Embed Size (px)
Citation preview
biomedicines
Article
Screening of Natural Compounds as P-Glycoprotein Inhibitorsagainst Multidrug Resistance
Sérgio M. Marques 1,2 , Lucie Šupolíková 3, Lenka Molcanová 4, Karel Šmejkal 4 , David Bednar 1,2,* andIva Slaninová 3,*
�����������������
Citation: Marques, S.M.; Šupolíková,
L.; Molcanová, L.; Šmejkal, K.; Bednar,
D.; Slaninová, I. Screening of Natural
Compounds as P-Glycoprotein
Inhibitors against Multidrug
Resistance. Biomedicines 2021, 9, 357.
https://doi.org/10.3390/
biomedicines9040357
Academic Editor: Marek Drozdzik
Received: 9 March 2021
Accepted: 26 March 2021
Published: 30 March 2021
Publisher’s Note: MDPI stays neutral
with regard to jurisdictional claims in
published maps and institutional affil-
iations.
Copyright: © 2021 by the authors.
Licensee MDPI, Basel, Switzerland.
This article is an open access article
distributed under the terms and
conditions of the Creative Commons
Attribution (CC BY) license (https://
creativecommons.org/licenses/by/
4.0/).
1 Loschmidt Laboratories, Department of Experimental Biology and Research Centre for Toxic Compounds inthe Environment RECETOX, Faculty of Science, Masaryk University, Kamenice 5/C13,625-00 Brno, Czech Republic; [email protected]
2 International Clinical Research Center, St. Anne’s University Hospital Brno, Pekarska 53,656-91 Brno, Czech Republic
3 Department of Biology, Faculty of Medicine, Masaryk University, Kamenice 5/A6,625-00 Brno, Czech Republic; [email protected]
4 Department of Natural Drugs, Faculty of Pharmacy, Masaryk University, Palackého 1946/1,612-00 Brno, Czech Republic; [email protected] (L.M.); [email protected] (K.Š.)
* Correspondence: [email protected] (D.B.); [email protected] (I.S.);Tel.: +420-549492616 (D.B.); +420-549496985 (I.S.)
Abstract: Multidrug resistance (MDR) is a common problem when fighting cancer with chemotherapy.P-glycoprotein (P-gp, or MDR1) is an active pump responsible for the efflux of xenobiotics out ofthe cell, including anti-cancer drugs. It is a validated target against MDR. No crystal structure ofthe human P-gp is available to date, and only recently several cryo-EM structures have been solved.In this paper, we present a comprehensive computational approach that includes constructingthe full-length three-dimensional structure of the human P-gp and its refinement using moleculardynamics. We assessed its flexibility and conformational diversity, compiling a dynamical ensemblethat was used to dock a set of lignan compounds, previously reported as active P-gp inhibitors, anddisclose their binding modes. Based on the statistical analysis of the docking results, we selecteda system for performing the structure-based virtual screening of new potential P-gp inhibitors.We tested the method on a library of 87 natural flavonoids described in the literature, and 10of those were experimentally assayed. The results reproduced the theoretical predictions onlypartially due to various possible factors. However, at least two of the predicted natural flavonoidswere demonstrated to be effective P-gp inhibitors. They were able to increase the accumulation ofdoxorubicin inside the human promyelocytic leukemia HL60/MDR cells overexpressing P-gp andpotentiate the antiproliferative activity of this anti-cancer drug.
Keywords: flavonoids; molecular dynamics; molecular docking; multidrug resistance; naturalcompounds; P-glycoprotein; structure-based virtual screening
1. Introduction
Multidrug resistance (MDR) is the common cause of therapeutic failure, not only incancer but also in other diseases. One of the mechanisms lying behind the MDR is the effluxof drugs from tumor cells through the ATP binding cassette (ABC) transporters, which actas integral membrane pumps. The ABC transporters are classified into seven subfamilies(ABCA-ABCG) based on their sequence homology and domain organization [1].
The most typical ABC transporter is P-glycoprotein (P-gp; 170 kDa), coded by theABCB1 (MDR1) gene, which is often over-expressed in the cancer cells of tumors treatedby anti-cancer drugs. It has been proposed to operate as a “hydrophobic vacuum cleaner,”expelling non-polar compounds from the cytosolic side of the membrane bilayer to theexterior [2–4]. Other important efflux transporters responsible for MDR are proteins
Biomedicines 2021, 9, 357. https://doi.org/10.3390/biomedicines9040357 https://www.mdpi.com/journal/biomedicines
Biomedicines 2021, 9, 357 2 of 22
encoded by the ABCC1–6 genes (multidrug resistance-related proteins 1–6; MRP1–6) andthe ABCG2 gene (breast cancer resistant protein; BCRP) [5]. ABC transporters consist ofminimally four domains: two nucleotide-binding domains (NBDs) with highly conservedsequence motifs and two transmembrane domains. The two NBDs contain conservedmotifs such as Walker A, Walker B, ABC signature, a glutamine loop (Q-loop), and a switchmotif. The activity of ABC transporters can be regulated by other domains that can bindto the NBDs or to the transmembrane domains [6,7]. The P-gp structure is formed bytwo pseudo-symmetrical halves with domain-swapping features. It includes at least twopositively cooperative sites for drug binding, with the H site preferring Hoechst 33342 torhodamine 123, and the R site preferring rhodamine 123 to Hoechst 33342. Binding to one ofthese sites has been shown to stimulate the binding to the other and the respective transportactivity [8]. Other binding sites, namely a modulator-binding site (M site), have beenreported and assigned in the P-gp structure [9]. The mechanisms of transport of substratesand drug modulation of P-gp have been extensively studied, both by experimental andcomputational methods [10–13]. Although the cycle is still not fully characterized, it isgenerally accepted that ATP binding to the NBDs triggers major conformational changes.The inward-facing conformation of P-gp, containing the substrates (drugs) bound in thetransmembrane binding pocket, is converted into an outward-facing conformation that canrelease the substrates to the extracellular environment. The hydrolysis of ATP, enabled bythe dimerization of the NBDs that led to the outward-facing conformation in the first place,restores the initial inward-facing state and closes the cycle [13,14].
A promising method for overcoming MDR based on an over-activation of thesemembrane pumps is the co-administration anti-cancer drugs with inhibitors of thosepumps. Three generations of MDR inhibitors have been introduced in the clinical trialsduring the last decades. Unfortunately, their toxicity in the doses required for blockingABC transporters disabled their use in the clinical practice [7]. Finding new non-toxicmembrane pump inhibitors can help solve this problem. Natural products occupy afundamental position among anti-cancer drugs, as more than 70% of all anti-cancer drugscurrently on the market were derived from, or inspired by, natural products [15]. Non-toxicinhibitors or modulators originating from natural sources are sometimes referred to as“fourth generation inhibitors” [1]. Fumitremorgin C, a mycotoxin isolated from Aspergillusfumigatus, is an example of a natural product inhibiting drug efflux. It was the first reportedinhibitor of BCRP. Its tetracyclic analogs (Ko132, Ko134, and Ko143) have even greaterpotential to inhibit BCRP with minimal toxicity.
Several research groups have described the ability of natural products, such as lignansand flavonoids, to inhibit P-gp-, MRP1-, and BCRP-mediated efflux and restore drugsensitivity in MDR cancer cells [1]. Flavonoids, a large group of polyphenolic compoundsfound in medicinal plants, vegetables, fruits, and beverages such as tea and wine, arean integral component of our everyday diet. In plants, they can be found as aglycones,but more often, they occur in the form of glycosides. Flavonoids can be classified asflavonols, flavones, isoflavones, flavanols, flavanones, and chalcones [16]. Flavonoidshave a wide variety of biological activities, including anti-oxidant, anti-inflammatory, andanti-cancer. The proposed mechanisms for the anti-cancer effects include their anti-oxidantactivities, their effects on signal transduction pathways involved in cell proliferation andangiogenesis, and their ability to modulate the activity of enzymes required for metabolicactivation of procarcinogens and the detoxification of carcinogens [16]. Flavopiridol, asynthetic flavone currently in clinical trials as an antineoplastic agent, is a potent inhibitorof several kinases, including CDK2 and CDK4 [17].
In vitro studies [18] have revealed that flavonoids mostly modulate ABC drug trans-porters by competitively binding to their substrate-binding sites. However, some flavonoidsbind to the NBDs, affecting the ATP binding or hydrolysis, or alter the surface expressionlevel of ABC transporters [1]. Boumendjel et al. investigated the structure–activity rela-tionships of flavonoids as potential MDR modulators. They concluded that flavonoidsare bi-functionally able to partly overlap the ATP-binding site and a vicinal hydrophobic
Biomedicines 2021, 9, 357 3 of 22
region interacting with steroids within a cytosolic domain of P-gp. They propose thatflavonoids reveal the binding affinity toward NBD2 of P-gp through their ability to mimicthe adenine moiety of ATP, which indicates that the flavonoid overlaps, at least partly, thenucleotide-binding site [19].
A particular group of flavonoids is represented by prenylated flavonoids, commonlypossessing cytotoxic, antibacterial, and anti-inflammatory properties [20]. The prenylationis generally seen as the introduction of C5 (prenyl) or C10 (geranyl) moieties to differentpositions of the flavonoid skeleton. The side chain can be further modified. Prenylationof the flavonoid skeleton increases lipophilicity, which may enable these compounds tocross the cell membrane. Furthermore, the lipophilic side chain increases the chanceof their interaction with various proteins, including those regulating cellular signaling.Paulownia tomentosa is an example of a plant source rich in such compounds, based on thecombination of a flavanone skeleton with a geranyl at position C6 [21,22]. The cytotoxicproperties of prenylated flavonoids were previously reviewed [23]. However, their activityagainst MDR was not systematically studied. We have previously demonstrated that aset of lignans (natural phenolic compounds), isolated from the magnolia-vine (Schisandrachinensis (Turcz.) Baill.), potentiate the cytotoxic effect of the anti-cancer drug doxorubicin,by increasing its accumulation inside the multidrug-resistant leukemia cells overproducingP-gp (HL60/MDR) [24].
To date, no crystal structure of the human P-gp has been solved. Hence, most ofthe modeling studies with P-gp modulators have used the mouse variant of that protein,which is often considered a good surrogate for the human variant due to a high homologyof 87%. Other studies have used homology models of the human P-gp, some of whichhave suggested different properties than the mouse homolog arising from the sequencevariation [25,26]. One of the main issues is related to the high flexibility of P-gp and thelarge conformational variability among the known crystal structures and models, whichmay lead to inconsistent results. Molecular dynamics (MD) simulations have been usedto incorporate flexibility in the study of potential inhibitors or substrates and improveprediction accuracy. However, some caution is needed when interpreting the results [25,27].Many modeling and virtual screening studies aiming to find P-gp modulators have beenperformed with different approaches and strategies [28–30], including several focused onnatural compounds [31,32].
In this paper, we report a comprehensive approach that includes: (1) predictionof the three-dimensional structure of the human P-gp by molecular threading and itsrefinement with MD simulations; (2) docking of our previously reported inhibitors (lignans)to construct a general structure-based virtual screening methodology; (3) virtual screeningof a library of 87 natural compounds (flavonoids); (4) experimental in vitro screening ofthe top-ranked available molecules for their validation as P-gp inhibitors on cancer cellsoverexpressing P-gp.
2. Materials and Methods2.1. Molecular Threading
The 3D structure of the human P-gp (P-gp; GenBank code: AAA59575.1) [33,34]was predicted from the peptide, provided as the FASTA sequence, by molecular thread-ing with the I-TASSER server [35,36] using the default settings. The Structural Analy-sis and Verification Server (SAVES v4.0) (https://servicesn.mbi.ucla.edu/SAVES/, ac-cessed on 15 January 2021) and the Swiss-Model Structure Assessment server (https://swissmodel.expasy.org/assess, accessed on 15 January 2021) [37,38] were used to as-sess the stereo-chemical quality of these structures, by providing several parameters:C-score [35], TM-score [35,39], PROVE [40], ERRAT [41], VERIFY3D [42], QMEAN [43],MolProbity score [44], and Ramachandran plots [45]. The resulting models were alsoaligned with a crystal structure of the mouse P-gp (PDB ID: 4M1M) using PyMOL 2.3.2 [46]to assess the root-mean-square deviation (RMSD) of the Cα atoms. Based on these pa-
Biomedicines 2021, 9, 357 4 of 22
rameters, the top-ranked model 1 from I-TASSER was selected for further refinementand analyses.
2.2. Molecular Dynamics
To improve the structural quality and diversity of the predicted human P-gp, model 1,obtained from I-TASSER, was submitted to molecular dynamics simulations. The hydrogenatoms were calculated using the H++ server [47], with an implicit solvent at pH 7.4, 0.1 Msalinity, with an internal dielectric constant of 10 and external of 80. The tLEaP programof AmberTools 14 [48] was then used to prepare the topology and coordinates files forperforming the MD simulation. The system was neutralized by adding 17 Cl− ions, and itwas solvated with an octagonal box of TIP3P water molecules [49] with the edges at least10 Å away from the protein atoms.
The equilibration and production MD simulations were carried out with the PMEMD.CUDA [50,51] module of AMBER 14, using the force field ff14SB [52]. This force fieldis currently one of the primary AMBER reference models for proteins, and it is recom-mended to be used in combination with the TIP3P water model (https://ambermd.org/AmberModels.php, accessed on 24 January 2021). In total, five minimization steps and12 steps of equilibration dynamics were performed prior to the production MD. The firstfour minimization steps, composed of 2500 cycles of steepest descent followed by 7500 cy-cles of conjugate gradient, were performed as follows: (i) in the first one, all the atomsof the protein and ligand were restrained with 500 kcal·mol−1·Å−2 harmonic force con-stant; (ii) in the following ones, only the backbone atoms of the protein and heavy atomsof the ligand were restrained, respectively, with 500, 125, and 25 kcal·mol−1·Å−2 forceconstant. A fifth minimization step, composed of 5000 cycles of steepest descent and15,000 cycles of the conjugate gradient, was performed without restraints. The subsequentMD simulations employed periodic boundary conditions, the particle mesh Ewald methodwas used for the treatment of the long-range interactions beyond the 10 Å cutoff [53], theSHAKE algorithm [54] was used to constrain the bonds involving the hydrogen atoms,and the Langevin thermostat was used with a collision frequency of 1.0 ps−1 and a timestep of 2 fs. The energy and coordinates were saved every 2 ps. Equilibration dynamicswere performed in 12 steps: (i) 20 ps of gradual heating from 0 to 310 K, under constantvolume, restraining the protein atoms and ligand with 200 kcal·mol−1·Å2 harmonic forceconstant; (ii) 10 MDs of 400 ps each, at constant pressure (1 bar) and constant temperature(310 K), with gradually decreasing restraints on the backbone atoms of the protein andheavy atoms of the ligand with harmonic force constants of 150, 100, 75, 50, 25, 15, 10,5, 1, and 0.5 kcal·mol−1·Å−2; (iii) 400 ps of MD at the same conditions as the previousones, but with restraints of 0.5 kcal/mol−1·Å−2 applied only on the backbone atoms ofthe transmembrane residues, as predicted by the PPM server [55]: residues 45–73, 75–76,114–136, 188–232, 293–317, 329–352, 710–736, 753–777, 831–879, 935–959, and 973–993. Theproduction MDs were run for 500 ns using the same settings employed in the last equilibra-tion step. The trajectories were analyzed using the cpptraj [56] module of AmberTools 14,and visualized using PyMOL 2.3.2 [46] and VMD 1.9.1 [57].
The trajectory was clustered using cpptraj, with a distance-based metric of the mass-weighted RMSD of the residues located in the extended binding site in the transmem-brane regions: residues 1–10, 44–74, 113–138, 187–234, 294–318, 330–353, 711–737, 751–775,833–877, 934–961, and 972–995 (all the heavy atoms were included). The hierarchicalagglomerative clustering algorithm was used with average-linkage, a cutoff for mini-mum distance between clusters (epsilon) of 1.5 Å, sieve 4, and a minimum of 10 clusters.The centroid structures of the clusters were saved and used in the subsequent dockinganalyses. These structures were analyzed with the Swiss-Model and SAVES servers forquality assessment.
Biomedicines 2021, 9, 357 5 of 22
2.3. Molecular Docking
The three-dimensional structures of all the ligands were prepared in Avogadro [58]and then minimized using the UFF force field [59] and the steepest descent algorithm. Theantechamber module of AmberTools 14 was employed to calculate the partial charges ofthe ligands using the semi-empirical AM1-BCC function [60,61]. The receptor structuresincluded: (i) the initial homology model 1, (ii) the structure after the equilibration MD,(iii) the 10 clusters’ representative structures, (iv) two crystal structures of the mouse P-gp(PDB IDs: 3G60 and 4M1M), and (v) the three available cryo-EM structures of the humanP-gp (PDB IDs: 6C0V, 6QEE, and 6QEX). The mouse variants and cryo-EM structures wereprepared by removing the B chains, when existing, co-crystallization ions and ligands, andthe hydrogen atoms were added with the reduce program of AmberTools 14 using dynamicoptimization of their position (-build -nuclear options). All structures were aligned prior tothe docking using PyMOL 2.3.2 [46].
The input files of the ligands and receptors, in MOL2 and PDB formats, respectively,were converted to the AutoDock Vina-compatible format PDBQT MGLTools [62], maintain-ing the previously calculated atomic charges of the ligands. The ligand-binding site of thehuman P-gp, as identified by I-TASSER (residues 69, 72, 336, 40, 343, 725, 728, 732, 953, 975,978, 979, 983, and 986), was used to define the region of interest for the molecular dockingperformed by AutoDock Vina [63]. This region was represented by a cubic box of 40 × 40× 40 Å centered at the center of mass of the Cα atoms of those residues. Such a box wassufficiently large to include the H, M, and R binding sites. The exhaustiveness parameterwas set to 100 (the default is 8), and the maximum number of binding modes (20) wassaved. The docking poses obtained from AutoDock Vina were re-scored by the SMINA [64],NNScore [65], and the RF-Score-VS [66] scoring functions. The docked binding modeswere visualized using PyMOL 2.3.2 [46].
2.4. Flavonoid Compounds
Tomentone (1), diplacone (2), mimulone (3), 5,7-dihydroxy-6-geranylchromone (4), to-mentodiplacone M (5), tomentodiplacone L (6), tomentodiplacone N (7), 3′-O-methyldiplacol(8), 3′-O-methyl-5′-methoxydiplacol (9), and 3′-O-methyl-5′-methoxydiplacone (10) wereobtained by the isolation procedures described in previous works (1–3, 5–8, 10 [67], 4 [68],and 9 [69]). Briefly, the fruits of P. tomentosa (Paulowniaceae) were extracted with ethanol,further fractionated by liquid-liquid extraction to several portions, and the chosen portionswere subsequently separated in several steps using column chromatography, flash chro-matography, semipreparative RP-HPLC, or preparative TLC. The purity of the isolatedcompounds was evaluated using HPLC-DAD analysis and exceeded 95% in all cases. Struc-tural elucidation was performed using UV and IR analysis, mass spectrometry, 1D and2D NMR spectroscopy, and the absolute configurations were determined using circulardichroism in combination with NMR [67–69].
2.5. Cell Lines and Cultivation Conditions
The multidrug-resistant sub-line of human promyelocytic leukemia cells HL60/MDRoverexpressing P-gp derived from parental HL60 cells after treatment with doxorubicin wasobtained from Prof. B. Sarkadi (Semmelweis University of Medicine, National Blood Centre,Membrane Research Group, Hungarian Academy of Science, Budapest, Hungary). Thecells were cultivated in RPMI 1640 medium supplemented with 2 mM glutamine and 10%fetal calf serum, 100 IU/mL penicillin, and 100 µg/mL streptomycin (PAA Laboratories,Austria) at 37 ◦C under 5% CO2 in a high-humidity atmosphere and subcultured threetimes a week. The characterization of the cells, the evidence of P-gp overexpression byimmunodetection of P-gp, and RT-PCR detection of mRNA of P-gp were done as reportedin a previous study [24].
Biomedicines 2021, 9, 357 6 of 22
2.6. Drug Accumulation Assay
A method described previously [24] was used to measure the fluorescent substrate dox-orubicin content in the cells by flow cytometry. Briefly, the HL60/MDR cells (2 × 10⁶ per mL)were pre-incubated for 15 min in a medium containing either the flavonoids 1–10 (10 and20 µM) or verapamil (20 µM), a first-generation inhibitor used as a positive control, andthen incubated with doxorubicin (10 µM) for an additional 60 min. After washing withPBS, the intracellular content of doxorubicin was determined using a Cytomics FC 500 flowcytometer (Beckman Coulter, Inc., Carlsbad, CA, USA; an excitation wavelength of 488 nmand an emission wavelength of 575 nm; FL2). A minimum of 10,000 cells was counted foreach sample. The results were expressed as the percentage ratio of the mean of fluorescenceof doxorubicin in the presence of a modulator to the mean of fluorescence of doxorubicinwithout a modulator.
2.7. Cell Viability Assay
The cell viability assay was based on the exclusion of propidium iodide (PI; Sigma-Aldrich, St. Louis, MO, USA) by the intact viable cells. The cells (7 × 10⁴ cells/mL) wereplated in 12-well tissue culture test plates (Orange Scientific, Braine-I’Alleud, Belgium) andtreated with test compounds at a concentration of 20 µM in combination with doxorubicinat a concentration of 1 µM. After 48 h of incubation, PI was added, and the percentageof dead (PI-positive) cells was detected using a Cytomics FC 500 flow cytometry system(Beckman Coulter, Inc., Brea, CA, USA) in channel FL3 (emission at 620 nm). A totalnumber of 10,000 cells was analyzed for each sample. The viability of cells after treatmentwith doxorubicin alone was compared with the viability after treatment with doxorubicinin combination with the test compounds or verapamil (positive control).
2.8. Statistical Analysis
All statistical analyses were performed with Statistica version 13 (StatSoft software).The data for doxorubicin accumulation were based at least on four independent experi-ments performed in duplicate. Cytotoxicity (PI-exclusion assay) data were evaluated fromat least three independent experiments performed in duplicate. Data are expressed as themeans ± SD. Results were analyzed using the Student’s t-test, significance differences:p < 0.1; p < 0.05; p < 0.005.
3. Results3.1. Modeling of the Human P-gp
When this project was started, no 3D structure of the human P-gp was available, andtherefore, we modeled its structure using the molecular threading server I-TASSER [35,36].Only recently, the first structure of the human P-gp determined with electron microscopy(EM) has become available (PDB ID: 6C0V) [11]. This was the first human P-gp structureever disclosed, and it displayed the outward-facing conformation, which was an importantcontribution with mechanistic implications. More recently, other human P-gp structuresobtained by cryo-EM have been published (PDB IDs: 6QEE and 6QEX) [13]. These struc-tures either contain mutations or are bound with ligands or antibodies that could affect thearrangement of the transmembrane domains. They all lack several parts of the sequencedue to their high flexibility and have a poor resolution (3.40 Å at best). For all these reasons,the human P-gp cryo-EM structures were not considered here for predicting the bindingof inhibitors, although, for comparison, they were tested in the first screening of lignans(see below).
I-TASSER predicted five models based on multiple crystal structures of transporterproteins, the closest one being the mouse P-gp variant with 87% of sequence identity(Supplementary Tables S1 and S2). Besides the I-TASSER default and preferred model(model 1; Figure 1), another model (model 4) also showed favorable and comparable qualityscores, as provided by I-TASSER, SAVES, and Swiss-Model (Supplementary Table S3).However, when comparing these structures with a widely used mouse P-gp structure (PDB
Biomedicines 2021, 9, 357 7 of 22
ID: 4M1M), model 4 presented a much higher RMSD value (6.18 Å) than model 1 (2.41 Å).For this reason, and to prevent using potentially biologically irrelevant conformations of thehuman P-gp, we discarded model 4, and model 1 was used in all the subsequent analyses.
Biomedicines 2021, 9, 357 7 of 22
However, when comparing these structures with a widely used mouse P-gp structure (PDB ID: 4M1M), model 4 presented a much higher RMSD value (6.18 Å) than model 1 (2.41 Å). For this reason, and to prevent using potentially biologically irrelevant confor-mations of the human P-gp, we discarded model 4, and model 1 was used in all the sub-sequent analyses.
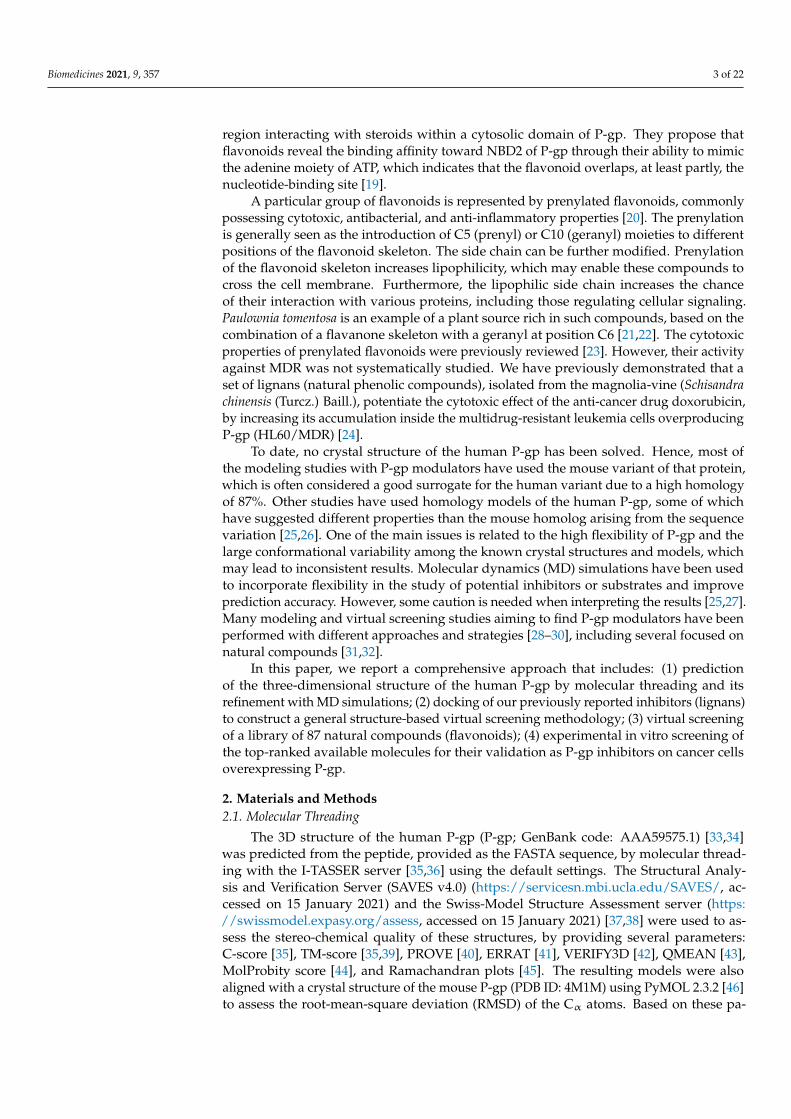
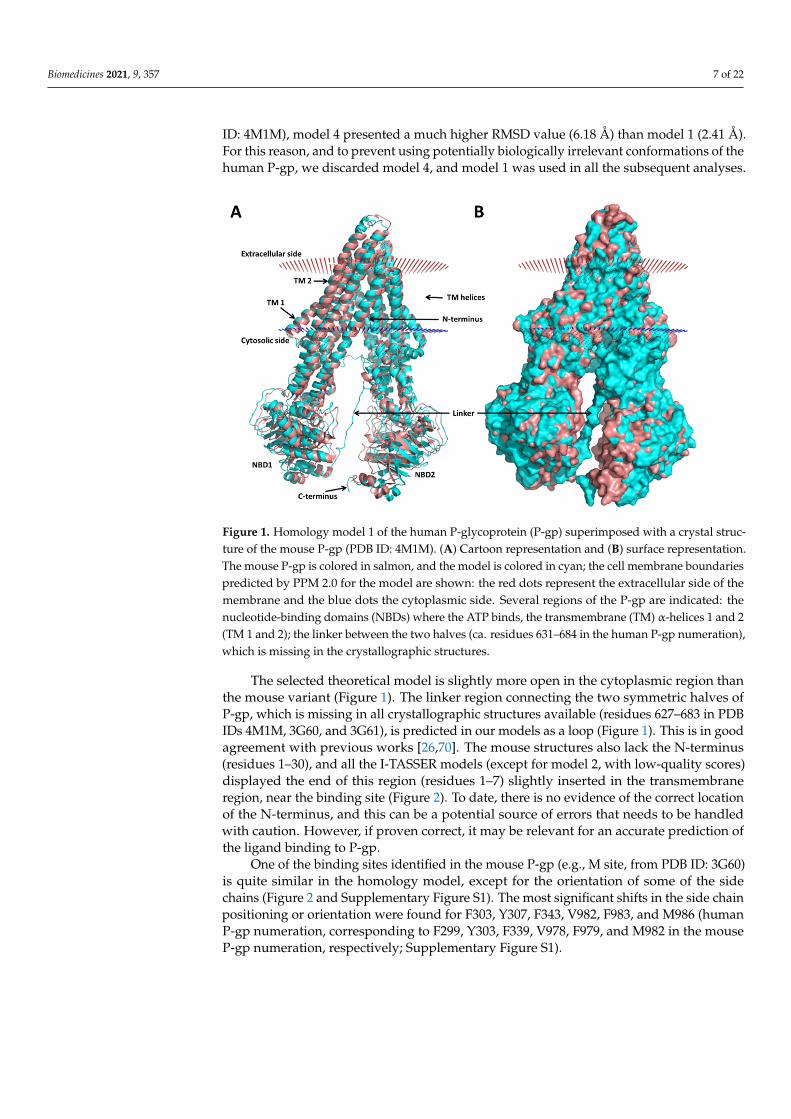
The selected theoretical model is slightly more open in the cytoplasmic region than the mouse variant (Figure 1). The linker region connecting the two symmetric halves of P-gp, which is missing in all crystallographic structures available (residues 627–683 in PDB IDs 4M1M, 3G60, and 3G61), is predicted in our models as a loop (Figure 1). This is in good agreement with previous works [26,70]. The mouse structures also lack the N-termi-nus (residues 1–30), and all the I-TASSER models (except for model 2, with low-quality scores) displayed the end of this region (residues 1–7) slightly inserted in the transmem-brane region, near the binding site (Figure 2). To date, there is no evidence of the correct location of the N-terminus, and this can be a potential source of errors that needs to be handled with caution. However, if proven correct, it may be relevant for an accurate pre-diction of the ligand binding to P-gp.
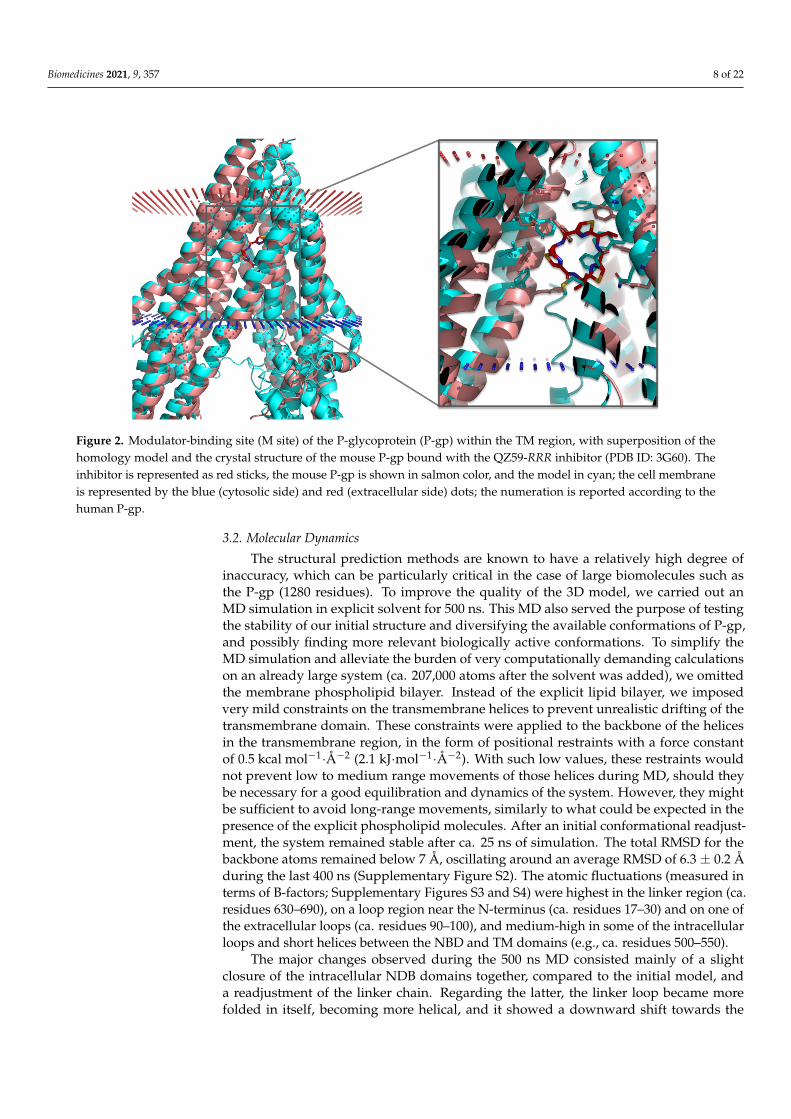
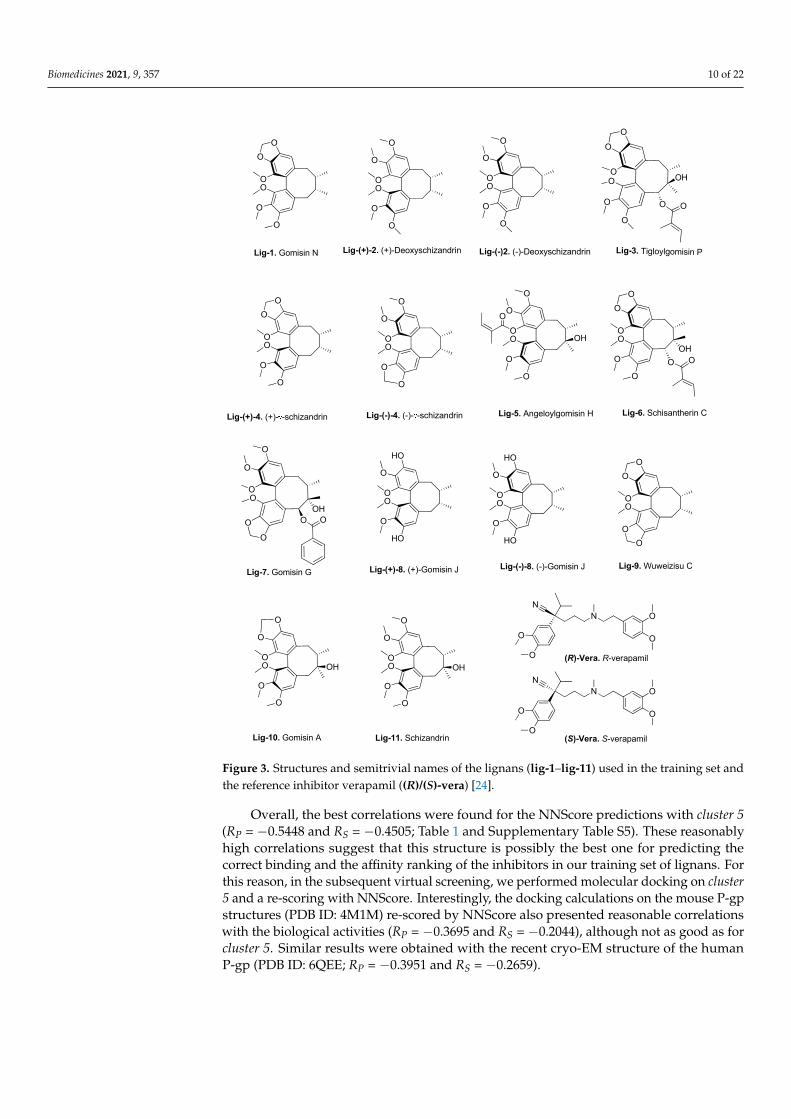
One of the binding sites identified in the mouse P-gp (e.g., M site, from PDB ID: 3G60) is quite similar in the homology model, except for the orientation of some of the side chains (Figure 2 and Supplementary Figure S1). The most significant shifts in the side chain positioning or orientation were found for F303, Y307, F343, V982, F983, and M986 (human P-gp numeration, corresponding to F299, Y303, F339, V978, F979, and M982 in the mouse P-gp numeration, respectively; Supplementary Figure S1).
Figure 1. Homology model 1 of the human P-glycoprotein (P-gp) superimposed with a crystal structure of the mouse P-gp (PDB ID: 4M1M). (A) Cartoon representation and (B) surface repre-sentation. The mouse P-gp is colored in salmon, and the model is colored in cyan; the cell mem-brane boundaries predicted by PPM 2.0 for the model are shown: the red dots represent the extra-cellular side of the membrane and the blue dots the cytoplasmic side. Several regions of the P-gp are indicated: the nucleotide-binding domains (NBDs) where the ATP binds, the transmembrane (TM) α-helices 1 and 2 (TM 1 and 2); the linker between the two halves (ca. residues 631–684 in the human P-gp numeration), which is missing in the crystallographic structures.
Figure 1. Homology model 1 of the human P-glycoprotein (P-gp) superimposed with a crystal struc-ture of the mouse P-gp (PDB ID: 4M1M). (A) Cartoon representation and (B) surface representation.The mouse P-gp is colored in salmon, and the model is colored in cyan; the cell membrane boundariespredicted by PPM 2.0 for the model are shown: the red dots represent the extracellular side of themembrane and the blue dots the cytoplasmic side. Several regions of the P-gp are indicated: thenucleotide-binding domains (NBDs) where the ATP binds, the transmembrane (TM) α-helices 1 and 2(TM 1 and 2); the linker between the two halves (ca. residues 631–684 in the human P-gp numeration),which is missing in the crystallographic structures.
The selected theoretical model is slightly more open in the cytoplasmic region thanthe mouse variant (Figure 1). The linker region connecting the two symmetric halves ofP-gp, which is missing in all crystallographic structures available (residues 627–683 in PDBIDs 4M1M, 3G60, and 3G61), is predicted in our models as a loop (Figure 1). This is in goodagreement with previous works [26,70]. The mouse structures also lack the N-terminus(residues 1–30), and all the I-TASSER models (except for model 2, with low-quality scores)displayed the end of this region (residues 1–7) slightly inserted in the transmembraneregion, near the binding site (Figure 2). To date, there is no evidence of the correct locationof the N-terminus, and this can be a potential source of errors that needs to be handledwith caution. However, if proven correct, it may be relevant for an accurate prediction ofthe ligand binding to P-gp.
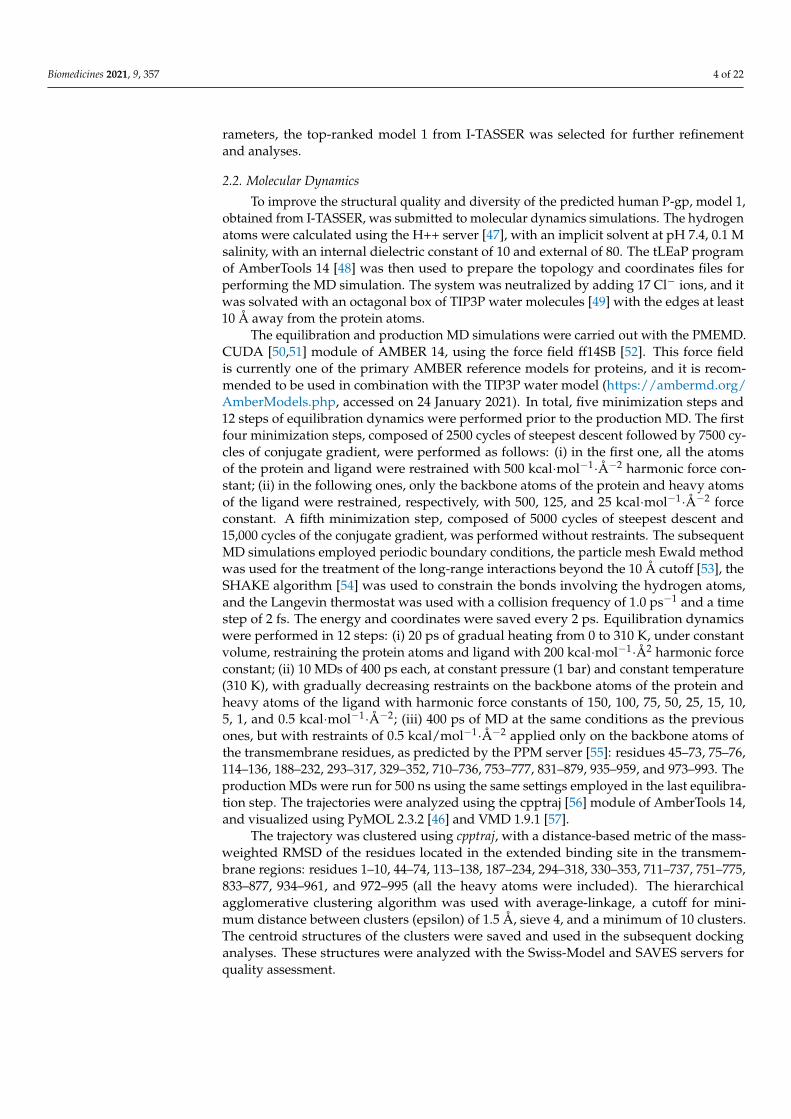
One of the binding sites identified in the mouse P-gp (e.g., M site, from PDB ID: 3G60)is quite similar in the homology model, except for the orientation of some of the sidechains (Figure 2 and Supplementary Figure S1). The most significant shifts in the side chainpositioning or orientation were found for F303, Y307, F343, V982, F983, and M986 (humanP-gp numeration, corresponding to F299, Y303, F339, V978, F979, and M982 in the mouseP-gp numeration, respectively; Supplementary Figure S1).
Biomedicines 2021, 9, 357 8 of 22
Biomedicines 2021, 9, 357 8 of 22
Figure 2. Modulator-binding site (M site) of the P-glycoprotein (P-gp) within the TM region, with superposition of the homology model and the crystal structure of the mouse P-gp bound with the QZ59-RRR inhibitor (PDB ID: 3G60). The inhibitor is represented as red sticks, the mouse P-gp is shown in salmon color, and the model in cyan; the cell membrane is represented by the blue (cytosolic side) and red (extracellular side) dots; the numeration is reported according to the human P-gp.
3.2. Molecular Dynamics The structural prediction methods are known to have a relatively high degree of in-
accuracy, which can be particularly critical in the case of large biomolecules such as the P-gp (1280 residues). To improve the quality of the 3D model, we carried out an MD simu-lation in explicit solvent for 500 ns. This MD also served the purpose of testing the stability of our initial structure and diversifying the available conformations of P-gp, and possibly finding more relevant biologically active conformations. To simplify the MD simulation and alleviate the burden of very computationally demanding calculations on an already large system (ca. 207,000 atoms after the solvent was added), we omitted the membrane phospholipid bilayer. Instead of the explicit lipid bilayer, we imposed very mild con-straints on the transmembrane helices to prevent unrealistic drifting of the transmem-brane domain. These constraints were applied to the backbone of the helices in the trans-membrane region, in the form of positional restraints with a force constant of 0.5 kcal mol−1⋅Å−2 (2.1 kJ⋅mol−1⋅Å−2). With such low values, these restraints would not prevent low to medium range movements of those helices during MD, should they be necessary for a good equilibration and dynamics of the system. However, they might be sufficient to avoid long-range movements, similarly to what could be expected in the presence of the explicit phospholipid molecules. After an initial conformational readjustment, the system remained stable after ca. 25 ns of simulation. The total RMSD for the backbone atoms re-mained below 7 Å, oscillating around an average RMSD of 6.3 ± 0.2 Å during the last 400 ns (Supplementary Figure S2). The atomic fluctuations (measured in terms of B-factors; Supplementary Figures S3 and S4) were highest in the linker region (ca. residues 630–690), on a loop region near the N-terminus (ca. residues 17–30) and on one of the extracellular loops (ca. residues 90–100), and medium-high in some of the intracellular loops and short helices between the NBD and TM domains (e.g., ca. residues 500–550).
The major changes observed during the 500 ns MD consisted mainly of a slight clo-sure of the intracellular NDB domains together, compared to the initial model, and a re-adjustment of the linker chain. Regarding the latter, the linker loop became more folded in itself, becoming more helical, and it showed a downward shift towards the NDB2 do-main. This observation is in agreement with a previous study reporting a similar behavior [26].
Figure 2. Modulator-binding site (M site) of the P-glycoprotein (P-gp) within the TM region, with superposition of thehomology model and the crystal structure of the mouse P-gp bound with the QZ59-RRR inhibitor (PDB ID: 3G60). Theinhibitor is represented as red sticks, the mouse P-gp is shown in salmon color, and the model in cyan; the cell membraneis represented by the blue (cytosolic side) and red (extracellular side) dots; the numeration is reported according to thehuman P-gp.
3.2. Molecular Dynamics
The structural prediction methods are known to have a relatively high degree ofinaccuracy, which can be particularly critical in the case of large biomolecules such asthe P-gp (1280 residues). To improve the quality of the 3D model, we carried out anMD simulation in explicit solvent for 500 ns. This MD also served the purpose of testingthe stability of our initial structure and diversifying the available conformations of P-gp,and possibly finding more relevant biologically active conformations. To simplify theMD simulation and alleviate the burden of very computationally demanding calculationson an already large system (ca. 207,000 atoms after the solvent was added), we omittedthe membrane phospholipid bilayer. Instead of the explicit lipid bilayer, we imposedvery mild constraints on the transmembrane helices to prevent unrealistic drifting of thetransmembrane domain. These constraints were applied to the backbone of the helicesin the transmembrane region, in the form of positional restraints with a force constantof 0.5 kcal mol−1·Å−2 (2.1 kJ·mol−1·Å−2). With such low values, these restraints wouldnot prevent low to medium range movements of those helices during MD, should theybe necessary for a good equilibration and dynamics of the system. However, they mightbe sufficient to avoid long-range movements, similarly to what could be expected in thepresence of the explicit phospholipid molecules. After an initial conformational readjust-ment, the system remained stable after ca. 25 ns of simulation. The total RMSD for thebackbone atoms remained below 7 Å, oscillating around an average RMSD of 6.3 ± 0.2 Åduring the last 400 ns (Supplementary Figure S2). The atomic fluctuations (measured interms of B-factors; Supplementary Figures S3 and S4) were highest in the linker region (ca.residues 630–690), on a loop region near the N-terminus (ca. residues 17–30) and on one ofthe extracellular loops (ca. residues 90–100), and medium-high in some of the intracellularloops and short helices between the NBD and TM domains (e.g., ca. residues 500–550).
The major changes observed during the 500 ns MD consisted mainly of a slightclosure of the intracellular NDB domains together, compared to the initial model, anda readjustment of the linker chain. Regarding the latter, the linker loop became morefolded in itself, becoming more helical, and it showed a downward shift towards the
Biomedicines 2021, 9, 357 9 of 22
NDB2 domain. This observation is in agreement with a previous study reporting a similarbehavior [26].
One of the primary purposes of this MD simulation was to find some P-gp conforma-tion closer to the bioactive form when the protein is bound to inhibitors or modulators, sothat it can be used for predictive purposes in virtual screening endeavors. For that, the MDtrajectory was clustered according to the orientation of the transmembrane residues, sincethis is the region where we expect the inhibitors to bind. Therefore, we used the RMSD ofthose residues as a metric for clustering the trajectories and extract the dominant conforma-tions of P-gp sampled during the MD. We initially constructed five clusters from the MD,but none of them provided reasonable agreements between the respective docking scoresand the biological activities for our testing set of lignan compounds (see below). Then, weincreased the number to 10 clusters and extracted the respective centroid structures, towhich we docked the lignans. Finally, we obtained some satisfactory results. We termedthese structures as cluster 0–cluster 9 (the lower the numbers corresponding to the higherpopulations; Supplementary Figures S5 and S6). We then assessed the structural quality ofthese cluster structures with the Swiss-Model and SAVES servers (Supplementary TableS4). As expected, we confirmed a significant improvement of all the quality parameters inthose structures in comparison to the initial model.
3.3. Molecular Docking of the Training Set
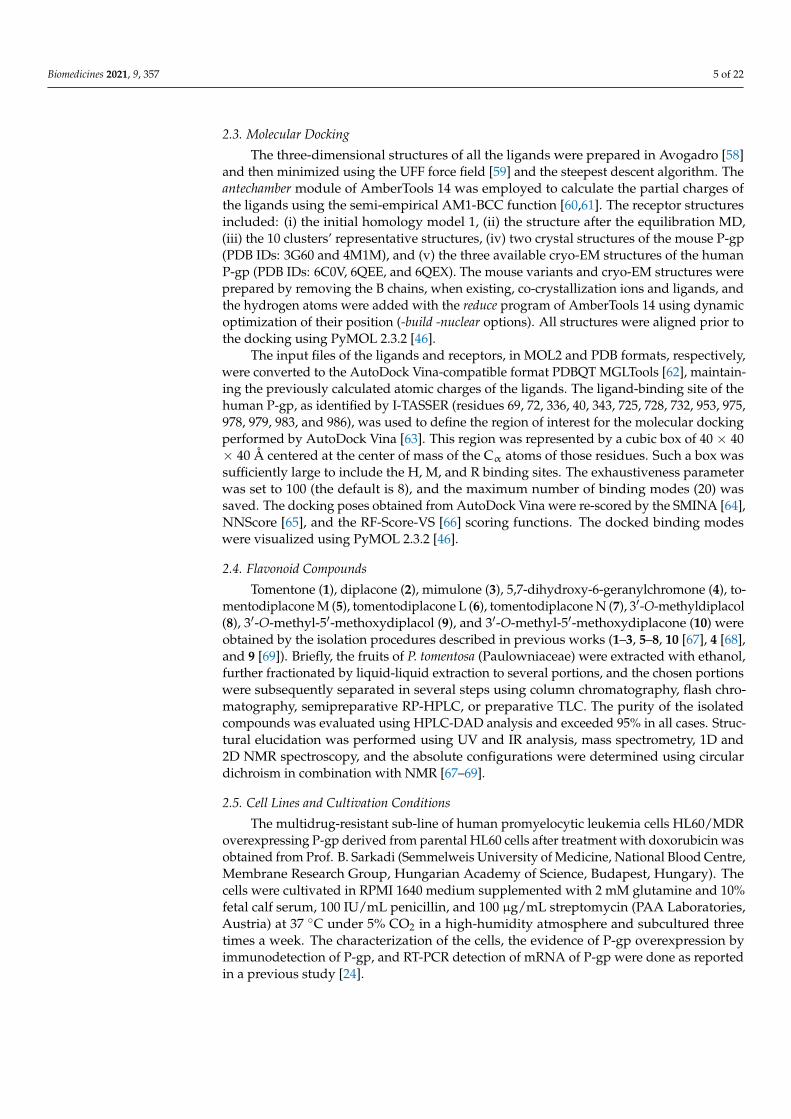
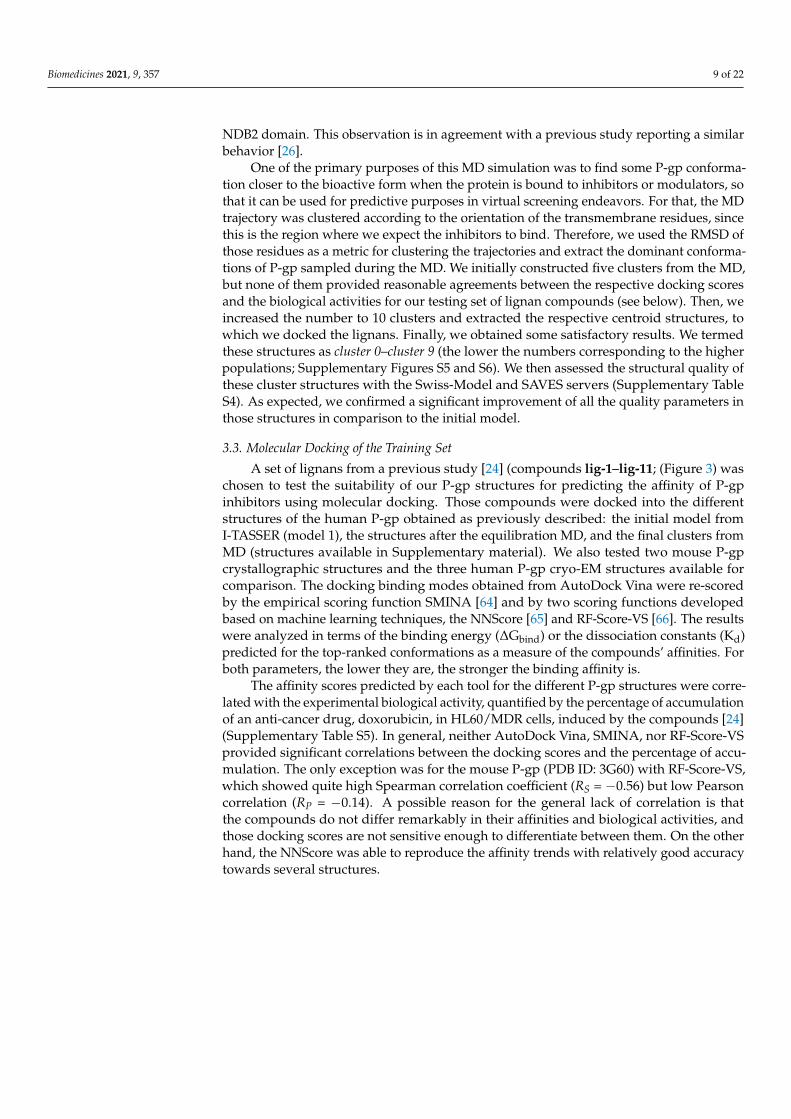
A set of lignans from a previous study [24] (compounds lig-1–lig-11; (Figure 3) waschosen to test the suitability of our P-gp structures for predicting the affinity of P-gpinhibitors using molecular docking. Those compounds were docked into the differentstructures of the human P-gp obtained as previously described: the initial model fromI-TASSER (model 1), the structures after the equilibration MD, and the final clusters fromMD (structures available in Supplementary material). We also tested two mouse P-gpcrystallographic structures and the three human P-gp cryo-EM structures available forcomparison. The docking binding modes obtained from AutoDock Vina were re-scoredby the empirical scoring function SMINA [64] and by two scoring functions developedbased on machine learning techniques, the NNScore [65] and RF-Score-VS [66]. The resultswere analyzed in terms of the binding energy (∆Gbind) or the dissociation constants (Kd)predicted for the top-ranked conformations as a measure of the compounds’ affinities. Forboth parameters, the lower they are, the stronger the binding affinity is.
The affinity scores predicted by each tool for the different P-gp structures were corre-lated with the experimental biological activity, quantified by the percentage of accumulationof an anti-cancer drug, doxorubicin, in HL60/MDR cells, induced by the compounds [24](Supplementary Table S5). In general, neither AutoDock Vina, SMINA, nor RF-Score-VSprovided significant correlations between the docking scores and the percentage of accu-mulation. The only exception was for the mouse P-gp (PDB ID: 3G60) with RF-Score-VS,which showed quite high Spearman correlation coefficient (RS = −0.56) but low Pearsoncorrelation (RP = −0.14). A possible reason for the general lack of correlation is thatthe compounds do not differ remarkably in their affinities and biological activities, andthose docking scores are not sensitive enough to differentiate between them. On the otherhand, the NNScore was able to reproduce the affinity trends with relatively good accuracytowards several structures.
Biomedicines 2021, 9, 357 10 of 22Biomedicines 2021, 9, 357 10 of 22
Lig-1. Gomisin N
O
O
O
O
O
O
Lig-(+)-2. (+)-Deoxyschizandrin
OO
O
O
O
O
O
O OH
Lig-3. Tigloylgomisin P
Lig-(-)-4. (-)- -schizandrin
OO
O
O
O
O
O
OH
O
O
O
O
O
O
Lig-(-)2. (-)-Deoxyschizandrin
Lig-(+)-4. (+)- -schizandrin Lig-5. Angeloylgomisin H Lig-6. Schisantherin C
OO
OO
O
OO O
OH
Lig-7. Gomisin G
O
O
OO
O
O
OHO O
Lig-(+)-8. (+)-Gomisin J Lig-9. Wuweizisu C
Lig-10. Gomisin A Lig-11. Schizandrin
Lig-(-)-8. (-)-Gomisin J
O
O
OO
OO
O
O
O
O
O
O
O
O
O
O
O
O
HO
O
O
O
O
HO
HO
O
O
O
O
HO OO
OO
OO
O
O
O
O
O
O
OH
O
O
O
O
O
O
OH(R)-Vera. R-verapamil
O
O
O
O
NN
O
O
O
O
NN
(S)-Vera. S-verapamil Figure 3. Structures and semitrivial names of the lignans (lig-1–lig-11) used in the training set and the reference inhibitor verapamil ((R)/(S)-vera) [24].
Figure 3. Structures and semitrivial names of the lignans (lig-1–lig-11) used in the training set andthe reference inhibitor verapamil ((R)/(S)-vera) [24].
Overall, the best correlations were found for the NNScore predictions with cluster 5(RP = −0.5448 and RS = −0.4505; Table 1 and Supplementary Table S5). These reasonablyhigh correlations suggest that this structure is possibly the best one for predicting thecorrect binding and the affinity ranking of the inhibitors in our training set of lignans. Forthis reason, in the subsequent virtual screening, we performed molecular docking on cluster5 and a re-scoring with NNScore. Interestingly, the docking calculations on the mouse P-gpstructures (PDB ID: 4M1M) re-scored by NNScore also presented reasonable correlationswith the biological activities (RP = −0.3695 and RS = −0.2044), although not as good as forcluster 5. Similar results were obtained with the recent cryo-EM structure of the humanP-gp (PDB ID: 6QEE; RP = −0.3951 and RS = −0.2659).
Biomedicines 2021, 9, 357 11 of 22
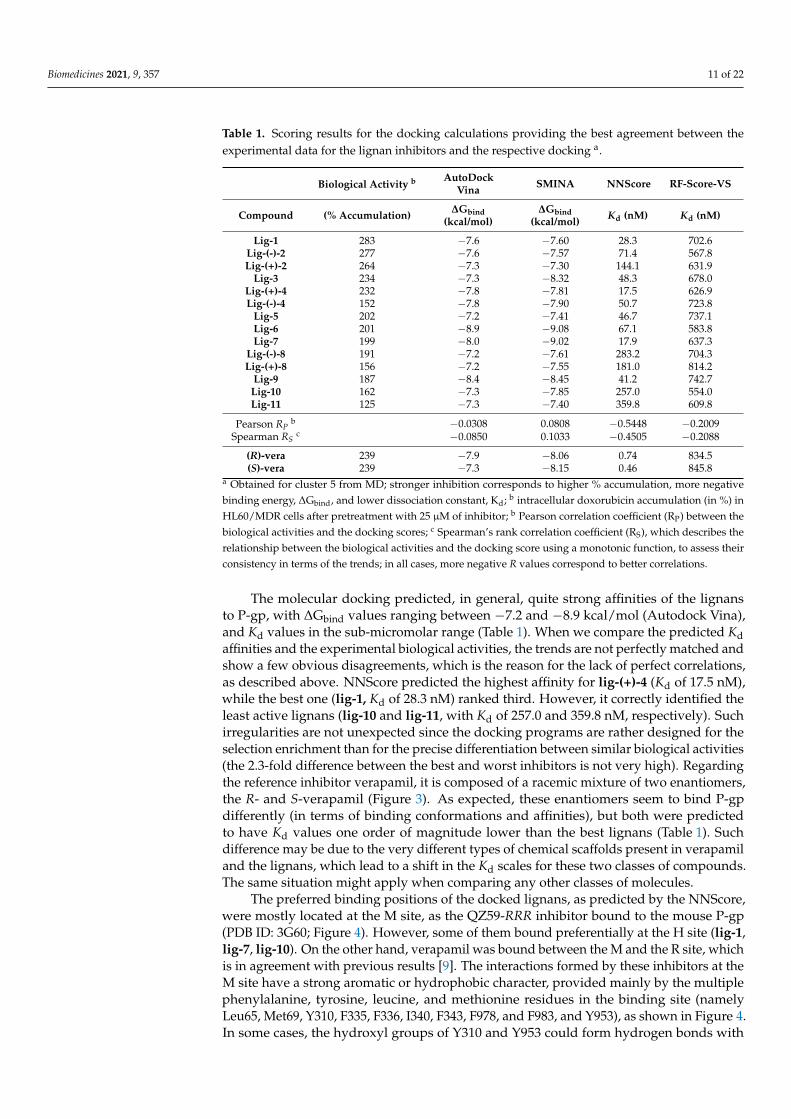
Table 1. Scoring results for the docking calculations providing the best agreement between theexperimental data for the lignan inhibitors and the respective docking a.
Biological Activity b AutoDockVina SMINA NNScore RF-Score-VS
Compound (% Accumulation) ∆Gbind(kcal/mol)
∆Gbind(kcal/mol) Kd (nM) Kd (nM)
Lig-1 283 −7.6 −7.60 28.3 702.6Lig-(-)-2 277 −7.6 −7.57 71.4 567.8Lig-(+)-2 264 −7.3 −7.30 144.1 631.9
Lig-3 234 −7.3 −8.32 48.3 678.0Lig-(+)-4 232 −7.8 −7.81 17.5 626.9Lig-(-)-4 152 −7.8 −7.90 50.7 723.8
Lig-5 202 −7.2 −7.41 46.7 737.1Lig-6 201 −8.9 −9.08 67.1 583.8Lig-7 199 −8.0 −9.02 17.9 637.3
Lig-(-)-8 191 −7.2 −7.61 283.2 704.3Lig-(+)-8 156 −7.2 −7.55 181.0 814.2
Lig-9 187 −8.4 −8.45 41.2 742.7Lig-10 162 −7.3 −7.85 257.0 554.0Lig-11 125 −7.3 −7.40 359.8 609.8
Pearson RPb −0.0308 0.0808 −0.5448 −0.2009
Spearman RSc −0.0850 0.1033 −0.4505 −0.2088
(R)-vera 239 −7.9 −8.06 0.74 834.5(S)-vera 239 −7.3 −8.15 0.46 845.8
a Obtained for cluster 5 from MD; stronger inhibition corresponds to higher % accumulation, more negativebinding energy, ∆Gbind, and lower dissociation constant, Kd; b intracellular doxorubicin accumulation (in %) inHL60/MDR cells after pretreatment with 25 µM of inhibitor; b Pearson correlation coefficient (RP) between thebiological activities and the docking scores; c Spearman’s rank correlation coefficient (RS), which describes therelationship between the biological activities and the docking score using a monotonic function, to assess theirconsistency in terms of the trends; in all cases, more negative R values correspond to better correlations.
The molecular docking predicted, in general, quite strong affinities of the lignansto P-gp, with ∆Gbind values ranging between −7.2 and −8.9 kcal/mol (Autodock Vina),and Kd values in the sub-micromolar range (Table 1). When we compare the predicted Kdaffinities and the experimental biological activities, the trends are not perfectly matched andshow a few obvious disagreements, which is the reason for the lack of perfect correlations,as described above. NNScore predicted the highest affinity for lig-(+)-4 (Kd of 17.5 nM),while the best one (lig-1, Kd of 28.3 nM) ranked third. However, it correctly identified theleast active lignans (lig-10 and lig-11, with Kd of 257.0 and 359.8 nM, respectively). Suchirregularities are not unexpected since the docking programs are rather designed for theselection enrichment than for the precise differentiation between similar biological activities(the 2.3-fold difference between the best and worst inhibitors is not very high). Regardingthe reference inhibitor verapamil, it is composed of a racemic mixture of two enantiomers,the R- and S-verapamil (Figure 3). As expected, these enantiomers seem to bind P-gpdifferently (in terms of binding conformations and affinities), but both were predictedto have Kd values one order of magnitude lower than the best lignans (Table 1). Suchdifference may be due to the very different types of chemical scaffolds present in verapamiland the lignans, which lead to a shift in the Kd scales for these two classes of compounds.The same situation might apply when comparing any other classes of molecules.
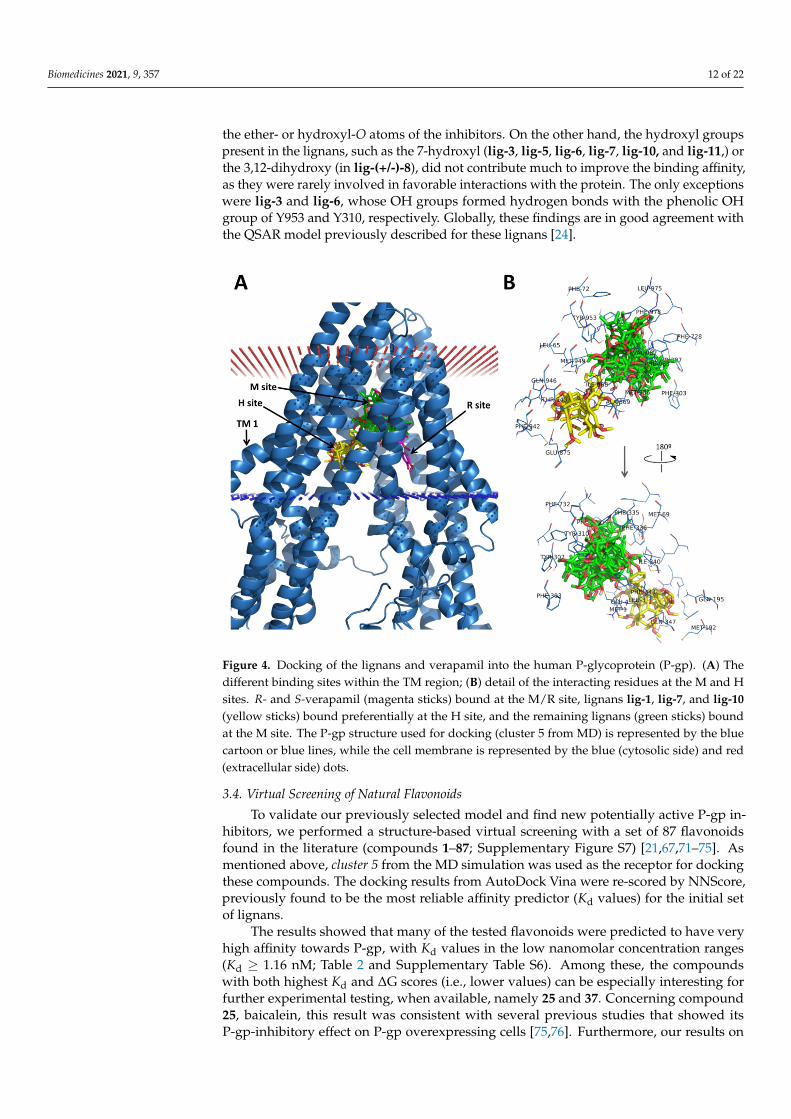
The preferred binding positions of the docked lignans, as predicted by the NNScore,were mostly located at the M site, as the QZ59-RRR inhibitor bound to the mouse P-gp(PDB ID: 3G60; Figure 4). However, some of them bound preferentially at the H site (lig-1,lig-7, lig-10). On the other hand, verapamil was bound between the M and the R site, whichis in agreement with previous results [9]. The interactions formed by these inhibitors at theM site have a strong aromatic or hydrophobic character, provided mainly by the multiplephenylalanine, tyrosine, leucine, and methionine residues in the binding site (namelyLeu65, Met69, Y310, F335, F336, I340, F343, F978, and F983, and Y953), as shown in Figure 4.In some cases, the hydroxyl groups of Y310 and Y953 could form hydrogen bonds with
Biomedicines 2021, 9, 357 12 of 22
the ether- or hydroxyl-O atoms of the inhibitors. On the other hand, the hydroxyl groupspresent in the lignans, such as the 7-hydroxyl (lig-3, lig-5, lig-6, lig-7, lig-10, and lig-11,) orthe 3,12-dihydroxy (in lig-(+/-)-8), did not contribute much to improve the binding affinity,as they were rarely involved in favorable interactions with the protein. The only exceptionswere lig-3 and lig-6, whose OH groups formed hydrogen bonds with the phenolic OHgroup of Y953 and Y310, respectively. Globally, these findings are in good agreement withthe QSAR model previously described for these lignans [24].
Biomedicines 2021, 9, 357 12 of 22
(PDB ID: 3G60; Figure 4). However, some of them bound preferentially at the H site (lig-1, lig-7, lig-10). On the other hand, verapamil was bound between the M and the R site, which is in agreement with previous results [9]. The interactions formed by these inhibi-tors at the M site have a strong aromatic or hydrophobic character, provided mainly by the multiple phenylalanine, tyrosine, leucine, and methionine residues in the binding site (namely Leu65, Met69, Y310, F335, F336, I340, F343, F978, and F983, and Y953), as shown in Figure 4. In some cases, the hydroxyl groups of Y310 and Y953 could form hydrogen bonds with the ether- or hydroxyl-O atoms of the inhibitors. On the other hand, the hy-droxyl groups present in the lignans, such as the 7-hydroxyl (lig-3, lig-5, lig-6, lig-7, lig-10, and lig-11,) or the 3,12-dihydroxy (in lig-(+/-)-8), did not contribute much to improve the binding affinity, as they were rarely involved in favorable interactions with the pro-tein. The only exceptions were lig-3 and lig-6, whose OH groups formed hydrogen bonds with the phenolic OH group of Y953 and Y310, respectively. Globally, these findings are in good agreement with the QSAR model previously described for these lignans [24].
Figure 4. Docking of the lignans and verapamil into the human P-glycoprotein (P-gp). (A) The different binding sites within the TM region; (B) detail of the interacting residues at the M and H sites. R- and S-verapamil (magenta sticks) bound at the M/R site, lignans lig-1, lig-7, and lig-10 (yellow sticks) bound preferentially at the H site, and the remaining lignans (green sticks) bound at the M site. The P-gp structure used for docking (cluster 5 from MD) is represented by the blue cartoon or blue lines, while the cell membrane is represented by the blue (cytosolic side) and red (extracellular side) dots.
3.4. Virtual Screening of Natural Flavonoids To validate our previously selected model and find new potentially active P-gp in-
hibitors, we performed a structure-based virtual screening with a set of 87 flavonoids found in the literature (compounds 1–87; Supplementary Figure S7) [21,67,71–75]. As mentioned above, cluster 5 from the MD simulation was used as the receptor for docking these compounds. The docking results from AutoDock Vina were re-scored by NNScore, previously found to be the most reliable affinity predictor (Kd values) for the initial set of lignans.
Figure 4. Docking of the lignans and verapamil into the human P-glycoprotein (P-gp). (A) Thedifferent binding sites within the TM region; (B) detail of the interacting residues at the M and Hsites. R- and S-verapamil (magenta sticks) bound at the M/R site, lignans lig-1, lig-7, and lig-10(yellow sticks) bound preferentially at the H site, and the remaining lignans (green sticks) boundat the M site. The P-gp structure used for docking (cluster 5 from MD) is represented by the bluecartoon or blue lines, while the cell membrane is represented by the blue (cytosolic side) and red(extracellular side) dots.
3.4. Virtual Screening of Natural Flavonoids
To validate our previously selected model and find new potentially active P-gp in-hibitors, we performed a structure-based virtual screening with a set of 87 flavonoidsfound in the literature (compounds 1–87; Supplementary Figure S7) [21,67,71–75]. Asmentioned above, cluster 5 from the MD simulation was used as the receptor for dockingthese compounds. The docking results from AutoDock Vina were re-scored by NNScore,previously found to be the most reliable affinity predictor (Kd values) for the initial setof lignans.
The results showed that many of the tested flavonoids were predicted to have veryhigh affinity towards P-gp, with Kd values in the low nanomolar concentration ranges(Kd ≥ 1.16 nM; Table 2 and Supplementary Table S6). Among these, the compoundswith both highest Kd and ∆G scores (i.e., lower values) can be especially interesting forfurther experimental testing, when available, namely 25 and 37. Concerning compound25, baicalein, this result was consistent with several previous studies that showed itsP-gp-inhibitory effect on P-gp overexpressing cells [75,76]. Furthermore, our results on
Biomedicines 2021, 9, 357 13 of 22
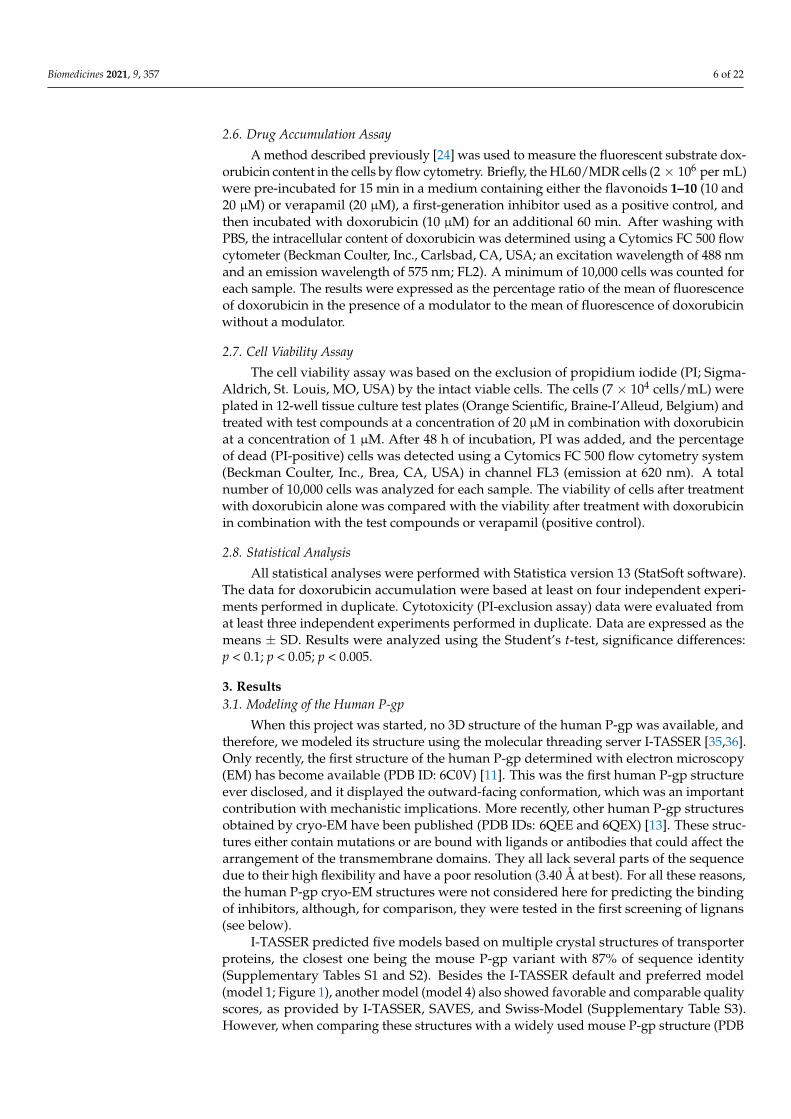
the potential of 37 (quercetin-3-glucoside) to interact with P-gp are new and suggest thepossibility to test this compound on some cellular systems. Several screened flavonoids(namely 3, 10, 25, and 37) seemed to be potentially stronger binders than any of the lignansin the training set (Kd ≤ 17.5 nM). Moreover, all of the 10 flavonoids to be experimentallytested (compounds 1–10; Figure 5) were predicted to be better binders than the worstlignan screened (Kd ≤ 359.8 nM). We also find that these ten compounds are among the50% best-ranked flavonoids, with the worst prediction for compound 6 with Kd 36.6 nM.Among these, the top-ranked five can be ordered as: 10 > 3 > 4 > 7 > 5. We also analyzed thebest binding scores of the different flavonoids towards any structure in our P-gp ensemble(i.e., not just cluster 5).
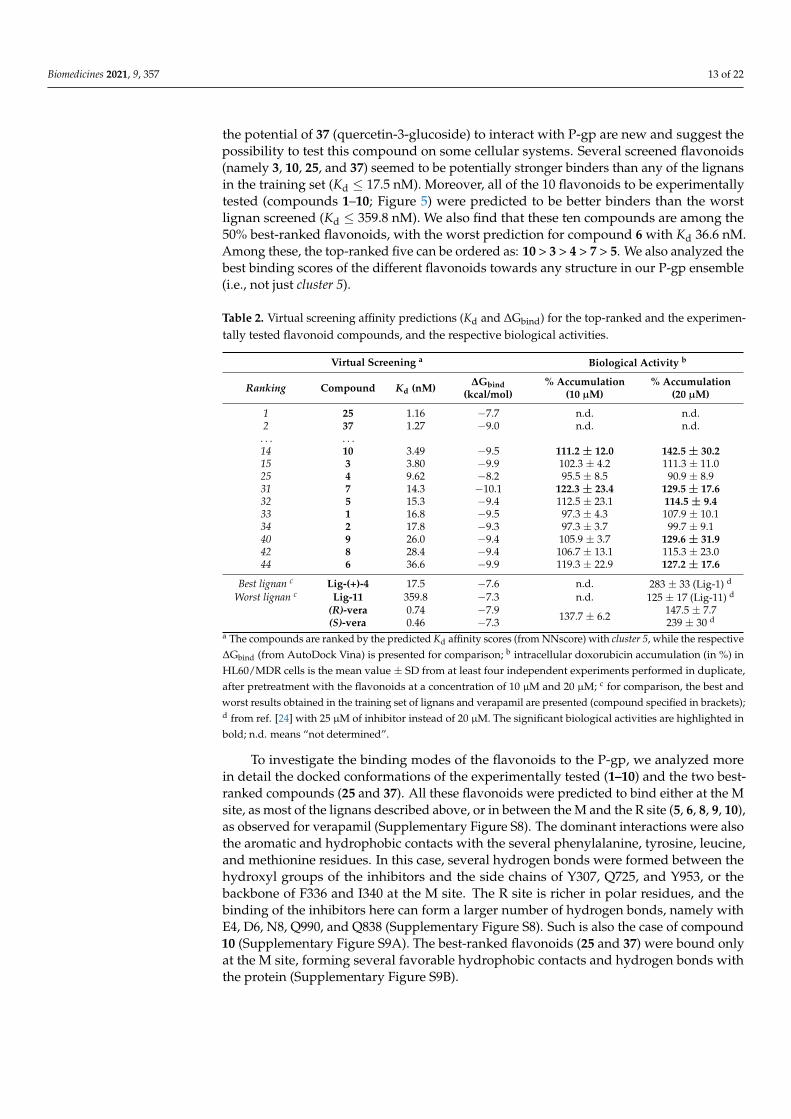
Table 2. Virtual screening affinity predictions (Kd and ∆Gbind) for the top-ranked and the experimen-tally tested flavonoid compounds, and the respective biological activities.
Virtual Screening a Biological Activity b
Ranking Compound Kd (nM) ∆Gbind(kcal/mol)
% Accumulation(10 µM)
% Accumulation(20 µM)
1 25 1.16 −7.7 n.d. n.d.2 37 1.27 −9.0 n.d. n.d.
. . . . . .14 10 3.49 −9.5 111.2 ± 12.0 142.5 ± 30.215 3 3.80 −9.9 102.3 ± 4.2 111.3 ± 11.025 4 9.62 −8.2 95.5 ± 8.5 90.9 ± 8.931 7 14.3 −10.1 122.3 ± 23.4 129.5 ± 17.632 5 15.3 −9.4 112.5 ± 23.1 114.5 ± 9.433 1 16.8 −9.5 97.3 ± 4.3 107.9 ± 10.134 2 17.8 −9.3 97.3 ± 3.7 99.7 ± 9.140 9 26.0 −9.4 105.9 ± 3.7 129.6 ± 31.942 8 28.4 −9.4 106.7 ± 13.1 115.3 ± 23.044 6 36.6 −9.9 119.3 ± 22.9 127.2 ± 17.6
Best lignan c Lig-(+)-4 17.5 −7.6 n.d. 283 ± 33 (Lig-1) d
Worst lignan c Lig-11 359.8 −7.3 n.d. 125 ± 17 (Lig-11) d
(R)-vera(S)-vera
0.740.46
−7.9−7.3 137.7 ± 6.2 147.5 ± 7.7
239 ± 30 d
a The compounds are ranked by the predicted Kd affinity scores (from NNscore) with cluster 5, while the respective∆Gbind (from AutoDock Vina) is presented for comparison; b intracellular doxorubicin accumulation (in %) inHL60/MDR cells is the mean value ± SD from at least four independent experiments performed in duplicate,after pretreatment with the flavonoids at a concentration of 10 µM and 20 µM; c for comparison, the best andworst results obtained in the training set of lignans and verapamil are presented (compound specified in brackets);d from ref. [24] with 25 µM of inhibitor instead of 20 µM. The significant biological activities are highlighted inbold; n.d. means “not determined”.
To investigate the binding modes of the flavonoids to the P-gp, we analyzed morein detail the docked conformations of the experimentally tested (1–10) and the two best-ranked compounds (25 and 37). All these flavonoids were predicted to bind either at the Msite, as most of the lignans described above, or in between the M and the R site (5, 6, 8, 9, 10),as observed for verapamil (Supplementary Figure S8). The dominant interactions were alsothe aromatic and hydrophobic contacts with the several phenylalanine, tyrosine, leucine,and methionine residues. In this case, several hydrogen bonds were formed between thehydroxyl groups of the inhibitors and the side chains of Y307, Q725, and Y953, or thebackbone of F336 and I340 at the M site. The R site is richer in polar residues, and thebinding of the inhibitors here can form a larger number of hydrogen bonds, namely withE4, D6, N8, Q990, and Q838 (Supplementary Figure S8). Such is also the case of compound10 (Supplementary Figure S9A). The best-ranked flavonoids (25 and 37) were bound onlyat the M site, forming several favorable hydrophobic contacts and hydrogen bonds withthe protein (Supplementary Figure S9B).
Biomedicines 2021, 9, 357 14 of 22
Biomedicines 2021, 9, 357 13 of 22
The results showed that many of the tested flavonoids were predicted to have very high affinity towards P-gp, with Kd values in the low nanomolar concentration ranges (Kd ≥ 1.16 nM; Table 2 and Supplementary Table S6). Among these, the compounds with both highest Kd and ΔG scores (i.e., lower values) can be especially interesting for further ex-perimental testing, when available, namely 25 and 37. Concerning compound 25, bai-calein, this result was consistent with several previous studies that showed its P-gp-inhib-itory effect on P-gp overexpressing cells [75,76]. Furthermore, our results on the potential of 37 (quercetin-3-glucoside) to interact with P-gp are new and suggest the possibility to test this compound on some cellular systems. Several screened flavonoids (namely 3, 10, 25, and 37) seemed to be potentially stronger binders than any of the lignans in the train-ing set (Kd ≤ 17.5 nM). Moreover, all of the 10 flavonoids to be experimentally tested (com-pounds 1–10; Figure 5) were predicted to be better binders than the worst lignan screened (Kd ≤ 359.8 nM). We also find that these ten compounds are among the 50% best-ranked flavonoids, with the worst prediction for compound 6 with Kd 36.6 nM. Among these, the top-ranked five can be ordered as: 10 > 3 > 4 > 7 > 5. We also analyzed the best binding scores of the different flavonoids towards any structure in our P-gp ensemble (i.e., not just cluster 5).
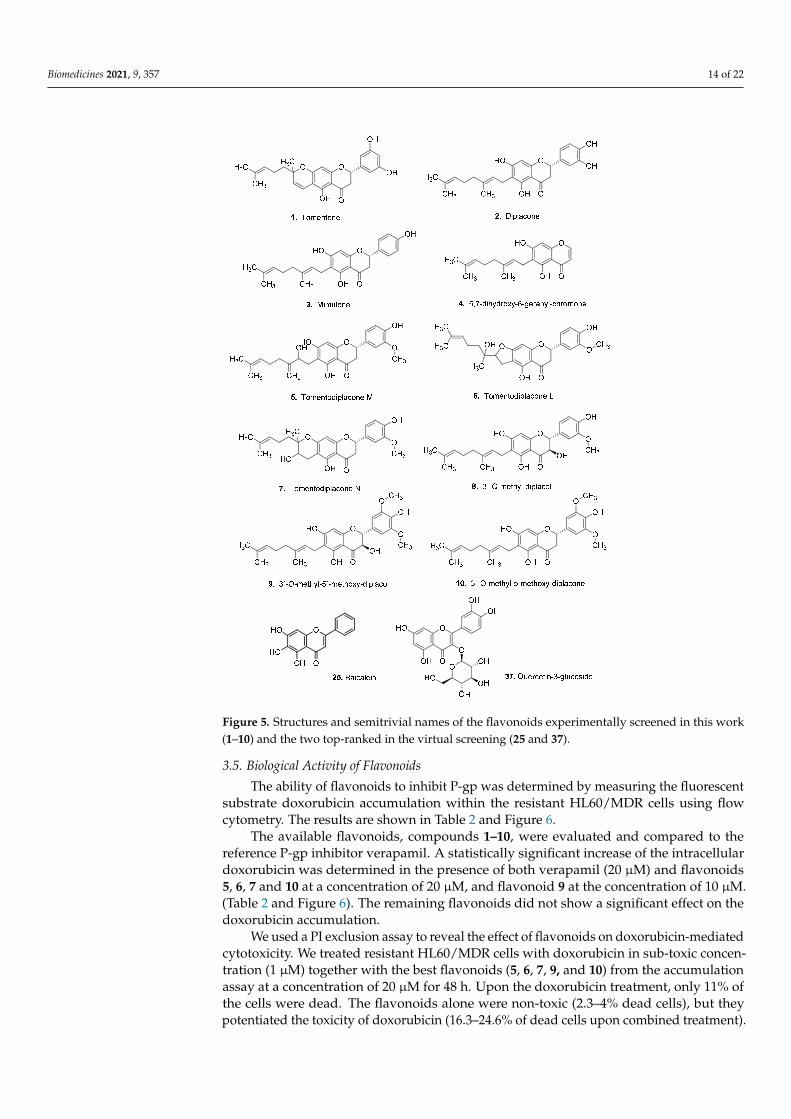
Figure 5. Structures and semitrivial names of the flavonoids experimentally screened in this work (1–10) and the two top-ranked in the virtual screening (25 and 37).
Figure 5. Structures and semitrivial names of the flavonoids experimentally screened in this work(1–10) and the two top-ranked in the virtual screening (25 and 37).
3.5. Biological Activity of Flavonoids
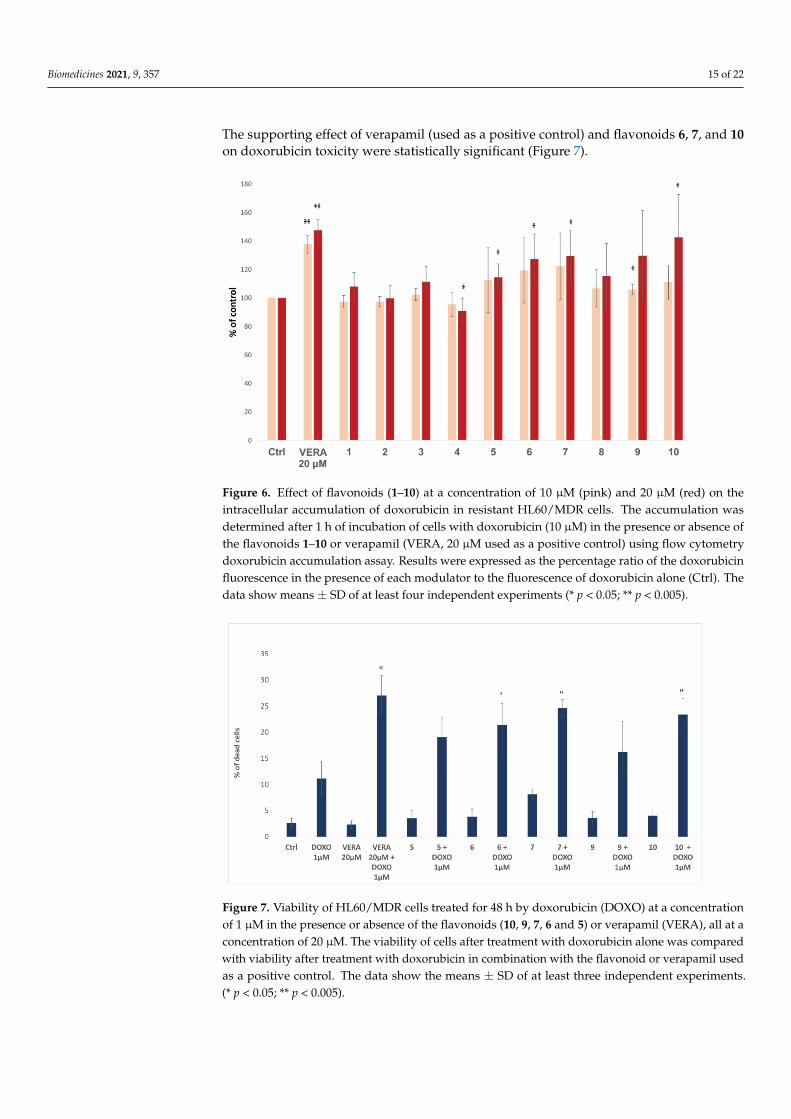
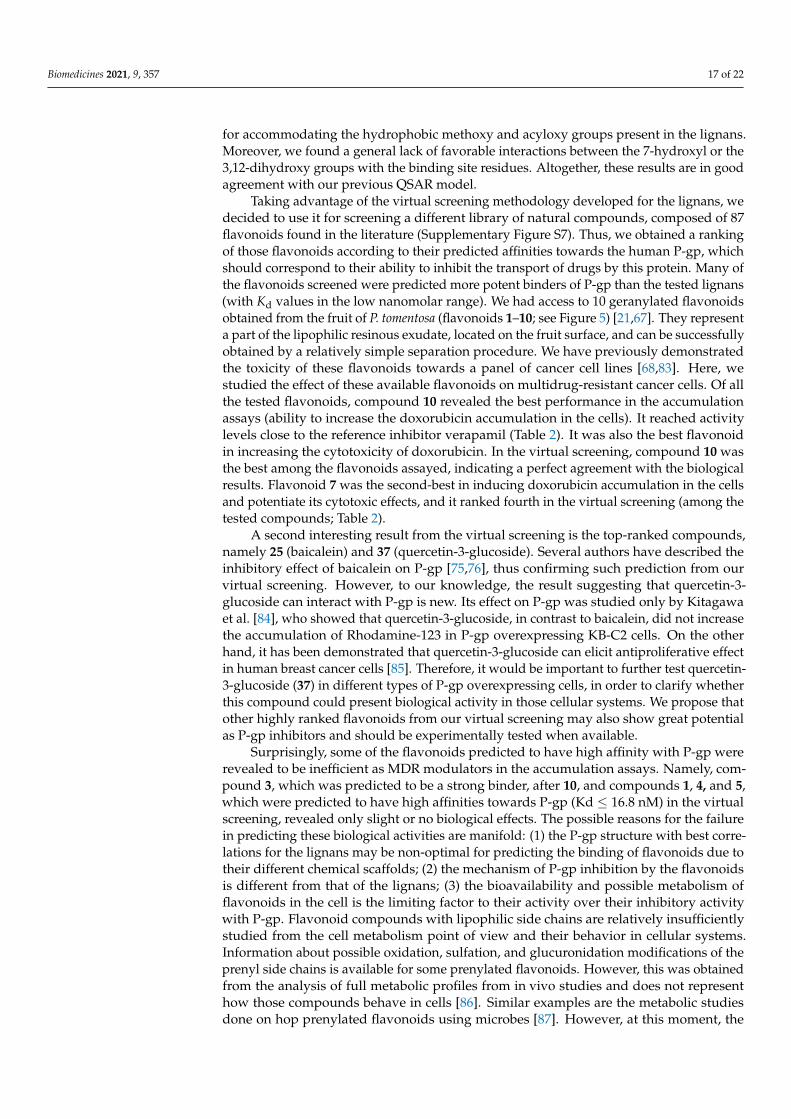
The ability of flavonoids to inhibit P-gp was determined by measuring the fluorescentsubstrate doxorubicin accumulation within the resistant HL60/MDR cells using flowcytometry. The results are shown in Table 2 and Figure 6.
The available flavonoids, compounds 1–10, were evaluated and compared to thereference P-gp inhibitor verapamil. A statistically significant increase of the intracellulardoxorubicin was determined in the presence of both verapamil (20 µM) and flavonoids5, 6, 7 and 10 at a concentration of 20 µM, and flavonoid 9 at the concentration of 10 µM.(Table 2 and Figure 6). The remaining flavonoids did not show a significant effect on thedoxorubicin accumulation.
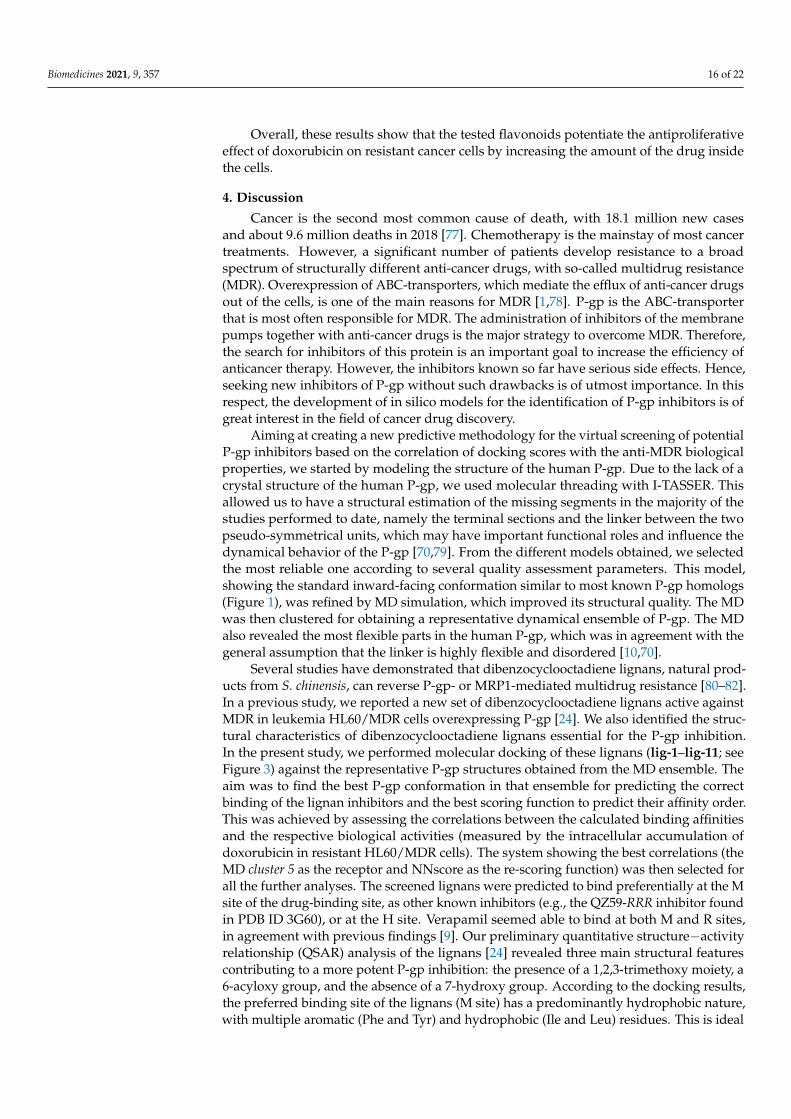
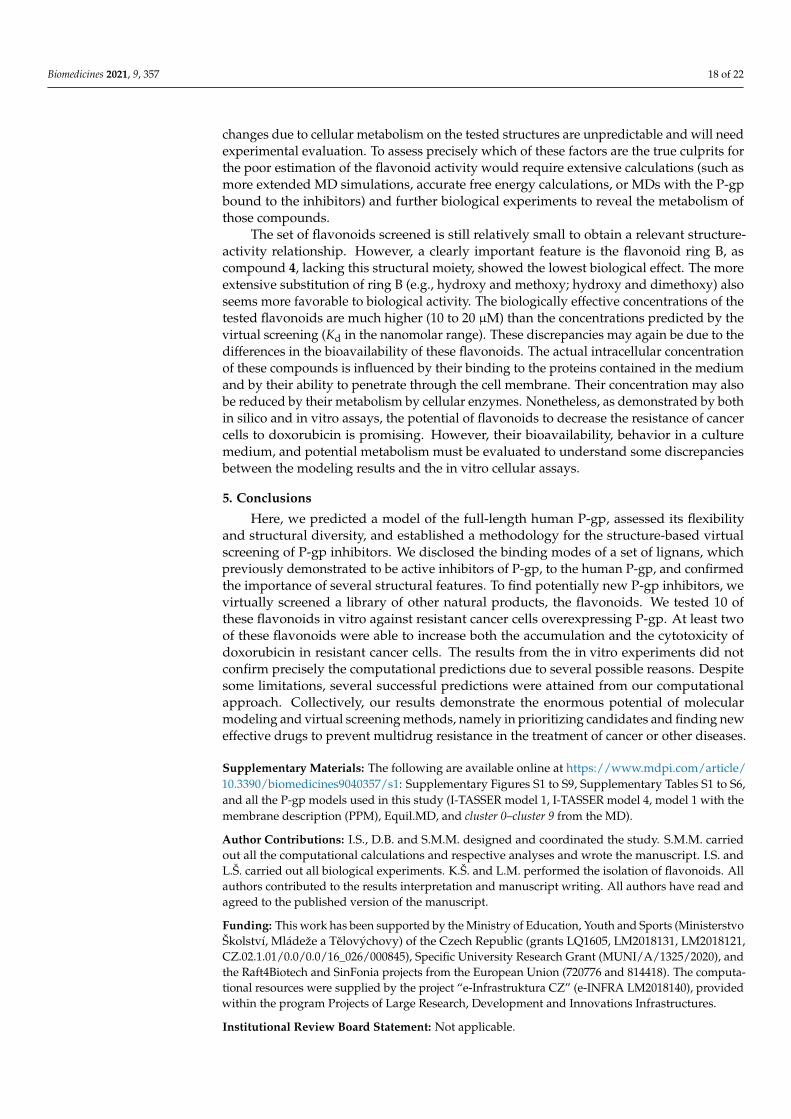
We used a PI exclusion assay to reveal the effect of flavonoids on doxorubicin-mediatedcytotoxicity. We treated resistant HL60/MDR cells with doxorubicin in sub-toxic concen-tration (1 µM) together with the best flavonoids (5, 6, 7, 9, and 10) from the accumulationassay at a concentration of 20 µM for 48 h. Upon the doxorubicin treatment, only 11% ofthe cells were dead. The flavonoids alone were non-toxic (2.3–4% dead cells), but theypotentiated the toxicity of doxorubicin (16.3–24.6% of dead cells upon combined treatment).
Biomedicines 2021, 9, 357 15 of 22
The supporting effect of verapamil (used as a positive control) and flavonoids 6, 7, and 10on doxorubicin toxicity were statistically significant (Figure 7).
Biomedicines 2021, 9, 357 15 of 22
and 10 at a concentration of 20 µM, and flavonoid 9 at the concentration of 10 µM. (Table 2 and Figure 6). The remaining flavonoids did not show a significant effect on the doxo-rubicin accumulation.
Figure 6. Effect of flavonoids (1–10) at a concentration of 10 µM (pink) and 20 µM (red) on the intracellular accumulation of doxorubicin in resistant HL60/MDR cells. The accumulation was determined after 1 h of incubation of cells with doxorubicin (10 µM) in the presence or absence of the flavonoids 1–10 or verapamil (VERA, 20 µM used as a positive control) using flow cytometry doxorubicin accumulation assay. Results were expressed as the percentage ratio of the doxorubi-cin fluorescence in the presence of each modulator to the fluorescence of doxorubicin alone (Ctrl). The data show means ± SD of at least four independent experiments (* p < 0.05; ** p < 0.005).
We used a PI exclusion assay to reveal the effect of flavonoids on doxorubicin-medi-ated cytotoxicity. We treated resistant HL60/MDR cells with doxorubicin in sub-toxic con-centration (1 µM) together with the best flavonoids (5, 6, 7, 9, and 10) from the accumula-tion assay at a concentration of 20 µM for 48 h. Upon the doxorubicin treatment, only 11% of the cells were dead. The flavonoids alone were non-toxic (2.3–4% dead cells), but they potentiated the toxicity of doxorubicin (16.3–24.6% of dead cells upon combined treat-ment). The supporting effect of verapamil (used as a positive control) and flavonoids 6, 7, and 10 on doxorubicin toxicity were statistically significant (Figure 7).
Overall, these results show that the tested flavonoids potentiate the antiproliferative effect of doxorubicin on resistant cancer cells by increasing the amount of the drug inside the cells.
Figure 6. Effect of flavonoids (1–10) at a concentration of 10 µM (pink) and 20 µM (red) on theintracellular accumulation of doxorubicin in resistant HL60/MDR cells. The accumulation wasdetermined after 1 h of incubation of cells with doxorubicin (10 µM) in the presence or absence ofthe flavonoids 1–10 or verapamil (VERA, 20 µM used as a positive control) using flow cytometrydoxorubicin accumulation assay. Results were expressed as the percentage ratio of the doxorubicinfluorescence in the presence of each modulator to the fluorescence of doxorubicin alone (Ctrl). Thedata show means ± SD of at least four independent experiments (* p < 0.05; ** p < 0.005).
Biomedicines 2021, 9, 357 16 of 22
Figure 7. Viability of HL60/MDR cells treated for 48 h by doxorubicin (DOXO) at a concentration of 1 µM in the presence or absence of the flavonoids (10, 9, 7, 6 and 5) or verapamil (VERA), all at a concentration of 20 µM. The viability of cells after treatment with doxorubicin alone was com-pared with viability after treatment with doxorubicin in combination with the flavonoid or vera-pamil used as a positive control. The data show the means ± SD of at least three independent ex-periments. (* p < 0.05; ** p < 0.005).
4. Discussion Cancer is the second most common cause of death, with 18.1 million new cases and
about 9.6 million deaths in 2018 [77]. Chemotherapy is the mainstay of most cancer treat-ments. However, a significant number of patients develop resistance to a broad spectrum of structurally different anti-cancer drugs, with so-called multidrug resistance (MDR). Overexpression of ABC-transporters, which mediate the efflux of anti-cancer drugs out of the cells, is one of the main reasons for MDR [1,78]. P-gp is the ABC-transporter that is most often responsible for MDR. The administration of inhibitors of the membrane pumps together with anti-cancer drugs is the major strategy to overcome MDR. Therefore, the search for inhibitors of this protein is an important goal to increase the efficiency of anti-cancer therapy. However, the inhibitors known so far have serious side effects. Hence, seeking new inhibitors of P-gp without such drawbacks is of utmost importance. In this respect, the development of in silico models for the identification of P-gp inhibitors is of great interest in the field of cancer drug discovery.
Aiming at creating a new predictive methodology for the virtual screening of poten-tial P-gp inhibitors based on the correlation of docking scores with the anti-MDR biologi-cal properties, we started by modeling the structure of the human P-gp. Due to the lack of a crystal structure of the human P-gp, we used molecular threading with I-TASSER. This allowed us to have a structural estimation of the missing segments in the majority of the studies performed to date, namely the terminal sections and the linker between the two pseudo-symmetrical units, which may have important functional roles and influence the dynamical behavior of the P-gp [70,79]. From the different models obtained, we selected the most reliable one according to several quality assessment parameters. This model, showing the standard inward-facing conformation similar to most known P-gp homologs (Figure 1), was refined by MD simulation, which improved its structural quality. The MD was then clustered for obtaining a representative dynamical ensemble of P-gp. The MD also revealed the most flexible parts in the human P-gp, which was in agreement with the general assumption that the linker is highly flexible and disordered [10,70].
Several studies have demonstrated that dibenzocyclooctadiene lignans, natural products from S. chinensis, can reverse P-gp- or MRP1-mediated multidrug resistance [80–82]. In a previous study, we reported a new set of dibenzocyclooctadiene lignans active
Figure 7. Viability of HL60/MDR cells treated for 48 h by doxorubicin (DOXO) at a concentrationof 1 µM in the presence or absence of the flavonoids (10, 9, 7, 6 and 5) or verapamil (VERA), all at aconcentration of 20 µM. The viability of cells after treatment with doxorubicin alone was comparedwith viability after treatment with doxorubicin in combination with the flavonoid or verapamil usedas a positive control. The data show the means ± SD of at least three independent experiments.(* p < 0.05; ** p < 0.005).
Biomedicines 2021, 9, 357 16 of 22
Overall, these results show that the tested flavonoids potentiate the antiproliferativeeffect of doxorubicin on resistant cancer cells by increasing the amount of the drug insidethe cells.
4. Discussion
Cancer is the second most common cause of death, with 18.1 million new casesand about 9.6 million deaths in 2018 [77]. Chemotherapy is the mainstay of most cancertreatments. However, a significant number of patients develop resistance to a broadspectrum of structurally different anti-cancer drugs, with so-called multidrug resistance(MDR). Overexpression of ABC-transporters, which mediate the efflux of anti-cancer drugsout of the cells, is one of the main reasons for MDR [1,78]. P-gp is the ABC-transporterthat is most often responsible for MDR. The administration of inhibitors of the membranepumps together with anti-cancer drugs is the major strategy to overcome MDR. Therefore,the search for inhibitors of this protein is an important goal to increase the efficiency ofanticancer therapy. However, the inhibitors known so far have serious side effects. Hence,seeking new inhibitors of P-gp without such drawbacks is of utmost importance. In thisrespect, the development of in silico models for the identification of P-gp inhibitors is ofgreat interest in the field of cancer drug discovery.
Aiming at creating a new predictive methodology for the virtual screening of potentialP-gp inhibitors based on the correlation of docking scores with the anti-MDR biologicalproperties, we started by modeling the structure of the human P-gp. Due to the lack of acrystal structure of the human P-gp, we used molecular threading with I-TASSER. Thisallowed us to have a structural estimation of the missing segments in the majority of thestudies performed to date, namely the terminal sections and the linker between the twopseudo-symmetrical units, which may have important functional roles and influence thedynamical behavior of the P-gp [70,79]. From the different models obtained, we selectedthe most reliable one according to several quality assessment parameters. This model,showing the standard inward-facing conformation similar to most known P-gp homologs(Figure 1), was refined by MD simulation, which improved its structural quality. The MDwas then clustered for obtaining a representative dynamical ensemble of P-gp. The MDalso revealed the most flexible parts in the human P-gp, which was in agreement with thegeneral assumption that the linker is highly flexible and disordered [10,70].
Several studies have demonstrated that dibenzocyclooctadiene lignans, natural prod-ucts from S. chinensis, can reverse P-gp- or MRP1-mediated multidrug resistance [80–82].In a previous study, we reported a new set of dibenzocyclooctadiene lignans active againstMDR in leukemia HL60/MDR cells overexpressing P-gp [24]. We also identified the struc-tural characteristics of dibenzocyclooctadiene lignans essential for the P-gp inhibition.In the present study, we performed molecular docking of these lignans (lig-1–lig-11; seeFigure 3) against the representative P-gp structures obtained from the MD ensemble. Theaim was to find the best P-gp conformation in that ensemble for predicting the correctbinding of the lignan inhibitors and the best scoring function to predict their affinity order.This was achieved by assessing the correlations between the calculated binding affinitiesand the respective biological activities (measured by the intracellular accumulation ofdoxorubicin in resistant HL60/MDR cells). The system showing the best correlations (theMD cluster 5 as the receptor and NNscore as the re-scoring function) was then selected forall the further analyses. The screened lignans were predicted to bind preferentially at the Msite of the drug-binding site, as other known inhibitors (e.g., the QZ59-RRR inhibitor foundin PDB ID 3G60), or at the H site. Verapamil seemed able to bind at both M and R sites,in agreement with previous findings [9]. Our preliminary quantitative structure−activityrelationship (QSAR) analysis of the lignans [24] revealed three main structural featurescontributing to a more potent P-gp inhibition: the presence of a 1,2,3-trimethoxy moiety, a6-acyloxy group, and the absence of a 7-hydroxy group. According to the docking results,the preferred binding site of the lignans (M site) has a predominantly hydrophobic nature,with multiple aromatic (Phe and Tyr) and hydrophobic (Ile and Leu) residues. This is ideal
Biomedicines 2021, 9, 357 17 of 22
for accommodating the hydrophobic methoxy and acyloxy groups present in the lignans.Moreover, we found a general lack of favorable interactions between the 7-hydroxyl or the3,12-dihydroxy groups with the binding site residues. Altogether, these results are in goodagreement with our previous QSAR model.
Taking advantage of the virtual screening methodology developed for the lignans, wedecided to use it for screening a different library of natural compounds, composed of 87flavonoids found in the literature (Supplementary Figure S7). Thus, we obtained a rankingof those flavonoids according to their predicted affinities towards the human P-gp, whichshould correspond to their ability to inhibit the transport of drugs by this protein. Many ofthe flavonoids screened were predicted more potent binders of P-gp than the tested lignans(with Kd values in the low nanomolar range). We had access to 10 geranylated flavonoidsobtained from the fruit of P. tomentosa (flavonoids 1–10; see Figure 5) [21,67]. They representa part of the lipophilic resinous exudate, located on the fruit surface, and can be successfullyobtained by a relatively simple separation procedure. We have previously demonstratedthe toxicity of these flavonoids towards a panel of cancer cell lines [68,83]. Here, westudied the effect of these available flavonoids on multidrug-resistant cancer cells. Of allthe tested flavonoids, compound 10 revealed the best performance in the accumulationassays (ability to increase the doxorubicin accumulation in the cells). It reached activitylevels close to the reference inhibitor verapamil (Table 2). It was also the best flavonoidin increasing the cytotoxicity of doxorubicin. In the virtual screening, compound 10 wasthe best among the flavonoids assayed, indicating a perfect agreement with the biologicalresults. Flavonoid 7 was the second-best in inducing doxorubicin accumulation in the cellsand potentiate its cytotoxic effects, and it ranked fourth in the virtual screening (among thetested compounds; Table 2).
A second interesting result from the virtual screening is the top-ranked compounds,namely 25 (baicalein) and 37 (quercetin-3-glucoside). Several authors have described theinhibitory effect of baicalein on P-gp [75,76], thus confirming such prediction from ourvirtual screening. However, to our knowledge, the result suggesting that quercetin-3-glucoside can interact with P-gp is new. Its effect on P-gp was studied only by Kitagawaet al. [84], who showed that quercetin-3-glucoside, in contrast to baicalein, did not increasethe accumulation of Rhodamine-123 in P-gp overexpressing KB-C2 cells. On the otherhand, it has been demonstrated that quercetin-3-glucoside can elicit antiproliferative effectin human breast cancer cells [85]. Therefore, it would be important to further test quercetin-3-glucoside (37) in different types of P-gp overexpressing cells, in order to clarify whetherthis compound could present biological activity in those cellular systems. We propose thatother highly ranked flavonoids from our virtual screening may also show great potentialas P-gp inhibitors and should be experimentally tested when available.
Surprisingly, some of the flavonoids predicted to have high affinity with P-gp wererevealed to be inefficient as MDR modulators in the accumulation assays. Namely, com-pound 3, which was predicted to be a strong binder, after 10, and compounds 1, 4, and 5,which were predicted to have high affinities towards P-gp (Kd ≤ 16.8 nM) in the virtualscreening, revealed only slight or no biological effects. The possible reasons for the failurein predicting these biological activities are manifold: (1) the P-gp structure with best corre-lations for the lignans may be non-optimal for predicting the binding of flavonoids due totheir different chemical scaffolds; (2) the mechanism of P-gp inhibition by the flavonoidsis different from that of the lignans; (3) the bioavailability and possible metabolism offlavonoids in the cell is the limiting factor to their activity over their inhibitory activitywith P-gp. Flavonoid compounds with lipophilic side chains are relatively insufficientlystudied from the cell metabolism point of view and their behavior in cellular systems.Information about possible oxidation, sulfation, and glucuronidation modifications of theprenyl side chains is available for some prenylated flavonoids. However, this was obtainedfrom the analysis of full metabolic profiles from in vivo studies and does not representhow those compounds behave in cells [86]. Similar examples are the metabolic studiesdone on hop prenylated flavonoids using microbes [87]. However, at this moment, the
Biomedicines 2021, 9, 357 18 of 22
changes due to cellular metabolism on the tested structures are unpredictable and will needexperimental evaluation. To assess precisely which of these factors are the true culprits forthe poor estimation of the flavonoid activity would require extensive calculations (such asmore extended MD simulations, accurate free energy calculations, or MDs with the P-gpbound to the inhibitors) and further biological experiments to reveal the metabolism ofthose compounds.
The set of flavonoids screened is still relatively small to obtain a relevant structure-activity relationship. However, a clearly important feature is the flavonoid ring B, ascompound 4, lacking this structural moiety, showed the lowest biological effect. The moreextensive substitution of ring B (e.g., hydroxy and methoxy; hydroxy and dimethoxy) alsoseems more favorable to biological activity. The biologically effective concentrations of thetested flavonoids are much higher (10 to 20 µM) than the concentrations predicted by thevirtual screening (Kd in the nanomolar range). These discrepancies may again be due to thedifferences in the bioavailability of these flavonoids. The actual intracellular concentrationof these compounds is influenced by their binding to the proteins contained in the mediumand by their ability to penetrate through the cell membrane. Their concentration may alsobe reduced by their metabolism by cellular enzymes. Nonetheless, as demonstrated by bothin silico and in vitro assays, the potential of flavonoids to decrease the resistance of cancercells to doxorubicin is promising. However, their bioavailability, behavior in a culturemedium, and potential metabolism must be evaluated to understand some discrepanciesbetween the modeling results and the in vitro cellular assays.
5. Conclusions
Here, we predicted a model of the full-length human P-gp, assessed its flexibilityand structural diversity, and established a methodology for the structure-based virtualscreening of P-gp inhibitors. We disclosed the binding modes of a set of lignans, whichpreviously demonstrated to be active inhibitors of P-gp, to the human P-gp, and confirmedthe importance of several structural features. To find potentially new P-gp inhibitors, wevirtually screened a library of other natural products, the flavonoids. We tested 10 ofthese flavonoids in vitro against resistant cancer cells overexpressing P-gp. At least twoof these flavonoids were able to increase both the accumulation and the cytotoxicity ofdoxorubicin in resistant cancer cells. The results from the in vitro experiments did notconfirm precisely the computational predictions due to several possible reasons. Despitesome limitations, several successful predictions were attained from our computationalapproach. Collectively, our results demonstrate the enormous potential of molecularmodeling and virtual screening methods, namely in prioritizing candidates and finding neweffective drugs to prevent multidrug resistance in the treatment of cancer or other diseases.
Supplementary Materials: The following are available online at https://www.mdpi.com/article/10.3390/biomedicines9040357/s1: Supplementary Figures S1 to S9, Supplementary Tables S1 to S6,and all the P-gp models used in this study (I-TASSER model 1, I-TASSER model 4, model 1 with themembrane description (PPM), Equil.MD, and cluster 0–cluster 9 from the MD).
Author Contributions: I.S., D.B. and S.M.M. designed and coordinated the study. S.M.M. carriedout all the computational calculations and respective analyses and wrote the manuscript. I.S. andL.Š. carried out all biological experiments. K.Š. and L.M. performed the isolation of flavonoids. Allauthors contributed to the results interpretation and manuscript writing. All authors have read andagreed to the published version of the manuscript.
Funding: This work has been supported by the Ministry of Education, Youth and Sports (MinisterstvoŠkolství, Mládeže a Telovýchovy) of the Czech Republic (grants LQ1605, LM2018131, LM2018121,CZ.02.1.01/0.0/0.0/16_026/000845), Specific University Research Grant (MUNI/A/1325/2020), andthe Raft4Biotech and SinFonia projects from the European Union (720776 and 814418). The computa-tional resources were supplied by the project “e-Infrastruktura CZ” (e-INFRA LM2018140), providedwithin the program Projects of Large Research, Development and Innovations Infrastructures.
Institutional Review Board Statement: Not applicable.
Biomedicines 2021, 9, 357 19 of 22
Informed Consent Statement: Not applicable.
Data Availability Statement: Not applicable.
Conflicts of Interest: The authors declare no conflict of interest.
References1. Ohnuma, S.; Ambudkar, S.V. Discovering Natural Product Modulators to Overcome Multidrug Resistance in Cancer Chemother-
apy. Curr. Pharm. Biotechnol. 2011, 12, 609–620. [CrossRef]2. Aller, S.G.; Yu, J.; Ward, A.; Weng, Y.; Chittaboina, S.; Zhuo, R.; Harrell, P.M.; Trinh, Y.T.; Zhang, Q.; Urbatsch, I.L.; et al. Structure
of P-Glycoprotein Reveals a Molecular Basis for Poly-Specific Drug Binding. Science 2009, 323, 1718–1722. [CrossRef]3. Velingkar, V.S.; Dandekar, V.D. Modulation of P-Glycoprotein Mediated Multidrug Resistance (MDR) in Cancer Using Chemosen-
sitizers. Int. J. Pharma Sci. Res. 2010, 1, 104–111.4. Dai, Y.; Zhang, F.; Chen, N.; Wang, G.; Jia, S.; Zheng, H. Analysis of P-glycoprotein structure and binding sites. In Proceedings of
the the 2nd International Conference on Information Science and Engineering; Institute of Electrical and Electronics Engineers: Wuhan,China, 2010; pp. 101–103. [CrossRef]
5. Dallavalle, S.; Dobricic, V.; Lazzarato, L.; Gazzano, E.; Machuqueiro, M.; Pajeva, I.; Tsakovska, I.; Zidar, N.; Fruttero, R.Improvement of Conventional Anti-cancer Drugs as New Tools against Multidrug Resistant Tumors. Drug Resist. Updat. 2020,50, 100682. [CrossRef]
6. Rees, D.C.; Johnson, E.; Lewinson, O. ABC Transporters: The Power to Change. Nat. Rev. Mol. Cell Biol. 2009, 10, 218–227.[CrossRef]
7. Li, W.; Zhang, H.; Assaraf, Y.G.; Zhao, K.; Xu, X.; Xie, J.; Yang, D.-H.; Chen, Z.-S. Overcoming ABC Transporter-MediatedMultidrug Resistance: Molecular Mechanisms and Novel Therapeutic Drug Strategies. Drug Resist. Updat. 2016, 27, 14–29.[CrossRef] [PubMed]
8. Shapiro, A.B.; Ling, V. Positively Cooperative Sites for Drug Transport by P-Glycoprotein with Distinct Drug Specificities. JBIC J.Biol. Inorg. Chem. 1997, 250, 130–137. [CrossRef] [PubMed]
9. Ferreira, R.J.; Ferreira, M.-J.U.; Dos Santos, D.J.V.A. Molecular Docking Characterizes Substrate-Binding Sites and EffluxModulation Mechanisms within P-Glycoprotein. J. Chem. Inf. Model. 2013, 53, 1747–1760. [CrossRef]
10. Ward, A.A.; Szewczyk, P.P.; Grimard, V.; Lee, C.-W.; Martinez, L.L.; Doshi, R.R.; Caya, A.A.; Villaluz, M.M.; Pardon, E.E.; Cregger,C.C.; et al. Structures of P-Glycoprotein Reveal Its Conformational Flexibility and an Epitope on the NucleotiDe-binding Domain.Proc. Natl. Acad. Sci. USA 2013, 110, 13386–13391. [CrossRef] [PubMed]
11. Kim, Y.; Chen, J. Molecular Structure of Human P-Glycoprotein in the ATP-Bound, Outward-Facing Conformation. Science 2018,359, 915–919. [CrossRef]
12. Zhang, Y.; Gong, W.; Wang, Y.; Liu, Y.; Li, C. Exploring Movement and Energy in Human P-Glycoprotein ConformationalRearrangement. J. Biomol. Struct. Dyn. 2018, 37, 1104–1119. [CrossRef]
13. Alam, A.; Kowal, J.; Broude, E.; Roninson, I.; Locher, K.P. Structural Insight into Substrate and Inhibitor Discrimination by HumanP-Glycoprotein. Science 2019, 363, 753–756. [CrossRef] [PubMed]
14. Kodan, A.; Yamaguchi, T.; Nakatsu, T.; Matsuoka, K.; Kimura, Y.; Ueda, K.; Kato, H. Inward-and Outward-Facing X-ray CrystalStructures of Homodimeric P-Glycoprotein CmABCB1. Nat. Commun. 2019, 10, 1–12. [CrossRef] [PubMed]
15. Newman, D.J.; Cragg, G.M. Natural Products as Sources of New Drugs from 1981 to 2014. J. Nat. Prod. 2016, 79, 629–661.[CrossRef]
16. Morris, M.E.; Zhang, S. Flavonoid–Drug Interactions: Effects of Flavonoids on ABC Transporters. Life Sci. 2006, 78, 2116–2130.[CrossRef] [PubMed]
17. Carlson, B.A.; Dubay, M.M.; Sausville, E.A.; Brizuela, L.; Worland, P.J. Flavopiridol Induces G1 Arrest with Inhibition ofCy-clin-Dependent Kinase (CDK) 2 and CDK4 in Human Breast Carcinoma Cells. Cancer Res. 1996, 56, 2973–2978. [PubMed]
18. Raj, N.K.; Sripal, R.M.; Chaluvadi, M.R.; Krishna, D.R. Bioflavonoids Classification, Pharmacological, Biochemical Effects andTherapeutic Potential. Ind. J. Pharmacol. 2001, 33, 2.
19. Di Pietro, A.; Dumontet, C.; Barron, D. Recent Advances in the Discovery of Flavonoids and Analogs with High-Affinity Bindingto P-Glycoprotein Responsible for Cancer Cell Multidrug Resistance. Med. Res. Rev. 2002, 22, 512–529. [CrossRef]
20. Brezani, V.; Smejkal, K.; Hosek, J.; Tomasova, V. Anti-inflammatory Natural Prenylated Phenolic Compounds—Potential LeadSubstances. Curr. Med. Chem. 2018, 25, 1094–1159. [CrossRef]
21. Schneiderová, K.; Šmejkal, K. Phytochemical profile of Paulownia tomentosa (Thunb). Steud. Phytochem. Rev. 2014, 14, 799–833.[CrossRef] [PubMed]
22. Molcanová, L.; Janošíková, D.; Dall’acqua, S.; Šmejkal, K. C-Prenylated Flavonoids with Potential Cytotoxic Activity against SolidTumor Cell Lines. Phytochem. Rev. 2019, 18, 1051–1100. [CrossRef]
23. Šmejkal, K. Cytotoxic Potential of C-prenylated Flavonoids. Phytochem. Rev. 2014, 13, 245–275. [CrossRef]24. Slanina, J.; Páchniková, G.; Carnecká, M.; Koubíková, L.P.; Adámková, L.; Humpa, O.; Šmejkal, K.; Slaninová, I. Identification
of Key Structural Characteristics of Schisandra chinensis Lignans Involved in P-Glycoprotein Inhibition. J. Nat. Prod. 2014, 77,2255–2263. [CrossRef] [PubMed]
25. Domicevica, L.; Biggin, P.C. Homology Modelling of Human P-glycoprotein. Biochem. Soc. Trans. 2015, 43, 952–958. [CrossRef]
Biomedicines 2021, 9, 357 20 of 22
26. Bonito, C.A.; Ferreira, R.J.; Ferreira, M.-J.U.; Gillet, J.-P.; Cordeiro, M.N.D.S.; Dos Santos, D.J.V.A. Theoretical Insights on HelixRepacking as the Origin of P-Glycoprotein Promiscuity. Sci. Rep. 2020, 10, 1–13. [CrossRef] [PubMed]
27. Condic-Jurkic, K.; Subramanian, N.; Mark, A.E.; O’Mara, M.L. The Reliability of Molecular Dynamics Simulations of theMultidrug Transporter P-glycoprotein in a Membrane Environment. PLoS ONE 2018, 13, e0191882. [CrossRef] [PubMed]
28. Shityakov, S.; Förster, C. In Silico Structure-Based Screening of Versatile P-Glycoprotein Inhibitors Using Polynomial EmpiricalScoring Functions. Adv. Appl. Bioinform. Chem. 2014, 7, 1–9. [CrossRef]
29. Yang, M.; Chen, J.; Shi, X.; Xu, L.; Xi, Z.; You, L.; An, R.; Wang, X. Development of in Silico Models for Predicting P-GlycoproteinInhibitors Based on a Two-Step Approach for Feature Selection and Its Application to Chinese Herbal Medicine Screening. Mol.Pharm. 2015, 12, 3691–3713. [CrossRef]
30. Ngo, T.-D.; Tran, T.-D.; Le, M.-T.; Thai, K.-M. Computational Predictive Models for P-Glycoprotein Inhibition of in-HouseChalcone Derivatives and Drug-Bank Compounds. Mol. Divers. 2016, 20, 945–961. [CrossRef]
31. Wongrattanakamon, P.; Lee, V.S.; Nimmanpipug, P.; Sirithunyalug, B.; Chansakaow, S.; Jiranusornkul, S. Insight into the MolecularMechanism of P-Glycoprotein Mediated Drug Toxicity Induced by Bioflavonoids: An Integrated Computational Approach.Toxicol. Mech. Methods 2017, 5, 1–19. [CrossRef]
32. Wongrattanakamon, P.; Nimmanpipug, P.; Sirithunyalug, B.; Chansakaow, S.; Jiranusornkul, S. A Significant Mechanism ofMolecular Recognition between Bioflavonoids and P-Glycoprotein Leading to Herb-Drug Interactions. Toxicol. Mech. Methods2017, 28, 1–11. [CrossRef]
33. Benson, D.A.; Cavanaugh, M.; Clark, K.; Karsch-Mizrachi, I.; Lipman, D.J.; Ostell, J.; Sayers, E.W. GenBank. Nucleic Acids Res.2012, 41, D36–D42. [CrossRef] [PubMed]
34. Chen, C.-J.; Chin, J.E.; Ueda, K.; Clark, D.P.; Pastan, I.; Gottesman, M.M.; Roninson, I.B. Internal Duplication and Homology withBacterial Transport Proteins in the mdr1 (P-glycoprotein) Gene from Multidrug-Resistant Human Cells. Cell 1986, 47, 381–389.[CrossRef]
35. Zhang, Y. I-TASSER Server for Protein 3D Structure Prediction. BMC Bioinform. 2008, 9, 1–8. [CrossRef]36. Roy, A.; Kucukural, A.; Zhang, Y. I-TASSER: A Unified Platform for Automated Protein Structure and Function Prediction. Nat.
Protoc. 2010, 5, 725–738. [CrossRef] [PubMed]37. Waterhouse, A.; Bertoni, M.; Bienert, S.; Studer, G.; Tauriello, G.; Gumienny, R.; Heer, F.T.; de Beer, T.A.P.; Rempfer, C.; Bordoli,
L.; et al. SWISS-MODEL: Homology Modelling of Protein Structures and Complexes. Nucleic Acids Res. 2018, 46, W296–W303.[CrossRef] [PubMed]
38. Arnold, K.; Bordoli, L.; Kopp, J.; Schwede, T. The SWISS-MODEL Workspace: A Web-Based Environment for Protein StructureHomology Modelling. Bioinformatics 2005, 22, 195–201. [CrossRef]
39. Zhang, Y.; Skolnick, J. Scoring Function for Automated Assessment of Protein Structure Template Quality. Proteins Struct. Funct.Bioinform. 2004, 57, 702–710. [CrossRef]
40. Pontius, J.; Richelle, J.; Wodak, S.J. Deviations from Standard Atomic Volumes as a Quality Measure for Protein Crystal Structures.J. Mol. Biol. 1996, 264, 121–136. [CrossRef]
41. Colovos, C.; Yeates, T.O. Verification of Protein Structures: Patterns of Nonbonded Atomic Interactions. Protein Sci. 1993, 2,1511–1519. [CrossRef]
42. Eisenberg, D.; Lüthy, R.; Bowie, J.U. VERIFY3D: Assessment of Protein Models with Three-Dimensional Profiles. Methods Enzymol.1997, 277, 396–404. [CrossRef]
43. Benkert, P.; Biasini, M.; Schwede, T. Toward the Estimation of the Absolute Quality of Individual Protein Structure Models.Bioinformatics 2010, 27, 343–350. [CrossRef] [PubMed]
44. Chen, V.B.; Arendall, W.B.; Headd, J.J.; Keedy, D.A.; Immormino, R.M.; Kapral, G.J.; Murray, L.W.; Richardson, J.S.; Richardson,D.C. MolProbity: All-Atom Structure Validation for Macromolecular Crystallography. Acta Crystallogr. Sect. D Biol. Crystallogr.2009, 66, 12–21. [CrossRef]
45. Lovell, S.C.; Davis, I.W.; Arendall, W.B.; De Bakker, P.I.W.; Word, J.M.; Prisant, M.G.; Richardson, J.S.; Richardson, D.C. StructureValidation by Cα Geometry: φ,ψ and Cβ Deviation. Proteins Struct. Funct. Bioinform. 2003, 50, 437–450. [CrossRef]
46. The PyMOL Molecular Graphics System, Version 2.3.2; Schrödinger, LLC: New York, NY, USA, 2019.47. Gordon, J.C.; Myers, J.B.; Folta, T.; Shoja, V.; Heath, L.S.; Onufriev, A. H++: A Server for Estimating pKas and Adding Missing
Hydrogens to Macromolecules. Nucleic Acids Res. 2005, 33, W368–W371. [CrossRef]48. Case, D.A.; Babin, V.; Berryman, J.T.; Betz, R.M.; Cai, Q.; Cerutti, S.; Cheatham, T.E., III; Darden, T.A.; Duke, R.E.; Gohlke, H.; et al.
AMBER 14; University of California: San Francisco, CA, USA, 2014.49. Jorgensen, W.L.; Chandrasekhar, J.; Madura, J.D.; Impey, R.W.; Klein, M.L. Comparison of Simple Potential Functions for
Simulating Liquid Water. J. Chem. Phys. 1983, 79, 926–935. [CrossRef]50. Götz, A.W.; Williamson, M.J.; Xu, D.; Poole, D.; Le Grand, S.; Walker, R.C. Routine Microsecond Molecular Dynamics Simulations
with AMBER on GPUs. 1. Generalized Born. J. Chem. Theory Comput. 2012, 8, 1542–1555. [CrossRef]51. Le Grand, S.; Götz, A.W.; Walker, R.C. SPFP: Speed without Compromise—A Mixed Precision Model for GPU Accelerated
Molecular Dynamics Simulations. Comput. Phys. Commun. 2013, 184, 374–380. [CrossRef]52. Maier, J.A.; Martinez, C.; Kasavajhala, K.; Wickstrom, L.; Hauser, K.E.; Simmerling, C. ff14SB: Improving the Accuracy of Protein
Side Chain and Backbone Parameters from ff99SB. J. Chem. Theory Comput. 2015, 11, 3696–3713. [CrossRef] [PubMed]
Biomedicines 2021, 9, 357 21 of 22
53. Darden, T.; York, D.; Pedersen, L. Particle Mesh Ewald: An N·log(N) Method for Ewald Sums in Large Systems. J. Chem. Phys.1993, 98, 10089–10092. [CrossRef]
54. Ryckaert, J.-P.; Ciccotti, G.; Berendsen, H.J.C. Numerical Integration of the Cartesian Equations of Motion of a System withConstraints: Molecular Dynamics of n-alkanes. J. Comput. Phys. 1977, 23, 327–341. [CrossRef]
55. Lomize, M.A.; Pogozheva, I.D.; Joo, H.; Mosberg, H.I.; Lomize, A.L. OPM Database and PPM Web Server: Resources forPositioning of Proteins in Membranes. Nucleic Acids Res. 2011, 40, D370–D376. [CrossRef]
56. Roe, D.R.; Cheatham, I.T.E. PTRAJ and CPPTRAJ: Software for Processing and Analysis of Molecular Dynamics Trajectory Data.J. Chem. Theory Comput. 2013, 9, 3084–3095. [CrossRef] [PubMed]
57. Humphrey, W.; Dalke, A.; Schulten, K. VMD: Visual Molecular Dynamics. J. Mol. Graph. 1996, 14, 33–38. [CrossRef]58. Hanwell, M.D.; Curtis, D.E.; Lonie, D.C.; Vandermeersch, T.; Zurek, E.; Hutchison, G.R. Avogadro: An Advanced Semantic
Chemical Editor, Visualization, and Analysis Platform. J. Chemin. 2012, 4, 17. [CrossRef]59. Rappe, A.K.; Casewit, C.J.; Colwell, K.S.; Goddard, W.A.; Skiff, W.M. UFF, a Full Periodic Table Force Field for Molecular
Mechanics and Molecular Dynamics Simulations. J. Am. Chem. Soc. 1992, 114, 10024–10035. [CrossRef]60. Jakalian, A.; Bush, B.L.; Jack, D.B.; Bayly, C.I. Fast, Efficient Generation of High-Quality Atomic Charges. AM1-BCC Model: I.
Method. J. Comput. Chem. 2000, 21, 132–146. [CrossRef]61. Jakalian, A.; Jack, D.B.; Bayly, C.I. Fast, Efficient Generation of High-Quality Atomic Charges. AM1-BCC model: II. Parameteriza-
tion and validation. J. Comput. Chem. 2002, 23, 1623–1641. [CrossRef]62. Sanner, M.F. Python: A Programming Language for Software Integration and Development. J. Mol. Graph. Model. 1999, 17, 57–61.63. Trott, O.; Olson, A.J. AutoDock Vina: Improving the Speed and Accuracy of Docking with a New Scoring Function, Efficient
Optimization, and Multithreading. J. Comput. Chem. 2010, 31, 455–461. [CrossRef]64. Koes, D.R.; Baumgartner, M.P.; Camacho, C.J. Lessons Learned in Empirical Scoring with Smina from the CSAR 2011 Benchmark-
ing Exercise. J. Chem. Inf. Model. 2013, 53, 1893–1904. [CrossRef] [PubMed]65. Durrant, J.D.; McCammon, J.A. NNScore 2.0: A Neural-Network Receptor–Ligand Scoring Function. J. Chem. Inf. Model. 2011, 51,
2897–2903. [CrossRef]66. Wójcikowski, M.; Ballester, P.J.; Siedlecki, P. Performance of Machine-Learning Scoring Functions in Structure-Based Virtual
Screening. Sci. Rep. 2017, 7, srep46710. [CrossRef] [PubMed]67. Hanáková, Z.; Hošek, J.; Babula, P.; Dall’Acqua, S.; Václavík, J.; Šmejkal, K. C-Geranylated Flavanones from Paulownia tomentosa
Fruits as Potential Anti-inflammatory Compounds Acting via Inhibition of TNF-α Production. J. Nat. Prod. 2015, 78, 850–863.[CrossRef] [PubMed]
68. Šmejkal, K.; Babula, P.; Šlapetová, T.; Brognara, E.; Dall’Acqua, S.; Žemlicka, M.; Innocenti, G.; Cvacka, J. Cytotoxic Activity ofC-Geranyl Compounds from Paulownia tomentosa Fruits. Planta Med. 2008, 74, 1488–1491. [CrossRef] [PubMed]
69. Šmejkal, K.; Grycová, L.; Marek, R.; Lemière, F.; Jankovská, D.; Forejtníková, H.; Vanco, J.; Suchý, V. C-Geranyl Compounds fromPaulownia tomentosa Fruits. J. Nat. Prod. 2007, 70, 1244–1248. [CrossRef]
70. Ferreira, R.J.; Ferreira, M.-J.U.; Dos Santos, D.J.V.A. Insights on P-Glycoprotein’s Efflux Mechanism Obtained by MolecularDynamics Simulations. J. Chem. Theory Comput. 2012, 8, 1853–1864. [CrossRef]
71. Hošek, J.; Bartos, M.; Chudík, S.; Dall’Acqua, S.; Innocenti, G.; Kartal, M.; Kokoška, L.; Kollár, P.; Kutil, Z.; Landa, P.; et al. NaturalCompound Cudraflavone B Shows Promising Anti-inflammatory Properties In Vitro. J. Nat. Prod. 2011, 74, 614–619. [CrossRef]
72. Argyropoulou, A.; Aligiannis, N.; Trougakos, I.P.; Skaltsounis, A.-L. Natural Compounds with Anti-ageing Activity. Nat. Prod.Rep. 2013, 30, 1412–1437. [CrossRef]
73. Navrátilová, A.; Nešuta, O.; Vancatová, I.; Cížek, A.; Varela-M, R.E.; López-Abán, J.; Villa-Pulgarin, J.A.; Mollinedo, F.; Muro, A.;Žemlicková, H.; et al. C-Geranylated Flavonoids from Paulownia tomentosa fruits with Antimicrobial Potential and SynergisticActivity with Antibiotics. Pharm. Biol. 2016, 54, 1398–1407. [CrossRef]
74. Hanáková, Z.; Hošek, J.; Kutil, Z.; Temml, V.; Landa, P.; Vanek, T.; Schuster, D.; Dall’Acqua, S.; Cvacka, J.; Polanský, O.; et al.Anti-inflammatory Activity of Natural Geranylated Flavonoids: Cyclooxygenase and Lipoxygenase Inhibitory Properties andProteomic Analysis. J. Nat. Prod. 2017, 80, 999–1006. [CrossRef]
75. Ferreira, A.; Santos, A.O.; Falcão, A.; Alves, G. In Vitro Screening of Dual Flavonoid Combinations for Reversing P-glycoprotein-Mediated Multidrug Resistance: Focus on Antiepileptic Drugs. Food Chem. Toxicol. 2018, 111, 84–93. [CrossRef]
76. Li, J.; Duan, B.; Guo, Y.; Zhou, R.; Sun, J.; Bie, B.; Yang, S.; Huang, C.; Yang, J.; Li, Z. Baicalein Sensitizes Hepatocellular CarcinomaCells to 5-FU and Epirubicin by Activating Apoptosis and Ameliorating P-glycoprotein Activity. Biomed. Pharmacother. 2018, 98,806–812. [CrossRef] [PubMed]
77. Latest Global Cancer Data: Cancer Burden Rises to 18.1 Million New Cases and 9.6 Million Cancer Deaths in 2018. Int. AgencyRes. Cancer 2018, 263, 1–3.
78. Dong, J.; Qin, Z.; Zhang, W.-D.; Cheng, G.; Yehuda, A.G.; Ashby, C.R.; Chen, Z.-S.; Cheng, X.-D.; Qin, J.-J. Medicinal ChemistryStrategies to Discover P-glycoprotein Inhibitors: An Update. Drug Resist. Updat. 2020, 49, 100681. [CrossRef]
79. Sato, T.; Kodan, A.; Kimura, Y.; Ueda, K.; Nakatsu, T.; Kato, H. Functional Role of the Linker Region in Purified HumanP-glycoprotein. FEBS J. 2009, 276, 3504–3516. [CrossRef] [PubMed]
80. Huang, M.; Jin, J.; Sun, H.; Liu, G.T. Reversal of P-glycoprotein-mediated Multidrug Resistance of Cancer Cells by FiveSchizandrins Isolated from the Chinese Herb Fructus schizandrae. Cancer Chemother. Pharmacol. 2008, 62, 1015–1026. [CrossRef][PubMed]
Biomedicines 2021, 9, 357 22 of 22
81. Pan, Q.; Lu, Q.; Zhang, K.; Hu, X. Dibenzocyclooctadiene lingnans: A Class of Novel Inhibitors of P-glycoprotein. Cancer Chemother.Pharmacol. 2005, 58, 99–106. [CrossRef]
82. Slaninova, I.; Brezinová, L.; Koubíková, L.; Slanina, J. Dibenzocyclooctadiene lignans Overcome Drug Resistance in Lung CancerCells—Study of Structure–Activity Relationship. Toxicol. Vitr. 2009, 23, 1047–1054. [CrossRef]
83. Šmejkal, K.; Svacinová, J.; Šlapetová, T.; Schneiderová, K.; Dall’Acqua, S.; Innocenti, G.; Závalová, V.; Kollár, P.; Chudík, S.; Marek,R.; et al. Cytotoxic Activities of Several Geranyl-Substituted Flavanones. J. Nat. Prod. 2010, 73, 568–572. [CrossRef]
84. Kitagawa, S.; Nabekura, T.; Takahashi, T.; Nakamura, Y.; Sakamoto, H.; Tano, H.; Hirai, M.; Tsukahara, G. Structure-ActivityRelationships of the Inhibitory Effects of Flavonoids on P-Glycoprotein-Mediated Transport in KB-C2 Cells. Biol. Pharm. Bull.2005, 28, 2274–2278. [CrossRef]
85. Yang, J.; Liu, R.H. Synergistic Effect of Apple Extracts and Quercetin 3-β-d-Glucoside Combination on Antiproliferative Activityin MCF-7 Human Breast Cancer Cells in Vitro. J. Agric. Food Chem. 2009, 57, 8581–8586. [CrossRef] [PubMed]
86. Xu, S.; Yu, J.; Zhan, J.; Yang, L.; Guo, L.; Xu, Y. Pharmacokinetics, Tissue Distribution, and Metabolism Study of Icariin in Rat.BioMed Res. Int. 2017, 2017, 1–17. [CrossRef] [PubMed]
87. Kim, H.J.; Yim, S.-H.; Han, F.; Kang, B.Y.; Choi, H.J.; Jung, D.-W.; Williams, D.R.; Gustafson, K.R.; Kennelly, E.J.; Lee, I.-S.Biotransformed Metabolites of the Hop Prenylflavanone Isoxanthohumol. Molecules 2019, 24, 394. [CrossRef] [PubMed]