Embed Size (px)
Citation preview

Paul et al. (2016) / J. Biosci. Agric. Res. 07(01): 608-620 DOI: 10.18801/jbar.070116.73
608 Corresponding authoremail: [email protected] (Khondoker Md. Nasiruddin) EISSN: 2312-7945, © Paul et al.(2016), Research paper
Screening for BLB resistance in BRRI and BINA released rice germplasms using RAPD markers
P. C. Paula, T. Chakrobartyb and K. M. Nasiruddina
aDept. of Biotechnology, Bangladesh Agricultural University (BAU) , Mymensing bDept. of Genetics and Plant Breeding, Bangladesh Agricultural University, Mymensing, Bangladesh ABSTRACT
The present work was conducted to identify Random Amplified Polymorphic DNA (RAPD) markers linked to the rice Bacterial Leaf Blight (BLB) resistance gene for a marker-assisted selection program. Eight genotypes were screened by RAPD marker. These are Iratom 24, Binasail, Binadhan 4, Binadhan 5, Binadhan 6, Binadhan 7, Brridhan 29 and BR 14. Out of 12 decamer random primers, two were used to amplify genomic DNA and the primers yielded a total of 12 RAPD markers of which 2 were considered as polymorphic. The primer 70AB10C10 produced maximum number of bands (7), whereas the least number of bands (4) was generated by the primer 71AB10G11. The percentage of polymorphic loci was 36.36. For all loci, the average number of allele was 1.1818 and the average number of gene diversity was 0.0787 and their standard deviation and mean were 0.4045 and 0.1758, respectively. A dendrogram based on genetic distance using UPGMA, indicates segregation of eight germplasms of rice into two main clusters Iratom 24, Binasail and BR 14 grouped in cluster I, while Binadhan 4, Binadhan 5, Binadhan 6, Binadhan 7, Brridhan 29 in cluster II. In cluster I, Iratom 24 alone formed sub cluster I; Binasail and BR 14 formed sub cluster II. In cluster II, Binadhan 4 forms subcluster I and Binadhan 5, Binadhan 6, Binadhan 7, Brridhan 29 grouped in sub cluster II. Brridhan 29 formed alone sub sub-cluster I. Again, sub sub-cluster I; Binadhan 7 formed alone cluster and Binadhan 5, Binadhan 6 formed sub sub-cluster III.The highest genetic distance (0.2007) was observed in Binasail Vs Binadhan 5, Binasail Vs Binadhan 6, Binasail Vs Binadhan 7, Binasail Vs Brridhan 29 and BR 14 Vs Binadhan 5,BR 14 Vs Binadhan 7, BR 14 Vs Brridhan 29 germplasms pair whereas, no genetic distance was estimated in Binadhan 6 Vs Binadhan 7, Binadhan 6 Vs Brridhan 29, Binadhan 5 Vs Binadhan 7, Binadhan 5 Vs Brridhan 29. Results are discussed considering the potential utility of the RAPD markers found, for marker assisted selection in rice breeding programs aiming at developing rice varieties with durable BLB resistance based on a combination of resistance genes.
Key Words: Rice variety, Genetic relationships, BLB resistance and RAPD markers
I. Introduction
Rice (Oryza sativa L.) is a staple food for more than half of the world’s population. The increasing demand for rice production is evident to meet the needs of increasing world population. One of such efforts is to cultivate rice with elevated level of disease resistance on marginal lands. To achieve a
Published with Open Access at Journal BiNET
Vol. 07, Issue 01: 608-620
Journal of Bioscience and Agriculture Research
Home page: www.journalbinet.com/jbar-journal.html
Please cite this article as: Paul, P. C., Chakrobarty, T. & Nasiruddin, K. M. (2016). Screening for BLB resistance in BRRI and BINA released rice germplasms using RAPD markers. Journal of Bioscience and Agriculture Research, 07(01), 608-620.
This article is distributed under terms of a Creative Common Attribution 4.0 International License.

Paul et al. (2016) / J. Biosci. Agric. Res. 07(01): 608-620 DOI: 10.18801/jbar.070116.73
609 Corresponding authoremail: [email protected] (Khondoker Md. Nasiruddin) EISSN: 2312-7945, © Paul et al.(2016), Research paper
substantial improvement in grain yield in a limited period, a second green revolution based on advanced plant biotechnology and plant genomics is needed (Conway and Toenniessen, 1999). Rice ranked first position by production during the year 2009-10 among all the cereals in Bangladesh (BBS, 2011). The total area and production of rice in Bangladesh is about 11.7 million hectares and 31.98 million metric tons, respectively (BBS, 2011). Although agro-climatic condition in Bangladesh is favorable for rice cultivation, rice production is being hampered in some areas of the country due to different diseases such as Bacterial leaf blight (BLB). Bacterial leaf blight (BLB) caused by the rod-shaped bacterium, Xanthomonas oryzae pv. oryzae (Xoo) is one of the most devastating diseases in rice. Outbreaks of BLB usually occur in irrigated and rainfed lowland ecologies throughout Asia and worldwide. Control measures for BLB include cultural practices, chemical control, biological control, disease forecasting, and most importantly, host genetic resistance. Since the chemical control is not effective, the utilization of resistant varieties carrying resistance genes have been considered to be the most effective way to control the disease (Nino-Lui et al., 2006). Most breeders are interested in utilizing BLB resistant varieties, and this goal is certainly achievable providing the availability of an easy strategy to identify resistance genes. At present, biotechnology progress continuously. Identification, cloning, and functional analyses of a gene can be performed relatively rapidly. In the case of BLB resistance, 35 BLB resistance genes have been identified in cultivated rice and the wild relatives (Singh et al., 2007; Wang et al., 2009). The first step towards rice improvement via marker-based selection and map based cloning of the resistance genes is the identification of molecular markers that are tightly linked to the genes of interest. Recent advances in molecular marker technology, has made it easier to identify and introgress resistance genes to desired genetic backgrounds. Several major resistance genes against BB pathogen have been tagged by Restriction Fragment Length Polymorphism (RFLP) and Randomly Amplified Polymorphic DNA Sequence (RAPD) markers (Yoshimura et al., 1992; Zhang et al., 1996). In this study, RAPD marker was used as it is important particularly for variety selection among eight HYV rice germplasms of Bangladesh released from Bangladesh Institute of Nuclear Agriculture, Mymensingh and Bangladesh Rice Research Institute, Gazipur. The specific objectives of the study were to screening of BINA released rice against BLB resistance, to establish the genetic relationship among eight rice genotypes at molecular level and to estimation of genetic relation and genetic variation between BLB resistance BR14 and other rice germplasms.
II. Methodology The experiment was carried out at the USDA Biotechnology Laboratory, Department of Biotechnology, Bangladesh Agricultural University, Mymensingh, Bangladesh during August 2011 to December 2011.
Study materials: Eight rice germplasms were used in this study. Seeds were collected from Bangladesh Rice Research Institute (BRRI), Joydebpur and Bangladesh Institute of Nuclear Agriculture (BINA), Mymensingh. Seed germination was performed and germinated seeds were sown in pots. Fresh leaf samples from 15-18 day old seedlings were used as the source of genomic DNA. In order to carry out RAPD analysis, young growing leaves from each of the 8 varieties were collected randomly from each population and used as the source of genomic DNA.
Table 01. Name of rice germplasms and their available sources
SL. No. Germplasms Collected from 01. Iratom 24 Bangladesh Institute of Nuclear Agriculture(BINA) 02. Binasail Bangladesh Institute of Nuclear Agriculture(BINA) 03. Binadhan 4 Bangladesh Institute of Nuclear Agriculture(BINA) 04. Binadhan 5 Bangladesh Institute of Nuclear Agriculture(BINA) 05. Binadhan 6 Bangladesh Institute of Nuclear Agriculture(BINA) 06. Binadhan 7 Bangladesh Institute of Nuclear Agriculture(BINA) 07. Brridhan 29 Bangladesh Agricultural Research Institute(BRRI) 08. BR 14 Bangladesh Agricultural Research Institute(BRRI)

Paul et al. (2016) / J. Biosci. Agric. Res. 07(01): 608-620 DOI: 10.18801/jbar.070116.73
610 Corresponding authoremail: [email protected] (Khondoker Md. Nasiruddin) EISSN: 2312-7945, © Paul et al.(2016), Research paper
Extraction of genomic DNA: For extraction of genomic DNA of rice variety the following reagents were useed:
Extraction buffer:
(pH = 8.0)
50 mM Tris-HCl 25 mM EDTA
(Ethylene diamine tetra acetic acid)
300 mM NaCland 1% SDS (Sodium
Dodecyl Sulphate)
Phenol: Chloroform: Isoamyl alcohol
25: 24: 1 (v/v/v); equilibrated to pH near 8.0 with TE buffer
TE (Tris-EDTA) buffer: pH = 8.0
10 mM Tris - HCl
1 mM EDTA
Sodium acetate
(3 M),
pH = 5.2
Absolute
(100%)-
Ethanol
At first, healthy portions of the youngest leaves of the seedlings were cuts-apart with sterile scissors and forceps. The leaf material was washed very well with sterile distilled water and ethanol and dried on fresh tissue paper to remove spores of microorganisms and any other DNA contaminants. Approximately, 2 cm leaf tissues were cut into small pieces and taken into a 1.5 ml eppendorf tube. For digestion, 800 μl extraction buffers was taken into the tube in two installments; first leaf tissues were ground manually with the help of tissue homogenizer with 400 μl extraction buffer, then the remaining 400 μl extraction buffer was added. The ground samples were vortexed for 20 seconds and incubated at 65°C for 5 minutes in hot water bath. These were further vortexed for 20 seconds and again incubated at the same temperature (65°C) for 10 minutes. The extract was centrifuged for 10 minutes at 15000 rpm with a microcentrifuge for precipitation of cell debris and 600 μl supernatant was transferred to another microcentrifuge tube. To allow precipitation of the cell debris, the extract was centrifuged with 600 μl Phenol: Chloroform: Isoamyl-alcohol (25:24:1, v/v/v) for 10 minutes at 15000 rpm with a microcentrifuge followed by vortexed for few seconds and 600 μl supernatant was transferred to another microcentrifuge tube. For purification, equal volume (500 μl ) of chloroform: isoamyl alcohol ( 24: 1, v/v) was added to it and vortexed for few seconds. The solution was centrifuged again for 10 minutes at 15000 rpm. 400 μl of the supernatant was recovered carefully without upsetting the lower portion and placed in a new eppendorf tube. DNA was precipitated with 40 μl of Sodium acetate and 1000 μl of absolute (100%) ethanol followed by gentle mixing. At this point, DNA became visible as white strands by flicking the tube several times with fingers. DNA was pelleted by centrifugation for 25 minutes at 15,000 rpm. After discarding the liquid completely, reprecipitation of the DNA solution was done by adding 1000 μl of 70 % ethanol and pelleted by centrifugation for 10 minutes at 15000 rpm. After removing the liquid completely, the pellets were then air dried and dissolved in 30-50 μl of TE buffer. Finally, the DNA samples were stored at 20°C.
Confirmation of DNA preparation: DNA prepared by above protocol often contains a large amount of RNA and pigments which usually cause over estimation of DNA concentration on a spectrophotometer. Thus, the RNA of the DNA samples was removed by following way:
Removal of RNA from Sample: 70 μl of sample, 330 μl ul of water, 20 μl of RNAse was taken in a new eppendorf tube and kept in waterbath for 20 minutes (at 250C Tempreture of water). Equal volume (420μl) of Phenol : Chloroform : Isoamylalcohol (25:24:1,v/v/v) was added centrifuged for 10 minutes at 15000 rpm with a microcentrifuge (Refrigerated centrifuge, Sanyo, Japan) followed by vortexed for 20 seconds. 420 μl supernatant was transferred to another microcentrifuge tube. Equal volume (420μl) of Phenol : Chloroform : Isoamylalcohol (25:24:1,v/v/v) was added centrifuged for 5 minutes at 15000 rpm with a microcentrifuge (Refrigerated centrifuge, Sanyo, Japan) followed by vortexed for 20 seconds. 400 μl supernatant was transferred to another new microcentrifuge tube. DNA was precipitated with40 μl of Sodiumacetate and 1000 μl of absolute (100%) ethanol followed by gentle mixing. At this point, DNA became visible as white strands by flicking the tube several times with fingers. DNA was pelleted by centrifugation for 25 minutes at 15,000 rpm. After discarding the liquid completely, reprecipitation of the DNA solution was done by adding1000 μl of 70 % ethanol and pelleted by centrifugation for 10 minutes at 15000 rpm. After removing the liquid completely, the pellets were

Paul et al. (2016) / J. Biosci. Agric. Res. 07(01): 608-620 DOI: 10.18801/jbar.070116.73
611 Corresponding authoremail: [email protected] (Khondoker Md. Nasiruddin) EISSN: 2312-7945, © Paul et al.(2016), Research paper
then air dried and dissolved in 30-50 μl of TE buffer. Finally, the DNA samples were stored at 20°C. After removing RNA the sample was evaluated both quantitatively and qualitatively using 1% agarose gel.
Preparation of agarose gel (1%) for electrophoresis
Reagents: 1. Agarose powder (Fisher Biotech, USA)
2. 5X TBE Buffer (pH 8.3): Composition (For 1000 ml): • Tris: 54 g (Sigma, USA) • Boric Acid: 27.5g (SRL, India) • EDTA: 4.65 g (Loba chemie, India)
3. Ethidium Bromide (SRL, India)
Procedure: For preparing 1% gel, 1.5 g agarose powder (Fisher Biotech) was taken into a 500 ml Erlenmeyer flask containing 250 ml of I x TBE buffer prepared by adding 50 ml of 5 x TBE buffer in 200 ml of sterile deionized water. To prevent excessive evaporation, the top of the flask was covered with aluminium foil paper. The flask was cooked into a microwave oven for about 1 minute with occasional swirling to generate uniform suspension until no agarose particle was seen and the agarose solution became transparent. When the agarose solution cooled to about 500 C (flask was cool enough to comfortably hold with bare hand). Then, the gel was poured on to the gel bed (15 x 15 x2 cm 3 in size) that was placed on a level bench and the appropriate comb was inserted and finally, the bubbles were removed. Meanwhile, the gel became completely cooled and solidified and comb was removed gently.
DNA sample preparation and electrophoresis Procedure:The hardened gel was transferred to the electrophoresis chamber and keepingthe gel horizontal and containing sufficienrtX TBE buffer to cover the gel ~1mm. For each sample, 2 μl of water was placed on a piece of aluminum foil paper and 1 μl loading dye (0.25% xylene cyanol, 0.25% bromophenol blue,30% glycerol and I mM EDTA) was added to it using 0.5-10 μl adjustable micropipette. Loading buffer was used for monitoring loading and the progress of the electrophoresis and to increase the density of the sample so that it was stayed in well. Finally, 3 μl extracted DNA was added to it and mixed well using same micropipette. The samples were then added slowly to allow them to sink to the bottom of the wells. The gel was placed in the gel chamber containing I x TBE buffer. The final level of the buffer was -5 mm above the gel. The electrophoresis apparatus were then connected to the Power Supply and turned on to migrated the DNA from negative to positive electrode (Black to Red). Electrophoresis was carried out at l20 v for 1.20 hour to get the dye 1/4 of the gel length. When DNA migrated sufficiently, as judged from the migration of bromophenol blue of loading buffer, the power supply was switched off. 6 μl ethidium bromide (10 mg/ml) DNA stain was added to make the DNA visible under UV transilluminator and mixed well by gentle shaking for 20 minutes.
Documentation of the DNA samples: After electrophoresis, the gel was carefully taken out from the gel chamber and the gel gently washed in running water and placed on the UV transilluminator in the dark chamber of the image documentation system (Labortechnik. Germany). The UV light of the system was switched on; the image was viewed on the monitor, focused, acquired and saved in a floppy disc, as well as printed on thermal paper. The electrophoregram of DNA of 8 rice germplasms.
Quantification of DNA concentration: One of the important variables for PCR amplification is the concentration of genomic DNA. Because different DNA extraction methods produced DNA of widely different purity, it is necessary to optimize the amount of DNA used in the RAPD -assay to achieve reproducibility and strong signal. Excessive genomic DNA may result in smears or in a lack of clearly defined bands in the gel; on the other hand, too little DNA gives nonreproducible patterns (Williams et al., 1993). Thus, it is necessary to optimize the DNA concentration. It is best to do a series of RAPD reaction using a couple of primers and a set of serial dilutions of each genomic DNA to identify empirically the useful range of DNA concentration, for which reproducible RAPD patterns are obtained. For quantification of DNA concentration, the spectrophotometer's (Spectronict Genesis™, New York, USA) wavelength was set at 260 nm after the spectrophotometer UV lamp was warmed up. A square cuvette was filled with 2 ml sterile distilled water and placed in the cuvette chamber and the absorbance reading was adjusted to zero for standardization. The test samples were prepared by taking

Paul et al. (2016) / J. Biosci. Agric. Res. 07(01): 608-620 DOI: 10.18801/jbar.070116.73
612 Corresponding authoremail: [email protected] (Khondoker Md. Nasiruddin) EISSN: 2312-7945, © Paul et al.(2016), Research paper
2 ul of each DNA sample in the cuvette containing 2 ml sterile distilled water and through mixing by pipetting. After recording the absorbance reading, the cuvette was rinsed out with sterile water, tamped out on a paper wipe, and absorbance readings for each sample was recorded in this way and are listed in Table 02.
Using the absorbance reading, the original sample concentration was determined according to the following formula:
100005.0)(
)()/(
mlsampleDNAofAmount
mlwaterdistilledofVolumeAbsorbancelngionconcentratDNA
The results of the DNA concentration were obtained in μg/ μl, these results containing a fraction. Therefore, to avoid fraction was converted it in ng/ μl . ( l μg- =-10-3-ng). Therefore, the result was multiplied with 1000.
Preparation of working solution (50 ng/ μl) of DNA samples: Working solution (50 ng/ μl ) from different DNA samples was prepared using the following formula: V1S1 = V2S2
Where, V1 = Final volume of DNA solution (μl) S1 = Final DNA concentration (ng/ μl) V2 = Initial volume of DNA solution (μl) S2 = Initial DNA concentration (ng/ μl)
Amplification of RAPD markers by polymerase chain reaction (PCR): To perform the amplification of RAPD, a single oligonucleotide of arbitrary DNA sequence is mixed with genomic DNA in the presence of a thermostable DNA polymerase and suitable buffer, and then subjected to temperature cycling conditions typical to the polymerase chain reaction (PCR). The products of the reaction depend on the sequence and the length of the oligonucleotide, as well as the reaction conditions. At an appropriate annealing temperature during the thermal cycle, the single primer binds to site on opposite strands of the genomic DNA that are within an amplifiable distance of each other (e.g., within few thousand nucleotides), and a discrete DNA segment is produced. The presence or absence of this specific product, although amplified with an arbitrary primer, will be diagnostic for the oligonucleotide-binding sites on the genonmic DNA. In practice, the DNA amplification reaction is repeated on a set of DNA samples with several different primers, under conditions that result in several amplified bands from each primer. Polymorphic bands are noted and the polymorphisms can be mapped in a segregating population. Often a single primer can be used to identify several polymorphisms, each of which matches to a different locus.
Primer selection: Ten primers of random sequence (imported from Japan) were screened on a sub sample of one randomly chosen individual from ten different cultivars to evaluate their suitability for amplifying DNA sequences, which could be accurately scored. Primers were selected on the basis of band resolution intensity, presence of smearing, consistency within individuals and potential for population discrimination. The details of the primers are given in Table 3. Final subset of three primers exhibiting good quality banding patterns and sufficient variability were selected for further analysis.
Reaction mix preparation to perform PCR: Conditions for RAPD, amplification reactions were maintained essentially following Williams et al. (1990) with some modifications. PCR reactions were performed on each DNA sample in a l0μl reaction mix containing the following reagents:
1. Taq DNA polymerase buffer (10 x) = 1 μl 2. Primer = 2 μl (10 uM) 3. dNTPs (250 pM) = 1 μl 4. Taq DNA polymerase = I unit (0.2 μl) (Genei, Bangalore, India) 5. Genornic DNA (50 ng/ μl) =2 μl (100 ug) and 6. MgCl2 = I unit (0.6 μl) (Genei, Bangalore, India) 7. A suitable amount of sterile deionized water to prepare 10 μl reaction mix.
During the experiment, PCR buffer, dNTPs, and primer solutions were thawed from frozen stocks, mixed by vortexing and placed on ice. DNA samples were also thawed out and mixed gently. The primers were pipetted first into PCR tubes compatible with the thermocycler used (0.2 ml). For each DNA sample being

Paul et al. (2016) / J. Biosci. Agric. Res. 07(01): 608-620 DOI: 10.18801/jbar.070116.73
613 Corresponding authoremail: [email protected] (Khondoker Md. Nasiruddin) EISSN: 2312-7945, © Paul et al.(2016), Research paper
tested, a pre-mix was then prepared including, in the following order: buffer, dNTPs, DNA template and sterile distilled water. Taq DNA polymerase enzyme was then added to the pre-mix. The pre-mix was then mixed well and aliquoted into the tubes containing primers. The tubes were then sealed and placed in a thermocycler and the cycling was started immediately.
Thermal profile: DNA amplification was performed in an oil-free thermal cycler (Master Cycler Gradient, Eppendorf, Germany). The reaction mix was preheated at 95°C for 3 minutes followed by 40 cycles of 1 minute denaturation at 94°C, 1.30 minute annealing at 35°C and elongation or extension at 72°C for 2 minutes. After the last cycle, a final step of 7 minutes at 72°C was added to allow complete extension of all amplified fragments. After completion of cycling program, reactions were held at 4°C.
Electrophoresis of the amplified products and documentation: The amplified products were electrophoretically separated on 1.4 % agarose gel. The gel was prepared using 1.4g agarose powder (Fisher Biotech, New Jersey, USA), 100 ml I x TBE buffer. Agarose gel electrophoresis was conducted in Ix TBE buffer at 120 V for 1.30hour. One molecular weight marker 1 kb DNA ladder size and 20bp were electrophoresed alongside the RAPD reactions. After completion of gel run 20ul ethidium bromide mixed in water, gel was kept in this mixture for 20 minutes. DNA bands were observed under UV light on a Transilluminator and photographed by image documentation system (Labortechnik, Germany).
RAPD data analysis: Since RAPD markers are dominant, we assumed that each band represented the phenotype at a single allelic locus (Williams el al., 1990). One molecular weight marker, 1000bp and 20bp DNA ladder were used to estimate the size of the amplification:
Accession No. Absorbance DNA Cone. ( ng/ μl) Iratom 24 0.006 300 Binasail 0.007 350 Binadhan 4 0.008 400 Binadhan 5 0.008 400 Binadhan 6 0.006 300 Binadhan 7 0.009 450 Brridhan 29 0.007 350 BR 14 0.006 300
Table 03. Parameters of random primers used in the study for screening
SL. No. Primer code Sequence GC Content (%)
1 70AB10C10 ACGAGCATGG 60
2 71AB10G11 GGTCCTACCA 60
Products by comparing the distance traveled by each fragment with that of the known sized fragments of molecular weight markers. All distinct bands or fragments (RAPD markers) were thereby given identification numbers, according to their position on gel and scored visually on the basis of their presence (1) or absence (0), separately for each individual and each primer. The scores obtained using all primers in the RAPD analysis were then pooled to create a single data matrix. This was used to estimate polymorphic loci, Nei's (1973) gene diversity, population differentiation (Gst), gene flow (Nm), genetic distance (D) and to construct a UPGMA (Unweighted Pair Group Method of Arithmetic Mean) dendrogram among populations using a computer program, POPGENE (Version 1.3 1). Gene frequency estimation for RAPD loci was based on the assumption of a two allele system. Only one of the two alleles is capable to amplify a RAPD marker by primer annealing, at an unknown genomic position (locus). The other is the "null" allele incapable of amplification, mainly because of loss of primer-annealing site by mutation. The two allele assumption is in most cases acceptable because, co-dominant loci showing band shifts are few (Elo et al., 1997). In this system only a null homozygote is detectable as negative for the RAPD band of interest. Under the assumption of Hardy-Weinberg equilibrium, the null allele frequency (q) may be (N/n) V2; where, N and n are the number of band negative individuals observed and the sample size, respectively. The frequency of the other allele (P) is I -q. The assumption of the two allele system enables us to calculate the Nei's genetic distance (Nei, 1972) from the RAPD pattern. Genetic-similarity values defined as the fraction of shared bands

Paul et al. (2016) / J. Biosci. Agric. Res. 07(01): 608-620 DOI: 10.18801/jbar.070116.73
614 Corresponding authoremail: [email protected] (Khondoker Md. Nasiruddin) EISSN: 2312-7945, © Paul et al.(2016), Research paper
between the RAPD profiles of any two individuals on the same gel were calculated manually. RAPD markers of the same molecular weight on the data matrix according to the following formula:
Similarity index (SI) = 2 Nxy/ (Nx + Ny)
Where, Nxy is the number of RAPD bands shared by individuals x and y respectively, and NX and NY are the number of bands in individual x and y, respectively (Lynch., 1990; Chapco et al., 1992; Wilde et al., 1992). Between population similarity (Sij) was calculated as the average similarity between each paired individuals of population i and j (Lynch, 1991).
Gene flow, (Nm) was estimated according to the following formula: Gene flow, Nm = 0.5 (1 -Gst)/ Gst
Where, Gst is the proportion of total genetic diversity attributable to subpopulation. It is also known as coefficient of gene differentiation.
The Gst values were calculated by using the following formula: Gst= 1- HMt
Where, Hs are the mean average heterozygosity of the total population and Ht is the mean of Hardy-Weinberg expectation of heterozygosity obtained with population average allele frequencies.
Nei's genetic distance and identity values were computed from frequencies of polymorphic markers to estimate genetic relationship between the studied eight varieties using the unweighted pair-group method of arithmetic means (UPGMA) (Sneath and Sokal, 1973). The dendrogram was constructed using the POPGENE (Version 1.3 1) computer program.
III. Results and Discussion Primer selection and RAPD pattern
Eight rice germplasms were analyzed as a group and a total of 11 RAPD bands were scored. Twelve primers were initially screened for their ability to produce polymorphic patterns and 2 primers (70AB10C10, 71AB10G11) which gave reproducible and distinct polymorphic amplified products were selected. A total of 11 polymorphic amplification products were obtained by using these arbitrary primers. The selected two primers produced comparatively maximum number of high intensity band with minimal smearing. The two primers showing good technical resolution and sufficient variation among different cultivars produced a total of 11 RAPD markers of which 4 (36. 36%) considered as plymorphic (either occurring in or absent in less than 11 of all individuals) Table 05. The highest numbers of bands were generated by primer 70AB10C10 whereas; the least number of bands were produced by primer 71AB10G11. The polymorphic amplification bands ranged from 2-4 and were amounted to be 18.18% on average (Table 04). The banding patterns of 11 rice germplasms using primers 70AB10C10, 71AB10G11 are shown in (Figure 01).
Table 04. RAPD Primer with corresponding bands scored and their size range together with polymorphic bands observed in 8 rice germplasms
Primer codes No. of bands scored No. of poly morphic bands Polymorphic loci (%) 70AB10C10 7 2 28.57 71AB10G11 4 2 50.00 Total 11 4 36.36 Average 5.5 2 18.18
Table 05. Frequencies of Polymorphic RAPD markers in eight rice germplasm
Locus Iratom 24 Binasail Binadhan 4 Binadhan 5 Binadhan 6 Binadhan 7 Brridhan 29 BR 14 70AB10C10-1 0.0000 1.0000 0.1835 0.0000 0.0000 0.0000 0.0000 1.0000 70AB10C10-2 1.0000 1.0000 1.0000 1.0000 1.0000 1.0000 1.0000 1.0000 70AB10C10-3 1.0000 1.0000 1.0000 1.0000 1.0000 1.0000 1.0000 1.0000 70AB10C10-4 1.0000 1.0000 1.0000 1.0000 1.0000 1.0000 1.0000 1.0000 70AB10C10-5 1.0000 1.0000 1.0000 1.0000 1.0000 1.0000 1.0000 1.0000 70AB10C10-6 1.0000 1.0000 1.0000 1.0000 1.0000 1.0000 1.0000 1.0000 70AB10C10-7 1.0000 1.0000 1.0000 1.0000 1.0000 1.0000 1.0000 1.0000 71AB10G11-1 1.0000 1.0000 1.0000 1.0000 1.0000 1.0000 1.0000 1.0000

Paul et al. (2016) / J. Biosci. Agric. Res. 07(01): 608-620 DOI: 10.18801/jbar.070116.73
615 Corresponding authoremail: [email protected] (Khondoker Md. Nasiruddin) EISSN: 2312-7945, © Paul et al.(2016), Research paper
71AB10G11-2 1.0000 1.0000 1.0000 0.0000 0.0000 0.0000 0.0000 1.0000 71AB10G11-3 1.0000 1.0000 1.0000 1.0000 1.0000 1.0000 1.0000 1.0000 71AB10G11-4 1.0000 1.0000 1.0000 1.0000 1.0000 1.0000 1.0000 1.0000
1kb 1 2 3 4 5 6 7 8 9 10 11 12 20bp
1kb 13 14 15 16 17 18 19 20 21 22 23 24 20bp
[ A ]
1kb 1 2 3 4 5 6 7 8 9 10 11 12 20bp
1kb 13 14 15 16 17 18 19 20 21 22 23 24 20bp
[ B ]
Figure 01. RAPD profile of 8 rice germplasms. In [A]-Primer 70AB10C10 (1,2,3-Iratom 24; 4,5,6-Binasail; 7,8,9-Binadhan 4; 10,11,12- Binadhan 5; 13,14,15- Binadhan 6; 16,17,18- Binadhan 7; 19,20,21-Brridhan 29; 22,23,24-BR 14. In [B]-Primer 71AB10G11(1,2,3-Iratom 24; 4,5,6-Binasail;
1500
1200
800
600
100
1500
1200
800
600 100
Paul et al. (2016) / J. Biosci. Agric. Res. 07(01): 608-620 DOI: 10.18801/jbar.070116.73
616 Corresponding authoremail: [email protected] (Khondoker Md. Nasiruddin) EISSN: 2312-7945, © Paul et al.(2016), Research paper
7,8,9-Binadhan 4; 10,11,12- Binadhan 5; 13,14,15- Binadhan 6; 16,17,18- Binadhan 7; 19,20,21-Brridhan29;22,23,24-BR14.
Frequency of polymorphic loci
The DNA polymorphisms were detected according to the presence and absence of bands. Absence of bands may be caused by failure of primers to anneal a site in some individuals due to nucleotide sequence differences or by insertions or deletions in primer sites (Clark and Lanigan, 1993). Frequencies of polymorphic RAPD markers are shown in Table 05. According to the results in Table 06, Binadhan 4 showed more genetically diversified comparative to the other germplasms and BR 14 and Binasail showed less genetically diversified comparative to the other germplasms.
Intra-germplasm similarity indices (Si)
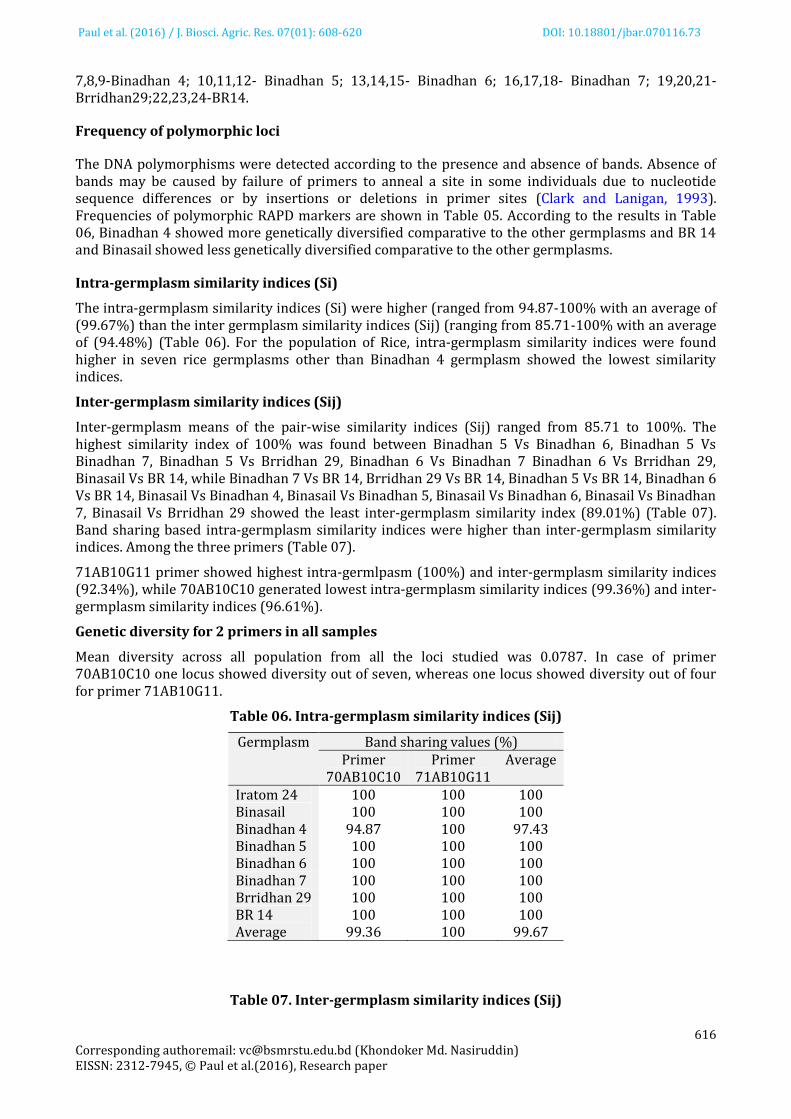
The intra-germplasm similarity indices (Si) were higher (ranged from 94.87-100% with an average of (99.67%) than the inter germplasm similarity indices (Sij) (ranging from 85.71-100% with an average of (94.48%) (Table 06). For the population of Rice, intra-germplasm similarity indices were found higher in seven rice germplasms other than Binadhan 4 germplasm showed the lowest similarity indices.
Inter-germplasm similarity indices (Sij)
Inter-germplasm means of the pair-wise similarity indices (Sij) ranged from 85.71 to 100%. The highest similarity index of 100% was found between Binadhan 5 Vs Binadhan 6, Binadhan 5 Vs Binadhan 7, Binadhan 5 Vs Brridhan 29, Binadhan 6 Vs Binadhan 7 Binadhan 6 Vs Brridhan 29, Binasail Vs BR 14, while Binadhan 7 Vs BR 14, Brridhan 29 Vs BR 14, Binadhan 5 Vs BR 14, Binadhan 6 Vs BR 14, Binasail Vs Binadhan 4, Binasail Vs Binadhan 5, Binasail Vs Binadhan 6, Binasail Vs Binadhan 7, Binasail Vs Brridhan 29 showed the least inter-germplasm similarity index (89.01%) (Table 07). Band sharing based intra-germplasm similarity indices were higher than inter-germplasm similarity indices. Among the three primers (Table 07).
71AB10G11 primer showed highest intra-germlpasm (100%) and inter-germplasm similarity indices (92.34%), while 70AB10C10 generated lowest intra-germplasm similarity indices (99.36%) and inter-germplasm similarity indices (96.61%).
Genetic diversity for 2 primers in all samples
Mean diversity across all population from all the loci studied was 0.0787. In case of primer 70AB10C10 one locus showed diversity out of seven, whereas one locus showed diversity out of four for primer 71AB10G11.
Table 06. Intra-germplasm similarity indices (Sij)
Germplasm Band sharing values (%) Primer
70AB10C10 Primer
71AB10G11 Average
Iratom 24 100 100 100 Binasail 100 100 100 Binadhan 4 94.87 100 97.43 Binadhan 5 100 100 100 Binadhan 6 100 100 100 Binadhan 7 100 100 100 Brridhan 29 100 100 100 BR 14 100 100 100 Average 99.36 100 99.67
Table 07. Inter-germplasm similarity indices (Sij)

Paul et al. (2016) / J. Biosci. Agric. Res. 07(01): 608-620 DOI: 10.18801/jbar.070116.73
617 Corresponding authoremail: [email protected] (Khondoker Md. Nasiruddin) EISSN: 2312-7945, © Paul et al.(2016), Research paper
Germplasm Band sharing values (%) Primer
70AB10C10 Primer
71AB10G11 Average
Iratom 24 Vs Binasail 92.31 100 96.15 Iratom 24 Vs Binadhan 4 97.43 85.71 91.57 Iratom 24 Vs Binadhan 5 100 85.71 92.85 Iratom 24 Vs Binadhan 6 100 85.71 92.85 Iratom 24 Vs Binadhan 7 100 85.71 92.85 Iratom 24 Vs Brridhan 29 100 85.71 92.85 Iratom 24 Vs BR 14 100 100 100 Binasail Vs Binadhan 4 92.31 85.71 89.01 Binasail Vs Binadhan 5 92.31 85.71 89.01 Binasail Vs Binadhan 6 92.31 85.71 89.01 Binasail Vs Binadhan 7 92.31 85.71 89.01 Binasail Vs Brridhan 29 92.31 85.71 89.01 Binasail Vs BR 14 100 100 100 Binadhan 4 Vs Binadhan 5 97.43 100 98.71 Binadhan 4 Vs Binadhan 6 97.43 100 98.71 Binadhan 4 Vs Binadhan 7 97.43 100 98.71 Binadhan 4 Vs Brridhan 29 97.43 100 98.71 Binadhan 4 Vs BR 14 94.87 85.71 90.29 Binadhan 5 Vs Binadhan 6 100 100 100 Binadhan 5 Vs Binadhan 7 100 100 100 Binadhan 5 Vs Brridhan 29 100 100 100 Binadhan 5 Vs BR 14 92.31 85.71 89.01 Binadhan 6 Vs Binadhan 7 100 100 100 Binadhan 6 Vs Brridhan 29 100 100 100 Binadhan 6 Vs BR 14 92.31 85.71 89.01 Binadhan 7 Vs Brridhan 29 100 100 100 Binadhan 7 Vs BR 14 92.31 85.71 89.01 Brridhan 29 Vs BR 14 92.31 85.71 89.01 Average 96.61 92.34 94.48
Nei’s (1972) genetic identity and genetic distance
The highest Nei’s (1972) genetic distance (0.2007) was observed in Binasail Vs Binadhan 5, Binasail Vs Binadhan 6, Binasail Vs Binadhan 7, Binasail Vs Brridhan 29 and BR 14 Vs Binadhan 5, BR 14 Vs Binadhan 6, BR 14 Vs Binadhan 7, BR 14 Vs Brridhan 29 germplasms pair whereas, no genetic distance was estimated in Binadhan 6 Vs Binadhan 7, Binadhan 6 Vs Brridhan 29, Binadhan 5 Vs Binadhan 6, Binadhan 5 Vs Binadhan 7, Binadhan 5 Vs Brridhan 29 (Table 09). Furthermore, high level of genetic distance was found in Binasail Vs Binadhan 4 and Binadhan 4 Vs BR 14(0.1667); Binadhan 4 Vs Iratom 24 (0.1000); Iratom 24 Vs Binadhan 4, Iratom 24 Vs Binadhan 5, Iratom 24 Vs Binadhan 6, Iratom 24 Vs Binadhan 7, Iratom 24 Vs Brridhan 29 (0.0.0953) germplasms pair and low level of genetic distance was observed in Binadhan 4 Vs Binadhan 5, Binadhan 4 Vs Binadhan 6, Binadhan 4 Vs Binadhan 7, Binadhan 4 Vs Brridhan 29 germplasms pair (0.0030).
Dendrogram
A dendrogram based on Nei’s (1972) genetic distance using UPGMA, indicates segregation of eight germplasms of rice into two main clusters Iratom 24, Binasail and BR 14 grouped in cluster I, while Binadhan 4, Binadhan 5, Binadhan 6, Binadhan 7, Brridhan 29 in cluster II (Figure 02). In cluster I, Iratom 24 alone formed sub cluster I; Binasail and BR 14 formed sub cluster II. In cluster II, Binadhan 4 forms subcluster I and Binadhan 5, Binadhan 6, Binadhan 7, Brridhan 29 grouped in sub cluster II. Brridhan 29 formed alone sub sub-cluster I. Again, sub sub-cluster I; Binadhan 7 formed alone cluster and Binadhan 5, Binadhan 6 formed sub sub-cluster III (Figure 02). Iratom 24, Binasail and BR14 grouped in one cluster because their banding patterns are same.

Paul et al. (2016) / J. Biosci. Agric. Res. 07(01): 608-620 DOI: 10.18801/jbar.070116.73
618 Corresponding authoremail: [email protected] (Khondoker Md. Nasiruddin) EISSN: 2312-7945, © Paul et al.(2016), Research paper
Table 08. Summary of Genic Variation Statistics for All Loci
Locus Sample Size Na* Ne* H* I*
70AB10C10-1 24 2.0000 1.6581 0.3963 0.5862 70AB10C10-2 24 1.0000 1.0000 0.0000 0.0000
70AB10C10-3 24 1.0000 1.0000 0.0000 0.0000 70AB10C10-4 24 1.0000 1.0000 0.0000 0.0000
70AB10C10-5 24 1.0000 1.0000 0.0000 0.0000 70AB10C10-6 24 1.0000 1.0000 0.0000 0.0000 70AB10C10-7 24 1.0000 1.0000 0.0000 0.0000
71AB10G11-1 24 1.0000 1.0000 0.0000 0.0000 71AB10G11-2 24 2.0000 1.8824 0.4688 0.6616
71AB10G11-3 24 1.0000 1.0000 0.0000 0.0000 71AB10G11-4 24 1.0000 1.0000 0.0000 0.0000
Mean 24 1.1818 1.1400 0.0787 0.1134 St. Dev. 0.4045 0.3156 0.1758 0.2529
Here,
Na=observed number of alleles Ne=Effective number of alleles H=Nei's (1973) gene diversity
I= Shannon's Information index
Table 09. Genetic distance value for different germplasm Germplasm Iratom
24 Binasail Binadhan
4 Binadhan
5 Binadhan
6 Binadhan
7 Brridhan
29 BR 14
Iratom 24 Binasail 0.0953 Binadhan 4 0.1000 0.1667 Binadhan 5 0.0953 0.2007 0.0030 Binadhan 6 0.0953 0.2007 0.0030 0.0000 Binadhan 7 0.0953 0.2007 0.0030 0.0000 0.0000 Brridhan 29 0.0953 0.2007 0.0030 0.0000 0.0000 0.0000 BR 14 0.0953 0.0000 0.1667 0.2007 0.2007 0.2007 0.2007
0.2007 0.1667 1.000 0.0953 0.0030 0.0000 Figure 02. UPGMA Dedogram based on Nei’s genetic distance, summarizing the data on differentiation between 8 Rice germplasms according to RAPD analysis. Maximum moderately resistant lines and Binasail grouped in same cluster due to lower genetic distance. While, majority susceptible lines showed higher genetic distance with moderately resistant line BR 14 and also Binasail. The RAPD technique was found to discriminate eight rice germplasms.
Iratom 24
Binasail
BR 14
Binadhan 4 Binadhan 5 Binadhan 6
Binadhan 7
BRRIdhan29

Paul et al. (2016) / J. Biosci. Agric. Res. 07(01): 608-620 DOI: 10.18801/jbar.070116.73
619 Corresponding authoremail: [email protected] (Khondoker Md. Nasiruddin) EISSN: 2312-7945, © Paul et al.(2016), Research paper
Germplasms showing higher intra-population similarity and lower proportion of polymorphic loci are likely to have less heterozygosity as compared to those showing less intra-germplasm similarity and higher proportion of polymorphic loci. In other words, germplasms having higher similarity are more homogenous groups. Binadhan 4 showed more genetically diversified comparative to the other germplasms. Out of 2 RAPD markers, 4 scorable bands (36.36%) were considered as polymorphic. This proportion of polymorphism is more or less compared to some previous RAPD analysis in rice e.g. 46.5% of rice landraces were polymorphic in Pandey et al. (2004), 26.27% of rice landraces in and lower polymorphic from 64.5% of rice landraces in Sharawy and Fiky, (2003). This difference can be attributed to the primers used and the genotypes evaluated. Intra-germplasm similarity indices in rice germplasms (Si) ranged from 94.87-100%, while pair-wise similarity indices (Sij) ranged from 85.71-100%. This implies that individuals within each germplasms are genetically more similar into each other, as it expected to be, than to individuals from all other germplasm.
IV. Conclusion Among eight rice germplasms, all showed the highest intra-germplasms similarity indces except Binadhan 4. The less degree of similarity (Si = 94.87%) between the RAPD profiles of Binadhan 4 indicated highest genetic variability among individuals of the population. It is also found that the genetic variability of other four germplasms namely Binadhan 5, Binadhan 6, Binadhan 7, Brridhan 29, BR 14, Iratom 24, Binasail were not found. Inter-germplasm similarity index between Binadhan 5 Vs Binadhan 6, Binadhan 5 Vs Binadhan 7, Binadhan 5 Vs Brridhan 29, Binadhan 6 Vs Binadhan 7 Binadhan 6 Vs Brridhan 29, Binasail Vs BR 14 (100%) germplasm pair was found higher. On the other hand, similarity between Binadhan 7 Vs BR 14, Brridhan 29 Vs BR 14, Binadhan 5 Vs BR 14, Binadhan 6 Vs BR 14, Binasail Vs Binadhan 4, Binasail Vs Binadhan 5, Binasail Vs Binadhan 6, Binasail Vs Binadhan 7, Binasail Vs Brridhan 29 was found lower (89.01%). All of 28 germplasms pair were not homogenous at different number of loci. The cluster pattern of 8 germplasms of rice showed two main clusters. Iratom 24, Binasail and moderately resistant BR 14 grouped in cluster one. In contrast, Binadhan 4, Binadhan 5, Binadhan 6, Binadhan 7, Brridhan 29 formed alone the other cluster. Moderately resistant line, BR 14, Binasail and Iratom 24 grouped in same cluster because of lower genetic distance. On the other hand, majority susceptible lines showed higher genetic distance with moderately resistant line and also Binasail and Iratom 24. BR 14 was taken as a moderately resistant variety. Binasail and Iratom 24 showed more similarity with this variety. So, Binasail and Iratom 24 may be resistant to BLB.
Acknowledgements
Authors are grateful to the Ministry of Science and Technology, Government of the People’s Republic of Bangladesh for the assignation of National Science and Technology fellowship which has partly supported the research work.
V. References
[1]. BBS, (2011). Bureau of Statistics, Ministry of Planning, Govt. of People's Republic of Bangladesh. [2]. Chapco, W., Ashton, N.W., Martel, R.K., Antonishishyn, N. & Crosby W.L. (1992). A feasibility
study of the use of random amplified polymorphic DNA in the population genetics and systematic of grasshoppers. Genome, 35, 569-574. http://dx.doi.org/10.1139/g92-085
[3]. Clark, A.G. & Lanigan, C.M.S. (1993). Prospects for estimating nucleotide divergence with RAPDs. Molecular Biology and Evoluition, 10, 1069-1111.
[4]. Conway, G. & Toenniessen, G. (1999). Feeding the world in the twenty-first century. Nature, 402, 55-58. http://dx.doi.org/10.1038/35011545
[5]. Elo, K., Ivanoff, S., Vuorinen, J. A. & Piironen, J. (1997). Inheritance of RAPD markers and detection of inter-specific hybridization with brown trout and extraction and multiplex fluorescent PCR method for marker assisted selection in breeding. Plant Breeding, 123, 554-557.
[6]. Lynch, M. (1990). The similarity index and DNA fingerprinting. Molecular Biology and Evoluition, 7(5), 478-484.

Paul et al. (2016) / J. Biosci. Agric. Res. 07(01): 608-620 DOI: 10.18801/jbar.070116.73
620 Corresponding authoremail: [email protected] (Khondoker Md. Nasiruddin) EISSN: 2312-7945, © Paul et al.(2016), Research paper
[7]. Nei, M. (1972). Genetic distance between populations. American Naturalist, 106: 283-292. Ovesna, J., K. Polakovaand L. Lisova. 2002. DNA analyses and their applications in plant breeding. Czech Journal of Genetics and Plant Breeding, 38, 29-40.
[8]. Nei, M. (1973). Analysis of gene diversity in subdivided populations. Proceedings of the National Academy of Sciences, U.S.A, 70, 3321-3323. http://dx.doi.org/10.1073/pnas.70.12.3321
[9]. Nino-Lui, D. O., Ronald, P. C. & Bogdanove, A. J. (2006). Pathogen profile Xanthomonusoryzaepathovars: model pathogen of a model crop. Molecular Plant Pathology, 7(5), 303-324. http://dx.doi.org/10.1111/j.1364-3703.2006.00344.x
[10]. Singh, K., Vikal, Y., Mahajan, R., Cheema, K. K., Bhatia, D., Sharma, R., Lore, J. S. & Bharaj, T. S. (2007). Three novel bacterial blight resistance genes identified, mapped and transfer to cultivated rice O. sativa L., In: The 2nd International Conference on Bacterial Blight of Rice. Nanjing, China, 82-84.
[11]. Sneath, P. H. A. & Sokal, R. R. (1973). Numerical taxonomy. W. H. Freeman & Co., San Francisco, 21-28.
[12]. Wang, C., Wen, G., Lin, X., Liu, X. & Zhang, D. (2010). Identification and fine mapping of a new bacterial blight resistance gene, Xa31(t) in rice. European Journal of Plant Pathology, 123, 235-240. http://dx.doi.org/10.1007/s10658-008-9356-4
[13]. Wilde, J., Waugh, R. & Powell, W. (1992). Genetic fingerprinting of Teobroma clones using randomly amplified polymorphic DNA markers. Theoretical and Applied Genetics, 83, 871-877.
[14]. Williams, J. G. K., Hanafey, M. K., Rafalski, J. A. & Tingey, S. V. (1993). Genetic analysis using random amplified polymorphic DNA markers. Methods enzymol., 218, 705-740. http://dx.doi.org/10.1016/0076-6879(93)18053-f
[15]. Williams, J. G. K., Kubelik, A. R., Livak, K. J., Rafalski, J. A. & Tingey, S. V. (1990). DNA polymorphisms amplified by arbitrary primers are useful as genetic markers. Nucleic Acids Research, 18(22), 6531-6535. http://dx.doi.org/10.1093/nar/18.22.6531
[16]. Yoshimura, S., Yoshimura, A., Saito, A., Kishimoto, N., Kawase, M., Yano, M., Nakagahara, M., Ogawa. T. & Iwata, N. (1992). RFLP analysis of introgressed chromosomal segment in three near-isogenic lines of rice for bacterial blight resistance genes, Xa-1, Xa-3 and Xa-4. Jpn J Genet., 67, 29–37. http://dx.doi.org/10.1266/jjg.67.29
[17]. Zhang, J., Li, X., Jiang, G., Xu, Y. & He, Y. (2006). Pyramiding of Xa7 and Xa21 for the improvement of disease resistance to bacterial blight in hybrid rice. Plant Breeding, 125, 600-605. http://dx.doi.org/10.1111/j.1439-0523.2006.01281.x
How to cite this article? APA (American Psychological Association) Paul, P. C., Chakrobarty, T. & Nasiruddin, K. M. (2016). Screening for BLB resistance in BRRI and BINA released rice germplasms using RAPD markers. Journal of Bioscience and Agriculture Research, 07(01), 608-620. MLA (Modern Language Association) Paul, P. C., Chakrobarty, T. & Nasiruddin, K. M. “Black Screening for BLB resistance in BRRI and BINA released rice germplasms using RAPD markers.” Journal of Bioscience and Agriculture Research, 07.01 (2016), 608-620. Chicago/Turabian Paul, P. C., Chakrobarty, T. & Nasiruddin, K. M. “Screening for BLB resistance in BRRI and BINA released rice germplasms using RAPD markers.” Journal of Bioscience and Agriculture Research, 07, no. 01 (2016), 608-620.