Embed Size (px)
Citation preview

Available online at www.sciencedirect.com
Energy Procedia 00 (2008) 000–000
EnergyProcedia
www.elsevier.com/locate/XXX
GHGT-9
Screening CO2 storage options in the Netherlands
Andrea Ramíreza *, Saskia. Hagedoornb, Leslie Kramersc, Ton Wildenborgc, Chris Hendriksb
a: Utrecht University, Copernicus Institute, Heidelberglaan 2 3584CS, Utrecht the Netherlands b: Ecofys Netherlands, B.V. P. O. Box 8408 3503 RK Utrecht, The Netherlands
c: TNO Built Environment and Geosciences, P. O. Box 80015 3508 TA Utrecht, The Netherlands
Elsevier use only: Received date here; revised date here; accepted date here
Abstract
This paper describes the development and application of an methodology to screen and rank Dutch reservoirs suitable for long-term large scale CO2 storage. The screening is focused on off- and on-shore individual aquifers, gas and oil fields. In total 177 storage reservoirs have been taken into consideration (139 gas fields, 4 oil fields and 34 aquifers, with a total storage potential of about 3200 Mt CO2). These reservoirs have been selected from over five hundred potentially suitable CO2 storage reservoirs. The total number of storage reservoirs has been reduced by applying preconditions with associated threshold values. Nevertheless, the number of reservoirs is still significant and limits the possibility to use any pair-wise comparison method (e.g. Multi-Criteria programs such as Bosda or Naiade). Therefore, a excel tool has been developed based on linear aggregation. The tool screens the reservoirs based on three criteria: storage potentials, costs and effort needed to manage risk.
© 2008 Elsevier Ltd. All rights reserved
Keywords: CO2 storage, screening, costs, risks
1. Introduction
Carbon dioxide capture, transport and geological storage (CCS) is increasingly being considered as a significant greenhouse gas (GHG) mitigation option that could allow the continue use of fossil fuels while providing the time needed by renewable energy to be deployed at large scale. The 2008 Energy Technology Perspectives report of the International Energy Agency estimated a capture potential of about 20% of global CO2 emissions in 2050 (IEA, 2008), with other studies showing similar ranges (e.g. IPCC, 2005). The significant role forecasted for CCS is based on three main assumptions:
CO2 capture technology will be available;
* Corresponding author. Tel.: +31-302-537639; fax: +31-302-537601. E-mail address: [email protected]
c© 2009 Elsevier Ltd. All rights reserved.
Energy Procedia 1 (2009) 2801–2808www.elsevier.com/locate/procedia
doi:10.1016/j.egypro.2009.02.052

2 Ramirez et al./ Energy Procedia 00 (2008) 000–000
The option will be competitive (i.e. cost reductions will be achieved via learning and market conditions will be present, e.g CO2 price) and, Sufficient and suitable underground storage capacity will be available.
Work on storage capacity evaluation has focused on two main areas: i) assessments of total capacities per country or regions; ii) risk assessment and uncertainty analysis of CO2 storage. The first approach has resulted in inventories and global atlases, with an emphasis on storage capacities in developed countries. Such capacities are being used by modelers and policy makers to set the physical boundaries for national deployment of CCS. The second approach has resulted in the on-going development of methodological frameworks for risk assessments. Almost all frameworks are based on quantitative mathematical modeling (e.g. Wildenborg et al, 2002, Walton et al, 2004) and only a few semi-qualitative assessments (e.g. Oldenburg, 2005, Bachu, 2002). These quantitative methods comprise major involvement of many experts, detailed studies and extensive modeling work. Their applicability for a large set of potential storage sites is therefore limited.
Most information used by national policy makers on the possible role of CCS in a portfolio of mitigation measures has been based on national estimations of CO2 storage capacities that, in most cases, assume all fields to be available and suitable. Risk associated to CO2 storage affects the suitability of a reservoir and consequently affects regional and national capacity estimates. It is important to take risk into account as it will result in more realistic valuations of total technical CO2 storage potentials. A simplified screening method for comparison of the portfolio of CO2 storage options that uses (publicly) available data would be helpful. However, until now few efforts have been made to develop such methods (e.g. van Egmond, 2006; Meyer 2006). The objective of this study is to develop a methodological framework to screen and rank CO2 reservoirs in the Netherlands. Such a framework should enable us to integrate theoretical knowledge, expert knowledge and publicly available data for site characterization in a consistent, systematic and transparent way.
2. Methodology
Figure 1 shows a schematic diagram of the methodology used to develop the framework and of the flows of information among the different steps. Note that inputs from the consultation round with an expert panel play a central role in the methodology.
The first expert consultation was meant to ask a (inter)national panel of experts their opinion on the method, criteria and indicators selected. The feedback of the expert evaluation resulted in changes in the original indicators. The second consultation focused on gathering the information needed to aggregate and score the values for the criteria “effort needed to manage risk”. In this consultation each expert was asked to provide scores for categories defined within each indicator, to define weighs among the indicators so they could be aggregated in the screening tool and to quantify the uncertainty in the knowledge base. Results for the latter point are not presented in this article.
Selection of thresholds for CO2 storage sites(resulted in 170 reservoirs)
Selection of thresholds for CO2 storage sites(resulted in 170 reservoirs)
Consultation process with expert panel toevaluate methodology (1st survey)Consultation process with expert panel toevaluate methodology (1st survey)
Identification of total fields in the NetherlandsIdentification of total fields in the Netherlands
Definition of categorieswithin each indicator
Definition of categorieswithin each indicator
Definition ofscoring valuesDefinition of
scoring valuesDefinition of
weighsDefinition of
weighs
Scenario analysisScenario analysis
Uncertainty/sensitivity analysisUncertainty/sensitivity analysis
Stakeholder consultationStakeholder consultation
Final reportFinal report
Development of the database Development of the database
Pedigree values reflectinguncertainties in the knowledge
base
Pedigree values reflectinguncertainties in the knowledge
base
Selection of indicators for assessing the screening criteriaSelection of indicators for assessing the screening criteria
Run excel based tool
Run excel based tool
Consultation process with expert panel toobtain scoring and weighing values (2nd survey)Consultation process with expert panel toobtain scoring and weighing values (2nd survey)
RankingRanking
Selection of thresholds for CO2 storage sites(resulted in 170 reservoirs)
Selection of thresholds for CO2 storage sites(resulted in 170 reservoirs)
Consultation process with expert panel toevaluate methodology (1st survey)Consultation process with expert panel toevaluate methodology (1st survey)
Identification of total fields in the NetherlandsIdentification of total fields in the Netherlands
Definition of categorieswithin each indicator
Definition of categorieswithin each indicator
Definition ofscoring valuesDefinition of
scoring valuesDefinition of
weighsDefinition of
weighs
Scenario analysisScenario analysis
Uncertainty/sensitivity analysisUncertainty/sensitivity analysis
Stakeholder consultationStakeholder consultation
Final reportFinal report
Development of the database Development of the database
Pedigree values reflectinguncertainties in the knowledge
base
Pedigree values reflectinguncertainties in the knowledge
base
Selection of indicators for assessing the screening criteriaSelection of indicators for assessing the screening criteria
Run excel based tool
Run excel based tool
Consultation process with expert panel toobtain scoring and weighing values (2nd survey)Consultation process with expert panel toobtain scoring and weighing values (2nd survey)
RankingRanking
2802 A. Ramı́rez et al. / Energy Procedia 1 (2009) 2801–2808
Author name / Energy Procedia 00 (2008) 000–000 3
2.1. Identification of fields
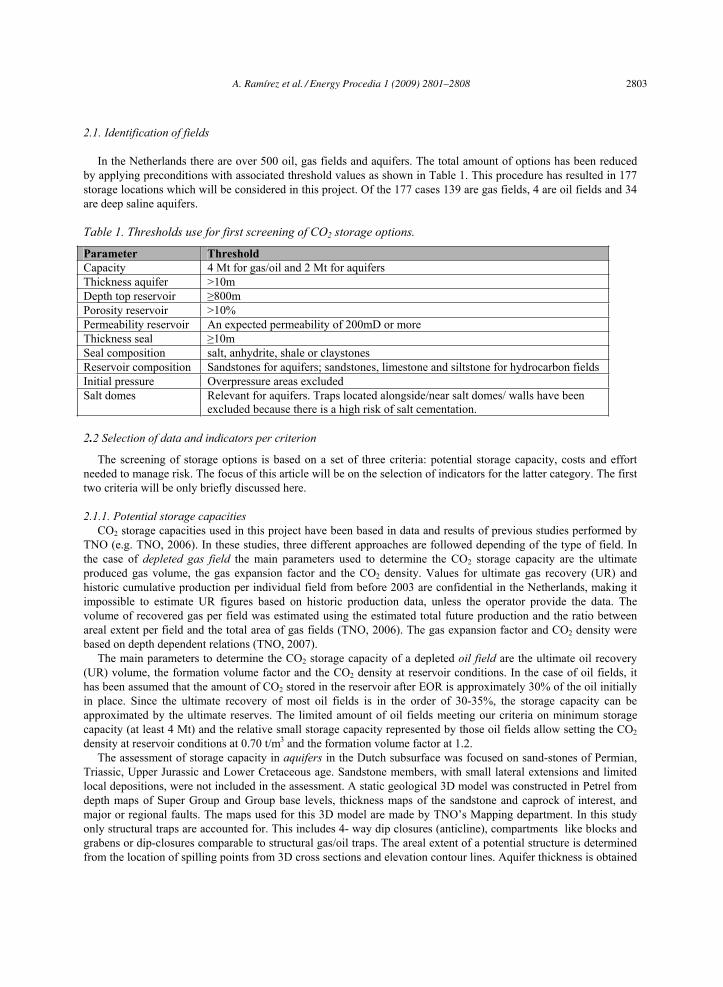
In the Netherlands there are over 500 oil, gas fields and aquifers. The total amount of options has been reduced by applying preconditions with associated threshold values as shown in Table 1. This procedure has resulted in 177 storage locations which will be considered in this project. Of the 177 cases 139 are gas fields, 4 are oil fields and 34 are deep saline aquifers.
Table 1. Thresholds use for first screening of CO2 storage options.
Parameter ThresholdCapacity 4 Mt for gas/oil and 2 Mt for aquifers Thickness aquifer >10m Depth top reservoir 800m Porosity reservoir >10% Permeability reservoir An expected permeability of 200mD or more Thickness seal 10m Seal composition salt, anhydrite, shale or claystones Reservoir composition Sandstones for aquifers; sandstones, limestone and siltstone for hydrocarbon fields Initial pressure Overpressure areas excluded Salt domes Relevant for aquifers. Traps located alongside/near salt domes/ walls have been
excluded because there is a high risk of salt cementation.
2.2 Selection of data and indicators per criterion
The screening of storage options is based on a set of three criteria: potential storage capacity, costs and effort needed to manage risk. The focus of this article will be on the selection of indicators for the latter category. The first two criteria will be only briefly discussed here.
2.1.1. Potential storage capacities CO2 storage capacities used in this project have been based in data and results of previous studies performed by
TNO (e.g. TNO, 2006). In these studies, three different approaches are followed depending of the type of field. In the case of depleted gas field the main parameters used to determine the CO2 storage capacity are the ultimate produced gas volume, the gas expansion factor and the CO2 density. Values for ultimate gas recovery (UR) and historic cumulative production per individual field from before 2003 are confidential in the Netherlands, making it impossible to estimate UR figures based on historic production data, unless the operator provide the data. The volume of recovered gas per field was estimated using the estimated total future production and the ratio between areal extent per field and the total area of gas fields (TNO, 2006). The gas expansion factor and CO2 density were based on depth dependent relations (TNO, 2007).
The main parameters to determine the CO2 storage capacity of a depleted oil field are the ultimate oil recovery (UR) volume, the formation volume factor and the CO2 density at reservoir conditions. In the case of oil fields, it has been assumed that the amount of CO2 stored in the reservoir after EOR is approximately 30% of the oil initially in place. Since the ultimate recovery of most oil fields is in the order of 30-35%, the storage capacity can be approximated by the ultimate reserves. The limited amount of oil fields meeting our criteria on minimum storage capacity (at least 4 Mt) and the relative small storage capacity represented by those oil fields allow setting the CO2density at reservoir conditions at 0.70 t/m3 and the formation volume factor at 1.2.
The assessment of storage capacity in aquifers in the Dutch subsurface was focused on sand-stones of Permian, Triassic, Upper Jurassic and Lower Cretaceous age. Sandstone members, with small lateral extensions and limited local depositions, were not included in the assessment. A static geological 3D model was constructed in Petrel from depth maps of Super Group and Group base levels, thickness maps of the sandstone and caprock of interest, and major or regional faults. The maps used for this 3D model are made by TNO’s Mapping department. In this study only structural traps are accounted for. This includes 4- way dip closures (anticline), compartments like blocks and grabens or dip-closures comparable to structural gas/oil traps. The areal extent of a potential structure is determined from the location of spilling points from 3D cross sections and elevation contour lines. Aquifer thickness is obtained
A. Ramı́rez et al. / Energy Procedia 1 (2009) 2801–2808 2803
4 Ramirez et al./ Energy Procedia 00 (2008) 000–000
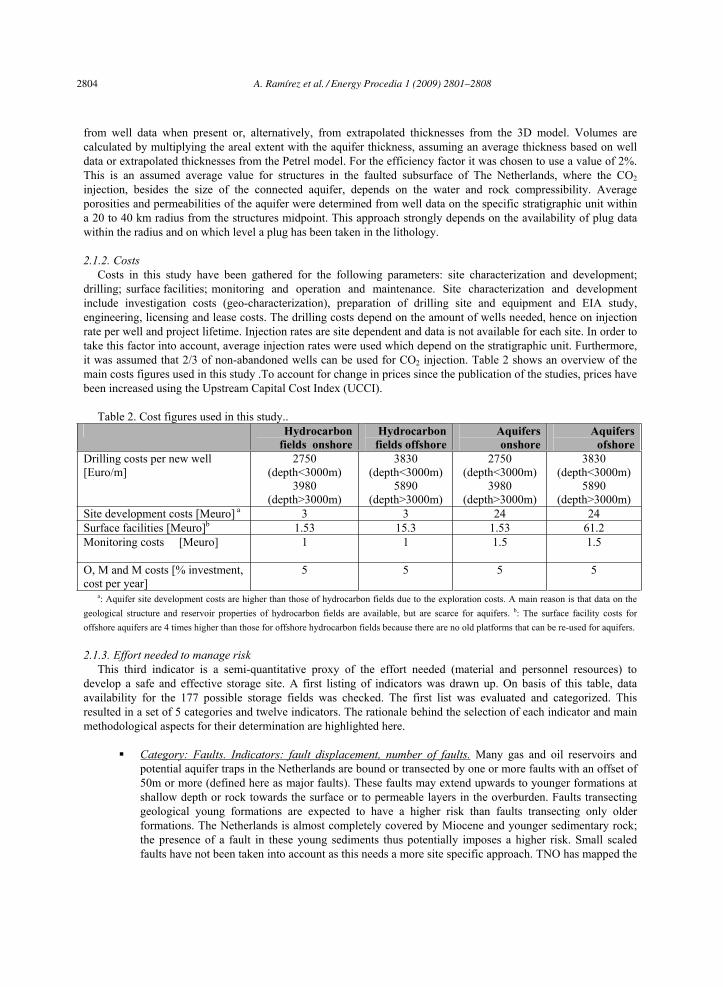
from well data when present or, alternatively, from extrapolated thicknesses from the 3D model. Volumes are calculated by multiplying the areal extent with the aquifer thickness, assuming an average thickness based on well data or extrapolated thicknesses from the Petrel model. For the efficiency factor it was chosen to use a value of 2%. This is an assumed average value for structures in the faulted subsurface of The Netherlands, where the CO2injection, besides the size of the connected aquifer, depends on the water and rock compressibility. Average porosities and permeabilities of the aquifer were determined from well data on the specific stratigraphic unit within a 20 to 40 km radius from the structures midpoint. This approach strongly depends on the availability of plug data within the radius and on which level a plug has been taken in the lithology.
2.1.2. CostsCosts in this study have been gathered for the following parameters: site characterization and development;
drilling; surface facilities; monitoring and operation and maintenance. Site characterization and development include investigation costs (geo-characterization), preparation of drilling site and equipment and EIA study, engineering, licensing and lease costs. The drilling costs depend on the amount of wells needed, hence on injection rate per well and project lifetime. Injection rates are site dependent and data is not available for each site. In order to take this factor into account, average injection rates were used which depend on the stratigraphic unit. Furthermore, it was assumed that 2/3 of non-abandoned wells can be used for CO2 injection. Table 2 shows an overview of the main costs figures used in this study .To account for change in prices since the publication of the studies, prices have been increased using the Upstream Capital Cost Index (UCCI).
Table 2. Cost figures used in this study.. Hydrocarbon
fields onshore Hydrocarbon fields offshore
Aquifers onshore
Aquifers ofshore
Drilling costs per new well [Euro/m]
2750 (depth<3000m)
3980 (depth>3000m)
3830 (depth<3000m)
5890 (depth>3000m)
2750 (depth<3000m)
3980 (depth>3000m)
3830 (depth<3000m)
5890 (depth>3000m)
Site development costs [Meuro] a 3 3 24 24 Surface facilities [Meuro]b 1.53 15.3 1.53 61.2 Monitoring costs [Meuro] 1 1 1.5 1.5
O, M and M costs [% investment, cost per year]
5 5 5 5
a: Aquifer site development costs are higher than those of hydrocarbon fields due to the exploration costs. A main reason is that data on the geological structure and reservoir properties of hydrocarbon fields are available, but are scarce for aquifers. b: The surface facility costs for offshore aquifers are 4 times higher than those for offshore hydrocarbon fields because there are no old platforms that can be re-used for aquifers.
2.1.3. Effort needed to manage risk This third indicator is a semi-quantitative proxy of the effort needed (material and personnel resources) to
develop a safe and effective storage site. A first listing of indicators was drawn up. On basis of this table, data availability for the 177 possible storage fields was checked. The first list was evaluated and categorized. This resulted in a set of 5 categories and twelve indicators. The rationale behind the selection of each indicator and main methodological aspects for their determination are highlighted here.
Category: Faults. Indicators: fault displacement, number of faults. Many gas and oil reservoirs and potential aquifer traps in the Netherlands are bound or transected by one or more faults with an offset of 50m or more (defined here as major faults). These faults may extend upwards to younger formations at shallow depth or rock towards the surface or to permeable layers in the overburden. Faults transecting geological young formations are expected to have a higher risk than faults transecting only older formations. The Netherlands is almost completely covered by Miocene and younger sedimentary rock; the presence of a fault in these young sediments thus potentially imposes a higher risk. Small scaled faults have not been taken into account as this needs a more site specific approach. TNO has mapped the
2804 A. Ramı́rez et al. / Energy Procedia 1 (2009) 2801–2808
Author name / Energy Procedia 00 (2008) 000–000 5
main geological formation and faults of the Netherlands on a regional scale based on 2D and 3D seismic data. For each geological formation fault maps have been compiled. By plotting all fault maps and outlines of hydrocarbon and aquifers on top of each other, fault displacement can be visualized. With this approach it is possible to quantify the number of (major) faults that confine a potential storage site and determine to which formation a fault extends. The number of major faults per storage field is considered therefore an indicator of the effort needed for risk management e.g. characterization, pressure test. It is assumed that a fault truncates against the overlaying formation. A fault may however fade out in a formation or cannot be observed in seismics anymore, in which case the offset of a fault becomes reduced. Extending interpreted faults to the overburden could therefore be an overestimation of the total length of the fault. Category: Seismicity. Indicator: seismicity type: Together with fault maps, well data and exploration maps the Netherlands has been subdivided in stable, slightly unstable and unstable natural tectonic zones (TNO, 2001). Tectonic unstable regions increase the effort needed to manage risk. In case there is evidence of several faults transecting the Pleistoceen, a zone is defined as slightly unstable. A zone with more recent seismic activity is classified as unstable. A zone is stable when seismic activity has not occurred in the Pleistoceen. A similar, but somewhat less detailed approach was performed for this study to take offshore seismics into account. Category: Wells. Indicators: wells drilled before 1967, between 1967 and 1976, and after 1976, well status, well accessibility: Several wells may have been drilled in gas or oil fields for exploration appraisal, water injection or production. Some of these wells are abandoned, others not yet. Degradation of cement plugs or inadequate plugging of abandoned wells may impose a risk of CO2 leakage. Legislation on cementing and plugging of wells was not in place before 1967. Compared to wells drilled after 1967, the degradation risk is assumed to be higher for wells drilled before 1967. The legislation enforced in 1967, was amended in 1976, which again led to higher quality plugs and cementation. In this study, it is assumed that a well drilled for exploration or production should fulfill the regulations defined at that moment. Assuming that the well has not been worked over since, the completion date is used to group the wells according to the periods when legislation changed (1967, 1967-1976 and after 1976). It is considered that the effort in risk management increases when the total number of drilled wells is high, also for the ones that have not been abandoned. To obtain the number of wells before 1967, between 1967 and 1976 and after 1976 that are abandoned and the number of wells that are still in use (wells not abandoned) a compilation had to be made of three different types of data namely: age of the well, well status and depth. Based on the end depth of the sidetrack or its primary well and the top depth of the caprock, each part of the well system was evaluated. Basically, the number of wells entered in the database shows the number of well sections drilled through the caprock and reservoir.
It is necessary to be able to locate and access these wells and work them over if they are thought to impose an unacceptable risk for leakage. The accessibility of wells is determined by plotting the outlines of hydrocarbon fields, well data and topography map of the Netherlands. In general offshore abandoned wells are harder to locate, and therefore more difficult to access, as they are often covered by sediments. Onshore abandoned wells may also be hard to access due to, for instance, buildings in urban areas. In this study offshore wells are regarded as least accessible, onshore urban as intermediate alternative (buildings on top of past well locations) and onshore rural as accessible. Category: Caprock. Indicators: caprock thickness, caprock composition, proven sealing: Gas and oil reservoirs in the Netherlands are mostly trapped by a caprock of at least 10m thick. CO2 can leak through the caprock, for example through fractures. The risk management effort is reduced when the cap rock is thicker. Besides thickness, sealing performance depends on permeability of the rock, which is related to its composition. In the database a caprock is classified as salt, shale2, claystone, anhydrite and marl. The risk management effort decreases when the composition of the seal contains on average rocks
2 It is necessary to emphasize on the definition of shale used in this database. In the petroleum industry shale is defined as a rock member that is composed of sandy, silt and clay (sandy or silty clay). In geology shale is a fine-grained sedimentary rock whose original constituents were clay minerals or muds and has hardened due to (heavy) compaction. By this latter definition shale is considered to have better sealing properties as claystone, which is less compacted.
A. Ramı́rez et al. / Energy Procedia 1 (2009) 2801–2808 2805

6 Ramirez et al./ Energy Procedia 00 (2008) 000–000
which are more impermeable. Sandstone, siltstone, carbonate/limestone and dolomite are not regarded as a seal at all. Due to the regional scale inventory in this study, homogeneity of the rocks cannot be proven explicitly. The indicator proven sealing is based on the type of storage location and the evidence of having trapped a gas or fluid before. The following classification has been used: Field evidence of gas; Field evidence of oil; No field evidence. Former gas fields have proven that these structures can sufficiently trap gas. Oil fields on the other hand have proven to trap a viscous fluid, but not necessarily gas, which increases the risk management effort. Finally, structures that do not contain any hydrocarbon have no proof that it can trap CO2. This is applicable for aquifers. Category: Reservoir depth. Indicator: reservoir depth: Reservoir depth, in meters, from the top of the reservoir to the surface (overburden thickness) is considered an indicator of the presence of secondary seals above the storage reservoir. A typical overburden in the Netherlands consists of an alteration of aquifers and aquitards. Aquitards could serve as a secondary seal. The overburden may reduce the risk when unexpected leakage through the top seal or a fault occurs. Impermeable rock in the overburden may block or slow down the upward migration of CO2. When CO2 is sufficiently slowed down by impermeable layers in the overburden, mineral or solubility trapping may lower CO2 leakage to the surface.
2.1.4. Development of the screening tool In order to develop a relative ranking of storage options, it is necessary to aggregate and score the values
provided by the different criteria and indicators. The output for the criteria storage capacity and costs per storage field will consist of two values expressed in Mt and Euro/tCO2 respectively. The criteria potential storage capacity and costs are a matter of calculating the results using quantitative data. Ranking the options according to storage capacity or costs is therefore relatively straightforward. The criterion effort needed to manage risk, on the other hand, is made up of qualitative and quantitative indicators. Each indicator is divided into categories. The categories can be set in quantitative terms (e.g. categories for tectonic seismic risk are >7, 6-7, 4-6, 2-4, <2) or in qualitative terms (e.g. categories for the primary seal composition are Carbonate, Anhydrite, Clay, Shale, Halite). To obtain a ranking of the reservoirs it is necessary to translate the categories into scores. These scores reflect the relative importance of the categories within a given indicator. In a second step the scores of the different indicators can be summed up into a unique value. To do so, it is necessary to assign weights that reflect the relative importance of the different indicators in terms of risk management. A second consultation with a (inter)national panel of 8 experts was performed to obtain the scoring and weighing values. The consultation made use of a spreadsheet tool containing 3 types of entries: scoring categories, evaluating the knowledge base and providing weights for the indicators. As an example Figure 2 shows how data was gathered in the first entry type. The input generated in the tool is then used to calculate an average score per site. The basic calculation is a simple linear aggregation using the scores and weights between categories and indicators. The resulting scores per site from the assessment are representative for the relative scoring without indicating an absolute site performance.
3. First Results
Figures 3 shows a frequency distribution of the results provided by the tool for each criterion. The total potential capacity of CO2 storage in the Netherlands is currently being calculated at 3.2Gt (the Slochteren field which has a potential of around 7Gt is not included since it is not expected to be available for CO2 storage before 2060). As figure 3, around 50% of the capacity is found in relatively small fields. Figure 3 also show the distribution of scores for the effort needed to manage risk (note that in the scale of 1 to 100, 1 would need the most effort and 100 the least). Only a few fields score relatively low with most fields being in a category that could be considered intermediate (e.g. between 65 and 80). Aquifers fields have in average scores below 65. This is not surprising since there is not proven sealing capacity and detailed information on those are missing. The low scores therefore will support the precautionary principle. Furthermore, since complete new information need to be gathered for these fields before their use and there are not platforms or well that can be reuse, their cost (per tonne of CO2 store) are quite high (compared to oil and gas fields). In fact in Figure 3C, aquifers are located at the right tail of the distribution.
2806 A. Ramı́rez et al. / Energy Procedia 1 (2009) 2801–2808

Author name / Energy Procedia 00 (2008) 000–000 7
Figure 2. Example of the spreadsheet used in the consultation to experts to gather scoring values
CO2 storage capacities in the Netherlands
Capacity [Mt]
0 20 40 60 80 100 120 140 160
Freq
uenc
y
0
20
40
60
80
100
120
Scores per field for the category effort needed to manage risk
Average Scores (scale 1 to 100)
30 40 50 60 70 80 90
Freq
uenc
y
0
10
20
30
40
50
CO2 storage costs
0
10
20
30
40
50
60
70
3 5 10 20 40 80 160 More
Costs [Euro/t CO2]
Freq
uenc
y
Figure 3. Distribution of the results obtainedby the screening tool in 3 categories: storage capacity,effort needed to manage risk and costs.
A. Ramı́rez et al. / Energy Procedia 1 (2009) 2801–2808 2807

8 Ramirez et al./ Energy Procedia 00 (2008) 000–000
If all fields with lower scores were to be excluded from the system, the storage capacity of the Netherlands would decrease by about 20%. This percentage may be significant if it influences the availability of CO2 storage, especially at the beginning of the deployment period.
The results provide here are just preliminary and at the moment research is being carried out in order to: Spatial distribution of the scores and fields for each category. Furthermore we are in the process of getting additional GIS data on modelling work related with the spatial development of land use in the Netherlands for the next 40 years which could allow us to point out possible tensions between the best options for CO2 storage (from the pre-screening tool) and use of land above ground. Sensitivity analysis regarding the individual scores provided by the panel of international experts. Analysis of current uncertainties in the knowledge base and the impact of such uncertainties on the results. To systematically assess strengths and weakness in the knowledge base, a pedigree assessment will be carried out. Criteria used in this study to assess the knowledge base are proxy (how good or close a measure of the quantity which is actually measures is to the quantity about which we seek information), empirical basis (refers to the degree to which direct measurements are used to estimate the variable), methodological rigor (refers to the norms methodological rigor in the process applied by peers in the relevant discipline) and degree of validation (this metrics refers to the degree to which ones has been able to cross-check data against independent sources). This information was already gathered as part of the two consultation rounds with experts and it is being processed.
The results will further be used in related research which investigates how different development strategies of a CO2 infrastructure could look like, by matching sources and sinks and by analyzing different scenarios of CO2emissions in a GIS based interface; thus placing the results in the context of the full CCS chain and climate change abatement. An example of this is shown under the work of van den Broek et al, 2008n (proceedings of this conference).
4. Conclusion
The results of this project provide a screening of storage sites at the national level that can be used by Dutch decision makers such as power generators and policy makers to understand the potential for CO2 storage in the Netherlands and help to steer CCS implementation.
5. References
Bachu, S. (2002) Sequestration of CO2 in Geological Media in Response to Climate Change: Roadmap for Site Selection Using the Transform of the Geological Space into the CO2- Phase Space. Energy Conversion and Management, 43(1): 87-102
Intergovernmental Panel on Climate Change (IPPC) (2005) Special Report on Carbon Dioxide Capture and Storage, Chapter 5 Underground Geological Storage Edited by Benson, S. and Cook, P.
Meyer R., May F., Muller C, Geel K, Bernstone C. Regional research, selection and geological characterization of a large anticlinat structure, as a candidate site for CO2 storage in northern Germany. Environmental Geology, 2006.
Oldenburg, C.M. (2005) HSE screening and ranking framework for geological CO2 storage site selection Lawrence Berkeley National Laboratory, Paper LBNL-58873
Van Egmond B. (2006) Developing a method to screen and rank geological CO2 storage sites on the risk of leakage. NWS-E-2006-108, Utrecht University and TNO.
Walton, F.B., Tait, J.C., LeNeveu, D., Sheppard, M.I. (2004) Geological storage of CO2: A statistical approach to assessing performance and riskIn: Rubin, E.S., Keith, D.W., Gilboy, C.F., editors Seventh International Conference on Greenhouse Gas Control Technologies, Cheltenham, UK
Wildenborg, A.F.B., Leijnse, A.L, Kreft, E., et al. (2003) CO2 Capture Project - An Integrated, Collaborative Technology Development Project for Next Generation CO2 Separation, Capture and Geologic Sequestration Safety Assessment Methodology for CO2 Sequestration (SAMCARDS) TNO-NITG, Report nr. 2.1.1, Utrecht
2808 A. Ramı́rez et al. / Energy Procedia 1 (2009) 2801–2808