Embed Size (px)
Citation preview
Lachlan LakeVictor Sadras
Screening chickpea for adaptation to water stress: Associations
between yield and crop growth rate
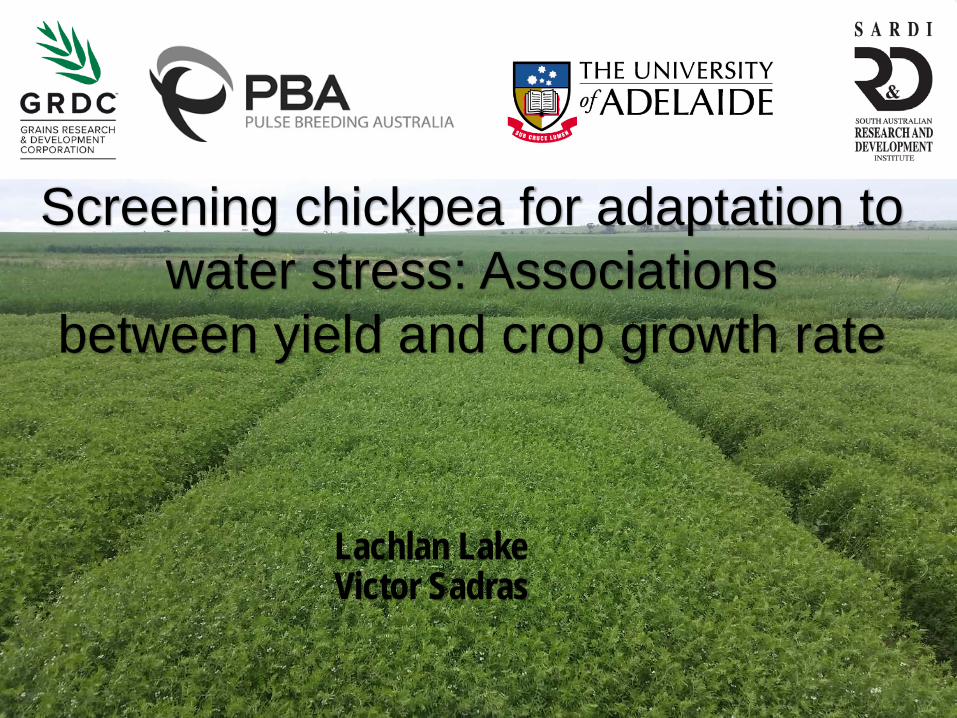
Adaptation strategies
• Selection directly for yield – low heritability
• Select for a secondary adaptive trait associated with
improved yield
• Crop growth rate (CGR) within specific windows has been
shown to be associated with yield in• maize
• wheat
• canola
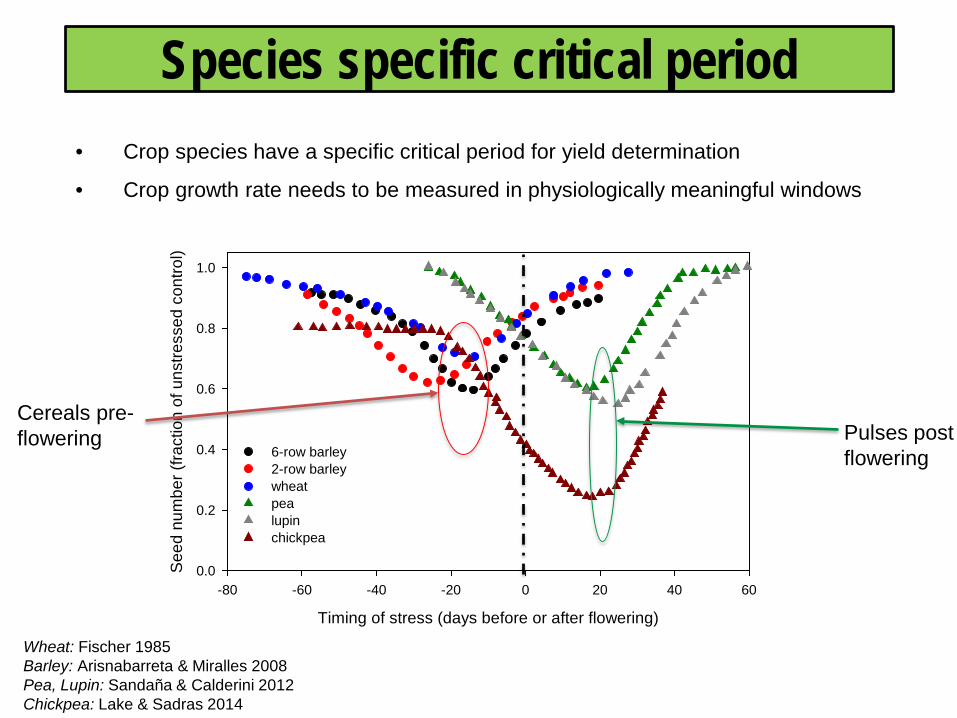
Wheat: Fischer 1985Barley: Arisnabarreta & Miralles 2008Pea, Lupin: Sandaña & Calderini 2012Chickpea: Lake & Sadras 2014
Species specific critical period
Timing of stress (days before or after flowering)
-80 -60 -40 -20 0 20 40 60
See
d nu
mbe
r (fra
ctio
n of
uns
tress
ed c
ontro
l)
0.0
0.2
0.4
0.6
0.8
1.0
6-row barley2-row barleywheatpealupinchickpea
• Crop species have a specific critical period for yield determination
• Crop growth rate needs to be measured in physiologically meaningful windows
Cereals pre-flowering Pulses post
flowering
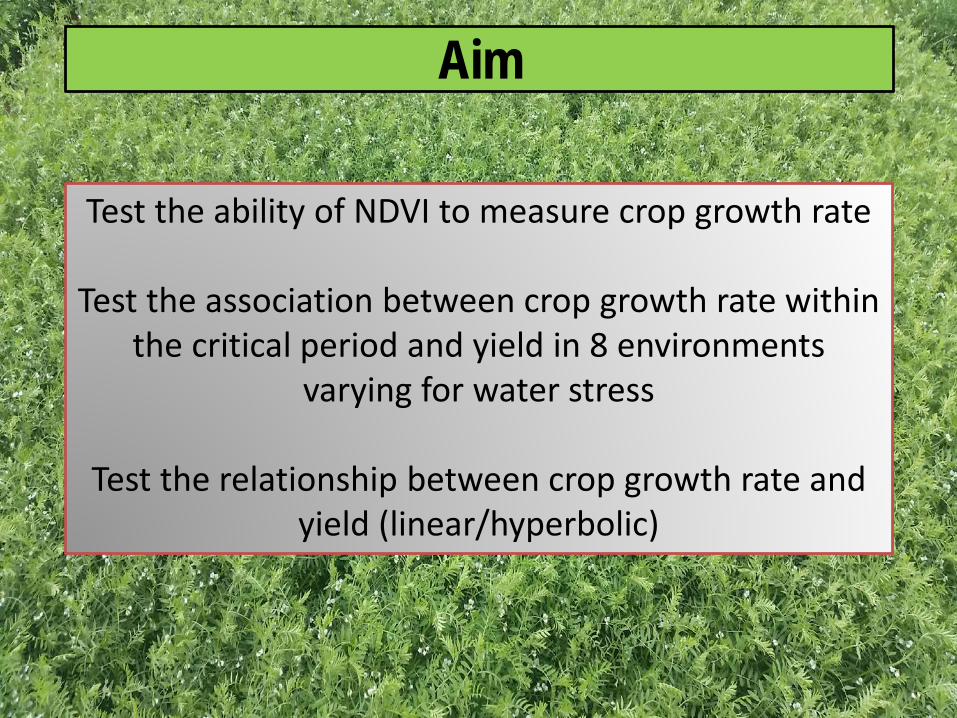
Test the ability of NDVI to measure crop growth rate
Test the association between crop growth rate within the critical period and yield in 8 environments
varying for water stress
Test the relationship between crop growth rate and yield (linear/hyperbolic)
Aim
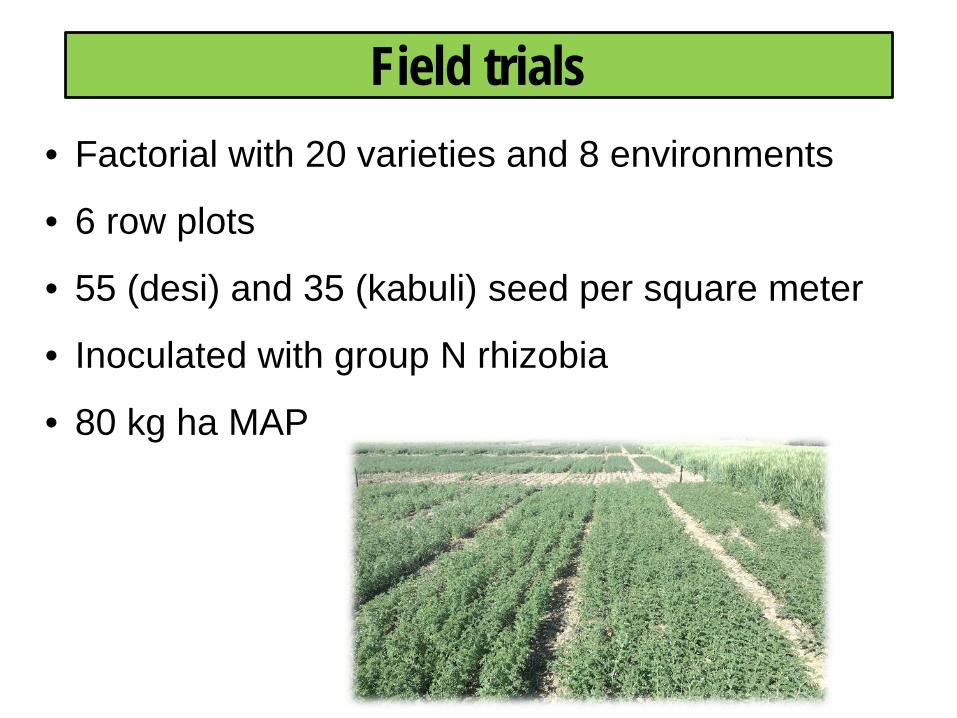
Field trials• Factorial with 20 varieties and 8 environments
• 6 row plots
• 55 (desi) and 35 (kabuli) seed per square meter
• Inoculated with group N rhizobia
• 80 kg ha MAP
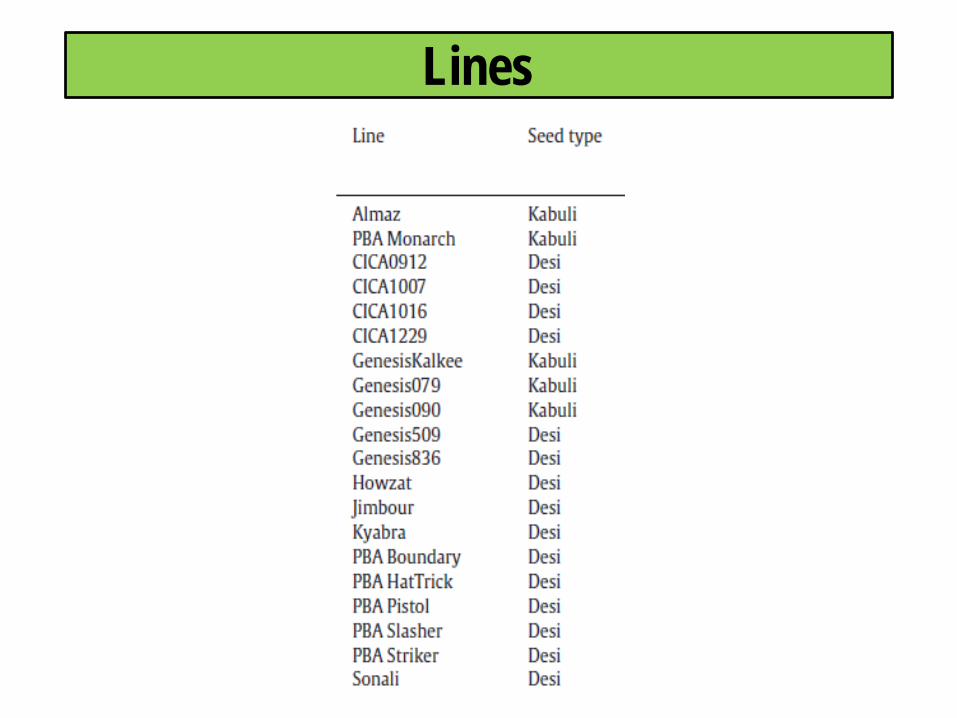
Lines
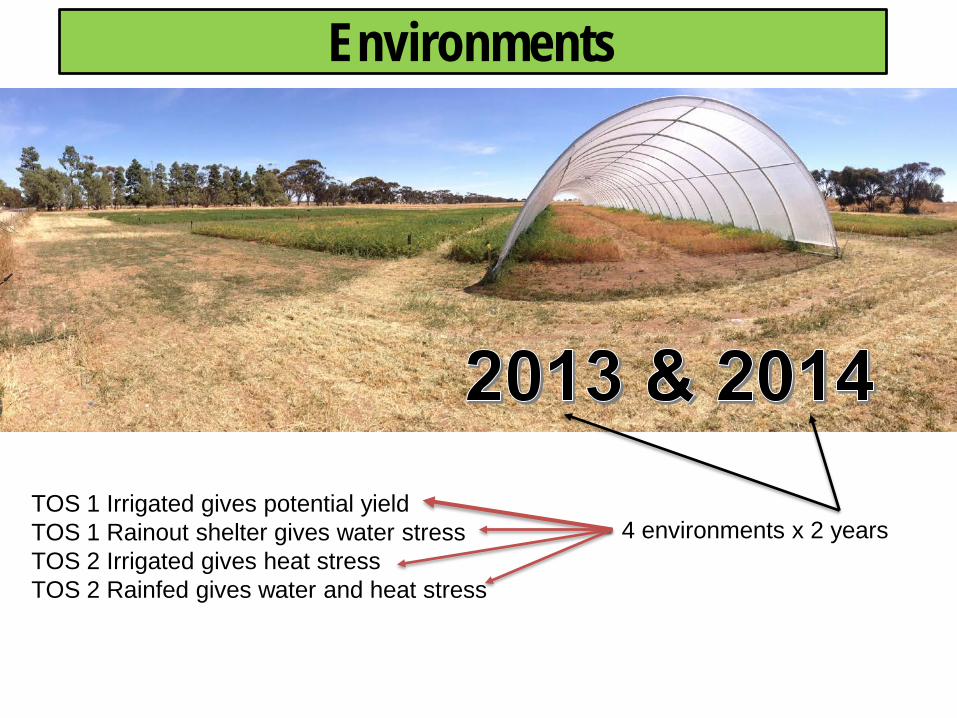
Environments
TOS 1 Irrigated gives potential yieldTOS 1 Rainout shelter gives water stressTOS 2 Irrigated gives heat stressTOS 2 Rainfed gives water and heat stress
4 environments x 2 years
0
0.2
0.4
0.6
0.8
600 800 1000 1200 1400 1600 1800
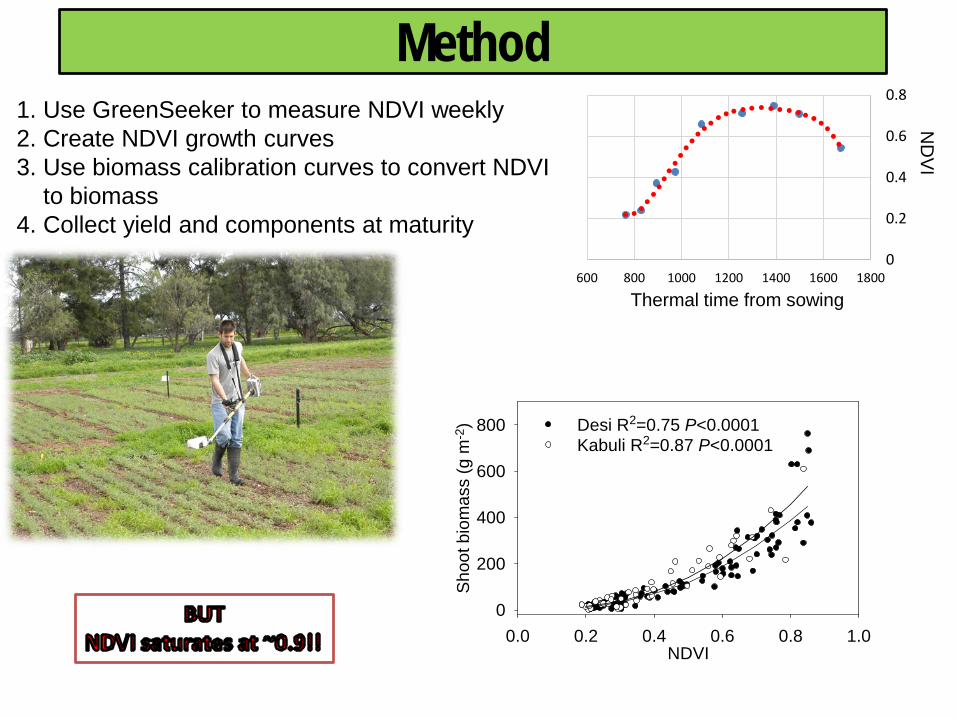
Method1. Use GreenSeeker to measure NDVI weekly2. Create NDVI growth curves3. Use biomass calibration curves to convert NDVI
to biomass4. Collect yield and components at maturity
NDVI0.0 0.2 0.4 0.6 0.8 1.0
Sho
ot b
iom
ass
(g m
-2)
0
200
400
600
800 Desi R2=0.75 P<0.0001Kabuli R2=0.87 P<0.0001
Thermal time from sowing
ND
VI
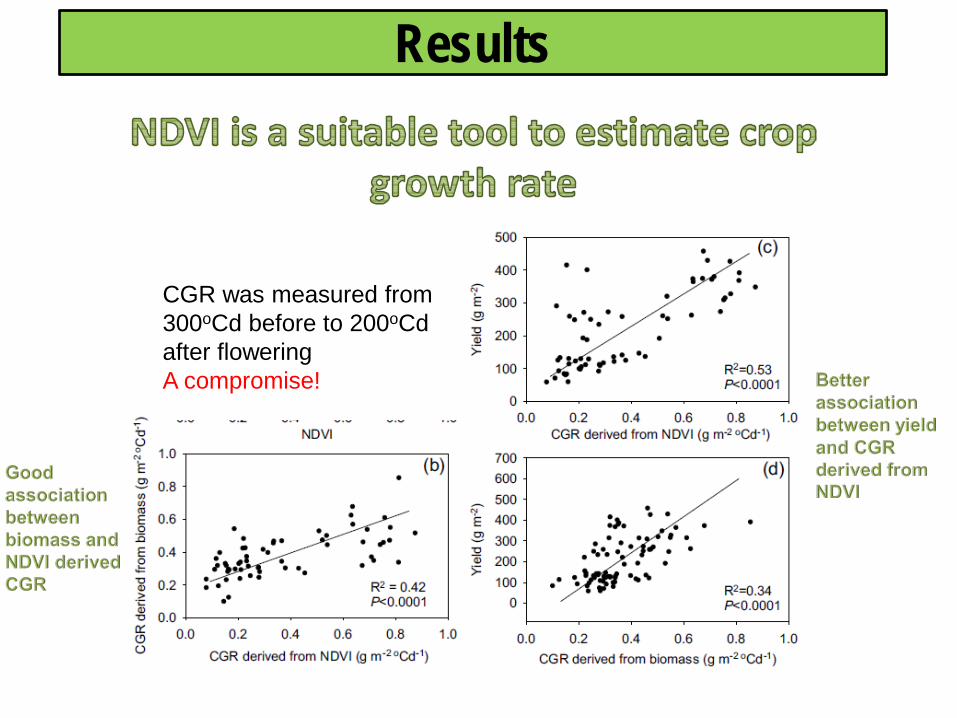
Results
CGR was measured from 300oCd before to 200oCd after floweringA compromise!
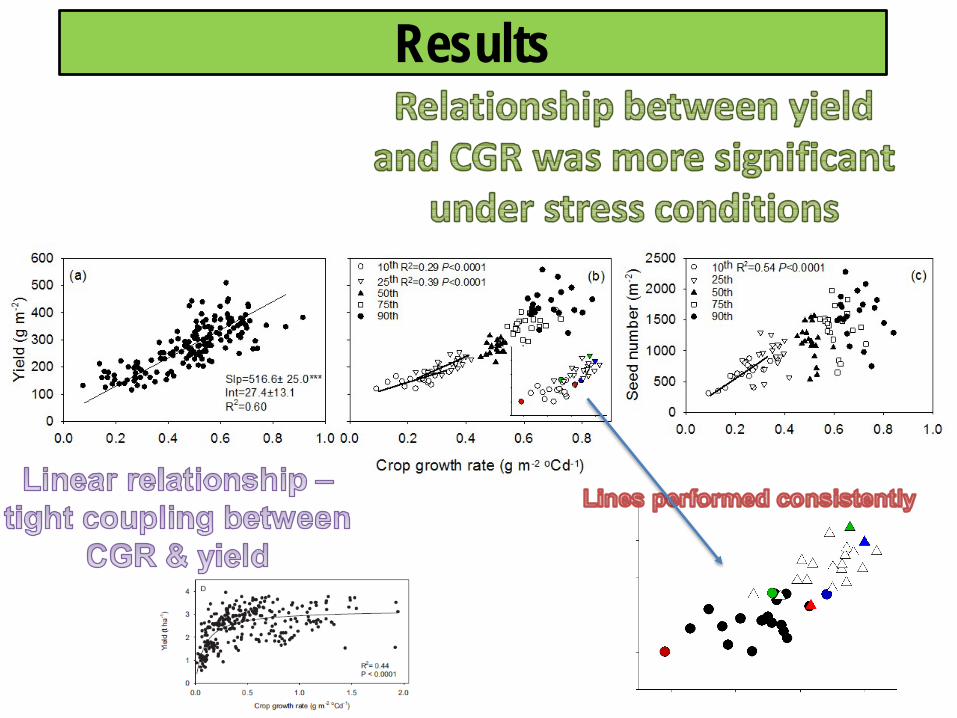
Results
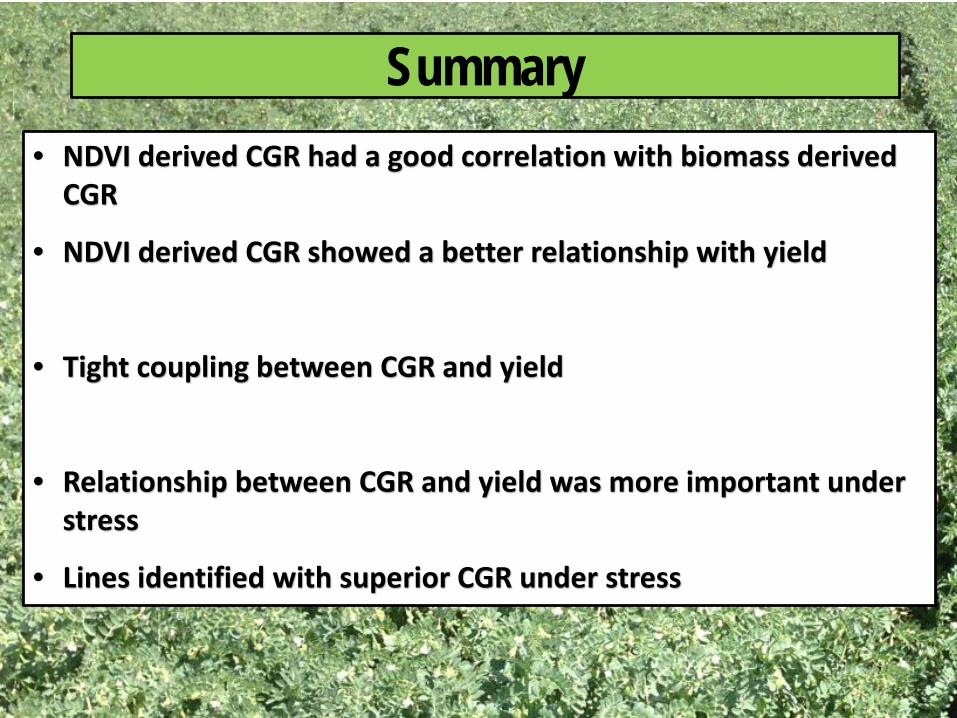
Summary• NDVI derived CGR had a good correlation with biomass derived
CGR
• NDVI derived CGR showed a better relationship with yield
• Tight coupling between CGR and yield
• Relationship between CGR and yield was more important under stress
• Lines identified with superior CGR under stress
Next Step
MOLECULAR MARKERS for CROP GROWTH RATE
Acknowledgements
Dr. Kristy Hobson (NSW DPI)
Dr. Jeff Paull (University of Adelaide)
SARDI - Clare team
Arisnabarreta, S., Miralles, D.J., 2008. Critical period for grain number establishment of near isogenic lines of two- and six-rowed barley. Field Crops Research 107, 196-202.
Fischer, R.A., 1985. Number of kernels in wheat crops and the influence of solar radiation and temperature. Journal of Agricultural Science, UK 105, 447-461.
Lake, L., Sadras, V.O., 2016. Screening chickpea for adaptation to water stress: Associations between yield and crop growth rate. European Journal of Agronomy 81, 86-91.
Lake, L. and V. O. Sadras (2014). "The critical period for yield determination in chickpea (Cicer arietinum L.)." Field Crops Research 168: 1-7.
Sandaña, P., Calderini, D.F., 2012. Comparative assessment of the critical period for grain yield determination of narrow-leafed lupin and pea. European Journal of Agronomy 40, 94-101.
SADRAS, V. O., LAKE, L., LEONFORTE, A., MCMURRAY, L. S. & PAULL, J. G. 2013. Screening field pea for adaptation to water and heat stress: Associations between yield, crop growth rate and seed abortion. Field Crops Research, 150, 63-73.
References