Embed Size (px)
Citation preview
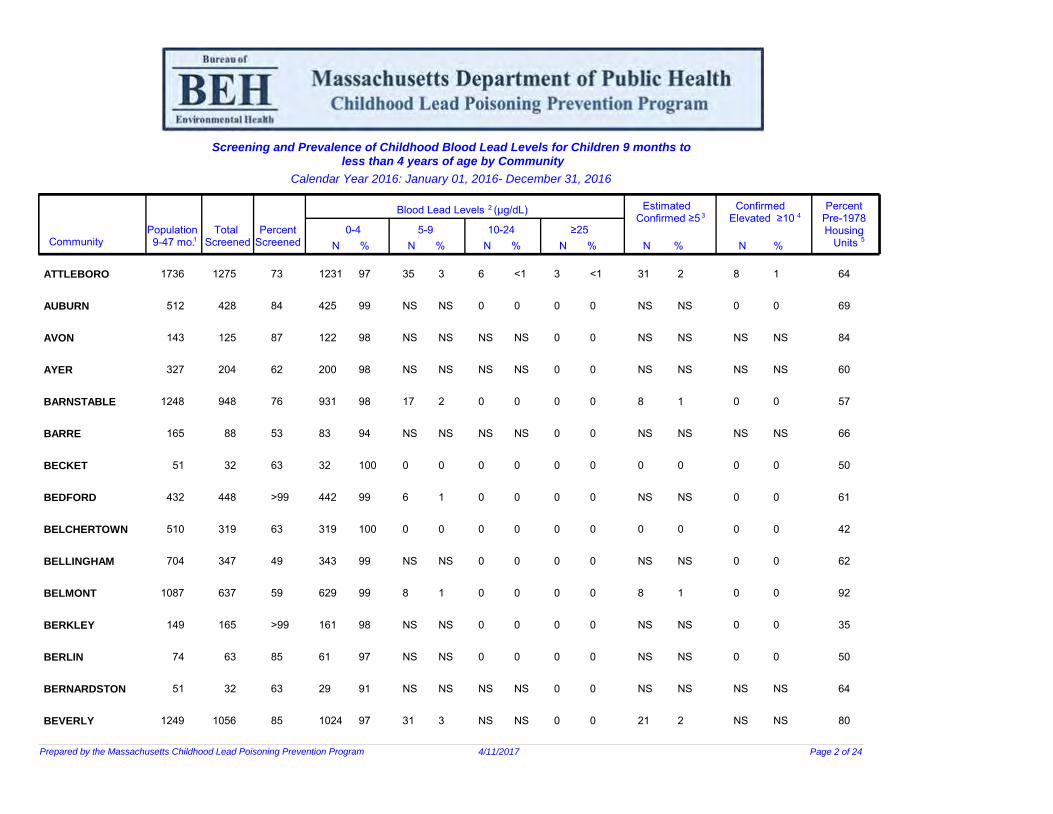
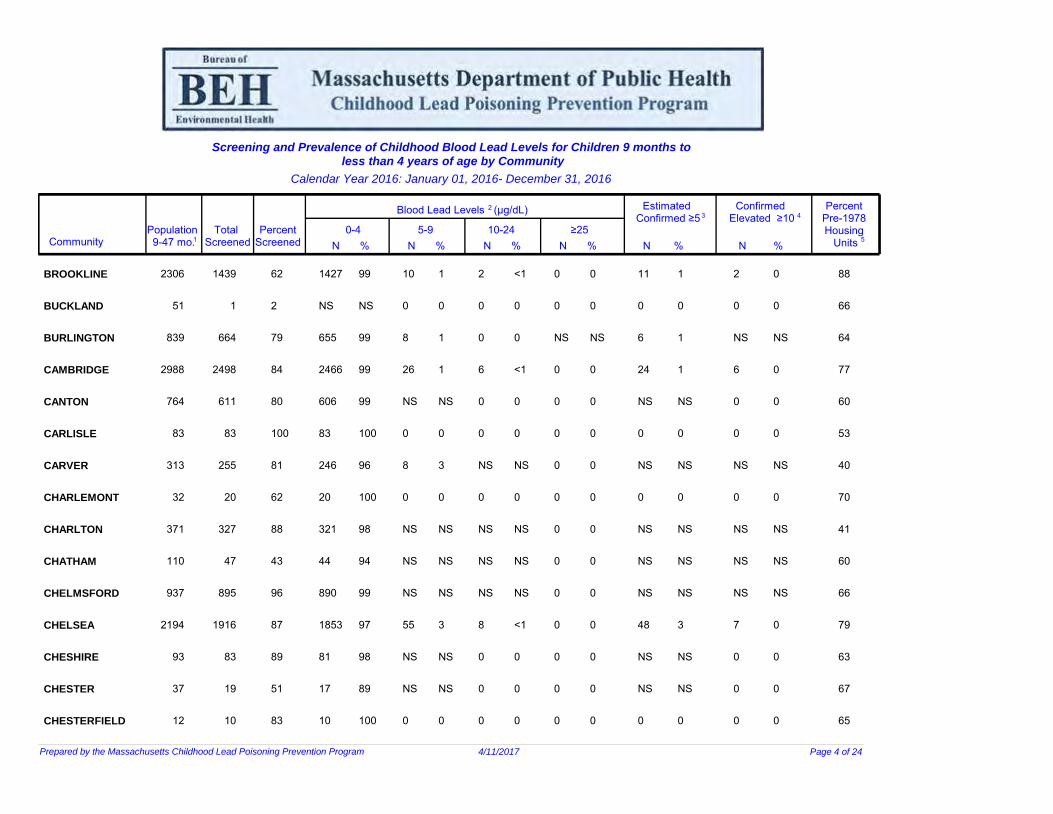
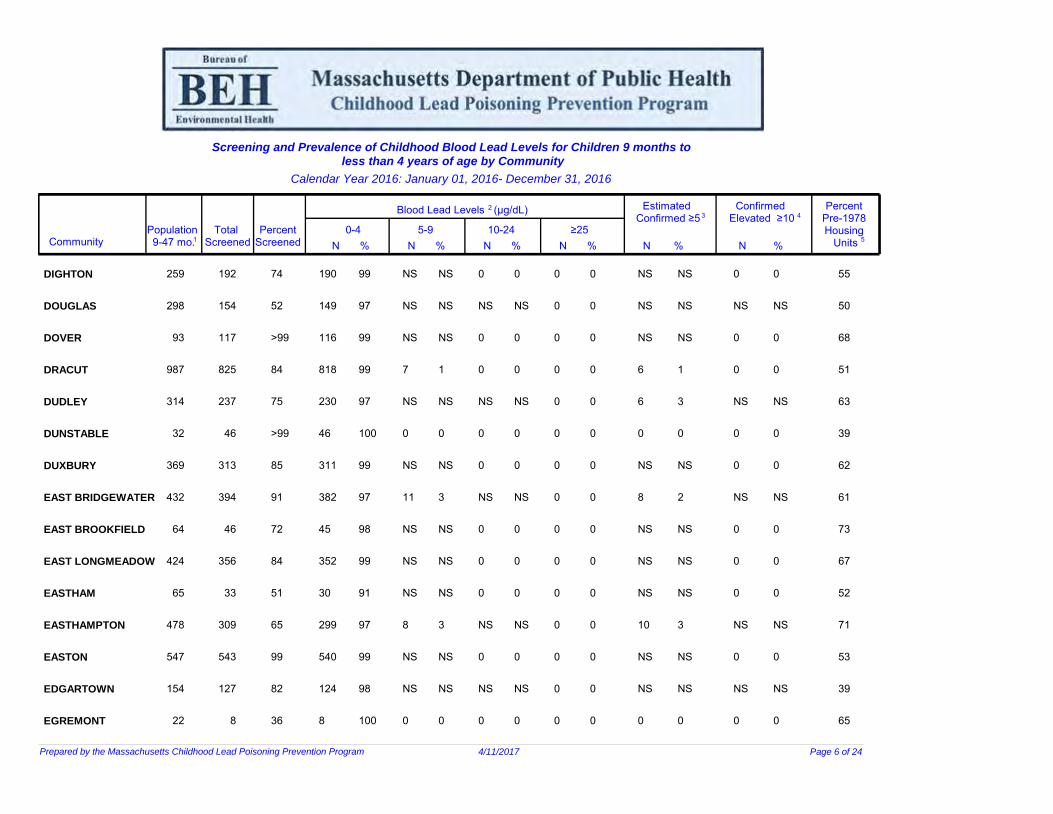
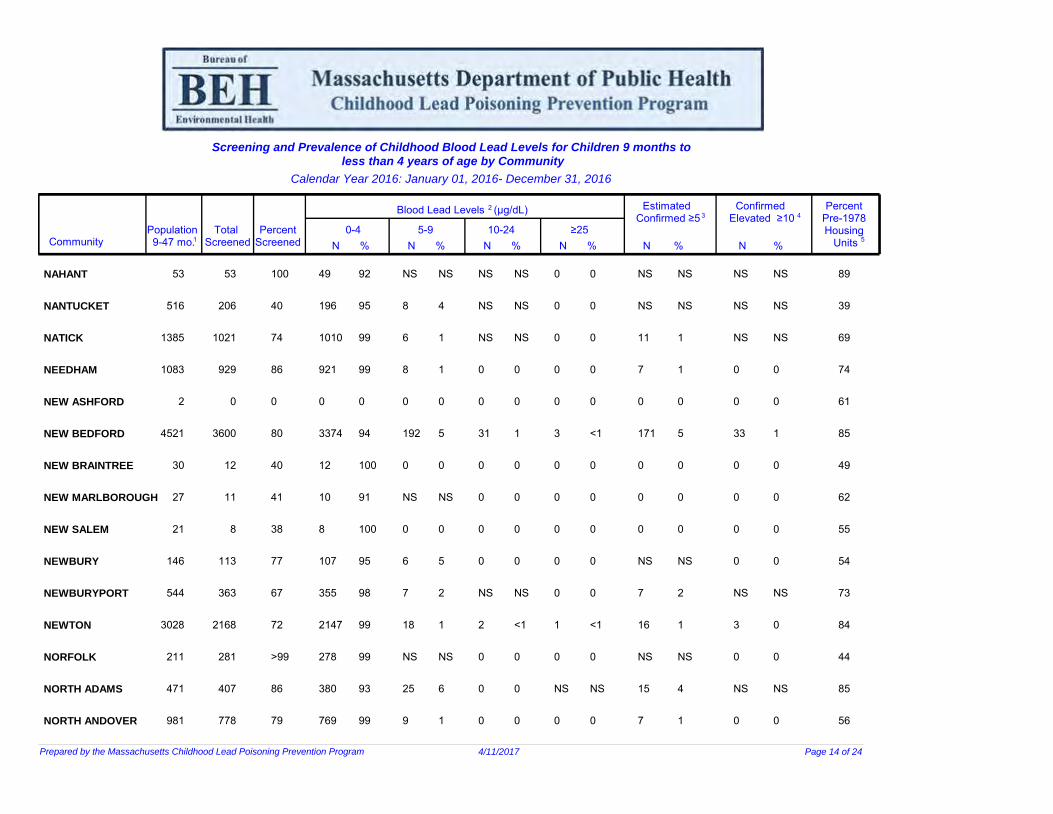
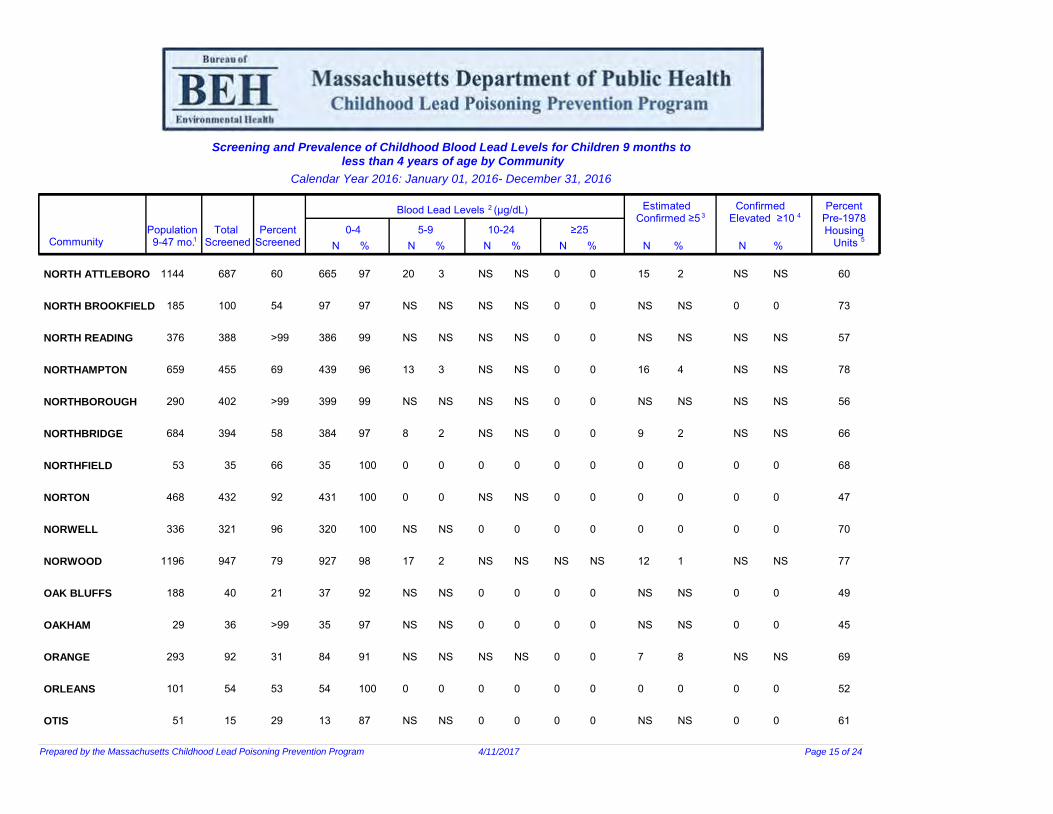
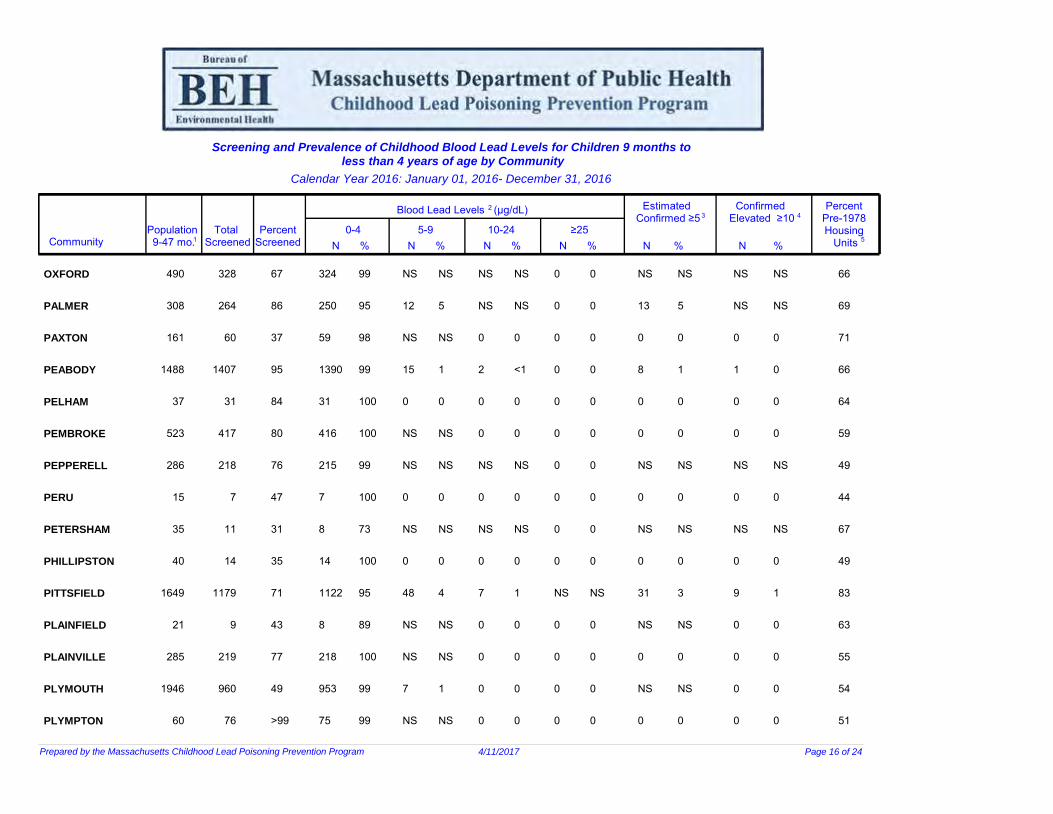
Screening and Prevalence Statistics 2016 Calendar Year Data
Massachusetts lead regulation (105 CMR 460.050) requires that all children be tested for blood lead between the ages of 9 and 12 months, and again at ages 2 and 3. Additionally, all children should be tested at age 4 if they live in a high risk community in Massachusetts. The following table presents childhood lead screening percentages, prevalence by blood lead levels, and prevalence for confirmed and unconfirmed elevated blood lead levels. This information is relevant to assessing the need for treatment and prevention services at the community level in Massachusetts.
DATA DESCRIPTION
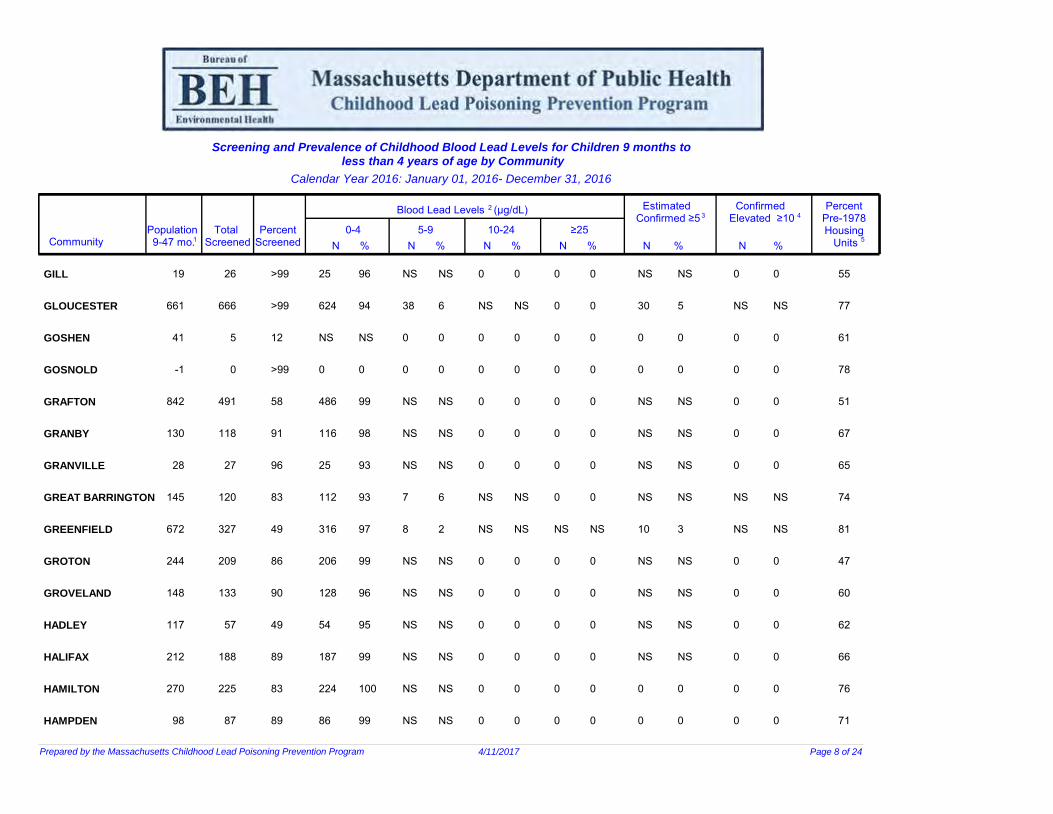
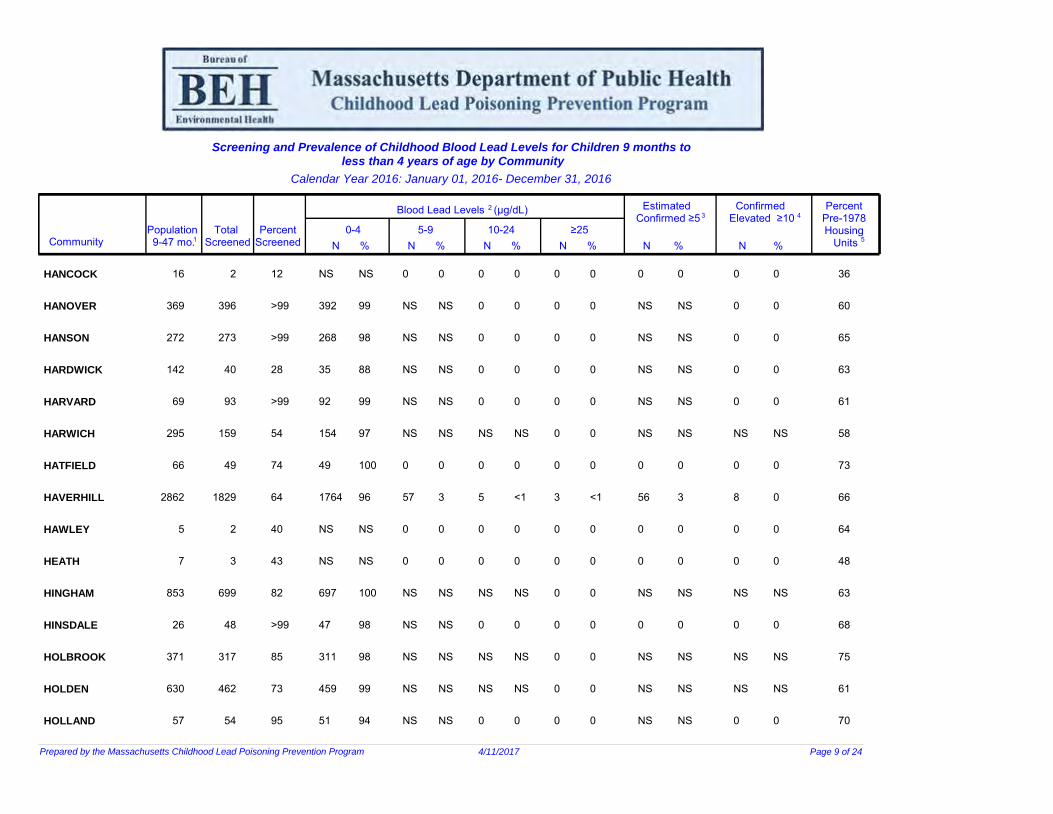
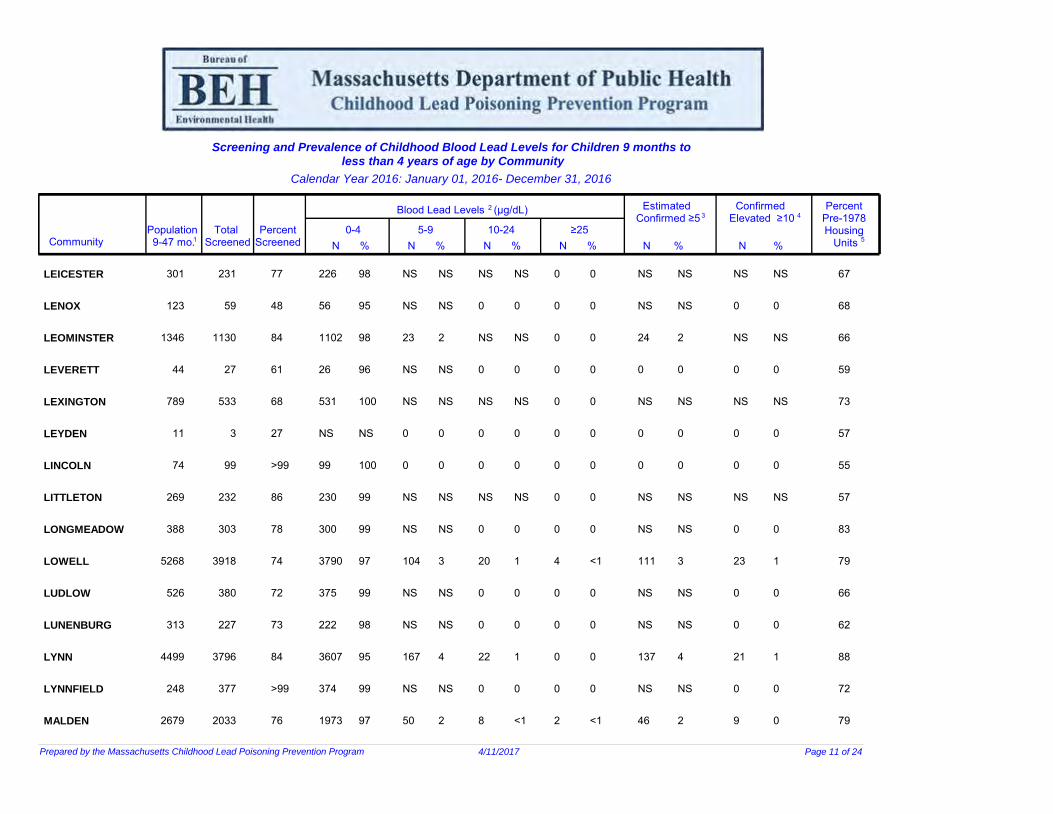
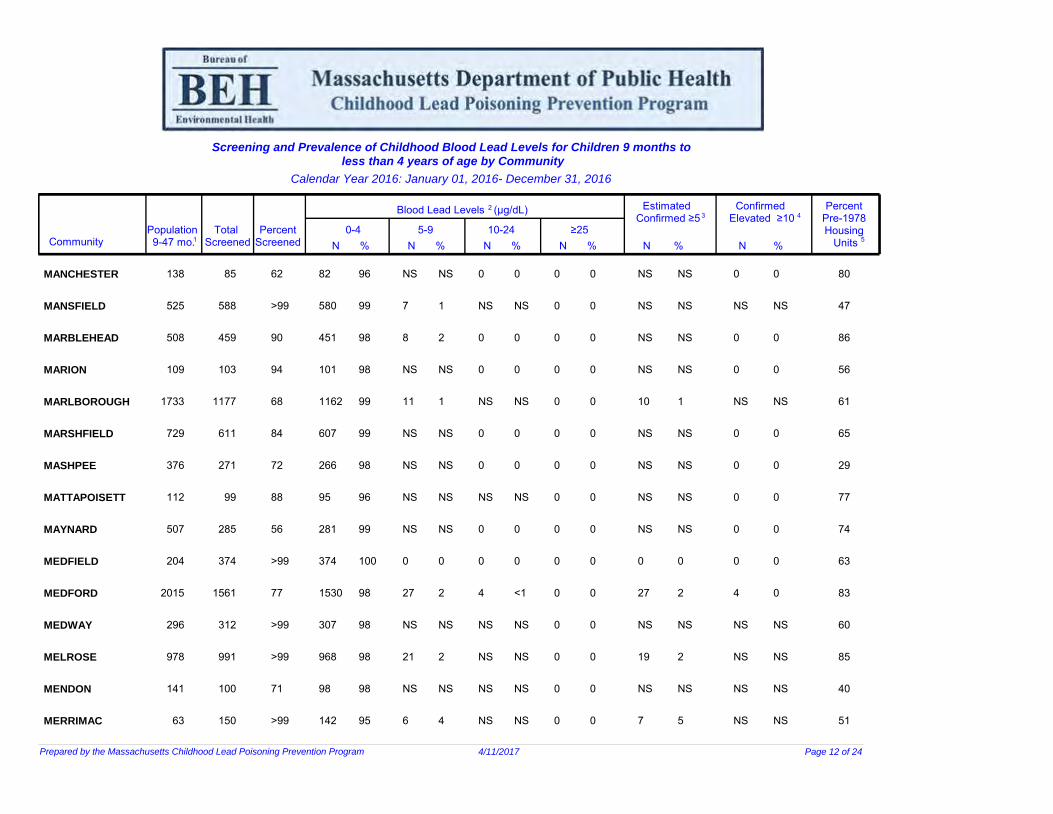
COMMUNITY: Cities and towns in Massachusetts listed alphabetically. POPULATION (9-47 MONTHS): The US Census Bureau 2016 estimate for the number of children 9 to 47 months of age. TOTAL SCREENED (9-47 MONTHS): The total number of children 9 to 47 months of age screened for lead poisoning in the given calendar year. PERCENT SCREENED: The percentage of children 9 to 47 months of age who were screened for lead poisoning in the given calendar year. This is calculated by dividing the total number of children screened by the underlying population in the geographic area based on the US Census Bureau 2016 estimate. µg/dL: micrograms per deciliter, the unit of measurement for blood lead specimens. BLOOD LEAD LEVELS: Number and percentage of children within each blood lead level category, out of all children screened 9 to 47 months of age. Only one blood lead specimen is counted per child. If a child has had more than one blood lead specimen within the designated time period, then the highest specimen is counted, with venous specimens taking priority, followed by confirmed capillary specimens and, finally, unconfirmed capillary specimens when no confirmed specimens are available. The blood lead categories include both confirmed and unconfirmed blood lead specimens. A confirmed blood lead specimen is either a single venous blood lead specimen of any value, or the higher of two capillary blood lead specimens ≥10 µg/dL drawn within 12 weeks of each other. A single capillary blood lead specimen of any value is considered unconfirmed. The Massachusetts Childhood Lead Poisoning Prevention Program (CLPPP) recommends but does not require confirmation of capillary blood lead specimens below 10 µg/dL. Due to this, capillary blood lead specimens between 5 and 9 µg/dL are usually unconfirmed. Unconfirmed capillary blood lead specimens ≥10 µg/dL are rare but may exist because of a failure to re-test.
In 2012, the CDC updated its guidelines on blood lead levels in children. The earlier 10 µg/dL level of concern was replaced with a reference level of 5 µg/dL. Due to these changes, blood lead levels below 10 µg/dL are now included in Department of Public Health data tables. The blood lead levels are organized into four categories: 0-4 µg/dL, 5-9 µg/dL, 10-24 µg/dL, and ≥25 µg/dL. For each category, the number (N) and percentage (%) of screened children whose highest blood lead specimen fell within the category is shown. Blood lead levels in the 10-24 µg/dL category are considered elevated and blood lead levels ≥25 µg/dL signify lead poisoning. For more information regarding the new guidelines, please visit the CDC’s information page on blood lead levels here.
ESTIMATED CONFIRMED ≥5: Capillary blood tests can be a usefuier to conduct than venous tests, esdoes not provide adequate precisiolevated blood lead level. Only about truly ≥5 µg/dL upon retest. Until co
l tool for preliminary lead screening because they are eas pecially on children. However, a single capillary test n or reliability to be considered confirmatory of an e 1/3 of capillary results in the 5-9 µg/dL range are found to be nfirmatory testing of preliminary capillary results 5-9 µg/dL becomes standard practice in Massachusetts, as recommended by MA CLPPP, a calculation is employed to estimate the true number of children with blood lead levels ≥5 µg/dL. The number of children with estimated confirmed ≥5 µg/dL blood lead levels is calculated as the sum of those with confirmed blood lead levels ≥5 µg/dL and a proportion of those having unconfirmed blood lead levels ≥5 µg/dL. The proportion of unconfirmed blood lead levels ≥5 µg/dL estimated to be truly elevated is based on the annual statewide proportion of capillary results in the 5-9 µg/dL range found to be truly ≥5 µg/dL upon retest (positive predictive value).
CONFIRMED ELEVATED ≥10: The Childhood Lead Poisoning Prevention Program defines an elevated blood lead level to be ≥10 µg/dL. This data shows the number (N) and percentage (%) of children nine to 47 months of age with a confirmed blood lead specimen ≥10 µg/dL. While not presented in the table, the number of unconfirmed elevated ≥10 µg/dL can be calculated by summing the 10-24 and ≥25 µg/dL blood lead level categories and then subtracting the number of confirmed elevated ≥10 µg/dL.
PERCENT PRE-1978 HOUSING UNITS: An estimate of the percentage of all housing units built prior to 1978, according to the 2011-2015 American Community Survey. In 1977, the Consumer Product Safety Commission banned lead-containing paint (16 C.F.R. 1303). Housing units built prior to this date may contain dangerous levels of lead in paint. According to Massachusetts regulations (105 CMR 460.000), removal or covering of lead hazards is required in units built before 1978 where a child under six years of age is living. This is a change from earlier high risk community incidence rate statistics (data prior to 2009-2013), which used the percentage of all housing units built prior to 1950.

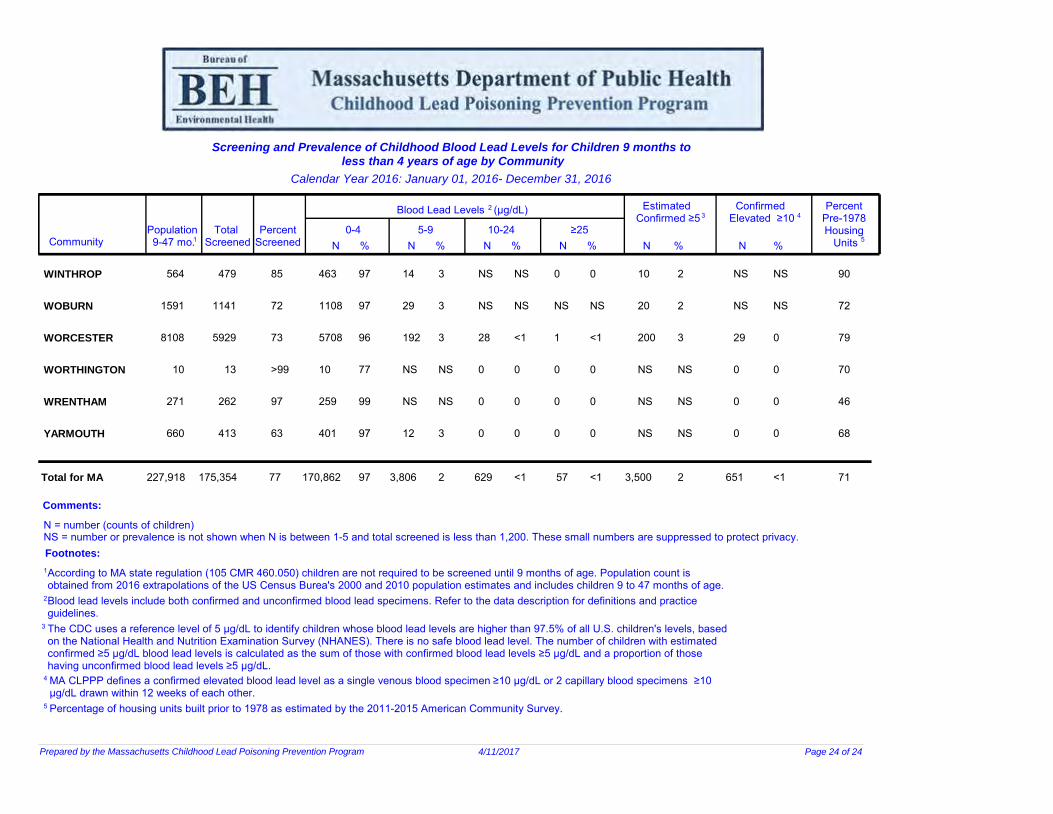
Screening and Prevalence of Childhood Blood Lead Levels for Children 9 months to less than 4 years of age by Community
Calendar Year 2016: January 01, 2016- December 31, 2016
Community
Percent Pre-1978 Housing
Units 5
67
61
65
92
68
52
68
64
68
89
60
68
63
43
77
ABINGTON 600 483 80
ACTON 597 450 75
ACUSHNET 275 234 85
ADAMS 223 216 97
AGAWAM 790 639 81
ALFORD 6 3 50
AMESBURY
AMHERST
ANDOVER
ARLINGTON
ASHBURNHAM
ASHBY
ASHFIELD
ASHLAND
ATHOL
592
491
922
1927
208
92
35
774
433
389
315
756
1470
108
52
16
555
163
66
64
82
76
52
57
46
72
38
Population9-47 mo.1
TotalScreened
PercentcreenedS
Blood Lead Levels 2 (µg/dL)
0-4 N %
5-9 N %
10-24N %
Estimated Confirmed ≥5 3
% ≥25
N %
474
443
233
194
629
NS
368
313
750
1451
104
51
13
549
157
98
98
100
90
98
NS
95
99
99
99
96
98
81
99
96
8
NS
NS
21
8
0
20
NS
NS
18
NS
NS
NS
NS
NS
2
NS
NS
10
1
0
5
NS
NS
1
NS
NS
NS
NS
NS
NS
NS
0
NS
NS
0
NS
0
NS
1
0
0
0
NS
NS
NS
NS
0
NS
NS
0
NS
0
NS
<1
0
0
0
NS
NS
0
NS
0
0
0
0
0
0
0
0
0
0
0
0
0
0
NS
0
0
0
0
0
0
0
0
0
0
0
0
0
N
6
7
0
11
8
0
15
NS
NS
13
NS
NS
NS
6
6
1
2
0
5
1
0
4
NS
NS
1
NS
NS
NS
1
4
Confirmed Elevated ≥10 4
N
NS
NS
0
NS
NS
0
NS
0
NS
1
0
0
0
NS
%
NS
NS
0
NS
NS
0
NS
0
NS
0
0
0
0
NS
NSNS
Prepared by the Massachusetts Childhood Lead Poisoning Prevention Program 4/11/2017 Page 1 of 24
Screening and Prevalence of Childhood Blood Lead Levels for Children 9 months to less than 4 years of age by Community
Calendar Year 2016: January 01, 2016- December 31, 2016
N
1275
Prepared by the Massachusetts Childhood Lead Poisoning Prevention Program 4/11/2017 Page 2 of 24
Community Population
1 9-47 mo. Total
Screened Percent
Screened
Blood Lead Levels 2 (µg/dL)
0-4 N %
5-9 N %
10-24 N %
Confirmed Elevated ≥10 4
%
Percent Pre-1978
Housing 5 Units
≥25N %
Estimated Confirmed ≥5 3
N %
ATTLEBORO 1736 73 1231 97 35 3 6 <1 3 <1 2 8 1 64
AUBURN 512 428 84 425 99 NS NS 0 0 0 0 NS NS 0 0 69
AVON 143 125 87 122 98 NS NS NS NS 0 0 NS NS NS NS 84
AYER 327 204 62 200 98 NS NS NS NS 0 0 NS NS NS NS 60
BARNSTABLE 1248 948 76 931 98 17 2 0 0 0 0 8 1 0 0 57
BARRE 165 88 53 83 94 NS NS NS NS 0 0 NS NS NS NS 66
BECKET 51 32 63 32 100 0 0 0 0 0 0 0 0 0 0 50
BEDFORD 432 448 >99 442 99 6 1 0 0 0 0 NS NS 0 0 61
BELCHERTOWN 510 319 63 319 100 0 0 0 0 0 0 0 0 0 0 42
BELLINGHAM 704 347 49 343 99 NS NS 0 0 0 0 NS NS 0 0 62
BELMONT 1087 637 59 629 99 8 1 0 0 0 0 8 1 0 0 92
BERKLEY 149 165 >99 161 98 NS NS 0 0 0 0 NS NS 0 0 35
BERLIN 74 63 85 61 97 NS NS 0 0 0 0 NS NS 0 0 50
BERNARDSTON 51 32 63 29 91 NS NS NS NS 0 0 NS NS NS NS 64
BEVERLY 1249 1056 85 1024 97 31 3 NS NS 0 0 21 2 NS NS 80
31

Screening and Prevalence of Childhood Blood Lead Levels for Children 9 months to less than 4 years of age by Community
Calendar Year 2016: January 01, 2016- December 31, 2016
Prepared by the Massachusetts Childhood Lead Poisoning Prevention Program 4/11/2017 Page 3 of 24
Community Population
1 9-47 mo. Total
Screened Percent
Screened
Blood Lead Levels 2 (µg/dL)
0-4N % N %
5-9 10-24 N %
≥25
N %
Estimated Confirmed ≥5 3
N %
Confirmed Elevated ≥10 4
N %
Percent Pre-1978 Housing
Units 5
BILLERICA 1270 1028 81 1011 98 16 2 NS NS 0 0 9 1 NS NS
BLACKSTONE 309 160 52 155 97 NS NS 0 0 0 0 NS NS 0 0
BLANDFORD 19 30 >99 100 0 0 0 0 0 030 0 0 0 0
BOLTON 156 153 98 151 99 NS NS 0 0 0 0 NS NS 0 0
BOSTON 21378 16757 78 16337 97 335 2 77 <1 8 <1 361 792 0
BOURNE 455 363 80 357 98 NS NS NS NS 0 NS NS NS NS
BOXBOROUGH 80 85 >99 85 100 0 0 0 0 0
0
0 0 0 0
BOXFORD 81 174 >99 173 99 0NS NS 0 0
0
0 NS NS 0 0
BOYLSTON 128 99 77 98 99 0 0 NS NS 0 0 NS NS NS NS
BRAINTREE 1357 1063 78 99 7 1 NS NS 0 0 7 1 NS NS
BREWSTER 198 108 55
1055
104 96 NS NS 0 0 0 0 NS NS 0
BRIDGEWATER 564 636 >99 628 99 7 1 NS NS 0 0 7 1 NS
BRIMFIELD 90 79 88 76 96 NS NS NS NS 0 0 NS NS 58NS
BROCKTON 4486 3782 84 3586 95 150 4 43 1 3 <1 173 5 83 44
BROOKFIELD 118 68 58 66 97 NS NS 0 0 0 0 NS NS 0
0
NS
NS
1
0
65
54
64
38
80
62
51
53
59
74
40
50
58
Screening and Prevalence of Childhood Blood Lead Levels for Children 9 months to less than 4 years of age by Community
Calendar Year 2016: January 01, 2016- December 31, 2016
Estimated Confirmed Percent Blood Lead Levels 2 (µg/dL) Confirmed ≥5 3 Elevated ≥10 4 Pre-1978
Population Total Percent 0-4 5-9 10-24 ≥25 Housing Community 9-47 mo. 1 Screened Screened Units 5
N % N % N % N % N % N %
ROOKLINE 2306 1439 62 1427 99 10 1 2 <1 0 0 11 1 2 0 88
UCKLAND 51 1 2 NS NS 0 0 0 0 0 0 0 0 0 0 66
URLINGTON 839 664 79 655 99 8 1 0 0 NS NS 6 1 NS NS 64
AMBRIDGE 2988 2498 84 2466 99 26 1 6 <1 0 0 24 1 6 0 77
ANTON 764 611 80 606 99 NS NS 0 0 0 0 NS NS 0 0 60
ARVER
HARLEMONT
HARLTON
HATHAM
HELMSFORD
HELSEA
HESHIRE
HESTER
HESTERFIELD
83
313
32
371
110
937
2194
93
37
12
83
255
20
327
47
895
1916
83
19
10
100
81
62
88
43
96
87
89
51
83
83
246
20
321
44
890
1853
81
17
10
100
96
100
98
94
99
97
98
89
100
0
8
0
NS
NS
NS
55
NS
NS
0
0
3
0
NS
NS
NS
3
NS
NS
0
0
NS
0
NS
NS
NS
8
0
0
0
0
NS
0
NS
NS
NS
<1
0
0
0
0
0
0
0
0
0
0
0
0
0
0
0
0
0
0
0
0
0
0
0
0
NS
0
NS
NS
NS
48
NS
NS
0
0
NS
0
NS
NS
NS
3
NS
NS
0
0
NS
0
NS
NS
NS
7
0
0
0
0
NS
0
NS
NS
NS
0
0
0
0
53
40
70
41
60
66
79
63
67
65
B
B
B
C
C
CARLISLE
C
C
C
C
C
C
C
C
C
Prepared by the Massachusetts Childhood Lead Poisoning Prevention Program 4/11/2017 Page 4 of 24

Screening and Prevalence of Childhood Blood Lead Levels for Children 9 months to less than 4 years of age by Community
Calendar Year 2016: January 01, 2016- December 31, 2016
Prepared by the Massachusetts Childhood Lead Poisoning Prevention Program 4/11/2017 Page 5 of 24
Community Population
1 9-47 mo. Total
Screened Percent Screened
Blood Lead Levels 2 (µg/dL) Estimated Confirmed ≥5
N %
3 Confirmed
Elevated ≥10
N %
4 Percent Pre-1978
Housing 5 Units N
0-4 % N
5-9 %
10-24 N % N
≥25
%
CHICOPEE
CHILMARK
CLARKSBURG
CLINTON
COHASSET
COLRAIN
CONCORD
CONWAY
CUMMINGTON
DALTON
DANVERS
DARTMOUTH
DEDHAM
DEERFIELD
DENNIS
2111
26
60
606
267
14
402
59
17
142
804
651
863
124
320
1317
15
7
439
221
30
318
27
18
134
760
682
708
100
175
62
58
12
72
83
>99
79
46
>99
94
95
>99
82
81
55
1297
14
6
413
219
30
318
25
16
132
745
670
702
93
167
98
93
86
94
99
100
100
93
89
99
98
98
99
93
95
15
NS
NS
24
NS
0
0
NS
NS
NS
11
11
6
7
8
1
NS
NS
5
NS
0
0
NS
NS
NS
1
2
1
7
5
5
0
0
NS
0
0
0
0
0
0
NS
NS
0
0
0
<1
0
0
NS
0
0
0
0
0
0
NS
NS
0
0
0
0
0
0
0
0
0
0
0
0
0
0
0
0
0
0
0
0
0
0
0
0
0
0
0
0
0
0
0
0
0
19
NS
0
17
NS
0
0
NS
NS
NS
9
8
6
6
NS
1
NS
0
4
NS
0
0
NS
NS
NS
1
1
1
6
NS
5
0
0
NS
0
0
0
0
0
0
NS
NS
0
0
0
0
0
0
NS
0
0
0
0
0
0
NS
NS
0
0
0
83
50
79
74
74
61
69
60
65
83
69
62
73
64
73
Screening and Prevalence of Childhood Blood Lead Levels for Children 9 months to less than 4 years of age by Community
Calendar Year 2016: January 01, 2016- December 31, 2016
Prepared by the Massachusetts Childhood Lead Poisoning Prevention Program 4/11/2017 Page 6 of 24
Community Population
1 9-47 mo. Total
Screened Percent Screened
Blood Lead Levels 2 (µg/dL) Estimated Confirmed ≥5
N %
3 Confirmed
Elevated ≥10
N %
4 Percent Pre-1978
Housing 5 Units N
0-4 % N
5-9 %
10-24 N % N
≥25
%
DIGHTON
DOUGLAS
DOVER
DRACUT
DUDLEY
DUNSTABLE
DUXBURY
EAST BRIDGEWATER
EAST BROOKFIELD
EAST LONGMEADOW
EASTHAM
EASTHAMPTON
EASTON
EDGARTOWN
EGREMONT
259
298
93
987
314
32
369
432
64
424
65
478
547
154
22
192
154
117
825
237
46
313
394
46
356
33
309
543
127
8
74
52
>99
84
75
>99
85
91
72
84
51
65
99
82
36
190
149
116
818
230
46
311
382
45
352
30
299
540
124
8
99
97
99
99
97
100
99
97
98
99
91
97
99
98
100
NS
NS
NS
7
NS
0
NS
11
NS
NS
NS
8
NS
NS
0
NS
NS
NS
1
NS
0
NS
3
NS
NS
NS
3
NS
NS
0
0
NS
0
0
NS
0
0
NS
0
0
0
NS
0
NS
0
0
NS
0
0
NS
0
0
NS
0
0
0
NS
0
NS
0
0
0
0
0
0
0
0
0
0
0
0
0
0
0
0
0
0
0
0
0
0
0
0
0
0
0
0
0
0
0
NS
NS
NS
6
6
0
NS
8
NS
NS
NS
10
NS
NS
0
NS
NS
NS
1
3
0
NS
2
NS
NS
NS
3
NS
NS
0
0
NS
0
0
NS
0
0
NS
0
0
0
NS
0
NS
0
0
NS
0
0
NS
0
0
NS
0
0
0
NS
0
NS
0
55
50
68
51
63
39
62
61
73
67
52
71
53
39
65
Prepared by the Massachusetts Childhood Lead Poisoning Prevention Program 4/11/2017 Page 7 of 24
Screening and Prevalence of Childhood Blood Lead Levels for Children 9 months to less than 4 years of age by Community
Calendar Year 2016: January 01, 2016- December 31, 2016
Community Population
1 9-47 mo. Total
Screened Percent Screened
Blood Lead Levels 2 (µg/dL) Estimated Confirmed ≥5
N %
3 Confirmed
Elevated ≥10
N %
4 Percent Pre-1978
Housing 5 Units N
0-4 % N
5-9 %
10-24 N % N
≥25
%
ERVING
ESSEX
EVERETT
FAIRHAVEN
FALL RIVER
FALMOUTH
FITCHBURG
FLORIDA
FOXBOROUGH
FRAMINGHAM
FRANKLIN
FREETOWN
GARDNER
AQUINNAH
GEORGETOWN
56
120
2131
398
3763
789
1835
40
511
3161
913
196
832
13
248
21
82
1674
319
2725
603
1104
3
443
2110
592
262
423
1
224
38
68
79
80
72
76
60
8
87
67
65
>99
51
8
90
20
79
1622
308
2611
597
1053
NS
433
2063
586
259
404
NS
221
95
96
97
97
96
99
95
NS
98
98
99
99
96
NS
99
NS
NS
48
8
101
NS
41
0
8
43
NS
NS
13
0
NS
NS
NS
3
3
4
NS
4
0
2
2
NS
NS
3
0
NS
0
NS
3
NS
11
NS
10
0
NS
4
NS
0
NS
0
NS
0
NS
<1
NS
<1
NS
1
0
NS
<1
NS
0
NS
0
NS
0
0
1
0
2
0
0
0
0
0
NS
0
NS
0
0
0
0
<1
0
<1
0
0
0
0
0
NS
0
NS
0
0
NS
NS
40
7
66
NS
40
0
7
43
NS
NS
15
0
NS
NS
NS
2
2
2
NS
4
0
2
2
NS
NS
4
0
NS
0
NS
4
NS
13
NS
8
0
NS
4
NS
0
6
0
NS
0
NS
0
NS
0
NS
1
0
NS
0
NS
0
1
0
NS
68
72
90
77
83
61
77
63
59
80
41
64
78
41
53
Prepared by the Massachusetts Childhood Lead Poisoning Prevention Program 4/11/2017 Page 8 of 24
Screening and Prevalence of Childhood Blood Lead Levels for Children 9 months to less than 4 years of age by Community
Calendar Year 2016: January 01, 2016- December 31, 2016
Community Population
1 9-47 mo. Total
Screened Percent Screened
Blood Lead Levels 2 (µg/dL) Estimated Confirmed ≥5
N %
3 Confirmed
Elevated ≥10
N %
4 Percent Pre-1978
Housing 5 Units N
0-4 % N
5-9 %
10-24 N % N
≥25
%
GILL
GLOUCESTER
GOSHEN
GOSNOLD
GRAFTON
GRANBY
GRANVILLE
GREAT BARRINGTON
GREENFIELD
GROTON
GROVELAND
HADLEY
HALIFAX
HAMILTON
HAMPDEN
19
661
41
-1
842
130
28
145
672
244
148
117
212
270
98
26
666
5
0
491
118
27
120
327
209
133
57
188
225
87
>99
>99
12
>99
58
91
96
83
49
86
90
49
89
83
89
25
624
NS
0
486
116
25
112
316
206
128
54
187
224
86
96
94
NS
0
99
98
93
93
97
99
96
95
99
100
99
NS
38
0
0
NS
NS
NS
7
8
NS
NS
NS
NS
NS
NS
NS
6
0
0
NS
NS
NS
6
2
NS
NS
NS
NS
NS
NS
0
NS
0
0
0
0
0
NS
NS
0
0
0
0
0
0
0
NS
0
0
0
0
0
NS
NS
0
0
0
0
0
0
0
0
0
0
0
0
0
0
NS
0
0
0
0
0
0
0
0
0
0
0
0
0
0
NS
0
0
0
0
0
0
NS
30
0
0
NS
NS
NS
NS
10
NS
NS
NS
NS
0
0
NS
5
0
0
NS
NS
NS
NS
3
NS
NS
NS
NS
0
0
0
NS
0
0
0
0
0
NS
NS
0
0
0
0
0
0
0
NS
0
0
0
0
0
NS
NS
0
0
0
0
0
0
55
77
61
78
51
67
65
74
81
47
60
62
66
76
71
Screening and Prevalence of Childhood Blood Lead Levels for Children 9 months to less than 4 years of age by Community
Calendar Year 2016: January 01, 2016- December 31, 2016
Prepared by the Massachusetts Childhood Lead Poisoning Prevention Program 4/11/2017 Page 9 of 24
Community Population
1 9-47 mo. Total
Screened Percent Screened
Blood Lead Levels 2 (µg/dL) Estimated Confirmed ≥5
N %
3 Confirmed
Elevated ≥10
N %
4 Percent Pre-1978
Housing 5 Units N
0-4 % N
5-9 %
10-24 N % N
≥25
%
HANCOCK
HANOVER
HANSON
HARDWICK
HARVARD
HARWICH
HATFIELD
HAVERHILL
HAWLEY
HEATH
HINGHAM
HINSDALE
HOLBROOK
HOLDEN
HOLLAND
16
369
272
142
69
295
66
2862
5
7
853
26
371
630
57
2
396
273
40
93
159
49
1829
2
3
699
48
317
462
54
12
>99
>99
28
>99
54
74
64
40
43
82
>99
85
73
95
NS
392
268
35
92
154
49
1764
NS
NS
697
47
311
459
51
NS
99
98
88
99
97
100
96
NS
NS
100
98
98
99
94
0
NS
NS
NS
NS
NS
0
57
0
0
NS
NS
NS
NS
NS
0
NS
NS
NS
NS
NS
0
3
0
0
NS
NS
NS
NS
NS
0
0
0
0
0
NS
0
5
0
0
NS
0
NS
NS
0
0
0
0
0
0
NS
0
<1
0
0
NS
0
NS
NS
0
0
0
0
0
0
0
0
3
0
0
0
0
0
0
0
0
0
0
0
0
0
0
<1
0
0
0
0
0
0
0
0
NS
NS
NS
NS
NS
0
56
0
0
NS
0
NS
NS
NS
0
NS
NS
NS
NS
NS
0
3
0
0
NS
0
NS
NS
NS
0
0
0
0
0
NS
0
8
0
0
NS
0
NS
NS
0
0
0
0
0
0
NS
0
0
0
0
NS
0
NS
NS
0
36
60
65
63
61
58
73
66
64
48
63
68
75
61
70

Prepared by the Massachusetts Childhood Lead Poisoning Prevention Program 4/11/2017 Page 10 of 24
Estimated Confirmed Percent Blood Lead Levels 2 (µg/dL) 3 4 Confirmed ≥5 Elevated ≥10 Pre-1978 Population Total Percent 0-4 5-9 10-24 ≥25 Housing
1 5 Community 9-47 mo. Screened Screened N % N % N % N % N % N % Units
HOLLISTON 385 328 85 323 98 NS NS 0 0 0 0 NS NS 0 0 73
HOLYOKE 1968 1410 72 1368 97 37 3 5 <1 0 0 34 2 5 0 84
HOPEDALE 155 133 86 128 96 NS NS NS NS 0 0 NS NS NS NS 59
HOPKINTON 398 442 >99 433 98 8 2 NS NS 0 0 NS NS NS NS 42
HUBBARDSTON 105 62 59 62 100 0 0 0 0 0 0 0 0 0 0 35
HUDSON 703 510 73 501 98 7 1 NS NS 0 0 6 1 NS NS 62
HULL 202 173 86 168 97 NS NS NS NS 0 0 NS NS NS NS 76
HUNTINGTON 72 50 69 45 90 NS NS 0 0 0 0 NS NS 0 0 66
IPSWICH 302 233 77 230 99 NS NS 0 0 0 0 NS NS 0 0 67
KINGSTON 334 348 >99 343 99 NS NS 0 0 0 0 NS NS 0 0 51
LAKEVILLE 265 276 >99 273 99 NS NS 0 0 0 0 NS NS 0 0 46
LANCASTER 189 139 74 133 96 6 4 0 0 0 0 NS NS 0 0 76
LANESBOROUGH 100 52 52 51 98 NS NS 0 0 0 0 0 0 0 0 71
LAWRENCE 4203 3228 77 3142 97 69 2 14 <1 3 <1 81 3 17 1 82
LEE 152 90 59 85 94 NS NS 0 0 NS NS NS NS NS NS 71
Screening and Prevalence of Childhood Blood Lead Levels for Children 9 months to less than 4 years of age by Community
Calendar Year 2016: January 01, 2016- December 31, 2016
Community Population
1 9-47 mo. Total
Screened Percent Screened
Blood Lead Levels 2 (µg/dL) Estimated Confirmed ≥5
N %
3 Confirmed
Elevated ≥10
N %
4 Percent Pre-1978
Housing 5 Units N
0-4 % N
5-9 %
10-24 N % N
≥25
%
LEICESTER
LENOX
LEOMINSTER
LEVERETT
LEXINGTON
LEYDEN
LINCOLN
LITTLETON
LONGMEADOW
LOWELL
LUDLOW
LUNENBURG
LYNN
LYNNFIELD
MALDEN
301
123
1346
44
789
11
74
269
388
5268
526
313
4499
248
2679
231
59
1130
27
533
3
99
232
303
3918
380
227
3796
377
2033
77
48
84
61
68
27
>99
86
78
74
72
73
84
>99
76
226
56
1102
26
531
NS
99
230
300
3790
375
222
3607
374
1973
98
95
98
96
100
NS
100
99
99
97
99
98
95
99
97
NS
NS
23
NS
NS
0
0
NS
NS
104
NS
NS
167
NS
50
NS
NS
2
NS
NS
0
0
NS
NS
3
NS
NS
4
NS
2
NS
0
NS
0
NS
0
0
NS
0
20
0
0
22
0
8
NS
0
NS
0
NS
0
0
NS
0
1
0
0
1
0
<1
0
0
0
0
0
0
0
0
0
4
0
0
0
0
2
0
0
0
0
0
0
0
0
0
<1
0
0
0
0
<1
NS
NS
24
0
NS
0
0
NS
NS
111
NS
NS
137
NS
46
NS
NS
2
0
NS
0
0
NS
NS
3
NS
NS
4
NS
2
NS
0
NS
0
NS
0
0
NS
0
23
0
0
21
0
9
NS
0
NS
0
NS
0
0
NS
0
1
0
0
1
0
0
67
68
66
59
73
57
55
57
83
79
66
62
88
72
79
Prepared by the Massachusetts Childhood Lead Poisoning Prevention Program 4/11/2017 Page 11 of 24
Screening and Prevalence of Childhood Blood Lead Levels for Children 9 months to less than 4 years of age by Community
Calendar Year 2016: January 01, 2016- December 31, 2016
Community Population
1 9-47 mo. Total
Screened Percent Screened
Blood Lead Levels 2 (µg/dL) Estimated Confirmed ≥5
N %
3 Confirmed
Elevated ≥10
N %
4 Percent Pre-1978
Housing 5 Units N
0-4 % N
5-9 %
10-24 N % N
≥25
%
MANCHESTER
MANSFIELD
MARBLEHEAD
MARION
MARLBOROUGH
MARSHFIELD
MASHPEE
MATTAPOISETT
MAYNARD
MEDFIELD
MEDFORD
MEDWAY
MELROSE
MENDON
MERRIMAC
138
525
508
109
1733
729
376
112
507
204
2015
296
978
141
63
85
588
459
103
1177
611
271
99
285
374
1561
312
991
100
150
62
>99
90
94
68
84
72
88
56
>99
77
>99
>99
71
>99
82
580
451
101
1162
607
266
95
281
374
1530
307
968
98
142
96
99
98
98
99
99
98
96
99
100
98
98
98
98
95
NS
7
8
NS
11
NS
NS
NS
NS
0
27
NS
21
NS
6
NS
1
2
NS
1
NS
NS
NS
NS
0
2
NS
2
NS
4
0
NS
0
0
NS
0
0
NS
0
0
4
NS
NS
NS
NS
0
NS
0
0
NS
0
0
NS
0
0
<1
NS
NS
NS
NS
0
0
0
0
0
0
0
0
0
0
0
0
0
0
0
0
0
0
0
0
0
0
0
0
0
0
0
0
0
0
NS
NS
NS
NS
10
NS
NS
NS
NS
0
27
NS
19
NS
7
NS
NS
NS
NS
1
NS
NS
NS
NS
0
2
NS
2
NS
5
0
NS
0
0
NS
0
0
0
0
0
4
NS
NS
NS
NS
0
NS
0
0
NS
0
0
0
0
0
0
NS
NS
NS
NS
80
47
86
56
61
65
29
77
74
63
83
60
85
40
51
Screening and Prevalence of Childhood Blood Lead Levels for Children 9 months to less than 4 years of age by Community
Calendar Year 2016: January 01, 2016- December 31, 2016
Prepared by the Massachusetts Childhood Lead Poisoning Prevention Program 4/11/2017 Page 12 of 24

Community Population
1 9-47 mo. Total
Screened Percent Screened
Blood Lead Levels 2 (µg/dL) Estimated Confirmed ≥5
N %
3 Confirmed
Elevated ≥10
N %
4 Percent Pre-1978
Housing 5 Units N
0-4 % N
5-9 %
10-24 N % N
≥25
%
METHUEN
MIDDLEBOROUGH
MIDDLEFIELD
MIDDLETON
MILFORD
MILLBURY
MILLIS
MILLVILLE
MILTON
MONROE
MONSON
MONTAGUE
MONTEREY
MONTGOMERY
MOUNT WASHINGTON
1874
802
13
188
1224
445
220
81
929
-1
179
271
35
32
1
1221
588
2
192
865
298
174
51
818
1
155
166
6
8
0
65
73
15
>99
71
67
79
63
88
>99
87
61
17
25
0
1204
574
NS
191
832
295
172
50
802
NS
149
161
6
8
0
99
98
NS
99
96
99
99
98
98
NS
96
97
100
100
0
16
11
0
NS
27
NS
NS
NS
14
0
6
NS
0
0
0
1
2
0
NS
3
NS
NS
NS
2
0
4
NS
0
0
0
0
NS
0
0
6
0
0
0
NS
0
0
0
0
0
0
0
NS
0
0
1
0
0
0
NS
0
0
0
0
0
0
1
0
0
0
0
0
0
0
0
0
0
0
0
0
0
<1
0
0
0
0
0
0
0
0
0
0
0
0
0
0
17
10
0
0
30
NS
NS
NS
15
0
NS
NS
0
0
0
1
2
0
0
3
NS
NS
NS
2
0
NS
NS
0
0
0
1
NS
0
0
6
0
0
0
NS
0
0
0
0
0
0
0
NS
0
0
1
0
0
0
NS
0
0
0
0
0
0
63
50
38
46
67
65
59
61
83
64
58
75
57
55
68
Screening and Prevalence of Childhood Blood Lead Levels for Children 9 months to less than 4 years of age by Community
Calendar Year 2016: January 01, 2016- December 31, 2016
Prepared by the Massachusetts Childhood Lead Poisoning Prevention Program 4/11/2017 Page 13 of 24
Community Population
1 9-47 mo. Total
Screened Percent Screened
Blood Lead Levels 2 (µg/dL) Estimated Confirmed ≥5
N %
3 Confirmed
Elevated ≥10
N %
4 Percent Pre-1978
Housing 5 Units N
0-4 % N
5-9 %
10-24 N % N
≥25
%
NAHANT
NANTUCKET
NATICK
NEEDHAM
NEW ASHFORD
NEW BEDFORD
NEW BRAINTREE
NEW MARLBOROUGH
NEW SALEM
NEWBURY
NEWBURYPORT
NEWTON
NORFOLK
NORTH ADAMS
NORTH ANDOVER
53
516
1385
1083
2
4521
30
27
21
146
544
3028
211
471
981
53
206
1021
929
0
3600
12
11
8
113
363
2168
281
407
778
100
40
74
86
0
80
40
41
38
77
67
72
>99
86
79
49
196
1010
921
0
3374
12
10
8
107
355
2147
278
380
769
92
95
99
99
0
94
100
91
100
95
98
99
99
93
99
NS
8
6
8
0
192
0
NS
0
6
7
18
NS
25
9
NS
4
1
1
0
5
0
NS
0
5
2
1
NS
6
1
NS
NS
NS
0
0
31
0
0
0
0
NS
2
0
0
0
NS
NS
NS
0
0
1
0
0
0
0
NS
<1
0
0
0
0
0
0
0
0
3
0
0
0
0
0
1
0
NS
0
0
0
0
0
0
<1
0
0
0
0
0
<1
0
NS
0
NS
NS
11
7
0
171
0
0
0
NS
7
16
NS
15
7
NS
NS
1
1
0
5
0
0
0
NS
2
1
NS
4
1
NS
NS
NS
0
0
33
0
0
0
0
NS
3
0
NS
0
NS
NS
NS
0
0
1
0
0
0
0
NS
0
0
NS
0
89
39
69
74
61
85
49
62
55
54
73
84
44
85
56
Screening and Prevalence of Childhood Blood Lead Levels for Children 9 months to less than 4 years of age by Community
Calendar Year 2016: January 01, 2016- December 31, 2016
Prepared by the Massachusetts Childhood Lead Poisoning Prevention Program 4/11/2017 Page 14 of 24
Community Population
1 9-47 mo. Total
Screened Percent Screened
Blood Lead Levels 2 (µg/dL) Estimated Confirmed ≥5
N %
3 Confirmed
Elevated ≥10
N %
4 Percent Pre-1978
Housing 5 Units N
0-4 % N
5-9 %
10-24 N % N
≥25
%
NORTH ATTLEBORO
NORTH BROOKFIELD
NORTH READING
NORTHAMPTON
NORTHBOROUGH
NORTHBRIDGE
NORTHFIELD
NORTON
NORWELL
NORWOOD
OAK BLUFFS
OAKHAM
ORANGE
ORLEANS
OTIS
1144
185
376
659
290
684
53
468
336
1196
188
29
293
101
51
687
100
388
455
402
394
35
432
321
947
40
36
92
54
15
60
54
>99
69
>99
58
66
92
96
79
21
>99
31
53
29
665
97
386
439
399
384
35
431
320
927
37
35
84
54
13
97
97
99
96
99
97
100
100
100
98
92
97
91
100
87
20
NS
NS
13
NS
8
0
0
NS
17
NS
NS
NS
0
NS
3
NS
NS
3
NS
2
0
0
NS
2
NS
NS
NS
0
NS
NS
NS
NS
NS
NS
NS
0
NS
0
NS
0
0
NS
0
0
NS
NS
NS
NS
NS
NS
0
NS
0
NS
0
0
NS
0
0
0
0
0
0
0
0
0
0
0
NS
0
0
0
0
0
0
0
0
0
0
0
0
0
0
NS
0
0
0
0
0
15
NS
NS
16
NS
9
0
0
0
12
NS
NS
7
0
NS
2
NS
NS
4
NS
2
0
0
0
1
NS
NS
8
0
NS
NS
0
NS
NS
NS
NS
0
0
0
NS
0
0
NS
0
0
NS
0
NS
NS
NS
NS
0
0
0
NS
0
0
NS
0
0
60
73
57
78
56
66
68
47
70
77
49
45
69
52
61
Screening and Prevalence of Childhood Blood Lead Levels for Children 9 months to less than 4 years of age by Community
Calendar Year 2016: January 01, 2016- December 31, 2016
Prepared by the Massachusetts Childhood Lead Poisoning Prevention Program 4/11/2017 Page 15 of 24
Estimated Confirmed Percent Blood Lead Levels 2 (µg/dL) 3 4 Confirmed ≥5 Elevated ≥10 Pre-1978 Population Total Percent 0-4 5-9 10-24 ≥25 Housing
1 5 Community 9-47 mo. Screened Screened N % N % N % N % N % N % Units
OXFORD 490 328 67 324 99 NS NS NS NS 0 0 NS NS NS NS 66
PALMER 308 264 86 250 95 12 5 NS NS 0 0 13 5 NS NS 69
PAXTON 161 60 37 59 98 NS NS 0 0 0 0 0 0 0 0 71
PEABODY 1488 1407 95 1390 99 15 1 2 <1 0 0 8 1 1 0 66
PELHAM 37 31 84 31 100 0 0 0 0 0 0 0 0 0 0 64
PEMBROKE 523 417 80 416 100 NS NS 0 0 0 0 0 0 0 0 59
PEPPERELL 286 218 76 215 99 NS NS NS NS 0 0 NS NS NS NS 49
PERU 15 7 47 7 100 0 0 0 0 0 0 0 0 0 0 44
PETERSHAM 35 11 31 8 73 NS NS NS NS 0 0 NS NS NS NS 67
PHILLIPSTON 40 14 35 14 100 0 0 0 0 0 0 0 0 0 0 49
PITTSFIELD 1649 1179 71 1122 95 48 4 7 1 NS NS 31 3 9 1 83
PLAINFIELD 21 9 43 8 89 NS NS 0 0 0 0 NS NS 0 0 63
PLAINVILLE 285 219 77 218 100 NS NS 0 0 0 0 0 0 0 0 55
PLYMOUTH 1946 960 49 953 99 7 1 0 0 0 0 NS NS 0 0 54
PLYMPTON 60 76 >99 75 99 NS NS 0 0 0 0 0 0 0 0 51
Screening and Prevalence of Childhood Blood Lead Levels for Children 9 months to less than 4 years of age by Community
Calendar Year 2016: January 01, 2016- December 31, 2016
Prepared by the Massachusetts Childhood Lead Poisoning Prevention Program 4/11/2017 Page 16 of 24
Community Population
1 9-47 mo. Total
Screened Percent Screened
Blood Lead Levels 2 (µg/dL) Estimated Confirmed ≥5
N %
3 Confirmed
Elevated ≥10
N %
4 Percent Pre-1978
Housing 5 Units N
0-4 % N
5-9 %
10-24 N % N
≥25
%
PRINCETON
PROVINCETOWN
QUINCY
RANDOLPH
RAYNHAM
READING
REHOBOTH
REVERE
RICHMOND
ROCHESTER
ROCKLAND
ROCKPORT
ROWE
ROWLEY
ROYALSTON
67
39
3386
1252
486
904
327
2314
3
123
686
101
17
172
33
57
16
2732
880
396
676
217
1988
11
108
532
112
1
119
21
85
41
81
70
81
75
66
86
>99
88
78
>99
6
69
64
57
15
2677
866
389
671
210
1944
11
105
517
107
NS
116
18
100
94
98
98
98
99
97
98
100
97
97
96
NS
97
86
0
0
40
11
6
NS
6
40
0
NS
15
NS
0
NS
NS
0
0
1
1
2
NS
3
2
0
NS
3
NS
0
NS
NS
0
NS
13
NS
NS
0
NS
4
0
0
0
0
0
0
0
0
NS
<1
NS
NS
0
NS
<1
0
0
0
0
0
0
0
0
0
2
0
0
0
0
0
0
0
0
0
0
0
0
0
0
<1
0
0
0
0
0
0
0
0
0
0
0
0
0
NS
49
11
NS
NS
6
31
0
NS
11
NS
0
NS
NS
0
NS
2
1
NS
NS
3
2
0
NS
2
NS
0
NS
NS
0
NS
15
NS
0
0
NS
4
0
0
0
0
0
0
0
0
NS
1
NS
0
0
NS
0
0
0
0
0
0
0
0
62
72
72
69
47
76
55
74
71
42
67
77
74
53
58
Screening and Prevalence of Childhood Blood Lead Levels for Children 9 months to less than 4 years of age by Community
Calendar Year 2016: January 01, 2016- December 31, 2016
Prepared by the Massachusetts Childhood Lead Poisoning Prevention Program 4/11/2017 Page 17 of 24

Community Population
1 9-47 mo. Total
Screened Percent Screened
Blood Lead Levels 2 (µg/dL) Estimated Confirmed ≥5
N %
3 Confirmed
Elevated ≥10
N %
4 Percent Pre-1978
Housing 5 Units N
0-4 % N
5-9 %
10-24 N % N
≥25
%
RUSSELL
RUTLAND
SALEM
SALISBURY
SANDISFIELD
SANDWICH
SAUGUS
SAVOY
SCITUATE
SEEKONK
SHARON
SHEFFIELD
SHELBURNE
SHERBORN
SHIRLEY
61
307
1509
201
32
434
747
14
470
284
406
47
47
53
193
25
202
1181
156
14
370
643
3
524
260
408
59
55
87
126
41
66
78
78
44
85
86
21
>99
92
>99
>99
>99
>99
65
22
198
1134
154
12
365
635
NS
518
256
401
51
53
86
125
88
98
96
99
86
99
99
NS
99
98
98
86
96
99
99
NS
NS
43
NS
NS
NS
8
0
NS
NS
7
8
NS
NS
NS
NS
NS
4
NS
NS
NS
1
0
NS
NS
2
14
NS
NS
NS
NS
NS
NS
0
0
0
0
0
NS
NS
0
0
0
0
0
NS
NS
NS
0
0
0
0
0
NS
NS
0
0
0
0
0
0
0
NS
0
0
0
0
0
0
0
0
0
0
0
0
0
0
NS
0
0
0
0
0
0
0
0
0
0
0
0
NS
NS
30
NS
NS
NS
7
0
NS
NS
NS
6
NS
0
NS
NS
NS
3
NS
NS
NS
1
0
NS
NS
NS
10
NS
0
NS
0
NS
NS
0
0
0
0
0
NS
NS
0
0
0
0
0
0
NS
NS
0
0
0
0
0
NS
NS
0
0
0
0
0
74
47
79
60
58
46
72
48
74
67
60
67
83
68
48
Prepared by the Massachusetts Childhood Lead Poisoning Prevention Program 4/11/2017 Page 18 of 24
Screening and Prevalence of Childhood Blood Lead Levels for Children 9 months to less than 4 years of age by Community
Calendar Year 2016: January 01, 2016- December 31, 2016
Blood Lead Levels 2 (µg/dL) 3 4 Confirmed ≥5 Elevated ≥10 Pre-197 Population Total Percent 0-4 5-9 10-24 ≥25 Housing
1 5Community 9-47 mo. Screened Screened N % N % N % N % N % N % Units
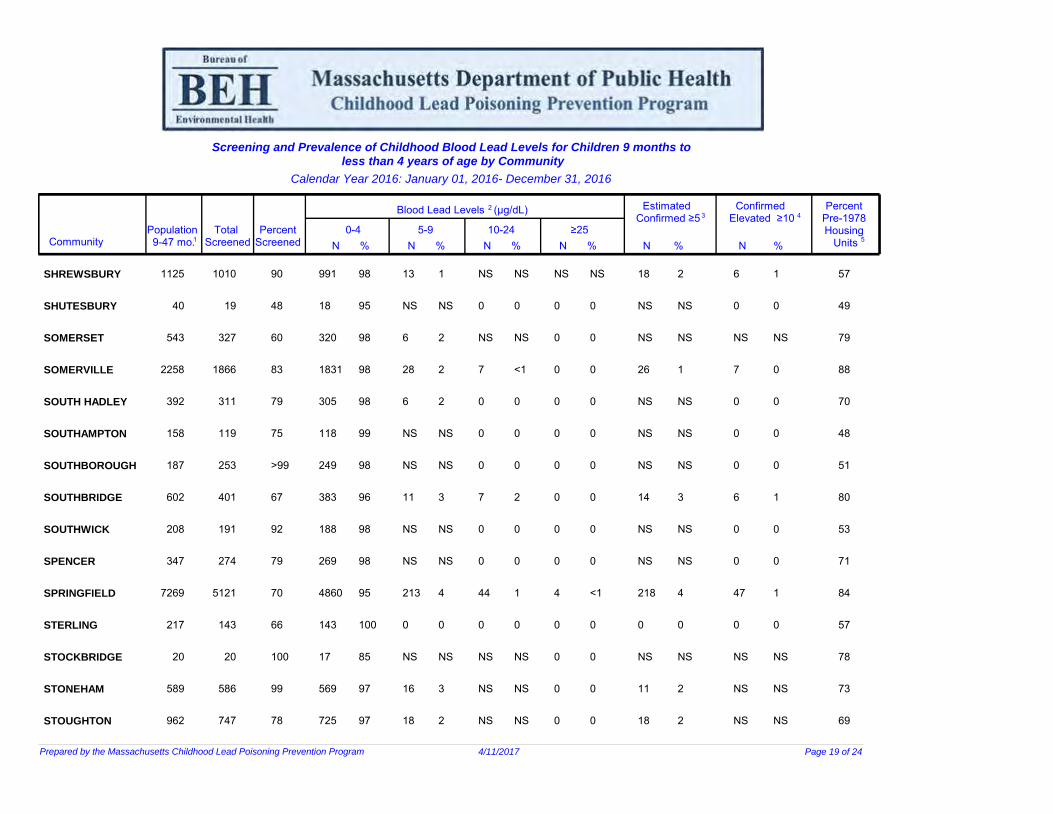
SHREWSBURY 1125 1010 90 991 98 13 1 NS NS NS NS 18 2 6 1 57
SHUTESBURY 40 19 48 18 95 NS NS 0 0 0 0 NS NS 0 0 49
SOMERSET 543 327 60 320 98 6 2 NS NS 0 0 NS NS NS NS 79
SOMERVILLE 2258 1866 83 1831 98 28 2 7 <1 0 0 26 1 7 0 88
SOUTH HADLEY 392 311 79 305 98 6 2 0 0 0 0 NS NS 0 0 70
SOUTHAMPTON 158 119 75 118 99 NS NS 0 0 0 0 NS NS 0 0 48
SOUTHBOROUGH 187 253 >99 249 98 NS NS 0 0 0 0 NS NS 0 0 51
SOUTHBRIDGE 602 401 67 383 96 11 3 7 2 0 0 14 3 6 1 80
SOUTHWICK 208 191 92 188 98 NS NS 0 0 0 0 NS NS 0 0 53
SPENCER 347 274 79 269 98 NS NS 0 0 0 0 NS NS 0 0 71
SPRINGFIELD 7269 5121 70 4860 95 213 4 44 1 4 <1 218 4 47 1 84
STERLING 217 143 66 143 100 0 0 0 0 0 0 0 0 0 0 57
STOCKBRIDGE 20 20 100 17 85 NS NS NS NS 0 0 NS NS NS NS 78
STONEHAM 589 586 99 569 97 16 3 NS NS 0 0 11 2 NS NS 73
STOUGHTON 962 747 78 725 97 18 2 NS NS 0 0 18 2 NS NS 69
Prepared by the Massachusetts Childhood Lead Poisoning Prevention Program 4/11/2017 Page 19 of 24
Screening and Prevalence of Childhood Blood Lead Levels for Children 9 months to less than 4 years of age by Community
Calendar Year 2016: January 01, 2016- December 31, 2016
Estimated Confirmed Percent 8

Community Population
1 9-47 mo. Total
Screened Percent Screened
Blood Lead Levels 2 (µg/dL) Estimated Confirmed ≥5
N %
3 Confirmed
Elevated ≥10
N %
4 Percent Pre-1978
Housing 5 Units N
0-4 % N
5-9 %
10-24 N % N
≥25
%
STOW
STURBRIDGE
SUDBURY
SUNDERLAND
SUTTON
SWAMPSCOTT
SWANSEA
TAUNTON
TEMPLETON
TEWKSBURY
TISBURY
TOLLAND
TOPSFIELD
TOWNSEND
TRURO
219
465
406
70
181
431
447
2093
309
741
149
14
100
223
33
155
230
416
51
187
402
276
1656
148
647
0
0
139
181
16
71
49
>99
73
>99
93
62
79
48
87
0
0
>99
81
48
153
222
416
51
184
394
268
1618
142
640
0
0
139
173
15
99
97
100
100
98
98
97
98
96
99
0
0
100
96
94
NS
NS
0
0
NS
8
7
32
6
6
0
0
0
NS
NS
NS
NS
0
0
NS
2
3
2
4
1
0
0
0
NS
NS
0
NS
0
0
NS
0
NS
6
0
NS
0
0
0
NS
0
0
NS
0
0
NS
0
NS
<1
0
NS
0
0
0
NS
0
0
0
0
0
0
0
0
0
0
0
0
0
0
0
0
0
0
0
0
0
0
0
0
0
0
0
0
0
0
0
NS
7
0
0
NS
NS
NS
28
NS
NS
0
0
0
6
NS
NS
3
0
0
NS
NS
NS
2
NS
NS
0
0
0
3
NS
0
NS
0
0
NS
0
NS
5
0
NS
0
0
0
NS
0
0
NS
0
0
NS
0
NS
0
0
NS
0
0
0
NS
0
56
42
61
61
49
85
69
65
52
51
48
48
77
62
55
Screening and Prevalence of Childhood Blood Lead Levels for Children 9 months to less than 4 years of age by Community
Calendar Year 2016: January 01, 2016- December 31, 2016
Prepared by the Massachusetts Childhood Lead Poisoning Prevention Program 4/11/2017 Page 20 of 24
Community Population
1 9-47 mo. Total
Screened Percent Screened
Blood Lead Levels 2 (µg/dL) Estimated Confirmed ≥5
N %
3 Confirmed
Elevated ≥10
N %
4 Percent Pre-1978
Housing 5 Units N
0-4 % N
5-9 %
10-24 N % N
≥25
%
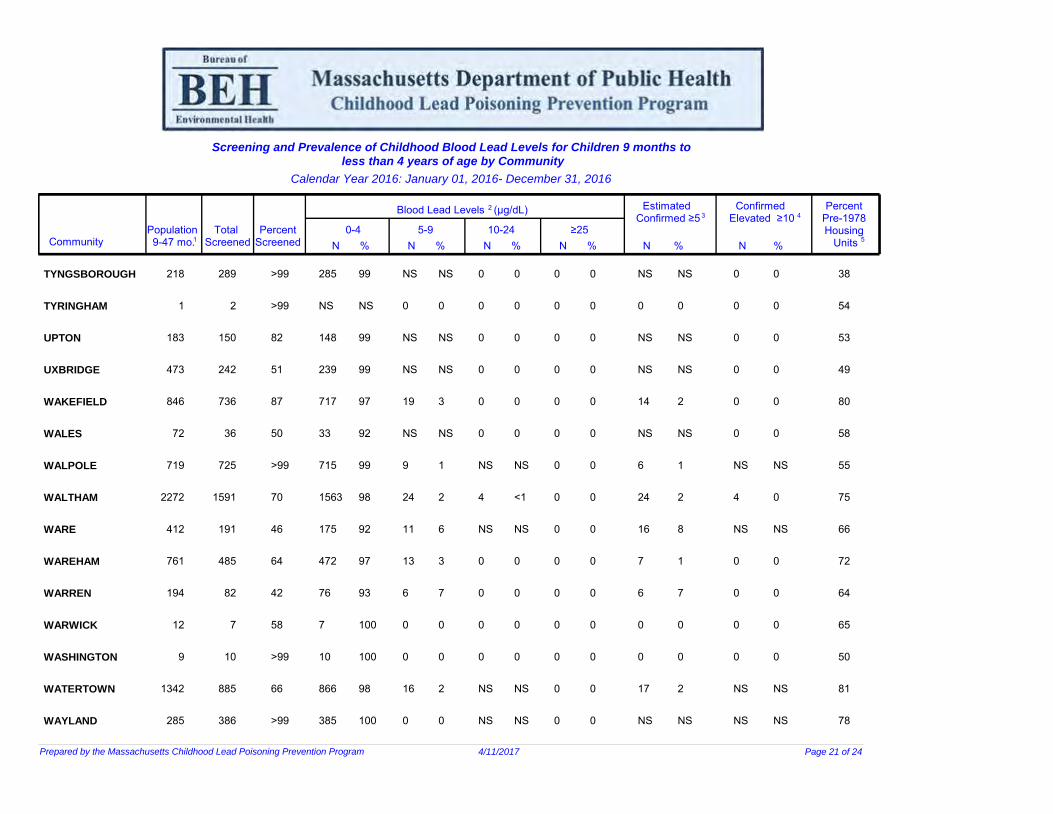
TYNGSBOROUGH
TYRINGHAM
UPTON
UXBRIDGE
WAKEFIELD
WALES
WALPOLE
WALTHAM
WARE
WAREHAM
WARREN
WARWICK
WASHINGTON
WATERTOWN
WAYLAND
218
1
183
473
846
72
719
2272
412
761
194
12
9
1342
285
289
2
150
242
736
36
725
1591
191
485
82
7
10
885
386
>99
>99
82
51
87
50
>99
70
46
64
42
58
>99
66
>99
285
NS
148
239
717
33
715
1563
175
472
76
7
10
866
385
99
NS
99
99
97
92
99
98
92
97
93
100
100
98
100
NS
0
NS
NS
19
NS
9
24
11
13
6
0
0
16
0
NS
0
NS
NS
3
NS
1
2
6
3
7
0
0
2
0
0
0
0
0
0
0
NS
4
NS
0
0
0
0
NS
NS
0
0
0
0
0
0
NS
<1
NS
0
0
0
0
NS
NS
0
0
0
0
0
0
0
0
0
0
0
0
0
0
0
0
0
0
0
0
0
0
0
0
0
0
0
0
0
0
NS
0
NS
NS
14
NS
6
24
16
7
6
0
0
17
NS
NS
0
NS
NS
2
NS
1
2
8
1
7
0
0
2
NS
0
0
0
0
0
0
NS
4
NS
0
0
0
0
NS
NS
0
0
0
0
0
0
NS
0
NS
0
0
0
0
NS
NS
38
54
53
49
80
58
55
75
66
72
64
65
50
81
78
Screening and Prevalence of Childhood Blood Lead Levels for Children 9 months to less than 4 years of age by Community
Calendar Year 2016: January 01, 2016- December 31, 2016
Prepared by the Massachusetts Childhood Lead Poisoning Prevention Program 4/11/2017 Page 21 of 24
Community Population
1 9-47 mo. Total
Screened Percent Screened
Blood Lead Levels 2 (µg/dL) Estimated Confirmed ≥5
N %
3 Confirmed
Elevated ≥10
N %
4 Percent Pre-1978
Housing 5 Units N
0-4 % N
5-9 %
10-24 N % N
≥25
%
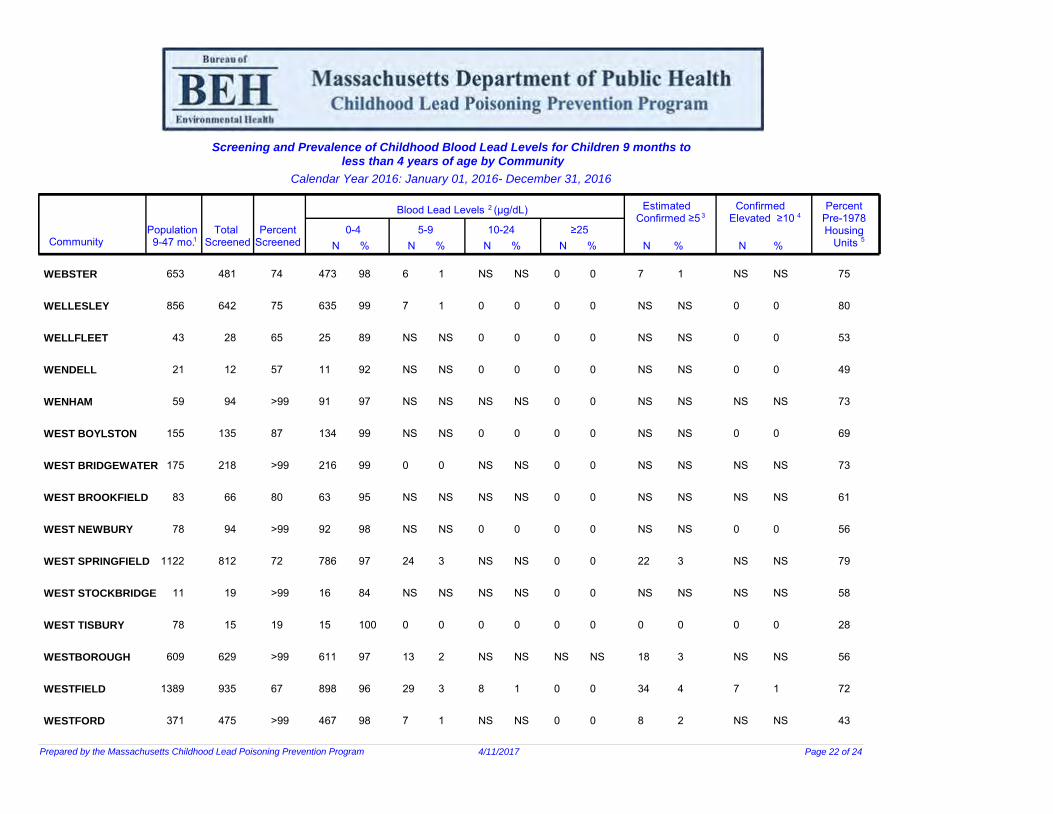
WEBSTER
WELLESLEY
WELLFLEET
WENDELL
WENHAM
WEST BOYLSTON
WEST BRIDGEWATER
WEST BROOKFIELD
WEST NEWBURY
WEST SPRINGFIELD
WEST STOCKBRIDGE
WEST TISBURY
WESTBOROUGH
WESTFIELD
WESTFORD
653
856
43
21
59
155
175
83
78
1122
11
78
609
1389
371
481
642
28
12
94
135
218
66
94
812
19
15
629
935
475
74
75
65
57
>99
87
>99
80
>99
72
>99
19
>99
67
>99
473
635
25
11
91
134
216
63
92
786
16
15
611
898
467
98
99
89
92
97
99
99
95
98
97
84
100
97
96
98
6
7
NS
NS
NS
NS
0
NS
NS
24
NS
0
13
29
7
1
1
NS
NS
NS
NS
0
NS
NS
3
NS
0
2
3
1
NS
0
0
0
NS
0
NS
NS
0
NS
NS
0
NS
8
NS
NS
0
0
0
NS
0
NS
NS
0
NS
NS
0
NS
1
NS
0
0
0
0
0
0
0
0
0
0
0
0
NS
0
0
0
0
0
0
0
0
0
0
0
0
0
0
NS
0
0
7
NS
NS
NS
NS
NS
NS
NS
NS
22
NS
0
18
34
8
1
NS
NS
NS
NS
NS
NS
NS
NS
3
NS
0
3
4
2
NS
0
0
0
NS
0
NS
NS
0
NS
NS
0
NS
7
NS
NS
0
0
0
NS
0
NS
NS
0
NS
NS
0
NS
1
NS
75
80
53
49
73
69
73
61
56
79
58
28
56
72
43
Screening and Prevalence of Childhood Blood Lead Levels for Children 9 months to less than 4 years of age by Community
Calendar Year 2016: January 01, 2016- December 31, 2016
Prepared by the Massachusetts Childhood Lead Poisoning Prevention Program 4/11/2017 Page 22 of 24
Screening and Prevalence of Childhood Blood Lead Levels for Children 9 months to less than 4 years of age by Community
Calendar Year 2016: January 01, 2016- December 31, 2016
Estimated Confirmed Percent Blood Lead Levels 2 (µg/dL) 3 4 Confirmed ≥5 Elevated ≥10 Pre-1978 Population Total Percent 0-4 5-9 10-24 ≥25 Housing
1 5 Community 9-47 mo. Screened Screened N % N % N % N % N % N % Units
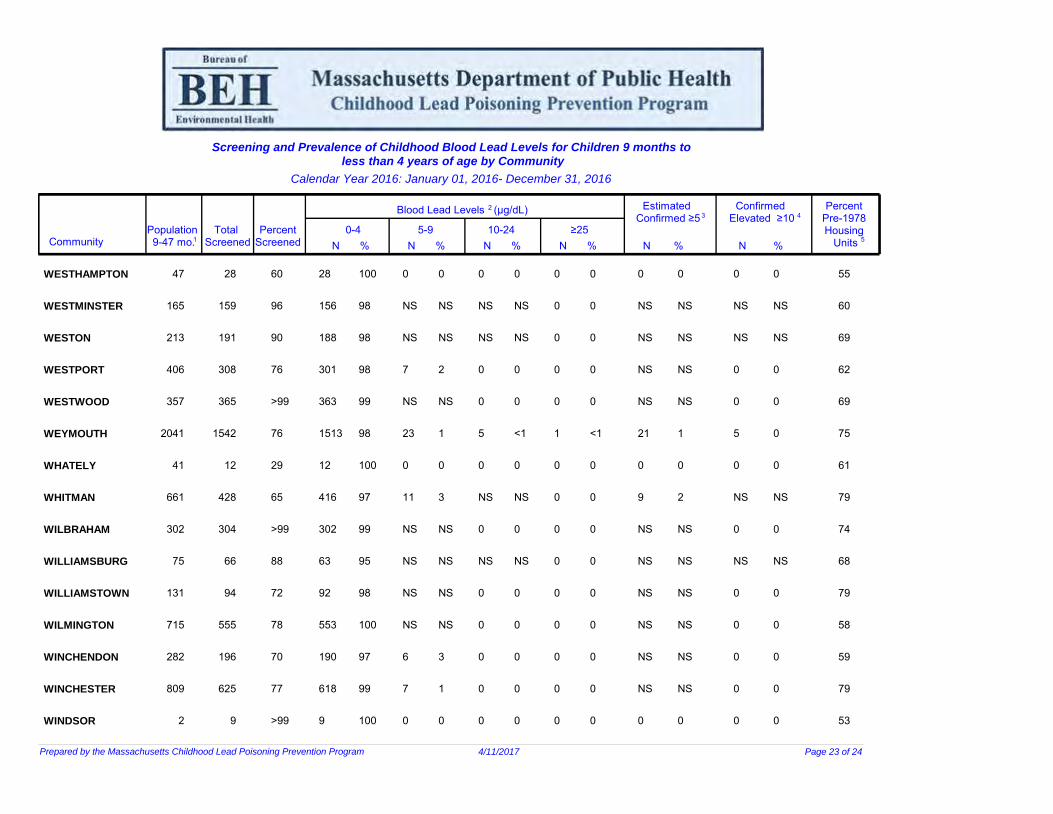
WESTHAMPTON 47 28 60 28 100 0 0 0 0 0 0 0 0 0 0 55
WESTMINSTER 165 159 96 156 98 NS NS NS NS 0 0 NS NS NS NS 60
WESTON 213 191 90 188 98 NS NS NS NS 0 0 NS NS NS NS 69
WESTPORT 406 308 76 301 98 7 2 0 0 0 0 NS NS 0 0 62
WESTWOOD 357 365 >99 363 99 NS NS 0 0 0 0 NS NS 0 0 69
WEYMOUTH 2041 1542 76 1513 98 23 1 5 <1 1 <1 21 1 5 0 75
WHATELY 41 12 29 12 100 0 0 0 0 0 0 0 0 0 0 61
WHITMAN 661 428 65 416 97 11 3 NS NS 0 0 9 2 NS NS 79
WILBRAHAM 302 304 >99 302 99 NS NS 0 0 0 0 NS NS 0 0 74
WILLIAMSBURG 75 66 88 63 95 NS NS NS NS 0 0 NS NS NS NS 68
WILLIAMSTOWN 131 94 72 92 98 NS NS 0 0 0 0 NS NS 0 0 79
WILMINGTON 715 555 78 553 100 NS NS 0 0 0 0 NS NS 0 0 58
WINCHENDON 282 196 70 190 97 6 3 0 0 0 0 NS NS 0 0 59
WINCHESTER 809 625 77 618 99 7 1 0 0 0 0 NS NS 0 0 79
WINDSOR 2 9 >99 9 100 0 0 0 0 0 0 0 0 0 0 53
Prepared by the Massachusetts Childhood Lead Poisoning Prevention Program 4/11/2017 Page 23 of 24
Estimated Confirmed Percent Blood Lead Levels 2 (µg/dL) 3 4 Confirmed ≥5 Elevated ≥10 Pre-1978 Population Total Percent 0-4 5-9 10-24 ≥25 Housing
1 5 Community 9-47 mo. Screened Screened N % N % N % N % N % N % Units
WINTHROP 564 479 85 463 97 14 3 NS NS 0 0 10 2 NS NS 90
WOBURN 1591 1141 72 1108 97 29 3 NS NS NS NS 20 2 NS NS 72
WORCESTER 8108 5929 73 5708 96 192 3 28 <1 1 <1 200 3 29 0 79
WORTHINGTON 10 13 >99 10 77 NS NS 0 0 0 0 NS NS 0 0 70
WRENTHAM 271 262 97 259 99 NS NS 0 0 0 0 NS NS 0 0 46
YARMOUTH 660 413 63 401 97 12 3 0 0 0 0 NS NS 0 0 68
Total for MA 227,918 175,354 77 170,862 97 3,806 2 629 <1 57 <1 3,500 2 651 <1 71
Comments:
N = number (counts of children) NS = number or prevalence is not shown when N is between 1-5 and total screened is less than 1,200. These small numbers are suppressed to protect privacy.
Footnotes:
1According to MA state regulation (105 CMR 460.050) children are not required to be screened until 9 months of age. Population count is obtained from 2016 extrapolations of the US Census Burea's 2000 and 2010 population estimates and includes children 9 to 47 months of age.
2Blood lead levels include both confirmed and unconfirmed blood lead specimens. Refer to the data description for definitions and practice guidelines.
3 The CDC uses a reference level of 5 µg/dL to identify children whose blood lead levels are higher than 97.5% of all U.S. children's levels, based on the National Health and Nutrition Examination Survey (NHANES). There is no safe blood lead level. The number of children with estimated
confirmed ≥5 µg/dL blood lead levels is calculated as the sum of those with confirmed blood lead levels ≥5 µg/dL and a proportion of those having unconfirmed blood lead levels ≥5 µg/dL.
4 MA CLPPP defines a confirmed elevated blood lead level as a single venous blood specimen ≥10 µg/dL or 2 capillary blood specimens ≥10 µg/dL drawn within 12 weeks of each other.
5 Percentage of housing units built prior to 1978 as estimated by the 2011-2015 American Community Survey.
Screening and Prevalence of Childhood Blood Lead Levels for Children 9 months to less than 4 years of age by Community
Calendar Year 2016: January 01, 2016- December 31, 2016
Prepared by the Massachusetts Childhood Lead Poisoning Prevention Program 4/11/2017 Page 24 of 24


![Hepatitis screening Chinese [Kompatibilitetstilstand] 2014/Oral presentations...collaboration with the Chinese community High prevalence of hepatitis B infections (6%) Low prevalence](https://img.pdfslide.us/doc/110x75/5e175694a1c2c52b8c4f477f/hepatitis-screening-chinese-kompatibilitetstilstand-2014oral-presentationscollaboration.jpg)