Embed Size (px)
Citation preview
Methods 50 (2010) S10–S14
Contents lists available at ScienceDirect
Methods
journal homepage: www.elsevier .com/locate /ymeth
Application Note
ScreenClust: Advanced statistical software for supervised and unsupervised highresolution melting (HRM) analysis q
Valin Reja a, Alister Kwok b, Glenn Stone c, Linsong Yang b, Andreas Missel d, Christoph Menzel d,*,Brant Bassam e
a Bio Republic, 14 Birriwa Street Greystanes, NSW 2145, Australiab Corbett Research (a QIAGEN Company), 14 Hilly Street, Mortlake, NSW 2137, Australiac CSIRO Mathematical and Information Sciences, Locked Bag 17, North Ryde, NSW 1670, Australiad QIAGEN GmbH, Qiagenstrasse 1, Hilden, Germanye P.O. Box 408, Winton, Qld 4735, Australia
a r t i c l e i n f o
Article history:Accepted 5 February 2010Available online 8 February 2010
Human genes:Factor V Leiden
Keywords:High resolution meltingPrincipal component analysisk-MeansCluster analysisLinear discriminant analysisPosterior class probabilitiesTypicalitiesSoftwareScreenClust
1046-2023/$ - see front matter � 2010 Published bydoi:10.1016/j.ymeth.2010.02.006
Abbreviations: HRM, high resolution melting; SNPphism; PC, principle component; LDA, linear disctemplate control.
q This application note has been provided by Qiagenmaterial to this thematic special issue. This applicaQiagen and has not undergone a peer review process
* Corresponding author. Address: QIAGEN Strasse 1E-mail address: [email protected] (C.
a b s t r a c t
Background: High resolution melting (HRM) is an emerging new method for interrogating and character-izing DNA samples. An important aspect of this technology is data analysis. Traditional HRM curves canbe difficult to interpret and the method has been criticized for lack of statistical interrogation and arbi-trary interpretation of results. Methods: Here we report the basic principles and first applications of a newstatistical approach to HRM analysis addressing these concerns. Our method allows automated genotyp-ing of unknown samples coupled with formal statistical information on the likelihood, if an unknownsample is of a known genotype (by discriminant analysis or ‘‘supervised learning”). It can also determinethe assortment of alleles present (by cluster analysis or ‘‘unsupervised learning”) without a priori knowl-edge of the genotypes present. Conclusion: The new algorithms provide highly sensitive and specific auto-calling of genotypes from HRM data in both supervised an unsupervised analysis mode. The method isbased on pure statistical interrogation of the data set with a high degree of standardization. The hypoth-esis-free unsupervised mode offers various possibilities for de novo HRM applications such as mutationdiscovery.
� 2010 Published by Elsevier Inc.
1. Introduction
High resolution melting (HRM) is a new method for monitoringDNA dissociation (‘‘melting”) kinetics. HRM is an entirely closed-tube procedure requiring only a generic DNA intercalation dye.As double-stranded DNA samples (for HRM analysis typically PCRproducts) dissociate with increasing temperature, dye is progres-sively released and fluorescence diminishes. Fluorescent measure-ments are collected at corresponding temperature increments andplotted as a ‘‘melt curve”. Curve shape and position are character-
Elsevier Inc.
, single nucleotide polymor-riminant analysis; NTC, no
as supplemental educationaltion note was sponsored bywithin Elsevier., 40724 Hilden, Germany.Menzel).
istic of each sample allowing them to be compared and discrimi-nated. Even a single base change between samples can be readilydetected and identified [1,2].
HRM discriminates genotypes by comparing the relative posi-tion and shape of melt curves [2]. These changes reflect a sample’sDNA sequence, random generation of heteroduplexes (i.e., mis-matched strand duplexes that occur in samples containing morethan one sequence variant), buffer conditions, and other reactionvariables [1,2].
Enhanced and automated HRM data processing methods areneeded, particularly for larger sample cohorts. Current HRM soft-ware plots variations in melt curve shape and position, however,the ability to statistically quantify differences is not supported.At present, the data analysis procedure typically uses melt curvefluorescence normalization followed by a simple subtraction (dif-ference) plot generated from a known control sample. Althoughthe method allows automated genotyping, no formal statisticalinformation is provided to indicate the likelihood an unknownsample is of a known genotype (discriminant analysis or ‘‘super-
V. Reja et al. / Methods 50 (2010) S10–S14 S11
vised learning”) nor do current methods allow the number of al-leles present to be determined (cluster analysis or ‘‘unsupervisedlearning”), useful in the discovery of new sequence variants.
Here we describe algorithms for reliable and relevant auto-mated genotyping of HRM data in supervised and unsupervisedmode using a set of advanced statistical methods such as principalcomponent analysis in a software package we call ScreenClust.
2. Materials and methods
2.1. HRM data sets
All analyses were performed with a prototype version of theScreenClust software package (Rotor-Gene ScreenClust HRM Soft-ware, QIAGEN, Hilden, Germany). Three HRM data sets were usedto investigate the new algorithms. All of them were generated ona Rotor-Gene Q 5plex HRM instrument (QIAGEN, Hilden, Germany)using 25 lL reaction volumes. These included: (A) 32 known repli-cates for alleles of the human factor V Leiden (G1691A) polymor-phism and a SYBR Green based master mix, 300 nM each primerand 25 ng template DNA. (B) Five replicates of each allele of a syn-thetic and challenging Class IV (A to T) SNP template, run with Eva-Green fluorescent intercalating dye (Biotium, Hayward, USA),300 nM each primer and 20 ng template. (C) Three replicates ofeach of five allele ratios of the factor V Leiden (G1691A) polymor-phism (percentage mutation to wild type; 2.5%, 5%, 10%, and 50%)along with the wild type and mutation controls, run with 1� SYTO-9 fluorescent green intercalating dye (Invitrogen, Carlsbad, USA),300 nM each primer and 25 ng template.
2.2. Analysis workflow
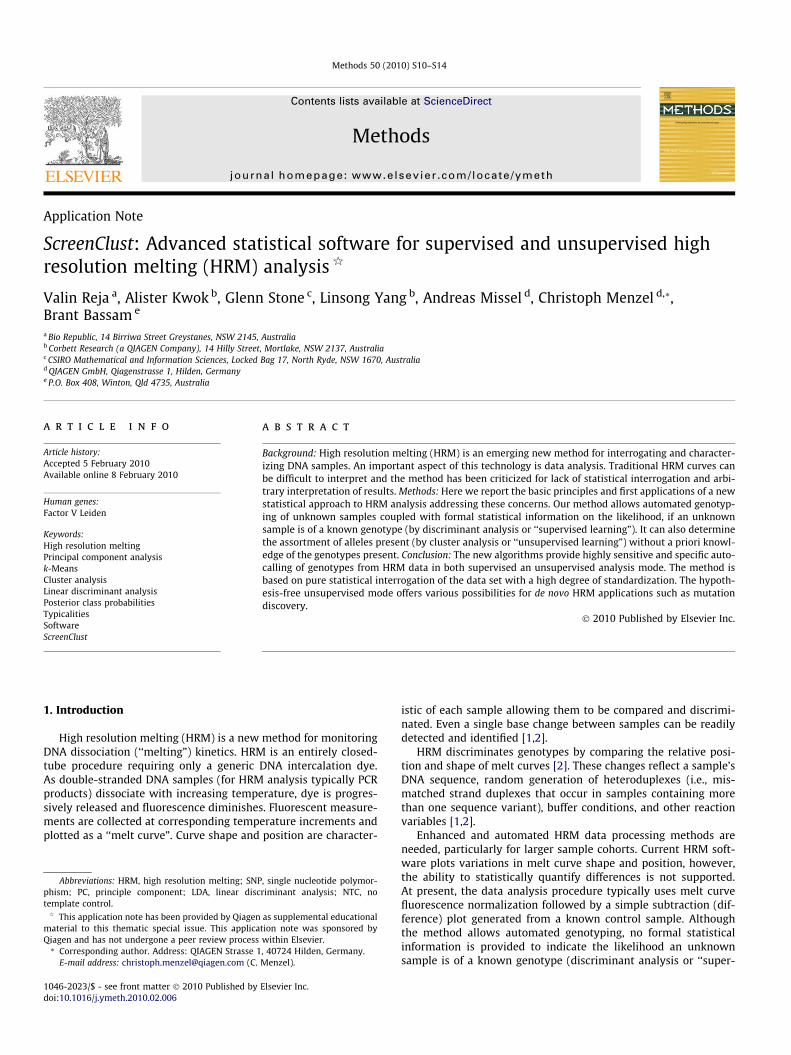
The workflow of the analysis procedure with all processingsteps is depicted in Fig. 1. The following sections detail the stepsperformed.
Fig. 1. Processing and analysis workflow in the
2.3. Normalization
Any HRM analysis requires the normalization of the start andend fluorescence, as differences in raw fluorescence can be inducedby various factors in the PCR and HRM process, e.g., differentamounts of total DNA present for amplicons and template. In thisstudy, HRM curves were normalized using two different methodsin order to determine which method provides the best representa-tion of known genotypes particularly for unsupervised clusteranalysis.
The first method applies curve scaling to a line of best fit suchthat the highest fluorescence value was equal to 100 and the low-est to zero. A region prior to and following melt curve transition isselected to calculate average fluorescence and slope of the curveand applied in the normalization.
The second method fits an idealized model of a double-strandedmelt curve using Levenberg–Marquardt least-squares estimationof non-linear parameters [3]. The idealized model was adaptedfrom the ideal melt curve described by Azbel [4] amended byparameters describing background noise and fluorescence changesdue to temperature, which are typically observed in HRM meltcurves (see Supplemental material for details of the fittingfunctions).
Both methods of normalization were compared using two HRMdata sets containing various types of alleles of differing fragmentlength and complexity of sequence.
2.4. Data processing and principal component analysis
To accentuate differences between individual samples, normal-ized melt curves are first differentiated in ScreenClust. Followingthis, a residual plot is generated by subtracting all the differenti-ated curves by the composite median of all curves (see Fig. 1).The residual plot is used as the data basis for a form of principalcomponent analysis to extract a set of features for each curve. Prin-cipal component analysis selects the linear combination of the datavector that shows the most variation among the samples as the
ScreenClust software (see text for details).
ºC71 72 73 74 75 76 77 78 79 80 81 82 83
Nor
mal
ised
Flu
ores
cenc
e
100
80
60
40
20
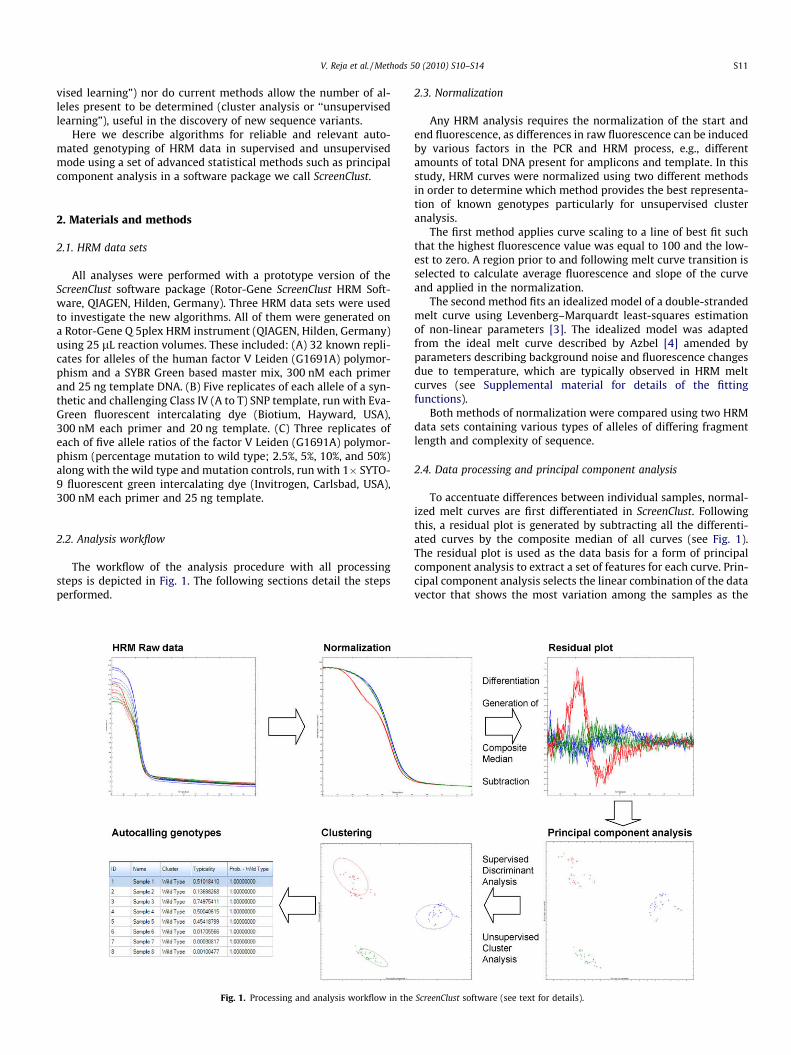
Fig. 2A. Normalized HRM curves of four allelic ratios of the factor V Leiden(G1691A) polymorphism (from 5% to 100%) as well as wild type and heterozygoussamples using the fluorescence scaling to a line of best fit normalization. The curveshave minimal curve shape topography, especially for allelic ratios of less then 10%.
S12 V. Reja et al. / Methods 50 (2010) S10–S14
first principal component (PC) [5]. Subsequent PCs account for asmuch of the remaining variability as possible. For most HRM datasets only up to the first three PCs are required in our experience asmost of the remaining variance in the other PCs will be attributedto uninteresting variation or noise (data not shown). The selectionof the appropriate number of PCs to use is described below.
2.5. Supervised discriminant analysis of data with known controls
Classification of unknown samples into known groups usingknown samples as controls was achieved using linear discriminantanalysis (LDA). LDA arises as the optimal classifier when the datahave a multivariate normal distribution, and each class has thesame covariance matrix but differing means [6]. Using the controlsamples, LDA calculates a cluster distribution. The center of thecluster is set as the mean of the controls.
Unknown samples are allocated to a cluster based on theirproximity to the mean points of the controls (see Supplementalmaterial for more mathematical details). When the number of con-trols in each group is P2, then LDA can be applied formally. How-ever, it would be desirable to have more known samples than this(i.e., P4 controls per group).
If only one control is provided per cluster, a nearest neighborcalculation is used by allocating the samples to a cluster basedon their proximity to the control.
The choice of PC dimensionality using a supervised data set isachieved using a cross-validation to find the number of PCs thatproduces the lowest number of misclassifications. Cross-validationinvolves leaving a known sample, and using the remainder to builda classifier. The left out observation is then classified and any errorcounted. This process is repeated for two and three PCs and thedimensionality with the lowest error rate chosen.
2.6. Unsupervised cluster analysis without known controls
The aim of unsupervised cluster analysis is to find de novo datagroups without a priori knowledge on the number and kind ofgenotypes present in the data set. To achieve such a hypothesisfree analysis we selected the method of k-means cluster analysis.k-Means undergoes an iterative process where clusters are gener-ated by choosing k random cluster centers and allocating samplesto clusters. The ideal cluster configuration for k clusters is the onewhere the within cluster sum of squares is minimized [7].
Alone, k-means is unable to determine the number of clusters;rather it defines clusters based on a given number of clusters. Todetermine a choice of the number of clusters we combine k-meanswith the Gap statistic [8]. The idea is to look at a measure of clusterquality and compare it to that of a simulated data set known to nothave any real clusters (see Supplemental material for more detailson the implementation of k-means and the gap statistics inScreenClust).
2.7. Posterior class probabilities and typicalities
Posterior class probabilities are the probabilities that each sam-ple is a member of each group assuming that the sample is a mem-ber of one of the groups. An unknown sample would be allocated tothe group with the largest posterior class probability.
Posterior class probabilities tell us which group a sample ismost likely a member of, given that it is a member of at leastone of them.
An additional typicality index tells us how consistent a sampleis within its own group, i.e., the typicality measures how well asample fits into its assigned cluster (for details of the calculationof posterior probabilities and typicalities see Supplementalmaterial).
2.8. ScreenClust software
Raw HRM data from the Rotor-Gene operating software are im-ported into ScreenClust software directly using the .rex file format,with syntactic analysis (parsing) to ensure the correct data is ana-lyzed. The overall analysis procedure is guided by a software wiz-ard and default values allowing, if desired, the standardizedgeneration of a genotyping result with only one operator selectionfor ‘‘supervised” or ‘‘unsupervised” mode. All no template controls(NTC) and unnamed samples are automatically removed from theanalysis as the lack of melt curve features affects the normaliza-tion. Following sample selection, the user can select between ana-lyzing supervised or unsupervised data sets.
Choosing ‘‘supervised” allows the appropriate controls for eachgenotype to be selected. If more than two controls were used foreach group, LDA is used and the appropriate number of PC deter-mined via the cross-validation function. Having only one controlwould activate the nearest neighbor classification of samples intogroups.
Selecting ‘‘unsupervised” enables the k-means clustering andGap statistic algorithms, with the software selecting the mostappropriate cluster number and PC number to use.
The clusters are graphically plotted using the loading scores ofeach PC for all samples (e.g., PC1 vs. PC2) for both supervisedand unsupervised methods. An ellipsoid representing clustercovariances following classification is also drawn. Unknown sam-ples are classified into each cluster group with posterior probabil-ities and typicalities being calculated for all samples.
3. Results
3.1. Evaluation of normalization methods
Using the normalization process of fluorescence scaling to a lineof best fit we observed that the data retained most of the curve fea-tures post normalization whereas the idealized Levenberg–Marqu-ardt fitting algorithm resulted in the characteristic heteroduplexcurve double inflection to disappear (see Supplemental material).The clustering and calling of unknown samples and clusters wasnevertheless effective for most data sets and both normalizationmethods. However, for one of our data sets containing difficult toresolve allelic ratios, down to as low as 2.5%, of the factor V Leidenpolymorphism, loss of curve features following normalizationusing the idealized model algorithm did result in incorrect cluster-
Nor
mal
ised
min
us A
A
0
-1
-2
-3
-4
-5
V. Reja et al. / Methods 50 (2010) S10–S14 S13
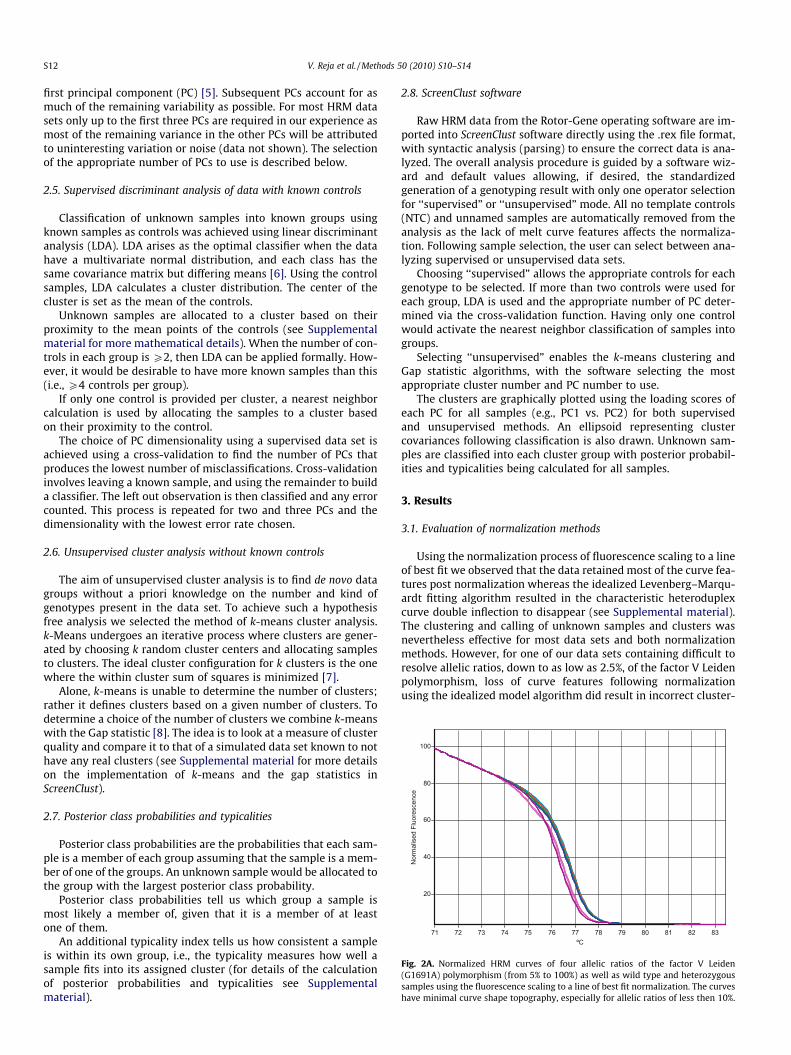
ing and calling of pseudo-unknowns using unsupervised analysis(data not shown). Using the fluorescence scaling to a line of bestfit model for this data set, all clusters and samples were called cor-rectly with high posterior probabilities and typicalities in unsuper-vised mode (Fig. 2A, B).
3.2. Class IV SNP genotyping
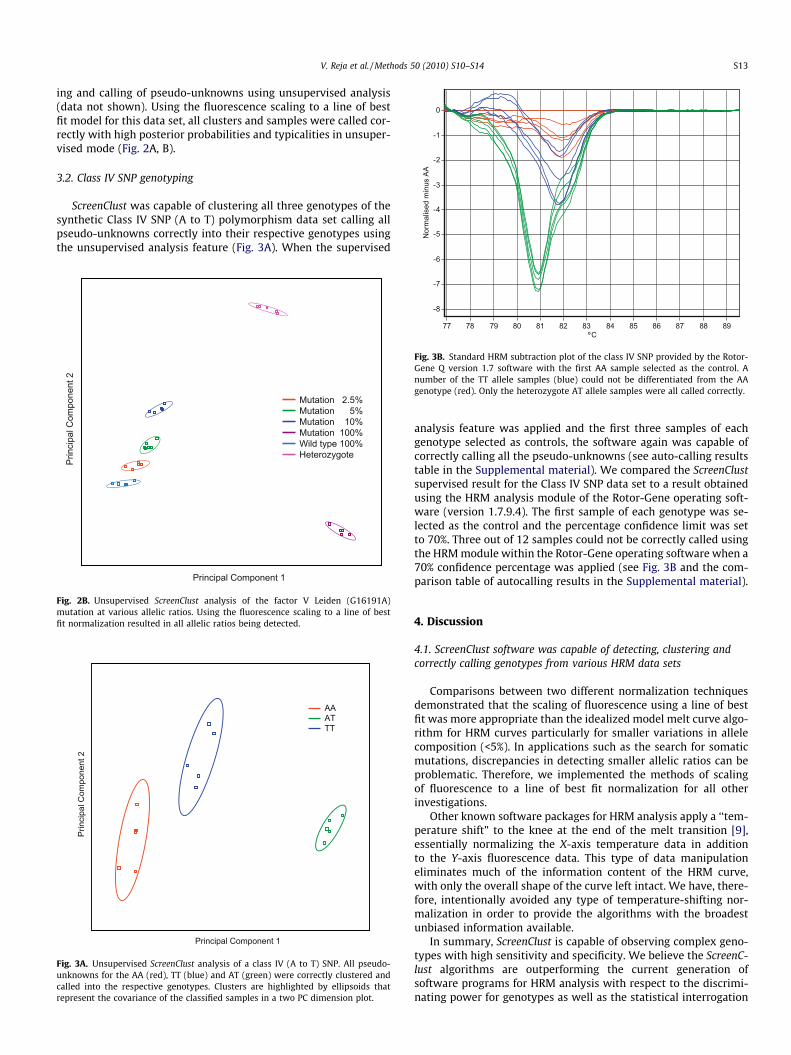
ScreenClust was capable of clustering all three genotypes of thesynthetic Class IV SNP (A to T) polymorphism data set calling allpseudo-unknowns correctly into their respective genotypes usingthe unsupervised analysis feature (Fig. 3A). When the supervised
Prin
cipa
l Com
pone
nt 2
Principal Component 1
Mutation 2.5%Mutation 5%Mutation 10%Mutation 100%Wild type 100%Heterozygote
Fig. 2B. Unsupervised ScreenClust analysis of the factor V Leiden (G16191A)mutation at various allelic ratios. Using the fluorescence scaling to a line of bestfit normalization resulted in all allelic ratios being detected.
Prin
cipa
l Com
pone
nt 2
Principal Component 1
AAATTT
Fig. 3A. Unsupervised ScreenClust analysis of a class IV (A to T) SNP. All pseudo-unknowns for the AA (red), TT (blue) and AT (green) were correctly clustered andcalled into the respective genotypes. Clusters are highlighted by ellipsoids thatrepresent the covariance of the classified samples in a two PC dimension plot.
ºC77 78 79 80 81 82 83 84 85 86 87 88 89
-6
-7
-8
Fig. 3B. Standard HRM subtraction plot of the class IV SNP provided by the Rotor-Gene Q version 1.7 software with the first AA sample selected as the control. Anumber of the TT allele samples (blue) could not be differentiated from the AAgenotype (red). Only the heterozygote AT allele samples were all called correctly.
analysis feature was applied and the first three samples of eachgenotype selected as controls, the software again was capable ofcorrectly calling all the pseudo-unknowns (see auto-calling resultstable in the Supplemental material). We compared the ScreenClustsupervised result for the Class IV SNP data set to a result obtainedusing the HRM analysis module of the Rotor-Gene operating soft-ware (version 1.7.9.4). The first sample of each genotype was se-lected as the control and the percentage confidence limit was setto 70%. Three out of 12 samples could not be correctly called usingthe HRM module within the Rotor-Gene operating software when a70% confidence percentage was applied (see Fig. 3B and the com-parison table of autocalling results in the Supplemental material).
4. Discussion
4.1. ScreenClust software was capable of detecting, clustering andcorrectly calling genotypes from various HRM data sets
Comparisons between two different normalization techniquesdemonstrated that the scaling of fluorescence using a line of bestfit was more appropriate than the idealized model melt curve algo-rithm for HRM curves particularly for smaller variations in allelecomposition (<5%). In applications such as the search for somaticmutations, discrepancies in detecting smaller allelic ratios can beproblematic. Therefore, we implemented the methods of scalingof fluorescence to a line of best fit normalization for all otherinvestigations.
Other known software packages for HRM analysis apply a ‘‘tem-perature shift” to the knee at the end of the melt transition [9],essentially normalizing the X-axis temperature data in additionto the Y-axis fluorescence data. This type of data manipulationeliminates much of the information content of the HRM curve,with only the overall shape of the curve left intact. We have, there-fore, intentionally avoided any type of temperature-shifting nor-malization in order to provide the algorithms with the broadestunbiased information available.
In summary, ScreenClust is capable of observing complex geno-types with high sensitivity and specificity. We believe the ScreenC-lust algorithms are outperforming the current generation ofsoftware programs for HRM analysis with respect to the discrimi-nating power for genotypes as well as the statistical interrogation
S14 V. Reja et al. / Methods 50 (2010) S10–S14
and interpretation of the sample set. In this context, it should benoted that the new algorithms offer a completely orthogonal ap-proach for HRM analysis software for independent validation andverification of HRM assays developed with the standard HRM anal-ysis approach. Furthermore, it is the first software that allows forthe detection and statistical analysis of unsupervised HRM datasets. This feature is highly advantageous to investigators attempt-ing to discover new polymorphisms. However, the sensitive algo-rithms may also easily find and cluster artifacts as individualpseudo-genotypes such as deviations in the master mix composi-tions (unpublished results). This, on one hand, allows monitoringthe quality of the HRM procedure with every run, but, on the otherhand, emphasizes the need also for highly standardized and reli-able reaction conditions for the applied reagents and the melt ana-lyzer for a successful HRM analysis.
The unsupervised mode is also the method of choice, if not forall putative genotypes in the data set controls are available. Thepartial set of controls is then employed as pseudo-unknowns inunsupervised mode. These controls and the corresponding samplesof the same genotype will form a cluster whereas a new polymor-phism will separate in another cluster.
Here we have shown first examples of the ScreenClust algo-rithms for SNP genotyping, respectively, mutation discovery, but
we believe that the approach also offers interesting possibilitiesfor other HRM applications such as the detailed analysis of inser-tions and deletions, pathogen detection but also methylationanalysis.
Appendix A. Supplementary data
Supplementary data associated with this article can be found, inthe online version, at doi:10.1016/j.ymeth.2010.02.006.
References
[1] K.M. Ririe, R.P. Rasmussen, C.T. Wittwer, Anal. Biochem. 245 (1997) 154–160.[2] C.T. Wittwer, G.H. Reed, C.N. Grundry, J.G. Vandersteen, R.J. Pryor, Clin. Chem. 49
(2003) 853–860.[3] D.W. Marquardt, J. Soc. Ind. Appl. Math. 11 (1963) 431–441.[4] M. Azbel, Proc. Natl. Acad. Sci. USA 76 (1979) 101–105.[5] I. Jolliffe, Principle Component Analysis, second ed., Springer, New York, 2002.[6] J. Ye, T. Li, T. Xiong, R. Janardan, IEEE/ACM Trans. Comput. Biol. Bioinform. 1
(2004) 181–190.[7] J.A. Hartigan, M.A. Wong, Appl. Stat. 28 (1979) 1000–1008.[8] R. Tibshirani, G. Walther, T. Hastie, Estimating the number of clusters in a data
set via the gap statistic, J.R. Stat. Soc. 63 (2001) 411–423.[9] M.G. Herrmann, J.D. Durtschi, L.K. Bromley, C.T. Wittwer, K.V. Voelkerding,
Amplicon DNA melting analysis for mutation scanning and genotyping: cross-platform comparison of instruments and dyes, Clin. Chem. 52 (2006) 494–503.