Embed Size (px)
Citation preview
Calhoun: The NPS Institutional Archive
Theses and Dissertations Thesis Collection
2000-03-01
Screen dispositions of Naval Task Forces against
Anti-Ship Missiles
Aydin, Erhan.
Monterey, California. Naval Postgraduate School
http://hdl.handle.net/10945/7785


^EY K^0X LIBRARYNAVALPOSTGRAOUATFo,..MONTEREY CA flaSSS^


NAVAL POSTGRADUATE SCHOOLMONTEREY, CALIFORNIA
THESIS
SCREEN DISPOSITIONS OF NAVAL TASKFORCES AGAINST ANTI-SHIP MISSILES
By
Erhan Aydin
March 2000
Thesis Advisor:
Second Reader:
Arnold H.
Douglas J
Buss
Mackinnon
Approved for public release; distribution is unlimited.


REPORT DOCUMENTATION PAGE Form Approved OMB No. 0704-0188
Public reporting burden for this collection of information is estimated to average 1 hour per response, including the time for reviewing instruction, searching
existing data sources, gathering and maintaining the data needed, and completing and reviewing the collection of information. Send comments regarding this burden
estimate or any other aspect of this collection of information, including suggestions for reducing this burden, to Washington headquarters Services, Directorate for
Information Operations and Reports, 1215 Jefferson Davis Highway, Suite 1204, Arlington, VA 22202-4302, and to the Office of Management and Budget,
Paperwork Reduction Project (0704-0188) Washington DC 20503.
1. AGENCY USE ONLY (Leave blank) 1. REPORT DATEMarch 2000
3. REPORT TYPE AND DATES COVEREDMaster's Thesis
4. TITLE AND SUBTITLE
Screen Dispositions of Naval Task Forces Against Anti-Ship Missiles
5. FUNDING NUMBERS
6. AUTHOR(S)
Aydin. Erhan
7. PERFORMING ORGANIZATION NAME(S) AND ADDRESS(ES)
Naval Postgraduate School Monterey, CA 93943-5000
8. PERFORMING ORGANIZATION REPORT NUMBER
9. SPONSORING / MONITORING AGENCY NAME(S) AND ADDRESS(ES) 10. SPONSORING/MONITORINGAGENCY REPORTNUMBER
11. SUPPLEMENTARY NOTESThe views expressed in this thesis are those of the authors and do not reflect the official policy or position of the Department of
Defense or the U.S. Government.
12a. DISTRIBUTION / AVAILABILITY STATEMENTApproved for public release; distribution is unlimited.
12b. DISTRIBUTION CODE
13. ABSTRACT (maximum 200 words)
Ship defense in convoy operations against Anti-Surface Missiles (ASM) has been an important aspect of Naval Warfare for the
last two decades. Countries in a state of conflict often conduct threatening operations in their own territories in order to slow or stop
the enemy merchant ship traffic through the straits or littoral waters. Such littoral scenarios, the quantity and capability of ASM'?in non-NATO countries pose a significant threat to the safe operation of the NATO forces in the waters off of potentially hostile
shores. In these operations the goals of the tactical commander are to design an optimal reaction platform (formation) and tc
determine an optimal strategy that will help him in multi-threat encounters. The scope and design in most anti-air warfare studies
have been limited to evaluating the effectiveness of detecting sensors and weapon systems in a regular screen formation. The
proposed model's (Disposition Mission Model - DMM) characterization, however, is based on how to perform an effective
defensive disposition from a task force. In DMM we focus on usage of a graphical user interface and provide a user-friendly
environment for analyzing new tactics in screen formations. The model, with its user interface, allows the user to build and run a
convoy simulation, and see the results comparatively on the same interface. The analysis using this model has yielded significant
insights towards the defense of a convoy by way of regression methods. It has been seen that positioning the escort ships within the
threat sector reduces the damage on the HVU and also balances the defensive load of each defense ship for the incoming missiles
The model, with its graphical interface and simulation components, provides an initial approach for future analysts, not only in
anti-air warfare defense of screen formations, but also in the areas of anti-surface and anti-submarine warfare. H14. SUBJECT TERMS
Littoral Arena, Disposition, Tactics, Simulation, Graphical User Interface, Swing
15. NUMBER OF PAGES
16. PRICE CODE
17. SECURITY CLASSIFICATIONOF REPORT
Unclassified
18. SECURITY CLASSIFICATIONOF THIS PAGE
Unclassified
19. SECURITY CLASSIFICATIONOF ABSTRACT
Unclassified
20. LIMITATION C
ABSTRACTUL
NSN 7540-01-280-5500 Standard Form 298 (Rev. 2-89)
Prescribed by ANSI Std. 239-18 298-102

11

Approved for public release; distribution is unlimited
SCREEN DISPOSITIONS OF NAVAL TASK FORCES AGAINSTANTI-SHIP MISSILES
Erhan Aydin
Lieutenant Junior Grade, Turkish NavyB.S., Turkish Naval Academy, 1994
Submitted in partial fulfillment of the
requirements for the degree of
MASTER OF SCIENCE IN OPERATIONS RESEARCH
from the
NAVAL POSTGRADUATE SCHOOLMar^h 2000


JUDLfcV KNOX L»Btj*A«>
NAVAL POSTGRADUATE $QtiMONTEREY CA 93943-51
ABSTRACT
Ship defense in convoy operations against Anti-Surface Missiles (ASM) has been
an important aspect of Naval Warfare for the last two decades. Countries in a state of
conflict often conduct threatening operations in their own territories in order to slow or
stop the enemy merchant ship traffic through the straits or littoral waters. Such littoral
scenarios, the quantity and capability of ASM's in non-NATO countries pose a
significant threat to the safe operation of the NATO forces in the waters off of potentially
hostile shores. In these operations the goals of the tactical commander are to design an
optimal reaction platform (formation) and to determine an optimal strategy that will help
him in multi-threat encounters. The scope and design in most anti-air warfare studies
have been limited to evaluating the effectiveness of detecting sensors and weapon
systems in a regular screen formation. The proposed model's (Disposition Mission Model
- DMM) characterization, however, is based on how to perform an effective, defensive
disposition from a task force. In DMM we focus on usage of a graphical user interface
and provide a user-friendly environment for analyzing new tactics in screen formations.
The model, with its user interface, allows the user to build and run a convoy simulation,
and see the results comparatively on the same interface. The analysis using this model
has yielded significant insights towards the defense of a convoy by way of regression
methods. It has been seen that positioning the escort ships within the threat sector reduces
the damage on the HVU and also balances the defensive load of each defense ship for the
incoming missiles. The model, with its graphical interface and simulation components,
provides an initial approach for future analysts, not only in anti-air warfare defense of
screen formations, but also in the areas of anti-surface and anti-submarine warfare.

VI

THESIS DISCLAIMER
The reader is cautioned that the computer programs developed in this research
may not have been exercised for all cases of interest. While every effort has been made,
within the time available, to ensure that the programs are free of computational and logic
errors, they cannot be considered validated. Any application of these programs without
additional verification is at the risk of the user.
Vll

Vlll

TABLE OF CONTENTS
I. INTRODUCTION 1
A. BACKGROUND AND PURPOSE 3
1. Graphical User Interface (GUI) 5
2. Simulation 5
B. OBJECTIVES 6
C. RESEARCH QUESTIONS 7
1. Initial Research Questions 7
2. Secondary Research Questions 8
D. METHODOLOGY 9
1. Modeling Methodology 9
2. Analysis Tool 10
3. Analysis Method 1
1
E. THESIS OUTLINE 12
II. CONVOY OPERATIONS 13
A. SCREEN FORMATION TACTICS IN WWII 14
B. MODERN SCREEN FORMATION TACTICS 15
C. SCREEN DISPOSITIONS 16
1. General Screen Disposition 17
2. Two Whiskey (2W) Disposition 18
D. SUMMARY 20
III. DISPOSITION MISSION MODEL (DMM) 21
A. METHODOLOGY 21
1. MODKIT and SLMKIT Packages 22
2. ASMD Package 23
3. Graphical User Interface 23
B. DMM'sGUI 24
1. Main Scenario Window 26
2. Simulation Running Window 37
C. DMM's SIMULATION (ASMD MODEL) 38
D. SUMMARY 39
IV. ANALYSIS USING DMM 41
A. MEASURES OF EFFECTIVENESS 41
B. INITIAL SCENARIO 42
1. Range and Bearing Factors 43
2. Regression Analysis 45
3. Improved Scenario 47
C. OTHER SCENARIOS 49
1. Two Screen Ships vs. Two ASM Sites 49
2. Three Screen Ships vs. Two ASM Sites 52
ix
D. DETAILED REGRESSION ANALYSIS 54
1. Hypothesis Test 55
2. Interpretation 57
E. TACTICS 59
1. Range vs. Bearing 60
2. More Than One Ship On Threat Sector 61
F. SUMMARY 62
V. CONCLUSIONS AND RECOMMENDATIONS 63
A. CONCLUSIONS 63
B. RESULTS OF THE ANALYSIS 64
C. DEVELOPMENT OF DMM 64
D. ADAPTATION OF DMM IN THE TURKISH NAVY 65
APPENDIX A. INI FILE INTERACTION IN DMM 67
APPENDIX B. ASMD MODEL 73
LIST OF REFERENCES 79
INITIAL DISTRIBUTION LIST 81
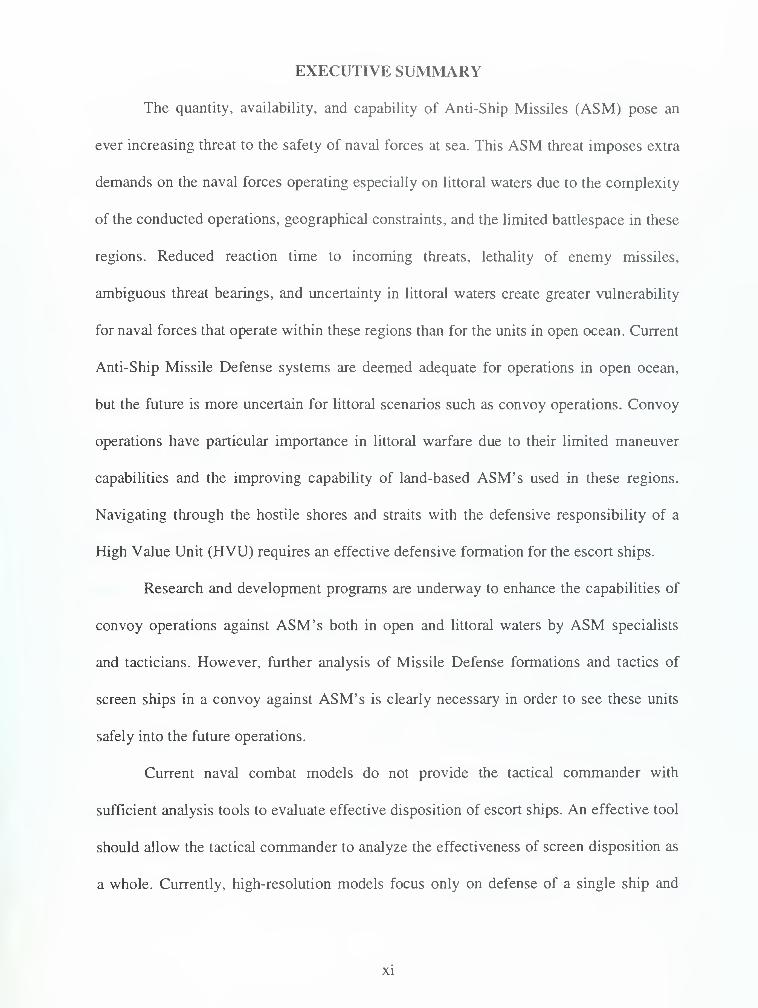
EXECUTIVE SUMMARY
The quantity, availability, and capability of Anti-Ship Missiles (ASM) pose an
ever increasing threat to the safety of naval forces at sea. This ASM threat imposes extra
demands on the naval forces operating especially on littoral waters due to the complexity
of the conducted operations, geographical constraints, and the limited battlespace in these
regions. Reduced reaction time to incoming threats, lethality of enemy missiles,
ambiguous threat bearings, and uncertainty in littoral waters create greater vulnerability
for naval forces that operate within these regions than for the units in open ocean. Current
Anti-Ship Missile Defense systems are deemed adequate for operations in open ocean,
but the future is more uncertain for littoral scenarios such as convoy operations. Convoy
operations have particular importance in littoral warfare due to their limited maneuver
capabilities and the improving capability of land-based ASM's used in these regions.
Navigating through the hostile shores and straits with the defensive responsibility of a
High Value Unit (HVU) requires an effective defensive formation for the escort ships.
Research and development programs are underway to enhance the capabilities of
convoy operations against ASM's both in open and littoral waters by ASM specialists
and tacticians. However, further analysis of Missile Defense formations and tactics of
screen ships in a convoy against ASM's is clearly necessary in order to see these units
safely into the future operations.
Current naval combat models do not provide the tactical commander with
sufficient analysis tools to evaluate effective disposition of escort ships. An effective tool
should allow the tactical commander to analyze the effectiveness of screen disposition as
a whole. Currently, high-resolution models focus only on defense of a single ship and
XI

cannot be easily extended to analyze the problem of screen defense as a whole.
Aggregated campaign models do not model either the process of detecting and firing of
missiles or defense ship reactions. A new model is clearly necessary to help the decision-
maker determine an optimal reaction tactic of positioning the screen ships of a convoy in
multi-threat encounters of littoral environments.
The Disposition Mission Model (DMM) was created as a simulation tool to
evaluate the effectiveness of different defense dispositions of a task force. In DMM the
analyst takes advantage of Graphical User Interface (GUI) to configure the scenarios, run
the simulation associated with the scenarios, and evaluate the results.
The simulation part of DMM, the Anti-Ship Missile Defense (ASMD) model, was
created by James R. Townsend at the Naval Postgraduate School as his Master's Thesis
in Operations Research "Defense of Naval Task Forces from Anti-Ship Missile Attack".
It supports realistic object movement simulation with a sophisticated mathematical
package. The object movement property of this enhanced simulation model was
combined with a user-friendly interface in DMM to design a modern combat model for
littoral scenarios. The advantages of the GUI in DMM are:
• Ease of use. Those who might not know the model can easily set a
scenario and run the model.
• To provide more quantitative information data necessary for the
comparative analysis.
• Capability to simulate a battle space with all entities (ships, sensors,
missiles etc.) necessary to form a convoy screen and the hostile elements
in a littoral map.
xn

Both exploratory and logit regression analyses utilizing the DMM have revealed
significant insights into screen defense of convoy operations. The analysis has shown
how to reduce the damage on the HVU and also balance the defensive load of each
defense ship for the incoming missiles by positioning the escort ships within the threat
sector. Placing the defense ships within the threat sector affects the defense more
positively than positioning them on the effective range necessary to cover the HVU.
The results derived from the analysis have also proved the concept that the more
screen ships the better defense of the convoy. However, it also showed that for small
navies that could not provide many defense ships per HVU, positioning the escort ships
within the threat sector would provide an effective defense as well.
The DMM is a powerful tool with its GUI and simulation components in the
analysis of screen defense disposition problems. The results obtained from the model are
intended to provide more qualitative information than precise quantitative results. The
model should be regarded as an initial approach to the future development of related
Operations Research topics. The modularity and scalability of the model enables the
future analysist to extend his work from the DMM and develop the model into new areas.
xin


I. INTRODUCTION
Naval forces of a nation are the major mobile units capable of operating
throughout the world seas. They primarily provide the continuance of several naval roles
and missions, such as sea control and maritime supremacy, and naval warfare efforts in
both war and peace time. Naval forces are also called on to maintain readiness in order to
conduct naval operations in littoral regions around the world. The littoral environment
and the potential enemy which may be encountered there impose new demands on the
naval forces. The conducted operations, geographical constraints, limited battlespace,
reduced reaction time to incoming threats, lethality of enemy missiles, ambiguous threat
bearings, and uncertainty equate to greater vulnerability for naval forces that operate
within these areas than in the open ocean.
Convoy operations have particular importance in littoral warfare due to their
limited maneuver capabilities. Navigating through the hostile shores and straits while
escorting a High Value Unit (HVU) requires an effective defense formation for the escort
ships.
The Turkish Navy, operating mostly in closed seas like the Aegean Sea and the
Black Sea, and the Allied Forces operating in the Adriatic and the Persian Gulf, are
indeed working in close proximity to potential adversaries that may possess weapon
systems capable of attacking these convoys at sea. The increasing potential hazard
presented by Anti-Ship Missiles (ASM's) to the naval forces is currently an
overwhelming threat. This threat will not likely change in the foreseeable future since
non-NATO countries, such as China and Russia, are making substantial improvements
toward the capabilities of their missile systems. Iraq, with its Soviet-built CSSC-3 and
Silkworm ASM's, and Iran, with China-built C-81's, are believed to pose a threat to U.S.
1

warships and the commercial ships in the Persian Gulf.
The U.S. Navy is without question the strongest in the world. No other nation can
challenge its ability to maintain sea control or threaten its maritime superiority, at least in
the foreseeable future. However, as the U.S. Navy shifts its strategy to include the littoral
arena and the support of land operations "from-the-sea", the primary threats to the force
within the littoral region, as in the open ocean, are again becoming land-based ASM
threats. Even though the U.S. Navy can obtain detailed information and intelligence over
a region via satellites, this ASM threat is still considered a big danger to the safety of its
convoy operations all around the world seas. Since this intelligence net does not exist for
smaller navies that are not supported by satellites, the increased availability and
capability of these weapons in hostile hands necessitates the analysis of defensive tactics.
The Turkish Navy is shifting its operational concept from a defensive role in its
surrounding seas (the Mediterranean Sea, Aegean Sea and Black Sea) to being a primary
contributor to the Allied Force's efforts. Recent operations, such as the humanitarian
rescue mission in Albania in 1998 performed together with the Standing Naval Forces of
Mediterranean ships (STANAVFORMED), active missions in the Adriatic for
interrogation of merchant traffic in the region, and convoy operations from/to Italy, are
all totally new to the Turkish Navy. Additionally, the crisis between Turkey and Greece
over the islands in the Aegean Sea is unfortunately evolving into a situation of armament
of Soviet-built ASM's on the islands. These threats, missions in NATO, and the plan of
owning an aircraft carrier in year 2010, reveal the fact that the Turkish Navy must change
its weapon systems and tactics necessary to enhance the capabilities and defense of its
future naval forces. Even though the new weapon systems for defensive purposes against
surface and subsurface missiles have begun to be installed on new ships, the research and

development programs for the new tactics are still underway. Current tactics used in
exercises and real operations evolved from experience, and most of the Allied Tactical
Publications were optimized for operations in non-littoral scenarios. These tactics still
seem usable for Anti-Submarine Warfare (ASW) and Anti-Surface Warfare (ASUW), but
not for Anti-Air Warfare (AAW) and related convoy operations due to the improving
capability of missiles used in these types of operations.
Tactical complexity is a peacetime problem and must be solved by the tacticians
before the war starts. However, the continuing pressure on tacticians to develop new
tactics with less cost and more certainty is making this process much more difficult.
There have been some debates among many ASM specialists about which methods are
superior and less costly in the development of new tactics. One method to estimate and
compare the effectiveness of convoy disposition tactics in multiple AAW scenarios is
through simulation. The training costs saved, the chance to test ideas cheaply, and the
operational insights gained can provide big rewards when applying well-developed
simulation methods. It allows flexibility, provides more certainty (even with stochastic
processes) and costs less compared to real testing and actual data collection from war
efforts. The purpose of this thesis, therefore, is to develop a tool that facilitates an
analysis about the new tactics in screen formations that can be adopted for the Turkish
Navy. Through the development of simulation components, as well as a comparative
analysis, a user-friendly graphic interface that demonstrates a real screen formation in
littoral waters will be produced.
A. BACKGROUND AND PURPOSE
For the purpose of this study, AAW is considered in its defensive role in naval
warfare. The effective use of sensors and weapon systems and the command and control
process, which are the most important aspects of the AAW, are all defensive supports to
the safety of ongoing operations.
AAW as a whole is a multidisciplinary field. Radar, command and control,
aerodynamics, infrared, fuzes, warheads, and control systems are combined in the process
of shooting at and destroying the surface threats in the defensive role. However, well-
formed defensive tactics, integrated with the systems mentioned above, ensure that ships
gain a cumulative benefit against the enemy. An effective disposition of the Task Force
(TF), for example, will enable the screen Task Force Commander (TFC or known as
OTC) to use his/her defensive capabilities in the best way and in the high readiness level
against air threats. Thus, forming the appropriate screen for the AAW against ASM's is a
very important operational decision for the naval tactical commanders. The appropriate
screen will help to regulate the usage and determine the most profitable disposition of
ships for the detection and the possible countering of enemy weapon systems.
As stated above, the basic decision problems for the tactical commander are to
design an optimal reaction formation, possibly consisting of different types of ships, and
to determine an optimal strategy that will help in multi-threat encounters. However, the
scope and design in most of the anti-air warfare studies has been limited to evaluating the
effectiveness of detecting sensors and weapon systems in a regular screen formation. The
proposed Disposition Mission Model (DMM) will be based on how to perform an
effective, defensive disposition from a given task force with respect to each ship's
weapon and sensor capabilities. This study is designed to help the decision-maker
determine the optimal force disposition in air defense of a convoy. In order to assist the
decision-maker, the scenario for each tactic is displayed by a user-friendly and interactive

environment, which the decision-maker (Task Force Commander-TFC) can visualize on
a littoral map.
1. Graphical User Interface (GUI)
The purpose of the Graphical User Interface (GUI) is actually to decorate the
simulation program with a user-friendly environment. The GUI in DMM is designed to
help the user in analyzing the effectiveness of the screen formations in an interactive map
environment (actual battle space). The GUI is also designed to display the results in a
comparative way on the same interface on which each scenario is depicted.
DMM's GUI is also intended to have a very robust and scalable design in order to
help the user who might have no idea of defense in convoy operations. The user does not
need to know even a computer programming language to execute a scenario and see the
simulation results in order to make the analysis. These features also help the future
analysts in designing new models, which can extend from the DMM.
Another important issue, which arises in the analysis of the simulation models, is
the fact that many different independent scenarios should be built and the simulatuion
associated with these scenarios should be run. Furthermore, the results of these runs must
be displayed in an orderly manner for later quantitative analyses. DMM's GUI provides
the user with all these essential tools. The usage of the GUI will be the major subject of
this thesis.
2. Simulation
There are three ways to study an air defense system scenario. One is to analyze
data from actual combat operations; another is to analyze data from controlled system-
level tests; and yet another is to analyze data from a simulation [Ref. 1].
The defense establishment of any nation will analyze air defense performance
(their own and that of their enemy) for lessons learned from actual combat use. The
information from such analyses is valuable, but not for determining whether existing
systems can do the job. It might be too late for that purpose after a conflict.
An analysis based on system-level test data has good credibility because the
actual software and hardware is used against live targets. However, safety considerations
and target performance limitations induce artificialities that can lead to erroneous
conclusions. Testing is also expensive and can investigate only a limited number of
system configurations and tactical scenarios.
Computer simulation of the air defense scenarios of a task force screen
formation/disposition allows greater flexibility - essentially unlimited testing. The
simulation results have varying degrees of credibility, depending on how simulation
fidelity, with respect to the actual system, is perceived. Overall, simulation has become a
more accepted and desirable method of analysis due to the increasing cost of operational
trials and complexities of defense systems.
For these reasons, in this thesis, simulation will be used to analyze the defensive
performance of various screen formations and tactics.
B. OBJECTIVES
It is recognized that many research and development programs are underway to
enhance the tactics of naval forces. In this study, the case of tactics for screen formations
is isolated from other cases since screen tactics can be expanded to cover different tactics
used in the ASW and the ASUW operations. In the DMM (Disposition Mission Model)
we will focus on usage of a graphical user interface and provide a user-friendly

environment for developing new tactics in screen formations against the land-based
AAW threats.
It is not the intention of the DMM to propose or build a comprehensive model of
maneuver warfare in this study. The environment that will be developed will facilitate the
exploration of multiple scenarios and architectures without relying on the veracity of a
single run. To manage this goal and to answer the questions about the efficiencies of
different screen dispositions in AAW, the thesis has the following objectives:
• To build a flexible, modular and expandable screen defense simulation
using MODKIT, SIMKTT and ASMD model (They will be covered in the
third chapter).
• To build a GUI that displays an actual littoral battlefield in which an HVU
escorted by screen ships can navigate, while providing the user with an
easily modifiable scenario.
• To analyze the result of each scenario by referring only to the GUI in
which the AAW simulation is run.
• To give a start and provide a base for the Turkish Navy in making war
games for convoy operations and other future missions.
• To provide a base for follow-on Operations Research (OR) thesis
researchers.
C. RESEARCH QUESTIONS
1. Initial Research Questions
The air defense system simulation can be a burden on the analyst if the designed
process is not properly prepared. It is vital that the model performs as intended over the

range of operational conditions to which it may be subjected by the decision-maker. The
model must also be suitable for different kinds of tactics and performances. The behavior
of the system can be determined by some particular details in the model: scenarios,
resolution of the model and the components that form the model. All these issues must be
reasonably accurate. In order to maintain this accuracy, the research questions below will
be explored throughout this study:
• What should be the discrete event simulation and GUI components
required in constructing a TF defense model for analyzing efficiency of
different screens formed around a High Value Unit (HVU)?
• What should the model resolution be?
• What are the important battle scenarios for the Turkish Navy to analyze
effectiveness of different screen dispositions for convoy operations and
how should the model be constructed to run these scenarios?
• Which tactics can be derived from this analysis and will prove to be
sufficient in the future?
2. Secondary Research Questions
The objective in air defense (of convoy operations) analysis is to predict the
system effectiveness. There are several system effectiveness measures that can be
studied. By stating this effectiveness measure, the objectives of the model becomes
clearer. In this scope, the secondary research questions will be searched and explored in
the later chapters of this study:
• Which variable inputs should be fixed for analysis purposes?
• What are the appropriate Measures of Effectiveness?

• What is the appropriate method for sampling strategy and analysis to
demonstrate the utility of this model?
Since DMM will be a tool used to study the effectiveness of a task force screen
against the ASM's and to help the decision-maker achieve specific objectives in a tactical
environment by determining the appropriate screen formation, the scope of the thesis will
also include:
• A collective usage of the ASMD model and Java™ programming
language to create a user-friendly GUI simulation model for a variety of
combat situations of a screen in convoy operations.
• An analysis of the effectiveness of new tactics associated with screen
ships and their dispositions on a formation for naval area ASM defense by
using the DMM.
D. METHODOLOGY
1. Modeling Methodology
a. Discrete Event Simulation
This thesis will incorporate a component-based discrete event simulation
approach using the Java™ programming language. Discrete event simulation concerns
the modeling of a system as it evolves over time by a representation in which the state
variables change instantaneously at separate points in time. These points in time are the
ones at which an event occurs, where an event is defined as an instantaneous occurrence
that may change the state of the system [Ref. 2]. In the DMM, positions of each entity
including sensors, weapons and movers are recorded at each next-event time advance in
which the state of the system is updated, and future event times are determined.

b. Components and Modularity
Discrete event simulation models all share a number of components in a
logical organization. The ASMD model uses entities at the composite unit level. A
composite unit is a group of components that operate together. Each composite unit is
created from several smaller components that seek to model the precise behaviors of the
composite unit. On the battlefield most entities, such as ships and ASM/SAM' s (Surface
to Air Missile), can be seen in a component-based behavior with their controllers,
movement, sensing and interaction elements. The DMM, using only the behaviors of
each component in the ASMD model, will share this component-based simulation
modeling.
The modularity of the system provides easy and fast adjustments,
additions and removals to the model. The model is scalable to support analysis of
different force sizes and mixes. The model therefore provides the necessary properties to
analyze one frigate screen task force or a destroyer group in a screen formation with little
effort. All those adjustments will be easily handled by the DMM with its GUI that can
display and run multiple scenarios.
2. Analysis Tool
The DMM will be utilized in order to decide what escort ship spacing and
orientation patterns are to be used in screen formation, and where each screen ship must
be positioned in the formation to minimize the threat posed by the ASM sites. The
graphical user interface will enable easy evaluation and manipulation of scenarios in
order to analyze different formations.
10
3. Analysis Method
a. Input Analysis (Exploratory Analysis vs. Traditional Analysis)
Since models are only approximations of actual systems, their reliability
depends in part on the quality of the input data. In this study it has been very difficult to
obtain accurate input data, such as the exact range of detecting sensors and weapon
systems etc., because of their high-level security clearance requirements. Therefore,
Exploratory Modeling [Ref. 3] was employed. The model was run many times with many
different input levels, thus producing a large number of possible combinations. For
exploratory modeling, "a large space in the domain of interest (and all the solutions in it)
will be examined, then a solution will be selected" [Ref. 3]. In traditional analyses, the
solution is found and the area around it is examined. Exploratory analysis not only
provides the necessary decision flexibility, but it also reduces the risks associated with
imperfect input data; an important consideration of this thesis.
b. Output Analysis (Logistic Regression)
Logistic Regression analysis was used as statistical method for output
analysis. Regression summarizes and models complex data in a compact way. Regression
models are easy to describe, study and compare. The models can also be used to make
predictions. Regression encompasses a broad range of methods, from elementary to
advanced with respect to the complexity and the number of predicted variables. The
DMM's output deals with percentage of the HVU's casualty: 50% means half of the
missiles fired against the HVU are on target while the rest are destroyed by defensive
means (escort group). The criteria of whether the HVU is damaged (or not damaged) will
be based on the percentage of ASM hits on the HVU.
11

In regression, categorical variables, such as percentages, probabilities and
two or more choices (yes-no, for and against, etc.), can be predicted by way of the logit
(also called logistic) regression method. Like elementary regression, logit regression
provides a flexible, general-purpose modeling strategy with straightforward
interpretation. The use of logit regression in this analysis will reduce several problems
caused by unrealistic predictions, which imply that some unrealistic parameters were
estimated. The logit regression, together with its usage in this proposed thesis, will be
covered in detail in the fourth chapter.
E. THESIS OUTLINE
This thesis consists of five chapters. This first chapter has introduced the problem
statement and discussed many of the pertinent subjects necessary to solve this problem in
a unified introductory level.
The second chapter covers the history of convoy operations and screen formation
tactics used in convoy operations. There is little published information about convoy
operations and its tactics, and this chapter provides some extra background.
Before going directly into the simulation, it is helpful to overview the discrete
event simulation and its components. The third chapter describes the DMM and its
components together with Java™ Swing components necessary for the GUI.
The primary subject matter of the fourth chapter is the Measure of Effectiveness
and the comparative analysis of the results using regression analysis methods. The
results, derived from the regression analysis methods, are evaluated in this chapter.
The fifth chapter contains the final conclusions and recommendations concerning
the results and possible future research areas.
12

II. CONVOY OPERATIONS
In the previous chapter, we have stated the purpose of the new model and
discussed some of the pertinent subjects necessary to build this kind of model. But before
getting directly into the models' functionality, some standard definitions and background
information must be covered initially. This introductory information will provide insight
into the model's design and also provide a basis for the application of the model.
Simply stated, a convoy is a number of merchant ships or naval auxiliaries, (or
both,) usually escorted by warships and/or aircraft, or a single merchant ship or naval
auxiliary under surface escort assembled and organized for the purpose of safe passage
together. If this convoy's voyage lies, in general, on the continental shelf in littoral waters
then it is called a coastal convoy. Escorting refers to the act of ships or aircraft that
accompany and defend valued units from enemy weapons. Escorting is one kind of
counterforce performed for the goal of the operation. Thus an AAW screen, for instance,
is primarily an escort counterforce to protect other units from ASM or aircraft attacks
[Ref. 4].
Originally, the first convoys of merchant ships were formed as a protection
against pirates. The tactics for the convoy escorts against pirates were simply based on
the idea of positioning the escort ships between the merchant ship (which is the HVU)
and the pirate ships.
The first great naval engagement of the French Revolutionary wars was fought
between the French and the British in the Atlantic Ocean about 430 miles west of the
Bretenton island of Ouessont. The battle arose out of an attempt by the British Navy,
under Early Howe, to intercept a grain convoy from the United States to France. The
practice at the time was to position the escort battle ships all around the grain convoy.
13

Since Early Howe was attacking with a huge crowd of ships from every sector, the
practice of forming the screen ships around the grain carrier ships was deemed to be
appropriate.
A. SCREEN FORMATION TACTICS IN WORLD WAR II
During the Battle of the Atlantic in the early years of World War II, the German
U-boats were sinking allied merchant ships at such an alarming rate that new tactics had
to be developed immediately. In reviewing data arising from OR practices during and
after the WWII, several countermeasures against anti-convoy encounters were invented
and some were successfully employed. Equipping merchant vessels with antiaircraft guns
and anti-torpedo nets helped greatly, considering the equipment performance. But the
installation of nets was expensive and also slowed down the speed of the convoy and
antiaircraft guns were needed in many other places besides ships [Ref. 5].
The first American carriers, arriving in the Atlantic in early 1943, soon found that
the practice of operating the carrier within the convoy screen was inefficient. Launching
and landing aircraft requires the carrier to turn into the wind, which of course was not
always the direction in which the convoy was sailing. Frequent maneuvering within the
convoy, particularly at night during flight operations, disrupted convoys operation and
always increased the risk of collision. The U.S. Navy adopted a mode of operation where
the carrier and its escorts sailed outside the convoy but remained close enough to enable
proper air cover.
The tactics, as mentioned above, have always changed to increase the safety of
convoy operations. For example, the most important trend in the midst of World War II
was an amalgamation of the types of surface ships supporting convoys. In 1945, cruisers
14

were armored big-gun ships that were capable of operating independently for protracted
periods. Destroyers were part of the screen protecting the main fleet, and frigates were
slower ships designed for the escort of merchant traffic.
B. MODERN SCREEN FORMATION TACTICS
Evaluating the enemy's rapidly changing countermeasures during the World War
II shows that most of them consisted of the renewal of the ship classes or installation of
new equipment onboard convoy ships to reduce casualties caused by the enemy. But
now, since most of nations capabilities for war are known in terms of platform and
weapon lethality, the need of developing and implementing counter-tactics, doctrines,
and effective training program to gain proficiency in naval operations is more important.
The danger caused by submarines in World War II has been replaced with the danger of
air attacks such as missiles and aircraft. Captain Wayne P. Hughes (USN, Retired) states
that "...universally recognized are these two facts: technology advances keep weapons in
a state of change, and tactics must mate with the capabilities of contemporary weapons"
[Ref. 61.
In the early to mid 1950's the Soviet Union developed a missile boat concept that
envisioned offensive, defensive, and special operations attacks with numerous patrol craft
within 20 to 30 miles of shore [Ref. 7]. In the late 1950's, they had produced Komar and
Osa fast patrol boats armed with Styx missiles (25-30 mi. range). By delivering these
boats along with the Styx missile to the Egyptian Navy in the early 1960's, they totally
changed the weapon balance of naval power between Israel and Egypt. The Israelis
understood that the merchant traffic in the region would face drastic danger. Their fleet,
then consisting mostly of ex-British World War II vintage Z class destroyers, was no
match against faster patrol craft equipped with accurate long-range ASM's. They soon
15

realized that their navy required immediate force and equipment changes and, equally
important, such an undertaking would require revision of concepts of operations,
doctrines, tactics and training. First they developed the Gabriel ASM with 12-mile range.
The positioning of screen ships (Z class destroyers) to avoid or destroy the enemy before
being destroyed by them became paramount. The Gabriel missile was out-ranged ten to
fifteen miles by the Styx missile. In other words, an Israeli ship would have to approach
the enemy more than ten miles inside the Styx missile range before they could fire
missiles. With this in mind, the concept called for a new tactic of defending the convoys
from outside the screen; maybe, miles away from where the convoys are. Scouting
procedures, EMCON conditions, electronic warfare, hardkill and softkill defense factors,
coordinated ASM attacks, as well as gunnery procedures, were developed and
extensively tested both at sea and inport with the use of state-of-the art tactical trainers in
Haifa, Israel. The Battle of Latakia on October 6, 1973, in coastal waters off the coast of
Syria was the first in which these Israeli concepts were put into action. There were no
casualties to the Israeli force while six Syrian boats were sunk during the battle. The
tactical concept, together with written and well-performed doctrines, helped the Israeli
forces against their strong enemy.
C. SCREEN DISPOSITIONS
Tactics are the methods by which forces are employed and handled in battle and
include: acts of deployment, maneuver, and application of force. But tactics alone can not
win battles. They must be combined with training and experience learned from past
efforts and must be performed in appropriate scenarios.
Considering the success managed by the Israeli Navy, there are many examples of
16

important improvements and usage of tactics. Among those improvements, two main
screen disposition tactics for convoy operations are still in use: the general screen
disposition and the two-whiskey (2W) disposition. Even though only the general screen
disposition will be analyzed in this thesis, the 2W disposition is considered worthy of
mentioning for completeness. In order to evaluate how well the commander is prepared
tactically to conduct the AAW screen dispositions, these two main disposition tactics
which are still being used by the Allied Forces are summarized below:
1. General Screen Disposition
The general screen disposition is performed for not only the AAW missions, but
also for the ASW and ASUW. It is appropriate for many multi-threat encounters. The
HVU (merchant vessel, aircraft carrier, etc., to be protected) becomes the guide of the
convoy. The OTC assigns each escort a designated sector according to their sensor and
weapons range. All screen ships take sectors with respect to the guide in range and true
bearing as assigned. The convoy takes the course in which the guide of the convoy must
sail. The OTC can change the convoy speed and course by changing the guide's course
and speed. All escort ships have to adjust their speed and course to stay within the
assigned sector. Wherever the guide sails, these ranges and bearings must be maintained.
Thus, all escort ships are free in their maneuvers as long as they stay within their sector.
Figure 1 is an illustrative example of a general screen disposition in which there is
no space between sectors for a submarine to pass through or for an ASM to reach the
guide before it should be detected by any of the escort ships. The sectors are:
• Escort ship 1 : 340°-030° and 8-20 NM.
• Escort ship2 :030°- 1 65° and 15-20 NM.
17

Escort ship3: 165°-265° and 15-20 NM.
Escort ship4: 265°-340° and 15-20 NM.
20 NM
Figure 1. General Screen Disposition, showing the escort's sectors.
2. Two Whiskey (2W) Disposition
Unlike the general screen disposition, the 2W disposition is designed to form an
umbrella-like defensive shield only against AAW threats. It is more effective than the
general screen disposition if performed with more than five screen ships. It allows a
18

layered sector defense by assigning more than one ship in the same threat axis. Figure 2
is a standard template used for 2W disposition.
36 20
( El> 7 ^34 18
v§yE>)
33
1 32
17
16
VI 5 >/CP
|0>sy
9
5t
23
24 1
Convoy course 090
ci>b15 ^4 ii
31 14 12 1 25 I
30
29
13
$>Y26
/ 1 Escon Shi^ HVU \J Escort ship in both sectors
Figure 2. Two Whiskey Disposition, providing defensive shield on the northeast sectors.
As seen in Figure 2, the convoy's course is general east, but escort ships are free
to maneuver as long as they maintain their sectors. They could actually maneuver in
order to assign their weapons to designated air targets effectively. Additionally, the escort
ships can cover more than one sector as illustrated in Figure 2.
Due to its multi-threat defensive capability (against air, surface and subsurface),
and since it requires fewer escort ships than 2W disposition, only the general screen
disposition will be used in the DMM's GUI to build the scenarios. The advantages of
using the general screen disposition are:
19

• It can be formed effectively even with a few screen units (Some might not
have many ships ready and on hand to escort a convoy).
• Many new tactics can easily be derived from general screen disposition
such as hiding the HVU inside the screen and greyhound tactics for fast
patrol boats.
The general disposition is also preferred by the Turkish Navy due to the
geographical constraints of the battle space (the Adriatic, the Aegean Sea, etc.) and
limited number of escort ships per HVU.
D. SUMMARY
In essence, tactics are the key elements of command and control. On the day of
the battle, a naval force will fight as well or as poorly as they are prepared tactically.
Naval forces must possess the capability to conduct any operation in order to control the
naval arena. This can be managed by the help of tactics developed to overcome the
enemy's capabilities.
This chapter covered the development of screen disposition tactics necessary for
convoy operations. Of the two introduced dispositions, the general screen disposition will
remain the focus throughout this thesis due to the reasons stated.
The screen dispositions exist only with their entities like ships, their weapons and
sensors. These entities will be introduced in the next chapter with the necessary GUI
elements used in DMM. The reasons for creating DMM, and briefly, how it works will be
the main subject in the next chapter.
20

III. DISPOSITION MISSION MODEL (DMM)
In this section we will examine the operation of the DMM. The model consists of
two distinct but collaborating parts: the graphical user interface and the simulation
component, both written in Java™ programming language. We will focus on the
structures of these two components, each of which has completely different properties.
GUI components will be discussed in detail, while the simulation components (ASMD
model) will only be briefly summarized. Component summaries will begin with a listing
of the associated properties and will be illustrated using related figures.
A. METHODOLOGY
An operations analyst knows that effective analysis requires the models to have
flexibility, modularity and scalability. Another important feature is that the model should
be independent of the platform. The Java™ programming language is a very good
solution to all of these problems. It is object-oriented, dynamic, and enables modular
design. Because of its platform independence feature, Java™ is becoming the language of
the Internet. Java™ also offers vastly greater support over its predecessors for developing
graphical user interfaces and graphical applets/applications. It provides every basic set of
components to implement any applet/application interfaces that are used in today's
software products.
Using this language for the discrete event simulation modeling will give the
operations analyst more flexibility and, most importantly, more time to devote toward
analysis. An AAW analyst, for example, should easily adapt a newly developed sensor in
the simulation model and conduct the analysis for a single ship or for a task group
without spending much time on model adjustments. The purpose of developing
Operations Research (OR) types of combat components is to provide a library of reusable
21

software to speed development of OR applications and make them more reliable. The
following paragraphs will discuss three steps taken to develop this analysis into an OR
combat model.
1. MODKIT and SIMKIT Packages
In earlier theses at NPS, very useful combat modeling Java™ packages were
introduced such as MODKIT and SIMKTT. MODKTT (developed by Major Arent
Arntzen, Norwegian Air Force) is a collection of classes for OR modeling based on the
"loosely coupled object architecture" [Ref. 8]. The loosely coupled object architecture
has the goal of designing and developing architecture for dynamic map-based military
planning applications using new platform-independent software technology. The loosely
coupled component architecture operates on a computer network and accesses data,
algorithms and other information over the network. Additionally, it supports Monte
Carlo simulations as well as visual presentation of the solutions. The architecture further
supports collaboration among planners on the computer network and allows the
components to be designed and constructed independently of each other and to be easily
added to the system. SIMKIT (developed by Professor Arnold Buss and Kirk Stork, a
graduate of NPS) is a Java™ library for constructing discrete event simulations that takes
an entity-based approach to modeling and simulation [Ref. 9]. SIMKIT provides
modelers the ability to construct scenarios using the various platforms and systems and to
construct their models by assembling the appropriate component models from various
sources. Each component model would be ideally retrieved from the source at run time
ensuring the most up-to-date version is in use.
22

2. ASMD Package
SIMKIT and MODKIT were used in several Naval Postgraduate School Master
Theses in order to provide analysis for naval combat models. Among those models, the
Anti-Ship Missile Defense (ASMD) model, created by James R. Townsend, has relevant
importance [Ref. 10]. It allows for more realistic object movement simulation owed to a
substantial supporting mathematical package. Instead of focusing solely on the defense of
a single ship in AAW, the simulation can be extended to analyze the problem of screen
defense as a whole through the use of this package. Since the DMM was inspired by the
ASMD model, we will cover ASMD and outline the necessities for DMM.
3. Graphical User Interface
Data becomes more informative and allows the user to be more perceptive when
presented visually. Graphical User Interface (GUI) is the tool to give this visual support
to the user. From the desktop level to client/server development applications, software
has turned toward GUI's in the last two decades. Successful design for GUI's requires a
multi-disciplinary effort. Graphic design, human factors and software engineering skills
all play a vital role in this effort.
The most important component of a GUI application is the interface. If the
application is too difficult to navigate or understand, the users will reject it, support and
training costs will greatly increase, programmers will get discouraged and maintenance
will be increasingly difficult. Thus, GUI applications must be designed to effectively
meet today's demanding software needs. Java™, with its "Java Foundation Classes"
(JFC), has become one of the most effective programming languages with regard to its
vast amount of graphic tools. JFC includes the next generation GUI toolkit that Sun
Microsystems is developing to enable enterprise development (large scale applications).
23

In April of 1997, JavaSoft announced JFC which supercedes (and includes) the
initial release of Abstract Window Toolkit (AWT). A major part of the JFC is a new set
of user interface components that is much more flexible, complete and portable. These
new components are called "Swing." With Swing, interfaces with tree components,
tables, tabbed dialogs, tooltips, and many other features that computer users have grown
accustomed to can be easily designed. In reality, Swing is more than this. In addition to
the new component, Swing makes two major improvements on the AWT. First, it relies
less on the runtime platform's native components, improving performance. Second,
because Swing is in complete control of the components, it is in control of the way
components look on the screen and allows the user greater control of how the
applications look. This feature is called Pluggable Look-and-Feel (PLAF). All these
features help the programmer in displaying the components on screen efficiently,
registering for events and getting information from them [Ref. 11].
The DMM's interface was written using Swing components. Main windows
(JFrame), tree component (JTree), tabbed frames (JTabbedPane), menus (JMenu,
JMenuItem), etc., are all examples of Swing components used to build the DMM. All
these components will be covered in detail in the following section of this chapter.
B. DMM's GUI
DMM's GUI consists primarily of two frames: the main scenario window and the
simulation running window. These two window frames distinguish the scenario from the
simulation part. The scenario, after being built, is run in the simulation window
24

on which the simulation results are displayed after the run is complete. Figures 3 and 4
show the main scenario and simulation running windows respectively (realistically, in a
static medium such as paper, it is hard to show that the ships are moving and missiles are
being fired by the ASM's sites within the simulation running window).
MAP VIEWERrlD|x[
Zoom Guides Screen Ships Help
^
V
1
slands
INTEL:
2 sitesI
Distance; 10.2 Bearing: 270
^\
Click on radar icons for intelLAT :
23.92 EL0N6:
35.98 N
Figure 3. Main Scenario Window, displaying a 6-ship-convoy in a littoral area. The
distance between HVU and one of the escorts is 10.2 NM and the true bearing from the
HVU is 270°. The cursor is last moved to 35.98N and 23.92E.
25

Figure 4. Simulation Running Window, displaying the convoy after run button is clicked.
The simulation will run twice. The wheel and anchor buttons are used for information
about the scenario and the results after the last run ends.
1. Main Scenario Window
are:
This window is used to build the scenario on a map. The features of this window
• Zooming in and out of the map (Zoomin/zoomout buttons and menu
items)
• Displaying latitude and longitude (Mouse movements)
• Displaying distance and bearing information (Mouse dragging)
• New ships with new features can be added or deleted (Ship Explorer)
• Help (Help menu/window)
26
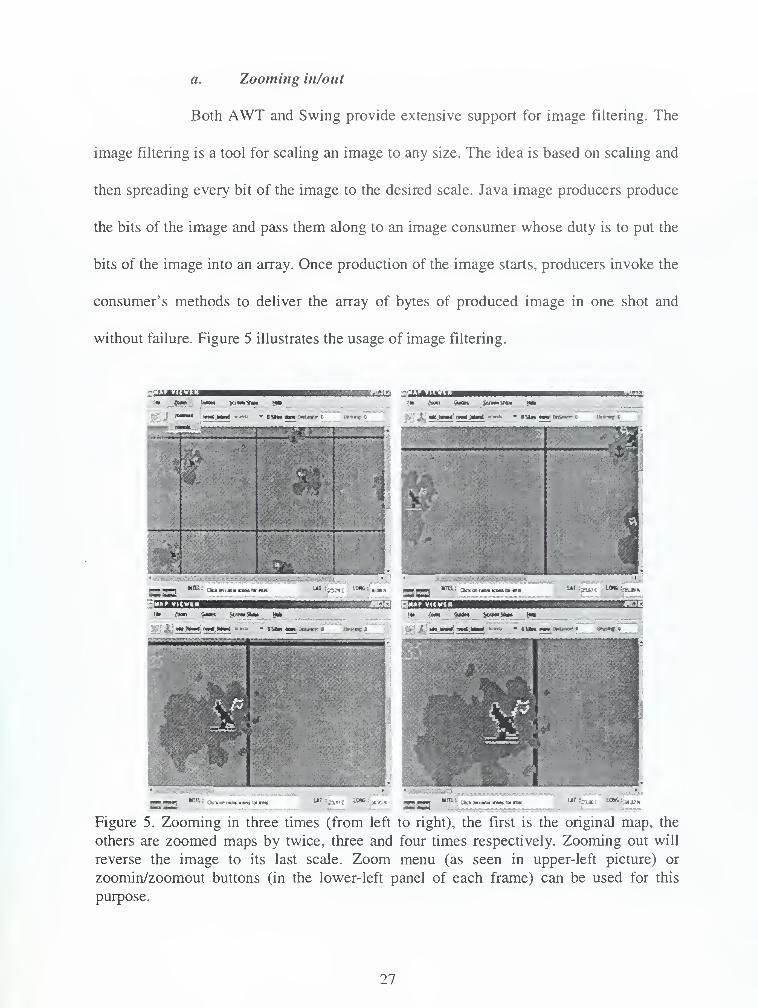
a. Zooming in/out
Both AWT and Swing provide extensive support for image filtering. The
image filtering is a tool for scaling an image to any size. The idea is based on scaling and
then spreading every bit of the image to the desired scale. Java image producers produce
the bits of the image and pass them along to an image consumer whose duty is to put the
bits of the image into an array. Once production of the image starts, producers invoke the
consumer's methods to deliver the array of bytes of produced image in one shot and
without failure. Figure 5 illustrates the usage of image filtering.
.- ;r,umv;ii
- - » « t :, . , <
Figure 5. Zooming in three times (from left to right), the first is the original map, the
others are zoomed maps by twice, three and four times respectively. Zooming out will
reverse the image to its last scale. Zoom menu (as seen in upper-left picture) or
zoomin/zoomout buttons (in the lower-left panel of each frame) can be used for this
purpose.
27

There are two main classes in AWT to reproduce and scale an image:
CropImageFilter and ReplicateScaleFilter. CropImageFilter crops a specific rectangle of
an image while ReplicateScaleFilter scales images by using a single algorithm that
replicates rows and/or columns of image data for scaling up, and removing rows and/or
columns of data for scaling down. In the DMM, only ReplicateScaleFilter is used for the
reasons explained below. Since the map is viewed inside a scroll pane (JScrollPane),
cropping the required piece of the image and then enlarging that piece is not a necessity.
By scrolling the image, one can view any part of the enlarged map.
There is another alternative in scaling the image:
AreaAveragingScaleFilter. The AreaAveragingScaleFilter, which is an extension of the
ReplicateScaleFilter, uses a more sophisticated algorithm. This algorithm produces
images of a better quality than images scaled by using ReplicateScaleFilter [Ref.12].
However, the better image quality comes at a price. AreaAveragingScaleFilter is slower
than ReplicateScaleFilter and causes an insufficient memory problem that might
terminate the program. Zooming in ten times to an image with ReplicateScaleFilter
causes no difficulty in memory capacity while three times with AreaAveragingScaleFilter
does (using Intel Pentium 200MHz PC with 32 MB RAM). Thus, ReplicateScaleFilter
method is considered to be a good tool to be used in DMM. Here is the method to scale
an image in the DMM:
public Image scalelmage ( int zoomingFactor ) {
int width = zoomingFactor * originallmage.getWidth (this);
int height = zoomingFactor * originallmage.getHeight (this);
ReplicateScaleFilter filter = new ReplicateScaleFilter (width, height);
FilteredlmageSource fis = new FilteredlmageSource (originallmage.getSource (), filter);
return createlmage(fis);
}
28

In the aforementioned method (scalelmage (int zoomingFactor)), the
original image is enlarged the "zoomingFactor" times and image producer produces the
new image. This method is fast and produces a quality image, which is enough for the
DMM zooming purpose.
b. Displaying Latitude/Longitude and Distance/Bearing
The DMM provides excellent information regarding location and
distance/bearing from any point on the map. Every mouse movement within the map is
displayed as latitude and longitude information in the very lower-right text areas. If the
mouse is dragged from one location to another, the distance and bearing from that
location to the last dragged point can also be shown in the upper-right text areas while a
line between these two points is drawn on the map. This feature helps the user position
the screen ships with respect to the ASM sites. After the guide is in its position,
measuring the bearing and range to the ASM sites will be very important in the
positioning of the screen ships. With AWT's MouseMotionListener, this feature can be
easily implemented. "Mouse moved" and "mouse dragged" events are refered to as
"mouse motion" events. These motion events are presented by the MouseEvent class. The
MouseEvent class provides methods that can be used to determine the position of the
mouse at the time of the event (getPoint( ), getX( ), getY( )). Here is the code used in the
DMM:
public void mouseDragged ( MouseEvent e ) {
// while dragging the cursor takes plus sign shape (+)
setCursor ( Cursor.getPredefinedCursor ( Cursor.CROSSHAIR_CURSOR ) );
drawDistance ( e.getX(), e.getY() );//draws the line
findDistance ( first, e.getPoint() ); //first is the point where the dragging starts
findBearing ( first, e.getPoint() );
setToString ( e.getX(), e.getY() ); //writes down the position into text fields even
// while the mouse is dragged
29

public void mouseMoved ( MouseEvent e )
// while mouse moved the cursor takes hand shape
setCursor ( Cursor.getPredefinedCursor ( Cursor.HAND_CURSOR ) );
setToString ( e.getX(), e.getY() ); //writes down the position into text fields
1
The other events (except mouse moved and dragged) such as mouse
clicked, entered, exited, pressed, released are simply mouse events (not mouse motion
events), and are also represented by MouseEvent class. The code below indicates how
mouse event method (mouse pressed) is used in the DMM. The information pertaining to
which mouse button is pressed is provided by SwingUtilities class static methods.
• isRightMouseButton(MouseEvent e)
• isLeftMouseButton(MouseEvent e)
public void mousePressed ( MouseEvent e ) {
//every time mouse pressed the cursor takes the plus sign shape (+)
setCursor ( Cursor.getPredefinedCursor ( Cursor.CROSSHAIR_CURSOR ) );
first = e.getPointO; // first point starting to drag
/* right mouse button click erases the line drawn, and resets the text fields for distance
and bearing to zero */
if ( SwingUtilities.isRightMouseButton ( e ) ) {
clearDrawLine ( );
distanceField.setText ( "0" );
bearingField.setText ("0"
);
}
}
Figures 3 and 5 illustrate how main scenario window displays the distance
and bearing information as well as the location.
c. Ship Explorer
Swing trees display hierarchical data by using a well-known paradigm of
folders and leaf items. The most widely used tree component is undoubtedly Windows
Explorer, which contains a tree component for navigating directories. Ship Explorer is
based on the same idea of displaying the convoy ships and their features in a hierarchical
manner. Ship Explorer takes its initial structure from an INI file (ships.ini). INI files
30

consist of blocks, which are labels surrounded by square brackets ([ ]), and key/value
pairs, which are separated by equals (=). The INIFileProperties class written by Professor
Arnold Buss at the Naval Postgraduate School, Monterey, California provides a
mechanism to read the blocks and key/value pairs and loads them into HashTables. The
Ship Explorer takes the blocks from the INI file and adds them as a node to the tree. The
properties of each ship are added to the tree as leaves. Figures 6 and 7 illustrate the
related part of the INI file and Ship Explorer.
From INI file (ships.ini)
[GUIDE]shipl = USS T.ROOSOVELTship2 =USS CARL VINSONship3 = USS EISENHOWERship4 =USSNIMITZship5 = USS J.F.KENNEDYship6 = USS KITTY HAWKship7 = USS AMERICA^
[USS T.ROOSOVELT]hullno = CVN71speed = 35
aircraft = 85
crew = 5600
weapons = Sea Sparrow Phalanx
airradar = SPS 64
surradar = SPS 55
To Ship Explorer;r;EasES
/..-!*[
jfs SBi
jfc DMM VESSELS
? Jt guide
9 ji USS T.ROOSOVELT
O '"-» - 5*00
O iixT*4ar - SPS 64
9 !#rs3>oro - S*» Sj>»jT<m '..a iam
© .«r™dar- SI'S 55
O a-xf raf; - 85
O trnOl™. - CVN71
• j_ OSS CKL VINSON
» Jt_ USS HSK-IHOWtX
Figure 6. LNI file and Ship Explorer, child nodes of guide node are guide ships. The
leaves are the properties related with each ship. The cut button is enabled as long as a
ship (guide or screen ship) is selected. The other two buttons on the upper panel are used
to add a guide or screen ship.
31

From INI file (ships.ini)
[SCREEN SHIP CLASS]classl = BARBAROS CLASS
,
class2 = KNOX CLASSclass3 = PERRY CLASSclass4 = SPRUANCE CLASSclass5 = GEARING CLASSclass6 =YAVUZ CLASS
[BARBAROS CLASS]shipl = TCG SALIHREISship2 = TCG KEMALREISship3 = TCG ORUCREISship4 = TCG BARBAROS
i
[TCG SALIHREIS]hullno = F 246
speed = 33
crew = 1 50
SAM = Sea Sparrow Mk 29
gun = VLSMk41airradar = AWS 9
surradar = AWS 6
To Ship Explorer
issaaiESEHiii
<bE=. JK3 mS&
DMM \TSS}XS
Jk screen sksf class
? i 3ARBAROS CLASS
<F Jt tcc SAimsns
Oimr- 1«lirraiaj - AWS *
C SAM - Sri Sfxav* \Di aiMxrsiar - .'.WS i
C>?"i-
.
tt««- VLSMMlO k«ii~ - > :~'
•Jj,
TCC KiJMALKKS
©- jfc TCG ORICREIS
Figure 7. LNI File and Ship Explorer, child nodes ol screen ship class are ship classes
whose child nodes are related ships. Leaves are the properties of each ship.
The guide menu and screen ships menu in the main scenario window takes
its menu items from the same INI file. Figure 8 shows these pop-up menus.
-mvzuouu " i»La^BuLUL.^i1*] wiUS
Figure 8. Guides and Screen Ships Menus, each menu is constructed from the LNI file.
32

Ship Explorer allows the user to add new ships to the model as well as to
delete them from the model. Deleting one of the ships from the Ship Explorer or adding a
new ship to it deletes or adds the unit from or to the associated menu as a menu item. The
added item's icon appears in a different color in the menu (Figure 9).
r52S3E2Ea 3S
jfr_CCTDE .
e^ Jfc us: WWII
_ .-. mat
J-
l s:
:: s
®" JL.'• s:
1
-'•,
-' -
iikjL GUIDE
** JL OSSWASP
OSS T.ROOSOWXT
LSS CARL VINSON
USS nSEMIOWFR
USS Niun z
«SS XFJOENNKDV
fc_ CSS AMERICA
OSS ENTEJSBUSE
-
Km, Attn to«r.S*»«
J.IKSKOSP
''
•
j' JLubowwroi
JLwskw
JLussinr.nwi
Jt,uwcaevfi;jnr*
Jt,u»ietPrH«»
JL «sown v»
J.-i ;um>
JL ISSilWSKCOi
JL IPS UMCOtH
"?V?
5"
5»w t0* ; i.-Mi
Figure 9. Adding USS WASP to the Guides results in an addition to both Ship Explorer
and Guides Menu.
Ship properties in Ship Explorer are editable. If you want a guide to
navigate faster, it is easy to edit its speed with one right mouse button click. Figure 10
illustrates this property.
i 2 t-.in J^-ii'.'/i^ii
*±DSS T.ROOSOVTXT
O crrw - 5608
O airraxiar - SPS 64
O wraponj - Sra Sparrow I'Siaiana
O »urra«Ux - SPS 55
K
ess CAKLVnvsors-
© r r<-w - 5408
O ajrradar - SI'S 64
O wrspfiu " Sea Sparrow PHalaAA
O «>"-ra«lar - SKS 55
O ip<.md "* *5
O aircraft - H5
Figure 10. Properties of each ship are editable. The editable text field comes up when
clicked using the right mouse button.
33

All those features described above provide modularity in the model. If a
user wants to examine the efficiency of a screen against ASM threats, adding new ships
to the Ship Explorer and building the scenario accordingly will make the process very
easy. The detailed information about INI files is given in Appendix A.
d. Help Window
The help menu in the main scenario window provides two help items: the
version and help. The version shows up as a dialog frame that displays the version of the
DMM while help menu item, when selected, brings out a tabbed pane that provides
access to many indicies. Figure 1 1 displays the Help Window.
IBheipeb 1.ID x
^xcsng ship cnoosnj guide map ho«l3play
mouse editing shfs version.
ctoosingstip choosing guide 'nap towtopiay
edteg ships wrsson
DBOOSiNG SCREEN SHIPS
)i>r own choice for?
-;-: ^:35S msnu.Fcr each class S^sre are submenus for each <;
' -:'- --:-;- w adjusts position ci-.;
'is guide pos n.Simp?
'_'. ..::••• pnmde
* I0USE
Distocstir.de! by dragging mouse
Figure 11. Help Window, with two help headers.
Tapped panes (JTabbedPane) are a common user interface component in
Swing that provides convenient access to more than one panel. The tabs show the
name/property of the associated panel. Tab names in this help window are also formed
from an INI file (helpTable.ini). The text area of each panel loads a text file whose name
is saved in the INI file (Figure 12).
34

From INI file (heIpTabIe.ini)
[Help]
topid=how to play
topic2=mouse
\[mouse]
filel=mouse.txt
To Help Window /IffiHELPER • . ,|D|xj
dwosmgsfip choosing gate map nowtopfey
mouse KiingsbfS WTSIK!_
a
: / -..• by dragging moess
•.
" Uies'ss
mp >.;-;;::_:::?:.::-
•
Figure 12. INI File and Help Window
The help window is designed as a tabbed frame in order to maintain
modularity. The DMM represents the initial approach to the screen disposition analysis,
but the model can be improved in future developments for different purposes. In this
development, the help window needs to be updated with new features added to the
program. Only new block and key/value pair addition to the INI file (by the new
developer) will be enough to update the help window. New added properties will show
up as a new tabbed panel in the window.
e. General Features
For Swing, it is particularly important to have a good grasp of "inner
classes", which are used by Swing itself. These inner classes help to write a class inside a
class in Java. For listeners such as actionListener, mouseListener, mouseMotionListener,
adjustmentListener, etc., inner classes are to be implemented. But with this
implementation, modularity and flexibility features provided by Java™ can not be used.
35
Inner class mechanism provides no access for a new class inherited from the outer (main)
class in order to overwrite a method of inner class.
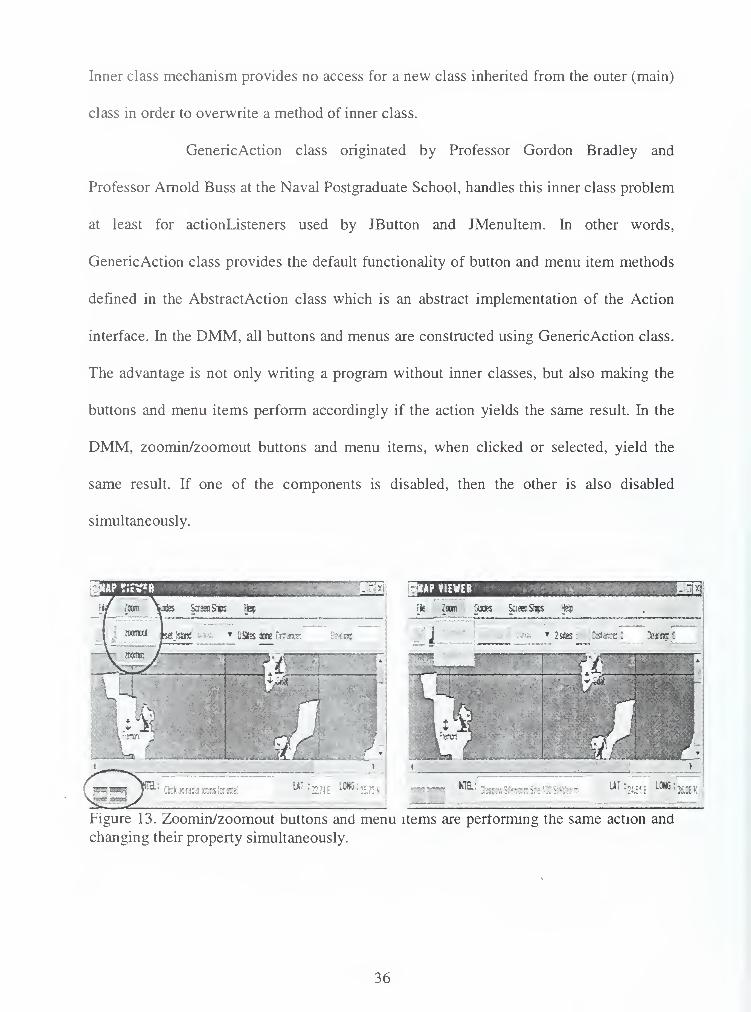
GenericAction class originated by Professor Gordon Bradley and
Professor Arnold Buss at the Naval Postgraduate School, handles this inner class problem
at least for actionListeners used by JButton and JMenuItem. In other words,
GenericAction class provides the default functionality of button and menu item methods
defined in the AbstractAction class which is an abstract implementation of the Action
interface. In the DMM, all buttons and menus are constructed using GenericAction class.
The advantage is not only writing a program without inner classes, but also making the
buttons and menu items perform accordingly if the action yields the same result. In the
DMM, zoomin/zoomout buttons and menu items, when clicked or selected, yield the
same result. If one of the components is disabled, then the other is also disabled
simultaneously.
AP ?JEVC B AP VIEWER
k Zoom Gudes SceerSjs Help
iT 2ste
: __
<
. MH.: -_...-. :->.'._-•: - UI :,.:,; LONG:,;m
Figure 13. Zoomin/zoomout buttons and menu items are pertorming the same action and
changing their property simultaneously.
36

2. Simulation Running Window
This window is designed to display a particular part of the map on which the
scenario is built, the information about the scenario and the simulation results. The
scenario, after being set, is run in the simulation window on which the simulation results
are displayed after the run is complete. As seen in Figure 4, the image is related part of
the map through which the convoy will navigate. Cropping the original image (map) and
then enlarging it by using CropImageFilter and ScalelmageFilter provides this new
image. If the scenario is set on a different area of the map, then the window will show
that part of the map in a scaled version.
The anchor and wheel buttons, when clicked, display the information about the
scenario and the results of the simulation after the last run, in an internal frame
(JInternalFrame). Internal frames are windows that can be contained within another
container such as a frame on a window. By default, they have close, maximize and
minimize buttons like other frames, but all these "standard look and feels" act inside the
outer frame. The maximize button, for example, can enlarge the internal frame as large as
the container. The Figures 14 and 15 display the internal frames.
INI OliMA I ION
UOR CARL VINSON23 79N . 35 BE00028 Ida
Strun snips
Bring* nfwnRun j<'-. afwn
o.»riric*; olwn;
USS BRiSCO70 0-50.0 d«o7 0-8-0 rim
TCO TRAKYA211 0-253 Ooo9 0-"> O O r»m
- <"MBMHHhHSHK
Kun NurMJwi
Figure 14. Internal Frame, displaying the information about the scenario
37

ZUSi
RF-SULTS
«,, a i :•.
iAZIAISTTP 437' 4-i
'
a
v.,.
in # hits on USS i ifcRS Vif* ON<l
». rA.42!.„ „• . ...
J
Hon Nunilxir .**.. §M £Figure 15. Internal Frame, displaying the simulation results after the fifth run.
When the run button is clicked, the simulation runs the selected number of times.
The simulation part (ASMD) will be covered briefly in the next section.
C. DMM's SIMULATION (ASMD MODEL)
In DMM, the Graphical User Interface is created to provide the ASMD model
with a realistic wargame design. The ASMD model was created by James R. Townsend
at the Naval Postgraduate School as his Master's Thesis, "Defense of Naval Task Forces
from Anti-ship Missile Attack", in Operations Research [Ref. 10].
The model allows for more realistic object movement simulation than regular
high-resolution models, owed to a substantial supporting mathematical package. This
enhanced realism allows for more accurate simulation of the missile attack. In the scope
of this analysis, we will focus only on the most salient points concerning the ASMD
model components and their functions in Appendix B. The detailed information and other
descriptive functions can be obtained from the original thesis.
38

D. SUMMARY
The modern interfaces of Java™, together with its flexibility, make the
application appealing to the user. In this chapter, we covered how this is possible and fun
with Java™.
The DMM's graphical user interface works as a User's Manual, allowing the user
to create a scenario of a convoy operation and then make the AAW defense simulation
for the related scenario.
In the next chapter we will discuss the simulation results with respect to the
appropriate Measure of Effectiveness (MOE) and evaluate the selected MOE by using
graphs and regression models.
39

THIS PAGE INTENTIONALLY LEFT BLANK
40
IV. ANALYSIS USING DMM
In the previous chapters we have discussed the reasons for creating the
Disposition Mission Model (DMM) and how it works. In this chapter we will conduct an
analysis using the model.
The DMM was constructed to analyze the effectiveness of different screen
dispositions on convoy operations. In order to determine the best arrangement for ships in
a TF by using comparative methods, we first need to find the appropriate Measure of
Effectiveness (MOE) to make the comparison.
A. MEASURES OF EFFECTIVENESS
In war games, the players are prone to think in terms of the casualties they suffer.
The policies and tactics of each side are changed simultaneously by the players as their
casualties increase. The loss of an important unit in the force might also change the
physical factors that will affect the tactics.
As discussed before, the convoy TF is an assembly of ships responsible for the
safe arrival of a special unit (HVU) at its destination. During this passage, the casualties
suffered by the screen ships and the HVU will force the OTC to change its tactics in
order to minimize damage to the HVU since it is the one to navigate safely. From this
point of discussion, counting the number of hits against the HVU is a strong defensive
MOE. It quantifies the result that OTC most wants to prevent. In order for this to be the
best choice, however, we need to specify what a hit does to an HVU in terms of damage.
Three ASM hits might result in a sinking for a merchant HVU while the same number of
hits might result in a flight platform damage for an aircraft carrier; but not a sinking.
41

Thus, in order not to confuse the decision-maker in terms of damage criteria of
each different HVU, and not to focus the user on the damage of the HVU neither in
equipment nor territory criteria, only the percentage hits on the HVU will be analyzed. If
the ASM sites deliver 30 ASM's, and the mean number of hits on the HVU is 4, then the
4percentage hit on the HVU will be — = 0. 133 (13%). It will later be clear that this also
helps in analysis using logistic regression.
B. INITIAL SCENARIO
We will start the analysis with a simple scenario: the defense of an HVU using
one screen ship against one ASM site (Figure 16). This scenario will also provide the
initial approach into how we evaluate the MOE that has been selected.
MAP VIEWER MMHe Zoom Guides Screen Ships Help
2 sites _ J Distance: SO _ Bedimg: OTO
INTEL: CSck on radar icons for inte!LAT : ?4.38f L0NG : 35.87 N
Hgure 16. Main Scenario Window, displaying a convoy with one HVU and a screen snip
to protect the HVU against one ASM site whose bearing is 090° true and distance is
50NM from the HVU.
The details of the scenario are:
• The HVU is 50 NM west of the ASM site (ASM site's bearing is 090 true
from the HVU)
42

• The ASM site delivers 30 Silkworm missiles towards HVU
• A Spruance class screen ship is positioned from 000° to 180° (with
increments of 10°) in bearing and from 1 to 45 NM (with increments of 2
NM) in range.
• Each new position scenario is run 20 times (each of which lasts about 12
minutes in a Pentium® EI processor PC).
1. Range and Bearing Factors
As already stated, the general screen disposition method is used in the DMM in
which each screen ship is positioned with respect to the HVU in range and bearing terms.
Figure 17 illustrates the MOE vs. bearing and range. In the left panel (bearing), the screen
ship is positioned from 000° to 180° with increments of 10° in every range from 1 to 45
NM with increments of 2 NM.
1.0
0.8"
2.0.6
0.2"
00
ASM ale boring is 090 deg-ltruc)
and Jj o-ijv r is 50 nmtlreal uosfOW dcg. U
10-30 30-50 50-70 70-90 90-110 110-1X130-150150-170170-190
0-20 20-40 40-60 60-80 80-100 100-120120-140140-160160-180bearing (deg)
Mil0-2 4-6 8-10 12-14 16-18 20-22 24-26 28-30 32-34 36-38 40-42 44-46
range from HVU (nm)
Figure 17. The graph displaying the percentage hits on HVU for possible ranges and
bearings of screen ship.
43

The smallest percentage value occurs when the screen ship is put between 080°-
100°, and as seen in the left panel of Figure 17, the percentage hit value on HVU starts
increasing as the screen ship is positioned away from that sector. The defense works
pretty well on 080°- 100° sector since the Silkworm missiles are coming from that sector
(090° is the threat axis).
In the right panel (distance), the screen ship is positioned from 1 to 45 NM with
increments of 2 NM in every bearing from 000° to 180° with increments of 10°. The
percentage hit value starts increasing when the screen ship is positioned farther than 25
NM away from the HVU (25 NM is the weapon guidance range limit for a Spruance class
frigate). Using different types of screen ships, it is seen that for best results HVU must be
covered at least within the screen ship weapon range.
Figure 18 displays the results in a three-dimensional way using a surface grid and
a histogram box plot. As seen from both panels in Figure 18, regardless of range factor,
which changes for each type of ship, placing the screen ship on the threat axis (090° here)
undoubtedly seems the best choice for the decision maker.
Figure 18. 3-dimensional surface grid and histogram graph displaying the percentage hits
on an HVU for different ranges and bearings.
44

2. Regression Analysis
As discussed in the first chapter, regression summarizes (or models) complex data
in a compact way, while evaluating evidence for a theoretical claim that there might be
covariation between variables [Ref. 13]. Analysis is now conducted to determine whether
a systematic (non-chance) covariance between the percentage-hit value on HVU and
location values of the screen ship (range/bearing) exists, by way of regression analysis.
Using linear regression methods, our model for this scenario will be:
percentage i= P o + P 1 range i + p 2 sector j
where i = 1,2,3,.. ..,n (number of observations) and p ,i,2 are the coefficients.
The range variable is the actual distance in nautical miles between the HVU and
the screen ship. The sector variable is coded 1 if the screen ship is positioned on the
threat sector, otherwise. The threat sector is considered to be 30° on both sides of the
actual threat bearing. For the above example, the threat bearing is 090°; causing the threat
sector to be a sector between 060°- 120°.
The percentage-hit value is always between 0.0 and 1.0. 0.0% indicates that HVU
gets no hits from the ASM raid while 100% explains a very bad defense formation in
which all missiles hit the HVU. In regression analysis this kind of variable is called a
categorical variable. Categorical variables require different approaches rather than linear
regression methods. Logit regression is the most widely known alternative to linear
regression in this circumstance. In practical use, ordinary regression methods and the
logit regression method have many similarities, although their underlying mathematical
bases are different. The detailed information about logit regression is beyond the scope of
this thesis, and may be found in many statistics textbooks. In short however, it is valuable
45

to know that logit regression prevents the percentage value from exceeding 1.0 and
falling below 0.0. The values beyond these limits will be impossible predictions derived
from reasonable locations of the screen ship.
The new model, using logit regression, will be:
Logiti= P o +Pi range , + p 2 sector i
where i = l,2,3,....,n (number of observations), Po,i,2
are the coefficients and the percentage-hit value will be computed as
percentage =_u .
t
. By using S-PLUS, the calculated coefficients are
po =-2.277822 , p, =0.1064937 and p 2 = -0.7963955 .
Thus, our model becomes:
1
Logiti= -2.3 +0.1 x range , -0.8 x sector , and percentage hit value is
l + e"^"
As an example, if the screen ship is 10 NM away from the HVU with a true
bearing of 110°, which is within the threat sector, then
Logit j=-2.3 +0.1x10 -0.8x1 becomes -2.1 and the percentage hit value becomes
_,_ 2 n=0.11 (%11). This is a very good prediction since the true value is actually
12% when we position the screen ship 10 NM away from the HVU with true bearing of
1 10° using DMM.
The Figure 19 shows the graph of percentage hits on the HVU versus fitted values
derived from the logit regression. The logit regression line covers most of the data points
on the graph, which means that logit regression works for this simple scenario.
46

l I I I
1.0- oo o/ i.. o
0.8- c
>X r/° 0.6-1c
'X5?
0.4-^ jS^.
0.2- e-^<5
I I I 1
0.0 0.2 0.4 0.6 0.8
ftt=1 / (1+exp[-(-2.3+0.1range-0.8sector)])
1.0
Figure 19. Graph of percentage hits on the HVU versus fitted values derived from logit
regression.
As we try to work on some detailed and complex examples (developed scenarios)
in later sections of this chapter, more complex formulations and models will be
considered using more variables, such as the number of ships, total range, and number of
ASM sites, rather than only range and sector variables. However, in dealing with more
variables we may encounter some statistical problems, such as zero effect variable or
multicollinearity between variables. The methods to eliminate these problems will also be
evaluated in this chapter.
3. Improved Scenario
This scenario differs from the above scenario only with an addition of an extra
ASM site. The true bearing of the new site is 270° from the HVU and both ASM sites
have 15 Silkworm missiles, for a total of 30 missiles. Now a convoy consisting of one
47

HVU and one screen ship will try to navigate between two sites, one of which is on the
east and the other on the west side of the convoy. Figure 20 graphs the results in a three-
dimensional way using a surface grid and a histogram box plot.
Figure 20. 3-dimensional surface grid and histogram graph displaying the percentage
hits on the HVU for different ranges and bearings of the screen ships against two ASMsites.
As seen from the above panels, the screen ship that is positioned within 10 NM of
the HVU (regardless of the bearing), due to its effective weapon guidance coverage
within this distance, defends effectively against the incoming missiles from both sites.
But within ranges of 10 to 25 NM, the damage on the HVU increases if the screen ship is
positioned on the threat axes, in particular 090° and 270° (+ 10°). In these ranges, the
least damage occurs when the screen ship is 000° and 180° (+ 10°), which are mid-
bearing values of the two threat axes. As the distance between the HVU and the screen
ship increases, it looks better if the screen ship is placed on one of the threat axes because
it becomes impossible for the screen ship to cover the HVU for the incoming missiles
from both sites. Thus, in long distances, it is better to focus on the missiles coming from
one site by positioning the screen ship on that threat sector. Positioning the screen ship on
48

any other sector at long distances will have the screen ship miss more of the missiles
coming from both sites.
C. OTHER SCENARIOS
1. Two Screen Ships vs. Two ASM Sites
In this scenario, there are two screen ships to protect the HVU against the missiles
from two ASM sites, each of which has 30 Silkworm missiles to fire. The ASM sites'
bearings are 090° and 270° true and they are 50 NM away from the HVU. We will
analyze three different situations:
• Both of the screen ships are on the threat sector ( ± 30° from the threat
axis)
• One of the screen ships is on the threat sector while the other is not.
• None of the screen ships are on the threat sector.
Figure 2 1 illustrates the graph of percentage hits vs. total distance between screen
ships and the HVU (sum of the distances between each screen ship and the HVU).
S 06
Iwo screen ships are on the threat sector
none ot the screen ships is on the threat sector
one screen ship is on the threat sector, the other is not
20nm 40nm 60nmtotal distance ot screen ships from HVU
Figure 21. The scatter plot graph of percentage hit vs. total distance between screen ships
and the HVU together with regression lines for each situation. Positioning the screen
ships on the threat sector provides more effective defense against the incoming missiles.
49

Figure 21 displays both scatter plots of the actual data points and the linear
regression lines related with these data points. The regression lines provide a better
comparison for these three situations than the individual points in the graph. As seen
from the fitted lines on the above graph, the more screen ships placed out of the threat
sector, the less effective the defense shield is in defending the HVU. However, this
comparison would be too hard to make with the scatter plot.
Positioning more ships on the threat sector provides not only a better defense, but
also a reduction in "incoming missile per screen ship rate". Thus, as more screen ships
are positioned outside the threat sector, the number of missiles they have to kill (homing
missiles towards them) increases. Since the screen ship is far away and out of the threat
sector and consequently cannot cover its own missiles, the other screen ship has to
intercept with more inbound missiles (more than 30) from both sites. Figures 22, 23, and
24 show this increment for three different situations in frequency histogram plots. The
location term in the x-axis of each graph indicates that the screen ships are put on 32
different locations. In Figure 22, for example, both screen ships are positioned on 32
different locations on their threat sectors while in Figure 23 ships are positioned in the
same number of locations but with one screen ship on the threat sector and the other out
of the threat sector. In each location point of these three graphs the distance between the
screen ship and the HVU remains the same. For example, in the first location in Figure 22
the distance between one of the screen ships and the HVU is 6 NM and the distance
between the other ship and the HVU is 12 NM, and both are on their threat sectors.
However, in Figure 23 the distance values remain the same (6 NM and 12 NM) for the
first location, but one of the screen ship is on the threat sector and the other is not. This is
true for the locations one through thirty-two with different distance values.
50

50
40
.30
^so-
io
-
Both the screen ships are on the threat sector
T V 1 i M i i i i i i r i i i
<,
i^A La!
r1 3 5 7 9 11 13 15 17 19 21 23 25 27 29 31
location
Figure 22. The frequency histogram graph showing the efforts both screen ships spend
when positioned on the threat sector. The darker bars indicate that they have to defend
more than 30 missiles only five times.
40
9i 30
20
-
One of th< screen ships is on the threat sector
-
i i i :
11
i ! i
1
i i
nTnn
10
1 3 5 7 9 11 13 15 17 19 21 23 25 27 29 31
location
Figure 23. The frequency histogram graph showing the efforts both screen ships spend
when positioned one on the threat sector and the other out of the threat sector. They have
to defend more than 30 missiles eight times.
51
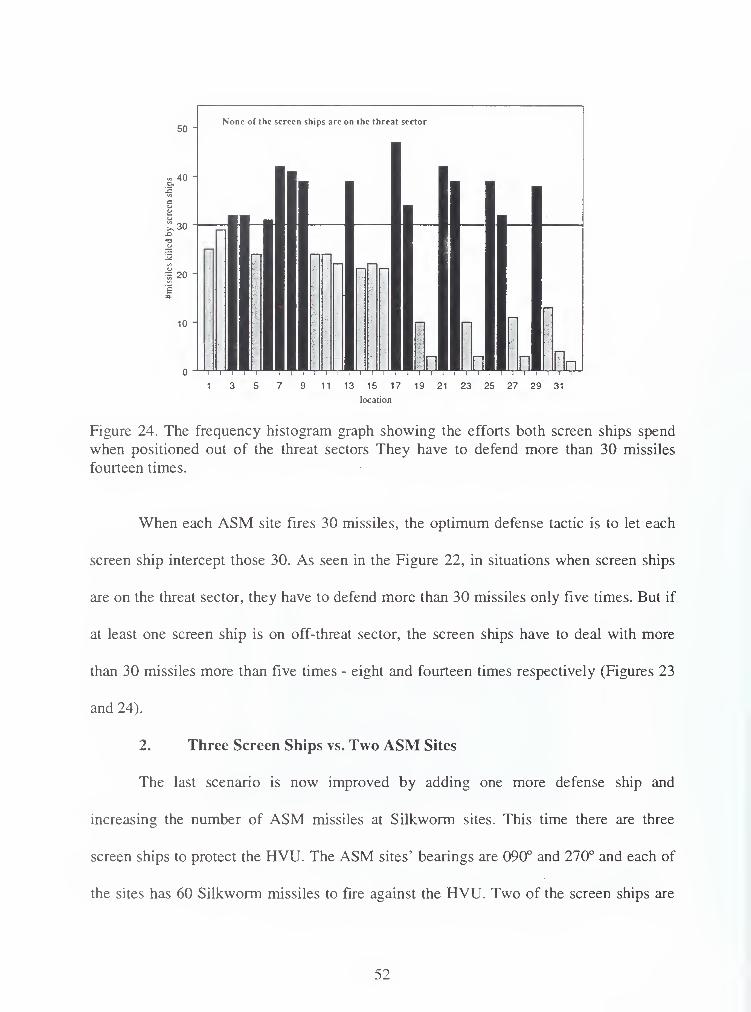
50 "None of the screen ships are on the threat sector
» 40 "
a
euu
n>siles
killed
by
o
c
-1
1
r-|r-i i-i
pi[--.
14t
10-
o-^
i I i i i i i i 't1TT 1 1
0"V nn
1 3 5 7 9 11 13 15 17 19 21 23 25 27 29 31
location
Figure 24. The frequency histogram graph showing the efforts both screen ships spend
when positioned out of the threat sectors They have to defend more than 30 missiles
fourteen times.
When each ASM site fires 30 missiles, the optimum defense tactic is to let each
screen ship intercept those 30. As seen in the Figure 22, in situations when screen ships
are on the threat sector, they have to defend more than 30 missiles only five times. But if
at least one screen ship is on off-threat sector, the screen ships have to deal with more
than 30 missiles more than five times - eight and fourteen times respectively (Figures 23
and 24).
2. Three Screen Ships vs. Two ASM Sites
The last scenario is now improved by adding one more defense ship and
increasing the number of ASM missiles at Silkworm sites. This time there are three
screen ships to protect the HVU. The ASM sites' bearings are 090° and 270° and each of
the sites has 60 Silkworm missiles to fire against the HVU. Two of the screen ships are
52
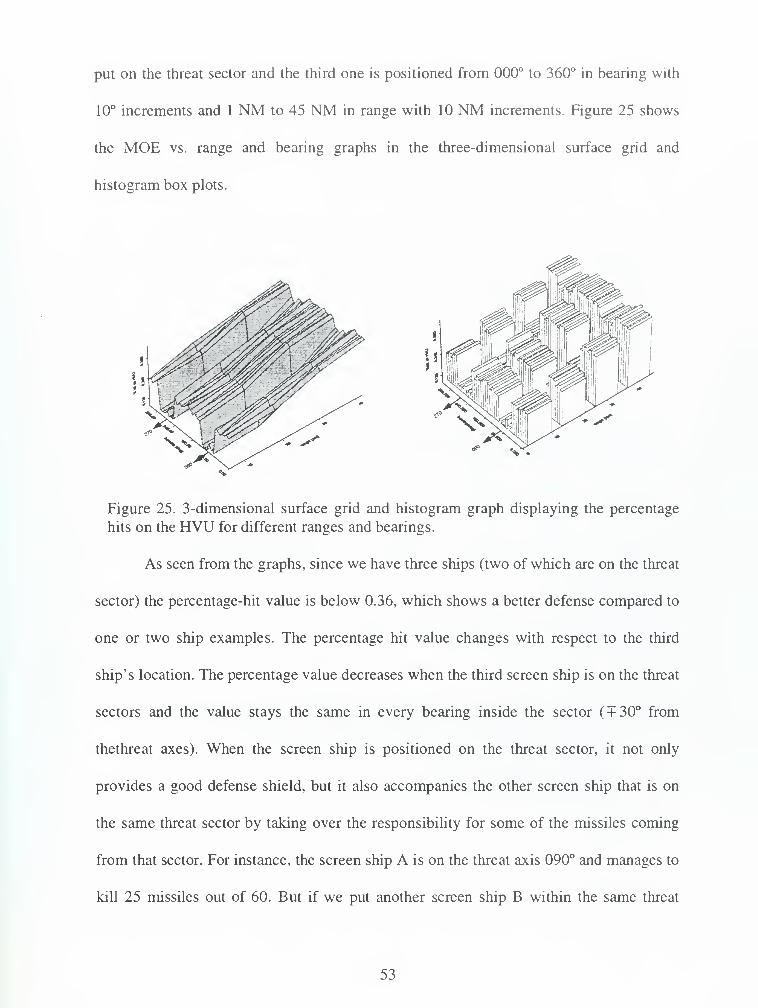
put on the threat sector and the third one is positioned from 000° to 360° in bearing with
10° increments and 1 NM to 45 NM in range with 10 NM increments. Figure 25 shows
the MOE vs. range and bearing graphs in the three-dimensional surface grid and
histogram box plots.
Figure 25. 3-dimensional surface grid and histogram graph displaying the percentage
hits on the HVU for different ranges and bearings.
As seen from the graphs, since we have three ships (two of which are on the threat
sector) the percentage-hit value is below 0.36, which shows a better defense compared to
one or two ship examples. The percentage hit value changes with respect to the third
ship's location. The percentage value decreases when the third screen ship is on the threat
sectors and the value stays the same in every bearing inside the sector ( + 30° from
thethreat axes). When the screen ship is positioned on the threat sector, it not only
provides a good defense shield, but it also accompanies the other screen ship that is on
the same threat sector by taking over the responsibility for some of the missiles coming
from that sector. For instance, the screen ship A is on the threat axis 090° and manages to
kill 25 missiles out of 60. But if we put another screen ship B within the same threat
53
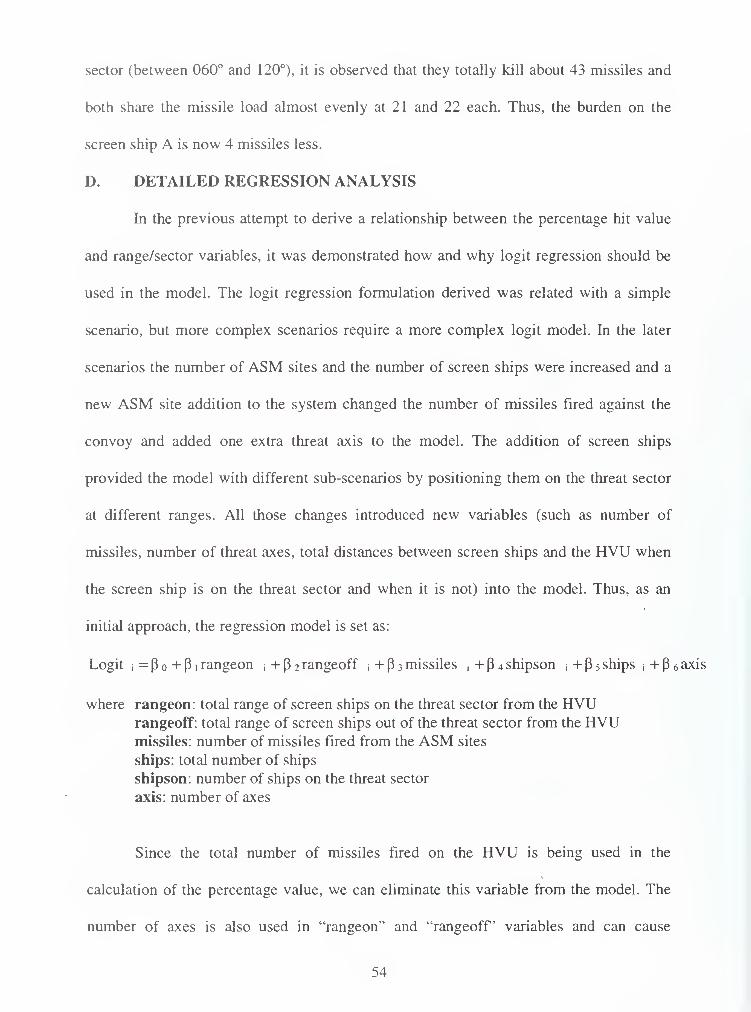
sector (between 060° and 120°), it is observed that they totally kill about 43 missiles and
both share the missile load almost evenly at 21 and 22 each. Thus, the burden on the
screen ship A is now 4 missiles less.
D. DETAILED REGRESSION ANALYSIS
In the previous attempt to derive a relationship between the percentage hit value
and range/sector variables, it was demonstrated how and why logit regression should be
used in the model. The logit regression formulation derived was related with a simple
scenario, but more complex scenarios require a more complex logit model. In the later
scenarios the number of ASM sites and the number of screen ships were increased and a
new ASM site addition to the system changed the number of missiles fired against the
convoy and added one extra threat axis to the model. The addition of screen ships
provided the model with different sub-scenarios by positioning them on the threat sector
at different ranges. All those changes introduced new variables (such as number of
missiles, number of threat axes, total distances between screen ships and the HVU when
the screen ship is on the threat sector and when it is not) into the model. Thus, as an
initial approach, the regression model is set as:
Logiti= P o + P i rangeon , + P 2 rangeoff i + P 3 missiles , + P 4 shipson , + P 5 ships j + P 6 axis
where rangeon: total range of screen ships on the threat sector from the HVUrangeoff: total range of screen ships out of the threat sector from the HVUmissiles: number of missiles fired from the ASM sites
ships: total number of ships
shipson: number of ships on the threat sector
axis: number of axes
Since the total number of missiles fired on the HVU is being used in the
calculation of the percentage value, we can eliminate this variable from the model. The
number of axes is also used in "rangeon" and "rangeoff variables and can cause
54
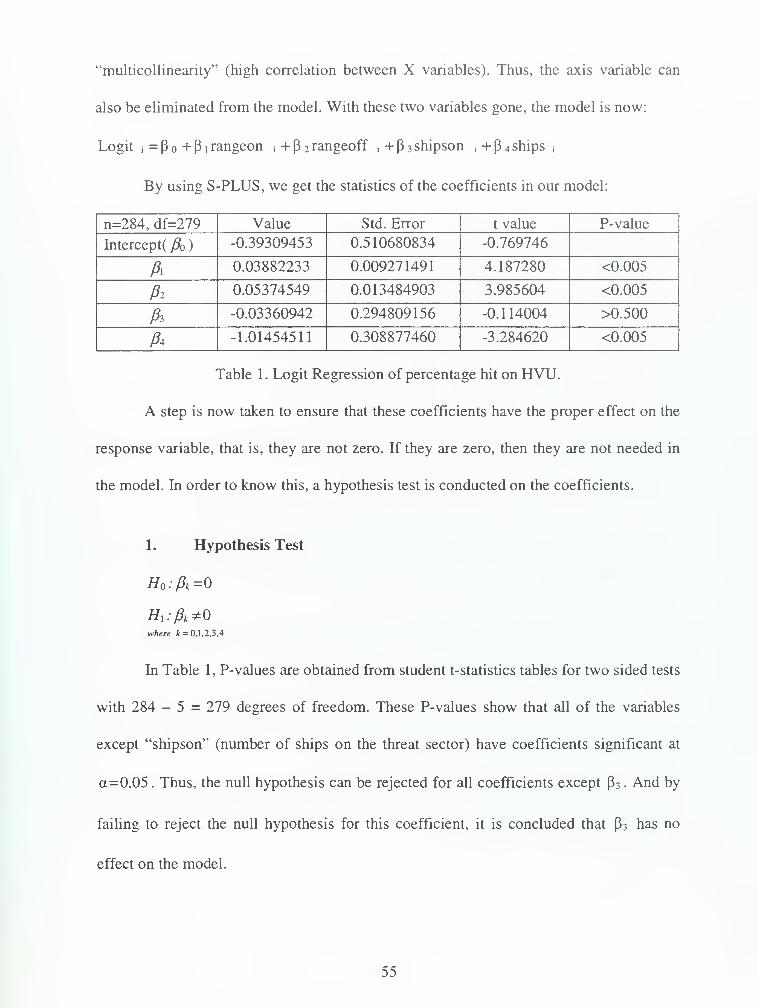
"multicollinearity" (high correlation between X variables). Thus, the axis variable can
also be eliminated from the model. With these two variables gone, the model is now:
Logit ;= P o + P i rangeon , + P 2 rangeoff , + P 3 shipson j + P 4 ships ,
By using S-PLUS, we get the statistics of the coefficients in our model:
n=284, df=279 Value Std. Error t value P-value
Intercept /3 )-0.39309453 0.510680834 -0.769746
0.03882233 0.009271491 4.187280 <0.005
A 0.05374549 0.013484903 3.985604 <0.005
A -0.03360942 0.294809156 -0.114004 >0.500
A -1.01454511 0.308877460 -3.284620 <0.005
Table 1. Logit Regression of percentage hit on HVU.
A step is now taken to ensure that these coefficients have the proper effect on the
response variable, that is, they are not zero. If they are zero, then they are not needed in
the model. In order to know this, a hypothesis test is conducted on the coefficients.
1. Hypothesis Test
Ho :0k =O
Hi:fit*0where k = 0.1.2.3,4
In Table 1 , P-values are obtained from student t-statistics tables for two sided tests
with 284 - 5 = 279 degrees of freedom. These P-values show that all of the variables
except "shipson" (number of ships on the threat sector) have coefficients significant at
a=0.05 . Thus, the null hypothesis can be rejected for all coefficients except p 3 . And by
failing to reject the null hypothesis for this coefficient, it is concluded that p 3 has no
effect on the model.
55

Without the shipon variable, the new model is:
Logiti= P o + P i rangeon , + P 2 rangeoff , + P 3 ships ,
By using S-PLUS, the statistics of the coefficients in the new model are:
n=284, df=279 Value Std. Error t value P-value
Intercept /?o
)
-0.37007626 0.469053657 -0.7889849
0.03859041 0.009041703 4.2680469 <0.005
Pi 0.05458885 0.011301562 4.8302042 <0.005
A -1.05374942 0.221938280 -4.7479390 <0.005
Table 2. Logit Regression of percentage hit on HVU.
By checking P-values in Table 2, the null hypothesis is rejected that all
coefficients do not have zero effect on the percentage-hit variable (response variable) at
significance level a =0.05 .
It has also been seen that the combination of the shipon variable (the one that was
eliminated) with other variables actually does not bring a significant improvement into
the latest model fit.
Logit;= - 0.37 + 0.039 rangeon ,+ 0.055 rangeoff - 1 .054 ships .
The regression formula of the model becomes:
fit : percentage =-( -0.37 +0.039 rangeon
j+0.055 rangeoff
j-1.054ships
{)
Figure 26 illustrates the regression fit graph. The regression line covers most of
the data points, revealing a good fit.
56

Figure 26. Graph of percentage hit on the HVU versus fitted values derived from logit
regression.
2. Interpretation
The logit equation from Table 2 is approximately:
Logit • =-0.37 +0.039 xrangeon +0.055 xrangeoff -1.054 x ships •
where rangeon is the total distance between the ships on the threat sector and the HVU,
rangeoff is again the total distance between ships off the threat sector and the HVU, and
ships variable indicates the number of screen ships in the convoy.
This formulation is intended to find the conditional effects of each variable on the
percentage-hit value. Since the input variables are not accurate due to their classified
status, the results from this formulation might not always compute the actual damage on
the HVU.
57

Each coefficient with reference to the percentage-hit value can now be
interpreted. For rangeon variable, with each additional 1 NM total distance of screen
ships on the threat sector from the HVU, all other variables being at their averages, the
predicted logit is now:
Alogitj =- 1.8+ 0.039x rangeon
j
The linear relationship between rangeon and predicted logits implies a curvilinear
relationship:
1
percentage = _(_L88+0.039xrangeon.)
1+e6
1
The relationship between rangeoff variables and the percentage hit values changes
Awith percentagej =
-(-1.75+0.055xrangeoff-)'
1+e '
For instance, for every new ship addition to the convoy, with the other two
variables having their average values (18 and 28 for rangeon and rangeoff respectively),
the following predicted logit equation is now determined:
Logitj=1.72-1.054 x ships
j
And the curvilinear relationship between number of ships and the percentage-hit
Aj
value implies percentage: = -——
—
, ^„,——. Figure 27 illustrates theF F b
l -(1.72-1.054xships-)to
1+e 1
conditional effects of each variable at average levels of the remaining variables.
58

10 15 20 25
total dstarce (nm) * ships added
Figure 27. Conditional effects of range and number of ship variables at average levels of
the other variables. (Left panel) As the screen ships are placed farther from the HVU, the
conditional effect on the percentage damage increases, but a larger effect appears for the
screen ships out of the threat sector. (Right panel) If the convoy is provided with more
ships, the conditional effect decreases curvilinearly.
From the graphs in Figure 27, it is easy to interpret that the number of ships has
the most effect on the percentage-hit value with rangeon the second most effective.
E. TACTICS
In the preceding chapter it was pointed out that the screen ships' (effective)
positioning for the defense against the land-based AAW threats could provide successful
work for the safety of the convoy. For some small navies that can not provide more
defensive ships per HVU, the advantages of effective positioning become very important.
Vessels for convoy operations do not have to be many in number; in fact, for
much of the work in minefields, which is another big threat in the littoral arena, it would
be better to have fewer ships by reason of reducing "the ships per mine ratio." In a multi-
threat arena or during a conventional war, it would seem necessary to have fewer but
effectively coordinated ships per mission. Otherwise, gaining one and losing more would
not yield an appropriate balance in the war effort.
59

The DMM has yielded significant insights towards the defense of a convoy. It is
seen that effective positioning of the escort ships reduced the damage on the HVU and
also balanced the defensive load of each defense ship for the incoming missiles. The
following are some scenarios that will help to interpret what has been seen so far.
1. Range vs. Bearing
It has been shown that screen ships, regardless of their distances from the HVU,
should be on the threat sector when they are to defend against more than one ASM site.
This is especially important for emergency reactions, where taking positions on the threat
sector takes less time than positioning on the distance necessary for effective weapon
coverage range. Figure 28 shows a similar scenario.
MAP VIEWER"*""« ';' —tt -
BAHMMMMmMMBB
File Zoom Guides Screen Ships Help
2 sites Distance: 0-0
Click on radar icons for irrteLAT :
23.59 EL0NG:
35.60 N
Figure 28. The Main Scenario Window, displaying a scenario. For quick maneuvers the
delay resulted from taking positions on the threat sector or inside the effective weapon
range might be very important since the attack might come any minute.
60

As seen from the above picture, the screen ships A and B must move to their
defensive locations. But assuming that their maximum speeds are 30 kts., they position in
their threat sectors about 20 minutes earlier than the time they position on their effective
weapon guidance range and start defending. This time delay might be important if it is
unclear about the exact time the attack starts. In the preceding chapter it was also shown
that a screen ship within the threat sector could provide a defense as effective as being on
the effective weapons range.
In the last part of the regression modeling, it was also seen that being within the
threat sector affects the defense more positively than being on the effective range (Figure
25 left panel).
2. More Than One Ship On Threat Sector
If more screen ships exist than the number of threats, the remaining ships must
also be positioned on the threat sector. This positioning brings along two advantages to
the defense: less damage on the HVU and a reduction in the incoming missiles per screen
ship rate.
For the ranges explored, the threat sector is + 30° from the threat axis. And in
Figure 25, it was seen that the damage percentage on the HVU did not change as long as
the extra ship was in that sector ( + 30° from the threat axis). Thus, assuming that there
might be other threats from other directions, the extra screen ship should be positioned on
the outer sides of the threat sector. For a threat axis with a true bearing of 090°, one ship
on the exact threat axis and the other one on the 120° or 060° (according to possible other
attacks direction) is more effective. This positioning also helps the screen ships in
defending fewer missiles while the convoy as a whole makes a more effective defense
(Figures 22, 23, and 24).
61
F. SUMMARY
The prominent trend in war games is away from cover, deception and dispersion
of a TF, and toward essential tactics to survive and perform the duty. If this duty is to
protect a valuable unit, which is the core of the ongoing operations, then the players focus
on the tactics to build a concentrated force to defend this unit against the hostility.
In this chapter, a method was explored for analyzing the effectiveness of various
defensive options in enhancing the safety of the HVU. For the survivability issue of the
HVU, the percentage hits on the HVU is deemed to be an appropriate MOE.
A simple scenario was begun and built upon with more complex examples in
order to make a comparative analysis of the MOE. The regression analysis was
introduced to study the conditional effects of the range, bearing and the number of ship
variables in the model.
The analysis proved how to form an effective positioning by examining the results
derived from the conditional effects of each input in the regression model. It was seen
that positioning the screen ships on threat sector would be the effective disposition
resulting in less damage on the HVU against the ASM's. Two main results derived from
the threat sector-positioning tactic are as follows:
• Reduction in the damage of the HVU.
• Reduction in the weapon load of each screen ships.
The overall conclusions and recommendations for future tactics will be discussed
in the next chapter.
62

V. CONCLUSIONS AND RECOMMENDATIONS
A. CONCLUSIONS
In this thesis, we have sought to explore an analysis tool in the area of screen
defense of a convoy against the land-based ASM's.
The Graphical User Interface (GUI) has yielded a significant capability to
simulate a battle space with all entities (ships, sensors, missiles etc.) necessary to form a
convoy screen and the hostile elements.
The simulation part of DMM (ASMD model) has proved to be sufficient to
simulate an exact model of a battle scenario by the help of a very sophisticated
mathematical package. Thus, the movement of each entity in the model is designed to be
more realistic with the accelaration and turning rate factors.
The results obtained from the model are intended to provide more quantitative
information than the results of the regular models that are only interested in the
survivability of the HVU. The result of each run is displayed in a comparative way on the
simulation running window. Thus, the result of a scenario can be easily compared with
another scenario by only clicking the information (wheel) button on the simulation
running window.
All those properties are used as an initial approach to the future development of
related OR topics. The modularity and scalability of the model enables the future
analysist to extend his work from the DMM and develop the model into new areas.
63

B. RESULTS OF THE ANALYSIS
Based on extensive usage of regression methods, a comparative analysis approach
was used throughout this study. With logistic regression methods, the MOE (percentage-
hit on the HVU) is intended as a comparative mean for different scenarios.
The estimated regression equations were used to study the conditional effects of
the range, bearing and the number of ship variables in the model. This approach was
needed to see the effects of each variable in terms of damage criteria. The results show
that more escort ships make a better defense of the convoy. However, the analysis has
also showed that for small navies that could not afford more screen ships per HVU,
positioning the escort ships within the threat sector provides an effective defense as well.
Having examined the defense load for each escort ship, the threat sector-
positioning tactic also proved to be more effective. As more screen ships are placed
within the threat sector, their defensive responsibility is reduced; thus they must deal with
fewer incoming missiles, so the overall defense is more effective.
C. DEVELOPMENT OF DMM
Using DMM, the strengths and weaknesses of a few convoy formations were
demonstrated as a preliminary analysis. The goal of this study was to provide a method
for analyzing the effectiveness of these formations, but a definitive analysis would
examine many more scenarios. By spending more effort on the model, new insights can
be gained by the decision-maker.
The DMM uses the ASMD model in its simulation part. The ASMD model fully
emulates the actual motion of missiles in space, with objects that accelerate and turn
smoothly. The mathematical package, which features more sophisticated motion
64

parameters, can be easily utilized for future analysis to render moving objects even more
accurately.
The DMM's GUI provides the user with such a user-friendly environment that
even those who might not know the model can easily set a scenario and run the model.
The GUI is designed to work only for defensive means and against, at most, two threats.
But with the modularity and scalability features of the DMM, the model can support
different scenarios with easy changes.
The features of ships are loaded from an INI file. This is adequate for little data.
However, on the development of the new models, it is recommended that a database
program be implemented. More effort, however, is required for database modification
into the model using Java™ programming language.
D. ADAPTATION OF DMM IN THE TURKISH NAVY
This study must be regarded as only the first step toward enhancing the safety of
the Turkish Naval Forces at sea. To manage this enhancement, the battlefield in DMM is
designed as a littoral arena, resembling the Aegean and the Mediterranean Seas with
many islands, isles, etc. The real maps were not intended to be used in this model for the
unclassified scope of this study. But the real map usage could be easily adapted into this
study by changing a few features of the model.
In adaptation process of this model into the Turkish Navy, the features to be
employed (recommended) are as follows:
• More accurate and classified data.
• A new simulation model extended from the ASMD model is to be
implemented in order to simulate the ASW, ASUW and Anti-Mine
65

•
Warfare. The ASMD model and the DMM's GUI are well suited to the
planning and execution of these operations.
The database usage instead of INI file property.
The modification of the model in order to run in a network environment.
This modification allows the model to have a real war game feature. For
example, the model can be rewritten as a Java™ applet, which can be run
in a browser, instead of an application, so blue and red sides can play in
two different environments.
66

APPENDIX A. INI FILE INTERACTION IN DMM
A. INI FILES
Many applications written for Windows® have INI files which are used to store
initialization data. Two examples from Windows® itself are win.ini and system.ini.
DMM uses the INI file format as its primary configuration method. For example, a file
called ships.ini, which is in the actions directory, is used to represent initialization data
related with the HVU and the screen ships. An INI file is divided into sections. Part of the
ships.ini file looks like this:
[GUIDE]shipl = USS KITTY HAWKship2 = USS CONSTELLATIONship3 = USS ENTERPRISEship4 = USS AMERICA
[SCREEN SHIP CLASS]classl =YAVUZ CLASSclass2 = KNOX CLASSclass3 = PERRY CLASSclass4 = SPRUANCE CLASS
[USS KITTY HAWK]hullno = CVN 63
speed = 32
aircraft = 85
crew = 5600
weapons = Sea Sparrow Phalanx
airradar = SPS 64
surradar = SPS 55
[YAVUZ CLASS]shipl =TCGYAVUZship2 = TCG YILDIRIMship3 = TCG TURGUTREISship4 = TCG FATIH
[TCG YILDIRIM]hullno = F 243
speed = 27
crew = 200
SAM = Sea Sparrow Mk 29
gun = Sea Zenith
airradar = DA08surradar = AWS 6 Dolphin
67

The ENI files are divided into two sections: the part in the square brackets ([ ]) is defined
as the "block" and each of the following lines separated by equals (=) gives a "keyname"
and its setting, the "keyvalue." Thus, in the block "GUIDE" the key value for the
keyname shipl is USS KITTY HAWK in the above example. In the ships.ini file, key
values associated with ship's names and ship's classes appear to be the block names. By
way of this structure, in the same file the very most detail of a ship can be reached.
B. READING FROM AN INI FILE
The goal in reading an INI file is to retrieve data stored therein. By having the
keyname as the word to be looked up and the keyvalue as the definition of that word, it is
possible to use an INI file as a glossary.
In ships.ini the blocks are designed to represent the names or the classes of the
ships. If we need to know the names of YAVUZ class frigates (German made frigates in
the Turkish Navy), we start to look up the block name [YAVUZ CLASS] and the
keyvalues under that block name. In the same way, if we want to know the speed of TCG
YILDIRIM (a YAVUZ class frigate), we need to find the block name with the same
name [TCG YILDIRIM] and then the keyname, "speed". The keyvalue "27" is the
answer referring to the speed.
INIFileProperties class, written by Professor Arnold Buss, provides a mechanism
to read the blocks and key/value pairs from an INI file. Since it extends
java.util.Properties, anything can be done to it concerning the Properties objects. It uses
the block names as keys for Hashtables of the key name/value pairs specified in each
block.
6X

1. Summary of Program
In a nutshell, the user is prompted to select an INI file. The load method is used to
read the properties from an input stream and adds them to the properties list. The search
for reading starts from the comments lines, which starts with " # " or ";
", but the
program skips those comments and starts directly from the lines starting with "[
". After
finding a line starting with "[
" and ending with "]
" and appropriate keyvalues
following this block, the block is put into a Property object and the keyvalues are put
(fixed) into this block. Thus, the program, after finding the block [YAVUZ CLASS],
relates every keyvalues under this block name (TCG YAVUZ, TCG YILDIRIM, TCG
TURGUTREIS, and TCG FATIH) to the blockname as seen in Figure 29.
new PropertiesQ
IYAVUZ CLASS
TCG YAVUZ - TCG YILDIRIM - TCG TURGUTREIS - TCG FATIH
Figure 29. The INTFileProperties class, takes the block names and makes them objects of
type Properties.
The other methods in the INIFileProperties class are mainly used to get the
specific key values from the blocks or the blocks themselves.
2. Source Code
package actions;
import java. io.*;
import Java. util.*;
69

public class INIFileProperties extends Properties{
public void load(String filename){
filename.replace(\V, V);
int lineNumber = 0;
try {
FileReader instream = new FileReader(filename);
BufferedReader input = new BufferedReader(instream);
StringTokenizer tokens = null;
Properties currentBlock = null;
for (String nextLine = input.readLine(); nextLine != null; nextLine = input.readLine()){
lineNumber++;
if (nextLine.startsWithC;") II nextLine. startsWith("#") ){ }
else if (nextLine.startsWith(T) && nextLine.endsWith("]")){
tokens = new StringTokenizer(nextLine, "[]");
if (tokens.countTokens()= 1) {
currentBlock = new Properties();
this.put(tokens.nextToken(), currentBlock);
}
else{
throw new IllegallNIFormatException (
"Improper format in " + filename + " on line " + lineNumber +":\n" +
nextLine);
}
1
else if (currentBlock != null){
tokens = new StringTokenizer(nextLine, "=");
switch (tokens.countTokens()){
case 0:
break;
case 1:
currentBlock.put(tokens.nextToken().trim(), "");
break;
case 2:
currentBlock.put(tokens.nextToken().trim(), tokens.nextToken().trim());
break;
default:
throw new IllegallNIFormatException (
"Improper format in " + filename + " on line " + lineNumber +":\n" +
nextLine + "[# tokens = " + tokens.countTokensQ + "]");
input.close();
}
catch (FileNotFoundException e) {System.err.prinfln(e); e.printStackTrace(System.err);
catch (IOException e) {System.err.println(e); e.printStackTrace(System.err);}
)
public Properties getProperties(String key){
return (Properties) this.get(key);
70

public Object getINIProperty(String block, String key){
return getProperties(block).get(key);
I
public Object getINIProperty(String block. String key, Object defaultValue)
Object o = this.getINIProperty(b!ock, key);
return (o != null) ? o : defaultValue;
public String toString(){
StringBuffer buf = new StringBuffer();
Properties prop = null;
for (Enumeration e = this.keys(); e.hasMoreElements(); ) {
Object key = e.nextElement();
buf.append(Xn');
buf.appendCH;
buf.append(key.toStringO);
buf.append(T);
buf.appendCVn7
);
try{
prop = (Properties) this.get(key);
for (Enumeration f = prop.keys(); f.hasMoreElements();){
Object key2 = f.nextElement();
Object value2 = prop.get(key2);
buf.append(key2.toString());
buf.append(" = ");
if(value2 != null){
buf.append(value2.toString());
}
buf.appendCVn');
}
}
catch (ClassCastException ex) {buf.append(this.get(key).toString());}
catch (NullPointerException ex){
}
}
return buf.toString();
}
public String listBlocks() {
StringBuffer buf = new StringBuffer();
for (Enumeration e = this.keys(); e.hasMoreElements();) {
buf.append(e.nextElement().toStringO);
buf.append(Vi');
}
return buf.toStringQ;
public String specificValue(String blockName, String key){
return (String)getProperties(blockName).get(key);
}
public String getKey(String blockName, int index){
int i = 0;
String str = " ";
for (Enumeration e = getProperties(blockName).keys();e.hasMoreElements();)
Object en = e.nextElementQ;
71

if (i==index) {
str = en.toStringO;
}
i++;
}
return str;
public static void main(String[] args){
INIFileProperties prop = new INIFileProperties();
prop.load(args[0]);
System. out.println(prop.listBlocks());
System.out.println(prop.specificValue("USS NIMITZ", "speed"));
System.out.println(prop.getKey("USS NIMITZ", 0));
I
72

APPENDIX B. ASMD MODEL
Combat in the ASMD model is conducted between entities at the Composite Unit
level. A Composite Unit, for the purpose of the ASMD model, is a group of special
purpose functional components that operate together. Using the premise of small reusable
object programming, these composite units are created from several smaller components
that seek to model the precise behaviors of the composite unit. A mover, for example, is
created with some behaviors like movement, sensor capability and defensive factors
(firing). The screen ships with more specific and particular behaviors are easily extended
from this mover as a tactical unit. Missiles are also an extension of the mover element
without having a defensive capability. The ASM sites are also movers with zero speed.
The main components of the Composite Unit are:
• Controller (two/three-dimension)
• Mover (two/three-dimension)
• Sensory Elements
• Firing Elements (interactor)
The interaction (communication) between composite unit elements is controlled
by a referee component. The referee informs other components about runtime events such
as a new missile fired from an ASM site or the direction and speed of a new composite
unit.
The referee component tasks are:
• Register
• Mover Sensor Mediator
• Missile Target Mediator
73

These component elements will work together to model the Composite Unit as
described below.
A. MAIN COMPONENTS
1. Controller (MoverBrain)
Every entity in the ASMD model has one common behavior: movement. The
ships, missiles and even the ASM sites are all movers. An object called MoverBrain
controls the movement of these entities.
MoverBrain is a relatively simple object that controls a mover object. It stores the
list of destinations and times that the mover will traverse. Once the movement starts, it
examines the movement capabilities of the mover and plans the best series of maneuver
operations necessary to cause the Composite Unit to arrive at the next location at the
correct time. MoverBrain dictates the turn rate, speed adjustments and the duration for
these maneuvers to the mover.
Some of the entities, like ships, move to their destinations in two-dimension along
the surface of the earth (2DMover) while some, like missiles, move in three-dimension
(3DMover). The MoverBrain2D and MoverBrain3D make these adjustments accordingly.
The MoverBrain3D, for example, directs a 3DMover at a certain rate and duration to
change altitude.
2. Mover (FullMover)
Units like HVU and screen ships, ASM sites and missiles all extend from the
mover object having an associated MoverBrain. An object called FullMover manages
movement of a mover. Depending on the type of movement desired for the Composite
Unit (two/three-dimension), FullMover2D and FullMover3D are used to accomplish it.
74
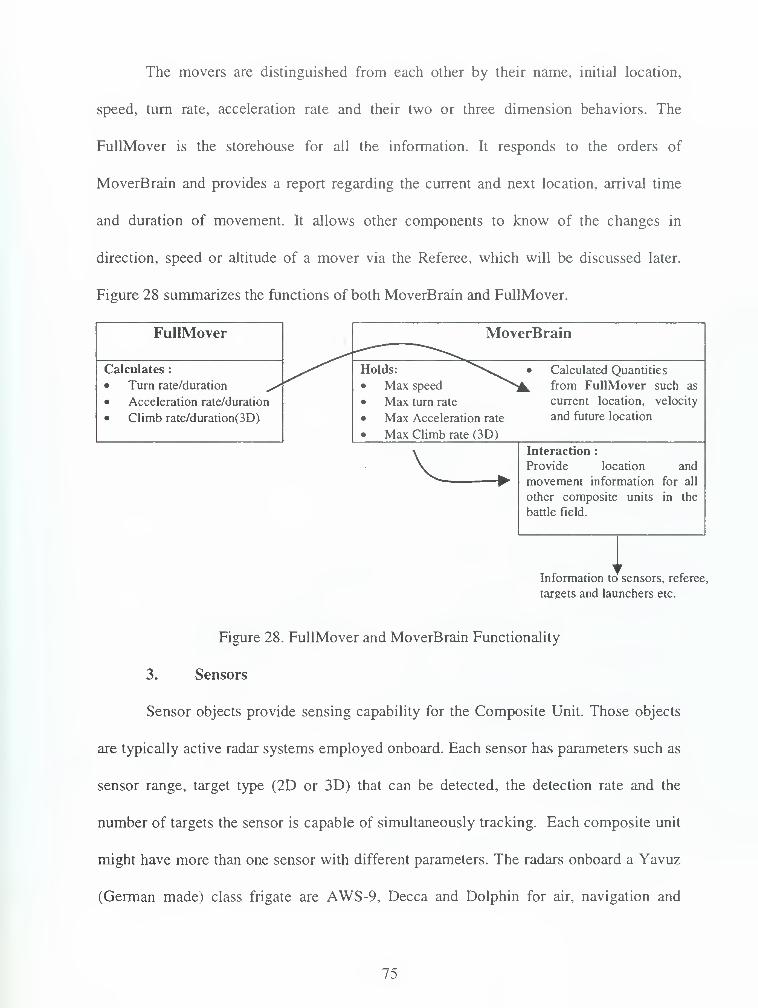
The movers are distinguished from each other by their name, initial location,
speed, turn rate, acceleration rate and their two or three dimension behaviors. The
FullMover is the storehouse for all the information. It responds to the orders of
MoverBrain and provides a report regarding the current and next location, arrival time
and duration of movement. It allows other components to know of the changes in
direction, speed or altitude of a mover via the Referee, which will be discussed later.
Figure 28 summarizes the functions of both MoverBrain and FullMover.
FullMover
Calculates :
• Turn rate/duration
• Acceleration rate/duration
• Climb rate/duration(3D)
Holds:
• Max speed
• Max turn rate
• Max Acceleration rate
• Max Climb rate (3D)
Calculated Quantities
from FullMover such as
current location, velocity
and future location
Interaction :
Provide location and
movement information for all
other composite units in the
battle field.
iInformation to sensors, referee,
targets and launchers etc.
Figure 28. FullMover and MoverBrain Functionality
3. Sensors
Sensor objects provide sensing capability for the Composite Unit. Those objects
are typically active radar systems employed onboard. Each sensor has parameters such as
sensor range, target type (2D or 3D) that can be detected, the detection rate and the
number of targets the sensor is capable of simultaneously tracking. Each composite unit
might have more than one sensor with different parameters. The radars onboard a Yavuz
(German made) class frigate are AWS-9, Decca and Dolphin for air, navigation and
75

tracking purposes respectively. In the DMM, all three are implemented to model a Yavuz
class frigate as a screen ship.
The sensor broadcasts messages to the Referee and FireDistributer whenever it
detects or loses a target. The sensor can be changed from "on" to "off or vice-versa. The
sensor also informs the Referee about this behavior. Figure 29 illustrates the functionality
of sensor elements.
Location and movement
information from the
mover
Sensor
Holds:
• Range
• Detection rate
• Number of targets
Interaction:
Provide sensor status
and list of current
targets.
\Launcher
Holds:
• Fire rate
• Launch capacity
FireDistributor
Determines which
launcher will fire
Interaction:
Respond to Launch orders
from FireDistributor and
create new missile entities
Figure 29. Sensor and Launcher Functionality
4. Firing Element
Launcher objects provide the Composite Unit with the firing capability. This
behavior performs the defensive actions for the screen. Each launcher possesses
properties that control the launch rate quantity and types of missiles that can be launched.
The launcher responds to orders from the FireDistributor.
76

The FireDistributor performs the decision logic necessary to allocate fire against
enemy forces. The convoy has one FireDistributor which coordinates AAW firing against
each ASM. ASM sites have also one FireDistributor which allocates ASM attacks.
Whenever a sensor detects a new target, it informs the FireDistributor. It is then the
FireDistributor's mission to allocate an appropriate weapon against this new target. It
makes the necessary calculations to know which system can intercept the target first. The
FireDistributor is a kind of MoverBrain, but for launcher objects (Figure 29).
B. REFEREE COMPONENT
Every war game needs an unallied, honest broker in the battlefield that resolves
issues between opponents. As the name implies, Referee provides the necessary
components that resolve issues among movers, sensors and their targets. Register, for
example, is the component that reacts to the addition of a new Composite Unit (a new
missile) and creates a Mediator between the missile and its target. The
MoverSensorMediator adjudicates the interaction between a moving target and a sensor
evaluating when and if the mediated target becomes detected or remains undetected by
the mediated sensor. MissileTargetMediator is another component that adjudicates the
interaction between missiles that are homing against a target. The mediator listens to the
movements of the target and directs the missile to adjust its flight for interception with
the target.
77

THIS PAGE INTENTIONALLY LEFT BLANK
78

LIST OF REFERENCES
1. Macfadzean, Robert H. M., Surface-Based Air Defense System Analysis, Artech
House, 1992.
2. Law, Averill M. and D. W. Kelton, Simulation Modeling And Analysis, McGraw-Hill, Inc., 1991.
3. Brooks, A., S. Bankes, and B. Bennett, Weapon Mix And Exploratory Analysis,
Rand Corp., 1993.
4. Hughes, Wayne P. Jr., Captain, U.S.Navy (Retired), Fleet Tactics And Coastal
Combat, Naval Institute Press, 1999.
5. Morse, Philip M., and G. E. Kimball, Methods of Operations Research,
Technology Press, MIT, 1952.
6. Hughes, Wayne P. Jr., Captain, U.S.Navy (Retired), Fleet Tactics Theory and
Practice, Naval Institute Press, 1986.
7. Wade, John F.G., Navy Tactics, Doctrines, and Training, And Training
Requirements for Littoral Warfare, Master's Thesis, Naval Postgraduate School
Monterey, CA., 1996.
8. Arnzen, A., Software Components for Air Defense Planning, Master's Thesis,
Naval Postgraduate School Monterey, CA, 1998.
9. Buss, A.H. and K. Stork, "SIMKIT User's Manual", Naval Postgraduate School,
Monterey, CA, 1998.
10. Townsend, James R., Defense of Naval Task Forces From Anti-Ship Missile
Attack, Naval Postgraduate School, 1999.
11. Geary, David M., Graphic Java™ Swing Mastering The JFC, Sun Microsystems
Press, 1999.
12. Geary, David M., Graphic Java™ AWT Mastering The JFC, Sun Microsystems
Press, 1999.
13. Hamilton, Lawrence C, Regression with Graphics, R.R. Donnelley & Sons
Company, 1992.
79

THIS PAGE INTENTIONALLY LEFT BLANK
80

INITIAL DISTRIBUTION LIST
1. Defense Technical Information Center 2
8725 John J. Kingman Rd., STE 0944
Ft. Belvoir, Virginia 22060-6218
2. Dudley Knox Library 2
Naval Postgraduate School
411 Dyer Rd.
Monterey, CA 93943-5101
3. Deniz Kuvvetleri Komutanligi 2
Personel Daire Baskanligi
Bakanliklar- 06100
Ankara, TURKEY
4. Deniz Kuvvetleri Komutanligi 1
Kutuphanesi
Bakanliklar -06100
Ankara, TURKEY
5. Deniz Harp Okulu 1
Kutuphanesi
Tuzla
Istanbul, TURKEY
6. Military Operations Research Society (MORS) 1
101 S.Whiting Street
Suite 202
Alexandria, VA 22304-3416
81
7. Chairman, Code 30 (OR/R1) 1
Naval Postgraduate School
Monterey, CA 93943-5100
8. Prof. Arnold H. BUSS (OR/Bu) 1
Department of Operations Research
Naval Postgraduate School
Monterey, CA 93943-5101
9. LCDR Douglas J. MACKINNON (OR/Mg) 1
Department of Operations Research
Naval Postgraduate School
Monterey, CA 93943-5101
10. Yazilim Gelistirme Grup Baskanligi 1
Deniz Harp Okulu Komutanligi
Tuzla
Istanbul, TURKEY
11. LTJG. Erhan AYDIN 2
Ataturk Caddesi, Erenler Sitesi
A Blok Daire 6
Erenkoy
Istanbul, TURKEY
82


S3 &OHPG6/Q2 TH
^'200 *u /