Embed Size (px)
Citation preview
Screen Australia Drama Report Production of feature films, TV and online drama in Australia in 2017/18
2
© Screen Australia 2018 ISBN: 978-1-920998-33-2
The text in this report is released subject to a Creative Commons BY licence (Licence). This means, in summary, that you may reproduce, transmit and distribute the text, provided that you do not do so for commercial purposes, and provided that you attribute the text as extracted from Screen Australia’s Drama Report 2017/18. You must not alter, transform or build upon the text in this report. Your rights under the Licence are in addition to any fair dealing rights which you have under the Copyright Act 1968 (Cwlth). For further terms of the Licence, please see http://creativecommons.org/licenses/by-nc-nd/3.0/
Screen Australia is grateful to all those who contributed data to the compilation of this report. The data provided has been drawn from a number of sources. While Screen Australia has undertaken all reasonable measures to ensure its accuracy, we cannot accept responsibility for inaccuracies and omissions.
Cover: Mystery Road TV Series
Storm Boy
The Drama Report 2017/18 | Screen Australia 3
Contents
ABOUT THE REPORT 3
Key terms 4
OVERVIEW 5
ALL DRAMA PRODUCTION 6
AUSTRALIAN FEATURE SLATE 8
Feature budget ranges 8
Sources of finance for Australian features 9
AUSTRALIAN TV DRAMA SLATE 11
AUSTRALIAN CHILDREN’S TV DRAMA SLATE 14
AUSTRALIAN ONLINE DRAMA PROGRAMS 16
Sources of finance for Australian TV and online drama 17
TV/online drama finance by first release platform 20
FOREIGN PRODUCTION 21
DRAMA PRODUCTION BY LOCATION 22
PDV SERVICES – FEATURES, TV DRAMA AND ONLINE PRODUCTION 24
All PDV 25
PDV expenditure by state 25
Focus on foreign PDV-only expenditure 26
Showcases 28
TITLES IN THE 17/18 SLATE 31
METHODOLOGY 37
ABOUT THE REPORTThe Drama Report covers the production of feature films, TV drama (mini-series, telemovies and series/serials) and online programs by financial year.
The report incorporates data gathered through surveys and publicly available sources to give a comprehensive view of drama production activity in Australia. Data is presented for the past five years, 2013/14 to 2017/18. Foreign titles are included if they are shot (or substantially shot) in Australia, or have post, digital or visual effects (PDV) work carried out in Australia without shooting here.
See page 4 for definitions of ‘Australian’, ‘domestic’, ‘co-production’ and ‘foreign’.
Feature films and TV dramas represent about 30 per cent of all audiovisual production in Australia (excluding online productions).1 Other areas of activity include documentaries, web-series, light entertainment, commercials, music videos, corporate videos and TV productions such as sport, news and current affairs. See the statistics section of the Screen Australia website for details, www.screenaustralia.gov.au/fact-finders/production-trends, and the relevant archives for pre-2013/14 data.
1Australian Bureau of Statistics (ABS), Film, Television and Digital Games, 2015/16, (cat. no. 8679.0).Storm Boy
4
KEY TERMS
Drama includes: Features: a film made for cinema which is 60 minutes or longer TV drama: a ‘drama’ program according to the Australian Content Standard guidelines (see ACMA website). Includes series/serials, mini-series and telemovies. See page 12 for definitions Online drama: encompasses single-episode or series programs with total durations of 30 minutes or more that have their first Australian release online.
Total budgets reports on how much it actually costs to make projects. It is reported for all projects that started shooting during the financial year, with the full budget allocated to the date principal photography started; budgets are not apportioned across the duration of the project.
Total spend/expenditure reports on how much of the total budgets were spent in Australia. This measure is particularly relevant for Co-productions and foreign productions. Again, all expenditure is allocated to the date principal photography or PDV work in Australia began rather than to the actual date of spending. Note: this is not the same as ‘qualifying Australian production expenditure’ (QAPE) for the purpose of the Producer Offset. Some expenditure in Australia is not QAPE, and QAPE can include some expenditure on Australian elements outside of Australia. QAPE is not reported here.
Australian productions include: ‘Domestic productions’: Projects other than Co-productions under Australian creative control (ie where the key elements are predominantly Australian and the project was originated and developed by Australians). This includes projects under Australian creative control that are 100 per cent foreign-financed. ‘Co-productions’ are Official Co-productions (ie projects made pursuant to an agreement between the Australian Government and the government of another country). As Official Co-productions don’t have to pass the ‘significant Australian content’ test for eligibility for the Producer Offset, and may be classified as ‘Australian’ for the purposes of Australian content regulations applying to broadcasters, the report mainly focusses on domestic and Co-production projects as a combined ‘Australian’ slate.
‘Foreign productions’ are defined as those under foreign creative control, originated and developed by non-Australians. This includes foreign projects with an Australian production company operating in a service capacity.
‘In-house productions’ are projects by Australian TV networks, where no independent production company is credited as producer or co-producer.
‘PDV’ (post, digital and visual effects) refers to those activities that create audio and visual elements for film or TV drama other than by principal photography, pick ups or physical elements such as sets and props, and includes animation. It also refers to the manipulation of those elements and includes sound and visual editing, digital effects, creation of computer-generated images (CGI), film laboratory work and duplication services. As such, it includes a variety of activities that not only take place after the shoot but also during the earlier stages of a project’s overall production.
The following abbreviations are used throughout the report: Subscription video-on-demand (SVOD), Broadcaster video-on-demand (BVOD), Advertising or Ad-based video-on-demand (AVOD) and Transactional video-on-demand (TVOD).
See also Methodology on pages 37-38.
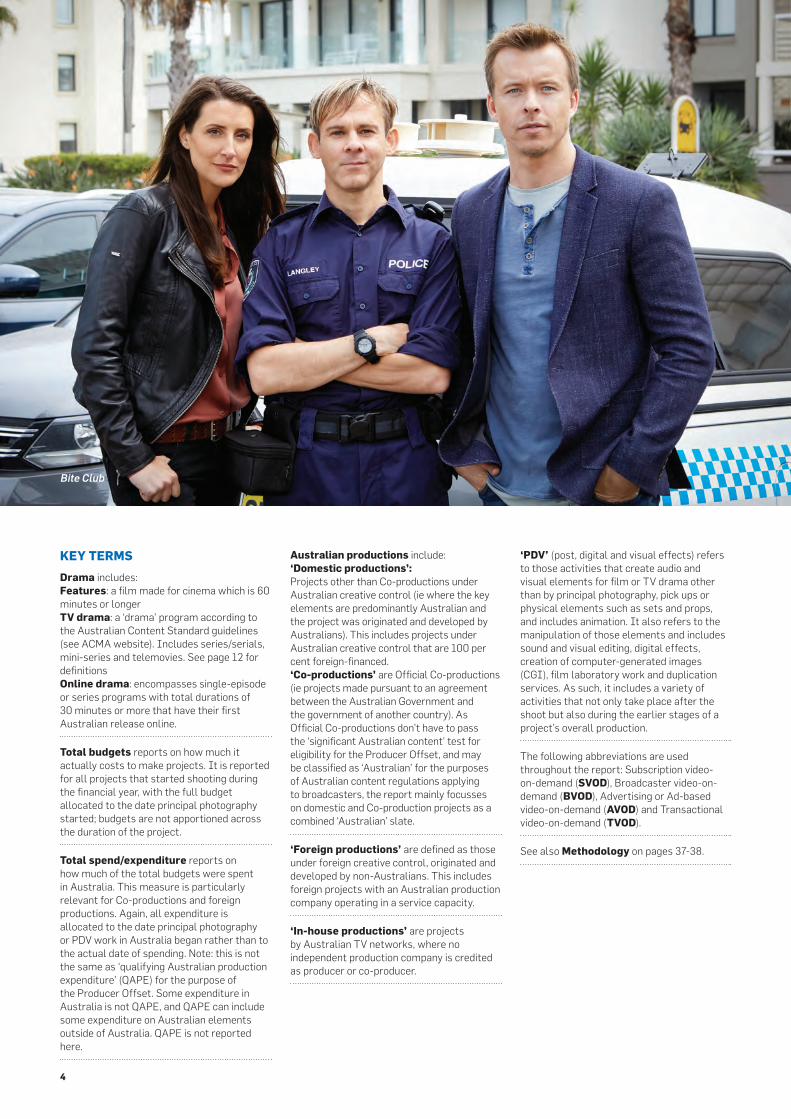
Bite Club
The Drama Report 2017/18 | Screen Australia 5
1,400
1,200
1,000
800
600
400
200
0
2013/14 2014/15 2015/16 2016/17 2017/18 5-yr avg.
Dra
ma
Expe
nditu
re ($
mill
ions
)
Aus Features Aus TV Drama Aus Children's TV Drama Aus Online Drama Foreign Features
Foreign TV Drama
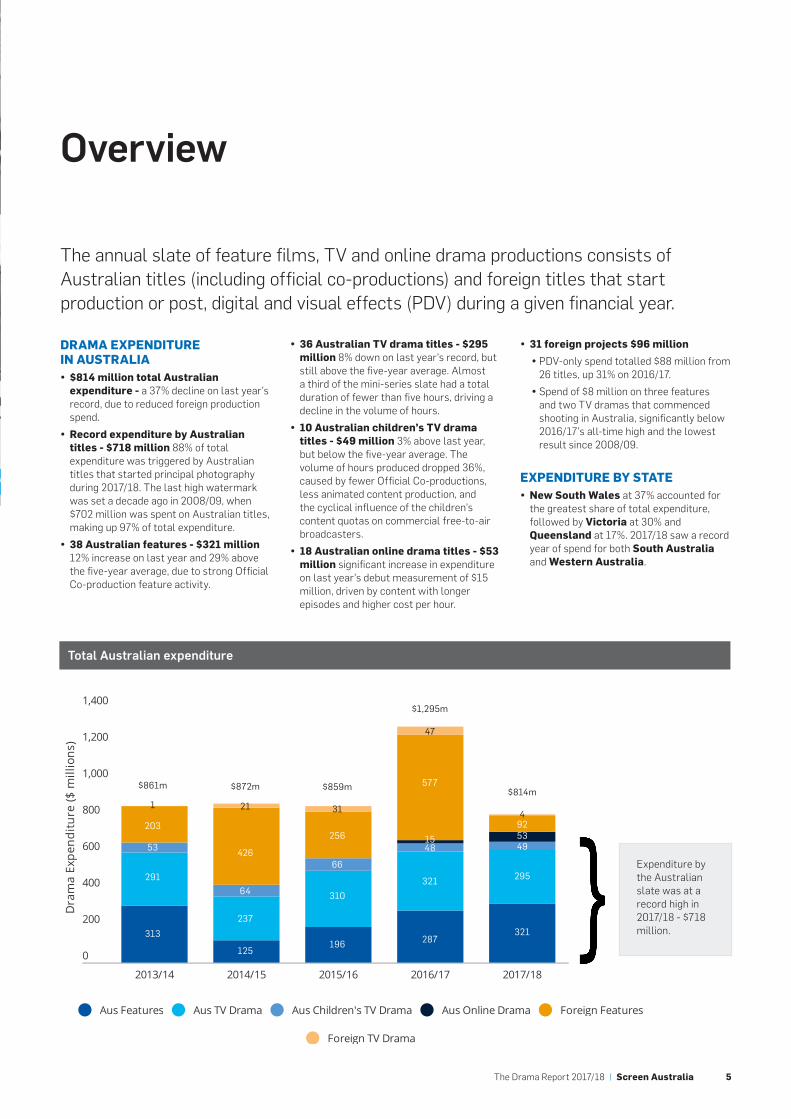
DRAMA EXPENDITURE IN AUSTRALIA y $814 million total Australian expenditure - a 37% decline on last year’s record, due to reduced foreign production spend.
y Record expenditure by Australian titles - $718 million 88% of total expenditure was triggered by Australian titles that started principal photography during 2017/18. The last high watermark was set a decade ago in 2008/09, when $702 million was spent on Australian titles, making up 97% of total expenditure.
y 38 Australian features - $321 million 12% increase on last year and 29% above the five-year average, due to strong Official Co-production feature activity.
Overview
The annual slate of feature films, TV and online drama productions consists of Australian titles (including official co-productions) and foreign titles that start production or post, digital and visual effects (PDV) during a given financial year.
Total Australian expenditure
$861m $872m $859m
$1,295m
$814m
Expenditure by the Australian slate was at a record high in 2017/18 - $718 million.
y 36 Australian TV drama titles - $295 million 8% down on last year’s record, but still above the five-year average. Almost a third of the mini-series slate had a total duration of fewer than five hours, driving a decline in the volume of hours.
y 10 Australian children’s TV drama titles - $49 million 3% above last year, but below the five-year average. The volume of hours produced dropped 36%, caused by fewer Official Co-productions, less animated content production, and the cyclical influence of the children’s content quotas on commercial free-to-air broadcasters.
y 18 Australian online drama titles - $53 million significant increase in expenditure on last year’s debut measurement of $15 million, driven by content with longer episodes and higher cost per hour.
y 31 foreign projects $96 million
y PDV-only spend totalled $88 million from 26 titles, up 31% on 2016/17.
y Spend of $8 million on three features and two TV dramas that commenced shooting in Australia, significantly below 2016/17’s all-time high and the lowest result since 2008/09.
EXPENDITURE BY STATE y New South Wales at 37% accounted for the greatest share of total expenditure, followed by Victoria at 30% and Queensland at 17%. 2017/18 saw a record year of spend for both South Australia and Western Australia.
1 21 31
203
426
25653
64
66291
237
310
313
125196
47
577
1548
321
287
4925349
295
321
6
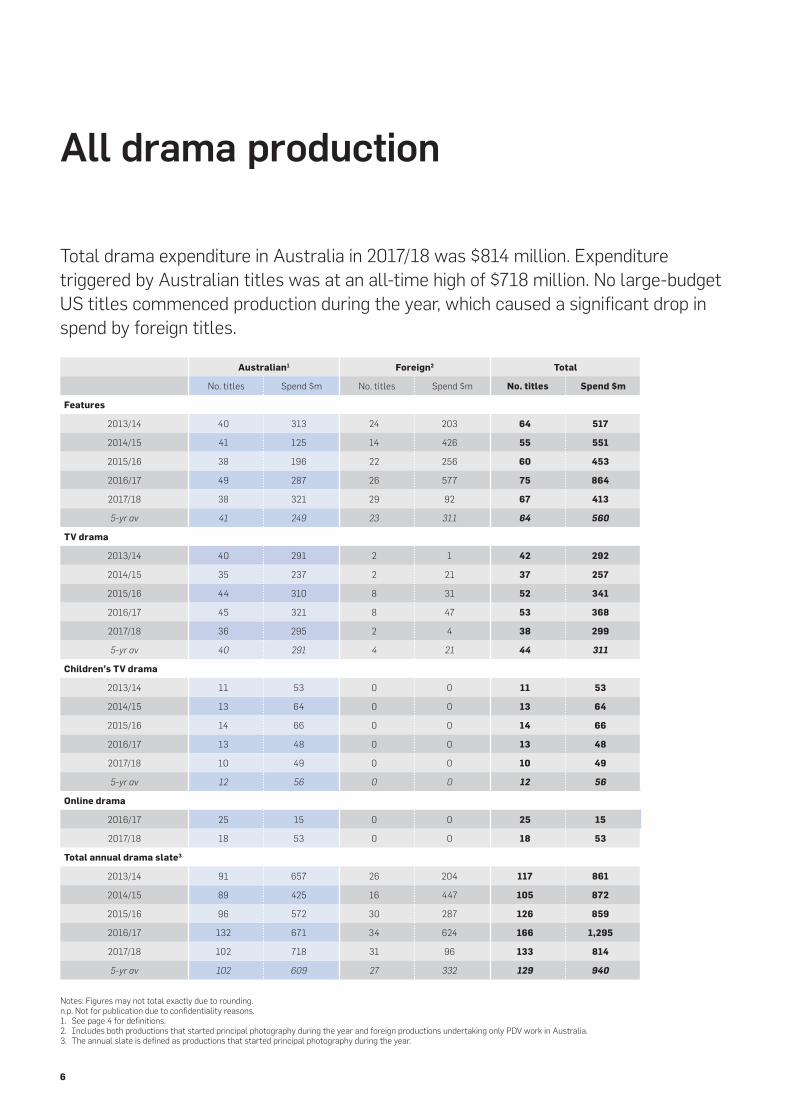
All drama production
Australian1 Foreign2 Total
No. titles Spend $m No. titles Spend $m No. titles Spend $m
Features
2013/14 40 313 24 203 64 517
2014/15 41 125 14 426 55 551
2015/16 38 196 22 256 60 453
2016/17 49 287 26 577 75 864
2017/18 38 321 29 92 67 413
5-yr av 41 249 23 311 64 560
TV drama
2013/14 40 291 2 1 42 292
2014/15 35 237 2 21 37 257
2015/16 44 310 8 31 52 341
2016/17 45 321 8 47 53 368
2017/18 36 295 2 4 38 299
5-yr av 40 291 4 21 44 311
Children’s TV drama
2013/14 11 53 0 0 11 53
2014/15 13 64 0 0 13 64
2015/16 14 66 0 0 14 66
2016/17 13 48 0 0 13 48
2017/18 10 49 0 0 10 49
5-yr av 12 56 0 0 12 56
Online drama
2016/17 25 15 0 0 25 15
2017/18 18 53 0 0 18 53
Total annual drama slate3
2013/14 91 657 26 204 117 861
2014/15 89 425 16 447 105 872
2015/16 96 572 30 287 126 859
2016/17 132 671 34 624 166 1,295
2017/18 102 718 31 96 133 814
5-yr av 102 609 27 332 129 940
Total drama expenditure in Australia in 2017/18 was $814 million. Expenditure triggered by Australian titles was at an all-time high of $718 million. No large-budget US titles commenced production during the year, which caused a significant drop in spend by foreign titles.
Notes: Figures may not total exactly due to rounding.n.p. Not for publication due to confidentiality reasons.1. See page 4 for definitions.2. Includes both productions that started principal photography during the year and foreign productions undertaking only PDV work in Australia.3. The annual slate is defined as productions that started principal photography during the year.
The Drama Report 2017/18 | Screen Australia 7
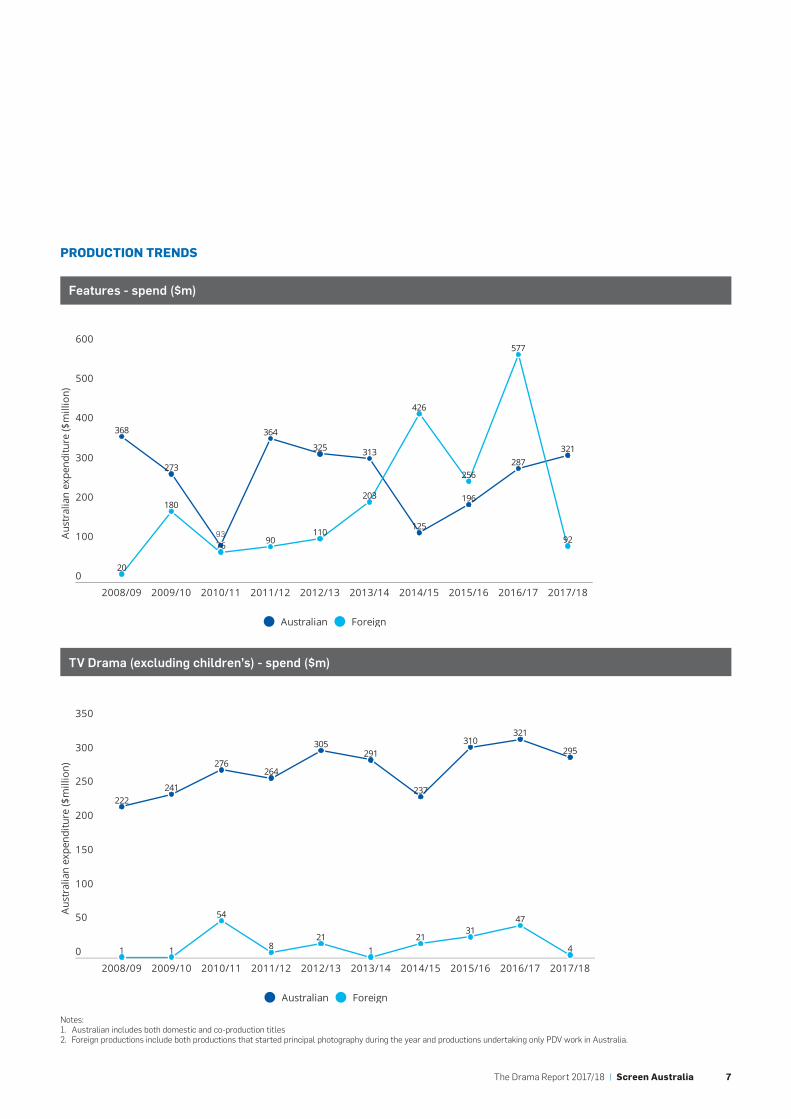
PRODUCTION TRENDS
Features - spend ($m)
TV Drama (excluding children’s) - spend ($m)
Notes: 1. Australian includes both domestic and co-production titles2. Foreign productions include both productions that started principal photography during the year and productions undertaking only PDV work in Australia.
0
100
200
300
400
500
600
2008/09 2009/10 2010/11 2011/12 2012/13 2013/14 2014/15 2015/16 2016/17 2017/18
368
273
364
325 313
125
196
287321
20
180
76 90110
203
426
256
577
92Aus
tral
ian
expe
nditu
re ($
mill
ion)
Australian Foreign
0
50
100
150
200
250
300
350
2008/09 2009/10 2010/11 2011/12 2012/13 2013/14 2014/15 2015/16 2016/17 2017/18
222241
276264
305291
237
310321
295
1 1
54
821
121
3147
4
Aus
tral
ian
expe
nditu
re ($
mill
ion)
Australian Foreign
93
8
All Australian features (domestic and co-production) by budget ranges
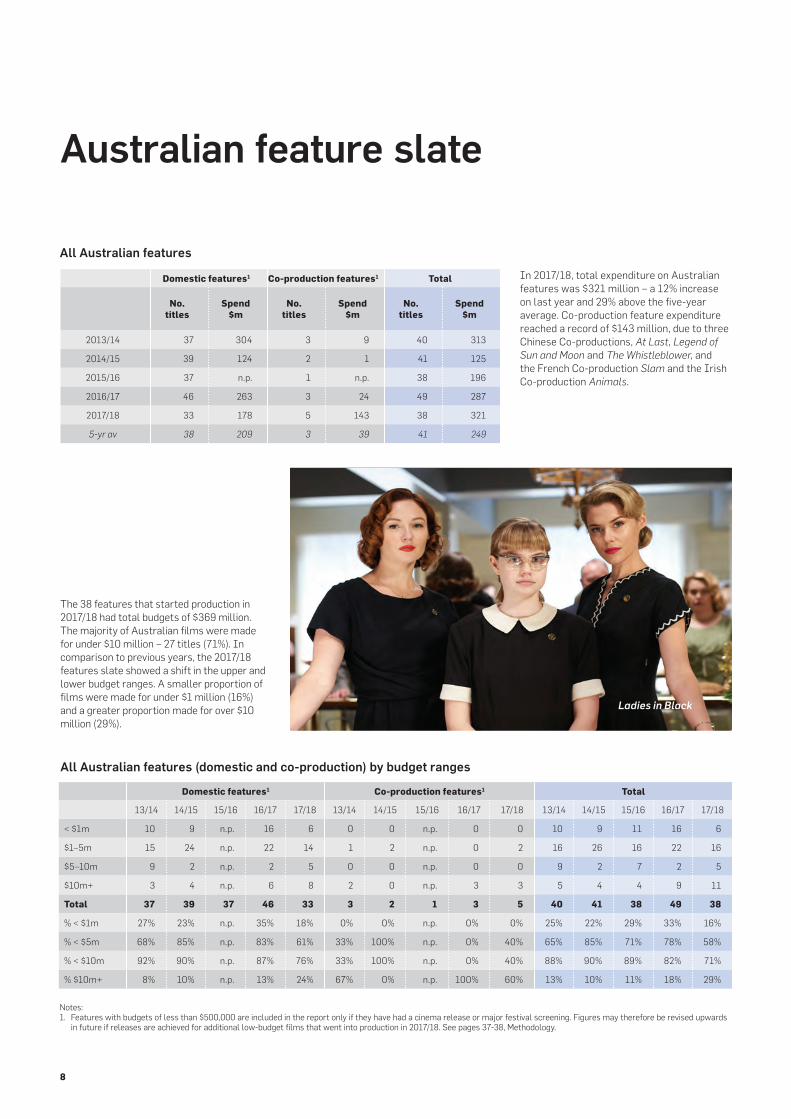
Australian feature slate
In 2017/18, total expenditure on Australian features was $321 million – a 12% increase on last year and 29% above the five-year average. Co-production feature expenditure reached a record of $143 million, due to three Chinese Co-productions, At Last, Legend of Sun and Moon and The Whistleblower, and the French Co-production Slam and the Irish Co-production Animals.
Domestic features1 Co-production features1 Total
13/14 14/15 15/16 16/17 17/18 13/14 14/15 15/16 16/17 17/18 13/14 14/15 15/16 16/17 17/18
< $1m 10 9 n.p. 16 6 0 0 n.p. 0 0 10 9 11 16 6
$1–5m 15 24 n.p. 22 14 1 2 n.p. 0 2 16 26 16 22 16
$5–10m 9 2 n.p. 2 5 0 0 n.p. 0 0 9 2 7 2 5
$10m+ 3 4 n.p. 6 8 2 0 n.p. 3 3 5 4 4 9 11
Total 37 39 37 46 33 3 2 1 3 5 40 41 38 49 38
% < $1m 27% 23% n.p. 35% 18% 0% 0% n.p. 0% 0% 25% 22% 29% 33% 16%
% < $5m 68% 85% n.p. 83% 61% 33% 100% n.p. 0% 40% 65% 85% 71% 78% 58%
% < $10m 92% 90% n.p. 87% 76% 33% 100% n.p. 0% 40% 88% 90% 89% 82% 71%
% $10m+ 8% 10% n.p. 13% 24% 67% 0% n.p. 100% 60% 13% 10% 11% 18% 29%
Domestic features1 Co-production features1 Total
No.
titlesSpend
$mNo.
titlesSpend
$mNo.
titlesSpend
$m
2013/14 37 304 3 9 40 313
2014/15 39 124 2 1 41 125
2015/16 37 n.p. 1 n.p. 38 196
2016/17 46 263 3 24 49 287
2017/18 33 178 5 143 38 321
5-yr av 38 209 3 39 41 249
All Australian features
Notes: 1. Features with budgets of less than $500,000 are included in the report only if they have had a cinema release or major festival screening. Figures may therefore be revised upwards
in future if releases are achieved for additional low-budget films that went into production in 2017/18. See pages 37-38, Methodology.
The 38 features that started production in 2017/18 had total budgets of $369 million. The majority of Australian films were made for under $10 million – 27 titles (71%). In comparison to previous years, the 2017/18 features slate showed a shift in the upper and lower budget ranges. A smaller proportion of films were made for under $1 million (16%) and a greater proportion made for over $10 million (29%).
Ladies in Black
The Drama Report 2017/18 | Screen Australia 9
No. of titles
Amount $m
% of total finance
Australian direct government sources1
2013/14 26 32.4 8%
2014/15 27 25.5 19%
2015/16 22 32.4 15%
2016/17 28 29.1 8%
2017/18 31 46.9 13%
5-yr av 27 33.3 12%
Australian Producer Offset2
2013/14 n.p. 111.1 29%
2014/15 n.p. 40.7 30%
2015/16 n.p. 65.5 31%
2016/17 n.p. 100.5 29%
2017/18 n.p. 112.5 31%
5-yr av 36 86.1 30%
Australian private investors
2013/14 25 15.9 4%
2014/15 29 16.5 12%
2015/16 26 11.7 6%
2016/17 33 24.6 7%
2017/18 21 18.3 5%
5-yr av 27 17.4 6%
Australian screen industry3
2013/14 34 44.3 12%
2014/15 36 26.0 19%
2015/16 31 30.7 15%
2016/17 34 29.4 8%
2017/18 36 43.2 12%
5-yr av 34 34.7 12%
Foreign investors
2012/13 20 177.4 47%
2013/14 13 24.9 19%
2014/15 17 69.1 33%
2015/16 25 163.1 47%
2016/17 25 147.8 40%
5-yr av 20 116.5 40%
Contributions to the annual Australian feature slate (domestic and co-production)
SOURCES OF FINANCE FOR AUSTRALIAN FEATURESThe sources of finance for Australian features can vary significantly from one year to the next. High-budget, principally foreign-financed titles cause large fluctuations, and the presence of five official co-productions impacted the financial make-up of this year’s slate. All contributions were above the five-year averages.
Foreign investors provided the majority of finance: $147.8 million to 25 titles (40% of total finance).
The Producer Offset contributed $112.5 million to projects, accounting for 31% of total finance.
Funding from Australian direct government sources increased to $46.9 million for 31 titles (13% of total finance). Screen Australia accounted for the greatest contribution from a single agency – investing $23 million in 22 features that commenced principal photography in 2017/18. Together the state agencies contributed $22 million to 29 features. The Melbourne International Film Festival and the Adelaide Film Festival financed two and three titles respectively. Local councils provided funding for feature films shooting in their local municipalities.
The Australian screen industry (mainly distribution and production companies) contributed $43.2 million to 36 features (12% of total finance).
Australian private investment was $18.3 million (5% of total finance). Around half of this amount can be attributed to a small number of titles with substantial amounts of private investment.
Notes: Figures may not total exactly due to rounding. Please note that finance sources reflect data available at the time of production and may change as titles near completion.n.p. Not for publication due to confidentiality reasons.1. Includes direct funding from Australian state and federal agencies and funding bodies for titles that commenced principal photography during a given financial year (see pages 37-38). Equity investments and grants only – distribution guarantees, loans and underwriting are not included. 2. The Producer Offset amount is taken from the finance plan of each title. For Screen Australia funded projects – the agency only requires 90% of the anticipated Offset to be included in the finance plan for features and television projects. A producer is entitled to retain the difference for their own purposes, but many producers still include it in the finance plan. For this reason, the Producer Offset amounts listed above may be lower than what is eventually received from the Australian Taxation Office for each project.3. Finance provided by Australian-based producers and production companies, distribution companies, free-to-air broadcasters (commercial and public) and subscription TV channels. The Producer Offset, cashflowed in various ways, is listed separately.
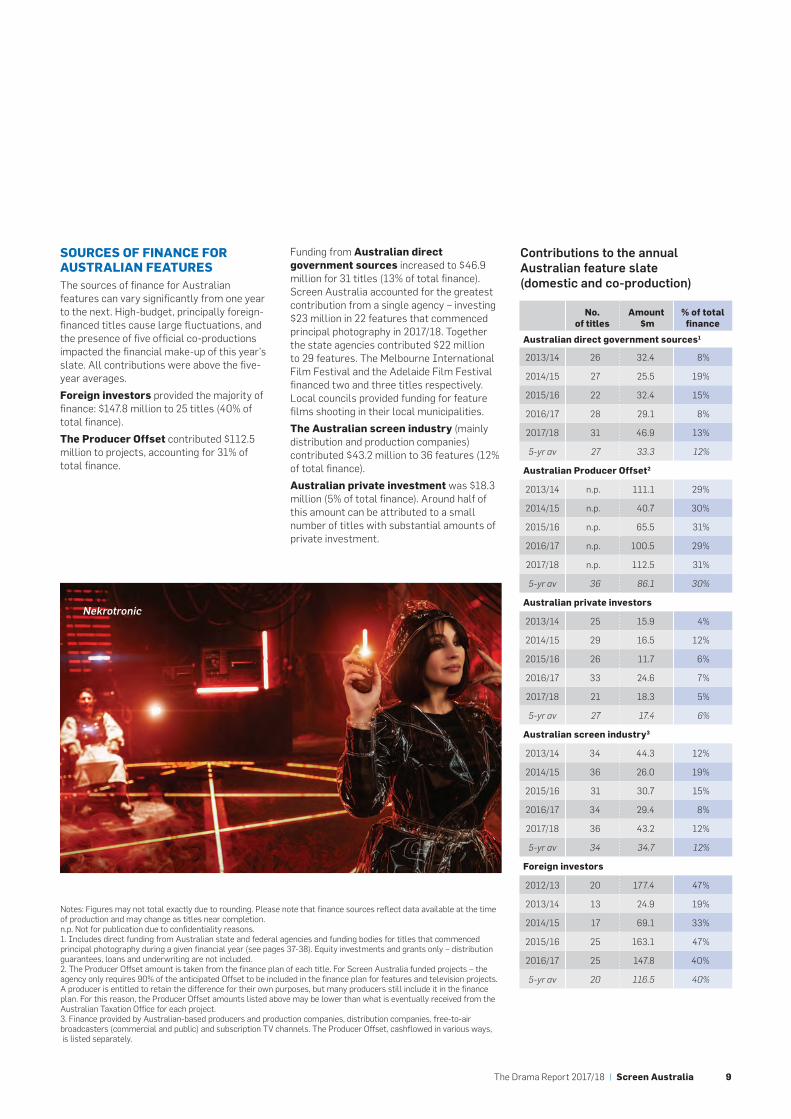
Nekrotronic
10
AUSTRALIAN FEATURES - GOVERNMENT FUNDING ($M)
2013/14
2014/15
2015/16
2016/17
2017/18
0 5 10 15 20 25 30 35 40 45 50
22 10
18 6
18 11 4
13 15
23 22 2
Screen Australia State Agencies Other
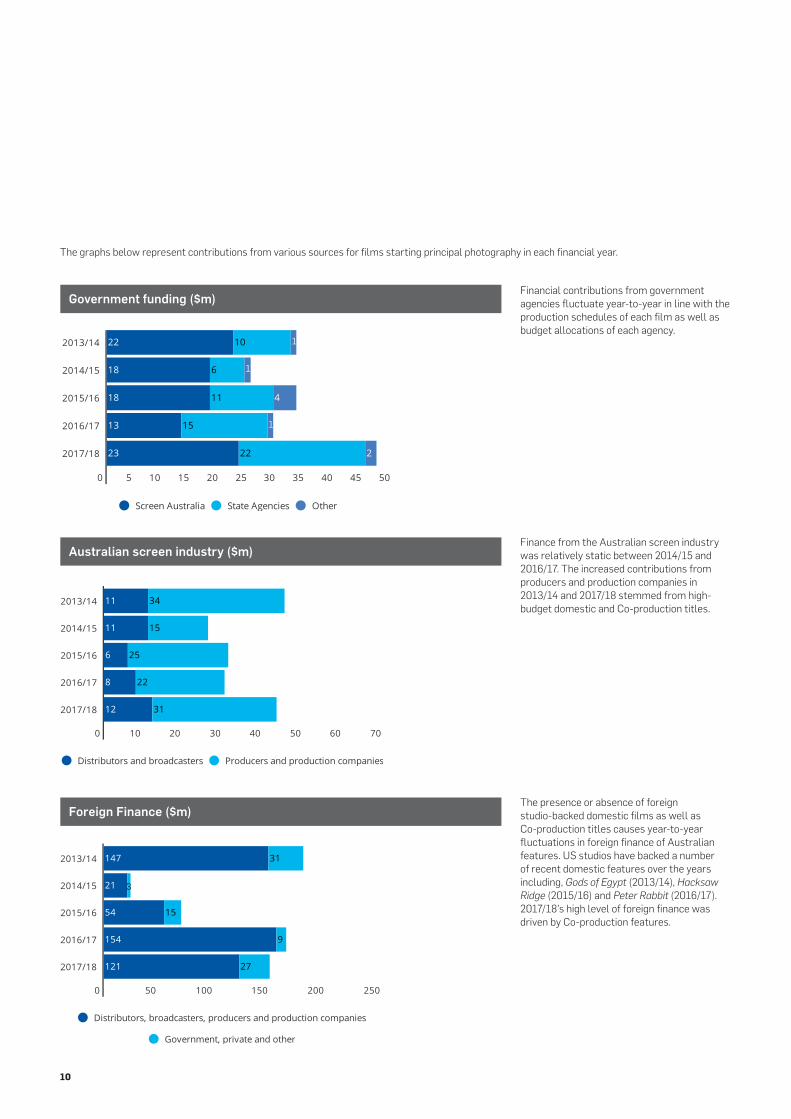
Financial contributions from government agencies fluctuate year-to-year in line with the production schedules of each film as well as budget allocations of each agency.
Finance from the Australian screen industry was relatively static between 2014/15 and 2016/17. The increased contributions from producers and production companies in 2013/14 and 2017/18 stemmed from high-budget domestic and Co-production titles.
The presence or absence of foreign studio-backed domestic films as well as Co-production titles causes year-to-year fluctuations in foreign finance of Australian features. US studios have backed a number of recent domestic features over the years including, Gods of Egypt (2013/14), Hacksaw Ridge (2015/16) and Peter Rabbit (2016/17). 2017/18’s high level of foreign finance was driven by Co-production features.
Government funding ($m)
Australian screen industry ($m)
Foreign Finance ($m)
The graphs below represent contributions from various sources for films starting principal photography in each financial year.
AUSTRALIAN FEATURES - AUSTRALIAN FILM/TV INDUSTRY($M)
2013/14
2014/15
2015/16
2016/17
2017/18
0 10 20 30 40 50 60 70
11 34
11 15
6 25
8 22
12 31
Distributors and broadcasters Producers and production companies
AUSTRALIAN FEATURES - FOREIGN FINANCE ($M)
2013/14
2014/15
2015/16
2016/17
2017/18
0 50 100 150 200 250
147 31
21
54 15
154 9
121 27
Distributors, broadcasters, producers and production companies
Government, private and other
1
1
1
3
The Drama Report 2017/18 | Screen Australia 11
Australian TV drama slate
Australian TV drama programs
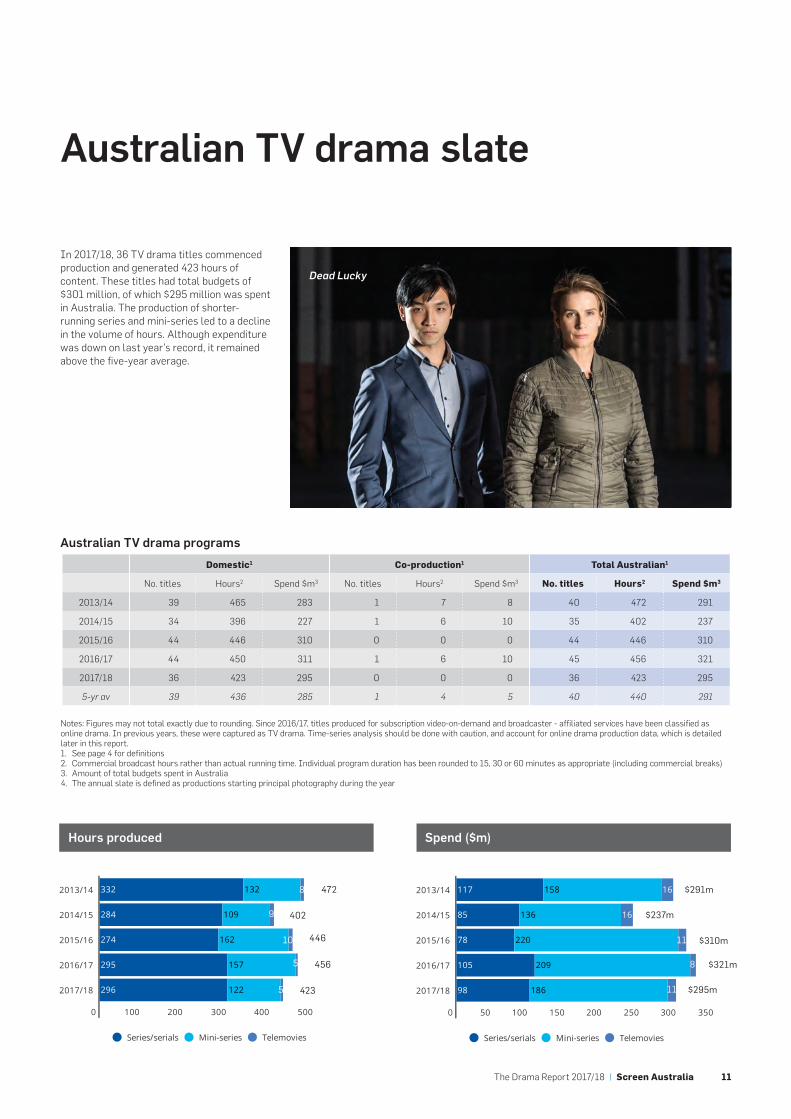
In 2017/18, 36 TV drama titles commenced production and generated 423 hours of content. These titles had total budgets of $301 million, of which $295 million was spent in Australia. The production of shorter-running series and mini-series led to a decline in the volume of hours. Although expenditure was down on last year’s record, it remained above the five-year average.
Domestic1 Co-production1 Total Australian1
No. titles Hours2 Spend $m3 No. titles Hours2 Spend $m3 No. titles Hours2 Spend $m3
2013/14 39 465 283 1 7 8 40 472 291
2014/15 34 396 227 1 6 10 35 402 237
2015/16 44 446 310 0 0 0 44 446 310
2016/17 44 450 311 1 6 10 45 456 321
2017/18 36 423 295 0 0 0 36 423 295
5-yr av 39 436 285 1 4 5 40 440 291
Notes: Figures may not total exactly due to rounding. Since 2016/17, titles produced for subscription video-on-demand and broadcaster - affiliated services have been classified as online drama. In previous years, these were captured as TV drama. Time-series analysis should be done with caution, and account for online drama production data, which is detailed later in this report.1. See page 4 for definitions2. Commercial broadcast hours rather than actual running time. Individual program duration has been rounded to 15, 30 or 60 minutes as appropriate (including commercial breaks)3. Amount of total budgets spent in Australia4. The annual slate is defined as productions starting principal photography during the year
2013/14
2014/15
2015/16
2016/17
2017/18
0 50 100 150 200 250 300 350
117 158 16
85 136 16
78 220
105 209
98 186
Series/serials Mini-series Telemovies
2013/14
2014/15
2015/16
2016/17
2017/18
0 100 200 300 400 500 600
332 132
284 109
274 162
295 157
296 122
Series/serials Mini-series Telemovies
Hours produced Spend ($m)
456
423
446
402
4728
9
10 11
11
85
5 $295m
$321m
$310m
$237m
$291m
Dead Lucky
12
BY FORMATFormat definitions according to this report:
• Series/serials - unlimited number of episodes (more than 13 in total) as well as multi-part programs with episode durations less than one commercial broadcast hour.
• Mini-series - a limited series of drama normally 13 hours or less in length and each episode is usually a commercial hour in duration.
• Telemovies – single-episode drama made for television that is a commercial hour or more in length. Series of, or related telemovies are counted as individual titles, as set out in a broadcaster’s licence agreement.
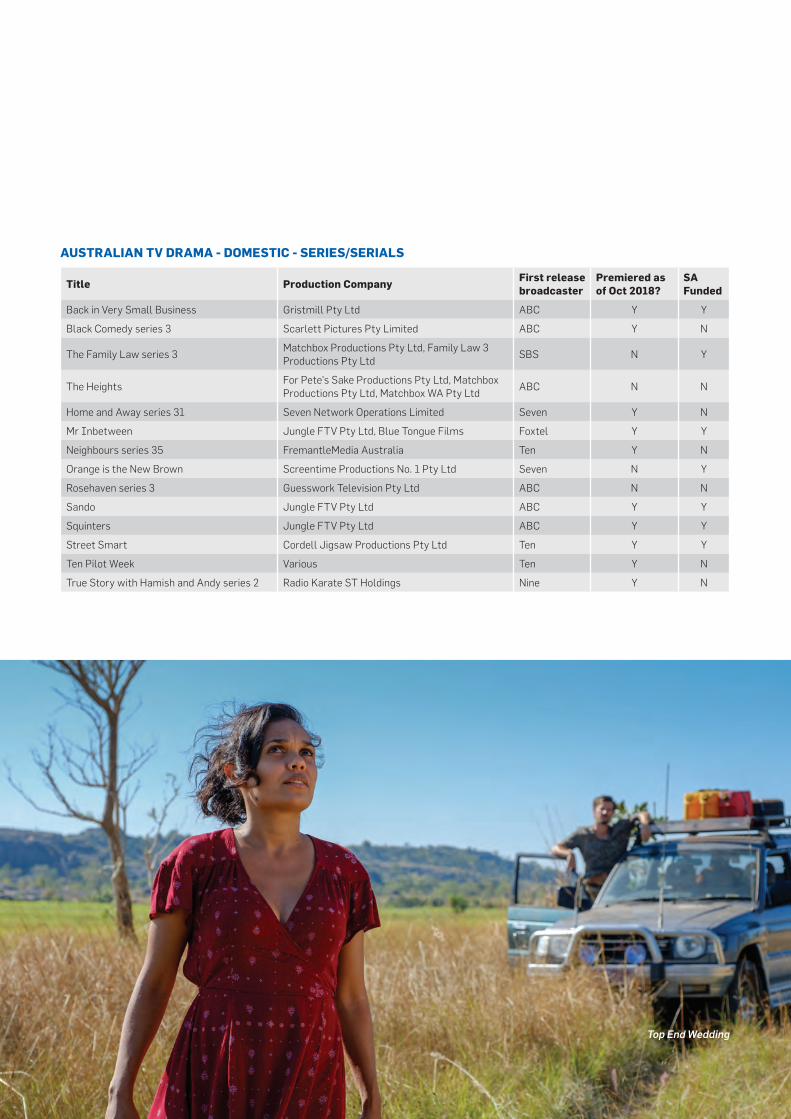
Series/serials production in 2017/18 scaled back a little after last year’s resurgence, however the volume of hours produced, budgets and expenditure were similar to the five-year averages. In addition to Home and Away (Seven) and Neighbours (Ten) (both more than 100 hours), for the first time in
over a decade, the slate included a new serial, The Heights (ABC) (15 hours). Other series produced were half-hour comedies with total durations below six hours. Titles included returning seasons of Black Comedy and Rosehaven (both ABC), The Family Law for SBS and True Story with Hamish and Andy for the Nine Network. New series in production included Squinters (ABC), Orange is the New Brown (Seven), Street Smart (Ten) and Mr Inbetween (Foxtel). See page 33 for full list.
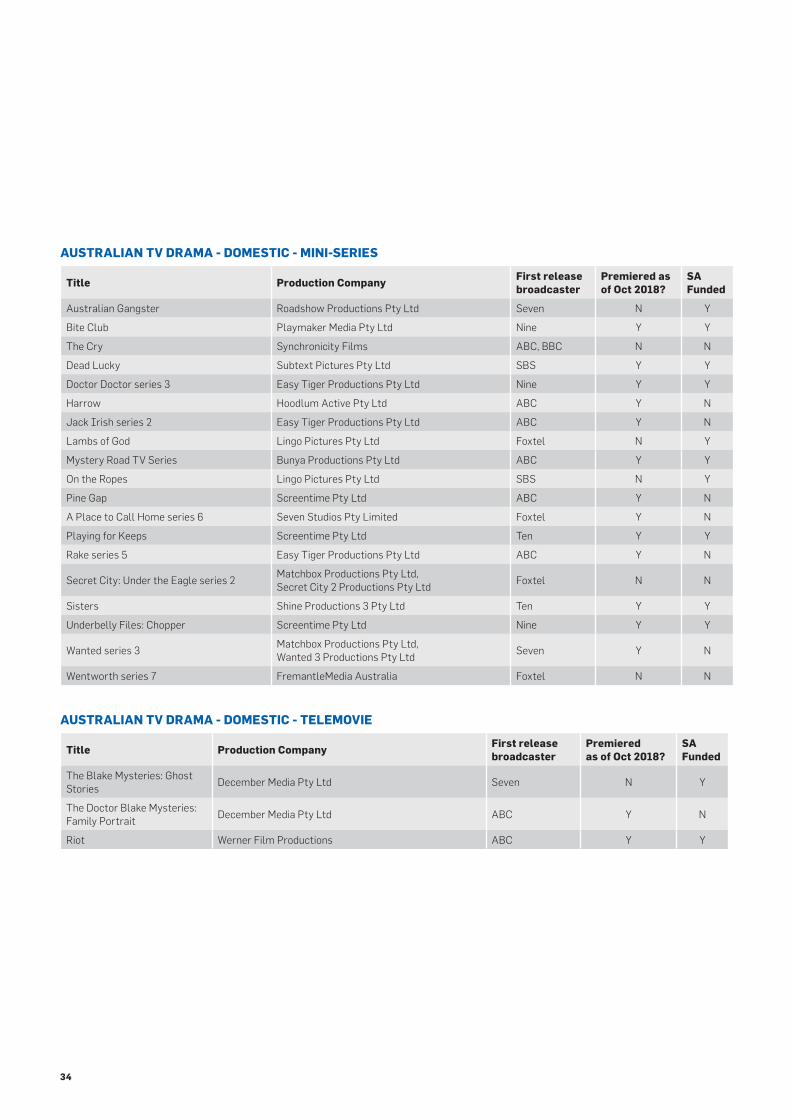
Mini-series production peaked in 2015/16 and has gradually declined over the last two years. In 2017/18 total budgets and expenditure remained above the five-year averages. The volume of hours decreased as more mini-series with shorter durations were produced – almost a third of the slate in production had total durations below five hours, and only a fifth of the slate had total durations of 10 hours. Season returns included Jack Irish (ABC) and Wanted (Seven) (both 6 hours), Doctor Doctor (Nine), A Place
to Call Home and Wentworth (Foxtel) (all three were 10 hours). New mini-series titles included the TV drama adaptation of Mystery Road (ABC) (6 hours), Dead Lucky (SBS) (4 hours), Australian Gangster (Seven) (3 hours), Bite Club (Nine), Playing for Keeps (Ten) (both 8 hours) and Lambs of God (Foxtel) (4 hours). See page 34 for full list.
The production of telemovies in 2017/18 remained below the five-year averages. Three telemovies entered production: the ABC’s Riot and The Doctor Blake Mysteries: Family Portrait and Channel Seven’s The Blake Mysteries: Ghost Stories.
Screen Australia announced that the near $20 million invested in adult TV drama in the 2017/18 financial year was an all-time record. It is anticipated that a number of these will start production in 2018/19.
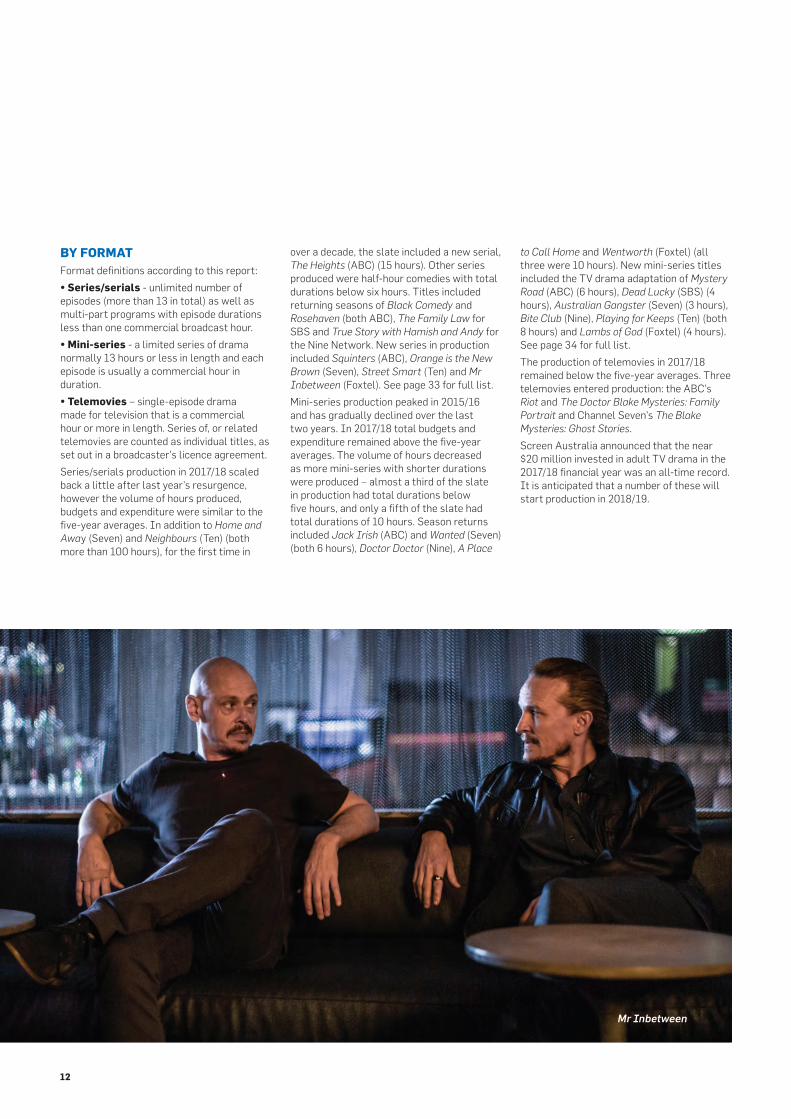
Mr Inbetween
The Drama Report 2017/18 | Screen Australia 13
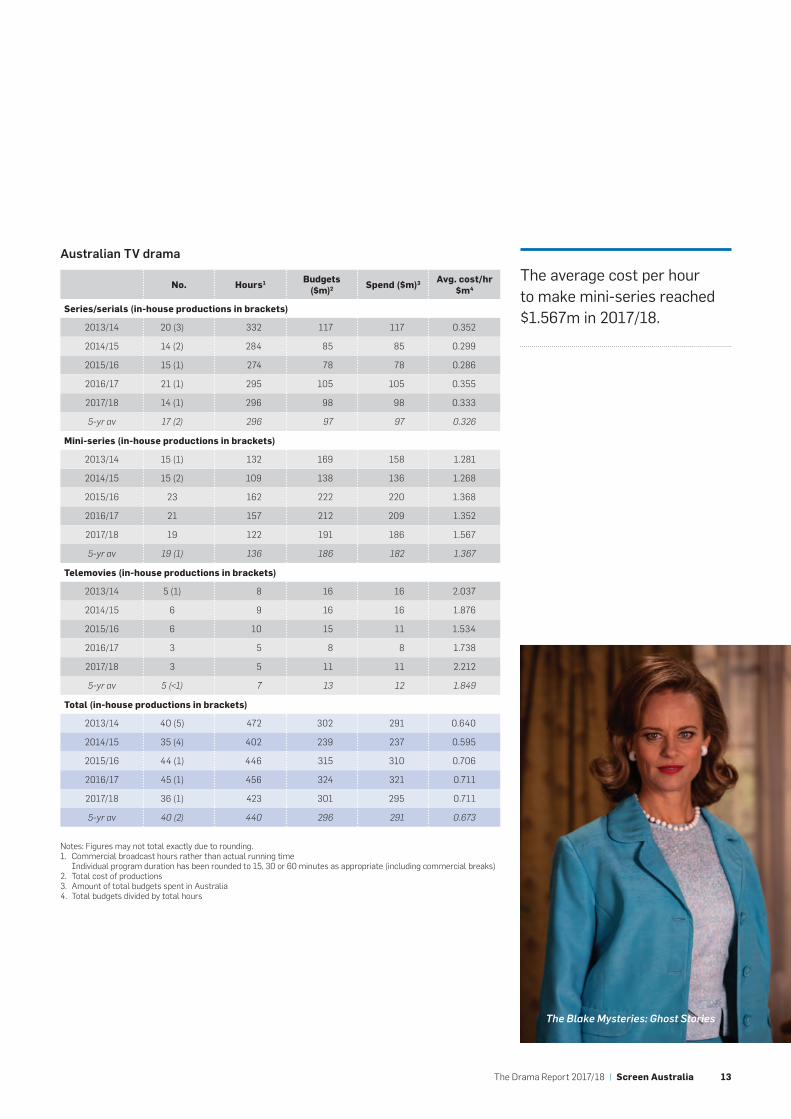
Australian TV drama
No. Hours1 Budgets
($m)2 Spend ($m)3 Avg. cost/hr $m4
Series/serials (in-house productions in brackets)
2013/14 20 (3) 332 117 117 0.352
2014/15 14 (2) 284 85 85 0.299
2015/16 15 (1) 274 78 78 0.286
2016/17 21 (1) 295 105 105 0.355
2017/18 14 (1) 296 98 98 0.333
5-yr av 17 (2) 296 97 97 0.326
Mini-series (in-house productions in brackets)
2013/14 15 (1) 132 169 158 1.281
2014/15 15 (2) 109 138 136 1.268
2015/16 23 162 222 220 1.368
2016/17 21 157 212 209 1.352
2017/18 19 122 191 186 1.567
5-yr av 19 (1) 136 186 182 1.367
Telemovies (in-house productions in brackets)
2013/14 5 (1) 8 16 16 2.037
2014/15 6 9 16 16 1.876
2015/16 6 10 15 11 1.534
2016/17 3 5 8 8 1.738
2017/18 3 5 11 11 2.212
5-yr av 5 (<1) 7 13 12 1.849
Total (in-house productions in brackets)
2013/14 40 (5) 472 302 291 0.640
2014/15 35 (4) 402 239 237 0.595
2015/16 44 (1) 446 315 310 0.706
2016/17 45 (1) 456 324 321 0.711
2017/18 36 (1) 423 301 295 0.711
5-yr av 40 (2) 440 296 291 0.673
Notes: Figures may not total exactly due to rounding.1. Commercial broadcast hours rather than actual running time
Individual program duration has been rounded to 15, 30 or 60 minutes as appropriate (including commercial breaks) 2. Total cost of productions3. Amount of total budgets spent in Australia4. Total budgets divided by total hours
The average cost per hour to make mini-series reached $1.567m in 2017/18.
The Blake Mysteries: Ghost Stories
14
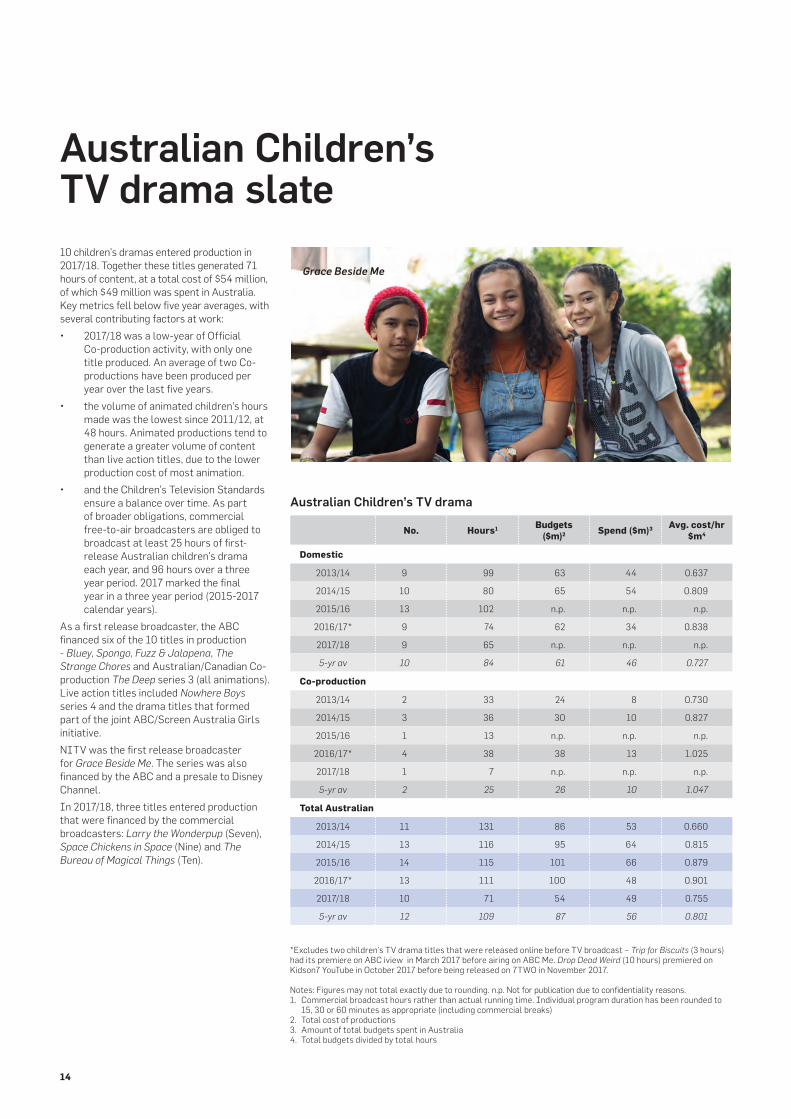
10 children’s dramas entered production in 2017/18. Together these titles generated 71 hours of content, at a total cost of $54 million, of which $49 million was spent in Australia. Key metrics fell below five year averages, with several contributing factors at work:
• 2017/18 was a low-year of Official Co-production activity, with only one title produced. An average of two Co-productions have been produced per year over the last five years.
• the volume of animated children’s hours made was the lowest since 2011/12, at 48 hours. Animated productions tend to generate a greater volume of content than live action titles, due to the lower production cost of most animation.
• and the Children’s Television Standards ensure a balance over time. As part of broader obligations, commercial free-to-air broadcasters are obliged to broadcast at least 25 hours of first-release Australian children’s drama each year, and 96 hours over a three year period. 2017 marked the final year in a three year period (2015-2017 calendar years).
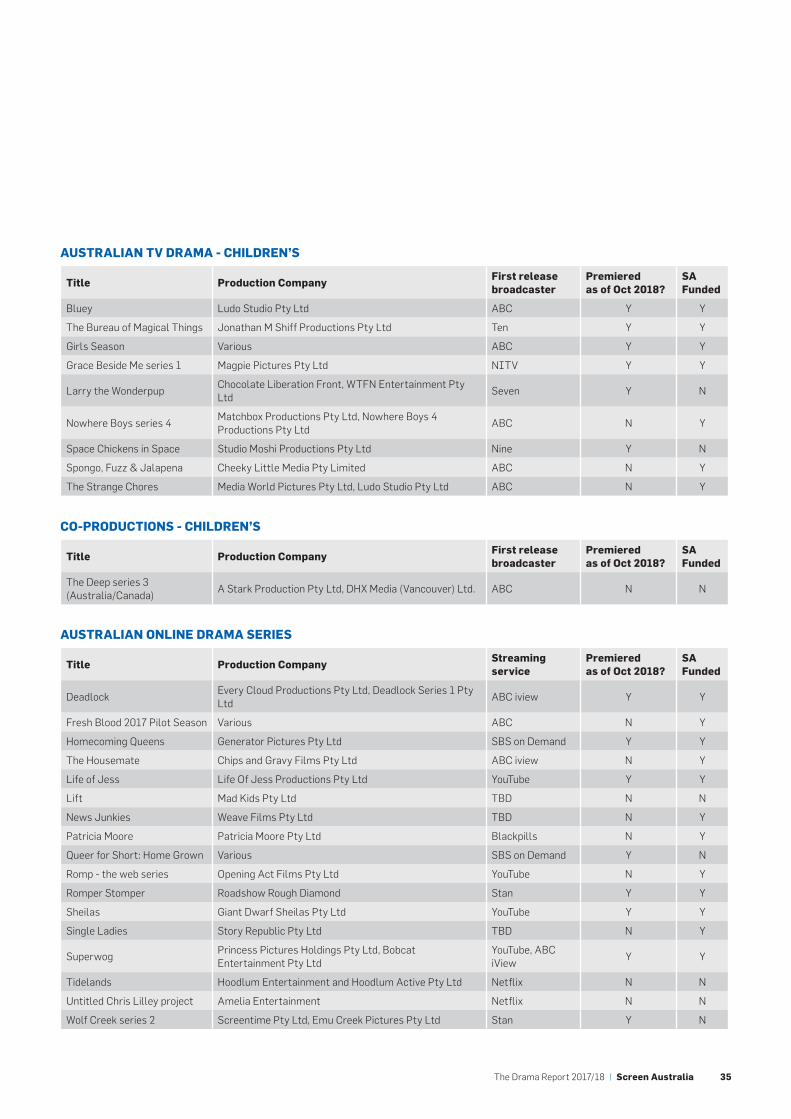
As a first release broadcaster, the ABC financed six of the 10 titles in production - Bluey, Spongo, Fuzz & Jalapena, The Strange Chores and Australian/Canadian Co-production The Deep series 3 (all animations). Live action titles included Nowhere Boys series 4 and the drama titles that formed part of the joint ABC/Screen Australia Girls initiative.
NITV was the first release broadcaster for Grace Beside Me. The series was also financed by the ABC and a presale to Disney Channel.
In 2017/18, three titles entered production that were financed by the commercial broadcasters: Larry the Wonderpup (Seven), Space Chickens in Space (Nine) and The Bureau of Magical Things (Ten).
Australian Children’s TV drama slate
Australian Children’s TV drama
No. Hours1 Budgets ($m)2 Spend ($m)3 Avg. cost/hr
$m4
Domestic
2013/14 9 99 63 44 0.637
2014/15 10 80 65 54 0.809
2015/16 13 102 n.p. n.p. n.p.
2016/17* 9 74 62 34 0.838
2017/18 9 65 n.p. n.p. n.p.
5-yr av 10 84 61 46 0.727
Co-production
2013/14 2 33 24 8 0.730
2014/15 3 36 30 10 0.827
2015/16 1 13 n.p. n.p. n.p.
2016/17* 4 38 38 13 1.025
2017/18 1 7 n.p. n.p. n.p.
5-yr av 2 25 26 10 1.047
Total Australian
2013/14 11 131 86 53 0.660
2014/15 13 116 95 64 0.815
2015/16 14 115 101 66 0.879
2016/17* 13 111 100 48 0.901
2017/18 10 71 54 49 0.755
5-yr av 12 109 87 56 0.801
Grace Beside Me
*Excludes two children’s TV drama titles that were released online before TV broadcast – Trip for Biscuits (3 hours) had its premiere on ABC iview in March 2017 before airing on ABC Me. Drop Dead Weird (10 hours) premiered on Kidson7 YouTube in October 2017 before being released on 7TWO in November 2017.
Notes: Figures may not total exactly due to rounding. n.p. Not for publication due to confidentiality reasons.1. Commercial broadcast hours rather than actual running time. Individual program duration has been rounded to
15, 30 or 60 minutes as appropriate (including commercial breaks)2. Total cost of productions3. Amount of total budgets spent in Australia4. Total budgets divided by total hours
The Drama Report 2017/18 | Screen Australia 15
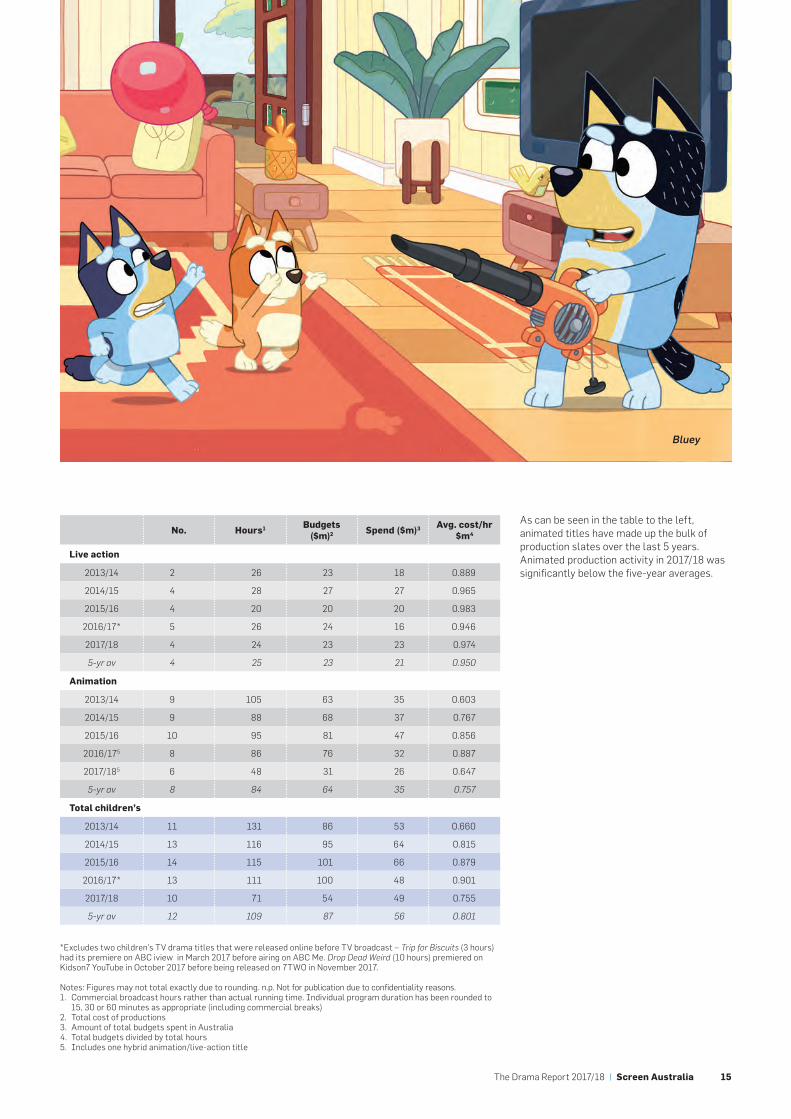
No. Hours1 Budgets ($m)2 Spend ($m)3 Avg. cost/hr
$m4
Live action
2013/14 2 26 23 18 0.889
2014/15 4 28 27 27 0.965
2015/16 4 20 20 20 0.983
2016/17* 5 26 24 16 0.946
2017/18 4 24 23 23 0.974
5-yr av 4 25 23 21 0.950
Animation
2013/14 9 105 63 35 0.603
2014/15 9 88 68 37 0.767
2015/16 10 95 81 47 0.856
2016/175 8 86 76 32 0.887
2017/185 6 48 31 26 0.647
5-yr av 8 84 64 35 0.757
Total children’s
2013/14 11 131 86 53 0.660
2014/15 13 116 95 64 0.815
2015/16 14 115 101 66 0.879
2016/17* 13 111 100 48 0.901
2017/18 10 71 54 49 0.755
5-yr av 12 109 87 56 0.801
As can be seen in the table to the left, animated titles have made up the bulk of production slates over the last 5 years. Animated production activity in 2017/18 was significantly below the five-year averages.
*Excludes two children’s TV drama titles that were released online before TV broadcast – Trip for Biscuits (3 hours) had its premiere on ABC iview in March 2017 before airing on ABC Me. Drop Dead Weird (10 hours) premiered on Kidson7 YouTube in October 2017 before being released on 7TWO in November 2017.
Notes: Figures may not total exactly due to rounding. n.p. Not for publication due to confidentiality reasons.1. Commercial broadcast hours rather than actual running time. Individual program duration has been rounded to
15, 30 or 60 minutes as appropriate (including commercial breaks)2. Total cost of productions3. Amount of total budgets spent in Australia4. Total budgets divided by total hours5. Includes one hybrid animation/live-action title
Bluey
16
Australian online drama programs
Notes: Figures may not total exactly due to rounding. n.p. Not for publication due to confidentiality reasons.1. Actual running time 2. Total cost of productions3. Amount of total budgets spent in Australia4. Total budgets divided by total hours
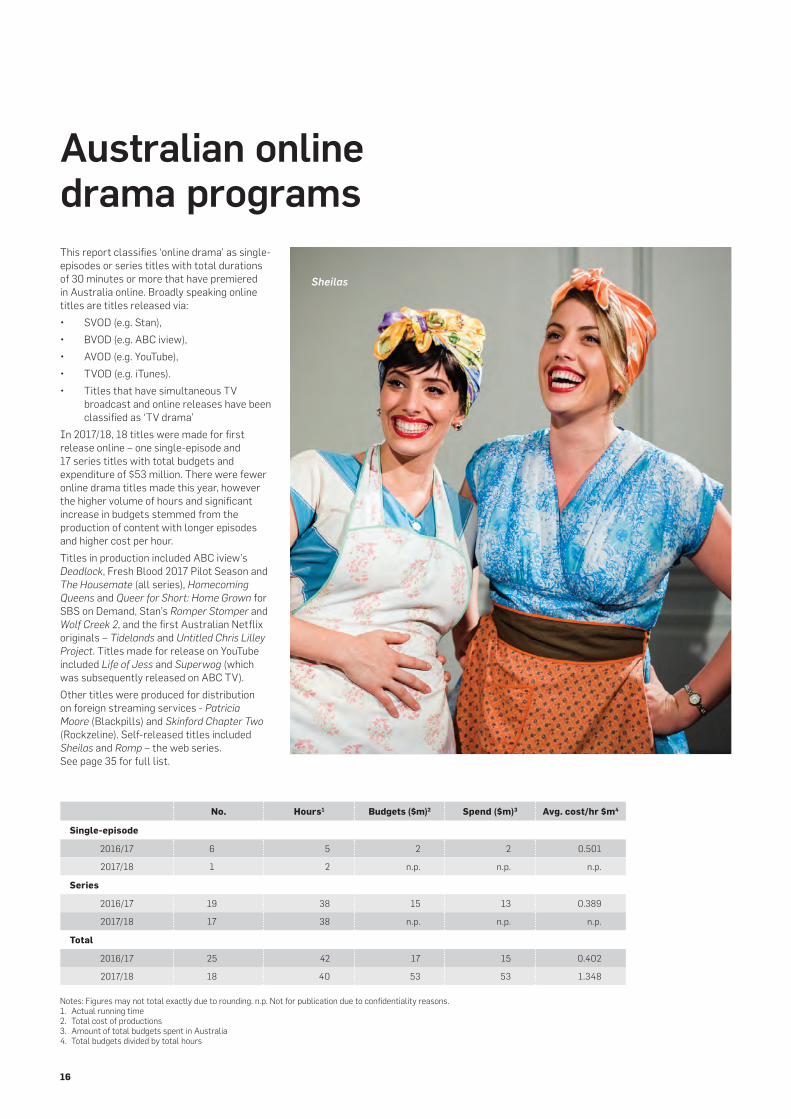
This report classifies ‘online drama’ as single-episodes or series titles with total durations of 30 minutes or more that have premiered in Australia online. Broadly speaking online titles are titles released via:
• SVOD (e.g. Stan),
• BVOD (e.g. ABC iview),
• AVOD (e.g. YouTube),
• TVOD (e.g. iTunes).
• Titles that have simultaneous TV broadcast and online releases have been classified as ‘TV drama’
In 2017/18, 18 titles were made for first release online – one single-episode and 17 series titles with total budgets and expenditure of $53 million. There were fewer online drama titles made this year, however the higher volume of hours and significant increase in budgets stemmed from the production of content with longer episodes and higher cost per hour.
Titles in production included ABC iview’s Deadlock, Fresh Blood 2017 Pilot Season and The Housemate (all series), Homecoming Queens and Queer for Short: Home Grown for SBS on Demand, Stan’s Romper Stomper and Wolf Creek 2, and the first Australian Netflix originals – Tidelands and Untitled Chris Lilley Project. Titles made for release on YouTube included Life of Jess and Superwog (which was subsequently released on ABC TV).
Other titles were produced for distribution on foreign streaming services - Patricia Moore (Blackpills) and Skinford Chapter Two (Rockzeline). Self-released titles included Sheilas and Romp – the web series. See page 35 for full list.
No. Hours1 Budgets ($m)2 Spend ($m)3 Avg. cost/hr $m4
Single-episode
2016/17 6 5 2 2 0.501
2017/18 1 2 n.p. n.p. n.p.
Series
2016/17 19 38 15 13 0.389
2017/18 17 38 n.p. n.p. n.p.
Total
2016/17 25 42 17 15 0.402
2017/18 18 40 53 53 1.348
Sheilas
The Drama Report 2017/18 | Screen Australia 17
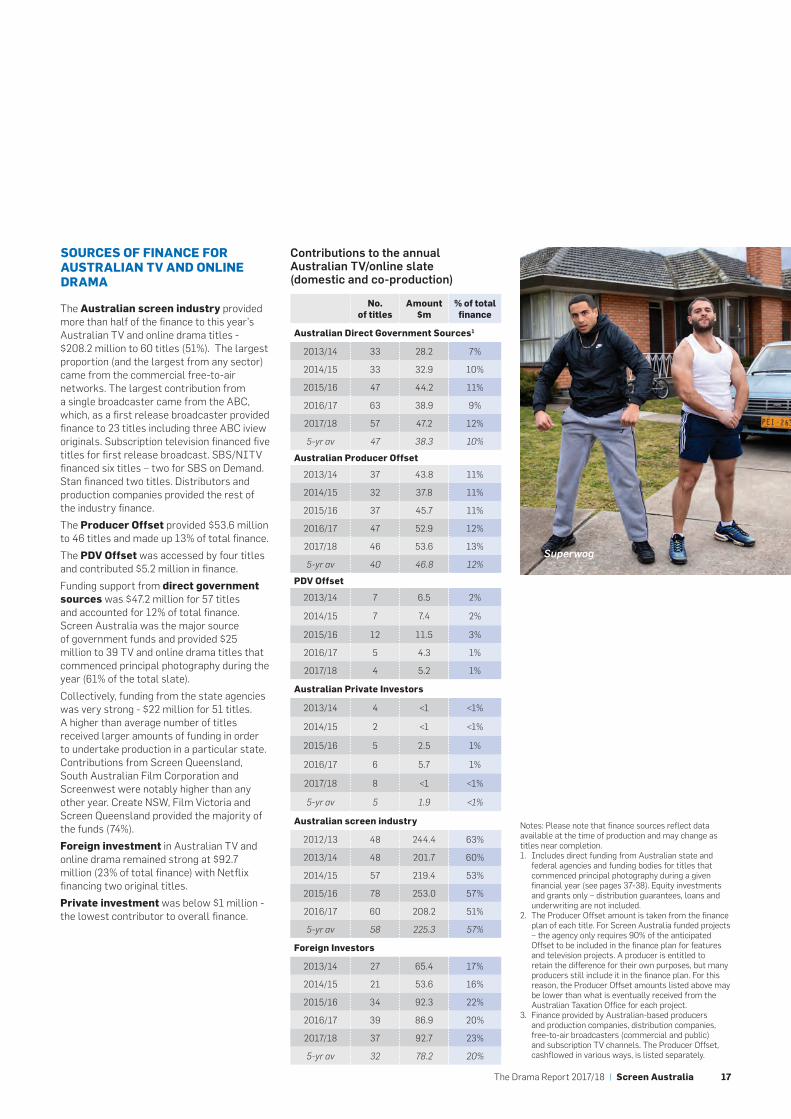
SOURCES OF FINANCE FOR AUSTRALIAN TV AND ONLINE DRAMA
The Australian screen industry provided more than half of the finance to this year’s Australian TV and online drama titles - $208.2 million to 60 titles (51%). The largest proportion (and the largest from any sector) came from the commercial free-to-air networks. The largest contribution from a single broadcaster came from the ABC, which, as a first release broadcaster provided finance to 23 titles including three ABC iview originals. Subscription television financed five titles for first release broadcast. SBS/NITV financed six titles – two for SBS on Demand. Stan financed two titles. Distributors and production companies provided the rest of the industry finance.
The Producer Offset provided $53.6 million to 46 titles and made up 13% of total finance.
The PDV Offset was accessed by four titles and contributed $5.2 million in finance.
Funding support from direct government sources was $47.2 million for 57 titles and accounted for 12% of total finance. Screen Australia was the major source of government funds and provided $25 million to 39 TV and online drama titles that commenced principal photography during the year (61% of the total slate).
Collectively, funding from the state agencies was very strong - $22 million for 51 titles. A higher than average number of titles received larger amounts of funding in order to undertake production in a particular state. Contributions from Screen Queensland, South Australian Film Corporation and Screenwest were notably higher than any other year. Create NSW, Film Victoria and Screen Queensland provided the majority of the funds (74%).
Foreign investment in Australian TV and online drama remained strong at $92.7 million (23% of total finance) with Netflix financing two original titles.
Private investment was below $1 million - the lowest contributor to overall finance.
No. of titles
Amount $m
% of total finance
Australian Direct Government Sources1
2013/14 33 28.2 7%
2014/15 33 32.9 10%
2015/16 47 44.2 11%
2016/17 63 38.9 9%
2017/18 57 47.2 12%
5-yr av 47 38.3 10%
Australian Producer Offset
2013/14 37 43.8 11%
2014/15 32 37.8 11%
2015/16 37 45.7 11%
2016/17 47 52.9 12%
2017/18 46 53.6 13%
5-yr av 40 46.8 12%
PDV Offset
2013/14 7 6.5 2%
2014/15 7 7.4 2%
2015/16 12 11.5 3%
2016/17 5 4.3 1%
2017/18 4 5.2 1%
Australian Private Investors
2013/14 4 <1 <1%
2014/15 2 <1 <1%
2015/16 5 2.5 1%
2016/17 6 5.7 1%
2017/18 8 <1 <1%
5-yr av 5 1.9 <1%
Australian screen industry
2012/13 48 244.4 63%
2013/14 48 201.7 60%
2014/15 57 219.4 53%
2015/16 78 253.0 57%
2016/17 60 208.2 51%
5-yr av 58 225.3 57%
Foreign Investors
2013/14 27 65.4 17%
2014/15 21 53.6 16%
2015/16 34 92.3 22%
2016/17 39 86.9 20%
2017/18 37 92.7 23%
5-yr av 32 78.2 20%
Notes: Please note that finance sources reflect data available at the time of production and may change as titles near completion.1. Includes direct funding from Australian state and
federal agencies and funding bodies for titles that commenced principal photography during a given financial year (see pages 37-38). Equity investments and grants only – distribution guarantees, loans and underwriting are not included.
2. The Producer Offset amount is taken from the finance plan of each title. For Screen Australia funded projects – the agency only requires 90% of the anticipated Offset to be included in the finance plan for features and television projects. A producer is entitled to retain the difference for their own purposes, but many producers still include it in the finance plan. For this reason, the Producer Offset amounts listed above may be lower than what is eventually received from the Australian Taxation Office for each project.
3. Finance provided by Australian-based producers and production companies, distribution companies, free-to-air broadcasters (commercial and public) and subscription TV channels. The Producer Offset, cashflowed in various ways, is listed separately.
Contributions to the annual Australian TV/online slate (domestic and co-production)
Superwog
18
Superwog
2013/14
2014/15
2015/16
2016/17
2017/18
0 10 20 30 40 50
Screen Australia State Agencies Other
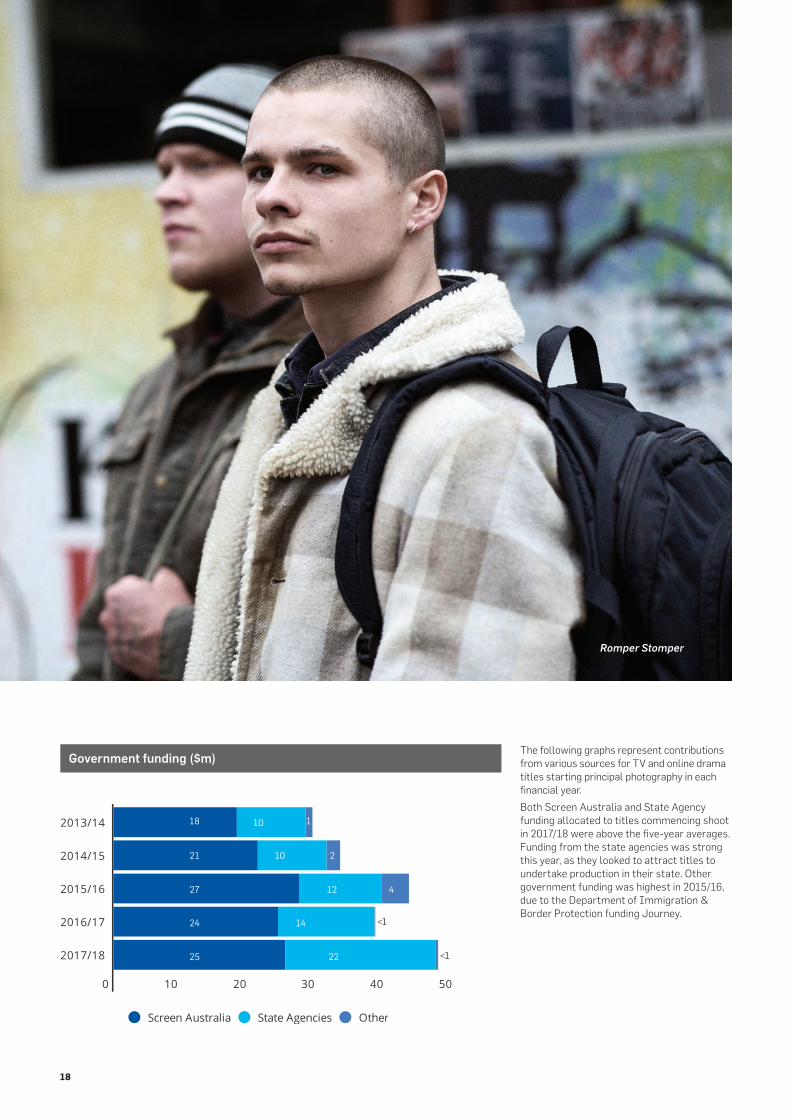
The following graphs represent contributions from various sources for TV and online drama titles starting principal photography in each financial year.
Both Screen Australia and State Agency funding allocated to titles commencing shoot in 2017/18 were above the five-year averages. Funding from the state agencies was strong this year, as they looked to attract titles to undertake production in their state. Other government funding was highest in 2015/16, due to the Department of Immigration & Border Protection funding Journey.
Government funding ($m)
18
21
27
24
25
10
10
12
14
22
1
2
4
<1
<1
Romper Stomper
The Drama Report 2017/18 | Screen Australia 19
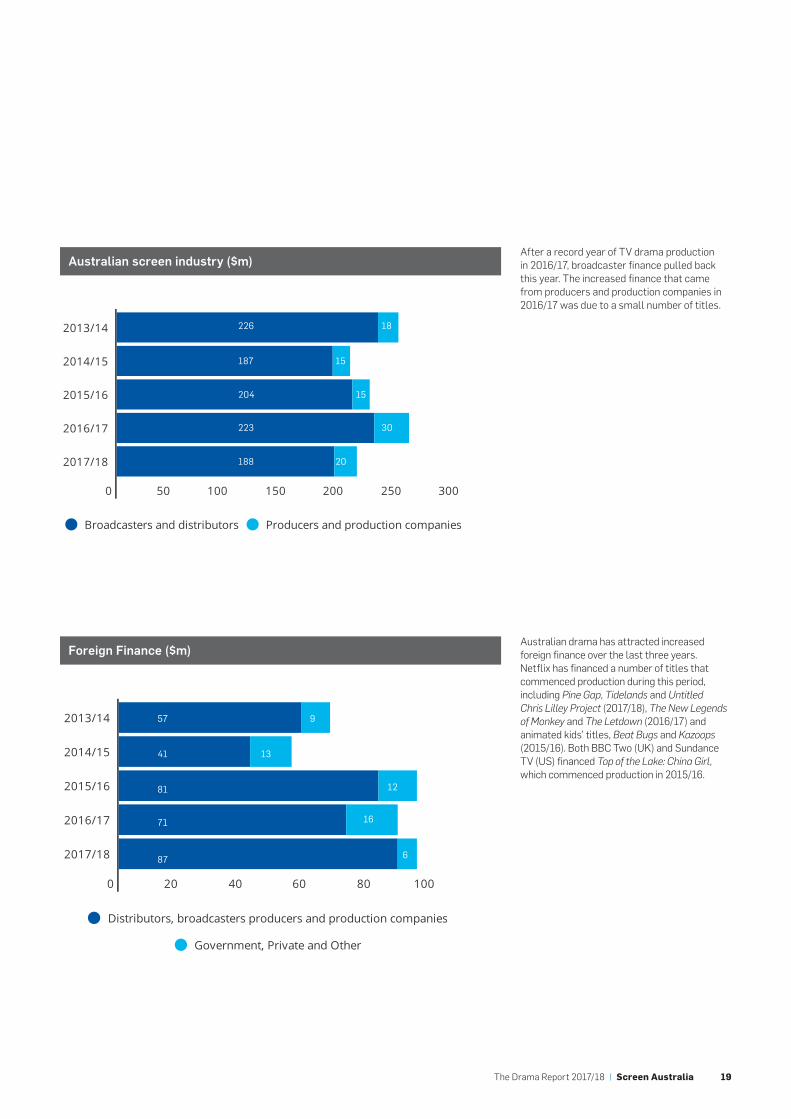
Australian drama has attracted increased foreign finance over the last three years. Netflix has financed a number of titles that commenced production during this period, including Pine Gap, Tidelands and Untitled Chris Lilley Project (2017/18), The New Legends of Monkey and The Letdown (2016/17) and animated kids’ titles, Beat Bugs and Kazoops (2015/16). Both BBC Two (UK) and Sundance TV (US) financed Top of the Lake: China Girl, which commenced production in 2015/16.
Australian screen industry ($m)
Foreign Finance ($m)
2013/14
2014/15
2015/16
2016/17
2017/18
0 50 100 150 200 250 300
Broadcasters and distributors Producers and production companies
2013/14
2014/15
2015/16
2016/17
2017/18
0 20 40 60 80 100
Distributors, broadcasters producers and production companies
Government, Private and Other
After a record year of TV drama production in 2016/17, broadcaster finance pulled back this year. The increased finance that came from producers and production companies in 2016/17 was due to a small number of titles.
226
187
204
223
188
18
15
15
30
20
57
41
81
71
87
9
12
16
6
13
20
TV/online drama finance by first release platform
No. of titlesInvestment
$m*Hours Budgets $m
ABC (includes iview)
2013/14 20 45 102 89
2014/15 20 52 109 115
2015/16 21 53 100 106
2016/17 34 55 120 130
2017/18 23 53 112 144
5-yr av 24 52 109 117
SBS/NITV (includes SBS on Demand)
2013/14 1 n.p. n.p. n.p.
2014/15 3 4 8 7
2015/16 3 3 9 9
2016/17 3 6 11 14
2017/18 6 8 20 21
5-yr av 3 5 10 11
Public broadcasters (ABC + SBS/NITV)
2013/14 21 n.p. n.p. n.p.
2014/15 23 56 117 122
2015/16 24 56 109 115
2016/17 37 62 131 143
2017/18 29 61 132 165
5-yr av 27 56 119 127
Commercial Free-to-air TV (includes on-demand platforms)
2013/14 23 147 454 240
2014/15 20 93 358 166
2015/16 23 108 393 218
2016/17 22 107 398 211
2017/18 17 84 336 142
5-yr av 21 108 388 195
Subscription television broadcasters
2013/14 4 26 35 53
2014/15 3 33 38 44
2015/16 6 30 46 67
2016/17 7 50 58 75
2017/18 5 31 33 50
5-yr av 5 34 42 58
Australian and foreign online streaming services**
2014/15 2 n.p. n.p. n.p.
2015/16 3 6 10 12
2016/17 8 3 9 5
2017/18 6 30 24 48
4-yr av 5 10 12 16
*investment includes licence fees, presales, equity investments etc. Financial contributions provided by a broadcaster or online streaming service for subsequent release rights are not accounted for here.
**combined due to confidentiality
Notes: Figures may not total exactly due to rounding. n.p. Not for publication due to confidentiality reasons.
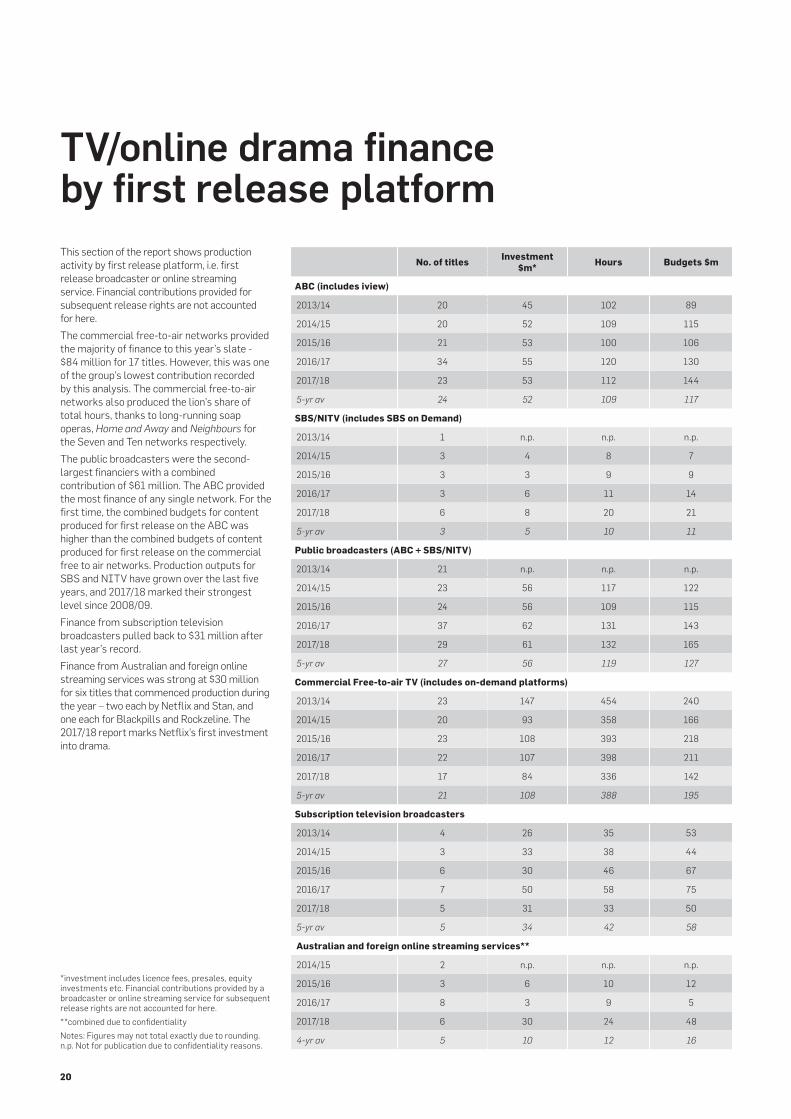
This section of the report shows production activity by first release platform, i.e. first release broadcaster or online streaming service. Financial contributions provided for subsequent release rights are not accounted for here.
The commercial free-to-air networks provided the majority of finance to this year’s slate - $84 million for 17 titles. However, this was one of the group’s lowest contribution recorded by this analysis. The commercial free-to-air networks also produced the lion’s share of total hours, thanks to long-running soap operas, Home and Away and Neighbours for the Seven and Ten networks respectively.
The public broadcasters were the second-largest financiers with a combined contribution of $61 million. The ABC provided the most finance of any single network. For the first time, the combined budgets for content produced for first release on the ABC was higher than the combined budgets of content produced for first release on the commercial free to air networks. Production outputs for SBS and NITV have grown over the last five years, and 2017/18 marked their strongest level since 2008/09.
Finance from subscription television broadcasters pulled back to $31 million after last year’s record.
Finance from Australian and foreign online streaming services was strong at $30 million for six titles that commenced production during the year – two each by Netflix and Stan, and one each for Blackpills and Rockzeline. The 2017/18 report marks Netflix’s first investment into drama.
The Drama Report 2017/18 | Screen Australia 21
Foreign production
Notes: Figures may not total exactly due to rounding. n.p. Not for publication due to confidentiality reasons.1. Amount of total budgets spent in Australia
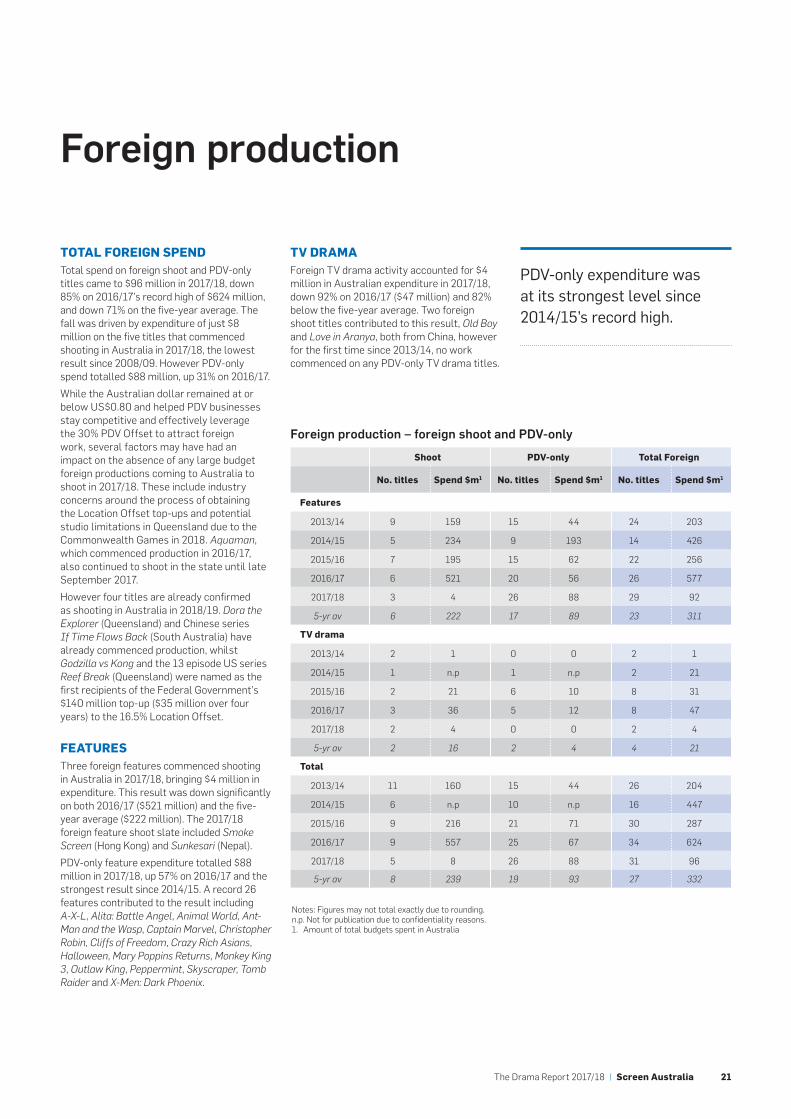
TOTAL FOREIGN SPENDTotal spend on foreign shoot and PDV-only titles came to $96 million in 2017/18, down 85% on 2016/17’s record high of $624 million, and down 71% on the five-year average. The fall was driven by expenditure of just $8 million on the five titles that commenced shooting in Australia in 2017/18, the lowest result since 2008/09. However PDV-only spend totalled $88 million, up 31% on 2016/17.
While the Australian dollar remained at or below US$0.80 and helped PDV businesses stay competitive and effectively leverage the 30% PDV Offset to attract foreign work, several factors may have had an impact on the absence of any large budget foreign productions coming to Australia to shoot in 2017/18. These include industry concerns around the process of obtaining the Location Offset top-ups and potential studio limitations in Queensland due to the Commonwealth Games in 2018. Aquaman, which commenced production in 2016/17, also continued to shoot in the state until late September 2017.
However four titles are already confirmed as shooting in Australia in 2018/19. Dora the Explorer (Queensland) and Chinese series If Time Flows Back (South Australia) have already commenced production, whilst Godzilla vs Kong and the 13 episode US series Reef Break (Queensland) were named as the first recipients of the Federal Government’s $140 million top-up ($35 million over four years) to the 16.5% Location Offset.
FEATURESThree foreign features commenced shooting in Australia in 2017/18, bringing $4 million in expenditure. This result was down significantly on both 2016/17 ($521 million) and the five-year average ($222 million). The 2017/18 foreign feature shoot slate included Smoke Screen (Hong Kong) and Sunkesari (Nepal).
PDV-only feature expenditure totalled $88 million in 2017/18, up 57% on 2016/17 and the strongest result since 2014/15. A record 26 features contributed to the result including A-X-L, Alita: Battle Angel, Animal World, Ant-Man and the Wasp, Captain Marvel, Christopher Robin, Cliffs of Freedom, Crazy Rich Asians, Halloween, Mary Poppins Returns, Monkey King 3, Outlaw King, Peppermint, Skyscraper, Tomb Raider and X-Men: Dark Phoenix.
Shoot PDV-only Total Foreign
No. titles Spend $m1 No. titles Spend $m1 No. titles Spend $m1
Features
2013/14 9 159 15 44 24 203
2014/15 5 234 9 193 14 426
2015/16 7 195 15 62 22 256
2016/17 6 521 20 56 26 577
2017/18 3 4 26 88 29 92
5-yr av 6 222 17 89 23 311
TV drama
2013/14 2 1 0 0 2 1
2014/15 1 n.p 1 n.p 2 21
2015/16 2 21 6 10 8 31
2016/17 3 36 5 12 8 47
2017/18 2 4 0 0 2 4
5-yr av 2 16 2 4 4 21
Total
2013/14 11 160 15 44 26 204
2014/15 6 n.p 10 n.p 16 447
2015/16 9 216 21 71 30 287
2016/17 9 557 25 67 34 624
2017/18 5 8 26 88 31 96
5-yr av 8 239 19 93 27 332
Foreign production – foreign shoot and PDV-only
TV DRAMAForeign TV drama activity accounted for $4 million in Australian expenditure in 2017/18, down 92% on 2016/17 ($47 million) and 82% below the five-year average. Two foreign shoot titles contributed to this result, Old Boy and Love in Aranya, both from China, however for the first time since 2013/14, no work commenced on any PDV-only TV drama titles.
PDV-only expenditure was at its strongest level since 2014/15’s record high.
22
NSW QLD VIC
Shoot PDV Total Shoot PDV Total Shoot PDV Total
$m
2013/14 300 65 365 124 5 129 192 77 270
2014/15 145 207 352 232 6 238 185 51 235
2015/16 390 86 476 89 10 99 160 58 217
2016/17 327 142 469 415 13 427 239 84 323
2017/18 177 124 301 109 27 137 183 63 246
%
2013/14 44% 36% 42% 18% 3% 15% 28% 43% 31%
2014/15 24% 77% 40% 38% 2% 27% 31% 19% 27%
2015/16 56% 51% 55% 13% 6% 12% 23% 34% 25%
2016/17 32% 54% 36% 40% 5% 33% 23% 32% 25%
2017/18 32% 48% 37% 20% 11% 17% 33% 24% 30%
SA WA Tas/NT/ACT
Shoot PDV Total Shoot PDV Total Shoot PDV Total
$m
2013/14 46 28 74 13 2 14 8 1 9
2014/15 9 5 14 12 <1 13 20 <1 20
2015/16 14 14 28 26 2 28 12 1 12
2016/17 22 20 43 7 3 10 22 1 23
2017/18 41 41 82 33 4 37 11 <1 11
%
2013/14 7% 16% 9% 2% 1% 2% 1% 1% 1%
2014/15 1% 2% 2% 2% <1% 1% 3% <1% 2%
2015/16 2% 8% 3% 4% 1% 3% 2% <1% 1%
2016/17 2% 8% 3% 1% 1% 1% 2% <1% 2%
2017/18 7% 16% 10% 6% 2% 5% 2% <1% 1%
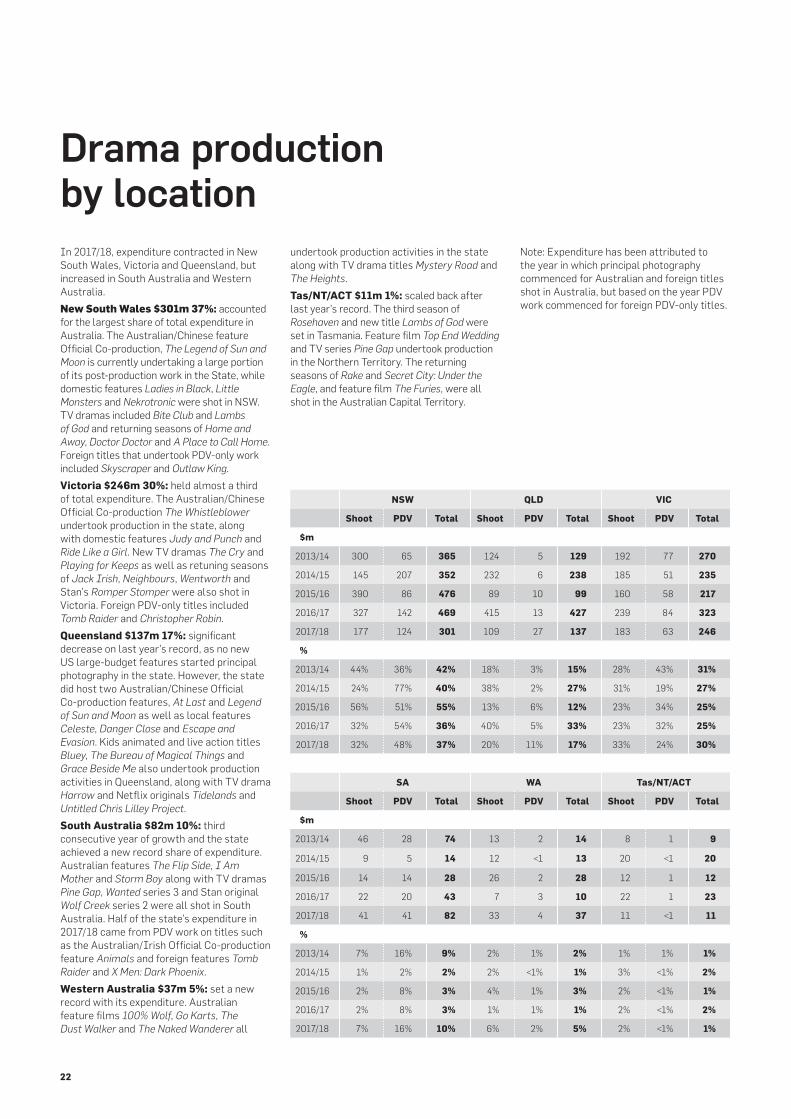
Drama production by locationIn 2017/18, expenditure contracted in New South Wales, Victoria and Queensland, but increased in South Australia and Western Australia.
New South Wales $301m 37%: accounted for the largest share of total expenditure in Australia. The Australian/Chinese feature Official Co-production, The Legend of Sun and Moon is currently undertaking a large portion of its post-production work in the State, while domestic features Ladies in Black, Little Monsters and Nekrotronic were shot in NSW. TV dramas included Bite Club and Lambs of God and returning seasons of Home and Away, Doctor Doctor and A Place to Call Home. Foreign titles that undertook PDV-only work included Skyscraper and Outlaw King.
Victoria $246m 30%: held almost a third of total expenditure. The Australian/Chinese Official Co-production The Whistleblower undertook production in the state, along with domestic features Judy and Punch and Ride Like a Girl. New TV dramas The Cry and Playing for Keeps as well as retuning seasons of Jack Irish, Neighbours, Wentworth and Stan’s Romper Stomper were also shot in Victoria. Foreign PDV-only titles included Tomb Raider and Christopher Robin.
Queensland $137m 17%: significant decrease on last year’s record, as no new US large-budget features started principal photography in the state. However, the state did host two Australian/Chinese Official Co-production features, At Last and Legend of Sun and Moon as well as local features Celeste, Danger Close and Escape and Evasion. Kids animated and live action titles Bluey, The Bureau of Magical Things and Grace Beside Me also undertook production activities in Queensland, along with TV drama Harrow and Netflix originals Tidelands and Untitled Chris Lilley Project.
South Australia $82m 10%: third consecutive year of growth and the state achieved a new record share of expenditure. Australian features The Flip Side, I Am Mother and Storm Boy along with TV dramas Pine Gap, Wanted series 3 and Stan original Wolf Creek series 2 were all shot in South Australia. Half of the state’s expenditure in 2017/18 came from PDV work on titles such as the Australian/Irish Official Co-production feature Animals and foreign features Tomb Raider and X Men: Dark Phoenix.
Western Australia $37m 5%: set a new record with its expenditure. Australian feature films 100% Wolf, Go Karts, The Dust Walker and The Naked Wanderer all
undertook production activities in the state along with TV drama titles Mystery Road and The Heights.
Tas/NT/ACT $11m 1%: scaled back after last year’s record. The third season of Rosehaven and new title Lambs of God were set in Tasmania. Feature film Top End Wedding and TV series Pine Gap undertook production in the Northern Territory. The returning seasons of Rake and Secret City: Under the Eagle, and feature film The Furies, were all shot in the Australian Capital Territory.
Note: Expenditure has been attributed to the year in which principal photography commenced for Australian and foreign titles shot in Australia, but based on the year PDV work commenced for foreign PDV-only titles.
The Drama Report 2017/18 | Screen Australia 23
NSW QLD VIC
Shoot PDV Total Shoot PDV Total Shoot PDV Total
$m
2013/14 300 65 365 124 5 129 192 77 270
2014/15 145 207 352 232 6 238 185 51 235
2015/16 390 86 476 89 10 99 160 58 217
2016/17 327 142 469 415 13 427 239 84 323
2017/18 177 124 301 109 27 137 183 63 246
%
2013/14 44% 36% 42% 18% 3% 15% 28% 43% 31%
2014/15 24% 77% 40% 38% 2% 27% 31% 19% 27%
2015/16 56% 51% 55% 13% 6% 12% 23% 34% 25%
2016/17 32% 54% 36% 40% 5% 33% 23% 32% 25%
2017/18 32% 48% 37% 20% 11% 17% 33% 24% 30%
SA WA Tas/NT/ACT
Shoot PDV Total Shoot PDV Total Shoot PDV Total
$m
2013/14 46 28 74 13 2 14 8 1 9
2014/15 9 5 14 12 <1 13 20 <1 20
2015/16 14 14 28 26 2 28 12 1 12
2016/17 22 20 43 7 3 10 22 1 23
2017/18 41 41 82 33 4 37 11 <1 11
%
2013/14 7% 16% 9% 2% 1% 2% 1% 1% 1%
2014/15 1% 2% 2% 2% <1% 1% 3% <1% 2%
2015/16 2% 8% 3% 4% 1% 3% 2% <1% 1%
2016/17 2% 8% 3% 1% 1% 1% 2% <1% 2%
2017/18 7% 16% 10% 6% 2% 5% 2% <1% 1%
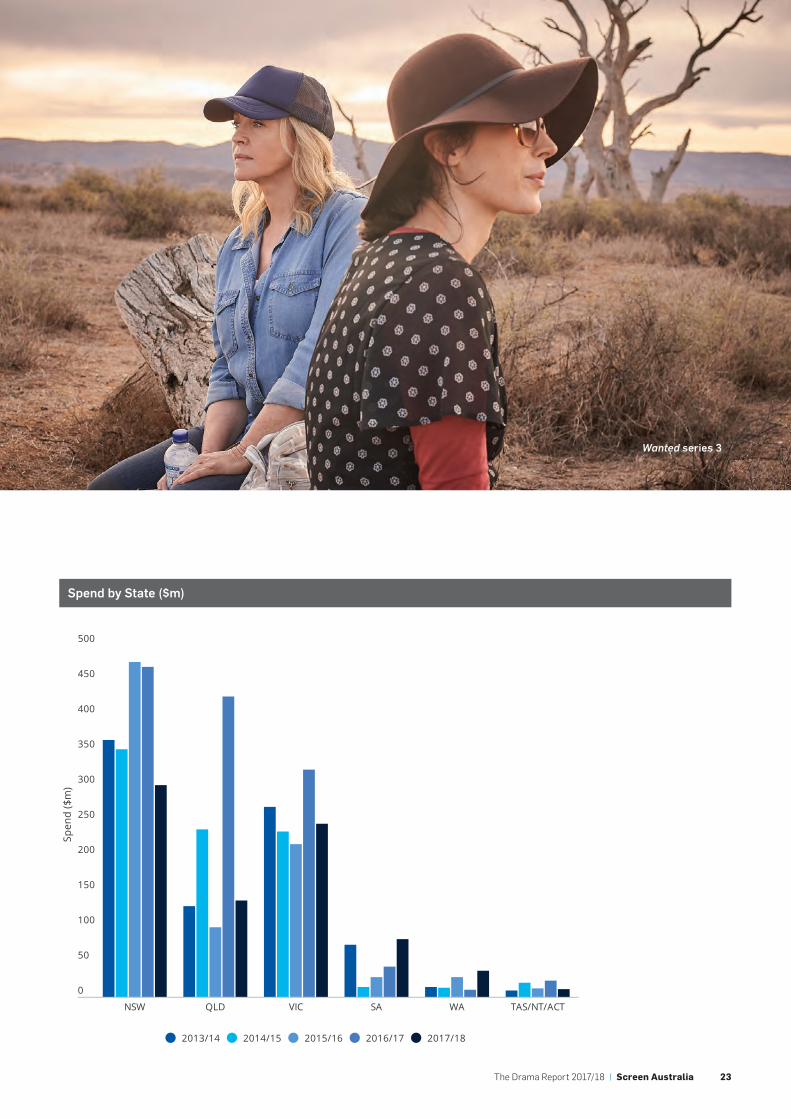
Spend by State ($m)
500
450
400
350
300
250
200
150
100
50
0
NSW QLD VIC SA WA TAS/NT/ACT
Spen
d ($
m)
2013/14 2014/15 2015/16 2016/17 2017/18
Wanted series 3
24
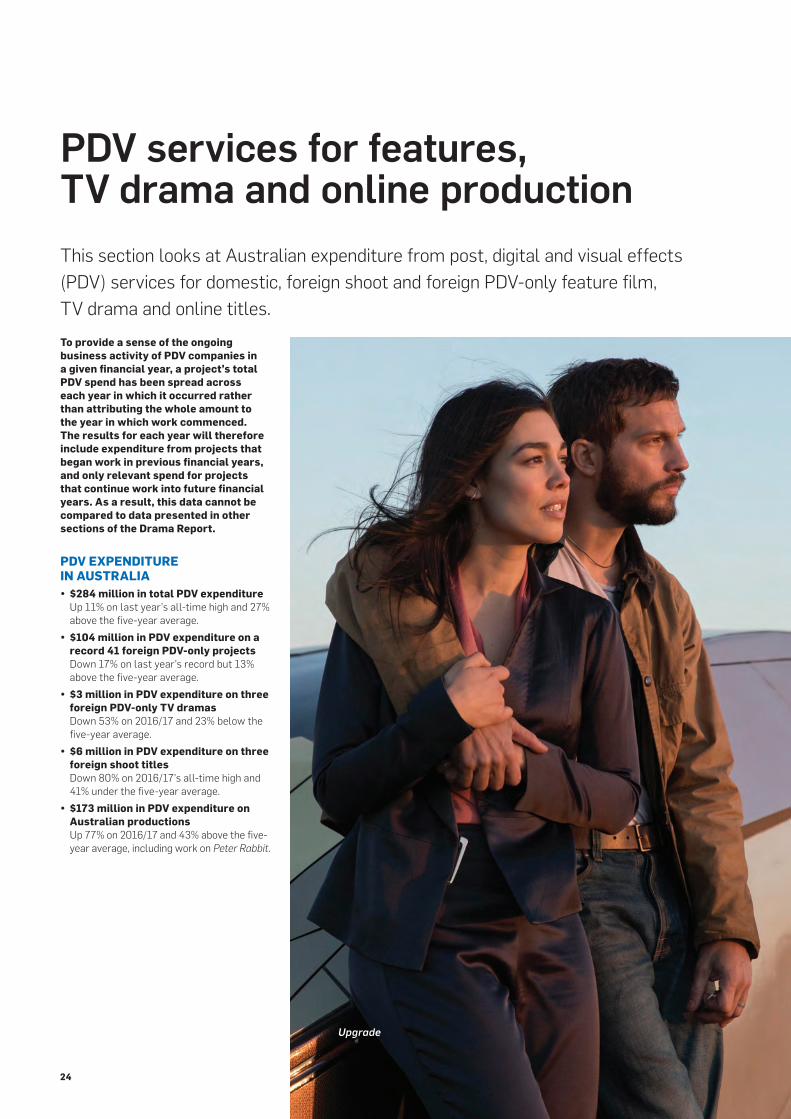
PDV services for features, TV drama and online production
This section looks at Australian expenditure from post, digital and visual effects (PDV) services for domestic, foreign shoot and foreign PDV-only feature film, TV drama and online titles.
To provide a sense of the ongoing business activity of PDV companies in a given financial year, a project’s total PDV spend has been spread across each year in which it occurred rather than attributing the whole amount to the year in which work commenced. The results for each year will therefore include expenditure from projects that began work in previous financial years, and only relevant spend for projects that continue work into future financial years. As a result, this data cannot be compared to data presented in other sections of the Drama Report.
PDV EXPENDITURE IN AUSTRALIA y $284 million in total PDV expenditure Up 11% on last year’s all-time high and 27% above the five-year average.
y $104 million in PDV expenditure on a record 41 foreign PDV-only projects Down 17% on last year’s record but 13% above the five-year average.
y $3 million in PDV expenditure on three foreign PDV-only TV dramas Down 53% on 2016/17 and 23% below the five-year average.
y $6 million in PDV expenditure on three foreign shoot titles Down 80% on 2016/17’s all-time high and 41% under the five-year average.
y $173 million in PDV expenditure on Australian productions Up 77% on 2016/17 and 43% above the five-year average, including work on Peter Rabbit.
Upgrade
The Drama Report 2017/18 | Screen Australia 25
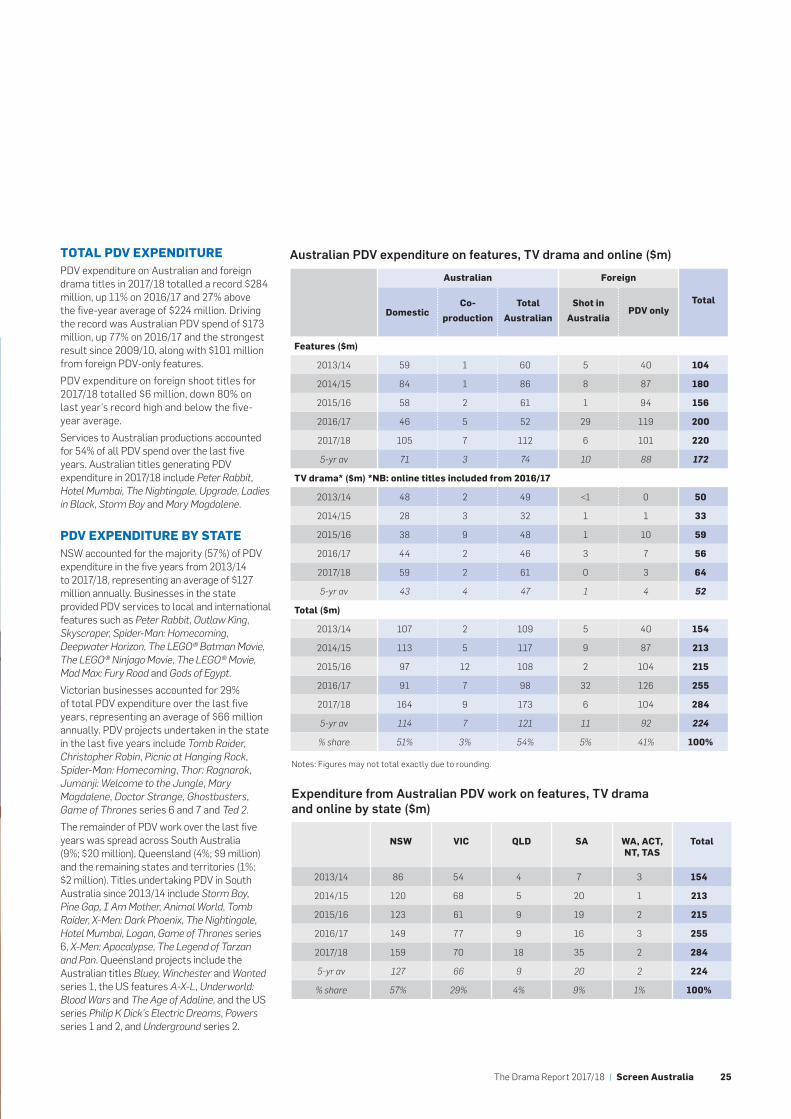
TOTAL PDV EXPENDITUREPDV expenditure on Australian and foreign drama titles in 2017/18 totalled a record $284 million, up 11% on 2016/17 and 27% above the five-year average of $224 million. Driving the record was Australian PDV spend of $173 million, up 77% on 2016/17 and the strongest result since 2009/10, along with $101 million from foreign PDV-only features.
PDV expenditure on foreign shoot titles for 2017/18 totalled $6 million, down 80% on last year’s record high and below the five-year average.
Services to Australian productions accounted for 54% of all PDV spend over the last five years. Australian titles generating PDV expenditure in 2017/18 include Peter Rabbit, Hotel Mumbai, The Nightingale, Upgrade, Ladies in Black, Storm Boy and Mary Magdalene.
PDV EXPENDITURE BY STATENSW accounted for the majority (57%) of PDV expenditure in the five years from 2013/14 to 2017/18, representing an average of $127 million annually. Businesses in the state provided PDV services to local and international features such as Peter Rabbit, Outlaw King, Skyscraper, Spider-Man: Homecoming, Deepwater Horizon, The LEGO® Batman Movie, The LEGO® Ninjago Movie, The LEGO® Movie, Mad Max: Fury Road and Gods of Egypt.
Victorian businesses accounted for 29% of total PDV expenditure over the last five years, representing an average of $66 million annually. PDV projects undertaken in the state in the last five years include Tomb Raider, Christopher Robin, Picnic at Hanging Rock, Spider-Man: Homecoming, Thor: Ragnarok, Jumanji: Welcome to the Jungle, Mary Magdalene, Doctor Strange, Ghostbusters, Game of Thrones series 6 and 7 and Ted 2.
The remainder of PDV work over the last five years was spread across South Australia (9%; $20 million), Queensland (4%; $9 million) and the remaining states and territories (1%; $2 million). Titles undertaking PDV in South Australia since 2013/14 include Storm Boy, Pine Gap, I Am Mother, Animal World, Tomb Raider, X-Men: Dark Phoenix, The Nightingale, Hotel Mumbai, Logan, Game of Thrones series 6, X-Men: Apocalypse, The Legend of Tarzan and Pan. Queensland projects include the Australian titles Bluey, Winchester and Wanted series 1, the US features A-X-L, Underworld: Blood Wars and The Age of Adaline, and the US series Philip K Dick’s Electric Dreams, Powers series 1 and 2, and Underground series 2.
Australian Foreign
TotalDomestic
Co-
production
Total
Australian
Shot in
AustraliaPDV only
Features ($m)
2013/14 59 1 60 5 40 104
2014/15 84 1 86 8 87 180
2015/16 58 2 61 1 94 156
2016/17 46 5 52 29 119 200
2017/18 105 7 112 6 101 220
5-yr av 71 3 74 10 88 172
TV drama* ($m) *NB: online titles included from 2016/17
2013/14 48 2 49 <1 0 50
2014/15 28 3 32 1 1 33
2015/16 38 9 48 1 10 59
2016/17 44 2 46 3 7 56
2017/18 59 2 61 0 3 64
5-yr av 43 4 47 1 4 52
Total ($m)
2013/14 107 2 109 5 40 154
2014/15 113 5 117 9 87 213
2015/16 97 12 108 2 104 215
2016/17 91 7 98 32 126 255
2017/18 164 9 173 6 104 284
5-yr av 114 7 121 11 92 224
% share 51% 3% 54% 5% 41% 100%
Australian PDV expenditure on features, TV drama and online ($m)
NSW VIC QLD SA WA, ACT, NT, TAS
Total
2013/14 86 54 4 7 3 154
2014/15 120 68 5 20 1 213
2015/16 123 61 9 19 2 215
2016/17 149 77 9 16 3 255
2017/18 159 70 18 35 2 284
5-yr av 127 66 9 20 2 224
% share 57% 29% 4% 9% 1% 100%
Expenditure from Australian PDV work on features, TV drama and online by state ($m)
Notes: Figures may not total exactly due to rounding.
26
0
20
40
60
80
100
120
140
0
6
11
17
23
29
34
40
2013/14 2014/15 2015/16 2016/17 2017/18
Spen
d ($
m)
No.
of t
itles
Spend ($m) No. of titles
104104 126
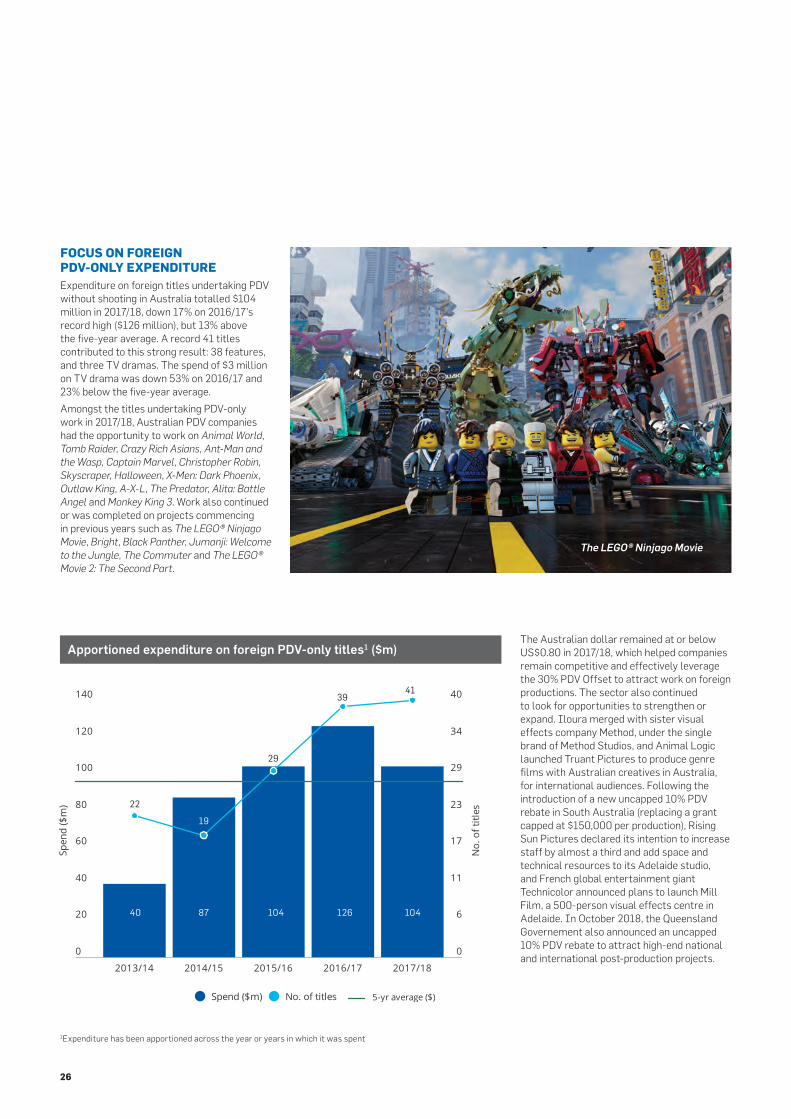
FOCUS ON FOREIGN PDV-ONLY EXPENDITUREExpenditure on foreign titles undertaking PDV without shooting in Australia totalled $104 million in 2017/18, down 17% on 2016/17’s record high ($126 million), but 13% above the five-year average. A record 41 titles contributed to this strong result: 38 features, and three TV dramas. The spend of $3 million on TV drama was down 53% on 2016/17 and 23% below the five-year average.
Amongst the titles undertaking PDV-only work in 2017/18, Australian PDV companies had the opportunity to work on Animal World, Tomb Raider, Crazy Rich Asians, Ant-Man and the Wasp, Captain Marvel, Christopher Robin, Skyscraper, Halloween, X-Men: Dark Phoenix, Outlaw King, A-X-L, The Predator, Alita: Battle Angel and Monkey King 3. Work also continued or was completed on projects commencing in previous years such as The LEGO® Ninjago Movie, Bright, Black Panther, Jumanji: Welcome to the Jungle, The Commuter and The LEGO® Movie 2: The Second Part.
Apportioned expenditure on foreign PDV-only titles1 ($m)
1Expenditure has been apportioned across the year or years in which it was spent
40 87
0
20
40
60
80
100
120
140
0
6
11
17
23
29
34
40
2013/14 2014/15 2015/16 2016/17 2017/18
Spen
d ($
m)
5-yr
ave
rage
($)
Spend ($m) 5-yr average ($)
The Australian dollar remained at or below US$0.80 in 2017/18, which helped companies remain competitive and effectively leverage the 30% PDV Offset to attract work on foreign productions. The sector also continued to look for opportunities to strengthen or expand. Iloura merged with sister visual effects company Method, under the single brand of Method Studios, and Animal Logic launched Truant Pictures to produce genre films with Australian creatives in Australia, for international audiences. Following the introduction of a new uncapped 10% PDV rebate in South Australia (replacing a grant capped at $150,000 per production), Rising Sun Pictures declared its intention to increase staff by almost a third and add space and technical resources to its Adelaide studio, and French global entertainment giant Technicolor announced plans to launch Mill Film, a 500-person visual effects centre in Adelaide. In October 2018, the Queensland Governement also announced an uncapped 10% PDV rebate to attract high-end national and international post-production projects.
22
19
29
3941
The LEGO® Ninjago Movie
The Drama Report 2017/18 | Screen Australia 27
100
80
60
40
20
0
% of titles by region % of expenditure by region
US US/Other Asia Other
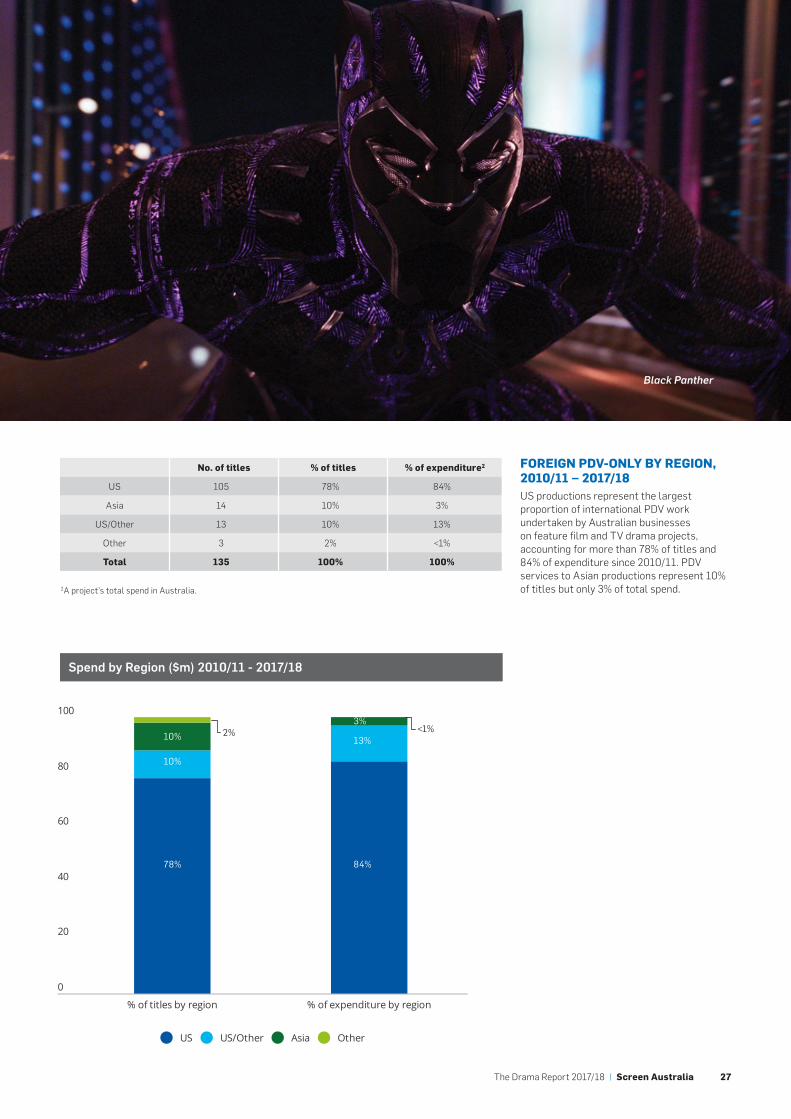
FOREIGN PDV-ONLY BY REGION, 2010/11 – 2017/18US productions represent the largest proportion of international PDV work undertaken by Australian businesses on feature film and TV drama projects, accounting for more than 78% of titles and 84% of expenditure since 2010/11. PDV services to Asian productions represent 10% of titles but only 3% of total spend.
Spend by Region ($m) 2010/11 - 2017/18
No. of titles % of titles % of expenditure2
US 105 78% 84%
Asia 14 10% 3%
US/Other 13 10% 13%
Other 3 2% <1%
Total 135 100% 100%
2A project’s total spend in Australia.
78%
10%
10%
84%
13%
3%<1%
Black Panther
2%
28
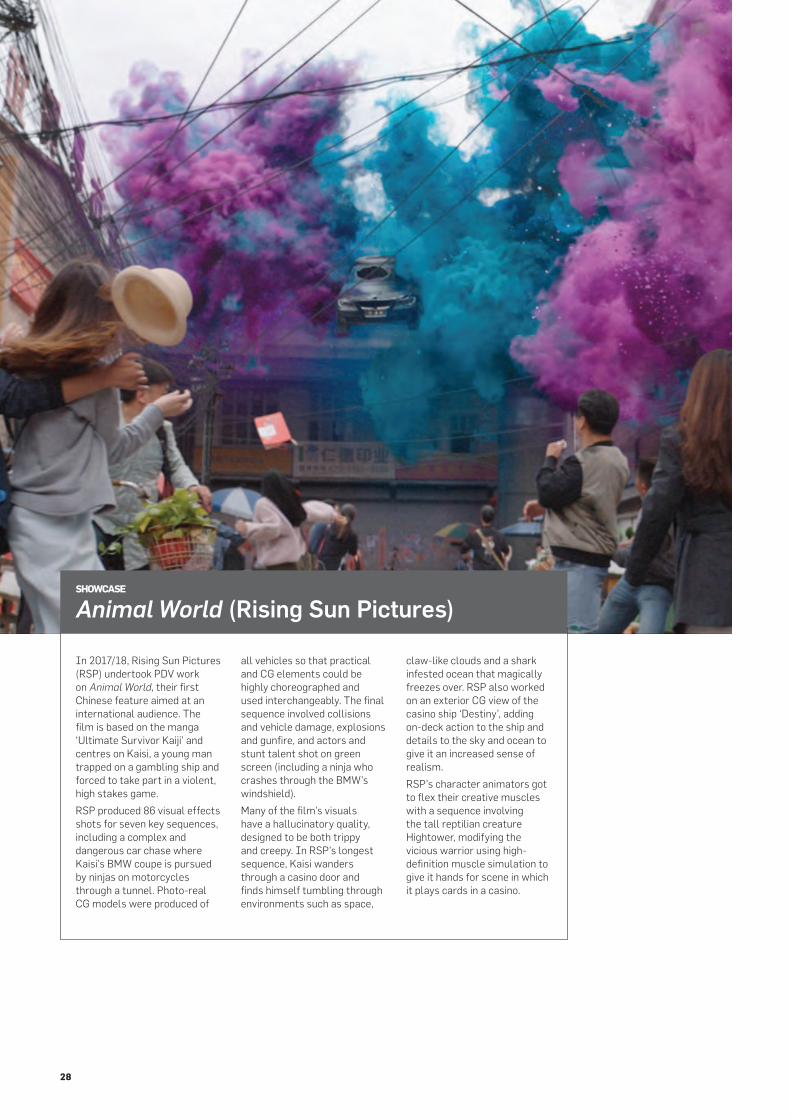
In 2017/18, Rising Sun Pictures (RSP) undertook PDV work on Animal World, their first Chinese feature aimed at an international audience. The film is based on the manga ‘Ultimate Survivor Kaiji’ and centres on Kaisi, a young man trapped on a gambling ship and forced to take part in a violent, high stakes game.
RSP produced 86 visual effects shots for seven key sequences, including a complex and dangerous car chase where Kaisi’s BMW coupe is pursued by ninjas on motorcycles through a tunnel. Photo-real CG models were produced of
all vehicles so that practical and CG elements could be highly choreographed and used interchangeably. The final sequence involved collisions and vehicle damage, explosions and gunfire, and actors and stunt talent shot on green screen (including a ninja who crashes through the BMW’s windshield).
Many of the film’s visuals have a hallucinatory quality, designed to be both trippy and creepy. In RSP’s longest sequence, Kaisi wanders through a casino door and finds himself tumbling through environments such as space,
claw-like clouds and a shark infested ocean that magically freezes over. RSP also worked on an exterior CG view of the casino ship ‘Destiny’, adding on-deck action to the ship and details to the sky and ocean to give it an increased sense of realism.
RSP’s character animators got to flex their creative muscles with a sequence involving the tall reptilian creature Hightower, modifying the vicious warrior using high-definition muscle simulation to give it hands for scene in which it plays cards in a casino.
SHOWCASE
Animal World (Rising Sun Pictures)
The Drama Report 2017/18 | Screen Australia 29
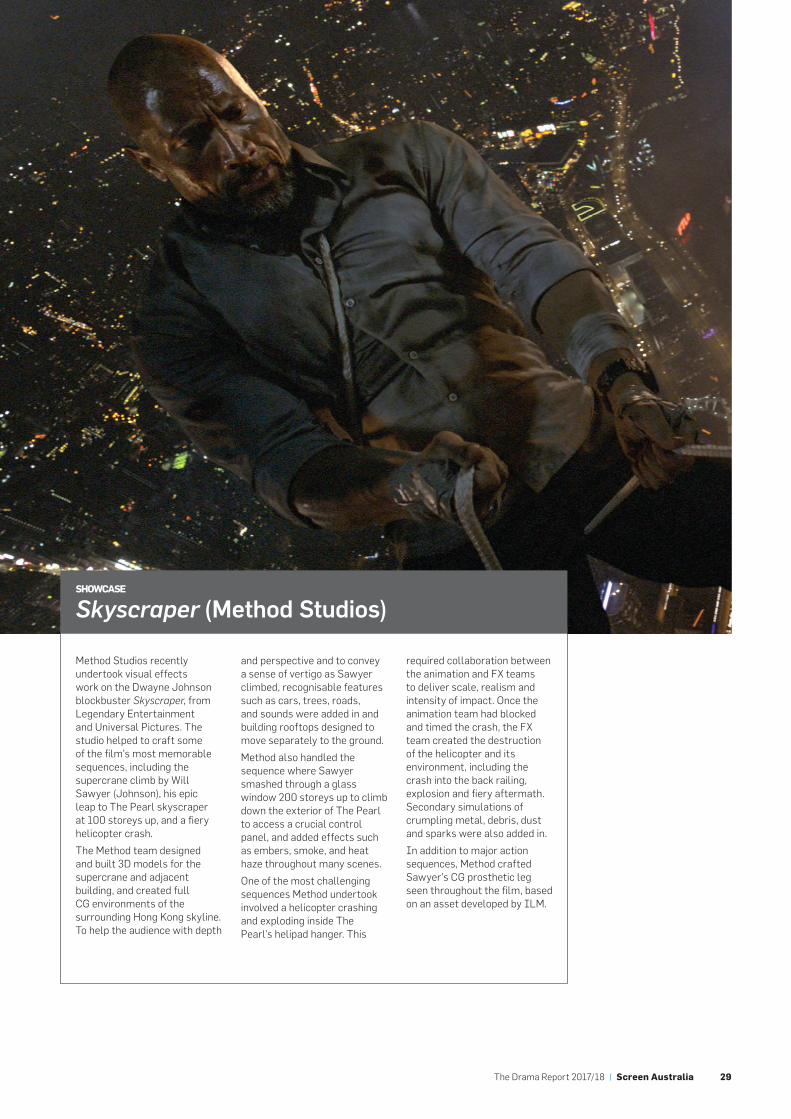
Method Studios recently undertook visual effects work on the Dwayne Johnson blockbuster Skyscraper, from Legendary Entertainment and Universal Pictures. The studio helped to craft some of the film’s most memorable sequences, including the supercrane climb by Will Sawyer (Johnson), his epic leap to The Pearl skyscraper at 100 storeys up, and a fiery helicopter crash.
The Method team designed and built 3D models for the supercrane and adjacent building, and created full CG environments of the surrounding Hong Kong skyline. To help the audience with depth
and perspective and to convey a sense of vertigo as Sawyer climbed, recognisable features such as cars, trees, roads, and sounds were added in and building rooftops designed to move separately to the ground.
Method also handled the sequence where Sawyer smashed through a glass window 200 storeys up to climb down the exterior of The Pearl to access a crucial control panel, and added effects such as embers, smoke, and heat haze throughout many scenes.
One of the most challenging sequences Method undertook involved a helicopter crashing and exploding inside The Pearl’s helipad hanger. This
required collaboration between the animation and FX teams to deliver scale, realism and intensity of impact. Once the animation team had blocked and timed the crash, the FX team created the destruction of the helicopter and its environment, including the crash into the back railing, explosion and fiery aftermath. Secondary simulations of crumpling metal, debris, dust and sparks were also added in.
In addition to major action sequences, Method crafted Sawyer’s CG prosthetic leg seen throughout the film, based on an asset developed by ILM.
SHOWCASE
Skyscraper (Method Studios)
30
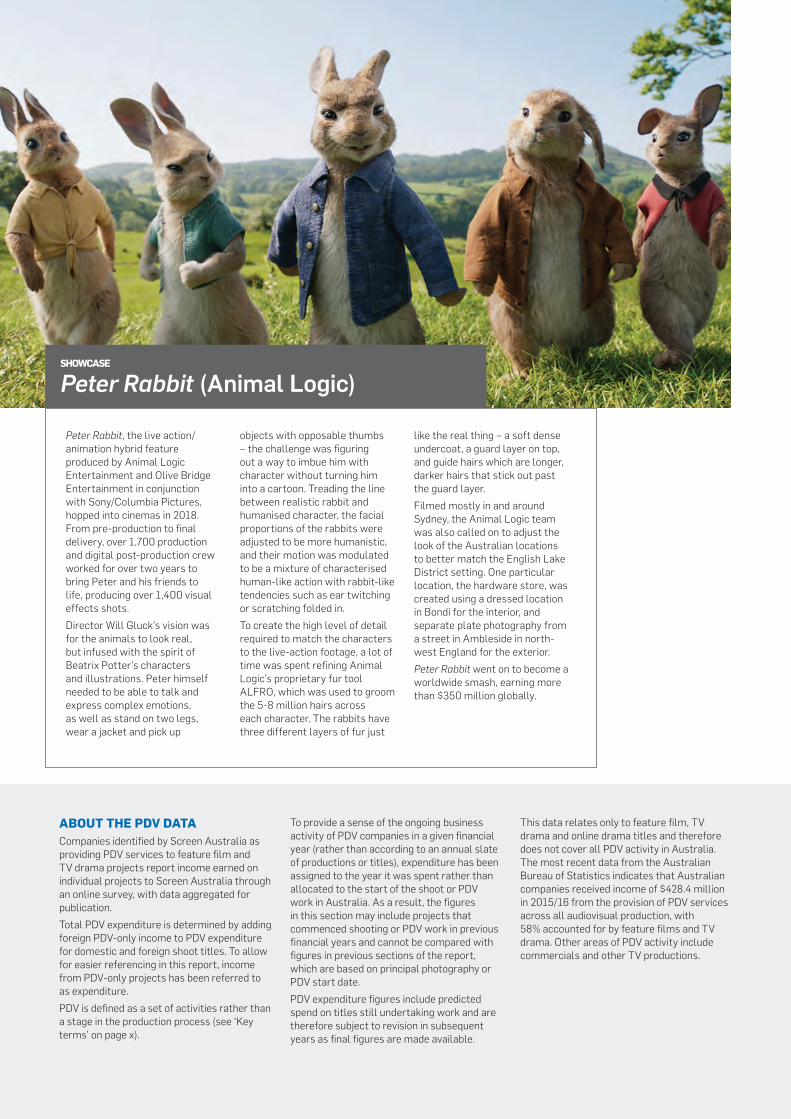
Peter Rabbit, the live action/animation hybrid feature produced by Animal Logic Entertainment and Olive Bridge Entertainment in conjunction with Sony/Columbia Pictures, hopped into cinemas in 2018. From pre-production to final delivery, over 1,700 production and digital post-production crew worked for over two years to bring Peter and his friends to life, producing over 1,400 visual effects shots.
Director Will Gluck’s vision was for the animals to look real, but infused with the spirit of Beatrix Potter’s characters and illustrations. Peter himself needed to be able to talk and express complex emotions, as well as stand on two legs, wear a jacket and pick up
objects with opposable thumbs – the challenge was figuring out a way to imbue him with character without turning him into a cartoon. Treading the line between realistic rabbit and humanised character, the facial proportions of the rabbits were adjusted to be more humanistic, and their motion was modulated to be a mixture of characterised human-like action with rabbit-like tendencies such as ear twitching or scratching folded in.
To create the high level of detail required to match the characters to the live-action footage, a lot of time was spent refining Animal Logic’s proprietary fur tool ALFRO, which was used to groom the 5-8 million hairs across each character. The rabbits have three different layers of fur just
like the real thing – a soft dense undercoat, a guard layer on top, and guide hairs which are longer, darker hairs that stick out past the guard layer.
Filmed mostly in and around Sydney, the Animal Logic team was also called on to adjust the look of the Australian locations to better match the English Lake District setting. One particular location, the hardware store, was created using a dressed location in Bondi for the interior, and separate plate photography from a street in Ambleside in north-west England for the exterior.
Peter Rabbit went on to become a worldwide smash, earning more than $350 million globally.
SHOWCASE
Peter Rabbit (Animal Logic)
ABOUT THE PDV DATACompanies identified by Screen Australia as providing PDV services to feature film and TV drama projects report income earned on individual projects to Screen Australia through an online survey, with data aggregated for publication.
Total PDV expenditure is determined by adding foreign PDV-only income to PDV expenditure for domestic and foreign shoot titles. To allow for easier referencing in this report, income from PDV-only projects has been referred to as expenditure.
PDV is defined as a set of activities rather than a stage in the production process (see ‘Key terms’ on page x).
To provide a sense of the ongoing business activity of PDV companies in a given financial year (rather than according to an annual slate of productions or titles), expenditure has been assigned to the year it was spent rather than allocated to the start of the shoot or PDV work in Australia. As a result, the figures in this section may include projects that commenced shooting or PDV work in previous financial years and cannot be compared with figures in previous sections of the report, which are based on principal photography or PDV start date.
PDV expenditure figures include predicted spend on titles still undertaking work and are therefore subject to revision in subsequent years as final figures are made available.
This data relates only to feature film, TV drama and online drama titles and therefore does not cover all PDV activity in Australia. The most recent data from the Australian Bureau of Statistics indicates that Australian companies received income of $428.4 million in 2015/16 from the provision of PDV services across all audiovisual production, with 58% accounted for by feature films and TV drama. Other areas of PDV activity include commercials and other TV productions.
The Drama Report 2017/18 | Screen Australia 31
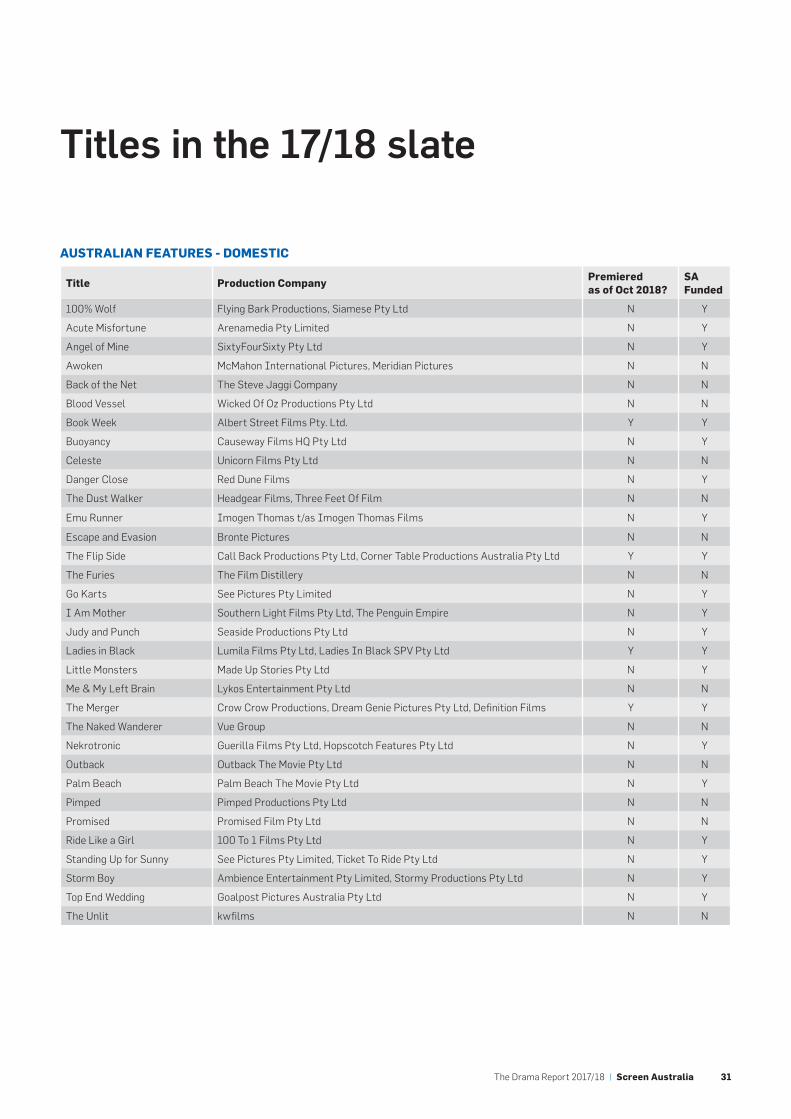
Titles in the 17/18 slate
AUSTRALIAN FEATURES - DOMESTIC
Title Production CompanyPremiered as of Oct 2018?
SA Funded
100% Wolf Flying Bark Productions, Siamese Pty Ltd N Y
Acute Misfortune Arenamedia Pty Limited N Y
Angel of Mine SixtyFourSixty Pty Ltd N Y
Awoken McMahon International Pictures, Meridian Pictures N N
Back of the Net The Steve Jaggi Company N N
Blood Vessel Wicked Of Oz Productions Pty Ltd N N
Book Week Albert Street Films Pty. Ltd. Y Y
Buoyancy Causeway Films HQ Pty Ltd N Y
Celeste Unicorn Films Pty Ltd N N
Danger Close Red Dune Films N Y
The Dust Walker Headgear Films, Three Feet Of Film N N
Emu Runner Imogen Thomas t/as Imogen Thomas Films N Y
Escape and Evasion Bronte Pictures N N
The Flip Side Call Back Productions Pty Ltd, Corner Table Productions Australia Pty Ltd Y Y
The Furies The Film Distillery N N
Go Karts See Pictures Pty Limited N Y
I Am Mother Southern Light Films Pty Ltd, The Penguin Empire N Y
Judy and Punch Seaside Productions Pty Ltd N Y
Ladies in Black Lumila Films Pty Ltd, Ladies In Black SPV Pty Ltd Y Y
Little Monsters Made Up Stories Pty Ltd N Y
Me & My Left Brain Lykos Entertainment Pty Ltd N N
The Merger Crow Crow Productions, Dream Genie Pictures Pty Ltd, Definition Films Y Y
The Naked Wanderer Vue Group N N
Nekrotronic Guerilla Films Pty Ltd, Hopscotch Features Pty Ltd N Y
Outback Outback The Movie Pty Ltd N N
Palm Beach Palm Beach The Movie Pty Ltd N Y
Pimped Pimped Productions Pty Ltd N N
Promised Promised Film Pty Ltd N N
Ride Like a Girl 100 To 1 Films Pty Ltd N Y
Standing Up for Sunny See Pictures Pty Limited, Ticket To Ride Pty Ltd N Y
Storm Boy Ambience Entertainment Pty Limited, Stormy Productions Pty Ltd N Y
Top End Wedding Goalpost Pictures Australia Pty Ltd N Y
The Unlit kwfilms N N
32
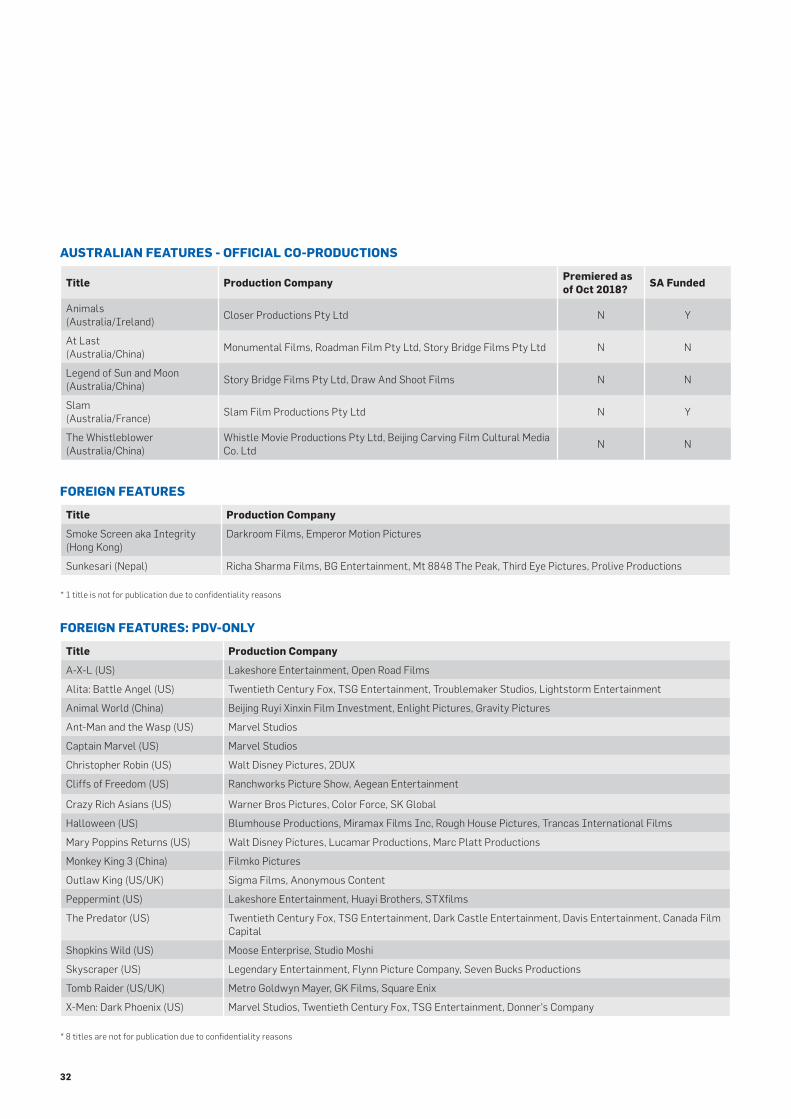
AUSTRALIAN FEATURES - OFFICIAL CO-PRODUCTIONS
Title Production CompanyPremiered as of Oct 2018?
SA Funded
Animals (Australia/Ireland)
Closer Productions Pty Ltd N Y
At Last (Australia/China)
Monumental Films, Roadman Film Pty Ltd, Story Bridge Films Pty Ltd N N
Legend of Sun and Moon (Australia/China)
Story Bridge Films Pty Ltd, Draw And Shoot Films N N
Slam (Australia/France)
Slam Film Productions Pty Ltd N Y
The Whistleblower (Australia/China)
Whistle Movie Productions Pty Ltd, Beijing Carving Film Cultural Media Co. Ltd
N N
FOREIGN FEATURES
Title Production Company
Smoke Screen aka Integrity (Hong Kong)
Darkroom Films, Emperor Motion Pictures
Sunkesari (Nepal) Richa Sharma Films, BG Entertainment, Mt 8848 The Peak, Third Eye Pictures, Prolive Productions
FOREIGN FEATURES: PDV-ONLY
Title Production Company
A-X-L (US) Lakeshore Entertainment, Open Road Films
Alita: Battle Angel (US) Twentieth Century Fox, TSG Entertainment, Troublemaker Studios, Lightstorm Entertainment
Animal World (China) Beijing Ruyi Xinxin Film Investment, Enlight Pictures, Gravity Pictures
Ant-Man and the Wasp (US) Marvel Studios
Captain Marvel (US) Marvel Studios
Christopher Robin (US) Walt Disney Pictures, 2DUX²
Cliffs of Freedom (US) Ranchworks Picture Show, Aegean Entertainment
Crazy Rich Asians (US) Warner Bros Pictures, Color Force, SK Global
Halloween (US) Blumhouse Productions, Miramax Films Inc, Rough House Pictures, Trancas International Films
Mary Poppins Returns (US) Walt Disney Pictures, Lucamar Productions, Marc Platt Productions
Monkey King 3 (China) Filmko Pictures
Outlaw King (US/UK) Sigma Films, Anonymous Content
Peppermint (US) Lakeshore Entertainment, Huayi Brothers, STXfilms
The Predator (US) Twentieth Century Fox, TSG Entertainment, Dark Castle Entertainment, Davis Entertainment, Canada Film Capital
Shopkins Wild (US) Moose Enterprise, Studio Moshi
Skyscraper (US) Legendary Entertainment, Flynn Picture Company, Seven Bucks Productions
Tomb Raider (US/UK) Metro Goldwyn Mayer, GK Films, Square Enix
X-Men: Dark Phoenix (US) Marvel Studios, Twentieth Century Fox, TSG Entertainment, Donner's Company
* 8 titles are not for publication due to confidentiality reasons
* 1 title is not for publication due to confidentiality reasons
The Drama Report 2017/18 | Screen Australia 33
AUSTRALIAN TV DRAMA - DOMESTIC - SERIES/SERIALS
Title Production CompanyFirst release broadcaster
Premiered as of Oct 2018?
SA Funded
Back in Very Small Business Gristmill Pty Ltd ABC Y Y
Black Comedy series 3 Scarlett Pictures Pty Limited ABC Y N
The Family Law series 3Matchbox Productions Pty Ltd, Family Law 3 Productions Pty Ltd
SBS N Y
The HeightsFor Pete's Sake Productions Pty Ltd, Matchbox Productions Pty Ltd, Matchbox WA Pty Ltd
ABC N N
Home and Away series 31 Seven Network Operations Limited Seven Y N
Mr Inbetween Jungle FTV Pty Ltd, Blue Tongue Films Foxtel Y Y
Neighbours series 35 FremantleMedia Australia Ten Y N
Orange is the New Brown Screentime Productions No. 1 Pty Ltd Seven N Y
Rosehaven series 3 Guesswork Television Pty Ltd ABC N N
Sando Jungle FTV Pty Ltd ABC Y Y
Squinters Jungle FTV Pty Ltd ABC Y Y
Street Smart Cordell Jigsaw Productions Pty Ltd Ten Y Y
Ten Pilot Week Various Ten Y N
True Story with Hamish and Andy series 2 Radio Karate ST Holdings Nine Y N
Top End Wedding
34
AUSTRALIAN TV DRAMA - DOMESTIC - MINI-SERIES
Title Production CompanyFirst release broadcaster
Premiered as of Oct 2018?
SA Funded
Australian Gangster Roadshow Productions Pty Ltd Seven N Y
Bite Club Playmaker Media Pty Ltd Nine Y Y
The Cry Synchronicity Films ABC, BBC N N
Dead Lucky Subtext Pictures Pty Ltd SBS Y Y
Doctor Doctor series 3 Easy Tiger Productions Pty Ltd Nine Y Y
Harrow Hoodlum Active Pty Ltd ABC Y N
Jack Irish series 2 Easy Tiger Productions Pty Ltd ABC Y N
Lambs of God Lingo Pictures Pty Ltd Foxtel N Y
Mystery Road TV Series Bunya Productions Pty Ltd ABC Y Y
On the Ropes Lingo Pictures Pty Ltd SBS N Y
Pine Gap Screentime Pty Ltd ABC Y N
A Place to Call Home series 6 Seven Studios Pty Limited Foxtel Y N
Playing for Keeps Screentime Pty Ltd Ten Y Y
Rake series 5 Easy Tiger Productions Pty Ltd ABC Y N
Secret City: Under the Eagle series 2Matchbox Productions Pty Ltd, Secret City 2 Productions Pty Ltd
Foxtel N N
Sisters Shine Productions 3 Pty Ltd Ten Y Y
Underbelly Files: Chopper Screentime Pty Ltd Nine Y Y
Wanted series 3Matchbox Productions Pty Ltd, Wanted 3 Productions Pty Ltd
Seven Y N
Wentworth series 7 FremantleMedia Australia Foxtel N N
AUSTRALIAN TV DRAMA - DOMESTIC - TELEMOVIE
Title Production CompanyFirst release broadcaster
Premiered as of Oct 2018?
SA Funded
The Blake Mysteries: Ghost Stories
December Media Pty Ltd Seven N Y
The Doctor Blake Mysteries: Family Portrait
December Media Pty Ltd ABC Y N
Riot Werner Film Productions ABC Y Y
The Drama Report 2017/18 | Screen Australia 35
CO-PRODUCTIONS - CHILDREN’S
Title Production CompanyFirst release broadcaster
Premiered as of Oct 2018?
SA Funded
The Deep series 3 (Australia/Canada)
A Stark Production Pty Ltd, DHX Media (Vancouver) Ltd. ABC N N
AUSTRALIAN ONLINE DRAMA SERIES
Title Production CompanyStreaming service
Premiered as of Oct 2018?
SA Funded
DeadlockEvery Cloud Productions Pty Ltd, Deadlock Series 1 Pty Ltd
ABC iview Y Y
Fresh Blood 2017 Pilot Season Various ABC N Y
Homecoming Queens Generator Pictures Pty Ltd SBS on Demand Y Y
The Housemate Chips and Gravy Films Pty Ltd ABC iview N Y
Life of Jess Life Of Jess Productions Pty Ltd YouTube Y Y
Lift Mad Kids Pty Ltd TBD N N
News Junkies Weave Films Pty Ltd TBD N Y
Patricia Moore Patricia Moore Pty Ltd Blackpills N Y
Queer for Short: Home Grown Various SBS on Demand Y N
Romp - the web series Opening Act Films Pty Ltd YouTube N Y
Romper Stomper Roadshow Rough Diamond Stan Y Y
Sheilas Giant Dwarf Sheilas Pty Ltd YouTube Y Y
Single Ladies Story Republic Pty Ltd TBD N Y
SuperwogPrincess Pictures Holdings Pty Ltd, Bobcat Entertainment Pty Ltd
YouTube, ABC iView
Y Y
Tidelands Hoodlum Entertainment and Hoodlum Active Pty Ltd Netflix N N
Untitled Chris Lilley project Amelia Entertainment Netflix N N
Wolf Creek series 2 Screentime Pty Ltd, Emu Creek Pictures Pty Ltd Stan Y N
AUSTRALIAN TV DRAMA - CHILDREN’S
Title Production CompanyFirst release broadcaster
Premiered as of Oct 2018?
SA Funded
Bluey Ludo Studio Pty Ltd ABC Y Y
The Bureau of Magical Things Jonathan M Shiff Productions Pty Ltd Ten Y Y
Girls Season Various ABC Y Y
Grace Beside Me series 1 Magpie Pictures Pty Ltd NITV Y Y
Larry the WonderpupChocolate Liberation Front, WTFN Entertainment Pty Ltd
Seven Y N
Nowhere Boys series 4Matchbox Productions Pty Ltd, Nowhere Boys 4 Productions Pty Ltd
ABC N Y
Space Chickens in Space Studio Moshi Productions Pty Ltd Nine Y N
Spongo, Fuzz & Jalapena Cheeky Little Media Pty Limited ABC N Y
The Strange Chores Media World Pictures Pty Ltd, Ludo Studio Pty Ltd ABC N Y
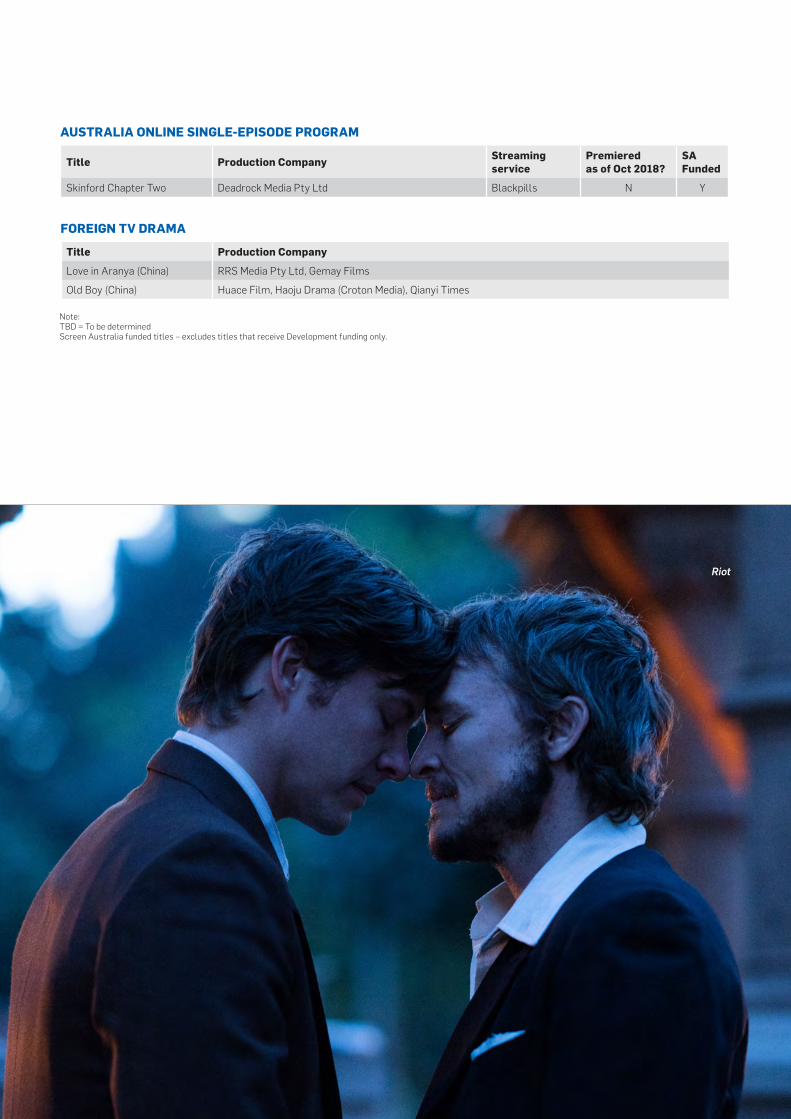
36
AUSTRALIA ONLINE SINGLE-EPISODE PROGRAM
Title Production CompanyStreaming service
Premiered as of Oct 2018?
SA Funded
Skinford Chapter Two Deadrock Media Pty Ltd Blackpills N Y
FOREIGN TV DRAMA
Title Production Company
Love in Aranya (China) RRS Media Pty Ltd, Gemay Films
Old Boy (China) Huace Film, Haoju Drama (Croton Media), Qianyi Times
Note: TBD = To be determined Screen Australia funded titles – excludes titles that receive Development funding only.
Riot
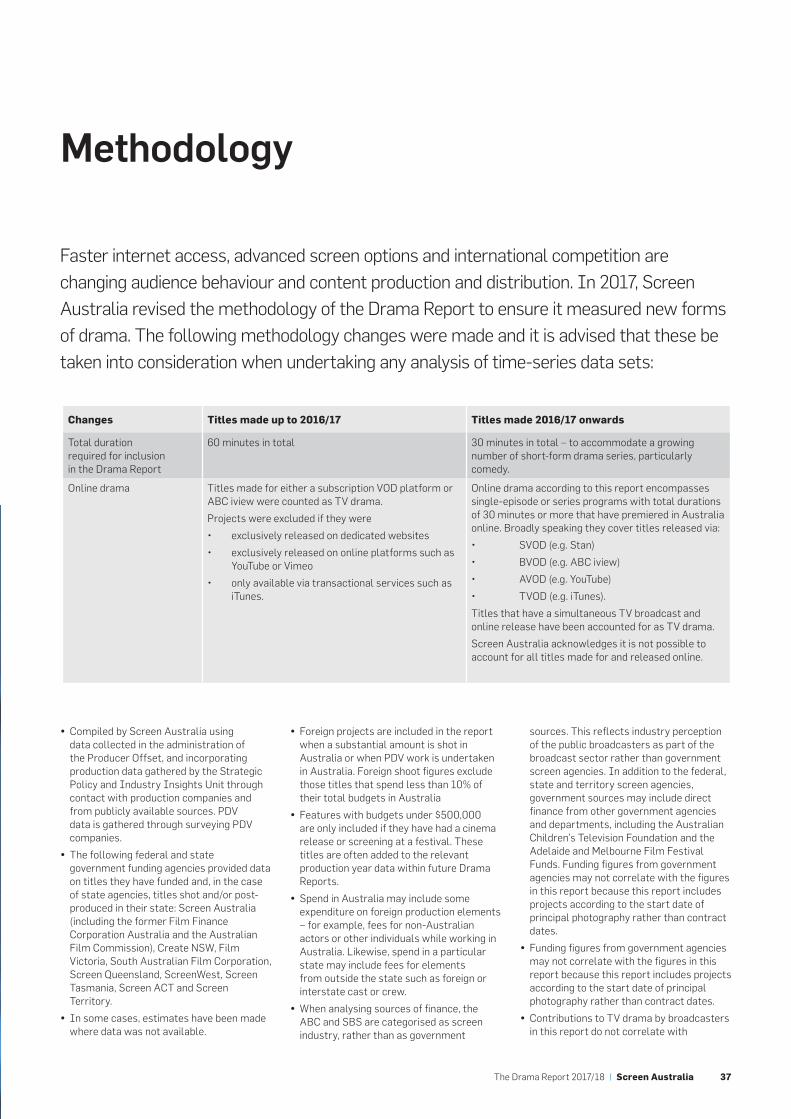
The Drama Report 2017/18 | Screen Australia 37
Changes Titles made up to 2016/17 Titles made 2016/17 onwards
Total duration required for inclusion in the Drama Report
60 minutes in total 30 minutes in total – to accommodate a growing number of short-form drama series, particularly comedy.
Online drama Titles made for either a subscription VOD platform or ABC iview were counted as TV drama.
Projects were excluded if they were
• exclusively released on dedicated websites
• exclusively released on online platforms such as YouTube or Vimeo
• only available via transactional services such as iTunes.
Online drama according to this report encompasses single-episode or series programs with total durations of 30 minutes or more that have premiered in Australia online. Broadly speaking they cover titles released via:
• SVOD (e.g. Stan)
• BVOD (e.g. ABC iview)
• AVOD (e.g. YouTube)
• TVOD (e.g. iTunes).
Titles that have a simultaneous TV broadcast and online release have been accounted for as TV drama.
Screen Australia acknowledges it is not possible to account for all titles made for and released online.
Methodology
Faster internet access, advanced screen options and international competition are changing audience behaviour and content production and distribution. In 2017, Screen Australia revised the methodology of the Drama Report to ensure it measured new forms of drama. The following methodology changes were made and it is advised that these be taken into consideration when undertaking any analysis of time-series data sets:
y Compiled by Screen Australia using data collected in the administration of the Producer Offset, and incorporating production data gathered by the Strategic Policy and Industry Insights Unit through contact with production companies and from publicly available sources. PDV data is gathered through surveying PDV companies.
y The following federal and state government funding agencies provided data on titles they have funded and, in the case of state agencies, titles shot and/or post-produced in their state: Screen Australia (including the former Film Finance Corporation Australia and the Australian Film Commission), Create NSW, Film Victoria, South Australian Film Corporation, Screen Queensland, ScreenWest, Screen Tasmania, Screen ACT and Screen Territory.
y In some cases, estimates have been made where data was not available.
y Foreign projects are included in the report when a substantial amount is shot in Australia or when PDV work is undertaken in Australia. Foreign shoot figures exclude those titles that spend less than 10% of their total budgets in Australia
y Features with budgets under $500,000 are only included if they have had a cinema release or screening at a festival. These titles are often added to the relevant production year data within future Drama Reports.
y Spend in Australia may include some expenditure on foreign production elements – for example, fees for non-Australian actors or other individuals while working in Australia. Likewise, spend in a particular state may include fees for elements from outside the state such as foreign or interstate cast or crew.
y When analysing sources of finance, the ABC and SBS are categorised as screen industry, rather than as government
sources. This reflects industry perception of the public broadcasters as part of the broadcast sector rather than government screen agencies. In addition to the federal, state and territory screen agencies, government sources may include direct finance from other government agencies and departments, including the Australian Children’s Television Foundation and the Adelaide and Melbourne Film Festival Funds. Funding figures from government agencies may not correlate with the figures in this report because this report includes projects according to the start date of principal photography rather than contract dates.
y Funding figures from government agencies may not correlate with the figures in this report because this report includes projects according to the start date of principal photography rather than contract dates.
y Contributions to TV drama by broadcasters in this report do not correlate with
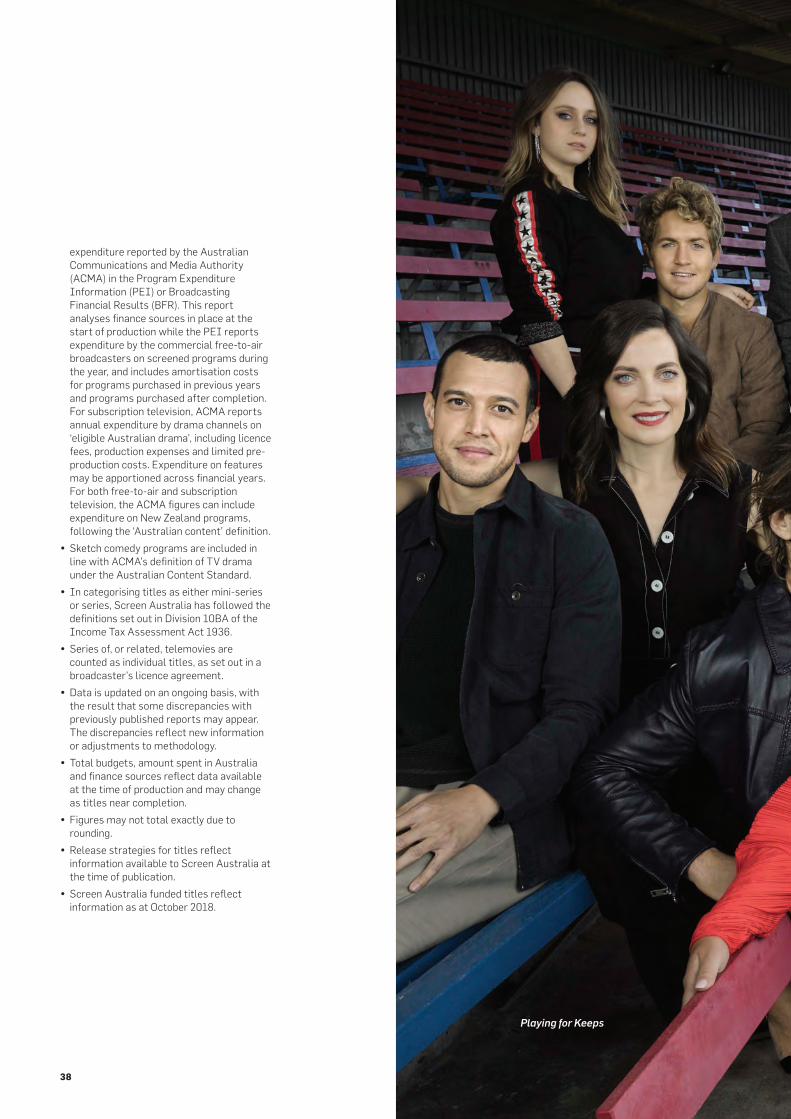
38
expenditure reported by the Australian Communications and Media Authority (ACMA) in the Program Expenditure Information (PEI) or Broadcasting Financial Results (BFR). This report analyses finance sources in place at the start of production while the PEI reports expenditure by the commercial free-to-air broadcasters on screened programs during the year, and includes amortisation costs for programs purchased in previous years and programs purchased after completion. For subscription television, ACMA reports annual expenditure by drama channels on ‘eligible Australian drama’, including licence fees, production expenses and limited pre-production costs. Expenditure on features may be apportioned across financial years. For both free-to-air and subscription television, the ACMA figures can include expenditure on New Zealand programs, following the ‘Australian content’ definition.
y Sketch comedy programs are included in line with ACMA’s definition of TV drama under the Australian Content Standard.
y In categorising titles as either mini-series or series, Screen Australia has followed the definitions set out in Division 10BA of the Income Tax Assessment Act 1936.
y Series of, or related, telemovies are counted as individual titles, as set out in a broadcaster’s licence agreement.
y Data is updated on an ongoing basis, with the result that some discrepancies with previously published reports may appear. The discrepancies reflect new information or adjustments to methodology.
y Total budgets, amount spent in Australia and finance sources reflect data available at the time of production and may change as titles near completion.
y Figures may not total exactly due to rounding.
y Release strategies for titles reflect information available to Screen Australia at the time of publication.
y Screen Australia funded titles reflect information as at October 2018.
Playing for Keeps
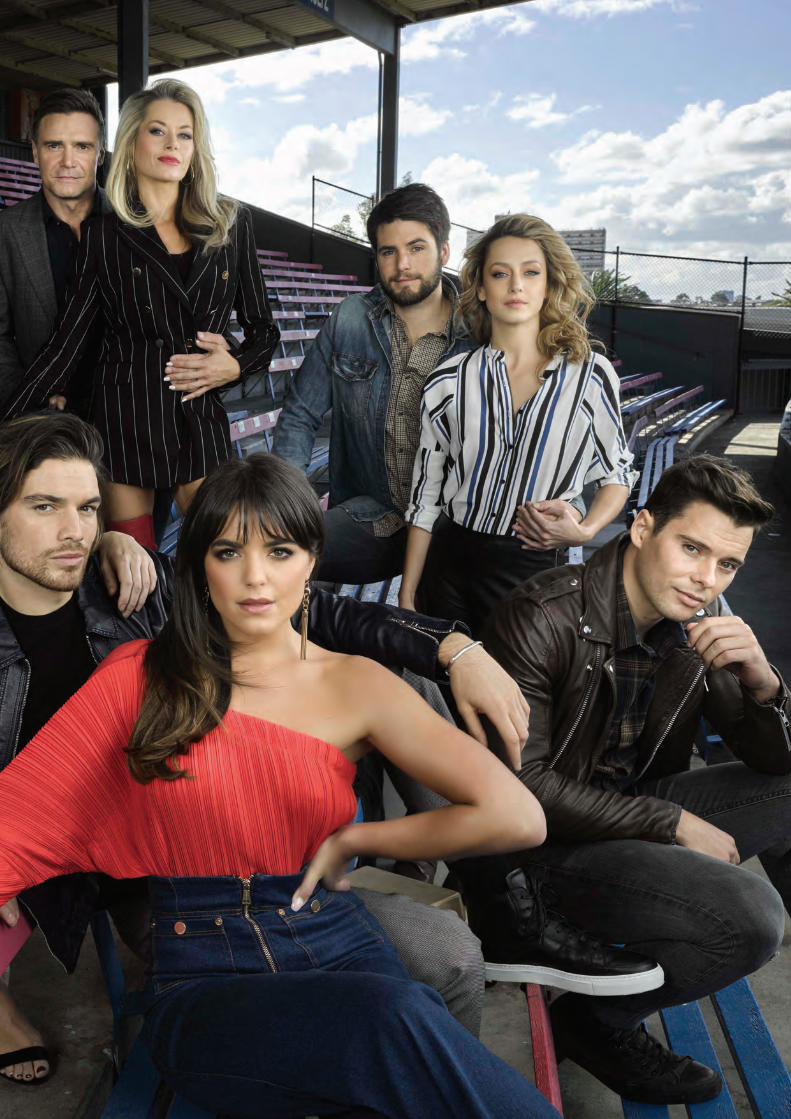
The Drama Report 2017/18 | Screen Australia 39

40