Embed Size (px)
Citation preview

International Journal of Engineering, ISSN/ISBN: 00207225,revised papper 28/03/2004,
SCRAP TIRE: A CIVIL ENGINEERING MATERIAL
D.M.S. Gerscovich and A.C.C.F. Sieira
State University of Rio de Janeiro, Rio de Janeiro, Brazil, [email protected], [email protected]
L.V. Medeiros
Gama Filho University, Catholic University of Rio de Janeiro
Rio de Janeiro, Brazil, [email protected]
A.S.F.J. Sayão
Catholic University of Rio de Janeiro, Rio de Janeiro, Brazil, [email protected]
Abstract Industrial societies produce scrap tires at increasing rates every year, generating
a large amount of a non-degradable urban solid waste. Stockpiles of scrap tires are exposed
to constant danger of fire, besides they may induce propagation of insects and diseases.
Environmentally acceptable management options to deal with scrap tires include:
Reduction, Recycle, Recover and Re-use. This paper describes a comprehensive research
project on tire waste utilization for Civil Engineering purposes. A prototype soil-tire
retaining wall, 4m high and 60m length was constructed and monitored. The use of scrap
tire mats as soil reinforcement has also been investigated by a series of field pullout tests,
with several arrangements of scrap tire mats, subjected to different confining levels. The
research indicates that the use of scrap tires can be an attractive low cost alternative in soil
stabilization projects.
Key Words scrap tires, retaining wall, field instrumentation, field pullout tests.
1. INTRODUCTION
Industrial societies produce scrap tires at
increasing rates every year. Presently, the
disposal of tires assumes impressive volumes,
with a world production over 800 millions of
scrap tires annually. It is estimated that
approximately 3 billion used tires are
deposited in reclaimed areas. Tires are non-
degradable and, due to their shape, quantity
and compaction resistance, vast landfill areas
are required. As a result, expensive waste

International Journal of Engineering, ISSN/ISBN: 00207225,revised papper 28/03/2004,
management costs are incurred, particularly in
metropolitan areas where the availability of
large landfill sites is limited. Stockpiles of
scrap tires are exposed to constant danger of
fire and also induce propagation of insects and
diseases, particularly important in tropical
environments with poor sanitary conditions.
The accumulation of moisture in scrap tires in
combination with heat and dark environment
provides an excellent environment for
breeding of vermin.
Tires are composed of two sidewalls and a
tread. They consist of a rubber or polymer
cover strongly reinforced with fibber or
metals, with a very high tensile strength. Their
mechanical properties remain available even
after its ordinary life has expired.
The environmentally acceptable management
options include the following:
Reduction as a consequence of a
technological developments that increases
of service life,
Recycle by cutting to make new products
such as floor mats, roadbeds and tracking
fields, etc. or by grinding to make asphalt
mixtures, rubber plastic compounds, etc.
Recover the raw material to manufacture
new products such as tire-derived fuel, etc.
Re-use by retreading or as a civil
engineering material.
Considering the frequent use of steel meshes
embedded in the tire, a significant portion of
the above applications cannot utilize such
tires, therefore reducing the reutilization of an
expressive number of scrap tires. Processing
used tires requires a significant amount of
financial investment as well as a strict control
on air emission. The percentage of tire
reutilization varies according to the industrial
setting of each region, and is limited to the
range of 15% to 45% of used tires.
The re-use of the whole tire as a Civil
Engineering material therefore appears to be
an attractive alternative to reduce the potential
hazard on the environment.
It has been also observed that tires embedded
in earthfills do not apparently affect the
environment. Water samples collected from a
drainage system installed below a tire-
reinforced earthfill showed no significant
adverse effect on water quality over a period
of 2 years.[1].
International Journal of Engineering, ISSN/ISBN: 00207225,revised papper 28/03/2004,
One of the first applications of the use of tires
in Civil Engineering practice dates from the
decade of 70, with the reconstruction of a
highway embankment, reinforced with tires, in
the north of California [2]. The embankment
was constructed with horizontal layers of tires,
vertically spaced of 0,60m and interlinked
with metal loops.
The primary researches related to the use of
the technique of soil-tires (denominated
"PNEUSOL") were developed in France. A
5m height and 10m long experimental wall
was constructed in Langres [3]. The results of
this experiment demonstrated the feasibility of
execution of soil-tires retaining structures.
After these experiences, other retaining walls
were built. Long [4] reported a wall in Ferrupt,
with 54m of extension and 5m of height, and
the one in Bussang, constituted of 6 different
sections summing a total of 650m of length
and up to 7m of height. All available data in
the literature referred to the details of the use
of the technique, with little information
regarding the deformability of the soil-tires
material.
In the 90´s, a comprehensive research project
on tire waste utilization has been carried out
simultaneously in Rio de Janeiro, Brazil [5],
and Ottawa, Canada [1, 6, 7, 8, 9]. The project
involved the construction of two prototypes
earth retaining walls and the execution of field
pullout tests, to evaluate the use of tires as soil
reinforcement.
Engineering properties of soil tire mixtures
have also been investigated in the 90’s.
Laboratory and prototype tests have been
performed aiming at studying the suitability of
the mixture as: (i) cover material for sanitary
landfills; (ii) lightweight fill material; (iii)
hydraulic barriers to groundwater flow [10, 11,
12].
This paper reports the main results of the
research project, developed in Rio de Janeiro,
Brazil, which intends to promote the use of
scrap tires in gravity and reinforced retaining
walls.
2. SCRAP TIRE RESEARCH PROJECT
2.1 Gravity Retaining Wall Gravity retaining
walls are made to resist earth lateral thrust, and

International Journal of Engineering, ISSN/ISBN: 00207225,revised papper 28/03/2004,
their stability against overturning and sliding
relies on the weight of the structure.
To investigate the geotechnical behavior of a
soil-tire gravity walls; a fully instrumented
retaining wall, 60m length and 4m height was
built (Figure 1). The tires where horizontally
placed side by side, in successive layers, tied
together to make a mat, and filled in with
compacted soil. An additional 2 m surcharge
load of soil was placed after the completion of
the wall.
To provide a uniform arrangement only car
passenger tires (0.60m of external diameter,
0.30m of internal diameter and 0.20m of
thickness) were utilized.
Tires with one sidewall removed (Figure 2)
were also used aiming at achieving a better
condition for internal compaction. Figure 3
shows the cutting tire machine, which was
used to remove the tire sidewall.
The reinforced wall was comprised of four
different sections, as shown in Figure 4, with
the following characteristics:
Section A: full tires, tied together with a
6mm thick polypropylene rope;
Section B: tires with top sidewall removed,
with the same cross section, rope connection
as in section A.
Section C: tires with top sidewall removed,
with the same cross section in section A, but
tied with a 2mm diameter plastic coated
galvanized zinc wire;
30
25
15
erosion
20
30
15
Section A section C
15.0 m 15.0 m 15.0 m 15.0 m
Access ramp
Crest of the slope Inclinometers (SI)
Pressure Cells (CP)
Soil Tire Wall
section B section D
SI-1
SI-2
SI-3
SI-4
SI-5
SI-6
SI-7
SI-8
CPCP CP
Figure 1. Site Plan and Instrumentation Location

International Journal of Engineering, ISSN/ISBN: 00207225,revised papper 28/03/2004,
Figure 2. Full and cut tires.
Figure 3. Machine for cutting tires.
Section D: tires with top sidewall removed,
tied together with a 6mm thick polypropylene
rope, with a narrower cross section.
The field instrumentation comprised
inclinometers and pneumatic earth pressure
cells (Figure 4).
The retaining structure was built in the
following sequence:
i) The base surface was cleaned and
leveled.
ii) The tires were tied to adjacent four
tires by a single turn of rope or wire. The
front row of tires was tied together by two
turns of the rope or one turn of the wire
1 2,4 m
3,0 m
3,6 m
4,0 m
2,0 m
Backfill
8
Inclinometers
Soil surcharge
Pressure cell
(a) Sections A, B and C
Soil surchage
Backfill
2,0 m
1,8 m
4,0 m
Inclinometers
Pressure cell
(b) Section D
Figure 4. Cross sections and field instrumentation
iii) There was no connection between
tires of different layers of tire meshes.
iv) Soil compaction was done using
manual labor and light machinery.
v) Successive tire layers were placed
with the center of the tires laterally
displaced (30cm) in relation to the layer
below to promote the interlocking of the
layers.
International Journal of Engineering, ISSN/ISBN: 00207225,revised papper 28/03/2004,
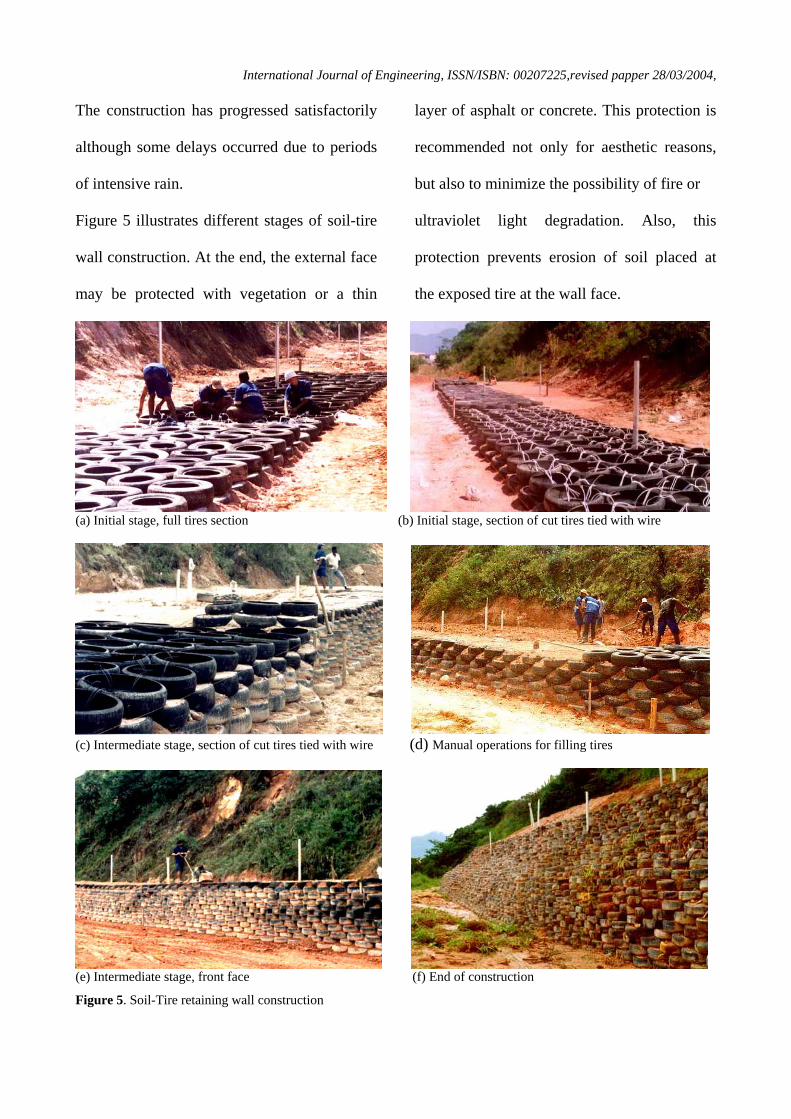
The construction has progressed satisfactorily
although some delays occurred due to periods
of intensive rain.
Figure 5 illustrates different stages of soil-tire
wall construction. At the end, the external face
may be protected with vegetation or a thin
layer of asphalt or concrete. This protection is
recommended not only for aesthetic reasons,
but also to minimize the possibility of fire or
ultraviolet light degradation. Also, this
protection prevents erosion of soil placed at
the exposed tire at the wall face.
(a) Initial stage, full tires section (b) Initial stage, section of cut tires tied with wire
(c) Intermediate stage, section of cut tires tied with wire (d) Manual operations for filling tires
(e) Intermediate stage, front face (f) End of construction
Figure 5. Soil-Tire retaining wall construction

International Journal of Engineering, ISSN/ISBN: 00207225,revised papper 28/03/2004,
Details of the construction and monitoring of
the wall have been presented elsewhere [13,
14, 15].
2.1.1 Materials The construction of the soil-
tire wall consumed approximately 15,000 tires
and made use of light compaction equipment
and soil locally available. Soils with poor
geotechnical characteristics may be used in a
gravity structure, because its role is primarily
to provide weight.
The soil at the experimental site is a well
graded clayey silty-sand (Unified Soil
Classification: SC), weathered from a gneissic
rock mass. Table 1 shows the geotechnical
characterization and Figure 6 shows the grain
size distribution of local soil.
Table 1. Geotechnical characterization of local soil
Natural soil Liquid limit (% ) 46.0 Plastic limit (%) 31.0
Water content (%) 20.0 Specific gravity of solids 2.72
Compacted soil Unit weight (kN/m³) 17.5
Void ratio 0.83
Drained triaxial tests in saturated samples have
indicate, for confining pressures ranging from
50kPa to 150kPa, no cohesion and a friction
angle of 29o. Direct shear tests in unsaturated
condition showed a greater cohesion equal to
13kPa [5].
Pe
rce
nta
ge
pa
ssin
g
Particle diameter (mm)
Figure 6. Grain size distribution of local soil
The stability of the wall is a function of its
specific weight. In this case it depends on the
type of tire to be used. A series of density tests
was performed in concrete lined pit, shown in
Figure 7. This pit accommodates three layers
of nine tires. The construction procedure used
in the field was reproduced inside the pit with
full tires and cut tires. The computed specific
weights were 16.2kN/m3 and 15.4kN/m3,
respectively for cut and full tires. It was
therefore observed a reduction of 6.2% on the
specific weight of the retaining wall built with
cut tires when compared to the specific weight
of the backfill. For a wall built with full tires
the reduction observed was 11.4%.

International Journal of Engineering, ISSN/ISBN: 00207225,revised papper 28/03/2004,
Figure 7. Field Density Tests
2.1.2. Field Results Figure 8 present profiles
of horizontal displacements measured at the
end construction and after the placement of
soil surcharge. The maximum horizontal
displacement occurred within the middle third
of the wall height and ranged from 0.7%
(Section A) to 0.5% (Section C) of the wall
height (H).
Horizontal displacement measurements in
section D have indicated that installation
problems might have occurred. Therefore,
their results were disregarded.
The soil-tire experimental retaining wall
showed a higher flexibility than conventional
gravity walls, which exhibits displacements
around 0.2%H to 0.4%H. However, the
observed movements for the present tire
reinforced wall were kept within reasonable
limits. A closer tightening of tire connections,
with the use of plastic coated wire, resulted in
about 30% reduction of the maximum
horizontal displacement, when compared to
tire connections with rope.
0 20 40 60
0
2
4
6
8
10
12
14
160 20 40
0
2
4
6
8
10
12
14
160 20 40
0
2
4
6
8
10
12
14
16
End of Wall Construction End of Surcharge Application
(a) Section A (b) Section B (c) Section C
Figure 8. Horizontal displacements vs. depth
Depth (m) Depth (m) Depth (m)
Horizontal displacement (mm) Horizontal displacement (mm) Horizontal displacement (mm)

International Journal of Engineering, ISSN/ISBN: 00207225,revised papper 28/03/2004,
It is worthwhile to note that the application of
the surcharge in section A, produced
additional lateral displacement concentrated
near the zone of the maximum horizontal
displacement, indicating some bulging around
the middle of the height. This feature suggests
the existence of a relative movement between
the tires in the middle, and the tires near the
top and the bottom of the wall. This behavior
is significantly different from the common
rotation around the base, which is observed on
conventional gravity walls.
The application of the surcharge in section C,
produced a rigid block movement from the top
of the wall to approximately 75% of its height,
and practically no additional movement was
monitored below this level.
Three levels of pressure cells, located 0.6m,
1.5m and 2.5m from the base of the wall, were
installed behind the wall at sections B, C and
D. The earth pressure was not monitored
behind Section A. The top earth pressure at
section D malfunctioned since the early stages
of the construction, therefore their readings
were disregarded.
Figure 9 presents earth pressure readings in
Section B, at the end of construction and at the
end of surcharge application. These results,
which have a similar pattern to the ones in
sections C, are compared to Rankine’s active
and at rest earth pressure distributions. The
theoretical curves were computed based on
strength parameters obtained from laboratory
tests [5]. The earth pressure coefficient at rest
was inferred from Jaky’s equation [16]. Due to
the horizontal displacements, the measured
horizontal stresses at end of construction are
lower than at rest horizontal stresses, and show
a reasonable agreement with Rankine’s theory.
However, at the base of the wall, an increase
of horizontal stresses may be noted. This, in
connection with the lateral displacement
measurements, indicates that the flexibility of
the wall promotes an expressive load transfer
from the middle part to the edges of the
backfill.
After application of surcharge, stresses were
below Rankine’s active earth theory, for the
first three meters of the wall. This was due to a
significant mobilization of the soil’s shear
strength.

International Journal of Engineering, ISSN/ISBN: 00207225,revised papper 28/03/2004,
0
1
2
3
4
0 10 20 30 40
Horizontal Stress (kPa)
Height (m)
Pressure Cell
Rankine's Theory
Horizontal Stress at Rest
(a) End of Construction of the Wall
0
1
2
3
4
0 20 40 60
Horizontal Stress (kPa)
Height (m)
Pressure Cell
Rankine's Theory
Horizontal Stress at Rest
(b) End of Surcharge Application
Figure 9. Horizontal Stresses vs. Depth
Table 2 shows a comparison between
Rankine’s active and at rest earth loads, and
measured earth thrusts. The ratio between the
earth thrust measured and Rankine’s or at rest
earth loads are indicated between brackets. It
is observed that the use of a tighter connection
between tires does not affect earth load against
the wall until the end of construction. With the
progress of the load application, due to the
placement of the surcharge, the stiffness of the
wall plays a more important role. The further
load application engages the connection
between tires, in the load carrying capacity,
more effectively.
Table 2. Comparison of Earth Thrusts
After Construction of the Wall
Section B Emeasured 49.kN/m
Ea 34 kN/m (143%) Eo 49 kN/m (100%)
Section C
Emeasured 45 kN/m Ea 31 kN/m (145%) Eo 44 kN/m (100%)
Section D
Emeasured 46 kN/m Ea 35 kN/m (131%) Eo 50 kN/m (92%)
After Surchage Aplication
Section B Emeasured 64 kN/m
Ea 101 kN/m (63%) Eo 144 kN/m (44%)
Section C
Emeasured 67.0 kN/m Ea 92.2 kN/m (73%) Eo 131.7 kN/m (51%)
Section D
Emeasured 42.4 kN/m Ea 84.0 kN/m (50%) Eo 120.0 kN/m (35%)
Notes: Ea = Rankine’s Active Trust; Eo= at Rest Trust ; ( ) ratio between Emeasured and Eo or Ea
The total earth load for section C, after the
surcharge application, was 73% of the
assumed Rankine’s earth thrust, while in
section B it was only 63%. If these results are
compared with the measured horizontal
displacements, they reinforce the idea that
high stress levels produced, in section C, can

International Journal of Engineering, ISSN/ISBN: 00207225,revised papper 28/03/2004,
be attributed to a wall displacement pattern
closer a rigid block movement.
Section D, which leaded to stress levels closer
to failure, particularly after the surcharge
application, produced significant reduction on
the earth pressure over the wall.
2.2 Reinforced Retaining Wall Soil
reinforcement technique is based on the
insertion of elements into the ground, capable
of resisting tensile loads. The shear stress
developed at the soil-reinforcement interface
reduces the horizontal thrust on retaining
structures, improving its stability conditions.
Not only the shearing resistance of the soil-
reinforcement interface contributes for
increasing the stability of the retaining
structures, but also the passive resistance
mobilized by the soil in front of the reinforcing
element. These two mechanisms produce
together a resistance at the interface soil
reinforcement, which is a fraction of the shear
strength of the soil.
The experimental program herein described
consisted of a series of full-scale pullout tests,
in which horizontal loads were applied to a tire
mesh, embedded in a sandy backfill material.
Figure 10 illustrates the field test setup.
Considering the magnitude of the required
loads, a permanent steel structure, with a pull
out capacity to 500kN, was specially designed
and constructed. This structure (Figure 11) has
a horizontal steel frame, with a concrete base,
anchored in residual soil, by two 15m inclined
anchors.
The pullout load was activated by a hydraulic
pump (Figure 11), which transmitted pressure
to a hydraulic piston, which was positioned at
the threaded rod. The horizontal load was
transferred to each individual front tire by a
chain linked to this rod. A 500kN load cell was
used for monitoring applied loads.
The load system ensured no displacement
restraints to each individual tire placed at the
front row.
To permit displacements greater than the
maximum piston travel (180mm), the system
had a device which allowed the maintenance
of the constant load while the pistons were
retreated and relocated prior to further load
application. This procedure allowed

International Journal of Engineering, ISSN/ISBN: 00207225,revised papper 28/03/2004,
Tires Soil surcharge
Concrete base Anchor
Load cell
Threaded rod
Wire cable
Rear displacement
gage (a) Cross section
Frontal displacement
gage
Load chain
(b) Plan view
Tires
Soil base
Figure 10. Field Pull-out Tests Scheme
Figure 11. Reaction Structure and Hydraulic Piston
performing tests up to the mobilization of the
maximum pull-out resistance of the tire mat.
The horizontal pullout displacements were
observed, with 0.5 mm accuracy, at different
locations: (a) on the threaded rod,
corresponding to the displacement of the first
row of tires (frontal displacement); (b) on
internal positions of the embedded tires
(internal displacement). The internal
displacements were monitored by horizontal
nylon cables tied to the tires that extended
outward the soil surcharge.
The pull-out loads were manually applied at a
rate of 2mm/min and the load readings were
registered each 10mm of displacement, until
failure was reached.
Field test setup and monitoring details have
been presented elsewhere [17, 18].

International Journal of Engineering, ISSN/ISBN: 00207225,revised papper 28/03/2004,
2.2.1 Testing programs Table 3 summarizes
the testing program. In arrangements with
more than one tire, two turns of a 6mm thick
polypropylene rope were used between
adjacent tires.
Table 3. Pullout testing program
Arrangement Description
1 Tire
2 Tires
4 Tires
2X3 Tires
4X3 Tires
4X3X4 Tires
4X3X4X3 Tires
4X5X4X5 Tires
The influence of tire geometry was evaluated
by performing tests with full and cut tires.
The soil surcharge ranged from 8 to 42 kPa,
corresponding to 0.5m to 2.5m of soil height.
In front of the first row of tires was the soil
was kept in loose state, for reducing the soil’s
passive resistance.
To ensure horizontal leveling, the tire mats
were placed over a 0.5m height soil base.
The sandy embankment was manually
compacted. Internally, the 0.6m diameter tires
were also filled up with compacted soil. In
some cases, the soil was mechanically
compacted with the use of a bulldozer shovel.
The voids between adjacent tires were also
carefully filled with soil.
The significance of the tire filling material was
also assessed by having the tires partly filled
with a stiff material. This stiff material was
either a soil-cement mixture (10% in weight)
or an unreinforced concrete slab placed inside
of the tire, at its midheight. The thickness of
this slab was smaller than the tire height,
ensuring that shear mobilization took place
along the soil-soil contact.
Figure 12 presents a view of the soil
embankment during a pull-out test.

International Journal of Engineering, ISSN/ISBN: 00207225,revised papper 28/03/2004,
Figure 12. : Pull-out Test View
2.2.2 Materials
Two materials were used for the construction
of the embankments: local soil [17] and a
commercially available sandy soil [18].
The geotechnical parameters of local soil are
described in Table 1 and these tests will
hereafter be designated as Phase 1.
The sandy soil used in the Phase 2 testing
program was a well-graded coarse sand (SW),
with strength parameters c' = 4,3kPa and ' =
31.7º. Figure 13 shows the grain size
distribution and Table 4 summarizes
geotechnical characterization of sand.
Peneira No
(USCS)
40302016128"6"5"4"3"2"
1" 3/4 1/2 3/8 1/4 4 6 8 10 16 20 30 40 50 60 100 200
0
10
20
30
40
50
60
70
80
90
100
0.0001 0.001 0.01 0.1 1 10 100 100Diâmetro dos Grãos (mm)
Per
cent
age
pass
ing
(%)
Particle diameter (mm)
Figure 13. Grain size distribution of sand - Phase 2
Table 4. Geotechnical characterization of compacted sand (Phase 2)
Water content (% ) 8.3
Specific gravity of solids 2.67 Unit weight (kN/m³) 16.8
Void ratio 0.71 Maximum void ratio 0.80 Minimum void ratio 0.57 Relative density (%) 42
2.2.3. Field Results At the beginning of the
tests, the displacements were observed to be
primarily due to deformations of the first row
of tires. As the test proceeded, deformations of
subsequent rows were successively initiated.
The initially circular tires were noted to reach
an elliptic shape, at the final stages of the tests.
As a consequence, non-uniform stresses and
strains were generated at the shear interface.
Figure 14 shows a view of a 4X3X4
arrangement of tires at the end of a pullout
test.

International Journal of Engineering, ISSN/ISBN: 00207225,revised papper 28/03/2004,
Figure 14. 4X3X4 arrangement at the end of test
The load-displacement curves resulting from
pullout tests did not exhibit a marked peak, but
the pullout load at failure could be reasonably
defined. Figure 15 shows typical results of
Phase 2 testing program. Similar results have
been observed in Phase 1.
0
10
20
30
40
50
60
70
0 20 40 60 80 100
Frontal Displacement (cm)
Load
(kN
)
4 Tires 4X3 Tires 4X3X4 Tires 4X3X4X3 Tires
Figure 15. Load vs Displacement - 1m Soil Surcharge (Phase 2)
Table 5 shows a summary of the pullout test
results for the different tire arrangements. It is
observed that increasing the number of tires
caused proportionally larger pullout loads.
Table 5. Pullout test results
Arrangement H * (m)
Pf **
(kN)
Pf / # Tires
(kN)
f ***
(m)
Phase 1 1
(cut tire) 1.0 5.4 5.4 0.13
1 (full tire) 1.0 6.7 6.7 0.20
2(cut tire) 1.0 7.1 3.6 0.15
4(full tire) 1.0 16.3 4.1 0.15
2 X 3(cut tire) 1.0 21.0 4.2 0.32
4 X 3(cut tire) 1.0 22.0 3.2 0.20
4 X 3 X 4 (cut tire) 1.0 35.0 3.2 0.34
4 X 3 X 4 X 3(cut tire) 1.0 62.0 4.4 0.61
4 X 5 X 4 X 5(cut tire) 1.0 65.0 3.6 0.45
Phase 2
1 (cut tire)
0.51.5 2.5
17.2 36.5 58.8
17.2 36.5 58.8
0.110.20 0.15
1 (full tire)
1.0 2.5
22.6 54.3
22.6 54.3
0.12 0.20
4 (cut tire)
0.51.5 2.5
34.8 68.5 123.2
8.7 17.1 30.8
0.180.18 0.24
4(full tire)
1.02.5
24,5 108.94
6.1 27.2
0.240.30
4 X 3 (cut tire)
0.51.5 2.5
37.4 88.2 127.6
8.7 17.1 30.8
0.200.33 0.40
4 X 3(full tire)
1.02.5
50.0 128.7
7.1 18.4
0.340.40
4 X 3 X 4 (cut tire)
0.5 1.5
55.1 98.1
5.0 8.9
0.36 0.47
soil-cement 1.5 103.3 9.4 0.434 X 3 X 4(full tire)
1.02.5
60.0 142.2
5.5 12.5
0.560.54
4 X 3 X 4 X 3(cut tire)
0.51.5
78.5 104.2
5.6 7.4
0.400.54
concrete slab 1.5 98.5 7.0 0.344 X 3 X 4 X 3
(full tire) 1.0 78.5 5.6 0.75
* H = surcharge height **Pf = pullout force at failure *** f = frontal displacement at failure
No significant differences have been observed
in pullout displacement curves for full and cut
tires.

International Journal of Engineering, ISSN/ISBN: 00207225,revised papper 28/03/2004,
The pullout load normalized behavior with
respect to the number of tires is plotted in
Figure 16. Each curve refers to specific
vertical stress levels and to different types of
tires (full tire or cut tire). For a given
surcharge load, the pullout capacity per tire
converges to a certain value, as the number of
tires increases. For surcharges less than 1.5m
height, this value is reduced to 6kN. For higher
surcharges, this value is not clearly defined
due to the limited amount of test arrangements
used. Although, one can comfortably assume
that these curves converge to higher values.
0
10
20
30
40
50
60
70
0 5 10 15Number of Tires
Loa
d pe
r T
ire
(kN
)
1.0m (full tire)
2.5m (cut tire)
2.5m (full tire)
0.5m (cut tire)
1.5m (cut tire)
Figure 16. Maximum load normalized behavior. Phase 2
The ratio between the normalized load and
surcharge height is shown in Figure 17. With
the exception of the tests with 0.5m surcharge
height, the pullout load per tire can be
represented by a single curve for each testing
program.
Tests performed by O’Schaughnessy & Garga
[19] are also plotted. The authors reported
pullout tests with different configurations of
mat tires embedded in 0,5m to 1,0m sandy
backfill. Their test setup is similar to the one
presented in this paper. Their results
emphasize the influence of tire mat
configuration. Linear tire grids with a single
row transverse to the direction of the applied
load produced higher pullout resistance, than
the one obtained with a linear tire grid aligned
with the applied load. For sake of comparison
between both testing programs, pullout tests
with a single tire in the first row are
disregarded.
0
5
10
15
20
25
30
0 5 10 15 20
Number of Tires
Load per Tire/Surcharge Height (kN/m)
O’Schaugnessy & Garga [18]
Phase 1 - local soil
Phase 2 - sandy soil
Figure 17. Pullout resistance normalized behavior.

International Journal of Engineering, ISSN/ISBN: 00207225,revised papper 28/03/2004,
The results apparently indicate that, for tire
arrangements with more than 14 tires, the
normalized pull-out strength approaches a
constant value for all tests, apparently
independent of the soil type of the
embankment. The small differences between
field pull-out tests can be associated to the
influence of different grain size distributions
and relative densities of the backfill materials.
The results also suggest that a minimum
pullout tire capacity of 4kN per surcharge
height (m) may be used for engineering
purposes, whenever normal stresses are kept
bellow 42kPa.
The pullout resistances monitored in single tire
tests were consistently higher than the ones
registered with tire mats. This behavior can be
attributed to the existence of a stronger
influence of lateral confinement in a single tire
arrangement. In addition, arrangements with
more than one tire present voids among tires,
which are difficult to be filled in with
compacted soil. This may result in a looser and
a less resistant soil-tire material [15].
Displacements of all tire arrangements have
indicated a progressive mobilization of shear
strength at successive tire rows.
At the earlier stages of the tests, the
displacements were primarily due to
deformations of the first row of tires. As the
test proceeded, the deformations of the
subsequent rows were successively initiated. It
was also observed that the rope knots
connecting adjacent tires were tightened with
the load application, resulting in an unforeseen
displacement. These displacements were
visually verified after the completion of the
tests and ranged between 0.02m to 0.04m
(Figure 14). The monitoring procedure did not
allow the identification of each component of
frontal displacement throughout the test.
Figure 18 shows frontal displacements
normalized by number of rows for the
different tire mats. As the number of row
increases, the normalized frontal displacement
reduces slightly. This pattern can be assigned
to the increasingly restriction of movement
due to the presence of a greater number of tire
connections.

International Journal of Engineering, ISSN/ISBN: 00207225,revised papper 28/03/2004,
For arrangements with a greater number of
rows, frontal displacement at failure was
nearly constant, ranging from 0.07m to 0.20m,
per transversal tire row. Due to the limited
number of tests the influence of vertical stress
level is not conclusive. O’Schaughnessy &
Garga [17] results are also plotted in Figure
18. Their data do not significantly depart from
the ones obtained in the present experimental
program and indicate an average normalized
frontal displacement of 0.15m.
0.0
0.1
0.2
0.3
0.4
0 1 2 3 4 5Number of Rows
f
?per
Row
(m
)
H=0.5m
H=1.0m
H=2.5m
O’Schaughnessy & Garga [11]
H=1.5m
Figure 18. Frontal displacement normalized behavior, for different surcharge heights (Phase 2).
Phase 1 testing program, with 1m surcharge
height, have shown an increase of 0.12m of
frontal displacement, at failure, per each
transversal tire row. These results are of the
same magnitude of the ones presented in
Figure 18 .
The influence of internal tire stiffness was also
evaluated by performing pullout tests with tire
filled with a soil-cement mixture or
unreinforced concrete slab. Field results
(Figure 19) indicated that the soil stiffness in
the tires did not affect significantly the pullout
resistance, but produced a stiffer tire mat. The
test performed with a concrete slab indicated a
37% reduction of frontal displacements at
failure, while soil-cement mixture caused a
slightly reduction of 8.5%.
0
50
100
150
0 10 20 30 40 50 60 70
Frontal Displacement (cm)
Loa
d (k
N)
compacted soil
soil-cement
(a) 4x3x4 tire arrangements
0
50
100
150
0 10 20 30 40 50 60 70
Frontal Displacement (cm)
Loa
d (k
N)
compacted Soil
concrete slab
(b) 4x3x4x4 tire arrangements
Figure 19. Influence of tire stiffness.
3. CONCLUSIONS
This paper presented results of a
comprehensive research project, developed in
Rio de Janeiro, Brazil, on use of scrap tires for
Civil Engineering purposes. The field tests

International Journal of Engineering, ISSN/ISBN: 00207225,revised papper 28/03/2004,
have shown that this alternative is a feasible
and low cost environmental engineering
solution.
Due to tire mechanical properties and
construction procedures the results of soil-tire
wall instrumentation indicate that the four
sections of prototype wall behaved adequately
in terms of stresses and deformation even for
the narrower section (section D) designed with
low safety factor.
The resulting structure is more flexible than
the conventional retaining walls, therefore they
produce higher horizontal displacements
which allow stress relaxation and load transfer.
Nevertheless, the observed lateral
displacements, for all sections, were kept
within reasonable limits.
From the lateral displacement point of view,
there is no significant difference between
using full tires and cut tires, tied with
polypropylene rope. However, it is expected
that the vertical displacement in the backfill
should be reduced with the use of cut tires.
The use of a more restrictive tightening
arrangement produces a stiffer wall, and its
displacement pattern does not depart
significantly from a rigid body movement.
Despite the observed horizontal displacements
during construction of the wall, the total lateral
load, in all sections, have a magnitude, similar
to the at rest condition. This behavior can be
attributed to the construction sequence, since
both the wall and backfill are built from
bottom to top. The most common lateral
displacement form observed in gravity
retaining walls is either a rotation around the
base or a constant horizontal displacement
with depth. Both forms do not apply to the
present case. The wall does not have a rigid
body motion and its flexibility helps the load
transfer mechanical action.
Similar to the lateral displacement monitoring,
no significant difference between using full
tires and cut tires has been noticed on the
measured earth pressure values, particularly at
the end of wall construction.
The additional load due to the 2m-height
surcharge, mobilized an expressive portion of
the shear strength of the backfill and increased
the importance of the load transfer mechanism.

International Journal of Engineering, ISSN/ISBN: 00207225,revised papper 28/03/2004,
The pullout behavior with respect to the
number of tires indicated a distinct response
for a single tire test. Increasing the number of
tires resulted in proportional larger pullout
loads.
The interaction between soil and tire mat
reinforcement is predominantly governed by
friction along the horizontal shear plane. The
ratio between the average shear strength
mobilized over the total length of the tire mat
reinforcement and the peak shear strength of
the soil (tan/tan´) was equal to 0.9.
In spite of the limited amount of tire
arrangements, the results suggested for
practical purposes a minimum resistance value
of 4kN per tire / surcharge height (m) and
0.12m of maximum frontal displacement, at
failure, per each transversal tire row.
The main advantages of using scrap tires in
slope stabilization and soil reinforcement
projects are:
The technique requires local soil, scrap tires
and rope, with no need of materials such as
cement, steel or aggregate.
There is no need for previous treatment of
tires before raising them in the wall or
arranging them in the reinforcing system.
The gravity wall can be constructed with
light compaction equipment or even
manually.
Transportation costs are usually low when
scrap tire deposits are available in urban
areas.
Tires embedded in earthfills apparently do
not affect the quality of groundwater.
4. ACKNOWLEDGEMENTS
The authors are grateful to the financial
support of Brazilian Research agencies CNPq
and FAPERJ. The authors also acknowledge
the financial assistance of IDRC (International
Development Research Center, Canada) and
GeoRio - Geotechnical Institute Foundation of
Rio de Janeiro, Brazil.
5. NOTATION
c’ effective cohesion
’ effective friction angle
H wall height
interface friction angle

International Journal of Engineering, ISSN/ISBN: 00207225,revised papper 28/03/2004,
Poisson’s ratio
f Frontal displacement at failure
Ea Rankine’s active trust
Eo At rest trust
Emeasured Measured trust
Pf Pullout force at failure

International Journal of Engineering, ISSN/ISBN: 00207225,revised papper 28/03/2004,
REFERENCES
1. O’Schaughnessy, V. & Garga, V.K., Tire-
reinforced Earthfill. Part3:
“Environmental assessment”, Canadian
Geotechnical Journal, 37, 2000, pp. 117-
131.
2. Hausmann, M.R. (1990) - “Slope
Remediation”. Stability and Performance
of Slope and Embankments-II,
Geotechnical Special Publication ASCE
n. 31, edited by R.B. Seed and R.W.
Boulanger, vol. 2, p. 1274-1317.
3. Long, N.T. (1984), “Pneusol, Tyresoil,
Tiresoil”. Colloque Routes et
Development, Ecole National des Ponts
et Chaussées, France, 17p.
4. Long, N.T. (1990) - “The Pneusol”.
Publication GT44, Laboratoire Central des
Ponts et Chaussées, France, 76p.
5. Sieira, A.C.C.F.; Sayão, A.S.F.J.; Medeiros,
L.V. & Gerscovich, D.M.S.,
“Experimental Soil-tire Retaining Wall”,
Revista Portuguesa de Geotecnia, no. 91,
julho, 2001, 17p. (in Portuguese).
6. Garga, V.K.; Shaughnessy, V.O.; Medeiros,
L.V.& Sayão A.S.F.J., “Behavior of Scrap
Tire Reinforced Retaining Walls:
Canadian and Brazilian Experiences”, 11th
Pan-American Conf. on Soil Mechanics
and Geotechnical Engineering, Foz do
Iguaçu, Brasil, vol. 3, 1999, pp. 1199-
1206.
7. Garga, V. K. and O’Shaughnessy, V.
(1995). Use of Scrap Tires for
Embankment Construction. 48th Canadian
Geotechnical Conference, vol. 1, p. 425-
432.
8. O’Schaughnessy, V. & Garga, V.K., Tire-
reinforced Earthfill. Part1: “Construction
of a test fill, performance, and retaining
wall design”, Canadian Geotechnical
Journal, 37, 2000, pp. 75-96.
9. O’Schaughnessy, V. & Garga, V.K (2000),
Tire-reinforced Earthfill. Part2: “Pullout
Behavior and Reinforced Slope Design”,
Canadian Geotechnical Journal, 37, pp.
97-116.
10. Masad, E.; Taha R.; Ho, C. Papagiannakis,
T. (1996) Engineering properties of
Tire/soil mixtures as a lightweight fill
material, Geotechnical Testing Journal,

International Journal of Engineering, ISSN/ISBN: 00207225,revised papper 28/03/2004,
American Society for Testing material,
pp.297-304.
11. Tweedie, J.J.; Humphrey, D.N.; Stanford,
T.C. (1998), Tire shreds as lightweight
retaining wall backfill: active conditions,
Journal of Geotechnical and
Geoenvironmental Engineering, pp.1061-
1070.
12. Lee, J.H.; Salgado, R.; Bernal, A.; Lovell,
C. W. (1999), Shredded tires and rubber-
sand as lightweight backfill, Journal of
Geotechnical and Geoenvironmental
Engineering, pp.132-141.
13. Medeiros, L.V.; Garga, V.; Gerscovich,
D.M.S.; Sayão, A.S.F.J. & Andrade,
M.H.N., “Analysis of the Instrumentation
of an Experimental Scrap Tire Retaining
Wall”, 11th Pan-Am. Conf. on Soil
Mechanics and Geotechnical Eng., Foz
do Iguaçu, vol I, 1999, pp. 19-25.
14. Medeiros, L. V.; Sayão, A. S. F. J; Garga,
V. K & Andrade, M. H. N., “Use of Scrap
Tires in Slope Stabilization”, 2nd Pan Am.
Symp. on Landslides, Rio de Janeiro, vol.
2, 1997, pp. 637-644.
15. Medeiros, L. V.; Sayão, A. S. F. J; Garga,
V. K & Andrade, M. H. N., “Use of Scrap
Tires in Retaining Walls”, International
Journal of Environmentally Conscious
Design and Manufacturing, vol 6, 1997,
pp. 19-24.
16. Jaky, J., “The coefficient of earth pressure
at rest, Journal of the society of
Hungarian Architects and Engineers,
1944,pp. 355-358.
17. Gerscovich, D.M.S.; Medeiros, L.V. de.;
Sayão, A. S. F.J. & Garga, V. K., :”Field
Pullout Tests on Scrap Tire
Arrangements”, International Conference
on Geotechnical & Geological
Engineering, Melbourne, 2000, CDROM.
18. Gerscovich, D.M.S.; Medeiros, L.V. de.;
Sayão & A. S. F, “Field Pullout Tests of
Scrap Tire Reinforcement Layers under
Different Soil Surcharges”, XV
International Congress on Soil
Mechanics and Geotechnical
Engineering, Istambul, 2001.
19. O’Schaughnessy, V. & Garga, V.K., Tire-
reinforced Earthfill. Part2: “Pullout
Behavior and Reinforced Slope Design”,

International Journal of Engineering, ISSN/ISBN: 00207225,revised papper 28/03/2004,
Canadian Geotechnical Journal, 37,
2000, pp. 97-116.