Embed Size (px)
Citation preview

Scouts: Improving the Diagnosis Process ThroughDomain-customized Incident Routing
Jiaqi Gao★, Nofel Yaseen
⋄, Robert MacDavid
∗, Felipe Vieira Frujeri
◦, Vincent Liu
⋄, Ricardo Bianchini
◦
Ramaswamy Aditya§, Xiaohang Wang
§, Henry Lee
§, David Maltz
§, Minlan Yu
★, Behnaz Arzani
◦
★Harvard University ⋄University of Pennsylvania ∗Princeton University ◦Microsoft Research §Microsoft
ABSTRACTIncident routing is critical for maintaining service level objectives
in the cloud: the time-to-diagnosis can increase by 10× due to mis-
routings. Properly routing incidents is challenging because of the
complexity of today’s data center (DC) applications and their de-
pendencies. For instance, an application running on a VM might
rely on a functioning host-server, remote-storage service, and vir-
tual and physical network components. It is hard for any one team,
rule-based system, or even machine learning solution to fully learn
the complexity and solve the incident routing problem. We pro-
pose a different approach using per-team Scouts. Each teams’ Scout
acts as its gate-keeper — it routes relevant incidents to the team
and routes-away unrelated ones. We solve the problem through
a collection of these Scouts. Our PhyNet Scout alone — currently
deployed in production — reduces the time-to-mitigation of 65% of
mis-routed incidents in our dataset.
CCS CONCEPTS•Computingmethodologies→Machine learning; •Networks→ Data center networks;
KEYWORDSData center networks; Machine learning; Diagnosis
ACM Reference Format:Jiaqi Gao, Nofel Yaseen, Robert MacDavid, Felipe Vieira Frujeri, Vincent
Liu, RicardoBianchini, Ramaswamy Aditya, Xiaohang Wang, Henry Lee,
David Maltz, Minlan Yu, Behnaz Arzani. 2020. Scouts: Improving the Di-
agnosis Process Through Domain-customized Incident Routing. In Annualconference of the ACM Special Interest Group on Data Communication on theapplications, technologies, architectures, and protocols for computer communi-cation (SIGCOMM ’20), August 10–14, 2020, Virtual Event, NY, USA. ACM,
New York, NY, USA, 17 pages. https://doi.org/10.1145/3387514.3405867
1 INTRODUCTIONFor cloud providers, incident routing — taking an issue that is too
complex for automated techniques and assigning it to a team of
engineers — is a critical bottleneck to maintaining availability and
Permission to make digital or hard copies of all or part of this work for personal or
classroom use is granted without fee provided that copies are not made or distributed
for profit or commercial advantage and that copies bear this notice and the full citation
on the first page. Copyrights for components of this work owned by others than ACM
must be honored. Abstracting with credit is permitted. To copy otherwise, or republish,
to post on servers or to redistribute to lists, requires prior specific permission and/or a
fee. Request permissions from [email protected].
SIGCOMM ’20, August 10–14, 2020, Virtual Event, NY, USA© 2020 Association for Computing Machinery.
ACM ISBN 978-1-4503-7955-7/20/08. . . $15.00
https://doi.org/10.1145/3387514.3405867
service-level objectives. When incidents are mis-routed (sent to thewrong team), their time-to-diagnosis can increase by 10× [21].
A handful of well-known teams that underpin other services
tend to bear the brunt of this effect. The physical networking team
in our large cloud, for instance, is a recipient in 1 in every 10 mis-
routed incidents (see §3). In comparison, the hundreds of other
possible teams typically receive 1 in 100 to 1 in 1000. These findings
are common across the industry (see Appendix A).
Incident routing remains challenging because modern DC ap-
plications are large, complex, and distributed systems that rely
on many sub-systems and components. Applications’ connections
to users, for example, might cross the DC network and multiple
ISPs, traversing firewalls and load balancers along the way. Any of
these components may be responsible for connectivity issues. The
internal architectures and the relationships between these compo-
nents may change over time. In the end, we find that the traditional
method of relying on humans and human-created rules to route
incidents is inefficient, time-consuming, and error-prone.
Instead, we seek a tool that can automatically analyze these
complex relationships and route incidents to the team that is most
likely responsible; we note that machine learning (ML) is a potential
match for this classification task. In principle, a single, well-trained
ML model could process the massive amount of data available from
operators’ monitoring systems—too vast and diverse for humans—
to arrive at an informed prediction. Similar techniques have found
success in more limited contexts (e.g., specific problems and/or
applications) [11, 15, 22, 25, 73]. Unfortunately, we quickly found
operationalizing this monolithicMLmodel comeswith fundamental
technical and practical challenges:
A constantly changing set of incidents, components, and monitoringdata: As the root causes of incidents are addressed and components
evolve over time, both the inputs and the outputs of the model are
constantly in flux. When incidents change, we are often left without
enough training data and when components change, we potentially
need to retrain across the entire fleet.
Curse of dimensionality: A monolithic incident router needs to in-
clude monitoring data from all teams. This large resulting feature
vector leads to “the curse of dimensionality” [4]. The typical solu-
tion of increasing the number of training examples in proportion to
the number of features is not possible in a domain where examples
(incidents) are already relatively rare events.
Uneven instrumentation: A subset of teams will always have gaps
in monitoring, either because the team has introduced new compo-
nents and analytics have not caught up, or because measuring is just
hard, e.g., in active measurements where accuracy and overhead
are in direct contention [34].
SIGCOMM ’20, August 10–14, 2020, Virtual Event, NY, USA Gao et al.
Limited visibility into every team: For the same reasons that it is
difficult for teams to have expertise in all surrounding components,
it is difficult for us to understand the appropriate feature sets from
each and every team.
Rather than building a single, monolithic predictor, we argue apiecewise solution based on a collection of (strategically assigned)
per-team predictors, a.k.a. Scouts, is more useful. Scouts are low-
overhead, low-latency, and high-accuracy tools that predict, for a
given team, whether the team should be involved. They are built by
the team to which they apply and are amenable to partial deploy-
ment. Scouts address the above challenges: they only need to adapt
to changes to their team and its components (instead of all changes),
they operate over a more limited feature set (no longer suffer the
curse of dimensionality), they limit the need for understanding
the internals of every team (they only need to encode information
about the team they are designed for and its local dependencies),
and only require local instrumentation. Scouts can utilize a hybrid
of supervised and unsupervised models to account for changes to
incidents (see §5) and can provide explanations as to why they de-
cided the team is (not) responsible. Operators can be strategic about
which Scouts they need: they can build Scouts for teams (such as
our physical networking team) that are inordinately affected by
mis-routings. Given a set of Scouts, operators can incrementally
compose them, either through a global routing system or through
the existing manual process.
We designed, implemented, and deployed a Scout for the physical
networking team of a large cloud.1We focus on this team as, from
our study of our cloud and other operators, we find the network —
and specifically the physical network — suffers inordinately from
mis-routing (see §3). This team exhibits all of the challenges of
Scout construction: diverse, dirty datasets; complex dependencies
inside and outside the provider; many reliant services; and frequent
changes. As the team evolves, the framework we developed adapts
automatically and without expert intervention through the use of
meta-learning techniques [46].
These same techniques can be used to develop new “starter”
Scouts as well. However, even for teams that do not build a Scout,
e.g., if instrumentation is difficult or dependencies are hard to dis-
entangle, they still benefit from Scouts: their incidents spend less
time at other teams, and they receive fewer mis-routed incidents
belonging to Scout-enabled teams. In fact, we show even a single,
strategically deployed Scout can lead to substantial benefit.
Our Scout has precision/recall ≥ 98%, and it can reduce over 60%
of the investigation time of many incidents. Our contributions are:
1) An investigation of incident routing based on our analysis of
our production cloud. As the data we use is of a sensitive nature,
we limit our discussion to those incidents which impacted the
physical networking team (arguably the most interesting for this
conference), but the scope of the study was much broader. We
augment our results with analysis of public incident reports [2, 7]
and a survey of other operators (Appendix A).
2) The introduction of the concept of a distributed incident routing
system based on Scouts. We show the improvements such a system
can bring through trace-driven simulations (Appendix D).
1To demonstrate the overall benefit of Scouts, we run trace-driven simulations of
broader deployments (Appendix D).
3) The design of a Scout for Microsoft Azure’s physical networking
team accompanied by a framework to enable its evolution as the
team’s monitoring systems, incidents, and responsibilities change.
4) A thorough evaluation of the deployed PhyNet Scout and analysisof incidents in our cloud from the past year and a discussion of the
challenges the Scout encountered in practice.
This paper is the first to propose a decomposed solution to the
incident routing problem. We take the first step in demonstrating
such a solution can be effective by building a Scout for the PhyNet
team of Microsoft Azure. This team was one of the teams most
heavily impacted by the incident routing problem. As such, it was a
good first candidate to demonstrate the benefits Scouts can provide;
we leave the detailed design of other teams’ Scouts for future work.
2 BACKGROUND: INCIDENT ROUTINGIncidents constitute unintended behavior that can potentially im-
pact service availability and performance. Incidents are reported
by customers, automated watchdogs, or discovered and reported
manually by operators.
Incident routing is the process through which operators decide
which team should investigate an incident. In this context, we
use team to broadly refer to both internal teams in the cloud and
external organizations such as ISPs. Today, operators use run-books,
past-experience, and a natural language processing (NLP)-based
recommendation system (see §7), to route incidents. Specifically,
incidents are created and routed using a few methods:
1) By automated watchdogs that run inside the DC and monitor
the health of its different components. When a watchdog uncovers
a problem it follows a built-in set of rules to determine where it
should send the incident.
2) As Customer Reported Incidents (CRIs) which go directly to a
24 × 7 support team that uses past experience and a number of
specialized tools to determine where to send the incident. If the
cause is an external problem, the team contacts the organization
responsible. If it is internal, it is sent to the relevant team where it
is acknowledged by the on-call engineer.
It is important for every incident to be mitigated as quickly as
possible, even if it does not result in SLO violations—prolonged
investigations reduce the resilience of the DC to future failures [12,
33]: any time saved from better incident routing is valuable.
Routing incidents can be excruciatingly difficult as modern DC
applications are large and complex distributed systems that rely on
many other components. This is true even for incidents generated
by automated watchdogs as they often observe the symptom —
which can be far-reaching: a VM’s frequent rebooting can be an
indication of a storage problem or a networking issue [15, 73].
3 INCIDENTS IN THEWILDTo understand the impact of incident routing and why incidents
are sometimesmis-routed, we investigate incidents in a large cloud.
In particular, we examine, in depth, the internal logs of incidents
involving the physical networking team (PhyNet) of a large cloud.
These logs cover nine months and include records of the teams
the incident was routed through, the time spent in each team, and
logs from the resolution process. We have normalized the absolute

SIGCOMM ’20, August 10–14, 2020, Virtual Event, NY, USA
0.0 0.2 0.4 0.6 0.8 1.00.0
0.2
0.4
0.6
0.8
1.0
0.0 0.4 0.6 0.8 1.0
0.2
0.4
0.6
0.8
1.0CRI Created by PhyNet monitorsCreated by other teams' monitors
Fraction of PhyNet incidents per day
(a)
Fraction of PhyNet Incidents mis-routed per day
(b)
CDF
0.00.0
Figure 1: (a) Fraction of PhyNet incidents (per-day) createdby its monitors, by those of other teams, and by customers.(b) Fraction of incidents of each type that are mis-routed.
investigation times to protect company sensitive data, however, the
reader can refer to the public incident reports of [2, 7] as a lower
bound (at the time of this writing, the maximum investigation time
in these reports was 25 hours).
3.1 What is the Cost of Incident Routing?As the core networking team, the physical networking team’s
(PhyNet’s) purview is every switch and router in the DC. They
are on the critical path of most distributed systems and the analysis
of their incidents serves as an interesting case study of mis-routings.
Most PhyNet incidents are discovered by its own monitoring
systems and are routed correctly to PhyNet (Figure 1). But some of
the incidents PhyNet investigates are created by other teams’ mon-
itoring systems or customers. Of the incidents that pass through
PhyNet, PhyNet eventually resolves a fraction, while others are
subsequently routed to other teams. In the former case, if the inci-
dent went through other teams, their time will have been wasted in
proving their innocence. In the latter, the same is true of PhyNet’s
resources. This also delays resolution of the incident. 58% of inci-
dents passing through PhyNet fall into one of these categories. We
find perfect (100%) accuracy in incident routing can reduce time to
mitigation of low severity incidents by 32%, medium severity ones
by 47.4%, and high severity ones by 0.15% (all teams are involved in
resolving the highest severity incidents to avoid customer impact).
Across teams and incidents, better incident routing could elimi-
nate an average of 97.6 hours of investigations per day — exceeding
302 hours on ∼10% of days.
The incidents resolved by PhyNet are investigated by 1.6 teams
on average, and up to 11 teams in the worst case. Mis-routed inci-
dents take longer to resolve (Figure 2): on average, they took 10×longer to resolve compared to incidents that were sent directly to
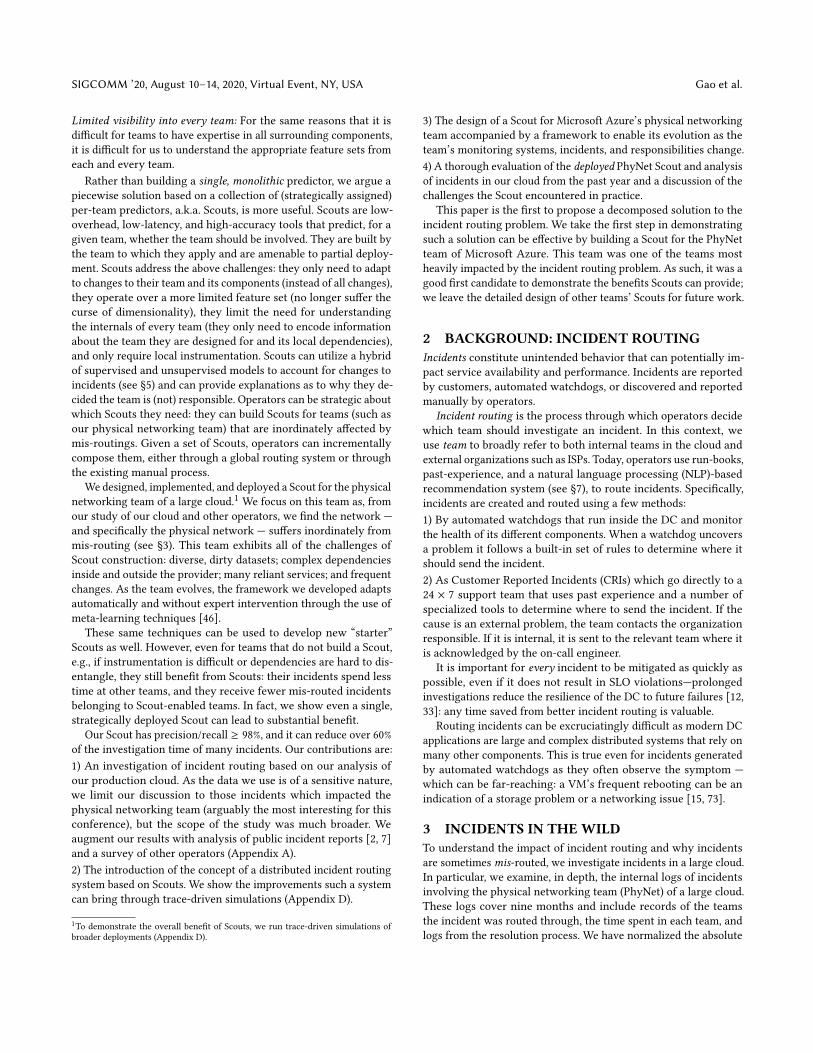
the responsible team. For 20% of them, time-to-mitigation could
have been reduced by more than half by sending it directly to
PhyNet (Figure 3). These incidents are likely a biased sample: mis-
routing may indicate the incident is intrinsically harder to resolve;
but our investigation into the reasons behind mis-routing indicates
that many hops are spurious and can be avoided (see §3.2).
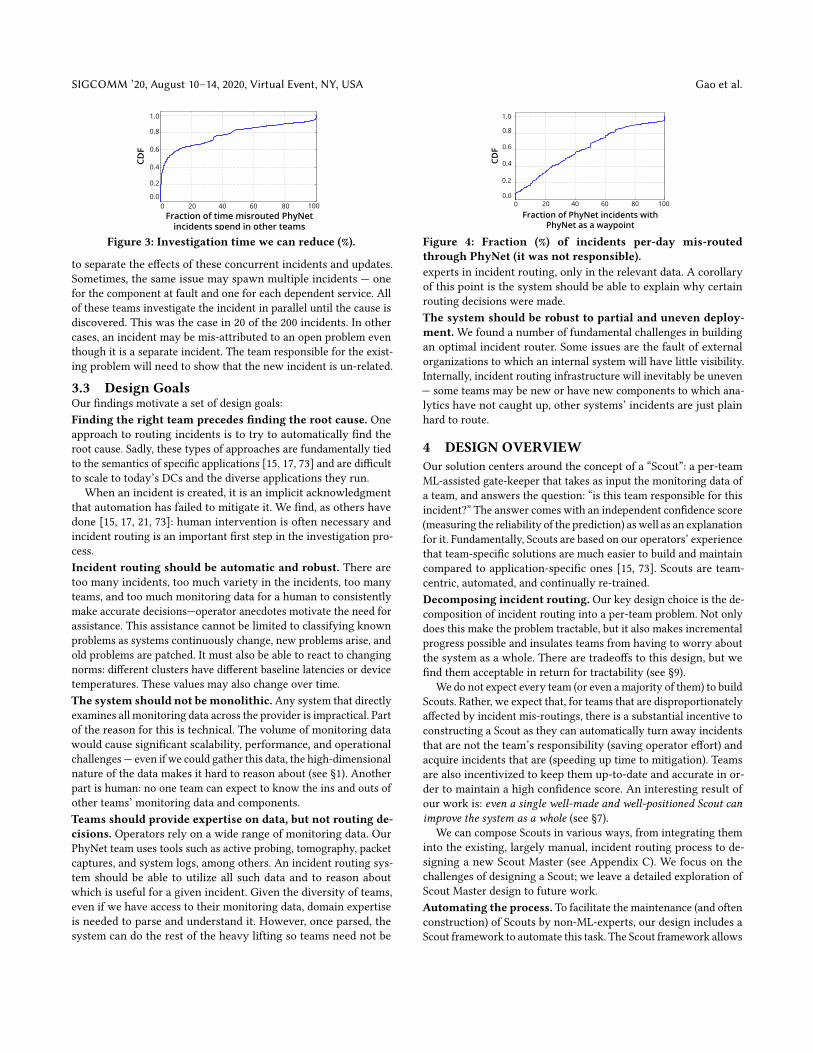
PhyNet is often one of the first suspects and among the first
teams to which incidents are sent. As a result, daily statistics show
that, in the median, in 35% of incidents where PhyNet was engaged,
the incident was caused by a problem elsewhere (Figure 4).
3.2 Why Do Multiple Teams Get Involved?We study why incident routing is difficult by analyzing, in depth,
200 rerouted incidents. To our knowledge, this is the first case study
focusing on the reasons behind cloud incident routing problems.
10 -8 10-6 10-4 10-2 100
Time (normalized)
Multiple teams investigate Single team investigates
CDF
0
0.2
0.4
0.6
0.8
1
10x
Figure 2: Time to diagnosis of incidents going through a sin-gle vs going through multiple teams. The numbers are nor-malized by the maximum investigation time in the dataset.
When an incident comes in, it is common to send it to the team
where the issue was first detected. For example, if a customer is un-
able to connect to a database, the database team is typically alerted
first. When operators find the database is functioning correctly
(e.g. CPU, disk, and query execution times seem healthy and there
are no changes in login times), they involve other teams. Common
reasons for involving other teams are:
Engineers from different teams bring a wide range of do-main knowledge to determine culpability. Often, the involve-ment of multiple teams is due to a lack of domain-knowledge in a
particular area. In our example, the database expert may not have
the networking expertise to detect an ongoing network failure or its
cause. Team-level dependencies are deep, subtle, and can be hard to
reason about — exacerbating the problem. In our database example,
a connectivity issue may spur engineers to check if the physical
network, DNS, software load balancers, or virtual switches are at
fault before looking at other possible (and less-likely) causes. The
most common cause of mis-routing is when a team’s component is
one of the dependencies of the impacted system and thus a legiti-
mate suspect, but not the cause. In 122 out of 200 incidents, there
was at least one such team that was unnecessarily engaged.
Counter-intuitively, when no teams are responsible, moreteams get involved. A fundamental challenge in incident routing
is engineers’ lack of visibility into other ISPs and customer systems,
which may be experiencing ongoing DDoS attacks, BGP hijacks,
or bugs/misconfigurations. CRIs are especially prone to starting
with missing information as these issues can be varied in nature
and hard to debug remotely. In such cases, it is sometimes faster to
rule out teams within the cloud first rather than to wait or blame
others. Ironically, this ends up involving more teams.
One example from the dataset is where a customer was unable to
mount a file-share. Suspects included storage, switches and links in
the network, the load balancer, or the provider’s firewalls, among
others. After ruling out all these components, operators found the
customer had mis-configured their on-premises firewall. Customer
misconfigurations or a workload beyond the customer VM’s capac-
ity was responsible for this and 27 other incidents in our dataset;
the PhyNet team was engaged in the investigation of each.
Concurrent incidents and updates are hard to isolate. DC is-
sues are often a result of management operations that create un-
intended side effects [12, 33]. Out of the 200 incidents we stud-
ied, 52 were caused by upgrades. These updates are not limited to
those made by the provider as they typically partner with hard-
ware vendors that have their own upgrade cycles. It can be difficult
SIGCOMM ’20, August 10–14, 2020, Virtual Event, NY, USA Gao et al.
Fraction of time misrouted PhyNet incidents spend in other teams
0 20 40 60 80 1000.0
0.2
0.4
0.6
0.8
1.0
CDF
Figure 3: Investigation time we can reduce (%).
to separate the effects of these concurrent incidents and updates.
Sometimes, the same issue may spawn multiple incidents — one
for the component at fault and one for each dependent service. All
of these teams investigate the incident in parallel until the cause is
discovered. This was the case in 20 of the 200 incidents. In other
cases, an incident may be mis-attributed to an open problem even
though it is a separate incident. The team responsible for the exist-
ing problem will need to show that the new incident is un-related.
3.3 Design GoalsOur findings motivate a set of design goals:
Finding the right team precedes finding the root cause. Oneapproach to routing incidents is to try to automatically find the
root cause. Sadly, these types of approaches are fundamentally tied
to the semantics of specific applications [15, 17, 73] and are difficult
to scale to today’s DCs and the diverse applications they run.
When an incident is created, it is an implicit acknowledgment
that automation has failed to mitigate it. We find, as others have
done [15, 17, 21, 73]: human intervention is often necessary and
incident routing is an important first step in the investigation pro-
cess.
Incident routing should be automatic and robust. There aretoo many incidents, too much variety in the incidents, too many
teams, and too much monitoring data for a human to consistently
make accurate decisions—operator anecdotes motivate the need for
assistance. This assistance cannot be limited to classifying known
problems as systems continuously change, new problems arise, and
old problems are patched. It must also be able to react to changing
norms: different clusters have different baseline latencies or device
temperatures. These values may also change over time.
The system should not bemonolithic. Any system that directly
examines all monitoring data across the provider is impractical. Part
of the reason for this is technical. The volume of monitoring data
would cause significant scalability, performance, and operational
challenges — even if we could gather this data, the high-dimensional
nature of the data makes it hard to reason about (see §1). Another
part is human: no one team can expect to know the ins and outs of
other teams’ monitoring data and components.
Teams should provide expertise on data, but not routing de-cisions. Operators rely on a wide range of monitoring data. Our
PhyNet team uses tools such as active probing, tomography, packet
captures, and system logs, among others. An incident routing sys-
tem should be able to utilize all such data and to reason about
which is useful for a given incident. Given the diversity of teams,
even if we have access to their monitoring data, domain expertise
is needed to parse and understand it. However, once parsed, the
system can do the rest of the heavy lifting so teams need not be
0.0
0.2
0.4
0.6
0.8
1.0
0
CDF
Fraction of PhyNet incidents with PhyNet as a waypoint
20 40 60 80 100
Figure 4: Fraction (%) of incidents per-day mis-routedthrough PhyNet (it was not responsible).experts in incident routing, only in the relevant data. A corollary
of this point is the system should be able to explain why certain
routing decisions were made.
The system should be robust to partial and uneven deploy-ment.We found a number of fundamental challenges in building
an optimal incident router. Some issues are the fault of external
organizations to which an internal system will have little visibility.
Internally, incident routing infrastructure will inevitably be uneven
— some teams may be new or have new components to which ana-
lytics have not caught up, other systems’ incidents are just plain
hard to route.
4 DESIGN OVERVIEWOur solution centers around the concept of a “Scout”: a per-team
ML-assisted gate-keeper that takes as input the monitoring data of
a team, and answers the question: “is this team responsible for this
incident?” The answer comes with an independent confidence score
(measuring the reliability of the prediction) as well as an explanation
for it. Fundamentally, Scouts are based on our operators’ experience
that team-specific solutions are much easier to build and maintain
compared to application-specific ones [15, 73]. Scouts are team-
centric, automated, and continually re-trained.
Decomposing incident routing. Our key design choice is the de-
composition of incident routing into a per-team problem. Not only
does this make the problem tractable, but it also makes incremental
progress possible and insulates teams from having to worry about
the system as a whole. There are tradeoffs to this design, but we
find them acceptable in return for tractability (see §9).
We do not expect every team (or even amajority of them) to build
Scouts. Rather, we expect that, for teams that are disproportionately
affected by incident mis-routings, there is a substantial incentive to
constructing a Scout as they can automatically turn away incidents
that are not the team’s responsibility (saving operator effort) and
acquire incidents that are (speeding up time to mitigation). Teams
are also incentivized to keep them up-to-date and accurate in or-
der to maintain a high confidence score. An interesting result of
our work is: even a single well-made and well-positioned Scout canimprove the system as a whole (see §7).
We can compose Scouts in various ways, from integrating them
into the existing, largely manual, incident routing process to de-
signing a new Scout Master (see Appendix C). We focus on the
challenges of designing a Scout; we leave a detailed exploration of
Scout Master design to future work.
Automating the process. To facilitate the maintenance (and often
construction) of Scouts by non-ML-experts, our design includes a
Scout framework to automate this task. The Scout framework allows

SIGCOMM ’20, August 10–14, 2020, Virtual Event, NY, USA
ModelSelector
Figure 5: The anatomy of a Scout.
teams to provide a simple configuration file that provides guidance
on their monitoring data — whether measurements are time-series
or a log of events; whether different pieces of data refer to different
statistics of a common component; or if certain data/components
should be ignored. The framework then automatically trains, re-
trains, and evaluates models to achieve the desired output. The
team can improve upon the Scout by tweaking the input features,
by adding additional models, or by adding specific decision rules.
In many ways, our framework mirrors a recent push toward
AutoML [46, 56]. Sadly, existing AutoML techniques are poorly
suited to incident routing because: (1) their sensitivity to the format
of input data makes them difficult to use [36]; (2) they deal poorly
with behavior that is slightly different from that found in the train-
ing set; (3) they are a black box, making it hard for operators to
reason about why they receive an incident; and (4) in return for
automation, they typically explore a huge search space and have a
high training cost. By building a framework specialized for incident
routing, we create a better solution. Such a framework is critical
for deploying an ML-based Scout in production as it helps (e.g.,
PhyNet) operators (not familiar with ML) maintain the Scout over
time and to incorporate new monitoring data or remove old ones.
5 THE SCOUT FRAMEWORKFigure 5 shows the architecture of our framework. It takes as input
a configuration file (provided by operators), the incident descrip-
tion, and pulls the relevant monitoring data the team (and its local
dependencies) collects and produces a Scout (e.g., for PhyNet). We
next describe each component.
5.1 Monitoring SpecificationsScouts rely on monitoring data to decide where to route incidents:
they must (1) decide which monitoring data is relevant to the in-
cident (lest we contribute to the curse of dimensionality) and (2)
pre-process that data before it is used. Both steps are difficult to
handle automatically. First, the framework starts with the incident
description and all of the operator’s monitoring data (from all DCs)
as input and has no other information with which to narrow its
search. Second, the framework must be able to process arbitrary
new datasets with minimal context. Teams can annotate both the
incident text and the monitoring data to help:
Extracting components from the incident itself. Scouts can-not investigate all components (DC sub-systems such as VMs,
switches, and servers): (1) it would result in a high-dimensional
feature-set (2) it can lead to too many false positives — due to con-
current and unrelated incidents (see §3). To solve this problem,
Scouts extract relevant components from the incident description.
Operators enable this by specifying how to detect such components
in the incident description (dependent components can be extracted
by using the operator’s logical/physical topology abstractions [52]).
Operators typically use machine-generated names for these compo-
nents and can specify how they can be extracted from the incident
using regular expressions:
Configuration
let VM = <regex>;let server = <regex>;let switch = <regex>;let cluster = <regex>;let DC = <regex>;
Example incident
(made up)
VM X.c10.dc3 in clusterc10.dc3 is experiencingproblem connecting tostorage cluster c4.dc1
Tagging monitoring data with additional metadata. Scoutsalso need to pull the relevant monitoring data and decide how to
pre-process it. Operators can assist in this process as well (this infor-
mation may already be part of the DC’s topology abstraction). First,
the location of each piece of monitoring data so the Scout can access
it. Second, the component associations of the data, e.g., to which
cluster and/or switch it refers. Third — to assist pre-processing — a
data type and optional class tag. For example:
MONITORING dataset_1 = CREATE_MONITORING(resource_locator,{cluster=Y,server=Z},TIME_SERIES, CPU_UTIL);
The data type can be one of TIME_SERIES or EVENT. Time-series
variables are anything measured at a regular interval, e.g., utiliza-
tion, temperature, etc. Events are data points that occur irregularly,
e.g., alerts and syslog error messages. All monitoring data can be
transformed into one of these two basic types, and Scouts use a
different feature engineering strategy for each (see §5.2). Note, op-
erators may apply additional pre-processing to the monitoring data;
for example, filtering out those syslogs they consider to be noise.
The class tag is optional (our PhyNet Scout only has two data-sets
with this tag), but enables the automatic combination of “related”
data sets — it ensures we can do feature engineering properly and
do not combine apples and oranges (see §5.2).
Operators provide this information through configuration files
(Figure 5). To modify the Scout, operators can modify the con-
figuration file, e.g., by adding/removing references to monitoring
data or changing the regular expressions the Scout uses to extract
components from the incident text.
5.2 Feature Construction and PredictionA Scout needs to examine each incident and decide if its team is
responsible (maybe based on past incidents). ML is particularly well
suited to such tasks (see §1).
We first need to decide whether to use supervised or unsuper-
vised learning. Supervised models are known to be more accurate
(Table §3). But supervised models had trouble classifying: (a) infre-
quent and (b) new incidents — there is not enough representative
training data to learn from [47]2. Thus, we opted for a hybrid so-
lution that uses supervised learning to classify most incidents but
2This is consistent with the high accuracy of these models as such incidents are rare.

SIGCOMM ’20, August 10–14, 2020, Virtual Event, NY, USA Gao et al.
falls back to an unsupervised model for new and rare incidents. We
use a separate ML model to learn which category an incident falls
into (the model selector). The underlying components are:
5.2.1 Random forests (RFs). We use Random forests (RFs) [57]
as our supervised learning model. RFs can learn the complex re-
lationships between incidents, the monitoring data the teams col-
lect, and whether the team is responsible. RFs are a natural first
choice [15, 18, 24, 68]: they are resilient to over-fitting and offer
explain-ability.
Explain-ability is often a crucial feature for the successful de-
ployment of a system such as ours (see §7). We use [57] to provide
explanations to the team when incidents are routed to them.
Our RF takes as input a set of aggregated statistics for each
type of component. For instance, in the component specification
presented in §5.1, the five component types would result in five
distinct sets of features.Per-component features. We next construct features for each
type of relevant component — up to five types in our example.
Per-component features incorporate EVENT and TIME_SERIES data
related to the components during the interval [𝑡 −𝑇, 𝑡], where 𝑡 isthe timestamp of the incident and 𝑇 is a fixed look-back time. Each
data set is pre-processed as follows:
Events/alerts: We count the events per type of alert and per compo-
nent, e.g., the number of Syslogs (per type of Syslog).
Time-series: We normalize them and calculate the: mean, standard
deviation, min, max, and 1𝑠𝑡, 10
𝑡ℎ, 25
𝑡ℎ, 50
𝑡ℎ, 75
𝑡ℎ, 90
𝑡ℎ, and 99
𝑡ℎ
percentiles during [𝑡 −𝑇, 𝑡] to capture any changes that indicate a
failure.
Merging features from multiple components. Many compo-
nents contain a variable amount of related monitoring data that
need to be combined to ensure a fixed-length feature-set. This
is because: (1) differences in hardware/instrumentation (e.g. two
servers with different generations of CPU, one with 16 cores and
one with 32, where data is collected for each core), or (2) the inclu-
sion of sub-components, e.g., many switches in a single cluster. In
the first case, user ‘class’ tags specify the data to combine (which
we normalize first). In the second, the component tags provide
that information: e.g., all data with the same ‘resource_locator’ and
‘cluster’ tag is combined. We ensure a consistent feature set size by
computing statistics over all the data as a whole. Our intuition is
these features capture the overall distribution and hence, the impact
of the failure. For example, if a switch in a cluster is unhealthy, the
data from the switch would move the upper (or lower) percentiles.
We compute statistics for all applicable component types: for
cluster c10.dc3 in our example, we would compute a set of cluster
and DC features. If we do not find a component in any of the team’s
monitoring data, we remove its features. For example, PhyNet is
not responsible for monitoring the health of VMs (other teams are)
and so the PhyNet Scout does not have VM features.
In our example, the features include a set of server and switchfeatures — corresponding to the statistics computed over data sets
that relate to servers and switches — set to 0; statistics computed
over each data set related to the two clusters: c10.dc3 and c4.dc1;and similarly, dc features over data from dc3 and dc1.
We add a feature for the number of components of each type.
This, for example, can help the model identify whether a change in
RF CPD+ NLP
Precision 97.2% 93.1% 96.5%
Recall 97.6% 94.0% 91.3%
F1-score 0.97 0.94 0.94
Table 1: F1-Score, precision, recall of each model as well asthe existing NLP solution §7.
the 99𝑡ℎ
percentile of a switch-related time series is significant (it
may be noise if all the data is from one switch but significant if the
data is aggregated across 100 switches).
5.2.2 Modified Change Point Detection (CPD+). To choose an
unsupervised model we use the following insight: when a team’s
components are responsible for an incident there is often an accom-
panying shift in the data from those components, moving from one
stationary distribution to another.
CPD+ is an extension of change point detection (CPD) [51], an
algorithm that detects when a time series goes from one stationary
distribution to another. CPD is not, by itself, sufficient: (a) CPD only
applies to time-series data and cannot operate over events; (b) CPD
tends to have high false-positives—changes in distribution due to
non-failure events are common. The problem in (b) is exacerbated
when the incident implicates an entire cluster and not a small set
of devices: the algorithm can make a mistake on each device.
We use simple heuristics to solve these problems3. Our intuition
is while we do not have enough data to learn whether the team
is responsible, we do have enough to learn what combination of
change-points point to failures: when we have to investigate the
full cluster, we “learn” (using a new RF) whether change-points
(and events) are due to failures. The input is the average number
of change-points (or events) per component type and monitoring
data in the cluster.
When the incident implicates a handful of devices, we take a
conservative approach and report the incident as the team’s re-
sponsibility if any error or change-point is detected—these are
themselves explanations of why the incident was routed to the
team.
5.3 The Model SelectorGiven an incident, the model selector maintains high accuracy by
carefully deciding between the RF and CPD+ algorithms. The model
selector has to:
Decide if the incident is “in-scope”.Operators know of incidents
(and components) that can be explicitly excluded from their team’s
responsibilities. Hence, they can specify incidents, components, and
keywords that are ‘out-of-scope’. Although optional, this can reduce
false positives. One example is an application that does not run on
a particular class of servers; any incident involving those servers is
unrelated. If PhyNet has passed the responsibility of a soon-to-be
decommissioned switch over to another team, that switch is also
out-of-scope. Example EXCLUDE commands are:
EXCLUDE switch = <regex>; orEXCLUDE TITLE = <regex>; orEXCLUDE BODY = <regex>;
3Anomaly detection algorithms (as opposed to CPD) e.g., OneClassSVM [66] had lower
accuracy (Table 1): 86% precision and 98% recall.
SIGCOMM ’20, August 10–14, 2020, Virtual Event, NY, USA
After applying exclusion rules, the model selector extracts com-
ponents from the incident description. This step is critical to avoid
using the team’s entire suite of monitoring data as input (see §5.1).
If the model selector cannot detect such a component, the incident
is marked as too broad in scope for either the RF or CPD+: it is likely
to be mis-classified—we revert to the provider’s existing incident
routing process.
Decide between RF, CPD+.We prefer to use the RF as our main
classifier because it is the most accurate (Table 1) and the most ex-
plainable — the CPD+ algorithm is only triggered on rare incidents
where the RF is expected to make mistakes.
We use meta-learning [65] to find “new” or rare incidents: we use
another ML model (an RF which is trained over “meta-features”).
Our meta-features are based on the method proposed in [58]: we
identify important words in the incident and their frequency. This
model is continuously re-trained so the model selector can adapt its
decisions to keep up with any changes to the team or its incidents.
Important note: The RF and the CPD+ algorithms used in our
framework can be replaced by other supervised and unsupervised
models respectively. Similarly, the RF model used in the model
selector can be replaced by other models (see §7). We chose these
models for our production system due to their explain-ability (the
RF), low overhead (CPD+), and high accuracy (both the RFs §7).
Operators can choose to replace any of these models depending on
their needs. We show an evaluation of other models in §7.
Thus, the end-to-end pipeline operates as follows: when a new
incident is created, the PhyNet Scout first extracts the relevant
components based on the configuration file. If it cannot identify
any specific components, incident routing falls back to the legacy
system. Otherwise, it constructs the model selector’s feature vector
from the incident text, and the model selector decides whether to
use the RF or the CPD+ algorithm. Finally, the Scout will construct
the feature vector for the chosen model, run the algorithm, and
report the classification results to the user.
6 IMPLEMENTATIONWe have deployed a Scout for the physical network (PhyNet) team
of Microsoft Azure. Azure’s production ML system, Resource Cen-
tral [23], manages the lifecycle of our models (the RF, CPD+, and the
Model selector) and serves predictions from them. Resource Central
consists of an offline (training) and an online (serving) component.
The offline component trains the models using Spark [72]. It is also
responsible for model re-training. The trained models are then put
in a highly available storage system and served to the online com-
ponent. This component provides a REST interface and is activated
once an incident is created in the provider’s incident management
system: the incident manager makes calls to the online component,
which runs the desired models and returns a prediction. If any of
the features are unavailable — e.g., if one of the monitoring sys-
tems we rely on also failed when the incident occurred — Resource
Central uses the mean of that feature in the training set for online
predictions. We will evaluate such failure scenarios in §7.
We have implemented a prototype of the Scout framework in
Python. The configuration file of PhyNet’s Scout describes three
types of components: server, switch, and cluster and twelve types
of monitoring data (listed in Table 2).
Each call to the Scout (consisting of pulling the relevant moni-
toring data, constructing features, and running the inference) takes
1.79 ± 0.85 minutes — negligible compared to the time operators
spend investigating incidents (those not resolved automatically).
Overall, the online pipeline and offline pipeline consist of 4124
and 5000 lines of code respectively. To facilitate what-if analysis,
we do not take action based on the output of the Scout but rather
observe what would have happened if it was used for routing deci-
sions.
7 EVALUATIONData: We use 9 months of incidents from Microsoft Azure. Each
data point describes an incident as, (𝑥𝑖 , 𝑦𝑖 ), where 𝑥𝑖 is a featurevector and 𝑦𝑖 is a label: 0 if PhyNet resolved the incident and 1
otherwise. We use a look-back time (T) of two hours (unless noted
otherwise) to construct 𝑥𝑖 . We also have a log of how each incident
was handled by operators in the absence of our system (see §3). We
remove all incidents that were automatically resolved and further
focus on incidents where we can extract at least one component.
As mentioned in §5.3, both of these types of incidents use the
legacy incident routing infrastructure. Note that excluding incidents
without a component means that the distribution of incidents used
in our evaluations is slightly different from that of §3.
Training and test sets:We randomly split the data into a training
and a test set. To avoid class imbalance [40] (most-incidents are
not PhyNet’s responsibility), we only use 35% of the non-PhyNet
incidents in the training set (the rest are in the test set). We split
and use half the PhyNet incidents for training. We also show results
for time-based splits in §7.3.
Accuracy Metrics:We use several such metrics:
Precision: The trustworthiness of the Scout’s output. A precision
of 90% implies the Scout is correct 90% of the time when it says
PhyNet is responsible.
Recall: The portion of PhyNet incidents the Scout finds. A recall of
90% implies the Scout can identify 90% of the incidents for which
PhyNet was responsible.
F1-score [32]: The harmonic mean of the algorithm’s precision and
recall — for measuring overall accuracy.
Metrics comparing Scouts to the baseline: We also define met-
rics that show the benefits of the Scout over the existing baseline.
We first describe this baseline in more detail and then define these
metrics:
Baseline: We use the operator’s existing incident routing process —
incident routing without Scout’s involvement — as our baseline. Our
discussion in section §3 describe the incident routing problem withthesemechanisms in place: operators use run-books, past-experience,
CDF
0.2 0.4 0.6 0.8 1.0
0.2
0.4
0.6
0.8
1.0
Fraction of total investigation time
0.00.0
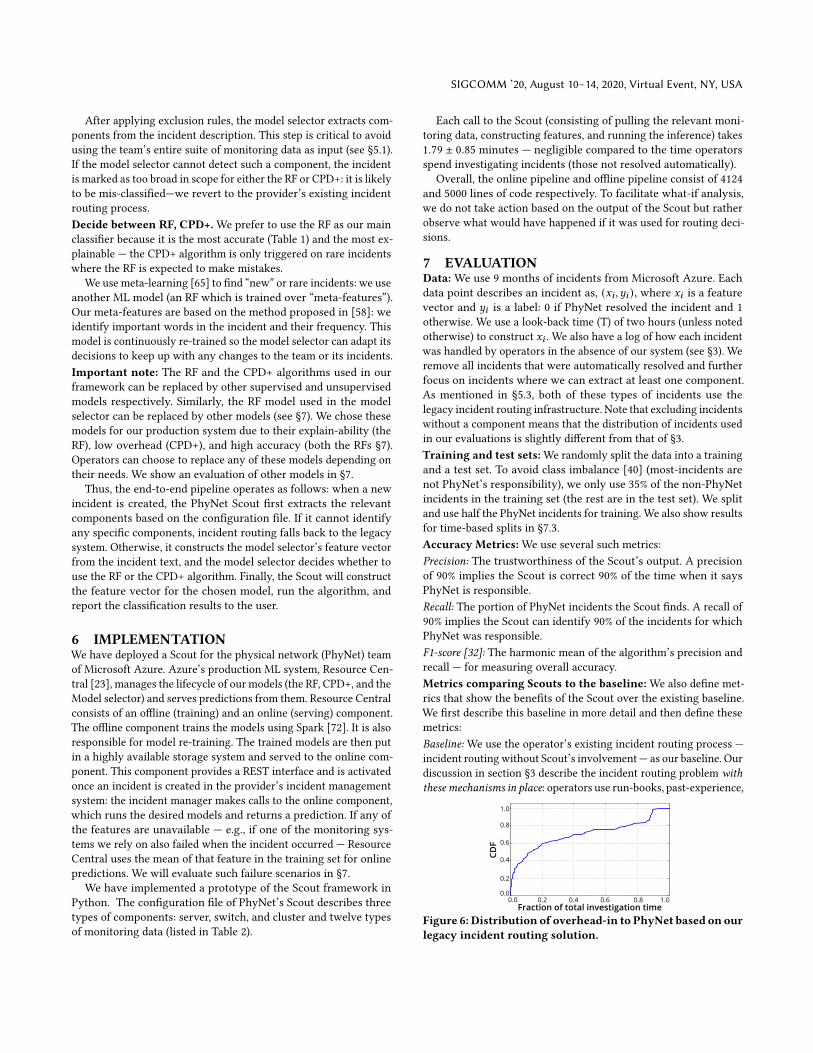
Figure 6: Distribution of overhead-in to PhyNet based on ourlegacy incident routing solution.

SIGCOMM ’20, August 10–14, 2020, Virtual Event, NY, USA Gao et al.
Data set Description
Ping statistics [34] Data from a monitoring system that periodically records latency between pairs of servers in the DC.
Link-level drop statistics Data from a diagnosis system that identifies links dropping packets [64].
Switch-level drop statistics Data from a diagnosis system that identifies switches dropping packets [64].
Canaries Data from “canary” VMs which run on every rack in the DC and test reachability to the Internet on commonly
used (reserved) ports. These VMs are also routinely used to test new software deployments [3].
Device reboots Records of when a VM, host, or a switch is rebooted.
Link loss status Data from counters that indicate the packet loss rate on a switch port.
Packet corruption rate (FCS) Data from a system that periodically checks the loss rate (due to corruption) on a link and reports an error if it
is above an operator specified threshold.
SNMP [20] and Syslogs [28] Data from standard network monitoring systems.
PFC counters Periodic counts of priority flow control (PFC) messages sent by RDMA-enabled switches.
Interface counters Number of packets dropped on a switch interface.
Temperature The temperature of each component (e.g., ASIC) of the switch or server.
CPU usage The CPU-usage on the device.
Table 2: Data sets used in PhyNet Scout.
and a natural language processing (NLP)-based recommendation
system.
The NLP-based system is a multi-class classifier that only takes
the incident description as input. It constructs features from the
incident description using the approach of [31]. The classifier pro-
duces a ranked list (along with categorical — high, medium, and low
— confidence scores) as a recommendation to the operator. This sys-
tem has high precision but low recall (Table 1). This is, in part, due
to suffering from the challenges described in §1. In addition, (a) the
text of the incident often describes the symptoms observed but does
not reflect the actual state of the network’s components; (b) the
text of the incident is often noisy — it contains logs of conversation
which often lead the ML model astray.
Our metrics compare Scouts to the current state of incident
routing (with the above mechanisms in place):
Gain: the benefit (in investigation time) the Scout offers. This is
measured as gain-in — time saved by routing incidents directly
to the team when it is responsible; and gain-out — time saved by
routing incidents away from the team when it is not responsible.
We measure these times as a fraction of the total investigation time.
Overhead: the amount of time wasted due to the Scout’s mistakes.
We again break overhead into overhead-out — the overhead of send-
ing incidents out to other teams by mistake; and overhead-in —
the overhead of sending incidents to the team itself by mistake.
Sadly, we do not have ground truth to measure overhead directly.
To estimate overhead-in, we first build the distribution of the over-
head of mis-routings to PhyNet using the baseline (Figure 6). We
then, using standard probability theory and assuming incidents are
independent and identically distributed, calculate the distribution
of our system’s overhead. We cannot estimate overhead-out: the
multitude of teams the incident can be sent to and the differences
in their investigation times make any approximation unrealistic.
We present error-out instead: the fraction of incidents mistakenly
sent to other teams.
7.1 Benefit of the PhyNet ScoutOur Scout’s precision is 97.5%, and recall 97.7% leading to an F-1
score of 0.98. In contrast, today, the precision of the provider’s inci-
dent routing system is 87.2%, with a recall of 91.9% and a resulting
F-1 score of 0.89.
Gain-InBest possible gainOverhead-in
Fraction of investigation time (%)(a)
CDF
0.0
0.2
0.4
0.6
0.8
1.0 1.0
Gain-outBest possible gain Error out : 1.7%
0.0
0.2
0.4
0.6
0.8
Fraction of investigation time (%)(b)
1000 20 40 60 801000 20 40 60 80
Figure 7: Gain/overhead for mis-routed incidents: (a)gain/overhead in (b) gain/error out.
The PhyNet Scout significantly reduces the investigation time
of mis-routed incidents with little additional overhead (Figure 7).
It closely mimics a perfect gate-keeper: in the median, the gap
between our Scout and one with 100% accuracy is less than 5%.
For those incidents that were already correctly routed (no oppor-
tunity for gain) our Scout correctly classifies 98.9% (no overhead).
Even at the 99.5𝑡ℎ percentile of the overhead distribution the Scout’s
overhead remains below 7.5%: much lower than the gain in the case
of mis-routed incidents. This overhead is an upper bound on what
we expect to see in practice: we use mis-routed incidents (typically
harder to diagnose compared to these correctly routed incidents)
to approximate overhead.
7.2 Analysis of (Mis-)PredictionsThe Scout can correctly classify many, previously mis-routed, inci-
dents. For example, in one instance, VMs in a cluster were crashing
because they could not connect to storage. The incident was first
sent to the storage team — it was created by their watchdogs. Stor-
age engineers guessed the issue was caused by a networking prob-
lem and sent the incident to PhyNet, which found a configuration
change on the ToR switch that caused it to reboot and interrupt
Time(a)
F-1
scor
e
0.40.5
0.6
0.7
0.8
0.9
1.0
Conservative one class SVM Aggressive one class SVM
AdaboostBag of words
0.4
0.5
0.6
0.7
0.8
0.9
1.0
Time(b)
10-01
11-01
12-01
01-01
02-01
09-01
10-01
11-01
12-01
01-01
02-01
09-01
Figure 8: Comparing decider algorithms with: (a) 10 day and(b) 60 day retraining intervals.
SIGCOMM ’20, August 10–14, 2020, Virtual Event, NY, USA
# of monitoring systems removed
F-1
scor
e
Worst caseAverage case
1 2 3 4 5 6 70.860.88
0.90
0.92
0.940.96
0.981.00
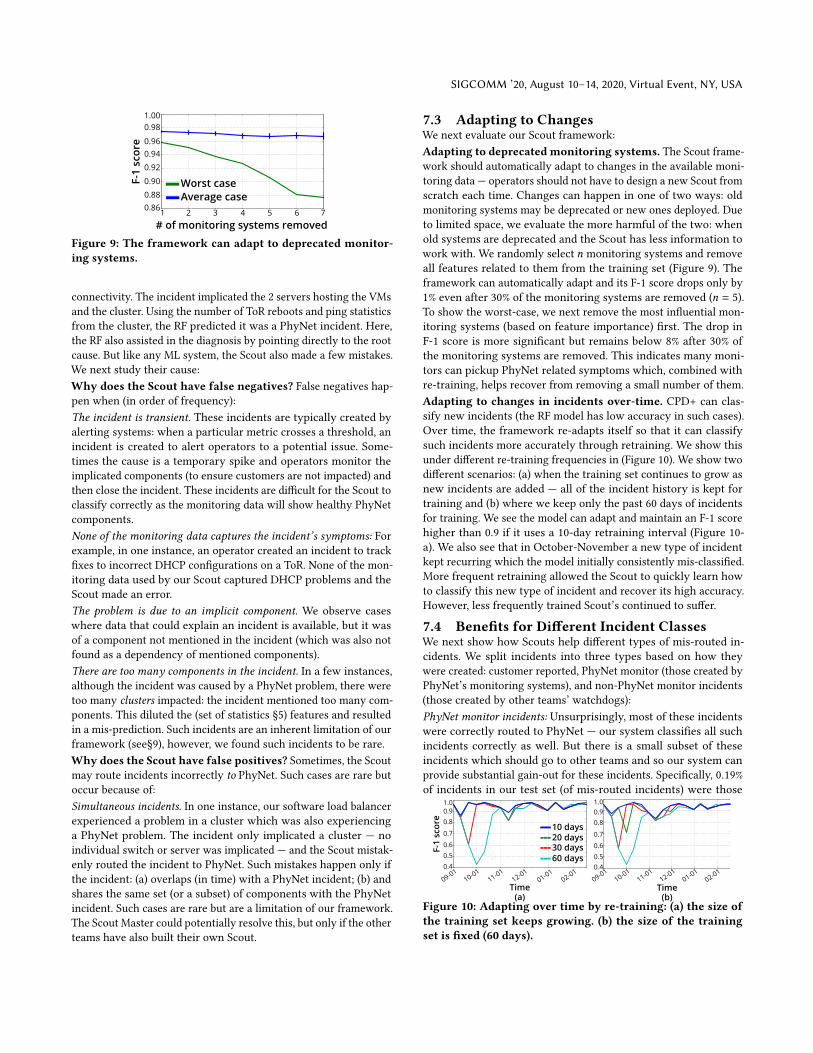
Figure 9: The framework can adapt to deprecated monitor-ing systems.
connectivity. The incident implicated the 2 servers hosting the VMs
and the cluster. Using the number of ToR reboots and ping statistics
from the cluster, the RF predicted it was a PhyNet incident. Here,
the RF also assisted in the diagnosis by pointing directly to the root
cause. But like any ML system, the Scout also made a few mistakes.
We next study their cause:
Why does the Scout have false negatives? False negatives hap-pen when (in order of frequency):
The incident is transient. These incidents are typically created by
alerting systems: when a particular metric crosses a threshold, an
incident is created to alert operators to a potential issue. Some-
times the cause is a temporary spike and operators monitor the
implicated components (to ensure customers are not impacted) and
then close the incident. These incidents are difficult for the Scout to
classify correctly as the monitoring data will show healthy PhyNet
components.
None of the monitoring data captures the incident’s symptoms: Forexample, in one instance, an operator created an incident to track
fixes to incorrect DHCP configurations on a ToR. None of the mon-
itoring data used by our Scout captured DHCP problems and the
Scout made an error.
The problem is due to an implicit component. We observe cases
where data that could explain an incident is available, but it was
of a component not mentioned in the incident (which was also not
found as a dependency of mentioned components).
There are too many components in the incident. In a few instances,
although the incident was caused by a PhyNet problem, there were
too many clusters impacted: the incident mentioned too many com-
ponents. This diluted the (set of statistics §5) features and resulted
in a mis-prediction. Such incidents are an inherent limitation of our
framework (see§9), however, we found such incidents to be rare.
Why does the Scout have false positives? Sometimes, the Scout
may route incidents incorrectly to PhyNet. Such cases are rare but
occur because of:
Simultaneous incidents. In one instance, our software load balancer
experienced a problem in a cluster which was also experiencing
a PhyNet problem. The incident only implicated a cluster — no
individual switch or server was implicated — and the Scout mistak-
enly routed the incident to PhyNet. Such mistakes happen only if
the incident: (a) overlaps (in time) with a PhyNet incident; (b) and
shares the same set (or a subset) of components with the PhyNet
incident. Such cases are rare but are a limitation of our framework.
The Scout Master could potentially resolve this, but only if the other
teams have also built their own Scout.
7.3 Adapting to ChangesWe next evaluate our Scout framework:
Adapting to deprecated monitoring systems. The Scout frame-
work should automatically adapt to changes in the available moni-
toring data — operators should not have to design a new Scout from
scratch each time. Changes can happen in one of two ways: old
monitoring systems may be deprecated or new ones deployed. Due
to limited space, we evaluate the more harmful of the two: when
old systems are deprecated and the Scout has less information to
work with. We randomly select 𝑛 monitoring systems and remove
all features related to them from the training set (Figure 9). The
framework can automatically adapt and its F-1 score drops only by
1% even after 30% of the monitoring systems are removed (𝑛 = 5).
To show the worst-case, we next remove the most influential mon-
itoring systems (based on feature importance) first. The drop in
F-1 score is more significant but remains below 8% after 30% of
the monitoring systems are removed. This indicates many moni-
tors can pickup PhyNet related symptoms which, combined with
re-training, helps recover from removing a small number of them.
Adapting to changes in incidents over-time. CPD+ can clas-
sify new incidents (the RF model has low accuracy in such cases).
Over time, the framework re-adapts itself so that it can classify
such incidents more accurately through retraining. We show this
under different re-training frequencies in (Figure 10). We show two
different scenarios: (a) when the training set continues to grow as
new incidents are added — all of the incident history is kept for
training and (b) where we keep only the past 60 days of incidents
for training. We see the model can adapt and maintain an F-1 score
higher than 0.9 if it uses a 10-day retraining interval (Figure 10-
a). We also see that in October-November a new type of incident
kept recurring which the model initially consistently mis-classified.
More frequent retraining allowed the Scout to quickly learn how
to classify this new type of incident and recover its high accuracy.
However, less frequently trained Scout’s continued to suffer.
7.4 Benefits for Different Incident ClassesWe next show how Scouts help different types of mis-routed in-
cidents. We split incidents into three types based on how they
were created: customer reported, PhyNet monitor (those created by
PhyNet’s monitoring systems), and non-PhyNet monitor incidents
(those created by other teams’ watchdogs):
PhyNet monitor incidents: Unsurprisingly, most of these incidents
were correctly routed to PhyNet — our system classifies all such
incidents correctly as well. But there is a small subset of these
incidents which should go to other teams and so our system can
provide substantial gain-out for these incidents. Specifically, 0.19%
of incidents in our test set (of mis-routed incidents) were those
Time10-01
F-1
scor
e
0.40.50.6
0.7
0.80.91.0
10 days20 days30 days60 days
0.40.50.6
0.7
0.80.91.0
(a)Time
(b)
09-01
11-01
12-01
01-01
10-0109
-0111
-0112
-0101
-0102
-0102
-01
Figure 10: Adapting over time by re-training: (a) the size ofthe training set keeps growing. (b) the size of the trainingset is fixed (60 days).
SIGCOMM ’20, August 10–14, 2020, Virtual Event, NY, USA Gao et al.
Gain-InBest possible gainOverhead-in
Fraction of investigation time (%)(a)
0.0
0.2
0.4
0.6
0.8
1.0
CDF
Gain-outBest possible gainError-out: 3.06%
0.0
0.2
0.4
0.6
0.8
1.0
Fraction of investigation time (%)(b)
20 40 60 800 100 20 40 60 800 100
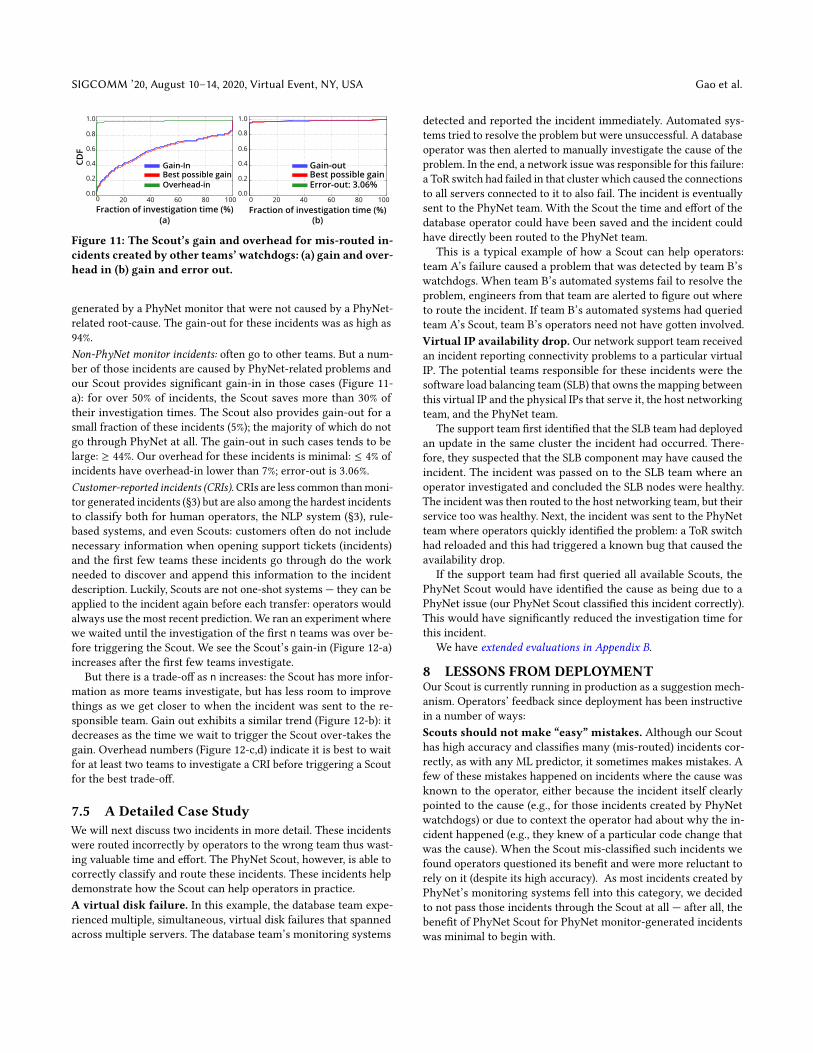
Figure 11: The Scout’s gain and overhead for mis-routed in-cidents created by other teams’ watchdogs: (a) gain and over-head in (b) gain and error out.
generated by a PhyNet monitor that were not caused by a PhyNet-
related root-cause. The gain-out for these incidents was as high as
94%.
Non-PhyNet monitor incidents: often go to other teams. But a num-
ber of those incidents are caused by PhyNet-related problems and
our Scout provides significant gain-in in those cases (Figure 11-
a): for over 50% of incidents, the Scout saves more than 30% of
their investigation times. The Scout also provides gain-out for a
small fraction of these incidents (5%); the majority of which do not
go through PhyNet at all. The gain-out in such cases tends to be
large: ≥ 44%. Our overhead for these incidents is minimal: ≤ 4% of
incidents have overhead-in lower than 7%; error-out is 3.06%.
Customer-reported incidents (CRIs).CRIs are less common thanmoni-
tor generated incidents (§3) but are also among the hardest incidents
to classify both for human operators, the NLP system (§3), rule-
based systems, and even Scouts: customers often do not include
necessary information when opening support tickets (incidents)
and the first few teams these incidents go through do the work
needed to discover and append this information to the incident
description. Luckily, Scouts are not one-shot systems — they can be
applied to the incident again before each transfer: operators would
always use the most recent prediction. We ran an experiment where
we waited until the investigation of the first n teams was over be-
fore triggering the Scout. We see the Scout’s gain-in (Figure 12-a)
increases after the first few teams investigate.
But there is a trade-off as n increases: the Scout has more infor-
mation as more teams investigate, but has less room to improve
things as we get closer to when the incident was sent to the re-
sponsible team. Gain out exhibits a similar trend (Figure 12-b): it
decreases as the time we wait to trigger the Scout over-takes the
gain. Overhead numbers (Figure 12-c,d) indicate it is best to wait
for at least two teams to investigate a CRI before triggering a Scout
for the best trade-off.
7.5 A Detailed Case StudyWe will next discuss two incidents in more detail. These incidents
were routed incorrectly by operators to the wrong team thus wast-
ing valuable time and effort. The PhyNet Scout, however, is able to
correctly classify and route these incidents. These incidents help
demonstrate how the Scout can help operators in practice.
A virtual disk failure. In this example, the database team expe-
rienced multiple, simultaneous, virtual disk failures that spanned
across multiple servers. The database team’s monitoring systems
detected and reported the incident immediately. Automated sys-
tems tried to resolve the problem but were unsuccessful. A database
operator was then alerted to manually investigate the cause of the
problem. In the end, a network issue was responsible for this failure:
a ToR switch had failed in that cluster which caused the connections
to all servers connected to it to also fail. The incident is eventually
sent to the PhyNet team. With the Scout the time and effort of the
database operator could have been saved and the incident could
have directly been routed to the PhyNet team.
This is a typical example of how a Scout can help operators:
team A’s failure caused a problem that was detected by team B’s
watchdogs. When team B’s automated systems fail to resolve the
problem, engineers from that team are alerted to figure out where
to route the incident. If team B’s automated systems had queried
team A’s Scout, team B’s operators need not have gotten involved.
Virtual IP availability drop. Our network support team received
an incident reporting connectivity problems to a particular virtual
IP. The potential teams responsible for these incidents were the
software load balancing team (SLB) that owns the mapping between
this virtual IP and the physical IPs that serve it, the host networking
team, and the PhyNet team.
The support team first identified that the SLB team had deployed
an update in the same cluster the incident had occurred. There-
fore, they suspected that the SLB component may have caused the
incident. The incident was passed on to the SLB team where an
operator investigated and concluded the SLB nodes were healthy.
The incident was then routed to the host networking team, but their
service too was healthy. Next, the incident was sent to the PhyNet
team where operators quickly identified the problem: a ToR switch
had reloaded and this had triggered a known bug that caused the
availability drop.
If the support team had first queried all available Scouts, the
PhyNet Scout would have identified the cause as being due to a
PhyNet issue (our PhyNet Scout classified this incident correctly).
This would have significantly reduced the investigation time for
this incident.
We have extended evaluations in Appendix B.
8 LESSONS FROM DEPLOYMENTOur Scout is currently running in production as a suggestion mech-
anism. Operators’ feedback since deployment has been instructive
in a number of ways:
Scouts should not make “easy” mistakes. Although our Scout
has high accuracy and classifies many (mis-routed) incidents cor-
rectly, as with any ML predictor, it sometimes makes mistakes. A
few of these mistakes happened on incidents where the cause was
known to the operator, either because the incident itself clearly
pointed to the cause (e.g., for those incidents created by PhyNet
watchdogs) or due to context the operator had about why the in-
cident happened (e.g., they knew of a particular code change that
was the cause). When the Scout mis-classified such incidents we
found operators questioned its benefit and were more reluctant to
rely on it (despite its high accuracy). As most incidents created by
PhyNet’s monitoring systems fell into this category, we decided
to not pass those incidents through the Scout at all — after all, the
benefit of PhyNet Scout for PhyNet monitor-generated incidents
was minimal to begin with.

SIGCOMM ’20, August 10–14, 2020, Virtual Event, NY, USA
Max 99th percentile 95th percentile Average Error-out
Number of team investigations (a)
Number of team investigations (b)
Gai
n-ou
t
Number of team investigations (c)
Ove
rhea
d-in
2 4 6 8 100.0
0.2
0.4
0.6
0.8
1.0
0.6
0.8
1.0
Erro
r-ou
t
Gai
n-in
2 4 6 8 100.0
0.2
0.4
0.6
0.8
1.0
2 4 6 8 100.0
0.2
0.4
0.6
0.8
1.0
Number of team investigations (d)
0.0
0.2
0.4
2 3 4 5 61
Figure 12: (a) gain-in, (b) gain-out, (c) overhead-in, and (d) error-out for CRIs as more teams investigate.
Explanations are crucial. In earlier versions of the Scout we only
reported the decision along with the confidence. Operators had a
hard time accepting the output because of the lack of explanation.
We thus augmented incidents with an explanation: we listed all
the components found in the incident and the monitoring data the
Scout used. For those incidents which the Scout classified as being
PhyNet’s responsibility, we used the method of [57] to describe
which features pointed to the problem being caused by PhyNet.
Some features help ML but confuse operators. One of our fea-tures is the number of components of each type (§5). Operators find
it confusing when these features are part of the explanation for a
decision because they are not part of their routine investigation
process: the model finds them useful but operators do not.
Operators do not have time to read the fine-print. We care-
fully studied the Scout, its mistakes, and its confidence scores be-
fore deploying it in production. We included these findings as part
of the recommendation to the operators. For example, an incident
classified as not being PhyNet’s responsibility would come with
the following recommendation: “The PhyNet Scout investigated
[list of components] and suggests this is not a PhyNet incident.Its confidence is [confidence]. We recommend not using this out-
put if confidence is below 0.8. Attention: known false negatives
occur for transient issues, when an incident is created after the
problem has already been resolved, and if the incident is too broad
in scope.” However, we found operators did not read this fine-print
and complained of mistakes when confidence was around 0.5 or
when transient incidents occurred.
Adding new features can be slow. The first step in building any
supervised model is to create a data set for training. To enable this,
early on (9 months in advance), we extended the retention period
of PhyNet’s monitoring data. To add new data sets we often have
to wait until there is enough (either because we had to extend the
retention period, or because the system is new) before we can add
it to the feature-set.
Down-weighting old incidents.Over time, many of the incidents
become “old” or obsolete, as the systems they pertain to evolve or
are deprecated. Therefore, in our deployed Scout we down-weight
incidents in proportion to how long ago they occurred.
Learning from past mistakes. To further improve the Scout, in
our production deployment we also found it useful to increase the
weight of incidents that were mis-classified in the past in future
re-training of the model.
Not all incidents have the right label.Our incidentmanagement
system records the team owning the incident when the root cause
was discovered and the incident was resolved. We use this field
to label the incidents for evaluating our system. Our analysis of
the mistakes our system made in production showed that in some
cases this label can be incorrect: the team that closed the incident
is not the team that found the root cause. This is often because
operators do not officially transfer the incident (in which case the
label is left unchanged). Such mislabeling can cause problems for
the Scout over time as many of these incidents were mistakenly
marked as mis-classifications and up-weighted for future training:
the model would emphasize learning the wrong label in the future.
This problem can be mitigated by de-noising techniques and by
analysis of the incident text (the text of the incident often does
reveal the correct label).
Concept drift. While the use of the CPD+ algorithm helps the
Scout be somewhat resilient to new incidents. Concept drift prob-
lems do rarely occur in practice: during the last two years, there
were a few weeks (despite frequent retraining) where the accuracy
of the Scout dropped down to 50%. This is a known problem in the
machine learning community and we are working on exploring
known solutions for addressing such problems.
9 DISCUSSIONScouts can significantly reduce investigation times (see §3,§7). How-
ever, like any other system, it is important to know when not torely on them:
Scouts route incidents, they do not trigger them. “Given the
high accuracy of Scouts, can they also periodically check team
health?” Sadly, no: (1) incidents provide valuable information that
enables routing — without them the accuracy of the Scout drops
significantly; (2) the overhead of running such a solution periodi-
cally would be unacceptable because the Scout would periodically
have to process all the monitoring data the team collects for each
and every device.
“Specific” incidents are easier to classify. Scouts identify whichcomponents to investigate from the incident and limit the scope
of their investigations to those components. Incidents that are too
broad in Scope are harder to classify because of feature dilution.
Such cases tend to be high priority incidents — all teams have toget involved (see §3).
Simultaneous incidents with over-lapping components areharder to classify. If two incidents implicate the same set of com-
ponents and one is caused by the Scout’s team, the Scout may
struggle to differentiate them (see §7). This is a very specific and
relatively rare subset of the broader issue of concurrent incidents.
Operators can improve the starter Scout the framework cre-ates. Our framework creates a starter Scouts. Operators can im-
prove this Scout by adding rules they have learned to work well in
SIGCOMM ’20, August 10–14, 2020, Virtual Event, NY, USA Gao et al.
practice. Similarly, operators familiar with ML and statistics can
add more specialized features to this starter Scout to improve its ac-
curacy. For teams whose components have complex dependencies
with other teams’ components, the accuracy of the Scout created by
the framework may not be high enough — in such cases the team
may be better off building their own.
The framework is only as good as the data input. Like all
ML-based solutions, our framework suffers from the “garbage-in-
garbage out principle” [44]: if none of the input data is predictive ofthe team’s culpability or if it is too noisy, the framework will not
produce an accurate Scout. Operators use the same data to diagnose
incidents when the team is responsible: this should be unlikely.
Some teamsmay not have data for training.GDPR [6] imposes
constraints on what data operators can collect and store which
impacts their ability to use ML [16] — operators may need to use
non-ML-based techniques for certain teams.
Not all teams should build a Scout. Not all teams experience
mis-routing in the same degree. Teams with few dependencies, for
example, do not experience mis-routing as often as a team such as
PhyNet, which is a dependency for almost all network-dependant
services. Similarly, teams where problems are less ambiguous are
also less prone to mis-routing, e.g., DNS issues tend to be routed
directly to the DNS team. This is also another reason that we built
a team-by-team solution: it helps prioritize teams who contribute
most to the mis-routing problem.
The framework requires correct annotations.We do not sup-
port any automatic validation of annotations. This is a subject of
future work.
Potential drawbacks of the team-by-team approach. Thereare two potential drawbacks to our Scout design. The first draw-
back is Scout Master cannot route an incident when all the Scouts
returns “no.” This may be due to false negatives, or because the
team responsible for the incident has not yet built a Scout. The
second drawback is some teams have complex dependencies, it may
not be possible to carve out a clear boundary and build completely
isolated Scouts for those teams. For example, if team A and team B
depend on each other, they may need to cooperate when building
their Scouts and use signals from each other’s monitoring systems.
We believe the pros outweigh the cons.
The side-effect of aggregating sub-components. In order to
maintain a fixed size feature vector (as necessitated by our ML
components) the Scout framework aggregates monitoring data
from components of the same type and computes a set of statistics
over the resulting data set. In some cases, this may dilute the impact
of a problem with an individual device which can result in mis-
classifications. We observe, however, that the Scout accuracy is
high irrespective of this design choice.
Alternative design. In the design of our Scout framework, we had
to find a solution to the fact that each incident can implicate an
unknown number of components (we do not know this number in
advance). Our solution uses aggregate statistics across components
with the same type to create a fixed-sized feature vector at all
times. However, two other designs are possible: (a) one can consider
all devices in the data center for each incident — this results in
an enormous feature-vector and would result in lower accuracy
due to the curse of dimensionality; (b) one can build a separate
classifier per type of component and check the health of each device
independently — this was infeasible in our case as we did not have a
data set with labels for each device (many incidents did not contain
the name of the device which was identified as the root cause).
10 RELATEDWORKMitigation tools [14, 26, 27, 30, 37, 38, 42, 43, 45, 48–50, 53,55, 59, 62, 63, 67, 69, 74–76]. Many automated diagnosis tools
have been built over the years [14, 26, 27, 30, 37, 38, 42, 43, 45, 48–
50, 53, 55, 59, 62, 63, 67, 69, 74–76]. These works aim at finding a
single root cause. But, there are some incidents where they fail
(packet captures from inside the network may be necessary [70]).
Incidents are an indication that existing diagnosis systems have
failed to automatically mitigate the problem. Many diagnosis sys-
tems require a human expert to interpret their findings [70]: the
support teams do not have the necessary expertise. There are many
instances where the network is not responsible for the problem –
these systems are too heavy-weight for solving incident routing.
Application-specific incident routers [15, 17, 29, 71, 73]. Be-cause they are heavily tied to the application semantics, these works
fail at fully solving the incident routing problem: they cannot op-
erate at DC-scale because operators would have to run (and con-
figure) an instance of these solutions per each application-type.
Also, [15, 71, 73] all focus on identifying whether the network, the
host, or the remote service is responsible. Cloud providers have mul-
tiple engineering groups in each category (e.g., our cloud has 100
teams in networking) and the broader problem remains unsolved.
Work in software engineering [13, 35, 39, 41, 60] The work
[13, 41]. try to find the right engineer to fix a bug during software
development and use either NLP-based text analysis or statistical-
based ticket transition graphs. Other work: [39, 60] analyzes the
source code. None can be applied to the incident routing problem
where bugs are not always confined to the source code but can be
due to congestion, high CPU utilization, or customer mistakes.
Measurement studies on network incidents [19, 21, 31, 33, 58,61]. The work [21] describes the extent of incident mis-routings in
the cloud, while our work focuses on the reasons why they happen.
Other studies characterize the different types of problems observed
in today’s clouds. These works provide useful insights that help
build better Scouts.
11 CONCLUSIONWe investigate incident routing in the cloud and propose a dis-
tributed, Scout-based solution. Scouts are team-specialized gate-
keepers. We show that even a single Scout can significantly reduce
investigation times.
Ethics: This work does not raise any ethical issues.
ACKNOWLEDGMENTSThe authors would like to thank Sumit Kumar, Rituparna Paul,
David Brumley, Akash Kulkarni, Ashay Krishna, Muqeet Mukhtar,
Lihua Yuan, and Geoff Outhred for their help with deployment of
the PhyNet Scout and their useful feedback. We would also like
to thank shepherd and SIGCOMM reviewers for their insightful
comments. Jiaqi Gao was supported in this project by a Microsoft
internship as well as by the NSF grant CNS-1834263. Nofel Yaseen
was supported, in part, by CNS-1845749.
SIGCOMM ’20, August 10–14, 2020, Virtual Event, NY, USA
REFERENCES[1] Adaboost. https://scikit-learn.org/stable/modules/generated/sklearn.ensemble.
AdaBoostClassifier.html.
[2] Azure cloud incidents. https://azure.microsoft.com/en-us/status/history/.
[3] Canary analysis: Lessons learned and best practicies from google
and waze. https://cloud.google.com/blog/products/devops-sre/
canary-analysis-lessons-learned-and-best-practices-from-google-and-waze.
[4] The curse of dimensionality in classification. https://www.visiondummy.com/
2014/04/curse-dimensionality-affect-classification/.
[5] Gaussian Naive Bayes. https://scikit-learn.org/stable/modules/generated/sklearn.
naive_bayes.GaussianNB.html.
[6] General data protection regulation. https://ec.europa.eu/info/law/law-topic/
data-protection_en.
[7] Google cloud incidents. https://status.cloud.google.com/summary.
[8] K nearest neighbors. https://scikit-learn.org/stable/modules/generated/sklearn.
neighbors.KNeighborsClassifier.html#sklearn.neighbors.KNeighborsClassifier.
[9] Neural Networks. https://scikit-learn.org/stable/modules/generated/sklearn.
neural_network.MLPClassifier.html.
[10] Quadratic Discriminant Analysis. https://scikit-learn.org/stable/modules/
generated/sklearn.discriminant_analysis.QuadraticDiscriminantAnalysis.html.
[11] Agarwal, B., Bhagwan, R., Das, T., Eswaran, S., Padmanabhan, V. N., and
Voelker, G. M. Netprints: Diagnosing home network misconfigurations using
shared knowledge. In NSDI (2009), vol. 9, pp. 349–364.[12] Alipourfard, O., Gao, J., Koenig, J., Harshaw, C., Vahdat, A., and Yu, M.
Risk-based planning for evolving data center networks. Symposium on OperatingSystems Principles (SOSP) (2019).
[13] Anvik, J., Hiew, L., and Murphy, G. C. Who should fix this bug? In Proceedingsof the 28th international conference on Software engineering (2006), ACM, pp. 361–
370.
[14] Arzani, B., Ciraci, S., Chamon, L., Zhu, Y., Liu, H., Padhye, J., Outhred, G.,
and Loo, B. T. Closing the network diagnostics gap with vigil. In Proceedings ofthe SIGCOMM Posters and Demos (2017), ACM, pp. 40–42.
[15] Arzani, B., Ciraci, S., Loo, B. T., Schuster, A., and Outhred, G. Taking the
blame game out of data centers operations with netpoirot. In Proceedings of the2016 ACM SIGCOMM Conference (2016), ACM, pp. 440–453.
[16] Arzani, B., Ciraci, S., Saroiu, S., Wolman, A., Stokes, J., Outhred, G., and
Diwu, L. Madeye: Scalable and privacy-preserving compromise detection in the
cloud. In 17th USENIX Symposium on Networked Systems Design and Implementa-tion (NSDI 20) (2020), USENIX Association.
[17] Bahl, P., Chandra, R., Greenberg, A., Kandula, S., Maltz, D. A., and Zhang,
M. Towards highly reliable enterprise network services via inference of multi-
level dependencies. In ACM SIGCOMM Computer Communication Review (2007),
vol. 37, ACM, pp. 13–24.
[18] Bekerman, D., Shapira, B., Rokach, L., and Bar, A. Unknownmalware detection
using network traffic classification. In Communications and Network Security(CNS), 2015 IEEE Conference on (2015), IEEE, pp. 134–142.
[19] Benson, T., Sahu, S., Akella, A., and Shaikh, A. A first look at problems in the
cloud. HotCloud 10 (2010), 15.[20] Case, J. D., Fedor, M., Schoffstall, M. L., and Davin, J. Simple network
management protocol (snmp). Tech. rep., 1990.
[21] Chen, J., He, X., Lin, Q., Xu, Y., Zhang, H., Hao, D., Gao, F., Xu, Z., Dang,
Y., and Zhang, D. An empirical investigation of incident triage for online
service systems. In Proceedings of the 41st International Conference on SoftwareEngineering: Software Engineering in Practice (2019), IEEE Press, pp. 111–120.
[22] Chen,M., Zheng, A. X., Lloyd, J., Jordan,M. I., and Brewer, E. Failure diagnosis
using decision trees. In International Conference on Autonomic Computing, 2004.Proceedings. (2004), IEEE, pp. 36–43.
[23] Cortez, E., Bonde, A., Muzio, A., Russinovich, M., Fontoura, M., and Bian-
chini, R. Resource central: Understanding and predicting workloads for improved
resource management in large cloud platforms. In Proceedings of the 26th Sympo-sium on Operating Systems Principles (2017), ACM, pp. 153–167.
[24] Cusack, G., Michel, O., and Keller, E. Machine learning-based detection of
ransomware using sdn. In Proceedings of the 2018 ACM International Workshop onSecurity in Software Defined Networks & Network Function Virtualization (2018),
ACM, pp. 1–6.
[25] Dimopoulos, G., Leontiadis, I., Barlet-Ros, P., Papagiannaki, K., and
Steenkiste, P. Identifying the root cause of video streaming issues on mo-
bile devices. In Proceedings of the 11th ACM Conference on Emerging NetworkingExperiments and Technologies (2015), ACM, p. 24.
[26] Duffield, N. Network tomography of binary network performance characteris-
tics. IEEE Transactions on Information Theory 52, 12 (2006), 5373–5388.[27] Duffield, N. G., Arya, V., Bellino, R., Friedman, T., Horowitz, J., Towsley, D.,
and Turletti, T. Network tomography from aggregate loss reports. PerformanceEvaluation 62, 1-4 (2005), 147–163.
[28] Gerhards, R. The syslog protocol. Tech. rep., 2009.
[29] Ghasemi, M., Benson, T., and Rexford, J. Rinc: Real-time inference-based
network diagnosis in the cloud. Princeton University (2015).
[30] Ghita, D., Argyraki, K., and Thiran, P. Toward accurate and practical network
tomography. ACM SIGOPS Operating Systems Review 47, 1 (2013), 22–26.[31] Gill, P., Jain, N., and Nagappan, N. Understanding network failures in data
centers: measurement, analysis, and implications. In ACM SIGCOMM ComputerCommunication Review (2011), vol. 41, ACM, pp. 350–361.
[32] Goutte, C., and Gaussier, E. A probabilistic interpretation of precision, re-
call and f-score, with implication for evaluation. In European Conference onInformation Retrieval (2005), Springer, pp. 345–359.
[33] Govindan, R., Minei, I., Kallahalla, M., Koley, B., and Vahdat, A. Evolve
or die: High-availability design principles drawn from googles network infras-
tructure. In Proceedings of the 2016 ACM SIGCOMM Conference (2016), ACM,
pp. 58–72.
[34] Guo, C., Yuan, L., Xiang, D., Dang, Y., Huang, R., Maltz, D., Liu, Z., Wang, V.,
Pang, B., Chen, H., et al. Pingmesh: A large-scale system for data center network
latency measurement and analysis. In ACM SIGCOMM Computer CommunicationReview (2015), vol. 45, ACM, pp. 139–152.
[35] Guo, P. J., Zimmermann, T., Nagappan, N., and Murphy, B. Not my bug! and
other reasons for software bug report reassignments. In Proceedings of the ACM2011 conference on Computer supported cooperative work (2011), ACM, pp. 395–404.
[36] Guyon, I., Chaabane, I., Escalante, H. J., Escalera, S., Jajetic, D., Lloyd, J. R.,
Macià, N., Ray, B., Romaszko, L., Sebag, M., et al. A brief review of the chalearn
automl challenge: any-time any-dataset learning without human intervention.
In Workshop on Automatic Machine Learning (2016), pp. 21–30.
[37] Heller, B., Scott, C., McKeown, N., Shenker, S., Wundsam, A., Zeng, H.,
Whitlock, S., Jeyakumar, V., Handigol, N., McCauley, J., et al. Leveraging
sdn layering to systematically troubleshoot networks. In Proceedings of the secondACM SIGCOMM workshop on Hot topics in software defined networking (2013),
ACM, pp. 37–42.
[38] Herodotou, H., Ding, B., Balakrishnan, S., Outhred, G., and Fitter, P.
Scalable near real-time failure localization of data center networks. In Proceedingsof the 20th ACM SIGKDD international conference on Knowledge discovery anddata mining (2014), ACM, pp. 1689–1698.
[39] Hovemeyer, D., and Pugh, W. Finding bugs is easy. Acm sigplan notices 39, 12(2004), 92–106.
[40] Japkowicz, N. The class imbalance problem: Significance and strategies. In Proc.of the Int’l Conf. on Artificial Intelligence (2000).
[41] Jeong, G., Kim, S., and Zimmermann, T. Improving bug triage with bug tossing
graphs. In Proceedings of the the 7th joint meeting of the European softwareengineering conference and the ACM SIGSOFT symposium on The foundations ofsoftware engineering (2009), ACM, pp. 111–120.
[42] Kandula, S., Katabi, D., and Vasseur, J.-P. Shrink: A tool for failure diagnosis
in ip networks. In Proceedings of the 2005 ACM SIGCOMM workshop on Miningnetwork data (2005), ACM, pp. 173–178.
[43] Katz-Bassett, E., Madhyastha, H. V., Adhikari, V. K., Scott, C., Sherry, J.,
Van Wesep, P., Anderson, T. E., and Krishnamurthy, A. Reverse traceroute.
In NSDI (2010), vol. 10, pp. 219–234.[44] Kim, Y., Huang, J., and Emery, S. Garbage in, garbage out: data collection, quality
assessment and reporting standards for social media data use in health research,
infodemiology and digital disease detection. Journal of medical Internet research18, 2 (2016), e41.
[45] Kompella, R. R., Yates, J., Greenberg, A., and Snoeren, A. C. Ip fault localization
via risk modeling. In Proceedings of the 2nd conference on Symposium on NetworkedSystems Design & Implementation-Volume 2 (2005), USENIX Association, pp. 57–
70.
[46] Kotthoff, L., Thornton, C., Hoos, H. H., Hutter, F., and Leyton-Brown, K.
Auto-weka 2.0: Automatic model selection and hyperparameter optimization in
weka. The Journal of Machine Learning Research 18, 1 (2017), 826–830.[47] Laskov, P., Düssel, P., Schäfer, C., and Rieck, K. Learning intrusion detection:
supervised or unsupervised? In International Conference on Image Analysis andProcessing (2005), Springer, pp. 50–57.
[48] Ma, L., He, T., Swami, A., Towsley, D., Leung, K. K., and Lowe, J. Node failure
localization via network tomography. In Proceedings of the 2014 Conference onInternet Measurement Conference (2014), ACM, pp. 195–208.
[49] Mahajan, R., Spring, N., Wetherall, D., and Anderson, T. User-level internet
path diagnosis. ACM SIGOPS Operating Systems Review 37, 5 (2003), 106–119.[50] Mathis, M., Heffner, J., O’neil, P., and Siemsen, P. Pathdiag: automated tcp
diagnosis. In International Conference on Passive and Active Network Measurement(2008), Springer, pp. 152–161.
[51] Matteson, D. S., and James, N. A. A nonparametric approach for multiple
change point analysis of multivariate data. Journal of the American StatisticalAssociation 109, 505 (2014), 334–345.
[52] Mogul, J., Goricanec, D., Pool, M., Shaikh, A., Koley, B., and Zhao, X. Expe-
riences with modeling network topologies at multiple levels of abstraction. In
17th USENIX Symposium on Networked Systems Design and Implementation (NSDI20) (2020).
[53] Mysore, R. N., Mahajan, R., Vahdat, A., and Varghese, G. Gestalt: Fast, unified
fault localization for networked systems. In USENIX Annual Technical Conference(2014), pp. 255–267.

SIGCOMM ’20, August 10–14, 2020, Virtual Event, NY, USA Gao et al.
[54] Myung, I. J. Tutorial on maximum likelihood estimation. Journal of mathematicalPsychology 47, 1 (2003), 90–100.
[55] Ogino, N., Kitahara, T., Arakawa, S., Hasegawa, G., and Murata, M. Decen-
tralized boolean network tomography based on network partitioning. In NetworkOperations and Management Symposium (NOMS), 2016 IEEE/IFIP (2016), IEEE,
pp. 162–170.
[56] Olson, R. S., and Moore, J. H. Tpot: A tree-based pipeline optimization tool for
automating machine learning. In Automated Machine Learning. Springer, 2019,pp. 151–160.
[57] Palczewska, A., Palczewski, J., Robinson, R. M., and Neagu, D. Interpreting
random forest models using a feature contribution method. In 2013 IEEE 14thInternational Conference on Information Reuse & Integration (IRI) (2013), IEEE,pp. 112–119.
[58] Potharaju, R., and Jain, N. An empirical analysis of intra-and inter-datacenter
network failures for geo-distributed services. ACM SIGMETRICS PerformanceEvaluation Review 41, 1 (2013), 335–336.
[59] Roy, A., Zeng, H., Bagga, J., and Snoeren, A. C. Passive realtime datacenter
fault detection and localization. In NSDI (2017), pp. 595–612.[60] Saha, R. K., Lease, M., Khurshid, S., and Perry, D. E. Improving bug localization
using structured information retrieval. In 2013 28th IEEE/ACM InternationalConference on Automated Software Engineering (ASE) (2013), IEEE, pp. 345–355.
[61] Sankar, S., Shaw, M., Vaid, K., and Gurumurthi, S. Datacenter scale evaluation
of the impact of temperature on hard disk drive failures. ACM Transactions onStorage (TOS) 9, 2 (2013), 6.
[62] Scott, C., Wundsam, A., Raghavan, B., Panda, A., Or, A., Lai, J., Huang, E.,
Liu, Z., El-Hassany, A., Whitlock, S., et al. Troubleshooting blackbox sdn
control software with minimal causal sequences. ACM SIGCOMM ComputerCommunication Review 44, 4 (2015), 395–406.
[63] Tammana, P., Agarwal, R., and Lee, M. Simplifying datacenter network debug-
ging with pathdump. In OSDI (2016), pp. 233–248.[64] Tan, C., Jin, Z., Guo, C., Zhang, T., Wu, H., Deng, K., Bi, D., and Xiang, D.
Netbouncer: Active device and link failure localization in data center networks.
In 16th USENIX Symposium on Networked Systems Design and Implementation(NSDI 19) (2019).
[65] Vilalta, R., and Drissi, Y. A perspective view and survey of meta-learning.
Artificial intelligence review 18, 2 (2002), 77–95.
[66] Watson, M. R., Marnerides, A. K., Mauthe, A., Hutchison, D., et al. Malware
detection in cloud computing infrastructures. IEEE Transactions on Dependableand Secure Computing 13, 2 (2016), 192–205.
[67] Widanapathirana, C., Li, J., Sekercioglu, Y. A., Ivanovich, M., and Fitz-
patrick, P. Intelligent automated diagnosis of client device bottlenecks in private
clouds. In Utility and Cloud Computing (UCC), 2011 Fourth IEEE InternationalConference on (2011), IEEE, pp. 261–266.
[68] Winstein, K., and Balakrishnan, H. Tcp ex machina: computer-generated
congestion control. In ACM SIGCOMM Computer Communication Review (2013),
vol. 43, ACM, pp. 123–134.
[69] Wu, W., Wang, G., Akella, A., and Shaikh, A. Virtual network diagnosis as a
service. In Proceedings of the 4th annual Symposium on Cloud Computing (2013),
ACM, p. 9.
[70] Yu, D., Zhu, Y., Arzani, B., Fonseca, R., Zhang, T., Deng, K., and Yuan, L.
dshark: A general, easy to program and scalable framework for analyzing in-
network packet traces. In 16th USENIX Symposium on Networked Systems Designand Implementation (NSDI 19) (2019).
[71] Yu, M., Greenberg, A. G., Maltz, D. A., Rexford, J., Yuan, L., Kandula, S., and
Kim, C. Profiling network performance for multi-tier data center applications. In
NSDI (2011), vol. 11, pp. 5–5.[72] Zaharia, M., Chowdhury, M., Franklin, M. J., Shenker, S., and Stoica, I.
Spark: Cluster computing with working sets. HotCloud 10, 10-10 (2010), 95.[73] Zhang, Q., Yu, G., Guo, C., Dang, Y., Swanson, N., Yang, X., Yao, R., Chin-
talapati, M., Krishnamurthy, A., and Anderson, T. Deepview: Virtual disk
failure diagnosis and pattern detection for azure. In 15th USENIX Symposiumon Networked Systems Design and Implementation (NSDI 18) (2018), USENIXAssociation.
[74] Zhang, Y., Roughan, M., Willinger, W., and Qiu, L. Spatio-temporal com-
pressive sensing and internet traffic matrices. In ACM SIGCOMM ComputerCommunication Review (2009), vol. 39, ACM, pp. 267–278.
[75] Zhao, Y., Chen, Y., and Bindel, D. Towards unbiased end-to-end network
diagnosis. In ACM SIGCOMM Computer Communication Review (2006), vol. 36,
ACM, pp. 219–230.
[76] Zhu, Y., Kang, N., Cao, J., Greenberg, A., Lu, G., Mahajan, R., Maltz, D., Yuan,
L., Zhang, M., Zhao, B. Y., et al. Packet-level telemetry in large datacenter
networks. In ACM SIGCOMM Computer Communication Review (2015), vol. 45,
ACM, pp. 479–491.

SIGCOMM ’20, August 10–14, 2020, Virtual Event, NY, USA
Appendices are supportingmaterial that has not been peer-reviewed.
A MEASUREMENT VALIDATIONTo validate our findings in §3, we looked at 182 publicly disclosed
incidents from two clouds [2, 7]. These incident reports only include
issues that led to significant customer impact, and they only provide
a partial log of the mitigation process, but they still provide some
useful insights. We found that in 35 of the 182 incidents multiplecomponents were discussed as either being impacted or involved in
the incident: each of these components may have been involved in
the investigation even though their components were not directly
responsible. In 6 such incidents, operators explicitly acknowledge
the involvement of multiple entities, and in at least one (Nov. 11,
2018), a neighboring ISP was responsible. In practice, the set of
involved entities is much higher than the reports indicate. In any
case, when problems occur, their impact can often be observed
across the DC; many teams are potential suspects4.
# of Teams 1–10 10–20 20–100 100–1000 >1000
Respondents 14 1 8 1 1
# of Users <1k 1k–10k 10k–100k 100k–1m >1m
Respondents 4 5 11 3 4
Table 3: Characteristics of the networks operated by our sur-vey respondents.
Survey of network operators. Direct surveys of practicing net-
work operators re-affirm the above results. In total, 27 operators
responded to our survey; Table 3 shows some of the characteris-
tics of the respondents. 9 of them were ISP operators, another 10
self-identified as an enterprise, 5 were DC operators, 1 managed
a content delivery network, one a nationwide security provider,
and one classified their network as falling in all these categories.
Many of the respondents reported a small number of teams in their
organization (1–10), but one reported upwards of 1,000 teams. The
networks operated by respondents served a wide array of user base
sizes, with some handling less than 1,000 users, and 4 handling over
a million.
When asked how much these operators thought incident routing
impacts their organization, on a scale of 1–5 with 5 as the highest,
23 selected a score ≥3, out of which 17 selected a score ≥4. 17marked the significance of this problem as ≥4. 17 of the 27 opera-tors answered that their network was incorrectly blamed for over
60% of incidents across their systems. We also asked the converse:
“When an incident occurs, how often other components (not the
network) are initially blamed even though the incident was caused
by a networking issue?” 20 operators said that other teams were
implicated less than 20% of the time.
Operators listed the reasons why incident routing hard was hard
for them: (1) Operators find it difficult to identify the boundary of
each team’s responsibilities especially in larger organizations; (2)
Tickets don’t contain the information necessary to enable effective
incident routing; (3) Operators lack the ability to understand the
entire complex system to direct incident to the right team; (4)
4The work of [33] provides an in-depth study of these incidents in Google cloud.
Operators need access to monitoring data, both historical and real-
time, to demonstrate that networking is not the issue — this data is
often not available especially when problems occur intermittently.
Lastly, 14 out of the 27 operators said that for typical investiga-
tions, more than 3 teams are involved when incidents occur; 19 said
this number was ≥ 2.
We note the absolute numbers are subject to significant bias
from the respondents, but qualitatively, they demonstrate the effect
of improper routing on the lives of operators.
B EXTENDED EVALUATIONThe choice of supervised learningmodel.We use RFs for super-
vised learning as they are explain-able. We also experimented with
other choices in order to understand the tradeoff of explain-ability
vs accuracy (Table §4).
Evaluating the Model Selector.We could use unsupervised mod-
els such as OneClassSVM, boosting (e.g., Adaboost), or reinforce-
ment learning instead of our bag of words based RF (bag of words)
in the model selector. We evaluate these choices here (we defer re-
inforcement learning to future work as it requires careful selection
of the reward).
With frequent (every 10 days) retraining all model’s are compara-
ble (Figure §8-a). With a lower retraining frequency (every 60 days)
the difference between these models becomes apparent (Figure 8-b).
OneClassSVM (with an aggressive kernel) is better in such cases as
it switches to using CPD+ more often. Choosing the right kernel
is critical for OneClassSVM. A conservative kernel (Polynomial)
which would favor classifying most incidents as “old” cannot adapt
to the longer re-training interval while an aggressive kernel (radias
basis kernel) will choose to classify many samples as “new” and
uses CPD+ in those cases.
Given the cheap cost of re-training, we recommend frequent
retraining no matter which model is used. Due to its explainability,
we opted for the RF in deployment.
Understanding what makes the Scout work. We next investi-
gate in more detail how the Scout is able to achieve its high accuracy.
The differences across classes: We first look at how “separable” the
two classes (PhyNet’s responsibility vs not PhyNet’s responsibility)
are. Specifically, we look at the Euclidean distance (computed over
the feature vectors) between incidents that are PhyNet’s responsibil-
ity; between incidents that are not PhyNet’s responsibility, and the
cross distance between incidents in these two classes. Even though
the distribution of each class is not separable individually, we see a
clear separation in the cross distance (Figure 13). We compute the
same metric for the features of each component type (Figure 14):
the results seem to indicate server-related features should not have
much predictive power. However, a more detailed deflation study
(Table 5) shows these features still marginally contribute to the
overall accuracy of the Scout. We also see some components have
more contribution toward recall (e.g., Server features) while others
contribute to precision (e.g., switch features).
Feature analysis: To further evaluate the impact of the features for
each component type we: (a) remove the corresponding features;
and (b) use only the corresponding features (Table 5). We see al-
though server-related features have the least contribution to overall
accuracy all components contribute to the overall high F-1 Score.
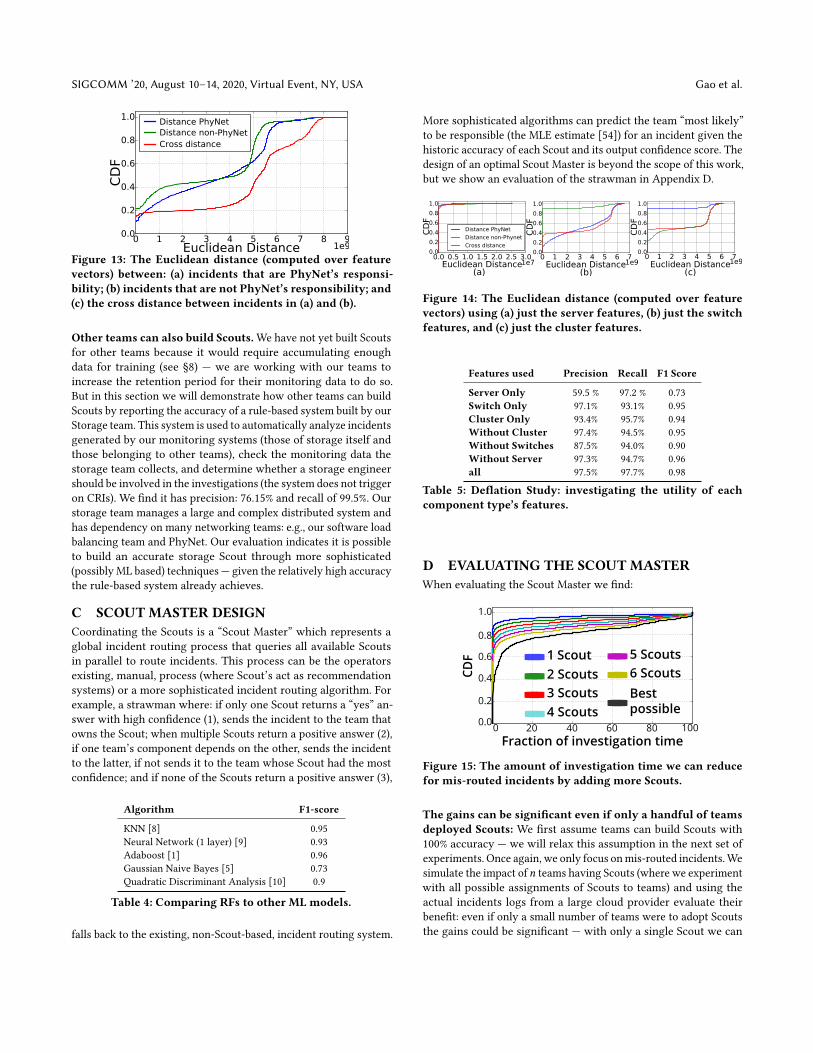
SIGCOMM ’20, August 10–14, 2020, Virtual Event, NY, USA Gao et al.
Figure 13: The Euclidean distance (computed over featurevectors) between: (a) incidents that are PhyNet’s responsi-bility; (b) incidents that are not PhyNet’s responsibility; and(c) the cross distance between incidents in (a) and (b).
Other teams can also build Scouts.We have not yet built Scouts
for other teams because it would require accumulating enough
data for training (see §8) — we are working with our teams to
increase the retention period for their monitoring data to do so.
But in this section we will demonstrate how other teams can build
Scouts by reporting the accuracy of a rule-based system built by our
Storage team. This system is used to automatically analyze incidents
generated by our monitoring systems (those of storage itself and
those belonging to other teams), check the monitoring data the
storage team collects, and determine whether a storage engineer
should be involved in the investigations (the system does not trigger
on CRIs). We find it has precision: 76.15% and recall of 99.5%. Our
storage team manages a large and complex distributed system and
has dependency on many networking teams: e.g., our software load
balancing team and PhyNet. Our evaluation indicates it is possible
to build an accurate storage Scout through more sophisticated
(possibly ML based) techniques — given the relatively high accuracy
the rule-based system already achieves.
C SCOUT MASTER DESIGNCoordinating the Scouts is a “Scout Master” which represents a
global incident routing process that queries all available Scouts
in parallel to route incidents. This process can be the operators
existing, manual, process (where Scout’s act as recommendation
systems) or a more sophisticated incident routing algorithm. For
example, a strawman where: if only one Scout returns a “yes” an-
swer with high confidence (1), sends the incident to the team that
owns the Scout; when multiple Scouts return a positive answer (2),
if one team’s component depends on the other, sends the incident
to the latter, if not sends it to the team whose Scout had the most
confidence; and if none of the Scouts return a positive answer (3),
Algorithm F1-score
KNN [8] 0.95
Neural Network (1 layer) [9] 0.93
Adaboost [1] 0.96
Gaussian Naive Bayes [5] 0.73
Quadratic Discriminant Analysis [10] 0.9
Table 4: Comparing RFs to other ML models.
falls back to the existing, non-Scout-based, incident routing system.
More sophisticated algorithms can predict the team “most likely”
to be responsible (the MLE estimate [54]) for an incident given the
historic accuracy of each Scout and its output confidence score. The
design of an optimal Scout Master is beyond the scope of this work,
but we show an evaluation of the strawman in Appendix D.
(c)(a) (b)
Figure 14: The Euclidean distance (computed over featurevectors) using (a) just the server features, (b) just the switchfeatures, and (c) just the cluster features.
Features used Precision Recall F1 Score
Server Only 59.5 % 97.2 % 0.73
Switch Only 97.1% 93.1% 0.95
Cluster Only 93.4% 95.7% 0.94
Without Cluster 97.4% 94.5% 0.95
Without Switches 87.5% 94.0% 0.90
Without Server 97.3% 94.7% 0.96
all 97.5% 97.7% 0.98
Table 5: Deflation Study: investigating the utility of eachcomponent type’s features.
D EVALUATING THE SCOUT MASTERWhen evaluating the Scout Master we find:
0 20 40 60 80 1000.0
0.2
0.4
0.6
0.8
1.0
1 Scout2 Scouts3 Scouts4 Scouts
5 Scouts6 ScoutsBestpossible
Fraction of investigation time
CDF
Figure 15: The amount of investigation time we can reducefor mis-routed incidents by adding more Scouts.
The gains can be significant even if only a handful of teamsdeployed Scouts: We first assume teams can build Scouts with
100% accuracy — we will relax this assumption in the next set of
experiments. Once again, we only focus onmis-routed incidents.We
simulate the impact of𝑛 teams having Scouts (where we experiment
with all possible assignments of Scouts to teams) and using the
actual incidents logs from a large cloud provider evaluate their
benefit: even if only a small number of teams were to adopt Scouts
the gains could be significant — with only a single Scout we can

SIGCOMM ’20, August 10–14, 2020, Virtual Event, NY, USA
reduce the investigation time of 20% of incidents and with 6 we can
reduce the investigation time of over 40% (Figure 15). With enough
Scouts — or by better assignment of Scouts to teams — gains can
be as high as 80% (Figure 15).
Even Scouts with imperfect accuracy are beneficial.We next
simulate Scouts of imperfect accuracy. To do so, we assign an ac-
curacy 𝑃 to each Scout which we pick uniformly at random from
the interval (𝛼, 𝛼 + 5%): each time a Scout is used, with probability
𝑃 it will correctly identify whether its team is responsible. If the
Scout is correct, we assign it a confidence 𝐶 chosen uniformly, at
random in the interval (0.8 − 𝛽, 0.8) and if it is incorrect we as-
sign it a confidence from the interval (0.5, 0.5 + 𝛽). Again, we lookat all possible Scout assignments and use actual incident reports
from a large cloud to evaluate the benefit of these Scouts. As the
impact of mis-routing is much less pronounced for some teams
compared to others (compare the gains presented here for a sin-
gle Scout with those of the PhyNet Scout), our results represent
a lower-bound on the actual benefits of Scouts. Despite this, even
with three Scouts, the Scout Master can reduce investigation time
by up to 80% (Figure 16).
0.00.1 0.2 0.3 0.4 0.5 0.70
0.750.80
0.850.90
0.951.00
Single Scout
0.0
0.2
0.4
0.6
1.0
0.0 0.1 0.2 0.3 0.40.5
Two Scouts0.8
0.700.75
0.800.85
0.900.95
1.000.0
0.2
0.4
0.6
0.8
1.0
0.0 0.1 0.20.3
0.4 0.50.700.75
0.80
0.850.90
0.951.000.0
0.2
0.4
0.6
0.8
1.0Three Scouts
Frac
tion
of i
nve
stig
atio
n
tim
e re
duce
d
Average 95th percentile
Figure 16: The lower bounds on gain when adding Scoutswith imperfect accuracy. By strategically assigning Scoutsto teams that are impacted more heavily by mis-routing wecan achieve much higher gains.