Embed Size (px)
Citation preview

ScottradeELITE
User Guide
Revised: December 7, 2015
2015 Scottrade, Inc.

Scottrade, Inc. and Scottrade Bank are separate but affiliated companies and are wholly-owned subsidiaries of Scottrade Financial Services, Inc. Brokerage products and services offered by Scottrade, Inc. – Member FINRA and SIPC. Deposit products and services offered by Scottrade Bank, Member FDIC. Brokerage products are not insured by the FDIC – are not deposits or other obligations of the bank and are not guaranteed by the bank – are subject to investment risks, including possible loss of the principal invested. Investors should consider the investment objectives, charges, expense, and unique risk profile of an Exchange Traded Fund (ETF) carefully before investing. Leveraged and Inverse ETFs may not be suitable for all investors and may increase exposure to volatility through the use of leverage, short sales of securities, derivatives and other complex investment strategies. These funds’ performance will likely be significantly different than their benchmark over periods of more than one day, and their performance over time may in fact trend opposite of their benchmark. Investors should monitor these holdings, consistent with their strategies, as frequently as daily. A prospectus contains this and other information about the ETF and should be obtained from the issuer. The prospectus should be read carefully before investing. The analytical tools described in this article are for information purposes only and their use does not guarantee a profit. None of the information provided should be considered a recommendation or solicitation to invest in, or liquidate, a particular security or type of security. Investors should fully research any security before making an investment decision. All investing involves risk including loss of principal and the potential for high volatility. The value of your investment will fluctuate over time and you may gain or lose money. Keep in mind profit will be reduced or loss worsened, as applicable, by the deduction of commissions and fees. The analytical tools described in this article are for information purposes only and their use does not guarantee a profit. None of the information provided should be considered a recommendation or solicitation to invest in, or liquidate, a particular security or type of security. Investors should fully research any security before making an investment decision. Indexes are unmanaged and one cannot invest directly in an index. Margin trading involves interest charges and risks, including the potential to lose more than deposited or the need to deposit additional collateral in a falling market. Scottrade’s margin agreement is available at scottrade.com, or through a Scottrade branch office, and contains the Margin Disclosure Statement and information on our lending policies, interest charges, and the risks associated with margin accounts. Investors should consider the investment objectives, risks, charges, and expenses of mutual fund carefully before investing. Mutual funds are subject to market fluctuation including the potential for loss of principal. A prospectus contains this and other information about the fund and may be ordered through www.scottrade.com or through a Scottrade branch office. The prospectus should be read carefully before investing. No transaction fee (NTF) funds are subject to the terms and conditions of the NTF funds program. Scottrade is compensated by the funds participating in the NTF program through recordkeeping, shareholder, or SEC 12b-1 fees. Options involve risk and are not suitable for all investors. Detailed information on our policies and the risks associated with options can be found in the Scottrade Options Application and Agreement, Brokerage Account Agreement, and by downloading the Characteristics and Risks of Standardized Options and Supplements (PDF) from The Options Clearing Corporation, or by requesting a copy from your local branch office. Supporting documentation for any claims will be supplied upon request. Keep in mind profit will be reduced or loss worsened, as applicable, by the deduction of commissions, fees and taxes. Scottrade does not provide tax advice. The material provided is for informational purposes only. Please consult your tax, or legal, advisor for questions concerning your personal tax or financial situation. Market volatility, volume, and system availability may impact account access and trade execution. None of the information provided should be considered a recommendation or solicitation to invest in, or liquidate, a particular security or type of security.
© 2015 Scottrade. All Rights Reserved

ScottradeELITE User Guide
Last updated: December 7, 2015 i
Table of Contents
Introduction ................................................................................................................................................. 1
Purpose..................................................................................................................................................... 1 What Is ScottradeELITE? ......................................................................................................................... 1
Overview ...................................................................................................................................................... 1
Features and Tools ................................................................................................................................... 1 Platform Comparison ................................................................................................................................ 8 Platform Comparison ................................................................................................................................ 9 Requirements ........................................................................................................................................... 9
Downloading and Installing ..................................................................................................................... 11
Accessing ScottradeELITE ...................................................................................................................... 16
The ScottradeELITE Main Window .......................................................................................................... 17
Layouts versus Templates ....................................................................................................................... 18
About Release Notes ................................................................................................................................ 18 Navigation .................................................................................................................................................. 19
Main Menu Bar ....................................................................................................................................... 19 Top Navigation – Other Tools and Features .......................................................................................... 27 Lower Navigation .................................................................................................................................... 28
Themes ....................................................................................................................................................... 38
Setting Themes ....................................................................................................................................... 38 Get Started Wizard .................................................................................................................................... 40
Using the Wizard to Set Up ScottradeELITE .......................................................................................... 40 Order Entry ................................................................................................................................................ 42
Accessing Order Entry ............................................................................................................................ 42 Placing a Stock or ETF Order ................................................................................................................. 44 Placing a Standard Options Order .......................................................................................................... 48 Order Entry Template (Tickets) .............................................................................................................. 53 Setting up Order Entry ............................................................................................................................ 54 Setting Trade Details for Stock/ETF and Option Orders ........................................................................ 55 Show Confirmation Window When Placing Orders ................................................................................ 57 Show Confirmation Window When Cancelling Orders ........................................................................... 58 Show Confirmation Window When Modifying Orders ............................................................................ 59 Show Notification Window When Modify an Order Overrides Current Order Being Built ...................... 60 Show Disclaimer Window When Placing Trailing Stop on Quote Orders .............................................. 61 Show Disclaimer Window When Placing Orders during Extended Hours .............................................. 62 Show Trade Execution Alerts ................................................................................................................. 63 Show Trade Execution Notice ................................................................................................................ 64 Automatically Dismiss Trade Execution Alerts after ( ) Seconds ......................................................... 65 Setting Order Quantity Limits ................................................................................................................. 66 Placing Advanced / Other Orders ........................................................................................................... 67 Modifying an Open Order ....................................................................................................................... 76 Cancelling an Order ................................................................................................................................ 78

ScottradeELITE User Guide
Last updated: December 7, 2015 ii
Linker Tool .............................................................................................................................................. 79 <Tool Name> Menu ................................................................................................................................ 79 Symbol Lookup ....................................................................................................................................... 79 Minimize / Restore .................................................................................................................................. 79
Balances..................................................................................................................................................... 80
Accessing and Updating Balances ......................................................................................................... 80 Viewing Deposits .................................................................................................................................... 80 Account Types ........................................................................................................................................ 81
Order Status .............................................................................................................................................. 84
Configuring Order Status ........................................................................................................................ 84 Checking Order Status ........................................................................................................................... 89 Filtering Orders ....................................................................................................................................... 89 Sorting Orders ........................................................................................................................................ 91 Modifying or Canceling Open Orders ..................................................................................................... 91 Canceling All Orders ............................................................................................................................... 91 Viewing an Advanced Order from Order Status ..................................................................................... 92 Modifying Advanced Orders from Order Status ..................................................................................... 92 Viewing Partial Shares ............................................................................................................................ 94 Hiding Additional Filters .......................................................................................................................... 94 Linker Tool .............................................................................................................................................. 95 <Tool Name> Menu ................................................................................................................................ 95 Right-click Functionality .......................................................................................................................... 95 Symbol Lookup ....................................................................................................................................... 95 Minimize / Restore .................................................................................................................................. 95 Template Manager .................................................................................................................................. 95
Positions .................................................................................................................................................... 96
Accessing Positions ................................................................................................................................ 96 Viewing Deposits .................................................................................................................................... 97 Viewing Equity Events Information for a Security ................................................................................... 98 Setting up Positions .............................................................................................................................. 100 Trading a Position ................................................................................................................................. 106 Portfolio Gain/Loss and Total Market Value ......................................................................................... 107 Linker Tool ............................................................................................................................................ 107 <Tool Name> Menu .............................................................................................................................. 107 Right-click Functionality ........................................................................................................................ 107 Symbol Lookup ..................................................................................................................................... 107 Minimize / Restore ................................................................................................................................ 107 Template Manager ................................................................................................................................ 107
Charts ....................................................................................................................................................... 108
Accessing Charts .................................................................................................................................. 108 Building a Chart .................................................................................................................................... 109 Viewing Multiple Symbols in the Same Chart ....................................................................................... 112 Chart Indicators and Studies ................................................................................................................ 116 What Is an Indicator? ............................................................................................................................ 116 Chart Drawing Tools ............................................................................................................................. 121 Configuring Chart Settings.................................................................................................................... 129 Trading from Charts .............................................................................................................................. 138 Placing an Order in a Chart .................................................................................................................. 142 Using the Trade Button ......................................................................................................................... 142

ScottradeELITE User Guide
Last updated: December 7, 2015 iii
Exporting Chart Data to Excel .............................................................................................................. 146 Linker Tool ............................................................................................................................................ 149 <Tool Name> Menu .............................................................................................................................. 149 Right-click Functionality ........................................................................................................................ 149 Symbol Lookup ..................................................................................................................................... 149 Minimize / Restore ................................................................................................................................ 149 Template Manager ................................................................................................................................ 149
Advanced Scanner .................................................................................................................................. 150
Accessing Advanced Scanner .............................................................................................................. 150 Creating a Name for a Scan ................................................................................................................. 151 Additional Filters ................................................................................................................................... 152 Running the Advanced Scanner ........................................................................................................... 152 Scan Results ......................................................................................................................................... 153 Working with the Scan Results ............................................................................................................. 153 Exporting Scan Results ........................................................................................................................ 154 Saving Data to Watch Lists .................................................................................................................. 154 Sector Trends Actions .......................................................................................................................... 154 Linker Tool ............................................................................................................................................ 155 <Tool Name> Menu .............................................................................................................................. 155 Right-click Functionality ........................................................................................................................ 155 Symbol Lookup ..................................................................................................................................... 155 Minimize / Restore ................................................................................................................................ 155 Template Manager ................................................................................................................................ 155
Recognia® ................................................................................................................................................ 156
What Is Recognia? ............................................................................................................................... 156 Accessing Recognia Intraday Trader ................................................................................................... 156 Using Intraday Trader™ ....................................................................................................................... 157 Help ....................................................................................................................................................... 157
Recognia® Alertwire™.............................................................................................................................. 158
What Is Recognia AlertWire? ............................................................................................................... 158 Accessing Recognia AlertWire ............................................................................................................. 158 Placing an Order from Recognia AlertWire .......................................................................................... 158
Recognia® Strategy Builder™ ................................................................................................................. 161
What Is Strategy Builder? ..................................................................................................................... 161 Accessing Strategy Builder ................................................................................................................... 161 Help ....................................................................................................................................................... 161
Recognia® Technical Insight™ ............................................................................................................... 162
What Is Recognia Technical Insight? ................................................................................................... 162 Accessing Recognia Technical Insight ................................................................................................. 162 Help ....................................................................................................................................................... 162
Recognia® Value Analyzer™ ................................................................................................................... 163
What Is Recognia Value Analyzer? ...................................................................................................... 163 Accessing Recognia Value Analyzer .................................................................................................... 163 Help ....................................................................................................................................................... 163
Trade Ideas® ............................................................................................................................................. 164
What Is Trade Ideas? ........................................................................................................................... 164

ScottradeELITE User Guide
Last updated: December 7, 2015 iv
What Can I Access with a Subscription? .............................................................................................. 164 Accessing Trade Ideas ......................................................................................................................... 165 Subscribing to Trade Ideas ................................................................................................................... 165 Using Trade Ideas ................................................................................................................................ 167 Creating and Saving Your Layout ......................................................................................................... 167 Help ....................................................................................................................................................... 168 Cancelling Subscription to Trade .......................................................................................................... 169
Upcoming Earnings ................................................................................................................................ 170
What Is Upcoming Earnings? ............................................................................................................... 170 Why Use Upcoming Earnings? ............................................................................................................. 170 Accessing Upcoming Earnings ............................................................................................................. 171 Finding, Sorting, Filtering, and Organizing Data .................................................................................. 172 Linker Tool ............................................................................................................................................ 174 <Tool Name> Menu .............................................................................................................................. 174 Right-click Functionality ........................................................................................................................ 174 Symbol Lookup ..................................................................................................................................... 174 Minimize / Restore ................................................................................................................................ 174 Template Manager ................................................................................................................................ 174
IPO Calendar ............................................................................................................................................ 175
What Is the IPO Calendar*? ................................................................................................................. 175 Accessing the IPO Calendar ................................................................................................................ 175 Finding, Sorting, Filtering, and Organizing Data .................................................................................. 175 Saving IPO Calendar Data to a Watch List .......................................................................................... 177 Placing an Order from the IPO Calendar.............................................................................................. 178 Linker Tool ............................................................................................................................................ 180 <Tool Name> Menu .............................................................................................................................. 180 Right-Click Functionality ....................................................................................................................... 180 Symbol Lookup ..................................................................................................................................... 180 Minimize / Restore ................................................................................................................................ 180 Template Manager ................................................................................................................................ 180
Zacks Predefined Screener .................................................................................................................... 181
What Is Zacks Predefined Screener? ................................................................................................... 181 Accessing Zacks Predefined Screener ................................................................................................. 181 Filtering Data in Zacks Predefined Screener by “Meets Zacks Criteria” .............................................. 182 Placing a Trade Using Zacks ................................................................................................................ 183 Using Column Features to Organize Zacks List ................................................................................... 184 Saving Zacks List to a Watch List ......................................................................................................... 186
Newsletter Subscriptions ....................................................................................................................... 187
Subscribing to Trading Central ............................................................................................................. 187 Subscribing to Recognia ....................................................................................................................... 187
Sector Trends .......................................................................................................................................... 188
Market Index ......................................................................................................................................... 188 Sector Groupings .................................................................................................................................. 188 Industry Groups .................................................................................................................................... 189 Sector Trend Calculations .................................................................................................................... 190 Using Sector Trends ............................................................................................................................. 190 Saving Data to Watch Lists .................................................................................................................. 192 Sector Trends Actions .......................................................................................................................... 192

ScottradeELITE User Guide
Last updated: December 7, 2015 v
Using Right-click Functionality .............................................................................................................. 193 <Tool Name> Menu .............................................................................................................................. 193 Symbol Lookup ..................................................................................................................................... 193 Minimize / Restore ................................................................................................................................ 193
Hot Keys ................................................................................................................................................... 194
What Is a Hot Key? ............................................................................................................................... 194 Why Use Hot Keys? .............................................................................................................................. 194 Accessing Hot Keys .............................................................................................................................. 194 Creating a New Hot Key ....................................................................................................................... 195 Assigning an Existing Hot Key to a Task .............................................................................................. 197 Changing Hot Key Assignments ........................................................................................................... 197 Deleting a Hot Key ................................................................................................................................ 199 Using Hot Keys in Order Entry ............................................................................................................. 199
Watch Lists .............................................................................................................................................. 200
What Are Watch Lists? ......................................................................................................................... 200 Why Use Watch Lists? .......................................................................................................................... 200 Accessing Watch Lists .......................................................................................................................... 200 Viewing, Adding and Removing Securities ........................................................................................... 202 Saving Watch Lists ............................................................................................................................... 203 Using Symbol Lookup ........................................................................................................................... 204 Using Double-Click Functionality .......................................................................................................... 204 Trading Options from Watch Lists ........................................................................................................ 205 Viewing Equity Events Information for a Security ................................................................................. 206 Configuring Columns ............................................................................................................................ 208 Applying Font Settings (Current Tab) ................................................................................................... 212 Applying Font Settings (All Tabs) ......................................................................................................... 214 Managing Watch Lists .......................................................................................................................... 216 Importing Watch Lists and Positions to Active Ticker ........................................................................... 220
Detailed Quote ......................................................................................................................................... 224
Accessing Detailed Quote .................................................................................................................... 224 Using Detailed Quote ............................................................................................................................ 224 Using Symbol Lookup ........................................................................................................................... 225 Other Detailed Quote Functionality ...................................................................................................... 225 Viewing Equity Events Information for a Security ................................................................................. 226 Configuring Detailed Quotes ................................................................................................................ 228 Linker Tool ............................................................................................................................................ 233 <Tool Name> Menu .............................................................................................................................. 233 Right-click Functionality ........................................................................................................................ 233 Symbol Lookup ..................................................................................................................................... 233 Minimize / Restore ................................................................................................................................ 233 Template Manager ................................................................................................................................ 233
Velocity & Forces .................................................................................................................................... 234
What Is Velocity & Forces?................................................................................................................... 234 Why Use Velocity & Forces? ................................................................................................................ 234 What Is Market Velocity? ...................................................................................................................... 234 What Are Market Forces? ..................................................................................................................... 234 Accessing Velocity & Forces ................................................................................................................ 234 Configuring Velocity & Forces .............................................................................................................. 236 Minimizing / Restoring Velocity & Forces ............................................................................................. 237

ScottradeELITE User Guide
Last updated: December 7, 2015 vi
Trading from Velocity & Forces ............................................................................................................ 237 Using the Linker Tool ............................................................................................................................ 238 <Tool> Menu ......................................................................................................................................... 238 Right-click Functionality ........................................................................................................................ 238 Symbol Entry Box ................................................................................................................................. 238 Symbol Lookup ..................................................................................................................................... 238 Minimize / Restore ................................................................................................................................ 238 Template Manager ................................................................................................................................ 238
Market Depth ........................................................................................................................................... 239
Accessing Market Depth ....................................................................................................................... 239 Configuring Settings ............................................................................................................................. 239 Activating or Deactivating a Subscription to a Premium Service.......................................................... 240 Free Subscriptions vs. Service Charges .............................................................................................. 242 Viewing Level II ..................................................................................................................................... 242 <Tool> Menu ......................................................................................................................................... 243 Right-click Functionality ........................................................................................................................ 243 Minimize / Restore ................................................................................................................................ 243
Time & Sales ............................................................................................................................................ 244
What Is Time & Sales? ......................................................................................................................... 244 Accessing Time & Sales ....................................................................................................................... 244 Pausing Time & Sales .......................................................................................................................... 244 Viewing Options in Time & Sales ......................................................................................................... 245 Configuring Time & Sales ..................................................................................................................... 246 Changing Default Order Condition Settings ......................................................................................... 247 Displaying Data ..................................................................................................................................... 249 Linker Tool ............................................................................................................................................ 251 <Tool Name> Menu .............................................................................................................................. 251 Right-click Functionality ........................................................................................................................ 251 Symbol Lookup ..................................................................................................................................... 251 Minimize / Restore ................................................................................................................................ 251 Template Manager ................................................................................................................................ 251
Option Chains .......................................................................................................................................... 252
What Is an Option Chain?..................................................................................................................... 252 Accessing Option Chains...................................................................................................................... 252 Viewing and Adding Option Chains ...................................................................................................... 252 Symbols Not Supported by Option Chains ........................................................................................... 253 Configuring Option Chains.................................................................................................................... 254 Option Chains Actions .......................................................................................................................... 255 Greeks .................................................................................................................................................. 256 Configuring Chain Display .................................................................................................................... 257 Selecting Expirations Option Chains .................................................................................................... 259 Placing a Trade from Option Chains .................................................................................................... 264 <Tool> Menu ......................................................................................................................................... 264 Right-click Functionality ........................................................................................................................ 264 Minimize / Restore ................................................................................................................................ 264
Profit Loss................................................................................................................................................ 265
What Is Profit Loss? .............................................................................................................................. 265 Why Use Profit Loss? ........................................................................................................................... 265 Volatility Types ...................................................................................................................................... 265

ScottradeELITE User Guide
Last updated: December 7, 2015 vii
Understanding Profit Loss .................................................................................................................... 265 Accessing Profit Loss ........................................................................................................................... 266 Getting Started with Strategies ............................................................................................................. 270 Understanding Chart Elements ............................................................................................................ 278 Understanding Scenarios ..................................................................................................................... 283 <Tool Name> Menu .............................................................................................................................. 289 Symbol Lookup ..................................................................................................................................... 289 Minimize / Restore ................................................................................................................................ 289
Skew Tool................................................................................................................................................. 290
What Is Volatility? ................................................................................................................................. 290 Understanding the Skew Tool .............................................................................................................. 291 Accessing Skew Tool ............................................................................................................................ 292 Using 2D Charts ................................................................................................................................... 294 Using 3D Charts ................................................................................................................................... 294 <Tool Name> Menu .............................................................................................................................. 295 Symbol Lookup ..................................................................................................................................... 295 Minimize / Restore ................................................................................................................................ 295
Company Profile ...................................................................................................................................... 296
Accessing Company Profile .................................................................................................................. 296 Right-click Functionality ........................................................................................................................ 297 Company Profile Menu ......................................................................................................................... 297
Alerts ........................................................................................................................................................ 299
Accessing Alerts ................................................................................................................................... 299 News Alerts ........................................................................................................................................... 300 Closing Alerts ........................................................................................................................................ 300 Creating Alerts ...................................................................................................................................... 300 Creating an Alert with Multiple Rules .................................................................................................... 306 Modifying an Existing Alert ................................................................................................................... 308 Deleting an Alert ................................................................................................................................... 309 Deleting an existing Alert Rule ............................................................................................................. 311 Resetting an Alert ................................................................................................................................. 312 Viewing Triggered Alerts....................................................................................................................... 314 Configuring Alert Settings ..................................................................................................................... 315 Alerts for Linked Accounts .................................................................................................................... 316
Market Movers ......................................................................................................................................... 317
Accessing Market Movers..................................................................................................................... 317 Pausing Market Movers ........................................................................................................................ 317 Configuring Market Movers................................................................................................................... 317 Linker Tool ............................................................................................................................................ 318 <Tool Name> Menu .............................................................................................................................. 318 Right-click Functionality ........................................................................................................................ 318 Symbol Lookup ..................................................................................................................................... 318 Minimize / Restore ................................................................................................................................ 318 Template Manager ................................................................................................................................ 318
Top Performers ....................................................................................................................................... 319
Viewing Top Performers ....................................................................................................................... 319 Viewing Equity Events Information for a Security ................................................................................. 321 Configuring Columns ............................................................................................................................ 323

ScottradeELITE User Guide
Last updated: December 7, 2015 viii
Saving Top Performers to Watch Lists ................................................................................................. 328 Top Performers Actions ........................................................................................................................ 328 Using Right-click Functionality .............................................................................................................. 329 Linker Tool ............................................................................................................................................ 329 <Tool Name> Menu .............................................................................................................................. 329 Right-click Functionality ........................................................................................................................ 329 Symbol Lookup ..................................................................................................................................... 329 Minimize / Restore ................................................................................................................................ 329 Template Manager ................................................................................................................................ 329
Virtual Trading ......................................................................................................................................... 330
Accessing Virtual Trading ..................................................................................................................... 330 GUI and Navigation Differences ........................................................................................................... 332 Placing a Virtual Trade ......................................................................................................................... 333 Viewing Virtual Balances ...................................................................................................................... 334 Viewing Virtual Positions ...................................................................................................................... 336 Configuring the Virtual Positions Window............................................................................................. 337 Trading Virtual Positions ....................................................................................................................... 342 Virtual Positions Actions ....................................................................................................................... 343 Portfolio Gain/Loss and Total Market Value ......................................................................................... 344 Linker Tool ............................................................................................................................................ 344 <Tool Name> Menu .............................................................................................................................. 344 Right-click Functionality ........................................................................................................................ 344 Symbol Lookup ..................................................................................................................................... 344 Minimize / Restore ................................................................................................................................ 344 Template Manager ................................................................................................................................ 344 Preventing Real Trades While in Virtual Mode ..................................................................................... 345
Global Settings ........................................................................................................................................ 346
The Linker Tool ..................................................................................................................................... 346 Minimizing or Restoring Windows ........................................................................................................ 349 Symbol Entry Box ................................................................................................................................. 349 Symbol Lookup ..................................................................................................................................... 350 <Tool Name> Menu .............................................................................................................................. 351 Right-click Functionality ........................................................................................................................ 352 Template Manager ................................................................................................................................ 353 Show or Hide Tabs in Select Windows ................................................................................................. 354 Show or Hide Account Quick View (Right Drawer) .............................................................................. 356 Show or Hide Layout Bar ...................................................................................................................... 358 Viewing or Selecting Recently-Entered Symbols ................................................................................. 360
Appendix A. Glossary ............................................................................................................................. 361
Appendix B. Exchange Identifications (IDs) ......................................................................................... 362 Appendix C. Subscriber Account Status .............................................................................................. 363

ScottradeELITE User Guide
Introduction 1
Introduction
Purpose This document contains step-by-step instructions for using ScottradeELITE along with its tools and features.
What Is ScottradeELITE? ScottradeELITE utilizes Windows-based technology to deliver a fully-customizable trading platform to active traders. With ScottradeELITE, active traders can research the market, identify and take action on opportunities in the market, make trades, and manage accounts from a single interface.
Overview
Features and Tools ScottradeELITE tools are designed to give you insight into ever-changing market conditions and help you find your next great trading opportunity. Tools include Streaming News (Dow Jones), Yahoo! News search, top performers scans (via Advanced Scanner), advanced charting capabilities, NASDAQ Level II/TotalView, NYSE OpenBook and more. The following sections explain the key ScottradeELITE features and tools in detail.
• Layout Manager – Provides the ability to save customized layouts or choose from preset layout templates. ScottradeELITE retains 200 layouts maximum.
• Layout Tabs (Quick Access Bar) – When enabled in Global Settings, the layout tabs are located at the bottom of your window and allow you to toggle between layouts with a single click.
• Linker – Link an unlimited number of individual windows using this function.
Linking windows provides the interactivity of entering a symbol in the active window while automatically updating all other linked windows simultaneously. You can customize each window to fit your trading needs.
• Market Research Tools – The following features within ScottradeELITE enable you to research the market for opportunities.
o More than 100 different technical and fundamental data elements that enable you to create personalized symbol grids allowing research of equities, options, and mutual funds.
o Create an unlimited number of symbol lists.
o NASDAQ TotalView Quotes displays every single quote and order at every price level in the NASDAQ Market Center with the fastest data feed available. Use TotalView to:
Better understand how orders are distributed throughout the market.
Identify new trading opportunities.
More effectively trade positions.

ScottradeELITE User Guide
Overview 2
o NASDAQ Level II Quotes displays the best bid and ask prices for each NASDAQ Market Participant. With Level II you get insight into what is happening behind the real-time quote. Color-coded price tiers and dynamic Depth Chart help you visually understand the market.
Quickly locate imbalances on the Bid or Ask side.
Identify market participants offering the lowest bid-ask spread.
Track market makers and ECNs to see who the major players are and if they are buying or selling.
o Advanced Charting provides the ability to build an unlimited number of customizable charts within in-depth technical analysis.
o Option Chain provides real-time, streaming data from any exchange.
o Free access to Dow Jones Real-Time News for Investors.
• Discovering Opportunities in the Market – Research opportunities and find which investments are best for you with the ScottradeELITE trading platform. Select different market events to watch and filter to refine the universe of securities being monitored. The result is an uninterrupted, real-time stream of actionable online trade opportunities streamed directly into ScottradeELITE.
o Advanced Scanner provides the ability to do many scan types on securities. Offers sorting and filter options by minimum amount, maximum amount, minimum average volume, fund category, and fund family. Use Advanced Scanner to find the most actives, net gainers/losers, and percent gainers/losers for fourteen separate exchanges. Advanced Scanner allows you to run scans for top performers and highs and lows.
o Use the High/Low Filter to view streaming, real-time highs and lows. Use this functionality to modify and customize settings to target only the segment of the market you want to see to catch breakouts and stay on top of the market.
o Use ScottradeELITE Alerts to monitor the market setting an unlimited number of conditional alerts and an unlimited number of rules for each of those alerts.

ScottradeELITE User Guide
Overview 3
• Manage Online Trading Accounts
o The account linking feature enables you to monitor and trade all accounts from one interface.
o Whether executing a trade in regular hours or in after-hours, our order entry component combines speed, flexibility, and performance in a platform designed for you.
o Real-time positions provide up to the second profit and loss information.
o You can monitor balances, trade activity, trade history, and financial history in one integrated platform.
• Sector Trends – Provides the capability to view the strength of market trends by sector, industry, security or My Positions. There are sorting and filter options to narrow results by minimum price, maximum provide, and minimum average volume.
• Fundamentals as a separate window – Most of the data is viewable in the Full Quote window but now there is the option to view data for Fundamentals in its own window.
• Detachable Windows – You have the ability to disengage a feature window and move it around on the computer monitor, independent of the main window.
• Carousel – Located at the bottom of the main layout, the Carousel allows you to quickly access active windows active windows within your layout. The Carousel has the ability to float (detach from the main user interface) or dock (attach to the main user interface). Use the Carousel to open multiple windows within the ScottradeELITE platform and minimize or restore windows with a single click. The Carousel offers some additional functionality on the left side bar:
o Hover Preview – The Hover Preview allows windows within Carousel to be viewed in a preview window by hovering over a particular preview window or thumbnail. Click the monitor icon on the left side of Carousel to toggle on or off the preview window. Hover your mouse over an active window in Carousel to see a larger version of the active window in the main layout.

ScottradeELITE User Guide
Overview 4
o Detach/Attach Carousel – Carousel has the ability to remain attached to the main user interface (docked) or the ability to detach (float) as a separate window within the main user interface. To detach Carousel, in the left side bar, click the Detach Carousel button. To dock Carousel, click the Configure the Carousel button, and then click Attach Carousel.
o Resizing – You can resize the Carousel by dragging the top black bar. When the
pointer becomes a double arrow, drag the pointer up or down to adjust the size.
o Collapse or Open (Hide or Unhide) – You can collapse (hide) or open (unhide) the
Carousel (depending on its current state) by clicking the gray toggle button between Trade and Layout in the lower left corner of the ScottradeELITE platform.

ScottradeELITE User Guide
Overview 5
You can also collapse or hide the Carousel by clicking the Carousel icon from the left side bar and then clicking Hide Carousel.
o Scrolling between Windows – The Carousel allows you to scroll between the windows that are currently open inside the ScottradeELITE platform. If the current windows do not fit in the Carousel space, a right arrow appears on the right side of the Carousel.
Clicking this arrow allows you to scroll to all available thumbnails. To scroll to the left, click the left arrow on the left side of the Carousel.
o Organize Thumbnails – To manually rearrange the thumbnails in the Carousel, drag
the thumbnails to the new location on the Carousel.
o Active Window Indicator – The small blue dot within the Carousel heading indicates
that the window is currently active or expanded within the platform. If the dot is gray, the window is currently in a minimized state within the platform. You can click an active window (blue dot) to minimize the window and click an inactive window (gray dot) to restore a window.

ScottradeELITE User Guide
Overview 6
o Right-click Functionality – Right-clicking a thumbnail within the Carousel provides a shortcut menu with the following options:
Detach/Attach (depending on the current state of the window) – Detaches or attaches the window from or to the main ScottradeELITE platform.
Minimize / Maximize (Restore) window – Minimizes the window or maximizes (restores) a minimized window.
Close window – Closes the window.
Hide Carousel – Collapses the Carousel completely.
The shortcut menu items offered by the right-click functionality may vary depending on the active window or tool you are using.
o Configure Carousel – Located in the bottom left corner of the ScottradeELITE platform, use the Carousel Properties to view or change sorting and preview preferences.
When you click Configure Carousel, the Carousel Properties dialog box displays the following options:
Show Preview – Selecting the Show Preview check box enables the hover Preview functionality within the Carousel. The hover preview allows you to hover over the thumbnail in the Carousel and see a larger preview image of the window.
Preview Size – You can choose from the following preview sizes: Small, Medium, or Large.
Thumbnail Size – The thumbnail size also can be adjusted by dragging the Thumbnail Size scroll bar (smallest size to the left, largest size to the right).

ScottradeELITE User Guide
Overview 7
• Account Quick View (Right Drawer) –The Account Quick View (Right Drawer) is a convenient way to view your account-specific information (Balances, Positions, and Order status). Use the Account Quick View (Right Drawer) to:
o Expand or collapse with a single click.
o Conserve real estate on your window.
To expand or collapse the Account Quick View (Right Drawer), on the top right side of the ScottradeELITE platform, click the Account Quick View arrow.
o Show (Pin) or Hide (Unpin) Account Quick View (Right Drawer) To keep the Account Quick View (Right Drawer) open and move it to a different
part of the screen, click the Pin button in the top right corner. To return Account Quick View (right Drawer) to its default state (the docked position), click the Pin button again.
You can conserve space by hiding the Account Quick View (Right Drawer) from view. For more information, see Show or Hide the Account Quick View (Right Drawer).

ScottradeELITE User Guide
Overview 8
Platform Comparison ScottradeELITE Scottrader® Scottrade.com
Technology Windows-based Yes No No Java-based No Yes No Browser-based No No Yes Products Supported Equities Yes Yes Yes Options Yes Yes Yes Mutual Funds No No Yes Fixed Incomes No No Yes Quote Data Delivery Method Streaming Yes Yes No Real-time No No Yes Quote List Features Number of symbols Up to 35,000 20 Unlimited Number of lists Up to 500 Unlimited Unlimited Symbol List Manager Yes Yes Yes Customizable Templates Yes Yes No Quote Views and Information NASDAQ TotalView Quotes Yes No No Level II Quotes Yes No No Fundamental (Level I) Quotes
(Streaming) Yes Yes No
Fundamental (Level I) Quotes (Real-time)
No No Yes
Time & Sales Data Delivery Method Streaming Yes Yes None Time & Sales Features Customizable Yes No No News Data Delivery Method Streaming Yes Yes No Real-Time No No Yes News Offerings Dow Jones Yes Yes Yes Symbol News Search Yes Yes Yes News Alert Yes No Yes Yahoo! News Search Yes No No Option Chains Data Delivery Method Streaming Yes Yes No Real-Time No No Yes Top Performers (Advanced Scanner) Data Delivery Method
Streaming Yes Yes No Real-Time No No Yes

ScottradeELITE User Guide
Overview 9
Platform Comparison ScottradeELITE Scottrader® Scottrade.com
Top Performers Lists Number of Exchanges 3 3 3 High and Lows (Advanced Scanner) Data Delivery Method
Streaming No Yes No Real-Time Yes High and Lows Filters Yes No Trading Right-Click Order Entry Yes Yes No Integrated Account Mgmt. Yes Yes Yes Symbol Alerts Available in Platform? Yes No Yes Layout Ability to view multiple windows Yes No No Customizable Window Layouts Unlimited 1 n/a
Requirements You must maintain a minimum account value and have a computer that meets specific technical requirements in order to use ScottradeELITE.
Monetary Requirements
To automatically download ScottradeELITE, you must meet one of the following requirements:
• Have a minimum equity of $25,000 in a single account. • Have a minimum equity of $15,000 in a primary account and a total of $25,000 in all
accounts. • Place at least nine trades in the last 90 days.

ScottradeELITE User Guide
Overview 10
Technical Requirements
Minimum • Windows Vista or newer with Internet Explorer version 7 (or later)
• 2GB of RAM • Dual core processor; minimum 1.8GHz clock speed • 250MB of free hard drive storage • Broadband connection; minimum 512Kbps + • Integrated graphics • Microsoft Framework - .NET 4.0 • 1024 x 768 minimum screen resolution
Recommended • Windows 7 or 8 (64 bit) with Internet Explorer 8.0 (or later) • 4GB (or more) of RAM • Quad core processor; minimum 2.4GHz clock speed • 250MB of free hard drive storage • Broadband connection; minimum 3Mbps (Cable, DSL,
Fiber-based, Corporate LAN) • Graphics:
o Single monitor – Integrated graphics o Multiple monitors – Dedicated card with minimum
512MB of video RAM • Microsoft Framework - .NET 4.0 • 1280 x 1024 minimum screen resolution

ScottradeELITE User Guide
Downloading and Installing 11
Downloading and Installing You must have administrative privileges on the machine prior to installing ScottradeELITE or the installation will fail. Follow these instructions for downloading and installing ScottradeELITE:
1. From the Scottrade Client Website Home tab on the left side navigation bar, click ScottradeELITE (New).
2. From the window that launches, click Download ScottradeELITE.
o Scottrade clients with accounts that meet the qualifications to use ScottradeELITE will see a dowload window.

ScottradeELITE User Guide
Downloading and Installing 12
o Scottrade clients with accounts that do not meet the qualifications to use ScottradeELITE will see a window with the criteria required to qualify.

ScottradeELITE User Guide
Downloading and Installing 13
3. In the File Download – Security Warning dialog box, click Run.
4. When the ScottradeELITE Setup Wizard appears, click Next.
5. Use the default destination folder location, and click Next.

ScottradeELITE User Guide
Downloading and Installing 14
6. Click Next.
7. Click Install.

ScottradeELITE User Guide
Downloading and Installing 15
8. Click Finish.
If you are trying to download ScottradeELITE to your company’s computer, the company’s network or security may not allow you to download ScottradeELITE. You will need to receive permission from your company to allow the install.
9. After the installation is complete, the ScottradeELITE program launches, and the User Authentication window opens.

ScottradeELITE User Guide
Accessing ScottradeELITE 16
Accessing ScottradeELITE If the ScottradeELITE program is not already open, follow the steps below to launch and log on to the ScottradeELITE platform.
1. From the desktop, double-click the ScottradeELITE icon.
2. When ScottradeELITE Login box appears, enter the following criteria:
3. In the Account box, type your account number.
4. In the Password box, type your password.
5. In the Language list, select English, and then click Login. If you want ScottradeELITE to retain your login credentials, select the Remember My Account Number check box.

ScottradeELITE User Guide
The ScottradeELITE Main Window 17
The ScottradeELITE Main Window When ScottradeELITE launches, the main window with the default layout appears. The image below shows an example layout named “ticket” with no active windows inside the main window.

ScottradeELITE User Guide
Layouts versus Templates 18
Layouts versus Templates The ScottradeELITE platform is comprised of layouts and templates. The differences between the two features are described below.
• Layout – A layout is the look and feel of the entire ScottradeELITE platform.
• Template – A template is an individual window within the platform.
About Release Notes ScottradeELITE saves a file to your computer so you can view the latest features and enhancements from the current release.
To view release notes, in the ScottradeELITE installation folder on your local drive, double-click Release_Notes.txt.

ScottradeELITE User Guide
Navigation 19
Navigation ScottradeELITE offers several menu-driven tools and functionalities that are built-in to the navigation features. Navigation features are located at the top and bottom of the ScottradeELITE platform.
Main Menu Bar The Main Menu bar provides easy access to the following top-level menus:
• Main Menu • Account • Research • Quotes • News • Option Tools • Help
Identifying New and Updated Features in Menus
Green “New” and “Updated” text labels, located next to the feature in the top-level menu, indicate a new or updated feature for the latest release. The labels can help you discover the most recent changes to the ScottradeELITE platform. “New” and “Updated” labels remain in the menu for the duration of the current release.

ScottradeELITE User Guide
Navigation 20
Main Menu
• Main Menu Submenus – The Main Menu allows access to any window on the ScottradeELITE platform. All available windows found in the Account, Research, Quotes, News, Options and Help menus are submenus within the Main Menu. Submenu details are available in subsequent sections of this guide.
• Export – The export feature allows you to export layouts or templates from the ScottradeELITE platform and save them locally (on your hard drive). The ScottradeELITE Export Wizard guides you through the export process.
ScottradeELITE saves layouts and templates to an account. For example, if you load your account from a different computer than you normally use, your layouts and templates are available.

ScottradeELITE User Guide
Navigation 21
• Import – You can import saved layouts, symbol lists, and layouts from legacy ScottradeELITE by using the Import feature.
A ScottradeELITE Import Wizard opens and guides you through the remaining steps.
After you click Next in the ScottradeELITE Import Wizard dialog box, locate the layout or template file on your computer, and click Open. In the lower right corner of the Open dialog box, click the drop-down arrow. Click ScottradeELITE export file type you want and then click Open. This action will import any saved files into the ScottradeELITE platform.

ScottradeELITE User Guide
Navigation 22
To access the Layout Manager, on the Main Menu, select Configure, and then click Layout Manager.
You can access the template by opening the feature specific to that template (for example, Charts) and pulling up the Template Manager.
• Save Layout – Allows you to save the layout that is currently active on the ScottradeELITE platform.
• Configure – The Configure submenu has several options.
Configure options include:
o Global Settings – Use Global Settings to choose your data stream preference, theme, language, show / hide tabs (in new windows only), or show / hide Account Quick View (Right Drawer).
o Ticker Settings – For more information, see the Active Ticker section.
o Trade Settings – Allows you to configure Order Entry settings. The same settings are available via the Order Entry Configure menu. For details, see the Order Entry section.
o Linker Settings – Launches a dialog box were you can set methods for linking common tools and windows, including Charts, Positions, Watch Lists, and Streaming News. For details, see The Linker Tool.
o Layout Manager – Using Layout Manager, you can create custom (up to 200) layouts, load a preset or custom layout, rename a layout, delete a layout, or save layouts to a list. Layout Manager also provides options to show a confirmation window you delete a layout or save changes to a layout automatically. For details, see the Layout Manager section.
o Hot Keys – Use Hot Keys to create keyboard shortcuts to commonly performed tasks. For details, see the Hot Keys section.
o Manage Subscriptions – Contains Market Depth and Trade Ideas® submenus.
Market Depth – Use Manage Premium Data Services to select Level II or Premium package data services. For details, see the Market Depth section.
Trade Ideas – Use Manage Trade Ideas Subscription to enter your account number and select the Trade Ideas service. For details, see the Trade Ideas section.
• Arrange Windows – Arrange Windows is a submenu (see image below) with the following:
o Cascade – Arranges all open windows in a cascading format.
o Tile Horizontally – Aligns all open windows horizontally.
o Tile Vertically – Aligns all open windows vertically.
o Bring All to Front - Places all windows to the front of the ScottradeELITE platform. All open windows are visible by clicking Bring to Front.
o Minimize All – Minimizes all open windows.
o Close All –Closes all open windows.

ScottradeELITE User Guide
Navigation 23
• Calculator – Launches the Windows Calculator.
• Log Off – Terminates your current session and logs you off ScottradeELITE. The difference between Log Off and Exit is that Log Off prompts you with a new Login box, while Exit simply shuts down the entire application.
• Help – The Help submenu contains the following:
o Provide Feedback – Launches a feedback form. You can select your type of feedback, include desktop screenshots, or enter your comments manually.
o ScottradeELITE Help – Takes you to a list of linked topics available in the Knowledge Center ScottradeELITE Help section.
o ScottradeELITE User Guide – Loads a PDF with detailed instructions for using ScottradeELITE.
o Knowledge Center – Redirects you to the ScottradeELITE Help section within the Scottrade.com Knowledge Center.
o Privacy Statement – Redirects you to the Scottrade Privacy Statement.
o Contact Us – Launches the Scottrade® client website’s home page and provides phone, email, and social media contact details.
o What’s New – Opens a page summarizing the additions and improvements in the latest release.
o Getting Started Wizard – Allows you to set up a theme, select a layout, set a font size, learn how to configure standard tools, subscribe to premium data services, and register for free third-party-provided newsletter subscriptions.
• Exit – Closes ScottradeELITE.

ScottradeELITE User Guide
Navigation 24
Account Menu
The Account menu contains account management tools specific to your portfolio.
• Place Trade – Loads an Order Entry window on the ScottradeELITE platform.
• Balances – Launches a Balances window.
• Order Status – Opens an Order Status window.
• Positions – Loads a Positions window.
• Account History – Takes you to the Account History section of Scottrade.com
• Gain/Loss Tax Center – Opens the Gain/Loss Tax Center within Scottrade.com.
• Scottrade Bank Access – Launches Scottrade Bank, giving you instant access to all your Scottrade Bank account services.
• Scottrade.com Access – Launches Scottrade.com.
• Account Management – Redirects you to the My Information and Preferences section of Scottrade.com.
• Fund Account – Redirects you to the Deposit section of Scottrade.com.
• Messaging – Takes you to the Message Center within Scottrade.com. The Message Center contains account specific messages and general messages.
• Reload Trading Data – Refreshes all trading information in the window.

ScottradeELITE User Guide
Navigation 25
Research Menu
The Research menu offers multiple research tools within the platform.
• Charts – Loads a Chart window.
• Company Profile – Opens the Company Profile window.
• Sector Trends – Opens a Sector Trends window.
• Advanced Scanner – Loads an Advanced Scanner window.
• Recognia – Opens a submenu with links to the following Recognia products: AlertWire, Intraday Trader, Strategy Builder, Technical Insight, and Value Analyzer.
• Trade Ideas – Launches the Manage Trade Ideas Subscription dialog box for non-subscribers or loads the Trade Ideas channel layout for subscribers.
• Upcoming Earnings – Loads the Upcoming Earnings window where you can view, search, sort, and filter on company earnings data.
• Zacks Predefined Screener – Opens Zacks Predefined Screener, a tool that may help you to identify stocks that meet your risk tolerance and return goals
• More Research – Redirects you to the Quotes and Research section of Scottrade.com.
• Learning Markets1 – Opens a submenu with the following market research choices located on the Client Website: Daily Market Commentary, Strategy Sessions, and Trader Podcasts.
• Newsletter Subscriptions - Opens a submenu with the following free subscription offerings: Recognia Market Newsletter and Trading Central.
¹ Brought to you by Learning Markets. The materials presented are being provided to you for educational purposes only. Scottrade, Inc. and its affiliates have not created and are not responsible for such materials. The content of such materials has not been adopted, endorsed or approved by Scottrade or its affiliates. The content was created and is being presented by an independent party not employed by or affiliated with Scottrade or its affiliates. The information presented or discussed is not a recommendation or an offer of, or solicitation of an offer by, Scottrade or its affiliates to buy, sell or hold any security or other financial product or an endorsement or affirmation of any specific investment strategy. You are fully responsible for your investment decisions. Your choice to engage in a particular investment or investment strategy should be based solely on your own research and evaluation of the risks involved, your financial circumstances, and your investment objectives. Scottrade and its affiliates are not offering or providing, and will not offer or provide, any advice, opinion or recommendation of the suitability, value or profitability of any particular investment or investment strategy.

ScottradeELITE User Guide
Navigation 26
Quotes Menu
The Quotes menu offers quote tools to manage Watch Lists, get Detailed Quotes, and access research and analysis tools within the platform.
• Watch Lists – Loads a Watch Lists window.
• Detailed Quote – Launches a Detailed Quote window.
• Velocity & Forces – Loads a Velocity & Forces window.
• Market Depth – Loads a Market Depth window.
• Time & Sales – Opens a Time & Sales window.
• Alerts – Loads an Alerts window.
• Market Movers – Opens the Market Movers window.
• Top Performers – Launch the Top Performers window.
News Menu
• Streaming News – Loads a Streaming News window.
• Yahoo! Finance Headlines – Launches the window where you can view the latest Yahoo! financial headlines and full news stories for the symbol you enter.
• More News – Takes you to the Quotes and Research section of Scottrade.com.
Option Tools Menu • Option Chains – Loads an Option Chains window. • Profit Loss – Launches the Profit Loss tool. • Skew Tool – Launches the Skew Tool.
Help • Provide Feedback – Opens a form for clients to enter feedback. • ScottradeELITE Help – Loads a ScottradeELITE section of the Scottrade.com
Knowledge Center. • ScottradeELITE User Guide – Loads a PDF containing comprehensive, detailed
instructions for using ScottradeELITE. • Knowledge Center – Redirects you to the ScottradeELITE help and how-to section of
the Scottrade.com Knowledge Center. • Contact Us – Sends you to the online page where phone, email, or online chat
information are available. • What’s New – Loads a page highlighting key features and enhancements from the latest
release. • Get Started Wizard – User-friendly pages help you choose a theme and layout, set up
tools, subscribe to premium data services and more.

ScottradeELITE User Guide
Navigation 27
Top Navigation – Other Tools and Features Icons or buttons representing other tools and features are located in the top right corner of the ScottradeELITE platform.
Button Image Button Name Description
Save Layout You can click Save Layout anytime within your
ScottradeELITE session to save your current layout.
Messages
Click to go to the Message Center within Scottrade.com. Click the Envelope button to quickly view your Scottrade account messages
Contact Us
When clicked, it redirects you to the Contact Us page on Scottrade.com. Clicking the Phone button will provide you with branch-specific contact information.
Knowledge Center Click to go to the Knowledge Center section of
Scottrade.com.

ScottradeELITE User Guide
Navigation 28
Lower Navigation • Trade Button – The Trade button is located in the lower left corner of the window and
allows you to access an Order Entry window. • Layout Manager – You can access the Layout Manager in the following ways:
o At the top of the ScottradeELITE platform, click the Main Menu and point to Configure.
o From the lower left corner, click the name of the active layout, and then click Layout Manager. In Image 2 below, the layout name is “Ticket.”
Image 1: Accessing Layout Manager from Top Navigation
Image 2: Accessing Layout Manager from Lower Navigation

ScottradeELITE User Guide
Navigation 29
On the Layout Manager menu, you can create a new layout, save a layout, or select an existing, saved layout from the list. For more information, see Managing Layouts.
When you click Layout Manager, a dialog box displays more layout settings and functionality, including:
• Search – You can search for a previously saved layout at the top of the Layout Manager dialog box by typing the layout name in the Search box.

ScottradeELITE User Guide
Navigation 30
• Load a Scottrade (Default) Layout – You can choose from several preset layouts in the Default Layouts list. To expand the list and load a preset layout, click the plus sign (+) to the left of Default Layouts. In the Default Layouts list, click the layout you want, and then click Load.
• Load a Previously Saved Layout – You can choose from up to 200 layouts you saved to the Layout Manager. To expand the list and load a custom layout, click the plus sign (+) to the left of Layouts. In the Layouts list, click the layout you want, and then click Load.
• Sorting Order – Arrange how your previously saved (custom) layouts appear in the Layout Manager using Sort Order. To arrange the order of the layouts, from the list of layouts in the Layout Manager dialog box, click the layout you want to move. With your layout selected, click the arrows to the right to move the layout up, down, to the top of the list, or to the bottom of the list.
• Set a Default Layout – The chosen default layout loads each time you launch ScottradeELITE. To set a layout as default, click the layout of choice, and click Set As Default below the list. When the default layout is saved, the word “(Default)” displays after the default layout name.
If you are using a layout other than your selected default layout, the word “(Active)” displays next to the layout you are using.

ScottradeELITE User Guide
Navigation 31
• Delete a Layout – To delete a layout, from the Layout Manager window, select a layout from the list, and then click Delete below the list of layouts. This action permanently deletes the selected layout.
When you delete a layout, a dialog box appears, asking if you want to delete the selected layout. To delete a layout without receiving this dialog box, clear the Show confirmation window when deleting layout(s) check box, and then click OK.
Renaming a Layout – To rename a layout, from the Layout Manager window, select a layout, and then click Rename. In the Rename Layout dialog box, type the name of your layout, and then click Save.
In the Layout Manager dialog box, click OK to complete the renaming action. To cancel this action, click Cancel.
• Layouts Saved Automatically – By default, any changes you make to a layout throughout your ScottradeELITE session are saved automatically. No manual save is needed. To not save changes to your layout by default, clear the Save Layout Changes Automatically check box.
• Loading Your Last-Used Layout –To load the last layout you used before you logged off automatically, select the Load Last Layout on Launch check box. When this check box is clear, ScottradeELITE will load your default layout, if you selected a default.
Managing Layouts
Using the Layout Manager menu, you can do the following:
• Save Layout – Clicking Save Layout saves any changes you have made to the active layout on the ScottradeELITE platform.
• Save Layout As – Clicking Save Layout As opens a dialog box where you can name the layout that is currently active on the ScottradeELITE platform.
• Create New Layout – Clicking Create New Layout launches a dialog box that requests a name for the new layout. When you save the new layout with a name, a blank canvas within the ScottradeELITE platform opens. Create New Layout is a start from scratch option.
If you already have a layout open, when you click Create New Layout, the system opens a dialog box that requests if you want to save your existing layout.

ScottradeELITE User Guide
Navigation 32
Switching Between Layouts You can switch between your custom layouts or Scottrade preset layouts in the following ways: • In the Layout Manager dialog box, click the layout you want, and then click Load.
• At the bottom of ScottradeELITE, on the Quick Access Bar, click the layout tab you want to load.

ScottradeELITE User Guide
Navigation 33
• At the bottom of ScottradeELITE, click the name of the active layout. On the Layout menu: o Point to Scottrade Layouts, and then click the layout you want to load, or
o In the custom layouts list, click the layout you want to launch.

ScottradeELITE User Guide
Navigation 34
Enabling the Quick Access Bar
To enable (show) or disable (hide) the Quick Access Bar at the bottom of ScottradeELITE, do the following:
1. On the Main Menu, point to Configure, and then click Global Settings.
2. In the Global Settings dialog box, select the Show Layout Bar check box, and then click OK.
The Quick Access Bar displays at the bottom of the ScottradeELITE platform.

ScottradeELITE User Guide
Navigation 35
Using Active Ticker
The active ticker is accessible via the Main Menu and provides a streaming feed of your chosen symbols. The active ticker is visible at the bottom of ScottradeELITE and you can customize it to stream the symbols you want.
To configure the Active Ticker, double-click the active ticker data, and make your selections from the Active Ticker dialog box that displays.
Active Ticker Dialog Box:
• Direction – You can view the active ticker in several directions: Scroll (default setting), Up, Down, Right, Left, Random, and None. Click None if you do not want to see animation when symbols change.
• Classic Ticker – You can set the symbols in the active ticker window to display a green background to denote a new high for the day and a red background to denote a new low for the day. To view this style, select the Classic Ticker check box.
• Add Symbols – To add a symbol to the active ticker, click the button above the symbol list. This action generates a blank row that allows you type the symbol you want.
• Deleting Symbols – To delete a symbol within the active ticker, select the symbol you want to remove and click the button above the list of symbols. This action removes the selected symbol.
• Sorting/Organizing Symbols – To rearrange the order of the symbols within the active ticker, select the symbol you want to move, and click the Up or Down arrow above the list of symbols. The selected symbol will move up or down in the list.
• Import Symbols from Symbol Lists – To import symbols from My Positions or My Watch Lists, click the icon and make your selection(s).
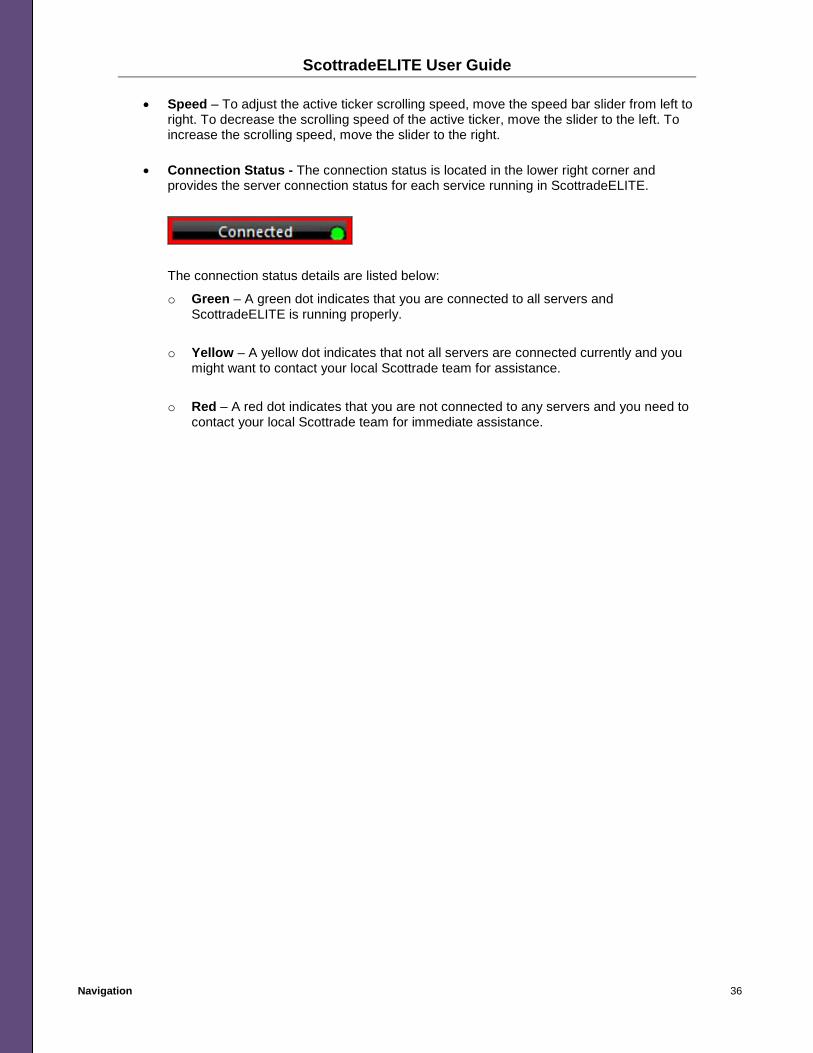
ScottradeELITE User Guide
Navigation 36
• Speed – To adjust the active ticker scrolling speed, move the speed bar slider from left to right. To decrease the scrolling speed of the active ticker, move the slider to the left. To increase the scrolling speed, move the slider to the right.
• Connection Status - The connection status is located in the lower right corner and provides the server connection status for each service running in ScottradeELITE.
The connection status details are listed below:
o Green – A green dot indicates that you are connected to all servers and ScottradeELITE is running properly.
o Yellow – A yellow dot indicates that not all servers are connected currently and you might want to contact your local Scottrade team for assistance.
o Red – A red dot indicates that you are not connected to any servers and you need to contact your local Scottrade team for immediate assistance.

ScottradeELITE User Guide
Navigation 37
Viewing Connection Status Details
To see the server connection status for each service:
1. In the lower right corner of the window, double-click the Connection Status.
2. The Connection Status dialog box lists the connection status of all servers you might be connected to by service. Green indicates you are connected to this service, red indicates you are not connected to this service.
3. To close the Connection Status dialog box, click OK.

ScottradeELITE User Guide
Themes 38
Themes When you log on to ScottradeELITE, the default theme loads. The default theme is the “Dark” theme. ScottradeELITE offers other theme selections that can enhance readability.
The “Dark” theme shows white text against a black background. The “Monochrome” theme displays images and text in varying tones of one color. The “Light” theme shows black text against a white background.
The system will apply the theme you select to all layouts except chart windows and custom colors. You may need to change the Time & Sales windows that contain custom text and highlight colors when you change the Global Theme or if you are not able to use the text or highlighting after a theme change.
Setting Themes To view Theme options or change your existing theme:
1. On the Main Menu, click Global Settings.

ScottradeELITE User Guide
Themes 39
2. Click the Theme arrow to see more options.
3. From the Theme list, click the theme you want to set as your default theme.

ScottradeELITE User Guide
Get Started Wizard 40
Get Started Wizard The Get Started Wizard is a tool that leads you through a series of well-defined steps to set up key tools, preferences, and subscription services in ScottradeELITE. The Get Started Wizard allows you to:
• Select a theme: light, monochrome or dark • Set a global font size • Select a pre-defined layout • Learn how to configure windows across ScottradeELITE • Subscribe to premium data services and complimentary newsletter subscriptions
provided by third-party entities unaffiliated with Scottrade, Inc.
Using the Wizard to Set Up ScottradeELITE When you log on to ScottradeELITE for the first time, your default layout loads and the Get Started Wizard displays on screen.
You can exit the Get Started Wizard without saving data at any point in the setup process. To exit the wizard, click Quit Setup.
Follow the steps below:
1. The Get Started dialog box provides an overview of the key tools, settings and subscriptions you can configure. To advance to the next screen, click Next.
2. In the Themes dialog box, choose a theme (light, monochrome or dark) for your
ScottradeELITE windows and layouts. Click Next.
3. In the Font dialog box, select the font size you want. Click Next.

ScottradeELITE User Guide
Get Started Wizard 41
4. In the Layout dialog box, select one of the preset layouts or an empty layout. Click Next.
5. The General Configuration Information dialog box provides an overview of tools you can configure and how to configure each tool. Click Next.
6. In the Premium Data Services dialog box, you may select a new service or make adjustments to an existing data subscription you may already have.
7. In the Complimentary Newsletter Subscriptions dialog box, next to the newsletter you want, click Subscribe Now to activate a subscription. Click Next.
The Get Started Wizard pre-selects any premium data service that you have subscribed to prior to using the wizard. Subscribing to premium data services is optional.
8. To complete your ScottradeELITE setup, in the Congratulations dialog box, click Finish.
You may access the Get Started Wizard again at any time by doing one of the following:
• On the Main Menu, point to Help, and then click Get Started Wizard. • On the Help menu, click Get Started Wizard.

ScottradeELITE User Guide
Order Entry 42
Order Entry In addition to the research, tracking and quoting tools offered on ScottradeELITE, you can also make trades quickly and easily. This section guides you through the features for placing security transactions.
Accessing Order Entry There are three ways to access the Order Entry window within ScottradeELITE:
• On the Main Menu, point to Account, and then click Place Trade.
• On the Account menu, click Place Trade.

ScottradeELITE User Guide
Order Entry 43
• In the bottom left corner of the window, click Trade.
Image 1: Trade button
Image 2: Trade button location.
The Order Entry window appears.

ScottradeELITE User Guide
Order Entry 44
Placing a Stock or ETF Order The Order Entry window opens with the Stock / ETF tab selected as the default. See the table below for Order Entry text box or list name and description details.
Name Description
Symbol Type the security symbol.
Buy/Sell Select an item from the list to verify how the order is submitted.
Quantity Enter a determined number of shares to trade each time.
Order Type Select an order type from the list and type the Limit price if available. • Market - An order to buy or sell a security immediately at the best available current
price; sometimes referred to as an unrestricted order. • Limit - An order to buy or sell a set number of shares at a specified price or better. • Stop on Quote - An order to buy or sell a security when its price exceeds an exact
point, ensuring a greater probability of achieving a fixed entry or exit price. • Stop Limit on Quote - An order that blends the traits of stop on quote order and a
limit order. • $Trailing Stop on Quote - A stop on quote order that sets the price at a fixed dollar
amount below (for a long position) and above (for a short position) the market price. The trigger or activation price is adjusted as the price of the security fluctuates.
• %Trailing Stop on Quote - A stop on quote order that sets the price at a fixed percentage below (for a long position) and above (for a short position) the market price. The trigger or activation price adjusts as the price of the security fluctuates.
Note: Click one of the quote buttons to quickly fill the limit price with that quoted price.
Limit Price Type the price to buy a security at or below a stated price or to sell a security at or above a stated price.
Stop Price Type the price that you want the order to buy or sell a security when its price exceeds a specific point.
Trail Type Select Points or Percent to define the Trailing Amount for a Trailing Stop on Quote order.
Trail Amount Type the amount of the Trailing Stop on Quote order.
Duration Select Day, GTC (Good Till Cancelled) or GTD (Good Till Date), subject to the order type. • Day – Any order to buy or sell a security that automatically expires if not executed on
the day the order is placed. • GTC – An order to buy or sell a security at a set price that is active until you decide to
cancel it or the trade is executed. GTC orders expire on the last day of the month after the month of the order placement, unless they are cancelled before that date.
Good Till Date
If available, type a date. The order remains active until the date you specified.
Note: You can also select a date from the Calendar icon to the right of the GTD box.
Time If available, select a time from the list. The order stays active until the time you specified.
Qualifiers Enter a determined number of shares to trade each time. If needed, select None or AON (All or None) from the list.
• None – No condition specified.
• AON – All or None. A condition used on a buy or sell order to instruct the broker to fill the order completely or not at all.
Session If available, select a session from the list.
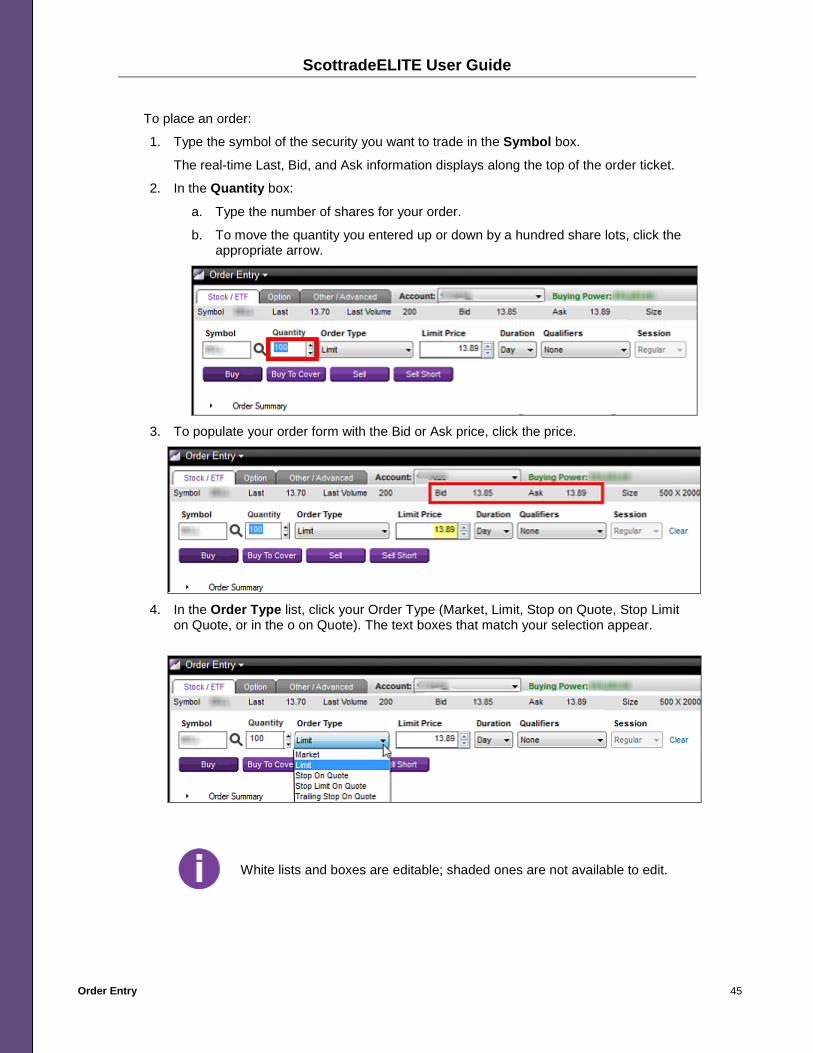
ScottradeELITE User Guide
Order Entry 45
To place an order:
1. Type the symbol of the security you want to trade in the Symbol box.
The real-time Last, Bid, and Ask information displays along the top of the order ticket.
2. In the Quantity box:
a. Type the number of shares for your order.
b. To move the quantity you entered up or down by a hundred share lots, click the appropriate arrow.
3. To populate your order form with the Bid or Ask price, click the price.
4. In the Order Type list, click your Order Type (Market, Limit, Stop on Quote, Stop Limit
on Quote, or in the o on Quote). The text boxes that match your selection appear.
White lists and boxes are editable; shaded ones are not available to edit.

ScottradeELITE User Guide
Order Entry 46
In the Limit Price, Stop Price, Trail Type, or Trail Amount box (if selected):
1. Type the value you want.
2. To move the price up or down in penny increments, press the appropriate key.
3. In the Duration list, click the amount of time you want your order to remain in queue. Your choices are Day, GTC (Good Till Cancelled) or GTD (Good Till Date).
4. In the Qualifiers list, click None or All or None (AON).
5. If available, in the Session list, click Regular or Extended.

ScottradeELITE User Guide
Order Entry 47
6. Click the action you want: Buy, Buy To Cover, Sell, or Sell Short.
7. After you have reviewed the order, click Place Order.
If confirmation windows are turned off; the order is submitted as soon as you click Place Order. There is no confirmation message.
Once the order is submitted, the order progress appears to the left of Place Order. When the order is confirmed, the reference number displays in this location. Order execution details display in this location. Orders also display in the Order Status window.

ScottradeELITE User Guide
Order Entry 48
Placing a Standard Options Order To place an option order from the Order Entry window, follow the steps below.
1. From the top of the Order Entry window, click the Option tab.
The Option Symbol Builder appears.

ScottradeELITE User Guide
Order Entry 49
The table below describes the items on the Option Symbol Builder dialog box:
Name Description
Symbol Type the symbol for the underlying security.
Buy/Sell Enter a determined the Market Side to trade each time. Select an item from the list to verify how the order will be submitted (Buy to Open, Buy to Close, Sell to Open or Sell to Close).
Expiration From the list, select when the option expires.
Strike Price From the list, select a strike price for the security.
Call / Put From the list, select the type of option.
Quantity Enter a determined number of shares to trade each time.
Note: Most option contracts represent 100 shares of the underlying security. If you enter 2 in this box, you will be trading 2 option contracts, representing 200 shares of the underlying security.
Order Type Select an order type from the list (Market, Limit, Stop on Quote, or Stop Limit on Quote) and type the Limit price, if available.
• Market - An order to buy or sell a security immediately at the best available current price; sometimes referred to as an unrestricted order.
• Limit - An order placed to buy or sell a set number of shares at a specified price or better.
• Stop on Quote - An order to buy or sell a security when its price reaches or passes a specific point, ensuring a greater probability of achieving a fixed entry or exit price.
• Stop Limit on Quote - An order that blends the traits of stop on quote order and a limit order.
Note: To quickly fill the limit price with that quoted price, click one of the quote buttons.
Limit Price For a Limit order, type the price to buy an option at or below a specified price or to sell an option at or above a specified price.
Stop Price For a Stop on Quote order, type the price that you want the order to buy or sell an option when its price surpasses a particular point.
Duration From the list, select a duration, depending on the order type.
• Day – Any order to buy or sell a security that automatically expires if not executed on the day the order is placed.
• GTC – An order to buy or sell a security at a set price that is active until the investor decides to cancel it or the trade is executed. GTC orders expire on the last day of the month following the month of the order placement, unless they are cancelled prior to that date.

ScottradeELITE User Guide
Order Entry 50
2. In the Symbol box, type the symbol of underlying security that you want to trade.
The real-time Last, Bid, and Ask information displays along the top of the order ticket.
3. To populate your order form with the Bid or Ask price, click the price.
4. In the Expiration list, click the time period when the option expires.
5. In the Strike Price list, click a strike price for the security.

ScottradeELITE User Guide
Order Entry 51
6. In the Call / Put list, click the type of option.
7. In the Quantity box:
8. Type the number of shares for your order.
9. To increase or decrease the quantity you entered by increments of a hundred, press the arrow key.
Most option contracts represent 100 shares of the underlying security. If you enter 2 in this box, you are trading 2 option contracts, representing 200 shares of the underlying security.
10. In the Order Type list, click your order type (Market, Limit, Stop on Quote, or Stop Limit on Quote) and type the Limit price, if available.
The Limit Price and Stop Price boxes appear depending on your selection.
11. In the Limit Price or Stop Price box (if selected):
12. Click one of the quote buttons to quickly fill the limit price with that quoted price or type the value you want.
13. To move the price up or down in penny increments, press the appropriate key. In the Limit Price or Stop Price lists, click the choice you want.

ScottradeELITE User Guide
Order Entry 52
In the Duration list, click your order duration. Your choices include Day, GTC (Good Till Cancelled) or GTD (Good Till Date).
In the Qualifiers list, click None or AON (All or None).
14. After you have verified that the information you entered is accurate and you are ready to place your order, click Place Order.
If confirmation windows are turned off; the order is submitted as soon as you click Place Order. No confirmation message appears. If you would like verification, see instructions under the Show Confirmation Window when Placing Orders section.
Once the order is submitted, the order progress appears to the left of Place Order. When the order is confirmed, the reference number displays in this location. Orders also display in the Order Status window.

ScottradeELITE User Guide
Order Entry 53
Order Entry Template (Tickets) There are six templates available in the Order Entry window: Standard Ticket, Classic Ticket, Slim Ticket, Slim Classic Ticket, Simple Ticket, or Vertical Ticket. Each template allows you to customize the size of the window. By default, the Order Entry window opens the Standard Ticket template view.
Selecting a Template View
You may select a template in the following ways:
• On the Order Entry menu, point to Tickets, and then select the ticket type you want.
• In the Configure Order Entry dialog box, click the Default Order Entry arrow, select the ticket type you want, and then click OK.

ScottradeELITE User Guide
Order Entry 54
Setting up Order Entry Using the Configuration settings in Order Entry, you can select trade details to display by default when you launch a new ticket. You can configure Order Entry to display confirmation messages or alerts when you open, modify, or cancel an order. Other settings include trade execution notices, dismissing trade execution alerts after a time period, and automatically clearing the order ticket.
To configure your Order Entry window:
1. On the Order Entry menu in the top left corner of the Order Entry window, click Configure.
2. The Configure Order Entry dialog box displays the default settings for the Order Entry window.

ScottradeELITE User Guide
Order Entry 55
3. To modify any of these options, click an item from a list where available (Buy / Sell, Order Type, Duration, and Qualifiers).
4. Under General Settings, select or clear the check boxes next to the setting.
5. Click OK.
By default, all check boxes except Automatically dismiss Trade Execution Alerts after 60 seconds are selected for Order Entry. You can adjust the settings based on your trading preferences.
Setting Trade Details for Stock/ETF and Option Orders Select from preset trade details in the stock / ETF or option order ticket to gain time per trade. Your saved trade details display automatically when you launch a new order entry ticket.
To set trade details for stock / ETF and option orders:
1. On the Order Entry menu, click Configure.
2. Do the following:
3. In the Stock / ETF Presets section, select or enter your trade details (Buy / Sell, Quantity, Order Type, Duration, and Qualifiers).
4. In the Options Presets section, select or enter your trade details (Buy / Sell, Quantity, Order Type, Duration, and Qualifiers).

ScottradeELITE User Guide
Order Entry 56
5. Click OK.
The Order Entry ticket displays the preset trade details in your Stock / ETF and Option tabs.

ScottradeELITE User Guide
Order Entry 57
Show Confirmation Window When Placing Orders To set up Order Entry to display the Show Confirmation Window when Placing Orders window, follow the steps below.
1. On the Order Entry menu, click Configure.
2. Under General Settings in the Configure Order Entry dialog box, select the Show Confirmation Window when Placing Orders check box, and then click OK.
Enabling this setting will launch the Order Confirmation window.

ScottradeELITE User Guide
Order Entry 58
Show Confirmation Window When Cancelling Orders To set up Order Entry to display the Show Confirmation Window when Cancelling Orders window, follow the steps below.
1. On the Order Entry menu, click Configure.
2. Under General Settings in the Configure Order Entry dialog box, select the Show Confirmation Window when Cancelling Orders check box, and then click OK.
Enabling this setting will launch the Order window.

ScottradeELITE User Guide
Order Entry 59
Show Confirmation Window When Modifying Orders To set up Order Entry to display the Show Confirmation Window when Modifying Orders window, follow the steps below.
1. On the Order Entry menu in the top left corner of the Order Entry window, click Configure.
2. Under General Settings in the Configure Order Entry dialog box, select the Show Confirmation Window when Modifying Orders check box, and then click OK.
Enabling this setting will launch the Order Modification window.

ScottradeELITE User Guide
Order Entry 60
Show Notification Window When Modify an Order Overrides Current Order Being Built
To set up Order Entry to display the Show Notification Window when Modify an Order overrides the current order being window, follow the steps below.
1. On the Order Entry menu, click Configure.
2. Under General Settings in the Configure Order Entry dialog box, select the Show Notification Window when Modify an Order overrides the current order being built check box, and then click OK.
Enabling this setting will launch a notification window when an order has been started in the order entry window and a modification would replace the entered selections.

ScottradeELITE User Guide
Order Entry 61
Show Disclaimer Window When Placing Trailing Stop on Quote Orders To set up Order Entry to display the Show Disclaimer Window when Placing Trailing Stop on Quote Orders window, follow the steps below.
1. On the Order Entry menu, click Configure.
2. Under General Settings in the Configure Order Entry dialog box, select the Show Disclaimer Window when Placing Trailing Stop on Quote Orders check box, and then click OK.
Enabling this setting will launch the disclaimer window.

ScottradeELITE User Guide
Order Entry 62
Show Disclaimer Window When Placing Orders during Extended Hours To set up Order Entry to display the Show Disclaimer Window when Placing Orders during Extended Hours window, follow the steps below.
1. On the Order Entry menu, click Configure.
3. Under General Settings in the Configure Order Entry dialog box, select the Show Disclaimer Window when Placing Orders during Extended Hours check box, and then click OK.
Enabling this setting will launch the Extended Hours Trading Risks/Disclaimer window.
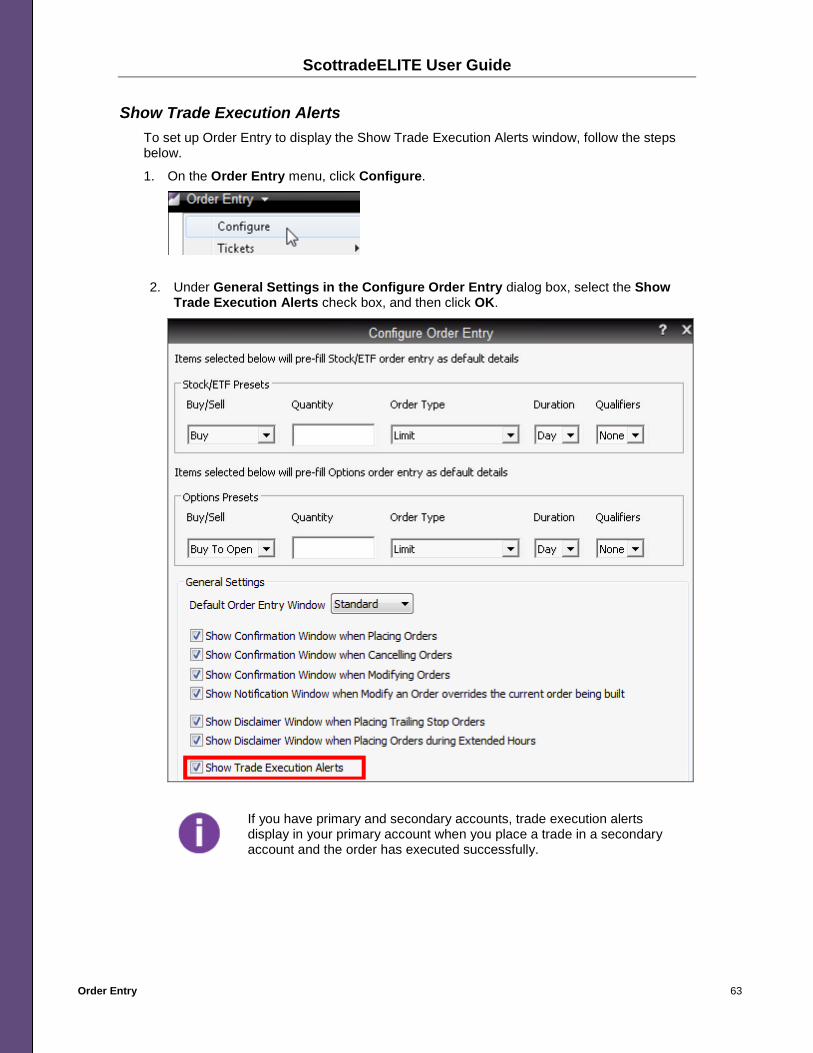
ScottradeELITE User Guide
Order Entry 63
Show Trade Execution Alerts To set up Order Entry to display the Show Trade Execution Alerts window, follow the steps below.
1. On the Order Entry menu, click Configure.
2. Under General Settings in the Configure Order Entry dialog box, select the Show Trade Execution Alerts check box, and then click OK.
If you have primary and secondary accounts, trade execution alerts display in your primary account when you place a trade in a secondary account and the order has executed successfully.

ScottradeELITE User Guide
Order Entry 64
Show Trade Execution Notice To set up Order Entry to display the Show Trade Execution Notice window, follow the steps below.
1. On the Order Entry menu, click Configure.
2. Under General Settings in the Configure Order Entry dialog box, select the Show Trade Execution Notice in Order Entry check box, and then click OK.
Enabling this setting displays a confirmation window in the Order Entry message text area when an order executes.
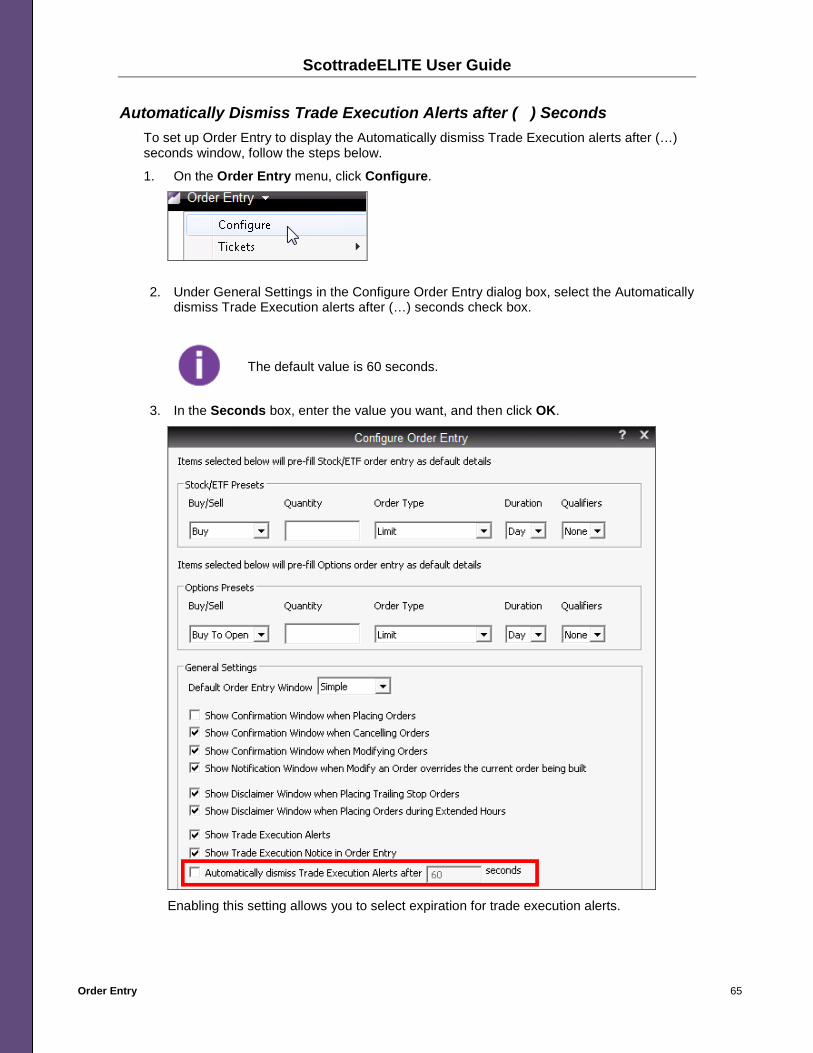
ScottradeELITE User Guide
Order Entry 65
Automatically Dismiss Trade Execution Alerts after ( ) Seconds To set up Order Entry to display the Automatically dismiss Trade Execution alerts after (…) seconds window, follow the steps below.
1. On the Order Entry menu, click Configure.
2. Under General Settings in the Configure Order Entry dialog box, select the Automatically dismiss Trade Execution alerts after (…) seconds check box.
The default value is 60 seconds.
3. In the Seconds box, enter the value you want, and then click OK.
Enabling this setting allows you to select expiration for trade execution alerts.

ScottradeELITE User Guide
Order Entry 66
Setting Order Quantity Limits You can set a maximum value or limit on the quantity you enter for an equity or options order. In the Order Entry window, when the amount you enter is larger than the quantity limit you set, you will receive a message asking you to verify the quantity you entered. The warning message displays before the order review window.
1. On the Order Entry menu, click Configure.
2. Under General Settings in one or both quantity limit boxes (Stock/ETF Quantity Limit box and/or Options Quantity Limit box), enter the quantity limit.
3. Next to the quantity limit box, select the Enable check box, and then click OK.

ScottradeELITE User Guide
Order Entry 67
Placing Advanced / Other Orders
One-Cancels-the-Other Order (OCO)
A one-cancels-the-other (OCO) order is an advanced order that allows two orders (typically a stop on quote order and a limit order) to be placed at the same time. When either the stop price or limit price is reached and the order is executed, the other order is automatically canceled.
To place an OCO order:
1. On the Main Menu, point to Account, and then click Place Trade.
The Order Entry window displays with the Stock / ETF tab selected as the default.
2. Click the Other / Advanced tab. The Advanced Orders window appears.

ScottradeELITE User Guide
Order Entry 68
3. In the Order list, select One Cancels Other (OCO).
4. In the Build Order area, type your selections in the available boxes or click a selection from the available lists (Symbol, Security Type, Quantity, Order Type, Limit Price, Stop Price, Trail Type, Duration).
The selections vary based on the security and order type values you enter.
For additional information about options orders, see Placing an Option Order.
5. To copy the order you entered in the Build Order area, click anywhere in the Order 1 box.
6. To add a second order, click the Order 2 box or click Build Next Order.
7. In the Order 2 box, type the order information for the second order.

ScottradeELITE User Guide
Order Entry 69
8. To place the advanced order, click Place Order.
One-Cancels-All Order (OCA)
A one-cancels-all (OCA) is an advanced order that consists of three orders. If one order is filled, the other orders are canceled. Use this type of order if you want to invest a certain dollar amount in one company but have several candidates to choose from.
To place an OCA order:
1. On the Main Menu, point to Account, and then click Place Trade.
The Order Entry window displays with the Stock/ETF tab selected as the default.

ScottradeELITE User Guide
Order Entry 70
2. Click the Other / Advanced tab. The Advanced Orders window appears.
3. From the Order list, select One Cancels All (OCA).
4. In the Build Order area, type your selections in the available boxes or click a selection from the available lists (Symbol, Security Type, Quantity, Order Type, Limit Price, Stop Price, Trail Type, Duration).
The selections vary based on the security and order type values you enter.
For additional information about options orders, see Placing an Option Order.

ScottradeELITE User Guide
Order Entry 71
5. To copy the order you typed in the Build Order area, click anywhere in the Order 1 box.
6. To add a second order, click the Order 2 box or click Build Next Order.
7. In the Order 2 box, type the order information for the second order.
8. To place the advanced order, click Place Order.

ScottradeELITE User Guide
Order Entry 72
Conditional Order (CO)
A conditional order is submitted based on criteria you define when entering the order, such as volume, percent change, intraday change, or whether the bid or ask hits a certain limit.
For example, you can set up an order that would buy 100 shares of Google if it hits its 52-week high. Conditional orders are available for all order types; however, the conditions available for options orders are limited to bid and ask.
Orders can only be placed in the regular market session and are only good for the regular market session. Orders cannot be placed or executed in the extended hours session.
The table below describes the conditional order fields:
Name Description
Symbol Type the security symbol.
Security Type From the list, select Stock/ETF or Option.
Trigger Select the event action that initiates the condition.
Condition Select the comparison for the triggering event.
Amount Type the dollar amount or percentage for meeting the condition.
Expiration Select the date when the condition expires.
Time Select the time when the condition expires.
To place a conditional order:
1. On the Main Menu, select, point to Account, and then click Place Trade.
2. The Order Entry window displays with the Stock / ETF tab selected as the default.
3. Click the Other / Advanced tab. The Advanced Orders window appears.

ScottradeELITE User Guide
Order Entry 73
4. In the Advanced Order Type list, click Conditional.
5. From the Place This Order area, under If the following event occurs, click Add Another Condition, and complete the second condition for the order.
The condition area expands to show the second condition area.
6. To remove the second condition, click Remove Condition.
7. To place the advanced order, click Place Order.

ScottradeELITE User Guide
Order Entry 74
Option Order
To place an option order:
1. From the Order Entry window, click the Other / Advanced tab.
2. In the Order list, click the order type of your choice: One Cancels Other (OCO), One Cancels All (OCA), or Conditional.
3. In the Security Type list, click Option.

ScottradeELITE User Guide
Order Entry 75
4. Use the boxes and lists available in the Option Symbol Builder to choose the contract you want to trade and to specify your order details.
The real-time Last, Bid, and Ask information is located at the top of the Order Entry window.
5. If you are placing an OCO or OCA order, the order summary updates as you complete the Order Entry fields.
6. When your order is complete, click Place Order.
As with a Standard order, order verification does not appear by default. See instructions for modifying your Order Entry settings to Show Confirmation Window When Placing Orders.
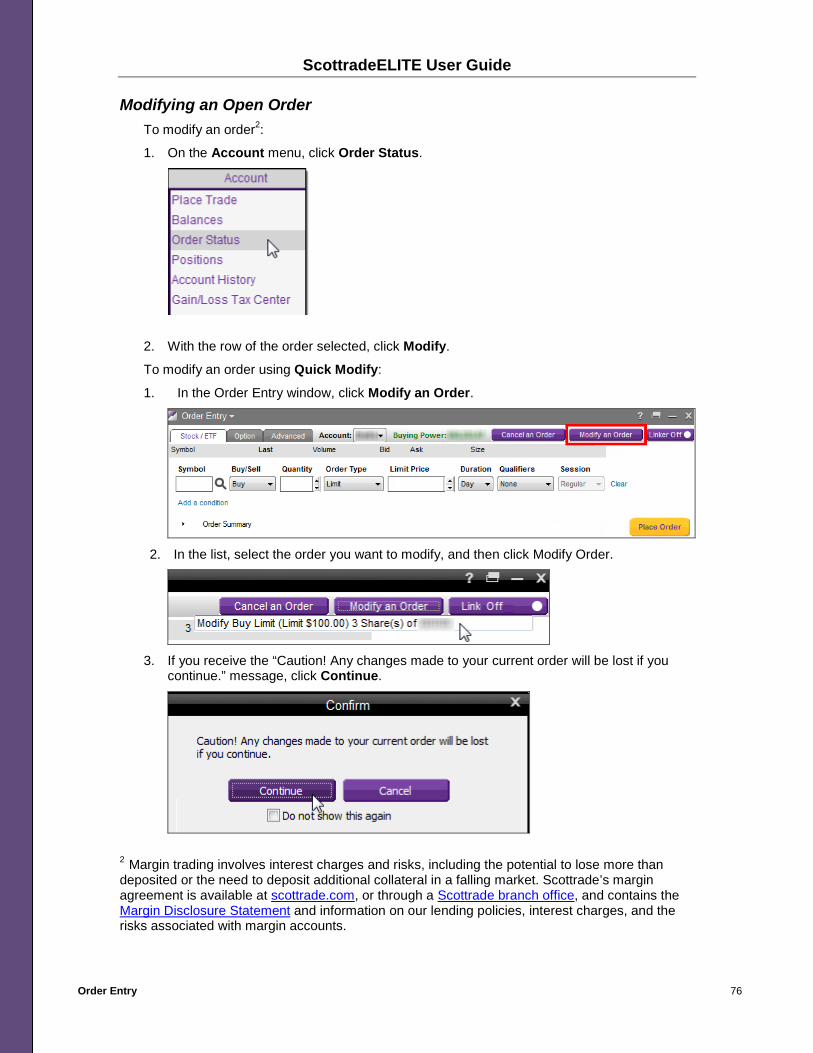
ScottradeELITE User Guide
Order Entry 76
Modifying an Open Order To modify an order2:
1. On the Account menu, click Order Status.
2. With the row of the order selected, click Modify.
To modify an order using Quick Modify:
1. In the Order Entry window, click Modify an Order.
2. In the list, select the order you want to modify, and then click Modify Order.
3. If you receive the “Caution! Any changes made to your current order will be lost if you
continue.” message, click Continue.
2 Margin trading involves interest charges and risks, including the potential to lose more than deposited or the need to deposit additional collateral in a falling market. Scottrade’s margin agreement is available at scottrade.com, or through a Scottrade branch office, and contains the Margin Disclosure Statement and information on our lending policies, interest charges, and the risks associated with margin accounts.

ScottradeELITE User Guide
Order Entry 77
4. Make the changes to your order and then, in the Order Entry window, click Modify Order.
5. In the Order Review window, verify your changes, and then click Modify Order.
The order confirmation appears.

ScottradeELITE User Guide
Order Entry 78
Cancelling an Order To cancel an order from the Order Entry window:
1. At the top right corner of the Order Entry window, click Cancel an Order.
2. Choose to cancel all open orders that currently exist or cancel just one individual order by
selecting that order in the list.
3. In the Confirm dialog box, if you receive the “Do you want to cancel the order:
<description of order>.” message, click Yes.
The order confirmation appears.

ScottradeELITE User Guide
Order Entry 79
Linker Tool Use the Linker Tool within the Order Status window to connect multiple windows so the symbol entered into one window displays in all linked windows simultaneously. For additional information, see Linker Tool.
<Tool Name> Menu The <Tool Name> menu contains options that allow you to execute common tasks. Options include printing, exporting data, refreshing or reloading trading data, accessing help information, detaching or attaching window positions, and closing windows. The options may vary slightly depending upon the tool you are using. For additional information, see <Tool Name> Menu.
Symbol Lookup Symbol Lookup, which is included within most tools in ScottradeELITE, provides you with more information about a company via its symbol. For more information, see Symbol Lookup.
Minimize / Restore Minimize and restore buttons are available on the top bar of all active windows on the ScottradeELITE platform. For more information, see Minimize / Restore.

ScottradeELITE User Guide
Balances 80
Balances The Balances window provides immediate access to the current account balances of all your linked accounts so you know exactly how much you have available for trading at any given time. Balances display differently based on your account type: cash, margin, and pattern day trading3. If you have a Scottrade Bank account, your account balance displays in the Balances window.
Accessing and Updating Balances There are two ways to access the Balances window:
• On the Main Menu, point to Account, and then click Balances. • On the Account menu, click Balances.
Viewing Deposits To make a deposit, to the right of the Account Number box, click the Deposit link.
This action redirects you to the Deposit section of Scottrade.com where you can quickly make a deposit into your Scottrade account.
3 Day trading is very risky. Please read the Day-Trading Risk Disclosure Statement before engaging in any day-trading strategy.

ScottradeELITE User Guide
Balances 81
Account Types Account types include margin account balances, cash account balances, and day trading account balances. For more information about the fields for a specific account type, see the tables below.
Margin Account Balances
Name Description
Total Brokerage Account Value
The total value of your brokerage account is calculated as the sum of your positions market value plus your cash balance.
Positions Market Value
The market value of all the positions in your account is calculated as the sum of your securities, mutual funds, CDs & bonds market value plus your options market value.
Cash Balance The total amount of funds in the cash portion of your account is called your brokerage cash balance.
Buying Power Marginable Securities
This balance shows the funds in your account that may be used for the additional purchase or short selling of marginable securities. Any funds used in excess of the margin settled credit balance are a loan and are charged margin interest.
Buying Power Non-Marginable Securities
This balance shows the funds in your account that may be used to purchase non-marginable securities. Any funds used in excess of the margin settled credit balance are a loan and are charged margin interest.
Funds Applied to Open Buy Orders
The balance is the total amount of funds that are removed from your account if all of your open buy orders are executed.

ScottradeELITE User Guide
Balances 82
Cash Accounts
Name Description
Total Asset Value The total value of your brokerage account is calculated as the sum of your positions market value plus your cash balance.
Positions Market Value
The market value of all the positions in your account is calculated as the sum of your securities, mutual funds, CDs & bonds market value plus your options market value.
Cash Balance The total amount of funds in the cash portion of your account is called your brokerage cash balance.
Funds Available for Trading
This balance indicates the total funds available for purchasing securities. You can use settled or unsettled funds for buying securities. If you want to use only settled funds to purchase securities, view the settled funds available for trading balance.
Funds Applied to Open Buy Orders
This balance is the total amount of funds that are removed from your account if all of your open buy orders are executed.
Settled Funds Available for Trading
You can view settled or unsettled funds in your cash account as an alternative to viewing your funds via the Scottrade® client website.

ScottradeELITE User Guide
Balances 83
Day Trading Accounts
Name Description
Total Brokerage Account Value
The total value of your brokerage account is calculated as the sum of your positions market value plus your cash balance.
Positions Market Value
The market value of all the positions in your account is calculated as the sum of your securities, mutual funds, CDs & bonds market value plus your options market value.
Cash Balance The total amount of funds in the cash portion of your account is called your brokerage cash balance.
Current Day Trading Buying Power (DTBP)
Your DTBP is the amount of money you have available in your account to place day trades on a given trading day, and it only applies to margin accounts classified as Pattern Day Trading accounts with $25,000 or more in equity.
Account Maintenance Excess
Your Account Maintenance Excess balance is the amount of marginable equity above the minimum account requirements as of the previous day's closing prices.
Beginning Day Trading Buying Power (DTBP)
Your Beginning of Day DTBP is equal to four times the amount of your Account Maintenance Excess as of the previous day's closing prices. This is the total amount of funds you have available for intraday trading throughout the day.
Today’s Impact on DTBP
Your Today's Impact on DTBP balance is a calculation of the net impact of today's trades, using execution prices. It includes all opening transactions on a position during the current trading day. If you close out a position that you opened earlier in the day, or participated in a day trade, the impact are reduced by the amount required for the opening transaction. Today's Impact on DTBP reduces the Current DTBP of your account.
Funds Applied to Open Buy Orders
This balance is the total amount of funds that are removed from your account if all of your open buy orders are executed.
Buying Power Marginable Securities
This balance shows the funds in your account that may be used for the additional purchase or short selling of marginable securities. Any funds used in excess of the margin settled credit balance are a loan and are charged margin interest.
Buying Power Non-Marginable Securities
This balance shows the funds in your account that may be used to purchase non-marginable securities. Any funds used in excess of the margin settled credit balance are a loan and are charged margin interest.
Funds Applied to Open Buy Orders
This balance is the total amount of funds that are removed from your account if all of your open buy orders are executed.

ScottradeELITE User Guide
Order Status 84
Order Status The Order Status window provides information on any order you have placed that is open, completed, has expired, or has been canceled. You can use the Order Status window to keep track of trading activity in your account or modify an order that has not executed yet.
Configuring Order Status Follow the instructions below to add new columns or remove existing columns.
Adding Columns
1. Add a column to Order Status using one of the following ways:
a. On the Order Status menu, click Configure.
b. Right-click anywhere in the Order Status window and click Configure.

ScottradeELITE User Guide
Order Status 85
2. In the Configure Order Status box, locate the item in the Available list in the following ways.
o Search. In the Search box, type the name of the item. The result displays in the Available list.
o View. Next to View, click Alphabetical to sort the column heading data list in alphabetical order or click By Category to sort the list by available categories.
3. In the Available list, click the column you want to display in the Order Status window.
To select multiple columns from the Available or Selected lists, hold down Shift or Ctrl while clicking the column in the list.

ScottradeELITE User Guide
Order Status 86
4. Click Add
Your columns display in the Selected list to the right.

ScottradeELITE User Guide
Order Status 87
5. Click OK.
The columns display in your Order Status window.
Removing Columns
1. Remove a column from Order Status using one of the following ways:
a. On the Order Status menu, click Configure.
b. Right-click the Order Status window and click Configure.
2. In the Configure Order Status box, in the Selected list, select the column data item or items you want to remove from the Order Status window.

ScottradeELITE User Guide
Order Status 88
3. Click Remove.
4. Click OK.
The columns will no longer display in your Order Status window.
Resizing Columns
You can adjust the column size within the Order Status window by doing one of following:
• Click-and-Drag. Point to the edge of the column heading. When the pointer becomes a double-headed arrow, drag the pointer to adjust the column size.
• Double-click. Point to the edge of the column heading. When the pointer becomes a
double-headed arrow, double-click the column. The column (or row) automatically adjusts to fit the widest entry.

ScottradeELITE User Guide
Order Status 89
Checking Order Status There are two ways to check the status of an order:
• On the Main Menu, point to Account, and then click Order Status.
• On the Account menu at the top of ScottradeELITE, click Order Status.
The Order Status window appears.
When viewing information in the Order Status window, you can filter page results by selecting the Additional Filters link at the top of the window.
Filtering Orders In the Order Status window, you can filter the page results by clicking the Additional Filters link at the top of the window. The Order Status window expands and displays filter categories near the top. You can use the filter categories to filter orders by Date, Order Type, Status, or Symbol. As you select new filters, your order status list applies the filters in real-time.

ScottradeELITE User Guide
Order Status 90
Filter by Date
In the Date list, click one of the following order categories:
• All Available • Today • Last 7 Days • Last 30 Days
Custom Range. For Custom Range, choose a specific range of dates. Type the dates you want in the Start Date box and End Date box, and then click OK.
Filter Order History by Order Type
In the Order Type list, select one of the order categories. The order categories include:
• All Available • Ext/Limit (Extended hours/Limit) • Limit • Market • Stop on Quote • Stop Limit on Quote • Trailing Stop on Quote
Filter by Order Status
In the Status list, select one of the following order categories:
• All Available • Open • Completed • Canceled • Expired
Filter by Symbol
In the symbol box, type the symbol you want to use to filter your orders.
The symbol box enables you to filter for symbols containing the characters entered.

ScottradeELITE User Guide
Order Status 91
Sorting Orders You can sort the orders list in the Order Status window by any of the columns.
To Sort Orders… Click Column Heading…
By column heading Once
In ascending order Once
In descending order Twice
Modifying or Canceling Open Orders Open orders have links that allow you to modify or cancel your order.
To… Click…
Change the details of your order. When you click the Modify link, the Order Entry window opens and enables you to make changes to your order details.
Modify
Close your order before it executes. You are asked to confirm your cancellation.
Sell
Canceling All Orders
To cancel all open orders:
1. In the Order Status window, click Cancel All Orders.
2. If you receive the “Are you sure you want to cancel all open orders?” message, click
Yes.
3. ScottradeELITE sends the cancel action for all open orders and changes the status from
“Open” to “Cancelled.”

ScottradeELITE User Guide
Order Status 92
Viewing an Advanced Order from Order Status You can view the status of your advanced (OCO or OCA) orders from the Order Status window. The orders display with all the component orders listed.
To view the status of your order from the Order Status window, click the arrow next to the group order number to expand the order.
The Order Status window displays the individual components of the group order.
Modifying Advanced Orders from Order Status You can open and modify your advanced (OCO or OCA) orders from the Order Status window.
1. Click the Modify link on one component order.
ScottradeELITE displays the Order Entry ticket with this component order entered as the active order. The fields that you can modify are active; you cannot modify the shaded fields.

ScottradeELITE User Guide
Order Status 93
2. Apply any changes (if necessary) and click Modify Order.
The Order Review window appears:
3. Click Modify Order.
4. The Order Review window closes, and the Order Entry window displays “Order Sent” with the reference number to indicate that the order modification was successful.
The Order Status window shows the updated information in the component order under the original group order number.
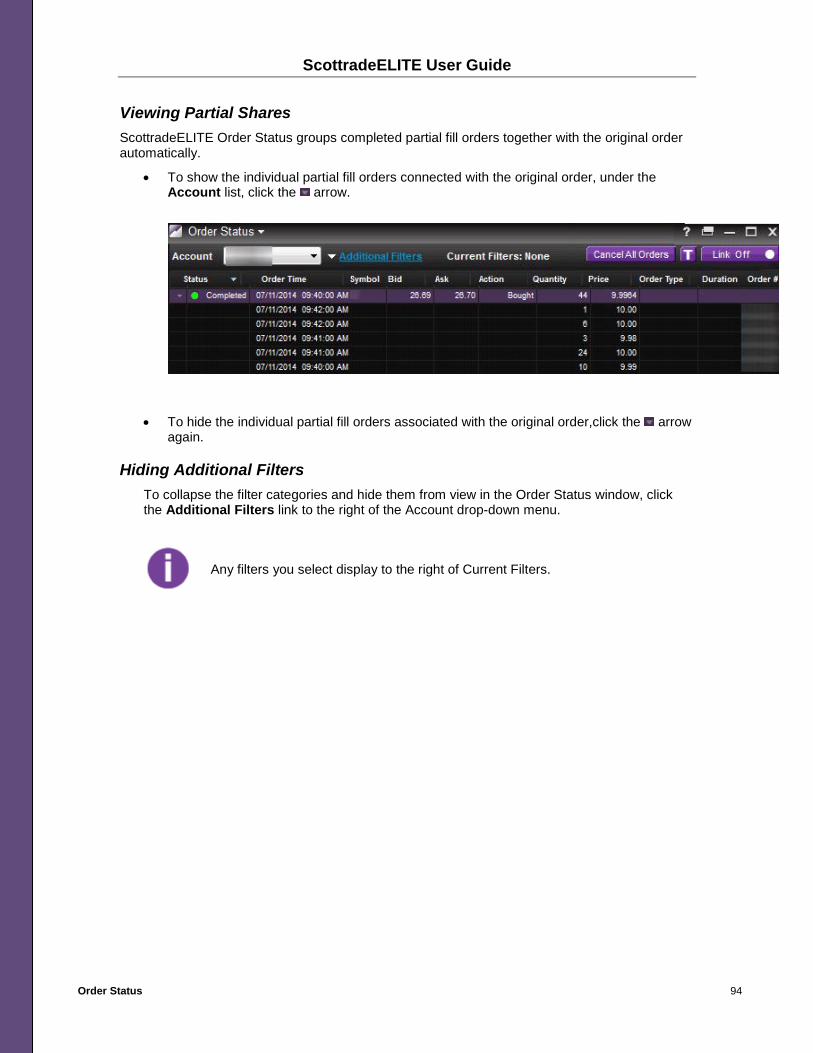
ScottradeELITE User Guide
Order Status 94
Viewing Partial Shares ScottradeELITE Order Status groups completed partial fill orders together with the original order automatically.
• To show the individual partial fill orders connected with the original order, under the Account list, click the arrow.
• To hide the individual partial fill orders associated with the original order,click the arrow again.
Hiding Additional Filters To collapse the filter categories and hide them from view in the Order Status window, click the Additional Filters link to the right of the Account drop-down menu.
Any filters you select display to the right of Current Filters.

ScottradeELITE User Guide
Order Status 95
Linker Tool Use the Linker Tool within the Order Status window to connect multiple windows so the symbol entered into one window displays in all linked windows simultaneously. For additional information, see Linker Tool.
<Tool Name> Menu The <Tool Name> menu contains options that allow you to execute common tasks. Options include printing, exporting data, refreshing or reloading trading data, accessing help information, detaching or attaching window positions, and closing windows. The options may vary slightly depending upon the tool you are using. For additional information, see <Tool Name> Menu.
Right-click Functionality Several tools in ScottradeELITE offer a shortcut menu with various options. The shortcut menu opens when you right-click anywhere in the window. For more information, see Right-click Functionality.
Symbol Lookup Symbol Lookup, which is included within most tools in ScottradeELITE, provides you with more information about a company via its symbol. For more information, see Symbol Lookup.
Minimize / Restore Minimize and restore buttons are available on the top bar of all active windows in ScottradeELITE. For more information, see Minimize / Restore.
Template Manager Template Manager is functionality found in several ScottradeELITE tools or windows. Located in the top right corner of the tool or active window, Template Manager is represented by a button. For more information, see Template Manager.

ScottradeELITE User Guide
Positions 96
Positions The Positions page of your account is designed to help you track your investments, and monitor their market performance with information you choose to display. With the ability to choose the information that is important to you, you can easily see how your individual investments are contributing to your overall trading strategy and monitor any investments that are approaching a sell target you may have established.
Accessing Positions There are two ways to access the Positions window:
• On the Main Menu, point to Account, and then click Positions.
• On the Account menu, click Positions.
From the Positions window, you can view your current positions across all your linked accounts.

ScottradeELITE User Guide
Positions 97
To view the Positions in a linked account, click the Account arrow below the Positions heading and select an available linked account.
The Accounts list displays any linked accounts you have at Scottrade.
Viewing Deposits To view the deposits, to the right of the Account box, click the Deposit link.
This action redirects you to the Deposit section of Scottrade.com where you can quickly make a deposit into your Scottrade account.

ScottradeELITE User Guide
Positions 98
Viewing Equity Events Information for a Security When you set up the Events column in your Positions window, icons will display for the security symbol entered for the following events:
• Projected Earnings: Displays if an event is approaching in the next 3 weeks for an equity.
• Historical Earnings: Shows the past events in the last 5 business days for an equity. • Offerings: Displays the offering type (IPO or SPO), exchange and settlement date for the
last 5 business days. • Dividends: Provides the pay date, event type (dividend) and amount if in the next 3
weeks or the last 5 business days. • Recognia Items: Shows when a Recognia Technical Event has occurred in the last 5
business days. • Splits: Shows the type (split), the date the split occurred and the ratio has occurred in the
last 5 business days. • Zacks List Items: Signals that the security currently meets Zacks criteria.
Viewing Projected Earnings
If an equity in the Symbol column of your Positions window has upcoming earnings information, an earnings icon will display in the Events column for that equity.
To view additional projected earnings information for a specific equity, add the Events column (for instructions, see Setting up Positions) and point to the earnings icon. A tooltip displays the following:
• Date expected • Consensus (low-high) • Number of analysts reporting

ScottradeELITE User Guide
Positions 99
Viewing Historical Earnings
If an equity in in the Symbol column of your Positions window has historical earnings information, an earnings icon will display in the Events column for that equity.
To view additional historical earnings information for a specific equity, point to the earnings icon. A tooltip displays the following:
• Date • Actual earnings amount • Number of Analysts reporting • % Surprise (difference between consensus and actual amounts)
Viewing Offerings
If an equity in the Symbol column of your Positions window has an offering (IPO or SPO), an offerings icon will display in the Events column for that equity.
To view more offerings details for a specific equity, point to the offerings icon. A tooltip displays the following:
• Exchange • Type (IPO or SPO) • Settlement Date
Viewing Dividends
If an equity in the Symbol column of your Positions window has an ex-dividend date, a dividends icon will appear in the Events column for that equity.
To view additional dividends details for a specific equity, point to the dividends icon. A tooltip displays the following:
• Ex-Date [mm/dd/yyyy] • Type: Dividend • Amount:
Viewing Recognia Items
If a Technical Event about an equity in the Symbol column of your Watch List window can be found in Recognia AlertWire, a Recognia icon will display in the Events column for that equity.
To view additional Recognia list information details for a specific equity, point to the Recognia icon.
Viewing Splits
If there is a split for an equity in in the Symbol column of your Positions window, a splits icon will display in the Events column for that equity.
To view additional splits information for a specific equity, point to the splits icon. A tooltip displays the following:
• Date [mm/dd/yyyy] • Type • Ratio

ScottradeELITE User Guide
Positions 100
Viewing Zacks List Items
If more information about an equity in the Symbol column of your Positions window can be found in Zacks Predefined Screener, a Zacks icon will display in the Events column for that equity.
To view additional Zacks list information details for a specific equity, point to the Zacks icon.
Setting up Positions You can change the following settings of the Positions window:
• Adding or removing available data columns to your list view.
• Changing the order that each column appears.
• Sorting positions by alphabetical order or by category.
To change the settings of the Positions window, click Configure on the Positions menu in the top left corner of the Positions window.
The Configure Positions window appears, allowing you to add or remove columns, change the column order or selecting how you want to sort your positions.
Using the Search Box
To search for an available column by alphabetical order or by category:
1. Under the Search box, click Alphabetical or Category.
2. In the Search box, type the column that you want to locate in the Available list.

ScottradeELITE User Guide
Positions 101
Customizing the Positions Window
To add a column to your Positions window:
1. On the Positions menu, click Configure.
2. In the Available list, click the column name you want to display in your Positions list and then click Add.
Applying Font Settings (Current Tab) To change the font settings in your Positions window:
1. On the Positions menu, click Configure.

ScottradeELITE User Guide
Positions 102
2. Click Font Settings.
3. In the Font dialog box, make your font selections and then click OK.
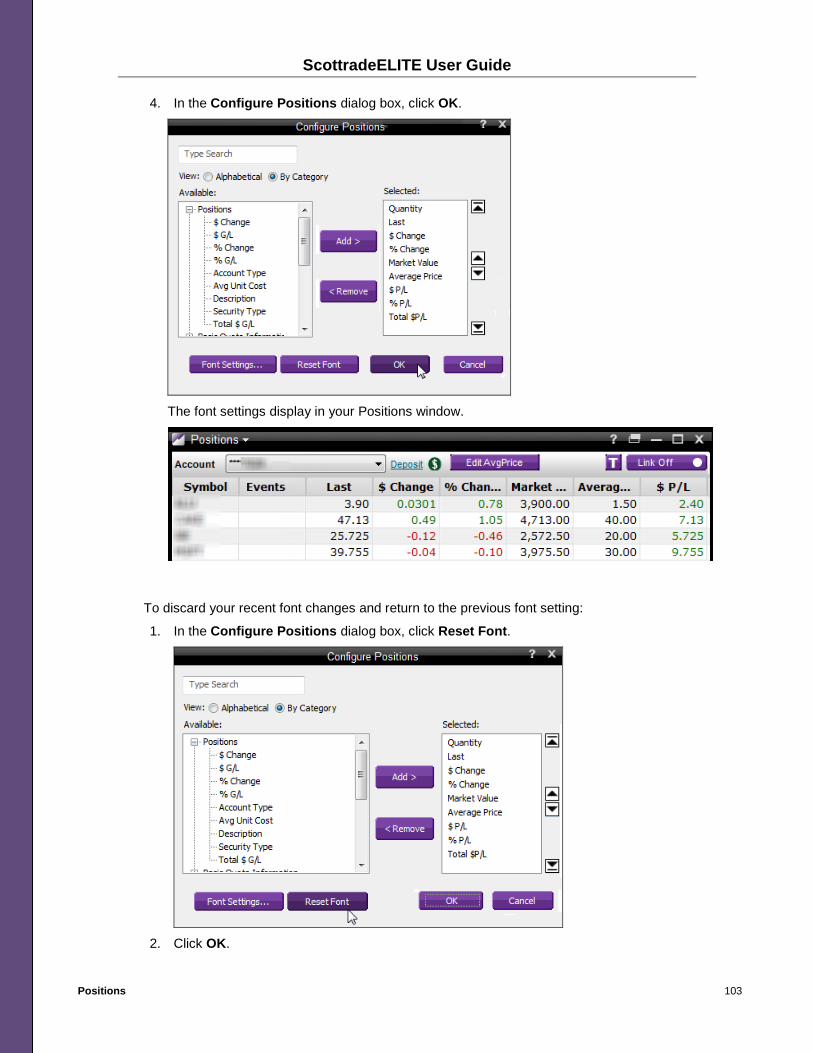
ScottradeELITE User Guide
Positions 103
4. In the Configure Positions dialog box, click OK.
The font settings display in your Positions window.
To discard your recent font changes and return to the previous font setting:
1. In the Configure Positions dialog box, click Reset Font.
2. Click OK.

ScottradeELITE User Guide
Positions 104
To remove a column from your Positions window:
1. On the Positions menu, click Configure.
2. In the Selected list, click the column you want to remove and then click Remove.
You can select multiple columns from the Available or Selected lists by using the following operations:
o To select non-consecutive columns, hold down Ctrl while clicking each column that you want.
o To select a consecutive group of columns, click the first item and hold down Shift while clicking the last column.
There are two ways to change the order that each column is displayed in the Positions window:
• In the Selected list, click the column(s) you want, and then click the Up, Down, Move to Top or Move to Bottom arrow to the right.

ScottradeELITE User Guide
Positions 105
• From the Positions window, click the column heading, and move right or left.
To adjust the column width in the Positions window:
1. Point to the right of the column heading.
2. When the double arrow appears, drag the column heading to the left or right.
You can sort the data in the Positions window by using one of the following operations:
To sort data … Click the column heading…
In ascending order Once
In descending order Twice
In its default order Three times
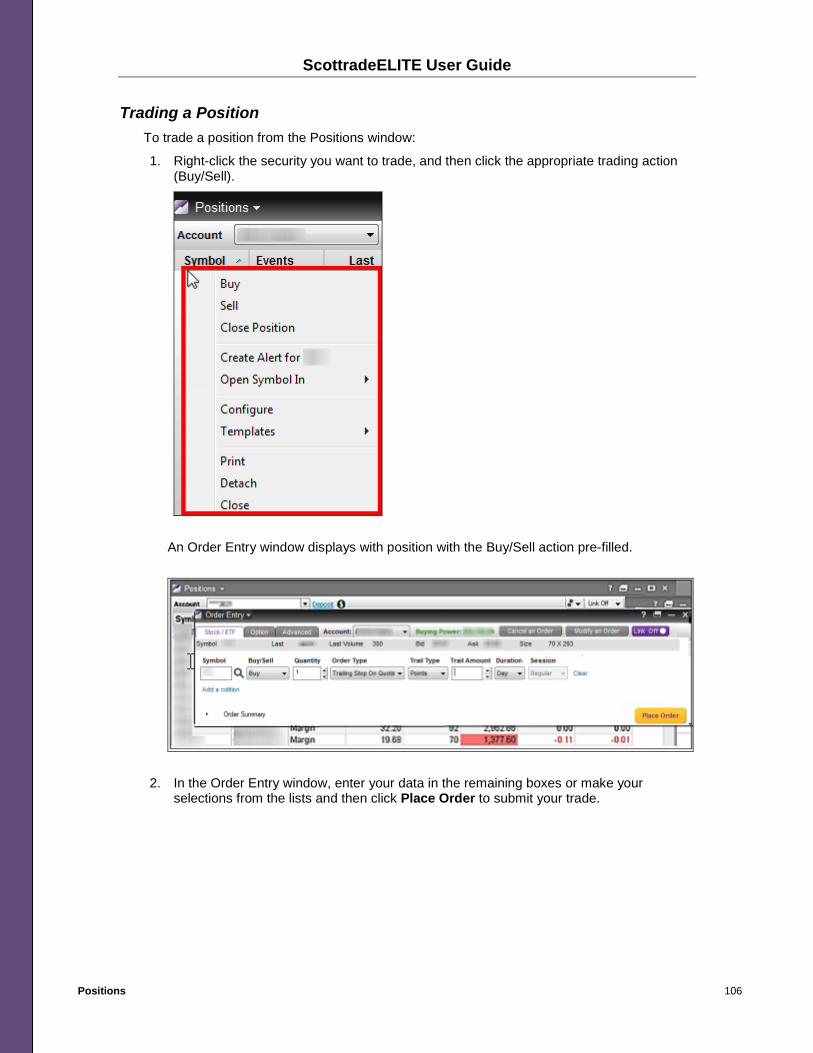
ScottradeELITE User Guide
Positions 106
Trading a Position To trade a position from the Positions window:
1. Right-click the security you want to trade, and then click the appropriate trading action (Buy/Sell).
An Order Entry window displays with position with the Buy/Sell action pre-filled.
2. In the Order Entry window, enter your data in the remaining boxes or make your selections from the lists and then click Place Order to submit your trade.

ScottradeELITE User Guide
Positions 107
Portfolio Gain/Loss and Total Market Value The Portfolio Gain/Loss $, Portfolio Gain/Loss % and Total Market Value fields are static fields that always display at the bottom of your Positions window. These figures reflect the Gain & Loss figures for your current positions.
Linker Tool Use the Linker Tool within the Positions window to connect multiple windows so the symbol entered into one window displays in all linked windows simultaneously. For additional information, see Linker Tool.
<Tool Name> Menu The <Tool Name> menu contains options that allow you to execute common tasks. Options include printing, exporting data, refreshing data, accessing help information, detaching or attaching window positions, and closing windows. Note that the options may vary slightly depending upon the tool you are using. For additional information, see <Tool Name> Menu.
Right-click Functionality Several tools in ScottradeELITE offer a shortcut menu with various options. The shortcut menu opens when you right-click anywhere in the window. For more information, see Right-click Functionality.
Symbol Lookup Symbol Lookup, which is included within most tools in ScottradeELITE, provides you with more information about a company via its symbol. For more information, see Symbol Lookup.
Minimize / Restore Minimize and restore buttons are available on the top bar of all active ScottradeELITE windows. For more information, see Minimize / Restore.
Template Manager Template Manager is functionality found in several tools or windows on the ScottradeELITE platform. Located in the top right corner of the tool or active window, Template Manager is represented by a button. For more information, see Template Manager.

ScottradeELITE User Guide
Charts 108
Charts ScottradeELITE’s easy-to-use charts offer sophisticated market analysis tools including more than 50 indicators advanced drawing tools, and the ability to play back shifts in the market to help you spot and react to trends.
Accessing Charts To load a chart:
1. Do one of the following:
a. On the Main Menu, point to Research and then click Charts.
b. On the Charts menu, click Charts.
A new, blank chart appears:
By default, the Charts window displays a blank chart.

ScottradeELITE User Guide
Charts 109
2. To analyze or track the price movement of a particular security, in the upper-left corner of the window, click the Enter Symbol box.
Building a Chart
When the chart opens, the name of the chart tab displays as Default until you enter a symbol.
To add a symbol to the chart, in the Enter Symbol box, type the symbol you want to monitor, and then click Go.
The tab name switches from Default to the symbol you entered. The charts window allows you to view the data for the symbol or list of symbols you have selected.
Using Tabs to Add Multiple Charts
The chart window can display or store multiple charts. To add a chart, click the plus tab to the right of the active tab (in the example below, the active tab is XYZ-Daily,12 months).
The basic chart template, which is the default template, automatically loads.
The chart window title bar and tab display the following data:
• Symbol • Time Frame • Frequency
For more information about setting the time frame and frequency, see the next section.

ScottradeELITE User Guide
Charts 110
Setting Time Frame
Traders analyze charts in various time frames. Longer-term investors tend to focus on higher time frames such as those shown in a monthly, weekly, or daily chart to maintain a proper perspective on their longer-term investments. Near-to-short-term traders may focus on chart time frames that give a one-to-two week perspective, such as daily or 60-minute time period. Day traders might look at shorter time periods such as 30 minute, 15 minute, 5 minute, 1 minute, or even a tick chart to identify and manage an intraday position. The chart window defaults to a daily time frame.
To change the default time frame (the default is Daily), on the time frame (Daily) menu, click the value you want.
Setting Frequency
The chart frequency is the number of bars displayed in the viewable chart area. Using charts enables you to quickly and easily adjust the displayed frequency.
• To change the default frequency data (the default is 12 months), on the frequency (12 month) menu, click the interval you want.

ScottradeELITE User Guide
Charts 111
• To view additional historical data, select a longer frequency and number of bars for that frequency loads and displays. Available frequencies range from one month to 25 years.
• To move back in time, drag the chart in the chart window to the right.
• To move forward in time, drag the chart in the chart window to the left.
• To extend the time period of the trading activity for a particular security in the chart window, drag the scroll arrow at the bottom right side of the window. This action will increase the scroll bar size.
• To zoom into a time period in the chart window, drag the scroll arrow at the bottom of the chart window to the left. This action will reduce the size of the scroll bar.
• To return to the original frequency, click the Home button in the lower right-hand corner of the Chart window.
Setting Chart Types
To the right of the Daily and 12-months time period menus is a chart-style menu. See the following table for available chart types.
Chart Type Description
OHLC OHLC is an abbreviation for “Open, High, Low, Close” chart. This chart shows the opening, high, low and closing prices for a security in color.
Candlestick Displays the high, low, opening and closing prices for a security for a single day.
Close Line The most basic chart type. This chart plots the closing price of the underlying security, with a line connecting the dots formed by the close price.
Heikin Ashi In Japanese, Heikin Ashi means “average bar.” Similar to the candlestick and bar charts, this chart type displays the open, high, low and close of the time frame, but it calculates information differently. Heikin Ashi charts compute their own open (HAO), high (HAH), low (HAL) and close (HAC), using the actual open (O), high (H), low (L) and close (C) of the time frame (for example, the open, high, low, and close, of each five minutes).
Mountain Similar to line charts in that mountain charts do not provide Open, High or Low price information.
Setting an Indicator
For more information, see Chart Indicators and Studies.
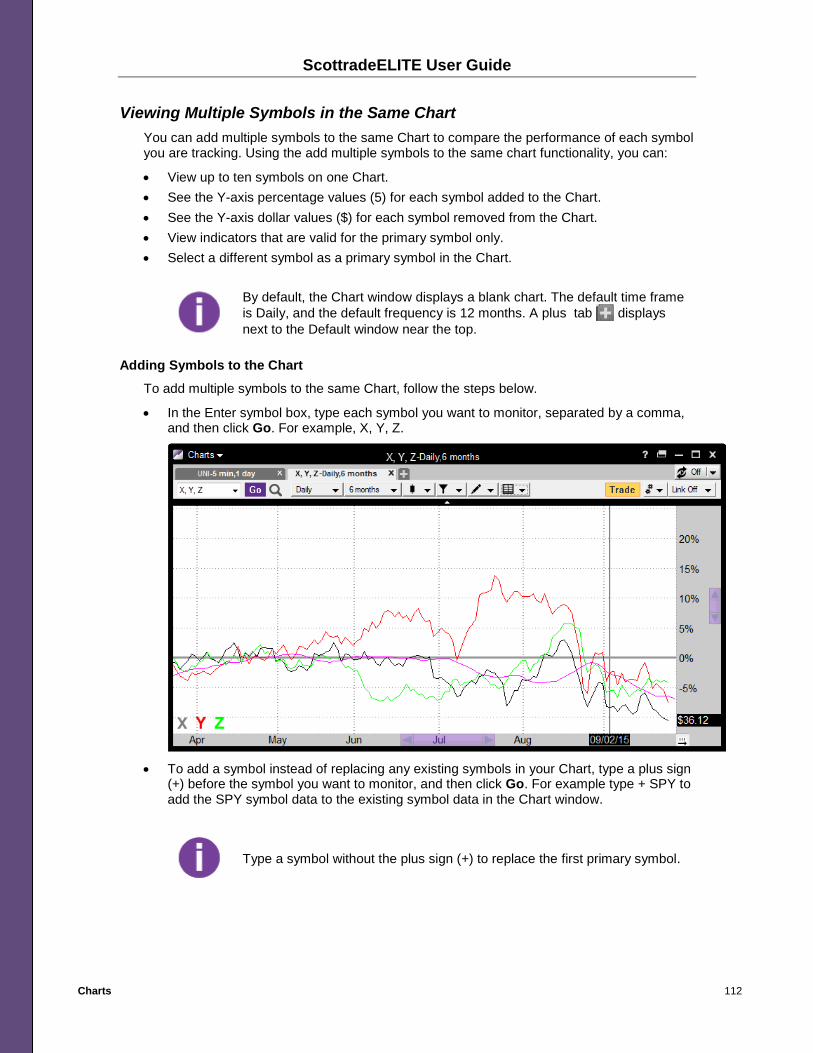
ScottradeELITE User Guide
Charts 112
Viewing Multiple Symbols in the Same Chart You can add multiple symbols to the same Chart to compare the performance of each symbol you are tracking. Using the add multiple symbols to the same chart functionality, you can:
• View up to ten symbols on one Chart. • See the Y-axis percentage values (5) for each symbol added to the Chart. • See the Y-axis dollar values ($) for each symbol removed from the Chart. • View indicators that are valid for the primary symbol only. • Select a different symbol as a primary symbol in the Chart.
By default, the Chart window displays a blank chart. The default time frame is Daily, and the default frequency is 12 months. A plus tab displays next to the Default window near the top.
Adding Symbols to the Chart
To add multiple symbols to the same Chart, follow the steps below.
• In the Enter symbol box, type each symbol you want to monitor, separated by a comma, and then click Go. For example, X, Y, Z.
• To add a symbol instead of replacing any existing symbols in your Chart, type a plus sign
(+) before the symbol you want to monitor, and then click Go. For example type + SPY to add the SPY symbol data to the existing symbol data in the Chart window.
Type a symbol without the plus sign (+) to replace the first primary symbol.

ScottradeELITE User Guide
Charts 113
Setting a Different Primary Symbol
Any indicators added to the Chart will be valid for the primary symbol in the chart. To select a different symbol as the primary symbol, right-click anywhere in the Chart, point to Set Primary Symbol, and then click the symbol you want to set as your primary symbol.

ScottradeELITE User Guide
Charts 114
Setting the Symbol Data Colors
To change the colors of a symbol displayed in the Chart, follow the steps below:
1. Right-click anywhere in the Chart, point to Set Properties, and then click the symbol you want.
The Chart Settings dialog box appears.
2. On the Colors tab, make your selections. For more information, see Configuring the Chart Tab.
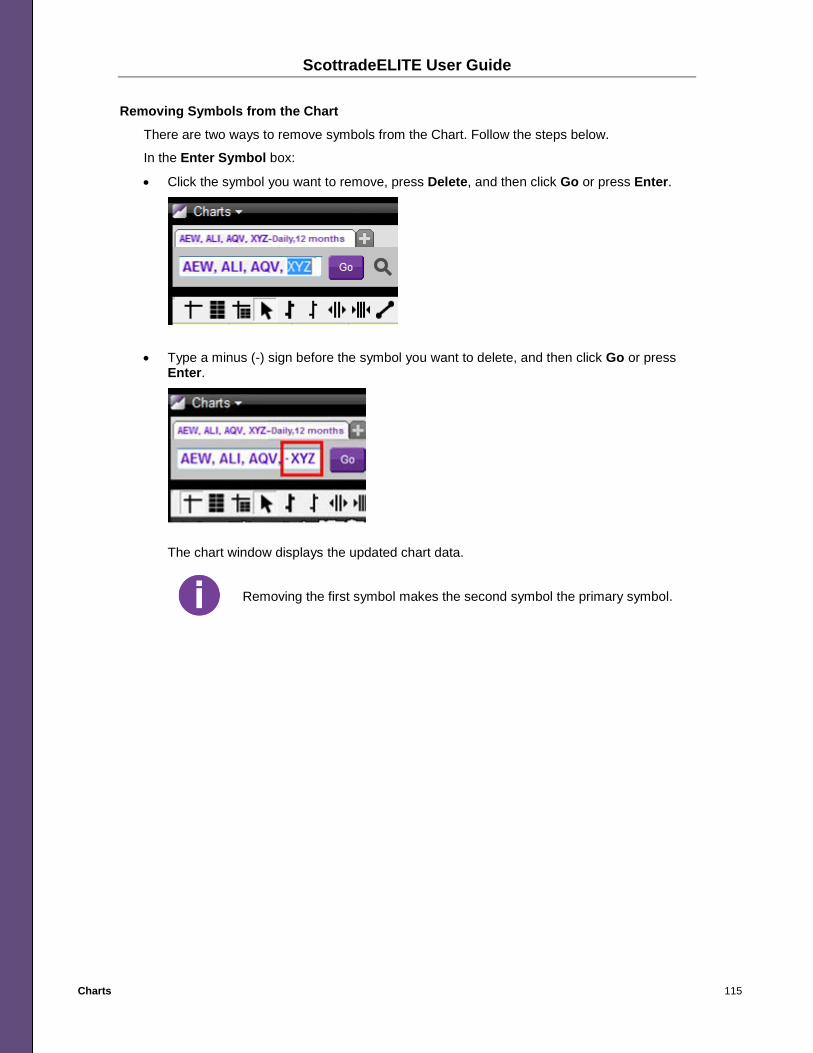
ScottradeELITE User Guide
Charts 115
Removing Symbols from the Chart
There are two ways to remove symbols from the Chart. Follow the steps below.
In the Enter Symbol box:
• Click the symbol you want to remove, press Delete, and then click Go or press Enter.
• Type a minus (-) sign before the symbol you want to delete, and then click Go or press Enter.
The chart window displays the updated chart data.
Removing the first symbol makes the second symbol the primary symbol.

ScottradeELITE User Guide
Charts 116
Chart Indicators and Studies Chart indicators and studies are technical analysis tools that traders can use to improve their trading technique.
What Is an Indicator? Indicators are calculations based on a security’s price and volume behavior. You can use technical indicators to plot and analyze price action in a chart automatically. ScottradeELITE offers hundreds of indicators that you can set up in your chart. For more information, see The Indicators section of the Knowledge Center.
Adding an Indicator
To the right of the Chart Style menu is the Indicator menu. There are over 60 indicators that can be added to a chart.
You can add an indicator to the chart window in the following ways:
• In the Add Indicator menu, select an indicator. Note that at the top of the menu is a Search box that can be used to quickly locate an indicator by name in the list.
• Right-click in the chart window. On the shortcut menu, click Add Indicator.
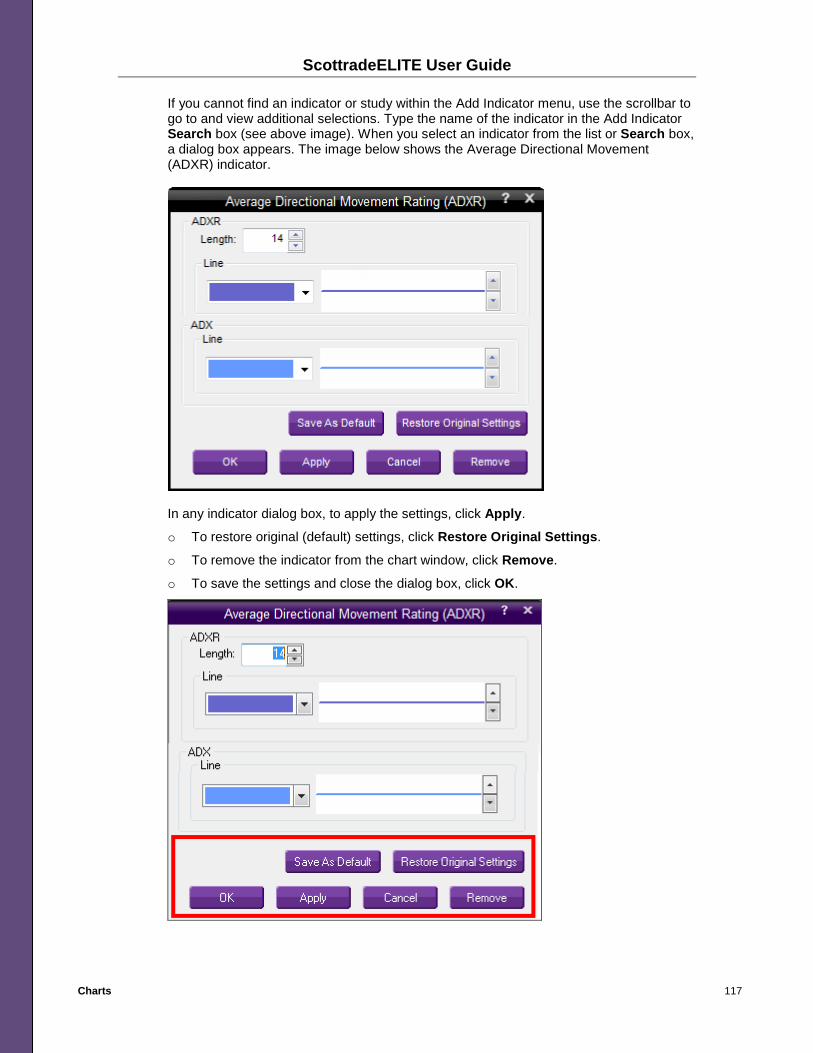
ScottradeELITE User Guide
Charts 117
If you cannot find an indicator or study within the Add Indicator menu, use the scrollbar to go to and view additional selections. Type the name of the indicator in the Add Indicator Search box (see above image). When you select an indicator from the list or Search box, a dialog box appears. The image below shows the Average Directional Movement (ADXR) indicator.
In any indicator dialog box, to apply the settings, click Apply.
o To restore original (default) settings, click Restore Original Settings.
o To remove the indicator from the chart window, click Remove.
o To save the settings and close the dialog box, click OK.

ScottradeELITE User Guide
Charts 118
After you select an indicator, the chart window displays the indicator.
If you add more indicators, the chart window displays the multiple indicators in a stacked view.
To change the settings of any indicator in the display, from the indicator menu, click Set Properties.

ScottradeELITE User Guide
Charts 119
The dialog box appears. In the dialog box, make your selections to change the settings.
Removing an Indicator
In the chart window, there are several ways to remove indicators.
Single Indicator
1. To remove a single indicator, to the left of the indicator box, click the X.
2. In the indicator menu, click Remove.

ScottradeELITE User Guide
Charts 120
Multiple Indicators
If you have multiple indicators, you can remove one indicator at a time or all indicators at once.
• To remove one indicator, right-click anywhere in the chart window, point to Remove Indicator, and click the indicator you want to remove.
If your chart window is divided into panes that show indicators, the Remove Indicator menu choices reflect the indicators that display in the pane where you right-clicked only.
• To remove all indicators from both the main chart window and lower chart indicator windows, right-click the chart window. On the shortcut menu, select Remove All Indicators.

ScottradeELITE User Guide
Charts 121
Chart Drawing Tools
Tools are specific functions designed to help a trader or analyst apply actions to a chart. These functions include visual reference tools such as crosshairs, data window or a mouse pointer. Some visual tools help you see a chart better, perhaps by thickening and thinning data bars or increasing or decreasing space between data bars. Other visual tools are used for specific tasks such as drawing trend lines, Gann Angles, or Fibonacci Ratio analysis.
Accessing Chart Toolbar and Drawing Tools
There are two options to access ScottradeELITE’s analytical drawing tools.
• You can select a drawing tool from the toolbar on the left side of the chart. • You can select the Drawing Tools button located above the top of the chart.
On the chart toolbar, additional tools may be available but not displayed due to space restriction.
• To access the additional tools, on the Chart Toolbar, click the arrow. • To customize the Chart Toolbar, on the Chart Toolbar menu, click Configure Chart
Toolbar.

ScottradeELITE User Guide
Charts 122
The Chart Toolbar is located on the left side by default. You can change the location of the Chart Toolbar to display at the top, bottom, left side, or right side of the chart window. In the image below, see the Chart Toolbar located at the top.
• To change the location of the Chart Toolbar, see the Configuring the Chart Toolbar section.
• To hide the Chart Toolbar, right-click anywhere in the chart window and click Hide Toolbar.

ScottradeELITE User Guide
Charts 123
• To display the toolbar, right-click anywhere in the chart window and click Show Toolbar.

ScottradeELITE User Guide
Charts 124
The Chart Drawing Tools menu, located to the right of the Indicators menu, has the same tools that are listed on the Chart Toolbar. Clicking a drawing tool in the Chart Drawing Tools menu will activate the tool on the Chart Toolbar and change the mouse cursor to the selected tool. See the image below for the list of available tools.
Configuring the Chart Toolbar
In addition to the standard right-click functionality menu items offered by several tools in ScottradeELITE, there are options to configure charts via the right-click functionality shortcut menu. The Configure Chart Toolbar includes settings to customize the following:
• Chart Toolbar location (top, bottom, left side, or right side of the chart window) • Chart Toolbar buttons (add or remove)

ScottradeELITE User Guide
Charts 125
To access the Configure Chart Toolbar settings:
• Right-click anywhere in the chart window and click Configure Toolbar.
The Configure Chart Toolbar dialog box appears.
• To change the location of your Chart Toolbar, on the Customize Chart Toolbar Location menu, click the location you want (Top, Bottom, Left, or Right).
• To add a new tool to the Chart Toolbar, in the Customize Chart Toolbar Buttons list, click the tool you want, and then click Add.

ScottradeELITE User Guide
Charts 126
The new tool displays in the list on the right.
• To remove a tool to the Chart Toolbar, in the Customize Chart Toolbar Buttons list, click the tool you want and then click Remove.

ScottradeELITE User Guide
Charts 127
The new tool displays in the list on the left.
• To return the toolbar settings to the default settings, in the Configure Chart Toolbar dialog box, click Restore Original Settings.

ScottradeELITE User Guide
Charts 128
Removing a Drawing Tool
To remove drawings from the chart window, on the Chart Toolbar, click Clear All Drawings.

ScottradeELITE User Guide
Charts 129
Configuring Chart Settings
Overview
Using the Configure settings, you can use preset features to help you spot specific market movements and trading opportunities. Likewise, you can configure the appearance of your chart to suit your trading style. Following are some features offered in the Configure Chart Settings dialog box:
• Show (or hide) open orders, dividends, earnings, and splits. • Display (or hide) symbol values, gridlines, line styles, and extended hours trading
preferences. • Set color preferences for single or multiple chart styles.
Accessing Configure Chart Settings
You can access the Configure Chart Settings dialog box in two ways:
• Right-click anywhere in the chart window and, on the menu, click Configure. • In the upper-left corner of the window, click Charts, and then click Configure.

ScottradeELITE User Guide
Charts 130
The Chart Settings dialog box appears. The General tab displays by default.

ScottradeELITE User Guide
Charts 131
General Tab Settings
The General tab settings provide features that allow you to change how trading data displays in the chart window. To set your preferences, do the following:
• To show the security symbol, symbol values, symbol name, display settings, extended hours trading and symbol/company watermark, select the appropriate check box.
• To change the colors of the Extended Hours Trading settings or Symbol/Name settings, on the Color menu, click the color you want.
• To change the transparency of the Symbol/Name settings, move the slider to the right to decrease the opacity or move the slider to the left to increase the opacity.
• To change the size of the Symbol/Name settings, move the slider to the left to decrease the size or move the slider to the right to increase the size.
• To change the location of the Symbol/Name settings on the chart, in the square to the right, click the button that represents where you want the security symbol / name to display in your chart.
• To hide a selected item from view, clear the appropriate check box. • After you modify a setting, click the Apply button at the bottom of the window to see the
changes implemented.
To remove your custom settings and revert to the default chart setttings, click the Default button at the bottom of the window to see the changes implemented.

ScottradeELITE User Guide
Charts 132
The table below lists the display settings that you can change from the General tab.
General Setting Description
Offset The space between the last bar and the beginning of the price scale defaults to a 2-bar width.
Scale Provides you the ability to change the scale from the default Linear to Logarithmic. An alternate type of scale used on a chart that is plotted in such a way that two equivalent percent changes are represented by the same vertical distance on the scale, regardless of what the price of the asset is when the change occurs. The distance between the numbers on the scale decreases as the price of the underlying asset increases. This is the case because a $1 increase in price becomes less influential as the price heads higher since it now corresponds to less of a percentage change than it did when the price of the asset was at a lower level.
Draw Straight Lines Under Log Scale
For Logarithmic scale charts, this setting gives you the ability to draw straight trend lines instead of the curved lines that would normally result when using the percentage scaling of log charts. Straight trend lines may be more consistent with what you see on a simple linear scaling chart. The curved lines, on the other hand, provide you with a more mathematically precise illustration.
Show Break Lines This feature will display a vertical line on the day breaks (market close time), month breaks, and year breaks.
Show Dividends For the symbol entered, displays an icon on the chart for the day on which the dividend was paid. Point to the icon to view the date, type and amount of the dividend. In the image below, dividend announcements display in green.
Show Splits For the symbol entered, shows an icon on the chart for the day a
security split occurred.

ScottradeELITE User Guide
Charts 133
General Setting Description
Show Earnings For the symbol entered, displays an icon on the day earnings are reported. The date is the date on which the earnings announcement was made. Point to the icon to see a tooltip containing earnings information.
Show Recognia AlertWire Events
Shows an icon on the chart for a single or multiple Recognia AlertWire news event(s), Point to the icon to view the date of the event and the number of headlines available for the symbol you entered. Click the icon to launch Recognia AlertWire and view headlines.
Show Indicator Buttons
For new indicators added to the chart, when selected, this setting displays indicator buttons inside the chart.
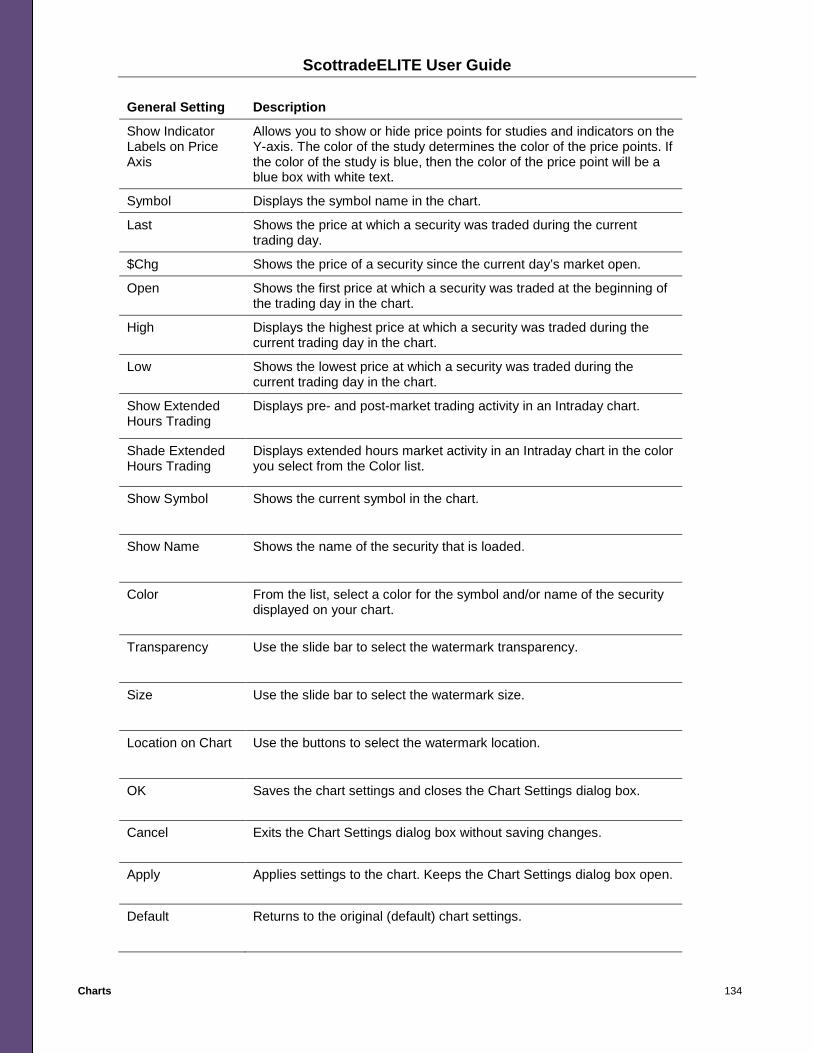
ScottradeELITE User Guide
Charts 134
General Setting Description
Show Indicator Labels on Price Axis
Allows you to show or hide price points for studies and indicators on the Y-axis. The color of the study determines the color of the price points. If the color of the study is blue, then the color of the price point will be a blue box with white text.
Symbol Displays the symbol name in the chart.
Last Shows the price at which a security was traded during the current trading day.
$Chg Shows the price of a security since the current day’s market open.
Open Shows the first price at which a security was traded at the beginning of the trading day in the chart.
High Displays the highest price at which a security was traded during the current trading day in the chart.
Low Shows the lowest price at which a security was traded during the current trading day in the chart.
Show Extended Hours Trading
Displays pre- and post-market trading activity in an Intraday chart.
Shade Extended Hours Trading
Displays extended hours market activity in an Intraday chart in the color you select from the Color list.
Show Symbol Shows the current symbol in the chart.
Show Name Shows the name of the security that is loaded.
Color From the list, select a color for the symbol and/or name of the security displayed on your chart.
Transparency Use the slide bar to select the watermark transparency.
Size Use the slide bar to select the watermark size.
Location on Chart Use the buttons to select the watermark location.
OK Saves the chart settings and closes the Chart Settings dialog box.
Cancel Exits the Chart Settings dialog box without saving changes.
Apply Applies settings to the chart. Keeps the Chart Settings dialog box open.
Default Returns to the original (default) chart settings.

ScottradeELITE User Guide
Charts 135
Color Tab Settings
The Color tab settings provide features that allow you to change colors of various objects in your chart. To set your preferences, do the following:
• To change the chart background color, background grandient color, grid line color, price/time scale gradient color, data window text or background color, crosshairs color, primary symbol chart styles color, or multiple symbols chart style colors, click the color drop-down arrow and then select the color you want.
• To show grid lines on your chart, select the Grid Lines check box. To hide grid lines, clear the Grid Lines check box.
• To change the style of your grid lines (solid, dash, dot or dash dot), next to the choice you want, click the button.
• After you modify the settings, click the Apply button at the bottom of the window to see the changes implemented.
To remove your custom settings and revert to the default chart setttings, click the Default button at the bottom of the window to see the changes implemented.

ScottradeELITE User Guide
Charts 136
The table below lists the color settings you can change from the Colors tab.
Color Setting Description
Background Color Sets the background color for the chart.
Background Gradient
Selecting this check box allows you to choose a gradient background color. If selected, the top of the chart begins with the background color and ends with the gradient color.
Crosshairs Sets the color to use to display crosshairs. The cross hairs display the date and price on the X-axis and Y-axis for the chart. If the Data Window is active, it shows the Open, High, Low, and Close values, which reflect where the crosshairs are located on the chart as well as any Chart Studies that are loaded.
Price/Time Scale Background
This feature sets the color background for the X and Y scales.
Price/Time Scale Gradient
Selecting this check box allows you to choose a gradient background color.
Price/Time Scale Text
Sets the color of the price axis on the right of the chart and the time axis on the bottom of the chart.
Data Window Background
Sets the color for the background of the data window.
Data Window Text Sets the color to use for the text that displays in the data window If the Data Window is active, it shows the Open, High, Low and Close values, which will reflect where the crosshairs are located on the chart as well as any Chart Studies that are loaded.
Grid Lines The check box indicates whether the grid lines are displayed on the chart. Click the associated button to display solid, dash, dot, or dash dot gridlines.
Multi Symbol Chart Styles
Sets the color for each symbol you add to the chart. Add up to 10 symbols.
Candles Up Fill Sets the color to display in a filled candlestick when the closing price is higher than the opening price.
Candles Up Outline
Sets the color for the candle shadow when the closing price is higher than the opening price.
Candles Down Fill Sets the color to display in a filled candlestick when the closing price is lower than the opening price.
Candles Down Outline
Sets the color for the candle shadow when the closing price is lower than the opening price.
Unchanged Candle/OHLC Bar
Sets the color for an unchanged candle or OHLC Bar.

ScottradeELITE User Guide
Charts 137
Color Setting Description
OHLC Up Sets the color of an open, high, low, and close price of a certain time period when the price is up.
OHLC Down Sets the color of an open, high, low, and close price of a certain time period when the price is down.
Close Line When this feature is selected the chart is displayed as a line, based on the daily close.
Mountain Sets the color to use in mountain charts.
OK Saves the chart settings and closes the Chart Settings dialog box.
Cancel Exits the Chart Settings dialog box without saving changes.
Apply Applies settings to the chart and keeps the Chart Settings dialog box open.
Default Returns to the original (default) chart settings.
For more information on creating and configuring the chart, see Building a Chart.

ScottradeELITE User Guide
Charts 138
Trading from Charts Learn how to easily initiate trades from your Chart window so that you're always ready when you spot an opportunity. Chart trading allows you to stay focused on your charts while you get a dynamic view of the market. With Chart trading functionality, you can place orders, monitor positions, manage working orders and perform one-click order entry for all of your linked accounts from a single Chart window.
Understanding Open Order Badges
Open equity orders (stocks and ETFs) for specified order types in charts are indicated by a badge: a green badge displays when you place a Buy or Buy to Cover order; a red badge displays for a Sell or Sell Short order.
Each badge displays the quantity, order type and draws a line to the price in the price pane. The badge intersects the Price scale at limit/stop price.
Getting More Information with Tooltips
When you point to a badge, a tooltip displays the following information:
• Account number with masking • Quantity • Order Type • Price
Order Types Enabled for Chart Trading
The chart displays an open order badge for the following open order types on the specified equity symbol:
• Limit Orders o Buy Limit Orders o Sell Limit Orders
• Stop-on-Quote Orders o Buy Stop-on-Quote Orders o Sell Stop-on-Quote Orders
• Stop Limit on Quote Orders o Buy Stop-Limit-on-Quote Orders o Sell Stop--Limit-on-Quote Orders
• Trailing Stop-on-Quote Orders o Buy Trailing Stop-on-Quote Orders o Sell Trailing Stop-on-Quote Orders

ScottradeELITE User Guide
Charts 139
Showing or Hiding Open Orders on Charts
You can set up your Chart window to display or hide open orders. To show open orders on a chart:
1. Go to the Configure Chart Settings window in one of the following ways:
a. In the upper-left corner of the window, click Charts and then click Configure.
b. Right-click anywhere in the Chart window. On the shortcut menu, click Configure.
2. Select the Show Open Orders check box and then click OK.

ScottradeELITE User Guide
Charts 140
To hide open orders on a chart:
1. Go to the Configure Chart Settings window in the following ways:
a. In the upper-left corner of the window, click Charts and then click Configure.
b. Right-click anywhere in the chart window and, on the menu, click Configure.
2. Clear the Show Open Orders check box and then click OK.

ScottradeELITE User Guide
Charts 141
A chart with open orders displays. On the chart, ScottradeELITE shows the badge for each open order on that symbol.
Open orders that are outside of the current price view in the Chart window are indicated by a text box at top (below any indicator badges) or at the bottom of the chart window.

ScottradeELITE User Guide
Charts 142
Placing an Order in a Chart For equities (stocks and ETFs), you can place a trade from the Charts window in the following ways:
• Click the Trade button. See steps. • Right-click the flag and click Buy <order type at price> or Sell <order type at price>.
See steps. • Drag the badge to the price level you want on the price axis. See steps.
Using the Trade Button To place an order from the Charts window with the Trade button:
1. In the Symbol box, enter a symbol and click Go.
2. In the upper-right area of the chart, click Trade.
The Order Entry window appears and contains the symbol you entered in the Chart.
3. In the Order Entry window, enter data in the remaining blank fields (Quantity, Order Type and Limit or Stop Price) to complete your order.
4. Click Place Trade.
Upon successful trade placement, the Order Entry window will display your order confirmation. You can check the status of your order via the Order Status window.
For more information about order types and/or placing orders, see Placing a Stock / ETF Order.

ScottradeELITE User Guide
Charts 143
Using Right-click Functionality: Placing an Order
To place an order using right-click functionality, do the following:
1. Right-click within the Charts window.
2. On the shortcut menu, click Buy <order type at price> to place a purchase order or click Sell <order type at price> to place an order to sell a stock or ETF.
The Buy or Sell options on the shortcut menu contain the price you clicked on in the Chart. Example:
This launches the Order Entry window where you can place your order.
The Order Entry window populates automatically with the following data from your Chart window:
o Symbol o Order type o The limit or stop price of the right-click location
Once a trade is placed, you can see open orders on the Chart for Limit Orders, Stop-on-Quote Orders, Stop Limit on Quote Orders, and Trailing Stop-on-Quote Orders.

ScottradeELITE User Guide
Charts 144
Using Right-click Functionality: Modifying an Open Order in a Chart Window
Once a badge appears on the chart, you can modify the price. To modify an open order, do the following:
1. Drag the badge to a new price level.
2. In the Order Review dialog box, click Modify Order to submit the price change.

ScottradeELITE User Guide
Charts 145
Cancelling an Open Order in a Chart Window
To cancel an existing order, on the right side of the badge, click X.
As the system cancels the order, the badge displays a “Cancelling…” message.
The badge disappears when the order cancellation process is complete.
Multiple Symbol Chart Trading
For multiple symbol charts, ScottradeELITE displays open equity orders for the primary symbol only.

ScottradeELITE User Guide
Charts 146
Exporting Chart Data to Excel You can export chart data to an Excel spreadsheet to study the data in depth using your own method.
To export chart data to an Excel spreadsheet, in the chart window, follow the steps below:
1. On the Charts menu, click Export to .csv.
2. The Save As dialog box appears.
3. Click the file path arrow and, in the list, select the file location you want.

ScottradeELITE User Guide
Charts 147
4. In the Save As dialog box, type your file name, and then click Save.
5. Go to the file location and double-click the chart file you saved.

ScottradeELITE User Guide
Charts 148
The spreadsheet containing your chart data opens.

ScottradeELITE User Guide
Charts 149
Linker Tool Use the Linker Tool within the Positions window to connect multiple windows so the symbol entered into one window displays in all linked windows simultaneously. For more information, see Linker Tool.
<Tool Name> Menu The <Tool Name> menu contains options that allow you to execute common tasks. Options include printing, exporting data, refreshing data, accessing help information, detaching or attaching window positions, and closing windows. Note that the options may vary slightly depending upon the tool you are using. For additional information, see <Tool Name> Menu.
Right-click Functionality Several tools in ScottradeELITE offer a shortcut menu with various options. The shortcut menu opens when you right-click anywhere in the window. For more information, see Right-click Functionality.
Symbol Lookup Symbol Lookup, which is included within most tools in ScottradeELITE, provides you with more information about a company via its symbol. For more information, see Symbol Lookup.
Minimize / Restore Minimize and restore buttons are available on the top bar of all active ScottradeELITE windows. For more information, see Minimize / Restore.
Template Manager Template Manager is functionality found in several tools or windows on the ScottradeELITE platform. Located in the top right corner of the tool or active window, Template Manager is represented by a button. For more information, see Template Manager.

ScottradeELITE User Guide
Advanced Scanner 150
Advanced Scanner The Advanced Scanner provides you with the ability to screen the market for an order type based on the trading criteria that are most important to you.
Accessing Advanced Scanner You can access Advanced Scanner in the following ways:
• On the Main Menu, point to Research, and then click Advanced Scanner.
• On the Research menu, click Advanced Scanner.
The Advanced Scanner window appears.

ScottradeELITE User Guide
Advanced Scanner 151
Creating a Name for a Scan To create a custom name for a scan, right-click the Default tab and then click Rename Tab.
To add more tabs to the Advanced Scanner window, click the + tab to the right of the existing tab(s). Multiple tabs allow you to run multiple scans within the same Advanced Scanner window.
Searching, Scanning and Sorting
Advanced Scanner offers several scanning and sorting options. To view or select the parameters for the scan type, on the Search list, click Stocks or ETFs.
The Advanced Scanner allows you to search the market based on technical criteria as well as more basic criteria such as price and volume. To view or select the individual scanning options, on the For list, click a scan type.

ScottradeELITE User Guide
Advanced Scanner 152
Additional Filters You can set filters and adjust the results of your scan. To apply a filter, click the arrow to the left of Additional Filters.
The table below contains fields available in the Additional Filters section:
Name Description
Min $ Sets the minimum price of the security.
Max $ Sets the maximum price of the security.
Min Avg Vol (20d) Sets the minimum volume of your results; for example, setting this to 1000 would mean that your results only show securities that trade over 1,000,000 shares per day on average over the last 20 days.
Sector/Industry Filter securities by their respective Sectors and Industry Groups. From the Sector/Industry list, click individual Sectors or Industry Groups.
Exchange Filter results to only certain exchanges: AMEX, NASDAQ, and NYSE.
Running the Advanced Scanner
After you choose your search parameters, the Run This Scan button becomes active. To perform the scan, click Run This Scan .

ScottradeELITE User Guide
Advanced Scanner 153
Scan Results When the scan runs, the results display in column order based on the scan’s focus so that the relevant data is readily available to you. You can sort the results by clicking on the column headings to arrange the items in either ascending or descending order based on your trading interests.
In addition, a number of results and timestamp output displays in the scan window to the right of Run This Scan.
If there are no matching results, Advanced Scanner displays “0 Results Found” in the results table below.
Working with the Scan Results Once the scan is complete you can right-click the results to access the menu. From this menu you have the option to place a trade, create an alert, print, detach the scanner from the window, or close the scan window. In addition, you can also choose to open the symbol in a new window such as Charts, Sector Trends, and more by pointing to the Open Symbol In menu.
If the scan does not return any results or if you want to alter the filters, you can do so by returning to the filter area of the scanner and making additional adjustments to the filters. After you select the new filters, to run the scanner again, click Update Scan or Run This Scan.

ScottradeELITE User Guide
Advanced Scanner 154
Exporting Scan Results You can export the results of your scans to a third party application via a comma delimited file or open all or a select amount of symbols into a watch list. You can do this in the following ways:
• On the Advanced Scanner menu, click Export to .csv. • On the upper right corner of the Advanced Scanner window, click Export.
On the menu that opens, specify the location and symbols you want to export. In the lower right corner of the Export window, click Export.
Saving Data to Watch Lists You can save your selections to a watch list.
1. On the Advanced Scanner menu, click Save as Watch List.
The Watch List window appears and contains a Scan Results tab.
2. To save the Scan Results Watch List, on the Watch Lists menu, click Save List.
3. To save the Scan Results Watch List as a different name, on the Watch Lists menu, click Save List As.
Sector Trends Actions See the table below for a list of available options located in the Sector Trends menu.
To… Click…
Print a Sector Trends list from the Print dialog box Print. Send Advanced Scanner data to a watch list so you can save it
Save as Watch Lists.
Save Advanced Scanner data to a local drive as a .csv file
Export to .csv.
Access online help Help.
Allows you to detach the window from its docked position or attach the active window into the original, docked position. Note: You can drag the detached window outside of the main ScottradeELITE platform and onto an alternate computer screen.
Detach.
Close the window Close.

ScottradeELITE User Guide
Advanced Scanner 155
Linker Tool Use the Linker Tool within the Order Status window to connect multiple windows so the symbol entered into one window displays in all linked windows simultaneously. For additional information, see Linker Tool.
<Tool Name> Menu The <Tool Name> menu contains options that allow you to execute common tasks. Options include printing, exporting data, refreshing or reloading trading data, accessing help information, detaching or attaching window positions, and closing windows. The options may vary slightly depending upon the tool you are using. For additional information, see <Tool Name> Menu.
Right-click Functionality Several tools in ScottradeELITE offer a shortcut menu with various options. The shortcut menu opens when you right-click anywhere in the window. For more information, see Right-click Functionality.
Symbol Lookup Symbol Lookup, which is included within most tools in ScottradeELITE, provides you with more information about a company via its symbol. For more information, see Symbol Lookup.
Minimize / Restore Minimize and restore buttons are available on the top bar of all active windows in ScottradeELITE. For more information, see Minimize / Restore.
Template Manager Template Manager is functionality found in several ScottradeELITE tools or windows. Located in the top right corner of the tool or active window, Template Manager is represented by a button. For more information, see Template Manager.

ScottradeELITE User Guide
Recognia® 156
Recognia®
What Is Recognia? Recognia4 is an industry leader in providing functional and technical analysis- based research products for self-directed traders.
Accessing Recognia Intraday Trader You can access Recognia Intraday Trader via ScottradeELITE in the following ways:
• On the Main Menu, point to Research, point to Recognia and then click Intraday Trader.
• On the Research menu, point to Recognia and then click Intraday Trader. • If you receive the “Redirecting to Recognia.com” message, click OK.
The Intraday Active Trader content appears.
4 Scottrade and Recognia are not affiliated. The information provided is for educational purposes only and Scottrade is not responsible for statements, offers, or products issued by Recognia. Scottrade assumes no responsibility for the accuracy, completeness, or timeliness of the data. No information presented constitutes a recommendation by Scottrade or its affiliates to buy, sell or hold any security, financial product or instrument discussed therein or to engage in any specific investment strategy. Please research any product or service carefully before investing.

ScottradeELITE User Guide
Recognia® 157
Using Intraday Trader™ By providing technical analysis on 15-minute price data, Intraday Trader by Recognia5 is designed to help you spot trends as they develop and time your trades according to your strategy. Intraday Trader monitors intraday changes in the market and notifies you when technical events occur based on your interests, helping you take advantage of trade opportunities in real time.
Help You may access Recognia product tutorials and user guides in the following ways:
• On the Main Menu, point to Research, point to Recognia and then click Recognia Tutorials or Recognia User Guides.
• On the Research menu, point to Recognia and then click Recognia Tutorials or Recognia User Guides.
• In the Recognia Disclaimer dialog box, click OK.
The Recognia website launches. You can click the product link you want to view the help content.
5 The Intraday Trader™ by Recognia tool is provided to Scottrade clients through a third party vendor. Scottrade does not guarantee the accuracy of the information contained in the Intraday Trader™ by Recognia tool and does not assume any liability for actions taken in reliance on information contained within the tool. Scottrade does not guarantee the availability or accessibility of the Intraday Trader™ by Recognia tool.

ScottradeELITE User Guide
Recognia® Alertwire™ 158
Recognia® Alertwire™
What Is Recognia AlertWire? You will get access to countless trade ideas based upon emerging technical events with Recognia AlertWire6. Receive automated interpretation of the event in news format with commentary describing the event, an educational description of the event type and a price chart highlighting the identified event.
Accessing Recognia AlertWire You can launch Recognia AlertWire in the following ways:
• On the Main Menu, point to Research, Recognia and then click Recognia AlertWire.
• On the Research menu, click Recognia and then click Recognia AlertWire.
Placing an Order from Recognia AlertWire For equities (stocks and ETFs), you can place a trade from the AlertWire window in the following ways:
• Click the Trade button. See steps. • Right-click the technical event information in the upper pane or lower pane and click Buy
<order type at price> or Sell <order type at price>. See steps.
Using the Trade Button
To place an order from the AlertWire window with the Trade button:
1. In the Symbol box, enter a symbol, and click Go.
6 The AlertWire™ by Recognia tool is provided to Scottrade clients through a third party vendor. Scottrade does not guarantee the accuracy of the information contained in the AlertWire™ by Recognia tool and does not assume any liability for actions taken in reliance on information contained within the tool. Scottrade does not guarantee the availability or accessibility of the AlertWire™ by Recognia tool.

ScottradeELITE User Guide
Recognia® Alertwire™ 159
2. In the lower pane, click Trade.
The Order Entry window appears with the symbol you entered in the AlertWire window.
3. In the Order Entry window, enter data in the remaining blank fields (Quantity, Order Type and Limit or Stop Price) to complete your order.
4. Click Place Trade.
Upon successful trade placement, the Order Entry window will display your order confirmation. You can check the status of your order via the Order Status window.
For more information about order types and/or placing orders, see Placing a Stock / ETF Order.

ScottradeELITE User Guide
Recognia® Alertwire™ 160
Using Right-Click Functionality: Placing an Order
To place an order using right-click functionality, do the following:
1. Right-click the technical event information in the upper pane or in the lower pane.
2. On the shortcut menu, click Buy <order type at price> to place a purchase order or click Sell <order type at price> to place an order to sell a stock or ETF.
This launches the Order Entry window where you can place your order.
The Order Entry window populates automatically and contains the symbol and order type from your AlertWire window.

ScottradeELITE User Guide
Recognia® Strategy Builder™ 161
Recognia® Strategy Builder™
What Is Strategy Builder? Recognia Strategy Builder7 is a powerful investment research product that helps you define and evaluate strategies that meet your specific criteria and style by using both fundamental and technical criteria for selecting stocks.
Accessing Strategy Builder You can launch Recognia Strategy Builder in the following ways:
• On the Main Menu, point to Research, point to Recognia and then click Recognia Strategy Builder.
• On the Research menu, point to Recognia and then click Recognia Strategy Builder.
• In the Recognia Disclaimer dialog box, click OK.
The Recognia Strategy Builder window launches.
Help You may access Recognia product tutorials and user guides in the following ways:
• On the Main Menu, point to Research, point to Recognia and then click Recognia Tutorials or Recognia User Guides.
• On the Research menu, point to Recognia and then click Recognia Tutorials or Recognia User Guides.
• In the Recognia Disclaimer dialog box, click OK.
The Recognia website launches. You can click the product link you want to view the help content.
7 Strategy Builder™ by Recognia tool is provided to Scottrade clients through a third-party vendor. Scottrade does not guarantee the accuracy of the information contained in the Strategy Builder™ by Recognia tool and does not assume any liability for actions taken in reliance on information contained within the tool. Scottrade does not guarantee the availability or accessibility of the Strategy Builder™ by Recognia tool.

ScottradeELITE User Guide
Recognia® Technical Insight™ 162
Recognia® Technical Insight™
What Is Recognia Technical Insight? Recognia Technical Insight8 is a chart pattern recognition tool that identifies both bullish and bearish technical patterns with matching target price ranges and pattern duration. You can also search for technical events on specific securities that interest you.
Accessing Recognia Technical Insight You can launch the Recognia Technical Insight window in the following ways:
• On the Main Menu, point to Research, point to Recognia and then click Recognia Technical Insight.
• On the Research menu, click Recognia and then click Recognia Technical Insight.
• In the Recognia Disclaimer dialog box, click OK.
The Recognia Technical Insight window launches.
Help You may access Recognia product tutorials and user guides in the following ways:
• On the Main Menu, point to Research, point to Recognia and then click Recognia Tutorials or Recognia User Guides.
• On the Research menu, point to Recognia and then click Recognia Tutorials or Recognia User Guides.
• In the Recognia Disclaimer dialog box, click OK.
The Recognia website launches. You can click the product link you want to view the help content.
8 Technical Insight™ by Recognia tool is provided to Scottrade clients through a third-party vendor. Scottrade does not guarantee the accuracy of the information contained in the Technical Insight™ by Recognia tool and does not assume any liability for actions taken in reliance on information contained within the tool. Scottrade does not guarantee the availability or accessibility of the Technical Insight™ by Recognia tool.

ScottradeELITE User Guide
Recognia® Value Analyzer™ 163
Recognia® Value Analyzer™
What Is Recognia Value Analyzer? Recognia Value Analyzer9 provides all the key value investing metrics for a specific stock on a single page.
Accessing Recognia Value Analyzer You can launch the Recognia Value Analyzer window in the following ways:
• On the Main Menu, point to Research, point to Recognia, and then click Recognia Value Analyzer.
• On the Research menu, click Recognia, and then click Recognia Value Analyzer.
• In the Recognia Disclaimer dialog box, click OK.
The Recognia Value Analyzer window launches.
Help You may access Recognia product tutorials and user guides in the following ways:
• On the Main Menu, point to Research, point to Recognia and then click Recognia Tutorials or Recognia User Guides.
• On the Research menu, point to Recognia and then click Recognia Tutorials or Recognia User Guides.
• In the Recognia Disclaimer dialog box, click OK.
The Recognia website launches. You can click the product link you want to view the help content.
9 Value Analyzer™ by Recognia tool is provided to Scottrade clients through a third-party vendor. Scottrade does not guarantee the accuracy of the information contained in the Value Analyzer™ by Recognia tool and does not assume any liability for actions taken in reliance on information contained within the tool. Scottrade does not guarantee the availability or accessibility of the Value Analyzer™ by Recognia tool.

ScottradeELITE User Guide
Trade Ideas® 164
Trade Ideas®
What Is Trade Ideas? Trade Ideas10 is a publisher of real-time, custom-filtered market data.
What Can I Access with a Subscription? The table below defines the five types of Trade Ideas subscriptions:
User Type Access Type Length of Access
What Happens When Access Expires?
Free Limited access and functionality.
Indefinite You can:
• Subscribe to Trade Ideas.
• Activate the demo (full access) to try out
Note: Once you activate the demo, you cannot reactivate the demo.
Demo Full access to Trade Ideas. 14 calendar days. Tip: The number of days remaining in the demo displays in the window.
You can subscribe to Trade Ideas to continue using full access.
Upon expiration, the subscription type converts to Free User or Subscribed User. Work saved during the demo will be lost or not accessible until you subscribe.
Note: Nonsubscribers will receive limited access.
Subscribed Full access to Trade Ideas, as long as the subscription is paid and you are in good standing. Subscribers also receive any future updates.
As long as you maintain a subscription.
Access to work is not available until you subscribe again.
If you unsubscribe and have not activated the Demo in the last year, the Demo will become available. Otherwise, you will have limited access when you unsubscribe.

ScottradeELITE User Guide
Trade Ideas® 165
Cancelled Subscription
If you cancel your Trade Ideas subscription, your access type will convert to Free User access. For more information, see Subscribing to Trade Ideas and Cancelling Subscription to Trade Ideas.
Nonsubscribers
If you are not a Trade Ideas subscriber, when you launch Trade Ideas, ScottradeELITE will notify you via a pop-up message and an email that you are not a subscriber.
Accessing Trade Ideas There are two ways to access Trade Ideas:
• On the Main Menu, point to Research, and then click Trade Ideas.
• On the Research menu, click Trade Ideas.
Subscribing to Trade Ideas
ScottradeELITE will notify you via a pop-up message and an email if you do not have access to Trade Ideas.
To subscribe to Trade Ideas:
1. On the Main Menu, point to Configure, and then click Manage Subscriptions.
2. In the Manage Premium Services dialog box, in the Select Service: section, click Trade Ideas.
3. In the Enter Scottrade Account Number box, type your 8-digit Scottrade account
number.
4. Select the I accept these terms check box.
5. Click Activate.

ScottradeELITE User Guide
Trade Ideas® 166
Once you have successfully subscribed, you can access Trade Ideas via ScottradeELITE.
The Trade Ideas Welcome window text and images may vary.
Trade Ideas gives you pre-defined scans containing themes. Examples of themes include Pre-Market, Active Trading, Sectors, Fundamentals, etc.
When Trade Ideas launches, you will see a pre-defined layout that matches the channels—or preset category of stocks, along with other layout elements and defining criteria.
Based on the criteria and channel you select, Trade Ideas provides ideas of stocks you can trade. The example below provides the Trade Ideas windows for stocks in the Technology channel.
The following table illustrates tools or windows (layout elements) and defining criteria that comprise the Trade Ideas layout.
The layout elements and defining criteria will vary depending on channel (category) you choose.

ScottradeELITE User Guide
Trade Ideas® 167
Layout Elements Defining Criteria
Top List Window Contains Market Movers today. Displays stocks in descending order by 60 minute % price change and:
• < - $0.01 EPS > $0.01 • < - 4% change from previous day’s
close 4% • Relative volume > 1.20
Multiple (Multi-) Strategy Window
Collection of five strategies scanning all stocks between $5.00 - $50.00 and featuring 52 Week Highs/Lows, Above/Below 50 Day Moving Average, and Volume Spikes on 3x ADV.
Channel Bar Trade Ideas preset components that combine curated selections of symbol lists, indicators, and visual displays (for example, columns, color sorting, and so on).
Using Trade Ideas
You can use the Trade Ideas layout elements exclusively or together with ScottradeELITE tools (Charts, Balances, Positions, Order Status, etc.) to help you find and get timely information about stocks that meet your strategy.
Creating and Saving Your Layout You can save Trade Ideas layout elements exclusively to a custom layout or you can save the Trade Ideas layout elements together with ScottradeELITE tools
To save a layout:
1. After you open all the windows you want, on the Main Menu, click Save Layout.
2. In the Layout Name: box, type the name of your layout.
3. Click OK.
The layout will display on the Quick Access Bar. See also: Quick Access Bar.

ScottradeELITE User Guide
Trade Ideas® 168
Help Instructions (including videos, online communities, and support forums) for using tools and features within Trade Ideas, such as strategies, alerts, and windows-specific channels, are available on the Help tab of the Trade Ideas window.

ScottradeELITE User Guide
Trade Ideas® 169
Cancelling Subscription to Trade Ideas Follow the instructions below to unsubscribe to Trade Ideas:
1. On the Main Menu, point to Configure, Manage Subscription, and then click Trade Ideas.
2. In the Manage Premium Services dialog box, click None (deactivate Trade Ideas).
3. Click Deactivate.
ScottradeELITE will remove your account access from Trade Ideas. When you log on to ScottradeELITE again, the Trade Ideas activation window will appear.

ScottradeELITE User Guide
Upcoming Earnings 170
Upcoming Earnings
What Is Upcoming Earnings? The Upcoming Earnings window offers data about future and past earnings11 announcements.
Why Use Upcoming Earnings? Using the functions in the Upcoming Earnings window, you can:
• Search for companies that have earnings announcements in the next 60 days with custom date ranges.
• Compare upcoming earnings consensus with previous three quarters earnings, % surprise, and actuals.
• Filter your results by either negative or positive earnings surprises, as well as met consensus on the last earnings date.
• Sort search results in columns by clicking the column heading. • Save your filtered symbol list to a Watch List to monitor the securities that interest you
and make decisions best-suited to your financial goals.
The following table defines the fields displayed in the Upcoming Earnings window.
Name Description
Date The date on which the company’s earnings are expected to be announced.
Symbol The security symbol for the company.
Name The name of the company.
Future Consensus Average of all estimated earnings from open research or analyst sources.
Low Est. Lowest estimated earnings, positive or negative, that exists among analysts following this security.
High Est. Highest estimated earnings, positive or negative, that exists among analysts following this security.
# of Analysts Number of analysts following this security and providing an earnings estimate.
Last Actual Most recent reported earnings.
Last Surprise % Percentage difference between consensus and actual amounts for most recent reported earnings.
2nd Last Actual Second most recent reported earnings.
2nd Last Surprise % Percentage difference between consensus and actual amounts for the second most recent reported earnings.
3rd Last Actual Third most recent reported earnings.
3rd Last Surprise % Percentage difference between consensus and actual amounts for the third most recent reported earnings.
11Estimated future earnings are subject to change and are not guaranteed. Historical earnings data does not guarantee the future earnings of a security. Scottrade does not give advice, make recommendations or determine the suitability of any security for a Scottrade client.
Consensus data for a particular security is calculated by taking the average of analyst earnings estimates for the security. Consensus numbers shown are based on data available to Scottrade, Inc. and may not include all analyst estimates for a particular security.

ScottradeELITE User Guide
Upcoming Earnings 171
Accessing Upcoming Earnings You can access Upcoming Earnings in the following ways:
• On Main Menu, point to Research, and then click Upcoming Earnings. • On the Research menu, click Upcoming Earnings.
The Upcoming Earnings window appears.
You can open 10 windows maximum.

ScottradeELITE User Guide
Upcoming Earnings 172
Finding, Sorting, Filtering, and Organizing Data Using functionality native to the Upcoming Earnings window, you can perform a search using preset settings, sort search results by column heading, and filter your search results by last earnings surprise.
Finding Earnings Information (Using Search)
When the Upcoming Earnings window opens, it automatically searches for companies with earnings announcements in the next 60 days.
Sorting by Column Heading
To sort the search results by a column, click the column heading you want ( ). The search results, sorted by the column you selected, display in the window.
Filtering by Date
By default, the Upcoming Earnings window provides search results by All Available dates and All Last Quarter Earnings Surprise.
To filter the search results by a custom date range, do the following:
1. On the Date: menu, click Custom Range.

ScottradeELITE User Guide
Upcoming Earnings 173
2. In the Date Filter dialog box, enter a Start Date and End Date, and then click OK.
The earnings results within your specified custom date range appear.
Filtering by Last Quarter Earnings Surprise Criteria
By default, the Upcoming Earnings window provides search results by All Available dates and All Last Quarter Earnings Surprise.
To filter the search results by Last Quarter Earnings Surprise criteria, on the Last Qtr. Earnings Surprise: menu, click the item you want (Negative Surprise, Met Consensus, Positive Surprise, or All). The earnings results within your specified custom date range display in the window.
Organizing Column Order Using the Drag-and-Drop Operation
To rearrange column order, drag the column heading to the location you want.

ScottradeELITE User Guide
Upcoming Earnings 174
Resizing Columns
You can adjust the column size within the Upcoming Earnings window by using either of the operations below:
• Drag and Drop Operation - Point to the edge of the column heading. When the pointer becomes a double-headed arrow, drag the pointer to adjust the column size.
• Double-click - Point to the edge of the column heading. When the pointer becomes a double-headed arrow, double-click the column. The column (or row) will automatically adjust to fit the widest entry.
Linker Tool Use the Linker Tool within the Order Status window to connect multiple windows so the symbol entered into one window displays in all linked windows simultaneously. For additional information, see Linker Tool.
<Tool Name> Menu The <Tool Name> menu contains options that allow you to execute common tasks. Options include printing, exporting data, refreshing or reloading trading data, accessing help information, detaching or attaching window positions, and closing windows. The options may vary slightly depending upon the tool you are using. For additional information, see <Tool Name> Menu.
Right-click Functionality Several tools in ScottradeELITE offer a shortcut menu with various options. The shortcut menu opens when you right-click anywhere in the window. For more information, see Right-click Functionality.
Symbol Lookup Symbol Lookup, which is included within most tools in ScottradeELITE, provides you with more information about a company via its symbol. For more information, see Symbol Lookup.
Minimize / Restore Minimize and restore buttons are available on the top bar of all active windows in ScottradeELITE. For more information, see Minimize / Restore.
Template Manager Template Manager is functionality found in several ScottradeELITE tools or windows. Located in the top right corner of the tool or active window, Template Manager is represented by a button. For more information, see Template Manager.

ScottradeELITE User Guide
IPO Calendar 175
IPO Calendar
What Is the IPO Calendar*? The IPO Calendar provides a detailed summary of historical and upcoming initial public offerings (IPOs).
Accessing the IPO Calendar You can access the IPO Calendar in the following ways:
• On the Main Menu, point to Research and then click IPO Calendar. • On the Research Menu, click IPO Calendar.
Finding, Sorting, Filtering, and Organizing Data Using functionality native to the IPO Calendar window, you can filter the search results by preset settings or a custom date range. You can also sort search results by column heading.
Finding Earnings Information (Using Search)
When the IPO Calendar window opens, it automatically searches for companies with upcoming IPOs within the last 30 days.
Sorting by Column Heading
To sort the search results by a column, click the column heading you want. The search results, sorted by the column you selected, display in the window.
Filtering by Date Range
You can filter your search criteria by a preset date range and upcoming IPOs or by a custom date range.

ScottradeELITE User Guide
IPO Calendar 176
To filter the search results by a preset date range, on the Date: menu, click a preset date range (Last 30 days + Upcoming, Last 90 days + Upcoming, or Last 12 months + Upcoming).
To filter the search results by a custom date range, do the following:
1. On the Date: menu, click Custom Range.
2. In the Date Filter dialog box, enter a Start Date and End Date, and then click OK.
The earnings results within your specified custom date range display on the screen.
Organizing Column Order Using the Drag-and-Drop Operation
To rearrange column order, drag the column heading to the location you want.
Resizing Columns
You can adjust the column size within the IPO Calendar window by using either of the operations below:
• Drag and Drop Operation - Point to the edge of the column heading. When the pointer becomes a double-headed arrow , drag the pointer to adjust the column size.
• Double-click - Point to the edge of the column heading. When the pointer becomes a double-headed arrow, double-click the column. The column (or row) will automatically adjust to fit the widest entry.
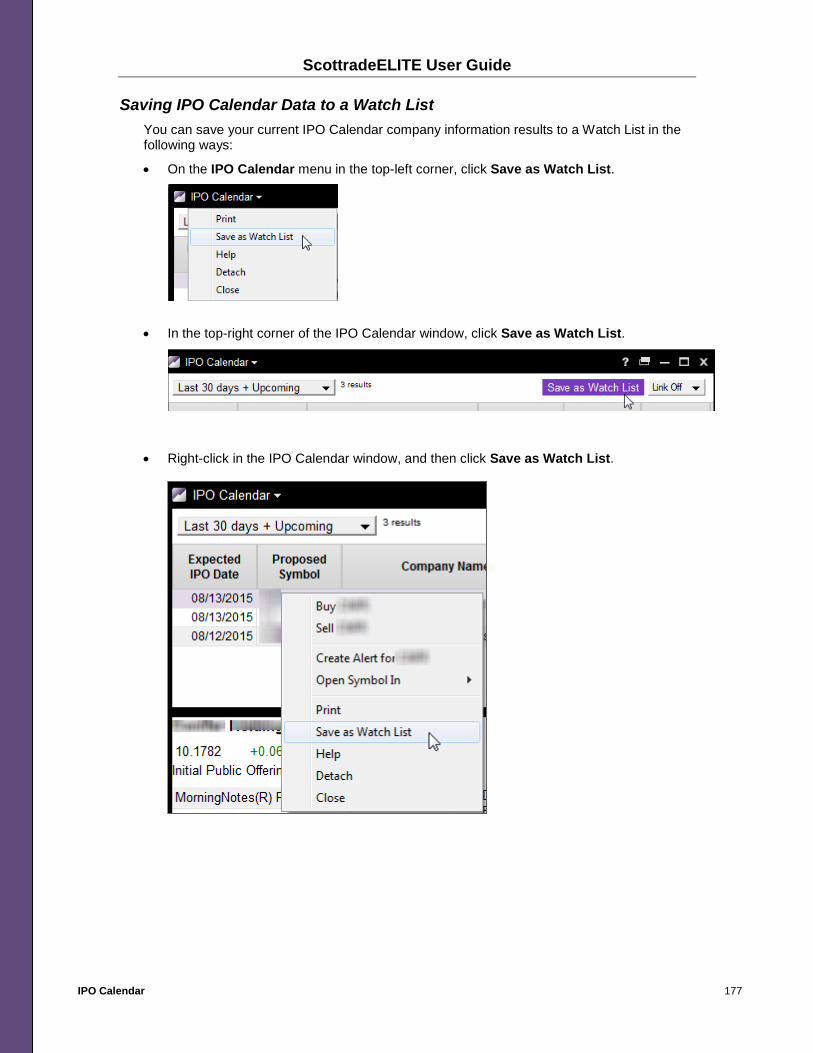
ScottradeELITE User Guide
IPO Calendar 177
Saving IPO Calendar Data to a Watch List You can save your current IPO Calendar company information results to a Watch List in the following ways:
• On the IPO Calendar menu in the top-left corner, click Save as Watch List.
• In the top-right corner of the IPO Calendar window, click Save as Watch List.
• Right-click in the IPO Calendar window, and then click Save as Watch List.

ScottradeELITE User Guide
IPO Calendar 178
Placing an Order from the IPO Calendar For equities (stocks and ETFs), you can place a trade from the IPO Calendar window in the following ways:
• Click the Trade button. See steps. • Right-click the technical event information in the upper pane or lower pane and click Buy
<order type at price> or Sell <order type at price>. See steps.
Using the Trade Button
To place an order from the IPO Calendar window with the Trade button:
1. In the upper pane, select the security you want.
2. In the lower pane, click Trade.
The Order Entry window appears with the symbol you entered in the IPO Calendar window.
3. In the Order Entry window, enter data in the remaining blank fields (Quantity, Order Type and Limit or Stop Price) to complete your order.
4. Click Place Trade.

ScottradeELITE User Guide
IPO Calendar 179
Upon successful trade placement, the Order Entry window will display your order confirmation. You can check the status of your order via the Order Status window.
For more information about order types and/or placing orders, see Placing a Stock / ETF Order.
Using Right-Click Functionality: Placing an Order
To place an order using right-click functionality:
1. Right-click the technical event information in the upper pane or in the lower pane.
2. On the shortcut menu, click Buy <order type at price> to place a purchase order or click Sell <order type at price> to place an order to sell a stock or ETF.
This launches the Order Entry window where you can place your order.
The Order Entry window populates automatically and contains the symbol and order type from your IPO Calendar window.

ScottradeELITE User Guide
IPO Calendar 180
Linker Tool Use the Linker Tool within the Order Status window to connect multiple windows so the symbol entered into one window displays in all linked windows simultaneously. For additional information, see Linker Tool.
<Tool Name> Menu The <Tool Name> menu contains options that allow you to execute common tasks. Options include printing, exporting data, refreshing or reloading trading data, accessing help information, detaching or attaching window positions, and closing windows. The options may vary slightly depending upon the tool you are using. For additional information, see <Tool Name> Menu.
Right-Click Functionality Several tools in ScottradeELITE offer a shortcut menu with various options. The shortcut menu opens when you right-click anywhere in the window. For more information, see Right-click Functionality.
Symbol Lookup Symbol Lookup, which is included within most tools in ScottradeELITE, provides you with more information about a company via its symbol. For more information, see Symbol Lookup.
Minimize / Restore Minimize and restore buttons are available on the top bar of all active windows in ScottradeELITE. For more information, see Minimize / Restore.
Template Manager Template Manager is functionality found in several ScottradeELITE tools or windows. Located in the top right corner of the tool or active window, Template Manager is represented by a button. For more information, see Template Manager.
* Initial Public Offerings cannot be purchased through Scottrade until the securities begin trading in the secondary market. Prior to the opening transaction in the secondary market, Scottrade only accepts limit orders and stop-on-quote limit orders.
Before investing in an Initial Public Offering, be sure that you are fully aware of the risks involved with this type of investing.
There are a variety of risk factors typically associated with investing in new issue securities, any of which may have a material and adverse effect on the price of the issuer’s common stock. IPOs may not be appropriate for every investor. Customers should read the offering prospectus carefully, and make their own determination of whether an investment in the offering is consistent with their investment objectives, financial situation, and risk tolerance.

ScottradeELITE User Guide
Zacks Predefined Screener 181
Zacks Predefined Screener
What Is Zacks Predefined Screener? Scottrade has partnered with Zacks12 Investment research to take advantage of its expertise in researching and analyzing U.S. equities. The Zacks Predefined Screener is a tool to help clients isolate possible stocks that may meet their risk tolerance and return objectives.
To be included in Zacks list, a stock must meet 5 requirements. A stock must:
1. Exist in the Zacks database.
2. Be a U.S. stock that is traded on the New York Stock Exchange, AMEX or NASDAQ.
3. Have analyst coverage.
4. Have a minimum price of $5.
5. Have an average trading dollar volume of $5 million (over the last 20 trading days).
Accessing Zacks Predefined Screener You can access the tool in one of the following ways:
• On the Main Menu, point to Research, and then click Zacks Predefined Screener.
12Zacks is not affiliated with Scottrade. Securities shown on the Zacks Predefined Screener list may not be appropriate under all circumstances and may not be suitable for all investors. There may be other more suitable options offered by Scottrade.

ScottradeELITE User Guide
Zacks Predefined Screener 182
• On the Research menu, click Zacks Predefined Screener.
The Zacks Predefined Screener window appears.
Filtering Data in Zacks Predefined Screener by “Meets Zacks Criteria” To filter and display records that have a date in the “Meets Zacks Criteria” column, do the following:
1. Select the Meets Zacks Criteria check box.
2. In the Filter (Symbol) box, enter a symbol and then click Go.
Records for the symbol you entered display in the window.
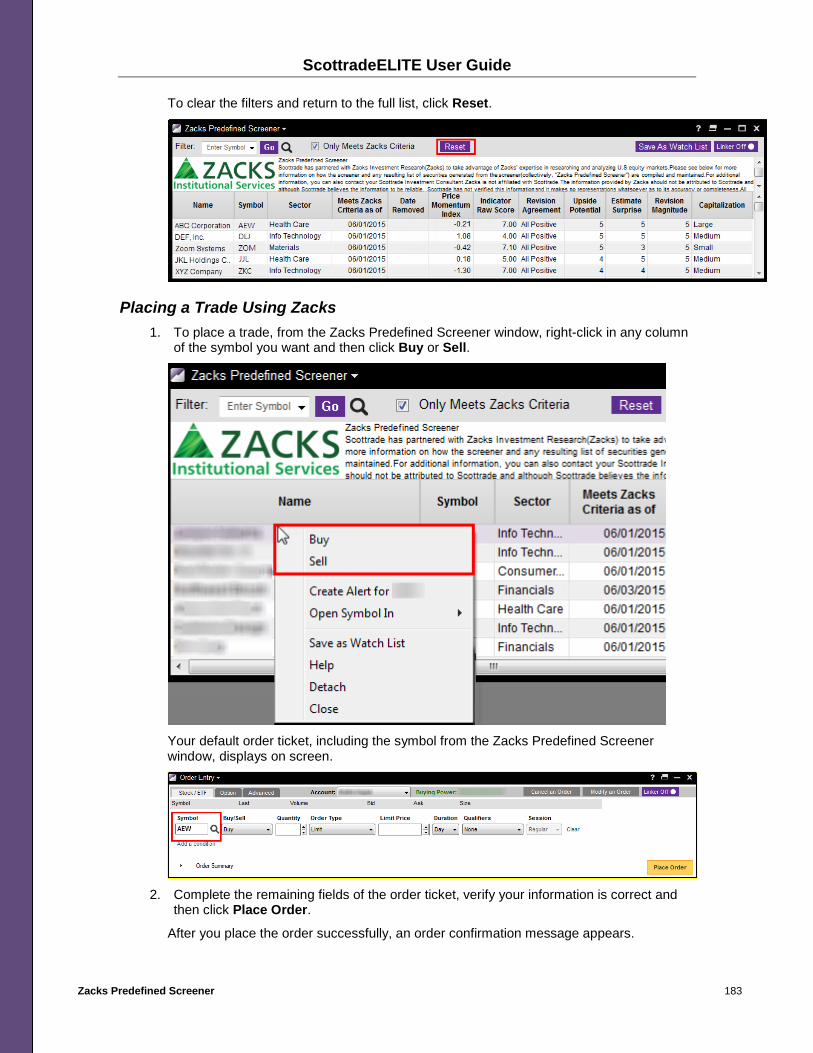
ScottradeELITE User Guide
Zacks Predefined Screener 183
To clear the filters and return to the full list, click Reset.
Placing a Trade Using Zacks 1. To place a trade, from the Zacks Predefined Screener window, right-click in any column
of the symbol you want and then click Buy or Sell.
Your default order ticket, including the symbol from the Zacks Predefined Screener window, displays on screen.
2. Complete the remaining fields of the order ticket, verify your information is correct and
then click Place Order.
After you place the order successfully, an order confirmation message appears.

ScottradeELITE User Guide
Zacks Predefined Screener 184
Using Column Features to Organize Zacks List The list of roughly 2,000 stocks is not a recommendation and is sent in alphabetical order. The column headers provide the capability for you to manipulate the data in the columns.
To view a tooltip description of each column, point to the column heading.
The following table defines the columns you can sort in Zacks Predefined Screener:
Column Name Description
Name Displays names of companies that meet the criteria to be included in Zacks database. Following are the criteria:
• U.S. Stock that is traded on the NYSE, AMEX or NASDAQ • Have analyst coverage. • Average trading dollar volume $5 million or greater (over last 20
trading days). • Stock price of $5 or greater.
When you select the “Only Meets Zacks Criteria” check box, companies must meet the following criteria, in addition to the criteria listed above, to be displayed in the filtered list:
• Raw Score of less than or equal to 3. • Price Momentum Index greater than 0.
Symbol Displays security symbols of companies that meet the criteria to be included in Zacks database. Following are the criteria:
1. U.S. Stock that is traded on the NYSE, AMEX or NASDAQ 2. Have analyst coverage. 3. Average trading dollar volume $5 million or greater (over last 20
trading days). 4. Stock price of $5 or greater.
When you select the “Only Meets Zacks Criteria” check box, companies must meet the following criteria, in addition to the criteria listed above, to be displayed in the filtered list:
1. Raw Score of less than or equal to 3. 2. Price Momentum Index greater than 0.
Sector Securities are displayed according to Zacks Global Sector Classifications.
Meets Zacks Criteria as of
The first date a stock had a Raw Score less than or equal to 3 and a Price Momentum Index greater than zero. This list will be updated daily, at approximately 7:00 a.m. CT Monday through Friday.
Date Removed The first date a stock that had previously met Zacks criteria no longer meets the criteria.
Price Momentum Index (PMI)
Represents the 11-week moving average change in price plotted in standard deviation units. The premise of the PMI is that any stock’s price momentum will revert back to its mean over time. A standard deviation greater than 0 represents positive momentum relative to the mean. The higher the standard deviation the stronger the momentum and the higher the likelihood of momentum ultimately having to trend back toward the mean.

ScottradeELITE User Guide
Zacks Predefined Screener 185
Column Name Description
Indicator Raw Score
Combines the Revision Agreement, Revision Magnitude, Upside Potential and Estimate Surprise scores into an aggregate Raw Score. The raw score is a company specific score between 1 and 9 (the lower the score the better).
Revision Agreement
Refers to the extent to which, based on Zacks’ analysis, analysts have been revising estimates in the same direction over the recent past.
• ”All Positive”: All estimate revisions were positive. • “Mostly Positive”: Most estimate revisions were positive. • “No Trend Identified”: No trend is evident. • “Mostly Negative”: Most estimate revisions were negative. • “All Negative”: All estimate revisions were negative. • “None”: No estimate revision was made during the recent past.
Upside Potential Refers to the extent to which, based on Zacks’ analysis, the most recent earning per share (EPS) estimates differ from the consensus estimates. Upside Potential scores range from 1 to 9, with 1 being considered by Zacks to be the best. Scores of 1 to 4 are considered by Zacks to be positive and scores of 6 to 9 are considered by Zacks to be negative. Upside Potential is designed to alert users to the beginning of an upward or downward trend.
Estimate Surprise Refers to the extent to which the last reported quarterly EPS deviated from the analysts’ mean estimate of that quarter’s EPS. Surprise scores range from 1 to 9, with 1 being considered by Zacks to be the best. Scores of 1 to 4 are considered by Zacks to be positive and scores of 6 to 9 are considered by Zacks to be negative.
Revision Magnitude
Refers to the percent change in the mean EPS estimate over the recent past. Magnitude scores range from 1 to 9, with 1 being considered by Zacks to be the best. Scores of 1 to 4 are considered by Zacks to be positive and scores of 6 to 9 are considered by Zacks to be negative.
Capitalization Determined by Zacks using the following for each stock, updated daily: • LARGE: Market Capitalization greater than $10 billion • MID: Market Capitalization between $2 billion and $10 billion • SMALL: Market Capitalization less than $2 billion
To sort the data in a column by ascending order, click the column heading at the top of the column. To sort the data in the column by descending order, click the tile again.
You will not be able to save a filtered or reordered list of records in the Zacks window.

ScottradeELITE User Guide
Zacks Predefined Screener 186
Saving Zacks List to a Watch List You can save your current Zacks list to a Watch List in the following ways:
• On the Zacks Predefined Screener menu in the top-left corner, click Save as Watch List.
• In the top-right corner of the Zacks Predefined Screener window, click Save as Watch
List.
• Right-click in the Zacks Predefined Screener window and then click Save as Watch List.
In your default template, a new Watch List window appears with all symbols from the Zacks window.
To save your Watch List window for future use, click Save.

ScottradeELITE User Guide
Newsletter Subscriptions 187
Newsletter Subscriptions Enhance your technical insight by getting free, independent information from industry-leading investment research providers Recognia and Trading Central.
Subscribing to Trading Central You can sign up to receive ETF strategy email via ScottradeELITE in the following ways:
• On the Main Menu, point to Research, Newsletter Subscriptions, and then click Trading Central.
• On the Research menu, point to Newsletter Subscriptions, and then click Trading Central.
If you receive the “Redirecting to TradingCentral.com” message, click OK.
To complete your subscription, follow the instructions on the Trading Central site.
Subscribing to Recognia You can sign up to receive Recognia’s Daily Market Report via ScottradeELITE in the following ways:
• On the Main Menu, point to Research, Newsletter Subscriptions, and then click Recognia.
• On the Research menu, point to Newsletter Subscriptions, and then click Recognia.
If you receive the “Redirecting to Recognia.com” message, click OK.
To complete your subscription, follow the instructions on the Recognia site.
Recognia Market Newsletter is available in English or Chinese.

ScottradeELITE User Guide
Sector Trends 188
Sector Trends The Sector Trends tool helps you identify potential trends in various securities or baskets of securities grouped together based on their business activities. In addition to identifying the trend, Sector Trends provides you with a quick, easy way to measure the strength of the trend.
All Sector Trends content in this guide is based on publically available information.
Market Index The Dow Jones Industrial Average (DJIA) U.S. Market Index and the Standard & Poor's (S&P) 500 Index are the most common methods used by financial professionals to compute an index that represents the market (U.S.). The DJIA is an index based on calculations from 30 of the largest companies in the market, while the S&P 500 is an index based on calculations from 500 larger companies. These indexes provide the trader with a representation of a basket of securities. While the DJIA is perhaps the most commonly quoted index, it only accounts for 30 securities. Financial professionals consider the S&P 500 to be a better overall index as it takes into account 500 securities of larger companies (almost 70% of the market’s value); therefore, the S&P 500 has a better overall representation of the market.
Amex, NASDAQ, and the NYSE list approximately 8000 individual securities. In addition to indexes such as the Dow or the S&P 500, it is helpful for investors classify various companies based on their type of business involvement. When investors combine companies with similar business industries to form an index, investors can easily compare one business group versus another or sort stronger companies within a business group. To provide a better business categorization, these 8000 securities compose sector and industry groups.
Sector Groupings Ten different sectors groupings represent the market (U.S.). Each sector represents a large segment of the economy. The ten sectors are as follows:
• Consumer Discretionary • Consumer Staples • Energy • Financials • Healthcare
• Industrials • Information Technology • Materials • Telecommunication Services • Utilities
For example, the Energy Sector would group any company whose business involves oil and gas into this sector. This Energy Sector group includes companies that produce oil, companies that provide oil field equipment and services, companies that store the oil in storage tanks, companies that refine the oil into various types of fuel, and companies that deal with natural gas or alternate energy sources, companies that ship the oil, and so on.
Every company with a business that involves oil and gas is used to calculate the Energy Sector Index. The investor can analyze this entire business segment from its index.

ScottradeELITE User Guide
Sector Trends 189
Industry Groups While the sector represents a large segment of an industry, the Industry Groups constitute a more specific grouping of companies with similar business activities. Thus, using the sector groupings example in the previous section, the Energy Sector breaks down into specific business groups. The industry listings for the Energy Sector are as follows:
• Coal and Consumable Fuels
• Integrated Oil and Gas
• Oil and Gas Drilling
• Oil and Gas Equipment Services
• Oil and Gas Exploration Production
• Oil and Gas Refining Marketing
• Oil and Gas Storage and Transportation
For example, you can use the Oil and Gas Equipment Services. This list comprises of roughly 188 securities that deal specifically to Oil and Gas Equipment and Services. By using this list, an index is calculated to represent the Industry Group of Oil and Gas Equipment Services.
In summary, an index based on a list of companies from a sector list provides a broader classification of general business segments. Conversely, an index based on a list of companies from the Industry list provides a more specific business representation.

ScottradeELITE User Guide
Sector Trends 190
Sector Trend Calculations The Sector Trend is a change of momentum study applied to Sector and Industry Group Indexes and individual securities to calculate the trend direction and the strength of the trend. The study is completely independent of how you calculate the Sector and Industry Indexes and the volume is not part of the calculations. The calculations use a proprietary combination of widely used formulas standard deviations, moving averages and average true range values to identify the trend in a Sector or Industry index or an individual security.
Once you identify a trend, the strength of the trend is derived by normalizing to the average true range of the underlying index or security. This provides trend and strength values that can be compared regardless of which underlying Index or security you used for calculations. In addition, to accentuate the change in trend from negative to positive, the calculation model includes a modified custom log transformation to allow appropriate scaling. The application performs all calculations in real time on the server level; this process frees up your computer resources for trading purposes.
When you're looking at the Sector Trends tool, the final sector trend value is a number that can range between -100 to +100. Any values between 0 and +100 denote strength or positive momentum and are assigned a green color. The more the trend value increases toward +100, the stronger the perceived trend. Any values between 0 and -100 denote weakness or negative momentum and are assigned a red color. The more the trend value decreases toward -100, the weaker the perceived trend. When the trend is not discernible (usually when the value is very close to zero), it is considered to be neutral and is assigned a yellow color.
Using Sector Trends You can use the Sector Trends tool in several ways. See the following section for an example of its use.
Top Down Approach
The Sector Trend tool starts from an overall perspective. The initial window shows the trend momentum for the overall market and the ten sectors, which are based on a broader segment.

ScottradeELITE User Guide
Sector Trends 191
The first badge, labelled Market, is an overall representation of the market. Each bar represents one trading day. Next, the ten sectors display.
If you click any particular sector, all the various Industry groups in that sector appear. The Industry groups are sub-categories with a more specific grouping of companies with similar business activities. For example, if you will click the badge for the energy sector:
You can easily identify which industry groups are weak or strong within the energy sector. Those with red bars have been underperforming the general market, while those with green bars have been performing better than the market. Additionally, by looking at the trend in the bars you can see whether the under or over-performance trends are changing based on the directional changes in bar height.
You can drill down one additional level to the individual securities that are used to represent the specific industry. For example, by clicking on the badge for Oil & Gas Storage & Transportation, you are able to see those securities that are used to represent that specific industry. Keep in mind, the securities listed at this level are not intended to be a comprehensive list of publicly traded securities within the selected industry.

ScottradeELITE User Guide
Sector Trends 192
Saving Data to Watch Lists You can save your stocks or positions in Sector Trends to a watch list.
1. In the View By: section, click Stock or click My Positions.
2. After you have selected your stocks, on the Sector Trends menu, click Save as Watch List.
The Watch List window appears and contains a Sector Trends tab.
3. To save the Sector Trends Watch List, on the Watch Lists menu, click Save List.
4. To save the Sector Trends Watch List as a different name, on the Watch Lists menu, click Save List As.
Sector Trends Actions The following table lists the available options located on the Sector Trends menu.
To… Click…
Open the Alerts Manager and create alerts Create Alert.
Print a Sector Trends list Print. Opens the Print dialog box.
Open a watch list Load Watch List
Send Sector Trends data to a watch list so you can save it
Save as Watch Lists.
Save Sector Trends data to a local drive as a .csv file
Export to .csv
Access online help Help. Opens the Scottrade Knowledge Center.
Detach the window Detach. Allows you to detach the window from its docked position. You can drag the detached window outside of the main ScottradeELITE platform and onto an alternate computer screen.
Close the window Close.

ScottradeELITE User Guide
Sector Trends 193
Using Right-click Functionality Several ScottradeELITE tools offer a shortcut menu with options. To see a shortcut menu to quickly perform the tasks below, right-click any symbol in the Top Performers list. For more information, see Right-click Functionality.
<Tool Name> Menu The <Tool Name> menu contains items that allow you to execute common tasks. Menu items include printing, exporting data, refreshing data, accessing help information, detaching or attaching window positions, and closing windows. Note that the options may vary slightly depending upon the tool you are using. For additional information, see <Tool Name> Menu.
Symbol Lookup Symbol Lookup, which is included within most tools in ScottradeELITE, provides you with more information about a company via its symbol. For more information, see Symbol Lookup.
Minimize / Restore Minimize and restore buttons are available on the top bar of all active ScottradeELITE windows. For more information, see Minimize / Restore.

ScottradeELITE User Guide
Hot Keys 194
Hot Keys
What Is a Hot Key? Hot keys are commands you can create using the keys on your keyboard. Using hot keys provide quicker access to market research and help you react faster when you spot an opportunity.
Why Use Hot Keys? You can modify the hot key setup and key type selections to suit your trading needs. You can easily add, edit, or delete hot keys from a menu and choose what key you want to use for a specific function.
Accessing Hot Keys To access the Hot Key Setup, on the Main Menu, point to Configure, and click Hot Keys.

ScottradeELITE User Guide
Hot Keys 195
The Hot Key Setup dialog box appears.
If you are currently looking at a single symbol window, the hot key opens the selected tool with the symbol attached. If you are looking at a window with multiple symbols, the tool opens with no symbol entered.
Creating a New Hot Key To create a hot key to quickly perform a task, follow the steps below.
1. To open the Hot Key Action dialog box and set up hot keys, click Add.
The Hot Key Action dialog box appears.

ScottradeELITE User Guide
Hot Keys 196
2. In the Action Type list, choose the action you want to see completed when you enter a hot key.
3. In the Hot Key box, type the hot keys you want to assign to your action (for example, press Ctrl+Shift+F6), and then click OK.
Available actions include order controls as well as individual window launch. For Security and Option Order Entry Hot Keys, you can select market side, quantity, order type, and, as appropriate, limit, duration, and qualifier values.
4. To close the dialog box and save your settings, click OK.

ScottradeELITE User Guide
Hot Keys 197
Assigning an Existing Hot Key to a Task To assign a hot key combination to a specific task, from the Hot Key Setup dialog box, click the key combination you want, and then click OK.
A hot key combination may be assigned to one action only.
Changing Hot Key Assignments To modify a Hot Key assignment to a task, follow the steps below.
1. In the Hot Key Setup dialog box, in the Hot Key list, click the hot key you want to modify.
2. Click Change.

ScottradeELITE User Guide
Hot Keys 198
3. The Hot Key Action dialog box appears.
4. In the Action Type list, choose the action you want to see completed when you enter a hot key.
5. In the Hot Key box, type the hot keys you want to assign to your action, and then click OK.
6. To exit the Hot Key Setup dialog box and save your settings, click OK.

ScottradeELITE User Guide
Hot Keys 199
Deleting a Hot Key
To delete a Hot Key, follow the steps below:
1. In the Hot Key Setup dialog box, click the hot key you want to delete, and then click Remove. The hot key is deleted.
2. To exit the Hot Key Setup dialog box and save your settings, click OK.
Using Hot Keys in Order Entry
Multiple Symbols
If you are viewing a window that contains multiple symbols and press a hot key combination, the hot key opens a blank window. For Order Entry Hot Keys, the ticket is completed with the Hot Key parameters that you defined. You only need to type the symbol.
Single Symbol
If you press a hot key combination for Order Entry while you are looking at a window with only one symbol, such as the Full Quote or Chart windows, the order goes through and provides you with an order confirmation preview.
An order review window appears, verifying that you want to place the order.
To view your confirmed order in the Order Status window, click Yes.

ScottradeELITE User Guide
Watch Lists 200
Watch Lists
What Are Watch Lists? Watch lists are a way to track and monitor all your potential security picks in a single location.
Why Use Watch Lists? Do you have a favorite security that you like to trade repeatedly throughout the day? Are you interested in finding certain price patterns or being reminded of trading opportunities that you otherwise may have forgotten? Whether you already have securities in your portfolio or have a list of securities you want to monitor, watch lists can help you accomplish your goals.
Using ScottradeELITE Watch Lists, you can:
• Access market data that is most important to you. • Monitor securities in up to 500 watch lists. • Choose the market data you want to include in your lists so you are always seeing the
information that is most crucial to your trading. • Save space and time by housing several lists (up to 50 tabs) per window. • Receive alerts about any changes to a security in your lists.
Accessing Watch Lists There are two ways to access Watch Lists:
• On the Main Menu, point to Quotes and then click Watch Lists.

ScottradeELITE User Guide
Watch Lists 201
• On the Quotes menu, click Watch Lists.
The Watch Lists window appears:
By default, the Watch Lists window displays with all fields blank.

ScottradeELITE User Guide
Watch Lists 202
Viewing, Adding and Removing Securities To add a symbol to your Watch List:
1. In the Symbol box, type the symbol you want to monitor.
2. Click Add.
The Watch Lists window allows you to view the data for the symbol or list of symbols you have entered.
To delete or remove a symbol from your Watch List, on the row of the symbol you want to delete or remove, right click the row and then click Remove Row.
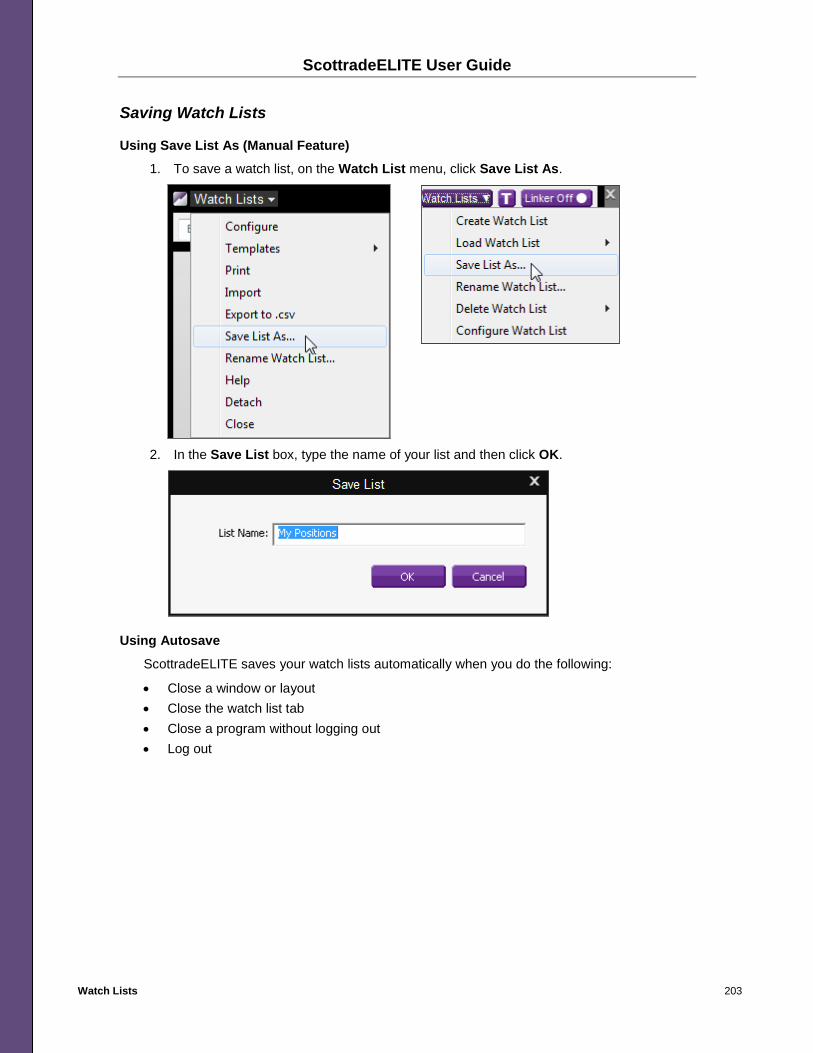
ScottradeELITE User Guide
Watch Lists 203
Saving Watch Lists
Using Save List As (Manual Feature)
1. To save a watch list, on the Watch List menu, click Save List As.
2. In the Save List box, type the name of your list and then click OK.
Using Autosave
ScottradeELITE saves your watch lists automatically when you do the following:
• Close a window or layout • Close the watch list tab • Close a program without logging out • Log out

ScottradeELITE User Guide
Watch Lists 204
Using Symbol Lookup To find symbols based on the name of the company, use the Symbol Lookup button. Type a symbol in the Symbol box in the Watch Lists window and then click the Symbol Lookup button.
The Symbol Lookup functionality is available in most tools or windows on the ScottradeELITE platform. For additional information, see Symbol Lookup.
Using Double-Click Functionality You can add new or modify existing symbols in any row within the Symbol column.
To add a new symbol:
1. Under the Symbol column heading, double-click the cell.
2. In the cell, type the symbol and press Enter.

ScottradeELITE User Guide
Watch Lists 205
3. In the cell, type the symbol, click the Symbol Lookup button and then click the symbol you want from the Symbol Lookup window.
4. Click Add.
Trading Options from Watch Lists You can add options to your Watch List by using the Options Symbol Builder. To access the Option Symbol Builder:
1. To the right of the Symbol box in the top left corner, click the Option Builder button to build your symbol.
2. The Watch Lists window expands to display the Option Builder tools.
3. In the Underlying <symbol> box, type the symbol of the underlying security, and then press Enter.
4. In the Call/Put list, click Calls or Puts.
5. In the Expiration list, click when the option expires.
6. In the Strike box, click the strike price and then click Go.
View the quotes for each exchange on which a particular symbol is trading by typing a pound sign (#) before the symbol to expand it.

ScottradeELITE User Guide
Watch Lists 206
Viewing Equity Events Information for a Security When you set up the Events column in your Watch List window, icons will display for the security symbol entered for the following events:
• Projected Earnings: Displays if an event is approaching in the next 3 weeks for an equity.
• Historical Earnings: Shows the past events in the last 5 business days for an equity. • Offerings: Displays the offering type (IPO or SPO), exchange and settlement date for the
last 5 business days. • Dividends: Provides the pay date, event type (dividend) and amount if in the next 3
weeks or the last 5 business days. • Recognia Items: Shows when a Recognia Technical Event has occurred in the last 5
business days. • Splits: Shows the type (split), the date the split occurred and the ratio has occurred in the
last 5 business days. • Zacks List Items: Signals that the security currently meets Zacks criteria.
Viewing Projected Earnings
If an equity in the Symbol column of your Watch List window has upcoming earnings information, an earnings icon will display in the Events column for that equity.
To view additional projected earnings information for a specific equity, add the Events column (for instructions, see Configuring Columns) and point to the earnings icon. A tooltip displays the following:
• Date expected • Consensus (low-high) • Number of analysts reporting
ScottradeELITE User Guide
Watch Lists 207
Viewing Historical Earnings
If an equity in in the Symbol column of your Watch List window has historical earnings information, an earnings icon will display in the Events column for that equity.
To view additional historical earnings information for a specific equity, point to the earnings icon. A tooltip displays the following:
• Date • Actual earnings amount • Number of Analysts reporting • % Surprise (difference between consensus and actual amounts)
Viewing Offerings
If an equity in in the Symbol column of your Watch List window has an offering (IPO or SPO), an offerings icon will display in the Events column for that equity.
To view more offerings details for a specific equity, point to the offerings icon. A tooltip displays the following:
• Exchange • Type (IPO or SPO) • Settlement Date
Viewing Dividends
If an equity in the Symbol column of your Watch List window has an ex-dividend date, a dividends icon will appear in the Events column for that equity.
To view additional dividends details for a specific equity, point to the dividends icon. A tooltip displays the following:
• Ex-Date [mm/dd/yyyy] • Type: Dividend • Amount:
Viewing Recognia Items
If a Technical Event about an equity in the Symbol column of your Watch List window can be found in Recognia AlertWire, a Recognia icon will display in the Events column for that equity.
To view additional Recognia list information details for a specific equity, point to the Recognia icon.
Viewing Splits
If there is a split for an equity in in the Symbol column of your Watch List window, a splits icon will display in the Events column for that equity.
To view additional splits information for a specific equity, point to the splits icon. A tooltip displays the following:
• Date [mm/dd/yyyy] • Type • Ratio

ScottradeELITE User Guide
Watch Lists 208
Viewing Zacks List Items
If more information about an equity in the Symbol column of your Watch List window can be found in Zacks Predefined Screener, a Zacks icon will display in the Events column for that equity.
To view additional Zacks list information details for a specific equity, point to the Zacks icon.
Configuring Columns
You can add new or remove existing columns in your Watch Lists window.
To add one column or multiple columns:
1. On the Watch Lists menu, click Configure.
2. In the Configure Watch List dialog box, in the Available list, locate the item you want:
o Search. In the Search box, type the name of the item. The result displays in the Available list.
o View. In the View section, click Alphabetical to sort the list in alphabetical order or
click By Category to sort the list by available categories.

ScottradeELITE User Guide
Watch Lists 209
3. In the Available list, select the column data you want to include on your watch list and then click Add.
To select multiple columns, hold down Shift or Ctrl while clicking the columns you want.
Your columns display in the Selected list to the right.

ScottradeELITE User Guide
Watch Lists 210
4. Click OK.
The columns display in your Watch Lists window.
To remove one column or multiple columns:
1. On the Watch Lists menu, click Configure.
2. In the Configure Watch Lists window, in the Selected list, click the column data item or
items you want to remove from the window.

ScottradeELITE User Guide
Watch Lists 211
3. Click Remove.
4. Click OK.
The column(s) no longer display in your Watch Lists window.
As an alternative to launching Velocity & Forces to view the data, you can add Velocity & Forces columns to your Watch Lists. To add Velocity & Forces columns, see Configuring Columns.

ScottradeELITE User Guide
Watch Lists 212
Applying Font Settings (Current Tab) You can change the font for one or multiple tabs in your Watch Lists window.
To change the font settings on one tab:
1. If you have multiple tabs, select the tab you want to change.
2. On the Watch Lists menu, click Configure.
3. Under Current Tab, click Font Settings.

ScottradeELITE User Guide
Watch Lists 213
4. In the Font dialog box, make your font selections, and then click OK.
5. In the Configure Watch List dialog box, click OK.
The font settings display in the tab you selected.
To discard your recent font changes and return to the previous font setting:
1. In the Configure Watch List dialog box, click Reset Font.
2. Click OK.

ScottradeELITE User Guide
Watch Lists 214
Applying Font Settings (All Tabs) You can change the font for one or multiple tabs in your Watch Lists window.
To change the font settings on multiple tabs:
1. On the Watch Lists menu, click Configure.
2. Under All Tabs, click Font Settings.
3. In the Font dialog box, make your font selections and then click OK.

ScottradeELITE User Guide
Watch Lists 215
4. In the Configure Watch List dialog box, click OK.
The font settings display in all tabs.
To discard your recent font changes and return to the previous font setting:
1. In the Configure Watch List dialog box, click Reset Font.
2. Click OK.
If you changed the font settings on a tab other than the Default tab and then apply a different font setting under All Tabs, only tabs that do not have custom font settings will receive the different font. If you click Reset Font on an active tab with custom settings, the active tab will inherit the All Tabs font setting.
About ScottradeNOTES
In the Watch Lists window, you can enter personal notes, up to 50 characters, to any symbol and save them with your layout. ScottradeNOTES displays as a column within the Watch Lists window.
To add the ScottradeNOTES column:
1. In the Configure Watch List dialog box, in the View section, click Alphabetical.
2. In the Available list, select ScottradeNOTES, and then click Add. Your selection displays in the Selected list to the right.
3. Click OK. The ScottradeNOTES column displays in your Watch List window.
To create a ScottradeNOTE:
1. Next to the symbol you want to notate, click the ScottradeNOTES cell, and delete the text in the cell.
2. When you are finished, click a different cell.
To remove the ScottradeNOTES column from your window:
1. In the Configure Watch List dialog box, in the Selected list, select ScottradeNOTES, and then click Remove.
2. Your selection displays in the Available list on the left.
3. Click OK. The ScottradeNOTES column no longer displays in your Watch List window.
Resizing Columns
You can adjust the column size within the Watch Lists window by doing one of following:
• Click-and-Drag - Point to the edge of the column heading. When the pointer becomes a double-headed arrow, drag the pointer to adjust the column size.
• Double-click - Point to the edge of the column heading. When the pointer becomes a double-headed arrow, double-click the column. The column (or row) automatically adjusts to fit the widest entry.

ScottradeELITE User Guide
Watch Lists 216
Managing Watch Lists Using the Watch List menus (left corner or right side of window) or right-click functionality, you can do the following and more:
• Add a new list or remove a saved list • Build a custom watch list to monitor securities that most interest you. • Monitor securities in up to 500 watch lists at once. • Place a trade. • Receive alerts about changes to a security. • Print your active watch lists. • Load a security in one of eight other windows on the ScottradeELITE platform. • Apply headings to organize and separate groups of securities within a list.
Using the Watch Lists Menu
The Watch Lists menus are located in upper-left corner and top right area of the Watch Lists window.
See the table below for a list of available menu commands from the Watch Lists menus.
To… Click…
Create a new watch list Create Watch List. If you set the tabs to display in windows, ScottradeELITE opens a new tab with the selected watch list displayed in the current window. If tabs are not enabled, the selected watch list opens in a new window.
Load an existing watch list Load Watch List. In the submenu, click the watch list type you want.
Save the list Save List As. In the Save List dialog box, type the name you want.
Assign a new name to an existing watch list; eliminating the instance of duplicate names.
Rename Watch List.
Delete a watch list Delete Watch List. In the submenu, click the list you want to delete.
Add new or remove existing columns in your Watch Lists window
Configure Watch List.

ScottradeELITE User Guide
Watch Lists 217
Using Right-click Functionality (Tab)
To see a shortcut menu that allows you to quickly perform the tasks below, right-click the untitled or new tab at the top of the window.
To… Click…
Create a new watch list Create New Watch List. If you set the tabs to display in windows, ScottradeELITE opens a new tab with the selected watch list displayed in the current window. If tabs are not enabled, the selected watch list opens in a new window.
Load an existing watch list Add Watch List. In the submenu, click the watch list type you want.

ScottradeELITE User Guide
Watch Lists 218
Using Right-click Functionality (Symbol Row)
To see a shortcut menu that allows you to quickly perform the tasks below, right-click any symbol in the list.

ScottradeELITE User Guide
Watch Lists 219
To… Click…
Place an order Buy [Symbol] Sell [Symbol]. The Order Entry window appears with the symbol populated in the Symbol box.
Create an alert for a security Create Alert for [Symbol]. The Alerts Manager appears. Complete the rules to create an alert for the symbol.
Open the symbol in one of eight other ScottradeELITE windows.
Open Symbol In.
Add a new security row Insert Symbol Row. In the blank row that appears, you can add a new security.
Insert a grouping row Insert Header Row. In the blank row that appears, you can type a description to separate the symbols above and below it into two distinct groups.
Remove a symbol Remove Row. The symbol is removed from the Quote Grid list.
Create a new watch list Create Watch List.
Open a new or saved watch list Load Watch List. From the submenu, select the watch list type you want.
Save a custom list Save List As.
Assign a new name to an existing watch list; eliminating the instance of duplicate names.
Rename Watch List.
Delete a saved list Delete Watch List.
Add or remove preset columns or change font settings
Configure Watch List.
Save a template or access Template Manager Templates.
Print the watch list Print Active Watch List. Opens the Print dialog box
Detach the window from or attach the window to the main user interface.
Detach / Attach.
Close the Watch List window Close.

ScottradeELITE User Guide
Watch Lists 220
Importing Watch Lists and Positions to Active Ticker You can import Watch Lists or Positions to the Active Ticker so that you can monitor the trading activity in a small scrolling format.
To import Watch Lists and Positions to Active Ticker:
1. On the Main Menu, point to Configure and then click Ticker Settings.
The Ticker Configuration window appears.
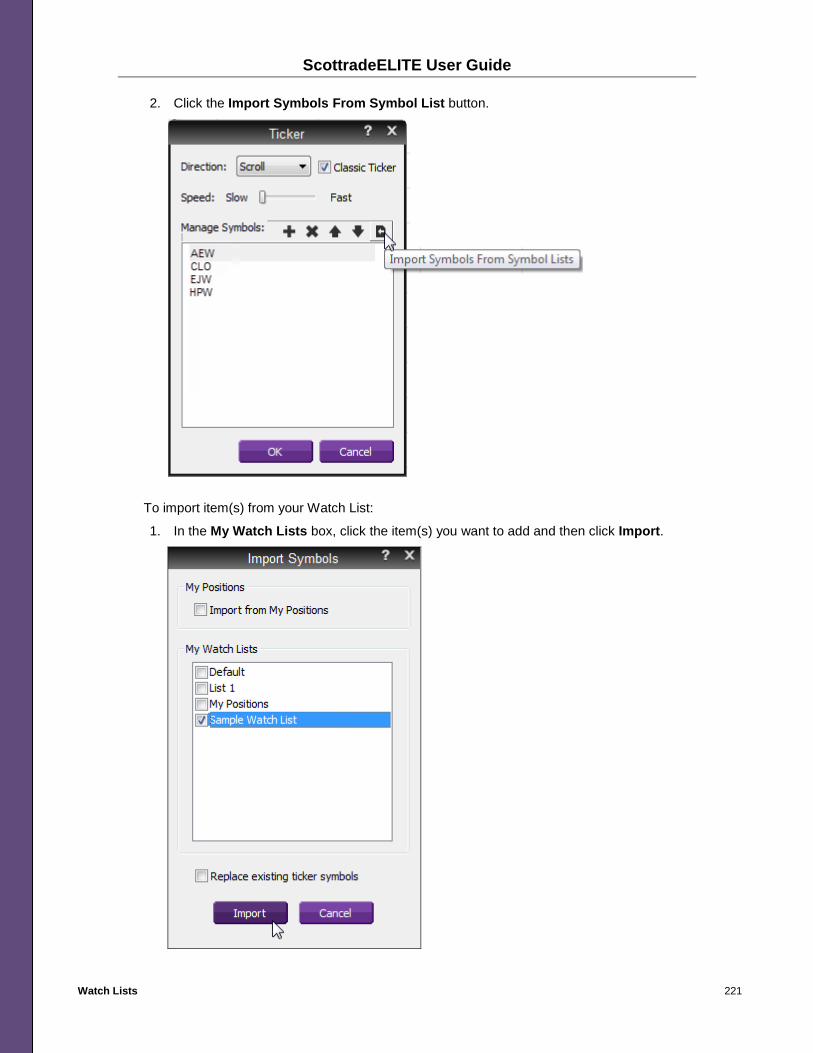
ScottradeELITE User Guide
Watch Lists 221
2. Click the Import Symbols From Symbol List button.
To import item(s) from your Watch List:
1. In the My Watch Lists box, click the item(s) you want to add and then click Import.

ScottradeELITE User Guide
Watch Lists 222
The items you selected from the My Watch Lists box appear in the lower portion of the Ticker Configuration window.
2. Click OK.
The symbols from that Watch List display in the Ticker at the bottom of the window.
To import items from your Positions:
1. In the Ticker Configuration window, select the Import from My Positions box, and then click Import.

ScottradeELITE User Guide
Watch Lists 223
The symbols from your Positions display in the list in the lower portion of the Configuration window.
2. Click OK.
The symbols from your Positions display in the list in the Ticker at the bottom of the window.

ScottradeELITE User Guide
Detailed Quote 224
Detailed Quote The Detailed Quote window offers you immediate access to streaming market data for any symbol you want to research. With ScottradeELITE, you can choose what market data displays in your Detailed Quote window so you are always researching based on the data that’s most crucial to your trading.
Accessing Detailed Quote There are two ways to open the Detailed Quote window:
• On the Main Menu, point to Quotes, and then click Detailed Quote.
• On the Quotes menu, select Detailed Quote.
Using Detailed Quote To retrieve a detailed quote:
1. In the Symbol box in the top left corner of the Detailed Quote window, type a symbol.
2. Click Go or press ENTER.

ScottradeELITE User Guide
Detailed Quote 225
Using Symbol Lookup To find symbols based on the name of the company, use the Symbol Lookup button. In the Symbol box, type a symbol, and then click the Symbol Lookup button.
The Symbol Lookup functionality is available in most ScottradeELITE tools or windows. For additional information, see Symbol Lookup.
Other Detailed Quote Functionality At the top of the Detailed Quote window, five buttons appear to the right of the Symbol Lookup button:
Each button is a pre-set template and represents a type of research analysis that can be used to help with investment decisions. See the table below for details.
Button Name Description (Type of Research Offered)
Custom By default, the Custom button includes all fields from the Summary button. The Custom tab is the only tab that allows you to add, remove, or rearrange any of the fields. For additional information on configuring the fields, see the Setting up Detailed Quotes section.
Financials View financial information for a security including the issuing company's income statement.
Technicals Use technical indicators to spot market trends and manage risks associated with price movements.
Fundamentals Use fundamental indicators to determine a company’s profitability, investment value, the ROI on shares of that company that are sold, liquidity ratios, and corporate governance.
Summary Includes the same fields as the Custom button fields.
The active button is highlighted and the details for that active button appear in the Detailed Quote window.

ScottradeELITE User Guide
Detailed Quote 226
Viewing Equity Events Information for a Security When you set up the Events column in your Detailed Quotes window, icons will display for the security symbol entered for the following events:
• Projected Earnings: Displays if an event is approaching for an equity. • Historical Earnings: Shows the past events for an equity. • Offerings: Displays the offering type (IPO or SPO), exchange and settlement date. • Dividends: Provides the pay date, event type (dividend), and amount. • Recognia Items: Shows when a Recognia Technical Event is available. • Splits: Shows the type (split), the date the split occurred, and the ratio. • Zacks List Items: Signals that Zacks contains more information about an equity
Viewing Projected Earnings
If an equity in the Symbol column of your Detailed Quotes window has upcoming earnings information, an earnings icon will display in the Events column for that equity.
To view additional projected earnings information for a specific equity, add the Events column (for instructions, see Configuring Detailed Quotes) and point to the earnings icon. A tooltip displays the following:
• Date expected • Consensus (low-high) • Number of analysts reporting
Viewing Historical Earnings
If an equity in in the Symbol column of your Detailed Quotes window has historical earnings information, an earnings icon will display in the Events column for that equity.
To view additional historical earnings information for a specific equity, point to the earnings icon. A tooltip displays the following:
• Date • Actual earnings amount • Number of Analysts reporting • % Surprise (difference between consensus and actual amounts)
Viewing Offerings
If an equity in in the Symbol column of your Detailed Quotes window has an offering (IPO or SPO), an offerings icon will display in the Events column for that equity.
To view more offerings details for a specific equity, point to the offerings icon. A tooltip displays the following:
• Exchange • Type (IPO or SPO) • Settlement Date

ScottradeELITE User Guide
Detailed Quote 227
Viewing Dividends
If an a dividend was paid for an equity in in the Symbol column of your Detailed Quotes window, a dividends icon will appear in the Events column for that equity.
To view additional dividends details for a specific equity, point to the dividends icon. A tooltip displays the following:
• Date [mm/dd/yyyy] (this is the pay date) • Type: Dividend • Amount:
Viewing Recognia Items
If a Technical Event about an equity in the Symbol column of your Watch List window can be found in Recognia AlertWire, a Recognia icon will display in the Events column for that equity.
To view additional Recognia list information details for a specific equity, point to the Recognia icon.
Viewing Splits
If there is a split for an equity in in the Symbol column of your Detailed Quotes rmers window, a splits icon will display in the Events column for that equity.
To view additional splits information for a specific equity, point to the splits icon. A tooltip displays the following:
• Date [mm/dd/yyyy] • Type • Ratio
Viewing Zacks List Items
If more information about an equity in the Symbol column of your Detailed Quotes window can be found in Zacks Predefined Screener, a Zacks icon will display in the Events column for that equity.
To view additional Zacks list information details for a specific equity, point to the Zacks icon.

ScottradeELITE User Guide
Detailed Quote 228
Configuring Detailed Quotes The following section provides instructions for configuring the Detailed Quote window.
Configure Detailed Quote Functions
The table below contains the core elements of the Configure Detailed Quote dialog box.
Function Description
1. Search You can search the available list by typing the field name in the Search Bar.
2. Sorting You can arrange the list alphabetically or by category.
3. Items List On the left side of the Configure window, you can select an option from a list of available data fields.
4. Spreadsheet A spreadsheet displays on the right side of the configure window. This spreadsheet is used to add and organize the fields you as you choose.
Initially, ScottradeELITE loads the fields that are currently in use on the Custom tab.

ScottradeELITE User Guide
Detailed Quote 229
Adding Fields
You can add new or remove existing fields in your Detailed Quotes window.
To add one field or multiple fields:
1. On the Detailed Quote menu, click Configure.
2. In the Configure Detailed Quote dialog box, in the list of available fields, locate the field you want:
o Search. In the Search box, type the name of the field. The result displays in the list below.
o View. In the View section, click Alphabetical to sort the list in alphabetical order or click By Category to sort the list by available categories.

ScottradeELITE User Guide
Detailed Quote 230
3. In the list of available fields, select the data you want to see, and do one of the following:
4. Click Add.
5. Drag the field you want to the spreadsheet.
To select multiple fields, hold down Shift or Ctrl while clicking the field you want.
Your field displays in the spreadsheet to the right.
6. Click OK.
The field displays in your Detailed Quote window.

ScottradeELITE User Guide
Detailed Quote 231
Removing Fields
To remove one field or multiple fields:
1. On the Detailed Quotes menu, click Configure.
2. In the Configure Detailed Quote window, you can do one of the following:
o In the spreadsheet, click the field you want to remove, and then click Remove.
o Right-click the field you want to remove in the spreadsheet, and then click Remove Item.
The field you removed displays in the list of available fields to the left.
3. Click OK.
The field no longer displays in your Detailed Quote window.

ScottradeELITE User Guide
Detailed Quote 232
Moving Fields to Different Locations
To move a field to a different location, in the Configure Detailed Quote window, in the spreadsheet, drag the field to the location you want.
Undo Your Last Action
To back out of the action you just performed, such as adding or removing a field:
1. In the Configure Detailed Quote window, click Undo.
2. Click OK.
Clearing All
To remove or clear all fields in your spreadsheet, click Clear All, and then click OK.

ScottradeELITE User Guide
Detailed Quote 233
Linker Tool Use the Linker Tool within the Positions window to connect multiple windows so the symbol entered into one window displays in all linked windows simultaneously. For additional information, see Linker Tool.
<Tool Name> Menu The <Tool Name> menu contains options that allow you to execute common tasks. Options include printing, exporting data, refreshing data, accessing help information, detaching or attaching window positions, and closing windows. Note that the options may vary slightly depending upon the tool you are using. For additional information, see <Tool Name> Menu.
Right-click Functionality Several tools in ScottradeELITE offer a shortcut menu with many options. The shortcut menu opens when you right-click anywhere in the window. For more information, see Right-click Functionality.
Symbol Lookup Symbol Lookup, which is included within most tools on the ScottradeELITE platform, provides you with more information about a company via its symbol. For more information, see Symbol Lookup.
Minimize / Restore Minimize and restore buttons are available on the top bar of all ScottradeELITE active windows. For more information, see Minimize / Restore.
Template Manager The Template Manager is found in several tools or windows in ScottradeELITE. Located in the top right corner of the tool or active window, the Template Manager is represented by a
button. For more information, see Template Manager.

ScottradeELITE User Guide
Velocity & Forces 234
Velocity & Forces
What Is Velocity & Forces? Velocity & Forces (NASDAQ Market Velocity® and NASDAQ Market Forces®)13 measures pre-trade order activity in the market trading system to indicate the intensity and direction of trading interest before that activity results in trades and price movement.
Why Use Velocity & Forces? You can use Velocity and Forces to get the insight necessary to make the best decisions for your trading strategies. Velocity & Forces measures levels of pre-trade order activity in the NASDAQ trading system, including NASDAQ-, NYSE-, and AMEX-listed securities, to indicate the intensity of trading interest and relative buy/sell pressure.
What Is Market Velocity? Market Velocity measures the intensity of the trading interest. This allows you to execute your trading strategy more quickly by comparing the expected order activity in a security with the current activity to detect surges in trading interest before the trade occurs. The velocity has a benchmark value of 100% being the securities 21-Day Moving Volume Average. If the velocity indicates a percentage higher than 100%, the security is trading above its 21-Day Moving Volume Average.
What Are Market Forces? Market Forces provides a real-time, pre-trade indication of the direction of the market by indicating whether trading interest is surging in either buy or sell orders. Used with Market Velocity, Market Forces can help you determine which securities are ready for an upturn or downturn to help you make better trading decisions. The Buy/Sell pressure is shown on a scale from 1-10. For example, if the Market Forces displays 0 (zero) for Buy Orders and 10 for Sell Orders, this would indicate for every 10 orders at the market center, 10 are sell and 0 are buy.
Accessing Velocity & Forces To access Velocity & Forces:
1. Do one of the following:
o On the Main Menu, point to Quotes, and then click Velocity & Forces. o On the Quotes menu, click Velocity & Forces.
The Velocity & Forces window appears.
13 NASDAQ Market Velocity® and NASDAQ Market Forces® measure levels of pre-trade order activity in the NASDAQ® trading system. They work together to indicate the intensity of trading interest and relative buy versus sell pressure for NASDAQ-, NYSE- and Amex-listed securities.*
*Data for NYSE- and Amex-listed securities are limited to data derived from quoting and trading on the NASDAQ Market Center. As with any trading tool, NASDAQ Velocity and Forces does not guarantee a profit.

ScottradeELITE User Guide
Velocity & Forces 235
2. In the Symbol box, type the symbol you want to monitor, and then click Go.
Once your symbol is entered, the information pertaining to the market and velocity data for this symbol populates in the window. The window continues to update with real-time pre-trade and trade activity.

ScottradeELITE User Guide
Velocity & Forces 236
Configuring Velocity & Forces To configure Velocity & Forces:
1. On the Velocity and Forces menu, click Configure.
The Configure Velocity & Forces dialog box appears.
o To display the Velocity & Forces window in a horizontal view, in the Orientation section, click Horizontal.
o To display the Velocity & Forces window in a vertical view, in the Orientation section, click Vertical.

ScottradeELITE User Guide
Velocity & Forces 237
o To add an intra-day security chart to the window, in the Show section, select the Stock Chart check box.
o To add a volume chart to the window, in the Show section, select the Stock Volume check box.
2. To save your settings and close the Velocity & Forces dialog box, click OK.
Minimizing / Restoring Velocity & Forces You can adjust the window size by using the minimize or restore buttons within Velocity & Forces. The minimize and restore buttons are available on the top bar in all active windows on the ScottradeELITE platform.
For additional information, see Minimizing / Restoring Windows.
Trading from Velocity & Forces To place a trade from within the Velocity & Forces window:
1. Right-click anywhere in the Velocity & Forces window.
2. From the shortcut menu, click Buy to place a purchase order, or click Sell to place an order to sell a security or an option
Clicking Buy or Sell from the shortcut menu launches the Order Entry window, where you can place your order. The Order Entry window automatically populates with the symbol you added to the Velocity & Forces window.
ScottradeELITE User Guide
Velocity & Forces 238
Using the Linker Tool The Linker Tool allows you to associate windows so that when you enter a symbol in one of the linked windows, the information for the symbol displays in all linked windows simultaneously. For additional information, see Linker Tool.
<Tool> Menu The <Tool> menu offers standard window functionality and provides you with a quick way to access and execute tasks. For additional information, see <Tool Name> Menu.
Right-click Functionality To access a shortcut menu containing standard tasks, right-click anywhere within the Velocity & Forces window. Right-click functionality is available in most tools or windows on the ScottradeELITE platform. For additional information, see Right-click Functionality.
Symbol Entry Box The Symbol Entry box allows you to type a symbol and add the symbol to the Velocity & Forces window. For additional information, see Symbol Entry Box.
Symbol Lookup Symbol Lookup provides you with the company name, symbol, and primary exchange specific to the symbol you are looking up. For additional information, see Symbol Lookup.
Minimize / Restore Minimize and restore buttons are available on the top bar of all ScottradeELITE active windows. For more information, see Minimize / Restore.
Template Manager When you save data in the Velocity & Forces window as a template, use the Template Manager to launch, modify or set as default a specific template. For additional information, see Template Manager.

ScottradeELITE User Guide
Market Depth 239
Market Depth Multiple (premium) subscription services offer advanced quoting within ScottradeELITE.
Source Description
NASDAQ Level II To take advantage of the best bid and ask prices for each NASDAQ Market Participants, you can choose to activate NASDAQ Level II..
NASDAQ TotalView This service provides the full order book for the NASDAQ index and gives you the ability to view every buy and sell order for any security listed on the NASDAQ. The NASDAQ TotalView window allows you to view a full quote, time and sales information, an aggregate depth bar graph and full depth bids and asks for any NASDAQ-listed security.
NYSE OpenBook OpenBook offers the full order book for the NYSE and gives you the ability to view every buy and sell order issued for any security listed on the NYSE. The NYSE OpenBook window allows you to view a full quote, time and sales information, an aggregate depth bar graph and full depth bids and asks for any NYSE-listed security.
Accessing Market Depth You can access Market Depth in the following ways:
• On the Main Menu, point to Quotes, and then click Market Depth. • On the Quotes menu, click Market Depth.
The Market Depth window appears.
Configuring Settings To configure the display settings of the Market Depth window, on the Market Depth menu, located in the top left corner of the window, click Configure.
From the Configure Market Depth dialog box, select any of the following options:
• Source (NASDAQ Level II, NASDAQ TotalView, NYSE OpenBook, TotalView and OpenBook).
• Orientation. The data display choices are Horizontal or Vertical. • Show (Display). When you point your mouse to one of the display items, a thumbnail
example displays to the right of the selected item.

ScottradeELITE User Guide
Market Depth 240
Activating or Deactivating a Subscription to a Premium Service You can manage your subscriptions from the Configure Market Depth dialog box.
To activate or subscribe to a premium service, from the Configure Market Depth dialog box, click the Manage Premium Data Services link.
The Manage Premium Data Services dialog box appears.
The Manage Premium Data Services dialog box with options appears if you are not subscribed to any service. If you are subscribed to Level II and want to upgrade, select Manage Premium Services from the Configure submenu in the ScottradeELITE Main Menu.

ScottradeELITE User Guide
Market Depth 241
The following premium service subscription options are available:
• Level II quotes ($10.00/month), or
• Full package (includes: NASDAQ Level II, NASDAQ TotalView, and NYSE OpenBook) ($15.00/month).
From the Manage Premium Data Services dialog box:
1. Select a service (Level II or Premium Package).
2. In the Enter Scottrade Account Number box, type your 8-digit Scottrade account number.
When you enter your account number, you are consenting to the fee structure defined in the subscription dialog box.
3. Select the I accept these terms check box.
4. Click Activate.
5. Once you have successfully subscribed, you can access the Market Depth window within ScottradeELITE.

ScottradeELITE User Guide
Market Depth 242
To deactivate the Market Depth Premium Data Services:
1. On the Main Menu, point to Configure, point to Manage Subscriptions, and then click Market Depth.
2. In the Manage Premium Services window, click None (deactivate services).
3. To the “Do you also wish to deactivate Level II services as well?” message, click Yes or No.
4. Click Save Changes.
Free Subscriptions vs. Service Charges • Level II is available for an access charge of $10.00; however, it is free to accounts with
ten or more commissioned trades per calendar month. A $10.00 charge is billed to your account at the end of every month, but the $10.00 is rebated back if you completed 10 or more commissioned trades by the end of trading on the last market day of the month.
• TotalView/OpenBook is free by executing at least 15 trades within the month.
Viewing Level II From the ScottradeELITE main toolbar, click Level II.
The Level II window appears. The Level II display is several windows combined into one window:
• Full Quote (Level 1 quote information) – The top of the Level II window displays a Full Quote for the symbol.
If the Market Depth window appears blank, type a valid symbol in the Search box located in the top left corner of the window.
• Source – You can select from the following options under the source drop-down: Level II, NASDAQ TotalView, or NYSE OpenBook. If you are subscribed to the entire Market Depth package, you can view NASDAQ TotalView and NYSE OpenBook separately or you can view the Combined Book, which allows you to see the depth of books for NYSE OpenBook and NASDAQ TotalView.
• Consolidated Bar Graph – The consolidated bar graph displays the aggregate data from the Level II feed. This data is proportionately displayed on the bar graph within the Market Depth window.
• Participants by Price – The participants by price is a graphical representation of how many participants are at a particular price level. The larger the section of the graph, the more participants are at that price level.
• Consolidated Size by Price – Provides the bid and ask levels adjacent to their aggregate size. The ask side of the list is sorted with the best or lowest ask level displaying at the top of the list then ascending order. The bid side of the list is sorted with the best or highest bid level displaying at the top of the list then in descending order.
• Participants – Displays the MMID for Level II quotes, which denotes the participant, their displayed bid / ask, bid / ask size, along with a size graph. The size graph is directly related to the proportion of all bid sizes or all ask sizes for that particular security.
• Time & Sales – An abbreviated Time & Sales window that shows only the symbol's last, size and time data.

ScottradeELITE User Guide
Market Depth 243
• Volume on Price – Shows how much volume has occurred at different price levels throughout the trading session..
<Tool> Menu The <Tool> menu offers standard window functionality and provides you with a quick way to access and execute tasks. For additional information, see <Tool Name> Menu.
Right-click Functionality To access a shortcut menu containing standard tasks, right-click anywhere within the Velocity & Forces window. Right-click functionality is available in most tools or windows on the ScottradeELITE platform. For additional information, see Right-click Functionality.
Minimize / Restore Minimize and restore buttons are available on the top bar of all ScottradeELITE active windows. For more information, see Minimize / Restore.

ScottradeELITE User Guide
Time & Sales 244
Time & Sales
What Is Time & Sales? Time & Sales data contains the official record of trade times and prices in addition to quantities on electronic trades. You can view and configure the time & sales data for securities in ScottradeELITE. In addition, you can place orders within the Time & Sales window.
Accessing Time & Sales You can launch Time & Sales in the following ways:
• On the Main Menu, point to Quotes, and then click Time & Sales. • On the Quotes menu, click Time & Sales.
The Time & Sales window appears.
• In the Symbol box, type the symbol you want to monitor, and then click Go.
Once your symbol is entered, the information pertaining to the time and sales data for this symbol scrolls in the window. As sales occur, the new data appears on the bottom line in the window, moving the other lines up.
Pausing Time & Sales There are two ways to pause the Time and Sales data:
• Click Pause on the Time & Sales toolbar.
• Click the vertical scroll bar.

ScottradeELITE User Guide
Time & Sales 245
When Time & Sales data is paused, the Pause button becomes the Play button.
To resume streaming Time & Sales data, click the Play button.
Viewing Options in Time & Sales The Time & Sales window uses the Option Builder to help you enter an option symbol.
1. To the right of the symbol box, click the Show Option Builder button.
2. The Time & Sales window expands to display the Option Builder tools.
3. In the Underlying <symbol> box, type the symbol of the underlying security, and then press Enter.
4. In the Call/Put list, click Calls or Puts.
5. In the Expiration list, click when the option expires.
6. In the Strike box, click the strike price, and then click Go.
7. The Option Builder closes and populates your Time & Sales window with the option contract you have selected.
Option symbols are read-only. To change a symbol you have created, use the Option Builder and create the new symbol.

ScottradeELITE User Guide
Time & Sales 246
Configuring Time & Sales The Time & Sales window has default font settings that indicate specific order conditions. You can change the default font settings.
Font Color and Default Order Condition Settings
By default, Time & Sales assigns font colors to highlight different order conditions. See the table below for details.
Color Order Condition
Red Trade occurred on the bid
Green Trade occurred on the ask
Blue Trade occurred inside the bid or ask
Brown Trade occurred outside the bid or ask
Teal Special condition for the trade
Pink Special condition for the quote
Black Regular text
The “Bid Size” and “Ask Size” are in hundreds. For example, a bid or ask size of 25 would equal 2500 shares.

ScottradeELITE User Guide
Time & Sales 247
Changing Default Order Condition Settings
Conditional Highlighting
You can assign custom colors to conditions you create in Time & Sales. For example, if a 52-week high traded on the symbol you are tracking in Time & Sales, the data would display in the color you assigned to it in the Configure Time & Sales dialog box.
To change the text or font color of trades when a condition you set is met, do the following:
1. On the Time & Sales menu, click Configure.
2. In the Conditional Highlighting area, in the if list, select a condition.
3. In the highlight list, select the color you want.
4. If you want to add another condition, repeat steps 1 and 2.

ScottradeELITE User Guide
Time & Sales 248
Font Colors
To change the text or font color:
1. On the Time & Sales menu, click Configure.
The Configure Time & Sales window appears.
2. In the Font Colors area:
3. Select the Use Custom Colors check box.
4. Next to each order condition, select the color you want from the Color box list.
5. Click OK.
When you clear the Use Custom Colors check box, ScottradeELITE will change the color based on the chosen theme. For more information, see Themes.

ScottradeELITE User Guide
Time & Sales 249
Displaying Data
Showing Quote Data
To display quote data in your Time & Sales window, in the Configure Time & Sales dialog box, select the Show Quote Data check box.
Adding Columns
To add or display columns in your Time & Sales window, follow the steps below:
1. On the Time & Sales menu, click Configure.
2. In the Available list, click the column heading you want to display.
3. Click Add.
4. The column displays in the Selected list.
5. Click OK.

ScottradeELITE User Guide
Time & Sales 250
Removing Columns
To add or display columns in your Time & Sales window, follow the steps below:
1. On the Time & Sales menu, click Configure.
2. In the Selected list, click the column heading you want to display.
3. Click Remove.
4. The column displays in the Available list.
5. Click OK.
SIAC (Securities Industry Automation Corporation) Quote Condition Descriptions
The Conditions column displays condition codes. See the descriptions of the condition codes in the table below.
Code Description
NORM Normal trade condition. No special instructions.
FORMT Pre- or post-market trade for a security. Trades update only the volume in the quote line; they do not affect Last, High, or Low.
INTERMARKETSWEEP This sale condition indicates that the execution price reflects the order instruction not to send the order to another market that may have had a superior price.
OUTOFSYNC Out of Sequence. The trade is printed (reported) out of sequence and at a time different from the actual transaction time.
MANUALBIDASKNONFIRM Slow Quote Due to an NYSE Liquidity Replenishment Point (NYSE LRP), AMEX Tolerance Breach (Spread, Momentum, or Gap Trade Tolerance) , or Gap Quote on Both the Bid and Offer Sides.
MANUALBIDASK Slow Quote Due to Set Slow List on Both the Bid and Offer Sides.
MANUALBID Slow Quote Due to a NYSE Liquidity Replenishment Point (NYSE LRP) or Gap Quote on the Bid Side.
MANUALASK Slow Quote Due to a NYSE Liquidity Replenishment Point (NYSE LRP) or Gap Quote on the Offer Side.

ScottradeELITE User Guide
Time & Sales 251
Linker Tool Use the Linker Tool within the Positions window to connect multiple windows so the symbol entered into one window displays in all linked windows simultaneously. For additional information, see Linker Tool.
<Tool Name> Menu The <Tool Name> menu contains options that allow you to execute common tasks. Options include printing, exporting data, refreshing data, accessing help information, detaching or attaching window positions, and closing windows. Note that the options may vary slightly depending upon the tool you are using. For additional information, see <Tool Name> Menu.
Right-click Functionality Several tools in ScottradeELITE offer a shortcut menu with various options. The shortcut menu opens when you right-click anywhere in the window. For more information, see Right-click Functionality.
Symbol Lookup Symbol Lookup, which is included within most tools in ScottradeELITE, provides you with more information about a company via its symbol. For more information, see Symbol Lookup.
Minimize / Restore Minimize and restore buttons are available on the top bar of all active ScottradeELITE windows. For more information, see Minimize / Restore.
Template Manager Template Manager is functionality found in several tools or windows on the ScottradeELITE platform. Located in the top right corner of the tool or active window, Template Manager is represented by a button. For more information, see Template Manager.

ScottradeELITE User Guide
Option Chains 252
Option Chains
What Is an Option Chain? Option chains can provide you with real-time streaming quotes on option contracts for an underlying symbol.
Accessing Option Chains You can launch Option Chains in the following ways:
• On the Main Menu, point to Option Tools, and then click Option Chains. • On the Option Tools menu, click Option Chains.
Viewing and Adding Option Chains To add a symbol to the Option Chains window in the Symbol box, type the symbol you want to monitor and then click Go.
A quote for the underlying security displays under the Symbol box.
Below the quote, available option contracts display calls and puts in a table format. The Series column in the middle of the table lists the strike price for each contract. The security in the middle remains fixed when you scroll to the right or left to view the call option and put option data. At-the-money strike prices are indicated by a blue shaded background.

ScottradeELITE User Guide
Option Chains 253
Symbols Not Supported by Option Chains Mutual fund symbols are not supported by Option Chains. You will receive a “No option contracts found” message in the Option Chains window if you do the following:
• In the Symbol box in the Option Chains window, enter a mutual fund symbol.
• Enter a mutual fund symbol in the Symbol box of a window that accepts mutual funds (for
example, Detailed Quote, etc.) and is linked to the Option Chains window.

ScottradeELITE User Guide
Option Chains 254
Configuring Option Chains To set up the data fields in the Option Chains window according to specific trading goals, follow the steps below.
1. Configure Option Chains using one of the following ways:
o On the Option Chains menu, click Configure.
o Right-click anywhere in the Option Chains window, and then click Configure.
The Configure Option Chains dialog box appears.
2. To add a column to your Option chains window, in the Available list, select an item, and then click Add.
3. To apply your changes, click OK.
4. To remove a column from your Option Chains window, in the Selected list, select an item, and then click Remove.
5. To apply your changes, click OK.

ScottradeELITE User Guide
Option Chains 255
Viewing a Basic Quote or Detailed Quote in Option Chains
You can modify the Option Chains window settings to display more or less quote data:
• To display a detailed quote at the top of the Option Chains window, in the Configure Option Chains dialog box, select the Show Detailed Quote Grid check box.
• To display a basic quote at the top of the Option Chains window, in the Configure Option
Chains dialog box, clear the Show Detailed Quote Grid check box.
To edit the order of the fields in the Option Chains window, drag and drop any data field to a new location.
Option Chains Actions See the table below for a list of available options located in the Actions menu.
To… Click…
Add column headings to your table Configure.
Save templates or access the Template Manager
Templates
Print an option chains list Print. Opens the Print dialog box.
Save option chains data to a local drive as a .csv file
Export to .csv
Access online help Help. Opens the Scottrade Knowledge Center.
Detach the window Detach. Allows you to detach the window from its docked position. You can drag the detached window outside of the main ScottradeELITE platform and onto an alternate computer screen.
Close the window Close.
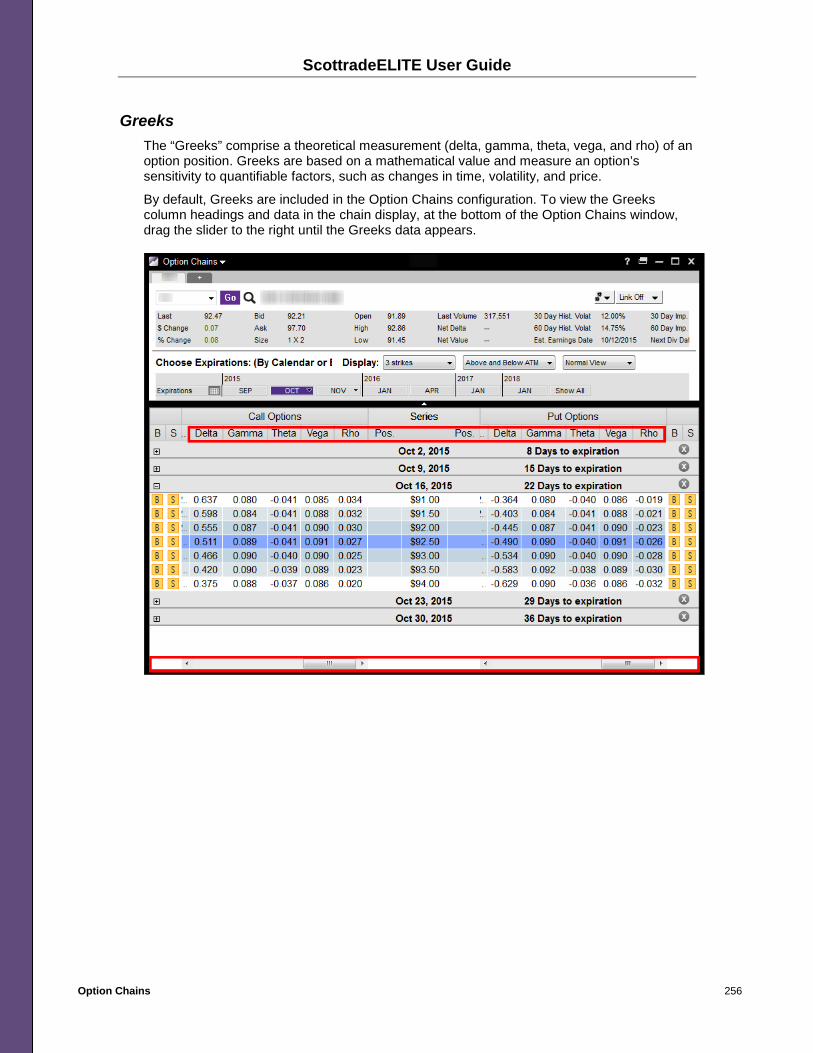
ScottradeELITE User Guide
Option Chains 256
Greeks The “Greeks” comprise a theoretical measurement (delta, gamma, theta, vega, and rho) of an option position. Greeks are based on a mathematical value and measure an option’s sensitivity to quantifiable factors, such as changes in time, volatility, and price.
By default, Greeks are included in the Option Chains configuration. To view the Greeks column headings and data in the chain display, at the bottom of the Option Chains window, drag the slider to the right until the Greeks data appears.

ScottradeELITE User Guide
Option Chains 257
Configuring Chain Display Option Chain displays three strike prices above and below the at-the-money (ATM) strike price by default. ATM is the strike price that is closest to the current price of the underlying security.
To change how data is displayed in the Option Chains window, in the Display lists, click the selection you want.
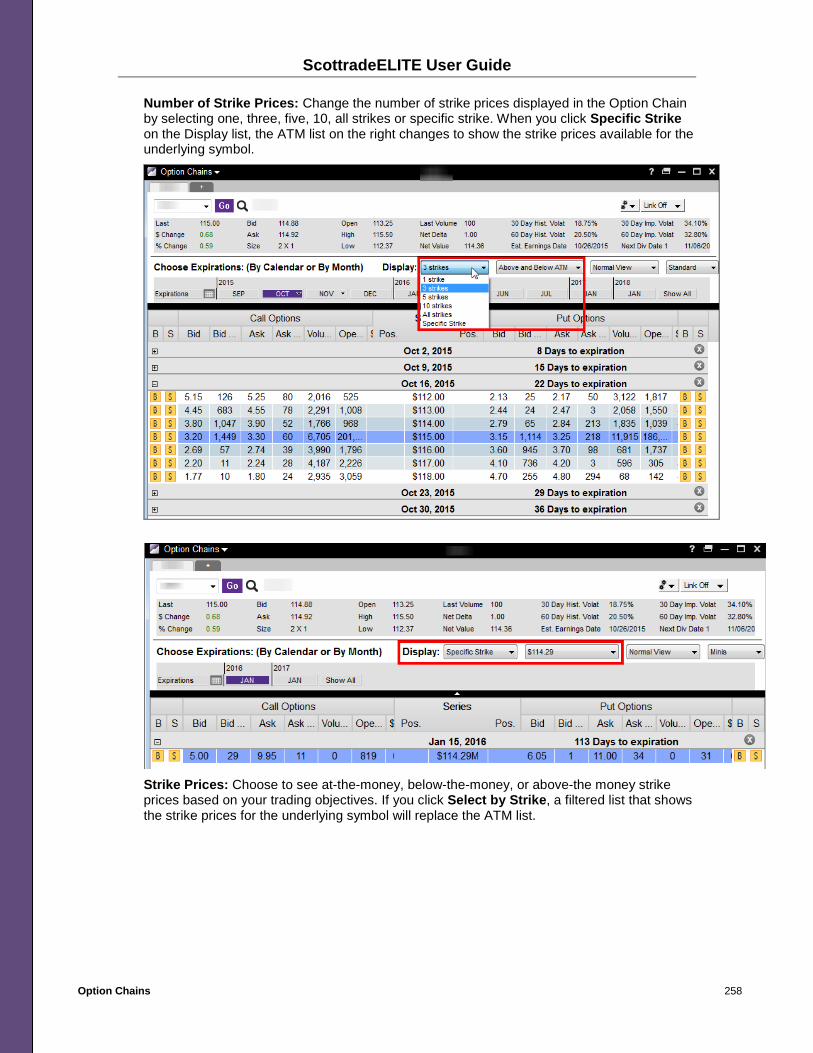
ScottradeELITE User Guide
Option Chains 258
Number of Strike Prices: Change the number of strike prices displayed in the Option Chain by selecting one, three, five, 10, all strikes or specific strike. When you click Specific Strike on the Display list, the ATM list on the right changes to show the strike prices available for the underlying symbol.
Strike Prices: Choose to see at-the-money, below-the-money, or above-the money strike prices based on your trading objectives. If you click Select by Strike, a filtered list that shows the strike prices for the underlying symbol will replace the ATM list.
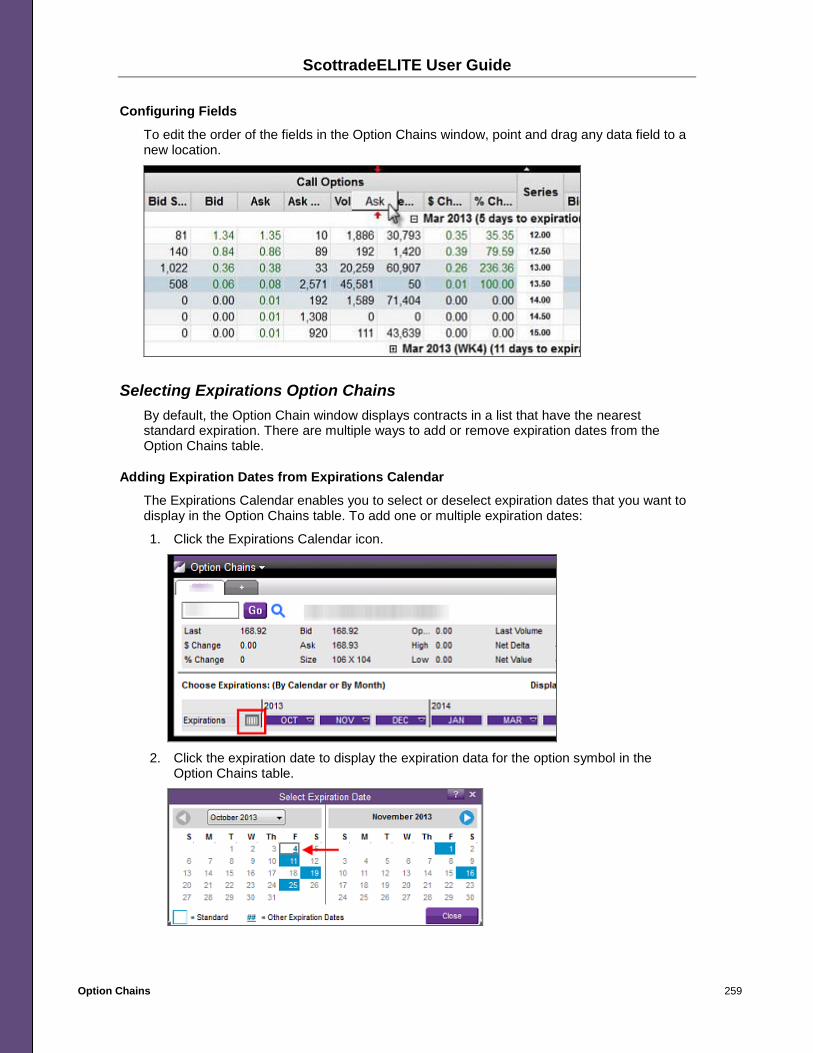
ScottradeELITE User Guide
Option Chains 259
Configuring Fields
To edit the order of the fields in the Option Chains window, point and drag any data field to a new location.
Selecting Expirations Option Chains By default, the Option Chain window displays contracts in a list that have the nearest standard expiration. There are multiple ways to add or remove expiration dates from the Option Chains table.
Adding Expiration Dates from Expirations Calendar
The Expirations Calendar enables you to select or deselect expiration dates that you want to display in the Option Chains table. To add one or multiple expiration dates:
1. Click the Expirations Calendar icon.
2. Click the expiration date to display the expiration data for the option symbol in the
Option Chains table.

ScottradeELITE User Guide
Option Chains 260
The expirations you selected display in the Option Chains table.
Removing Expiration Dates from Expirations Calendar
To remove one or multiple expiration dates:
1. Click the Expirations Calendar icon.
2. Click the selected expiration date to remove the expiration data for the option symbol in
the Option Chains table.
The expirations no longer display in the Option Chains table.
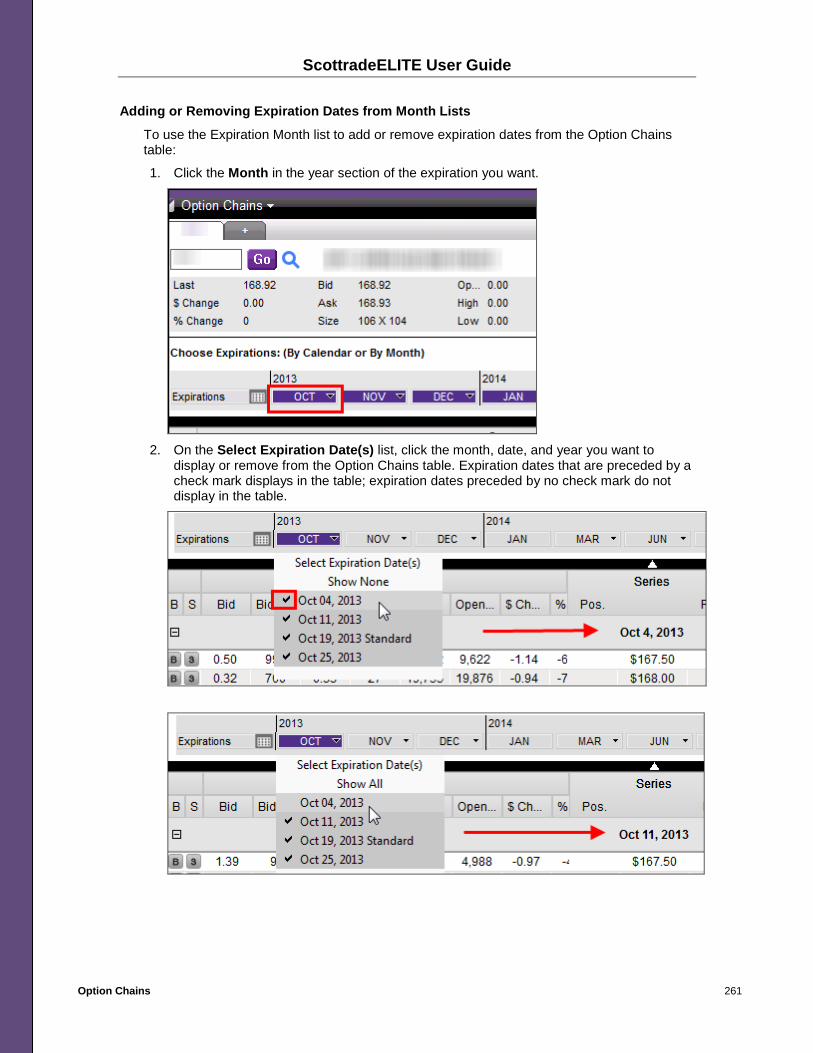
ScottradeELITE User Guide
Option Chains 261
Adding or Removing Expiration Dates from Month Lists
To use the Expiration Month list to add or remove expiration dates from the Option Chains table:
1. Click the Month in the year section of the expiration you want.
2. On the Select Expiration Date(s) list, click the month, date, and year you want to
display or remove from the Option Chains table. Expiration dates that are preceded by a check mark displays in the table; expiration dates preceded by no check mark do not display in the table.

ScottradeELITE User Guide
Option Chains 262
Adding or Removing Expiration Dates (Show All versus Show None)
To select all expiration dates for a specific month and year or to show no expiration dates for a defined month and year in the Option Chains table, follow the steps below.
1. Click the Month in the year section of the expiration you want.
2. In the Select Expiration Date(s) list, click Show None.
3. The system removes any expiration dates from the Option Chains table and the table
area displays the message below.
4. To show all the previous option expiration dates, repeat Step #1. On the Select
Expiration Date(s) list, click Show All.
All expiration dates for the month and year selected display in the Option Chains table.

ScottradeELITE User Guide
Option Chains 263
Removing Expiration Dates (Delete Button)
You can use the Delete button to remove expiration dates for a specific month and year.
From the Option Chains table, click the Delete button to the right of the month and year that you want to remove:
The expiration data for the month and year you selected no longer displays in the table.

ScottradeELITE User Guide
Option Chains 264
Placing a Trade from Option Chains Using the Buy and Sell buttons, you can place a trade on an individual option contract.
When you click the Buy or Sell buttons, an Order Entry window launches with the option contract data pre-populated in the fields.
<Tool> Menu The <Tool> menu offers standard window functionality and provides you with a quick way to access and execute tasks. For additional information, see <Tool Name> Menu.
Right-click Functionality Right-click functionality is available in most tools or windows on the ScottradeELITE platform. To see a shortcut menu that allows you to quickly perform the tasks below, right-click anywhere within the Option Chains window. For additional information, see Right-click Functionality.
Minimize / Restore Minimize and restore buttons are available on the top bar of all ScottradeELITE active windows. For more information, see Minimize / Restore.

ScottradeELITE User Guide
Profit Loss 265
Profit Loss
What Is Profit Loss? Profit Loss is a calculator that accounts for options pricing models and returns the option’s potential gain or loss based on market movement and days until the options expires. Using a calculation, Profit Loss is an educational tool that can help you understand the potential hypothetical reward or risk on the position.
Why Use Profit Loss? Here are four reasons:
• Get a visual representation of your computed strategy’s profit / loss before or during a trade.
• View potential changes to your profitability or goals based on adjustments to market forces (volatility, days until expiration, and underlying price).
• Understand different trading strategies by exploring multiple option contracts. • Add up to four options legs to analyze spreads
Volatility Types See What is Volatility?
Understanding Profit Loss Profit Loss is vital in establishing a theoretical options position whether you are buying calls and puts or placing more advanced spread based options trades. If you buy equity positions outright, you can calculate profits and losses based on price only. Conversely, since options prices are impacted by market factors (volatility and time) and those factors both impact the options price, there is no basic way to calculate potential reward and risk on the position.
Options prices are based on the Black-Scholes method, which uses for the current security price, the intrinsic value, time to expiration, volatility, and interest rates to establish a premium price. Because these values constantly change, the values of an option price constantly change. The ever-changing state, can present a challenge to someone trying to forecast potential reward-risk on his or her trades.
After you choose the option contract or option spread and the Profit Loss tool populates, a graph displays. The Profit Loss tool uses the current real-time option price to calculate the risk graph, but you may choose to enter your own price to either simulate a specific price or to model an existing trade. The X axis on the Profit Loss graph represents the underlying security price while the Y axis represents the Profit or Loss on the position. When you move your cursor over the graph, the crosshairs display and move both X axis and Y axis to pinpoint specific prices along the risk curve. To forecast a profit or loss, drag the crosshairs along the X axis until you reach the desired underlying security price, then move the mouse up or down to find either the black or blue line to establish what the profit or loss would be at that price. In addition, when you click the graph, you will see a snapshot of the option Greeks at that price next to the Scenario at the bottom of the window. On the right of the risk graph is a summary showing key points for the hypothetical trade such as breakeven, maximum profits and loss, and a payoff table for specific security prices.

ScottradeELITE User Guide
Profit Loss 266
The Profit Loss tool lets you model either specific, manually-entered options positions or pre-selected options spreads chosen from the tool directly. After you choose the options contract, you will see a graph that forecasts a projected profit and loss based on the current underlying market price. By default, the Profit Loss graph displays two pricing forecasts. The first forecast is represented by a black line and shows the price of the option at expiration. The second forecast is depicted by a blue line, which represents the real time option price based on the current days to expiration. Note the differences between these two forecasts and how they can be interpreted. For example, if you are looking at a December Expiration and it is currently October, the black line represents the value of your option at expiration in December, not the value if the underlying market were to suddenly increase or decrease in price. For a current forecast, you would look to the blue line, which is based on the current days to expiration.
At the bottom of the Profit Loss window, You can adjust the days to expiration to help forecast price on certain days. For example, if your analysis shows a $10.00 move in an equity in two weeks, you can model this by adjusting the days to expiration forward by ten days. Remember, options lose value every day based on time decay (Theta) and this loss needs to be modeled to accurately to assess the performance of the position. You can also adjust the volatility using either a pre-selected amount based on the implied or historical volatility computed by ScottradeELITE. For example, you can take the anticipated time for your trade (what you expect to be in the trade for 60 days) and use that amount (60 Day IV or HV) to model the trade. Additionally, you can adjust the interest rate. In addition to the to the two default forecasts, you can use the Profit Loss tool to add more market scenarios to your strategy.
Accessing Profit Loss To launch Profit Loss:
1. On the Option Tools menu, click Profit Loss.
2. On the Strategy menu, select a strategy.
If no strategy is selected, by default, ScottradeELITE loads data for a Long Call strategy and shows the nearest to the money call at the closest monthly expiration.

ScottradeELITE User Guide
Profit Loss 267
3. In the Enter Symbol box, type a symbol you want to monitor, and then click Go.
The option loads in the Profit Loss window. A summary of available pertinent option pricing and data and the Profit Loss chart display in the window.

ScottradeELITE User Guide
Profit Loss 268
The following table explains the Profit Loss data:
Name Description
Last The price at which a security was traded during the current trading day.
$ Change The price of a security since the current day’s market open is reflected in the $ Change column
% Change The price of a security since the current day's market open displays in the % Change column.
Bid The price a market maker or broker is willing to pay for a security or commodity.
Ask The price at which a market maker or broker offers to sell a security or commodity.
BxA Size This number of shares a buyer/seller is buying or selling at a specified bid price. When a buyer or seller is willing to buy or sell a certain amount of shares, the price does not matter; only the number of shares matters.
Open The first price at which a security was traded at the beginning of the trading day.
High The highest price at which a security was traded during the current trading day.
Low The lowest price at which a security was traded during the current trading day.
Vol Volume is the number of shares traded in a company's security or in an entire market over a specified period, typically a day. Typically, some external event causes unusual market activity, such as higher or lower than average volume.
Net Delta This column shows the sum of the deltas of all equity and option positions for the underlying security held in the client’s account.
Net Value This column shows the total value of the client’s current security and option positions for this underlying symbol.

ScottradeELITE User Guide
Profit Loss 269
Field Name Description
30 Day Hist Volat This is based on the volatility over the past 30 days. This analysis originates from the idea that securities bottom from "panic" selling, after which a rebound is imminent. One way of measuring this phenomenon is to observe a widening range between high and low prices each day. A progressively wider range, observed over a short period of time, can indicate that a bottom is near. Price tops are generally reached at a more leisurely pace and can be characterized by a narrowing of the price range. This measure of the trading range takes place over a specified period in order to determine whether or not an issue is being "dumped" and is approaching a bottom. A prerequisite to a valid bottom is an increase in the volatility line above the reference line. In a similar manner, an indication of an imminent top would be a decrease in the volatility line below the reference line. As long as volatility is rising, it is likely that a security will not approach a top. Note: This study should be used with trend following analyses and momentum oscillators to confirm accuracy.
60 Day Hist Volat This is based on the volatility over the past 60 days. This analysis originates from the idea that securities bottom from "panic" selling, after which a rebound is imminent. One way of measuring this phenomenon is to observe a widening range between high and low prices each day. A progressively wider range, observed over a short period of time, can indicate that a bottom is near. Price tops are generally reached at a more leisurely pace and can be characterized by a narrowing of the price range. This measure of the trading range takes place over a specified period in order to determine whether or not an issue is being "dumped" and is approaching a bottom. A prerequisite to a valid bottom is an increase in the volatility line above the reference line. In a similar manner, an indication of an imminent top would be a decrease in the volatility line below the reference line. As long as volatility is rising, it is likely that a security will not approach a top. Note: This study should be used with trend following analyses and momentum oscillators to confirm accuracy.
Est. Earnings Date The date on which a company’s earnings are expected to be available.
30 Day Imp. Volat This is based on the past 30 days of implied volatility.
60 Day Imp. Volat This is based on the past 60 days of implied volatility.
Next Div Date 1 Displays the date of the next dividend.
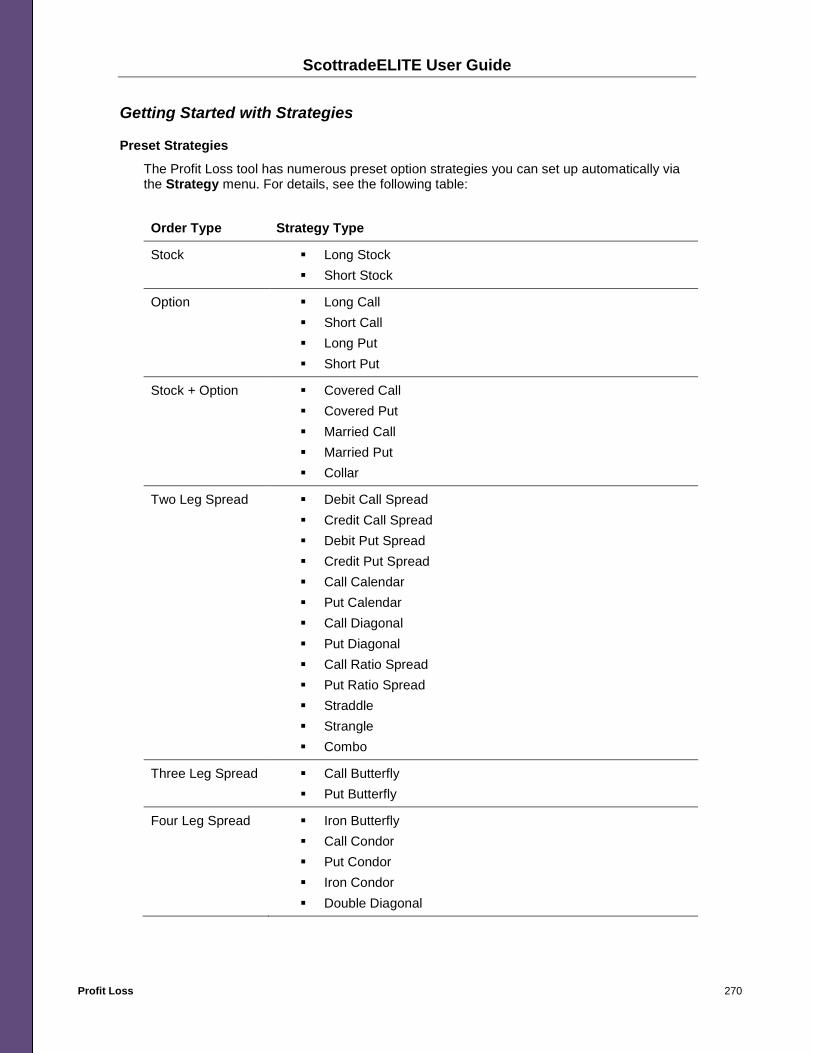
ScottradeELITE User Guide
Profit Loss 270
Getting Started with Strategies
Preset Strategies
The Profit Loss tool has numerous preset option strategies you can set up automatically via the Strategy menu. For details, see the following table:
Order Type Strategy Type
Stock Long Stock Short Stock
Option Long Call Short Call Long Put Short Put
Stock + Option Covered Call Covered Put Married Call Married Put Collar
Two Leg Spread Debit Call Spread Credit Call Spread Debit Put Spread Credit Put Spread Call Calendar Put Calendar Call Diagonal Put Diagonal Call Ratio Spread Put Ratio Spread Straddle Strangle Combo
Three Leg Spread Call Butterfly Put Butterfly
Four Leg Spread Iron Butterfly Call Condor Put Condor Iron Condor Double Diagonal

ScottradeELITE User Guide
Profit Loss 271
To add a preset strategy, from the Strategy menu, click the strategy you want:
Manual Strategies
You can also build an option or stock + option spread by adding legs manually.

ScottradeELITE User Guide
Profit Loss 272
To add an option or a stock leg:
• To add an option leg, click +Add Option Leg. Profit Loss adds another option row to the window.
• To add a stock leg, click +Add Stock Leg. Profit Loss adds a stock position to the Profit Loss Graph. This is required if you are building strategies, such as Covered Calls, where a stock position is part of the option spread.
The Profit Loss Tool has the ability to display a maximum of four legs per chart. This would include one stock position and up to three option legs simultaneously or four options legs. There can only be one stock position per profit loss chart.
Options Legs
One Stock + Three Options Legs
When you add the maximum amount of legs (four), +Add Option Leg and +Add Stock Leg will become disabled.

ScottradeELITE User Guide
Profit Loss 273
To remove an option or stock leg:
1. In the Buy/Sell column, click the X to the left of the leg you want to remove.
For either pre-selected strategies or manually built strategies, you can edit the individual option or stock position you would like to display in the Profit Loss graph.
o If you build the option spread manually, by default, the system sets the option to the nearest to the money call and sets the closest monthly expiration to Buy.
o If you select a preset strategy, the system builds the spread in accordance to preset option spread strategy descriptions. For details see Preset Strategies.
2. In the Buy/Sell list, select Buy or Sell.
3. Select an expiration date in the following ways:
4. In the Expiration list, select the expiration date you want.
5. Click the Expiration Calendar icon. Click an available expiration date (denoted as circled dates).

ScottradeELITE User Guide
Profit Loss 274
6. To choose a different month or year, in the Month/Year List, select the month and year you want.
7. To advance to the next month or to go back to the previous month, click the arrows.
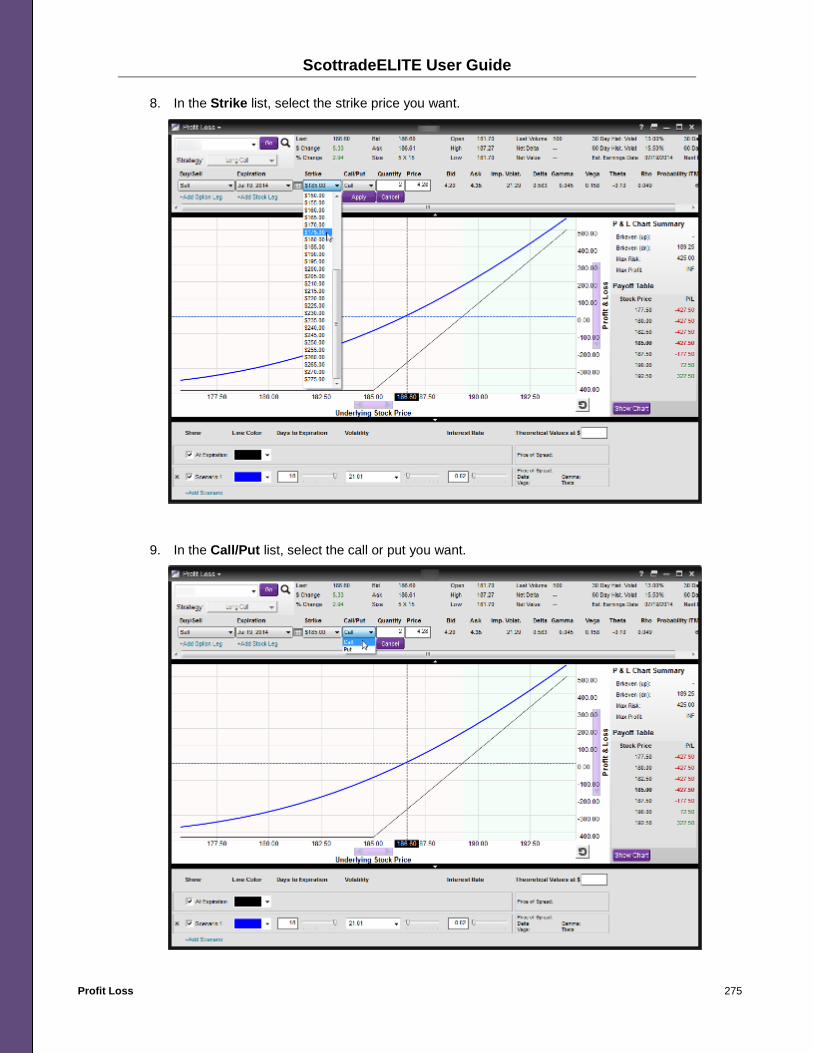
ScottradeELITE User Guide
Profit Loss 275
8. In the Strike list, select the strike price you want.
9. In the Call/Put list, select the call or put you want.

ScottradeELITE User Guide
Profit Loss 276
10. To adjust the quantity of contracts or shares purchased or sold, in the Quantity box, enter the number of contracts or shares in the spread.
11. By default the price displays the current real time price of the option contract or security.
12. To adjust the price to account for a position you are already in or if you would like to model a specific entry price, in the Price box, enter a new price.

ScottradeELITE User Guide
Profit Loss 277
13. When you are finished making changes, do the following:
a. To apply the changes to the Profit Loss Graph, click Apply.
b. To cancel your changes and set the values you entered to the default values, click Cancel.
The Profit Loss graph updates to reflect the changes you made to the individual legs or the option spread.

ScottradeELITE User Guide
Profit Loss 278
Understanding Chart Elements In the middle of the Profit Loss window is the Profit Loss Graph. Located to the right is the Profit Loss Chart Summary and Payoff Table. The graph is displayed in a two axes chart; the horizontal axis represents the underlying security price and the vertical axis represents profit or loss on the chosen strategy.
Profit Loss Graph Elements
By default, the Profit Loss Graph displays two scenarios of Profit and Loss. A vertical dashed line on the graph represents the current price of the underlying security. A black line, which represents Profit or Loss at the date of the options expiration, represents the first scenario. To follow this curve to show future profit and loss levels, move the cursor along the line. As you move the cursor, the crosshairs allow you to line up the underlying price of the security with how much gain or loss you will see on that position.
The second line, or the blue profit and loss line, represents the gain or loss at the present time. Based on the current real time quote, the profit and loss is at 0, which represents entering into the position at the current price. As with any scenario, you can view the profit and loss at different underlying security prices my moving and aligning the cursor (crosshairs) with the different scenario lines.
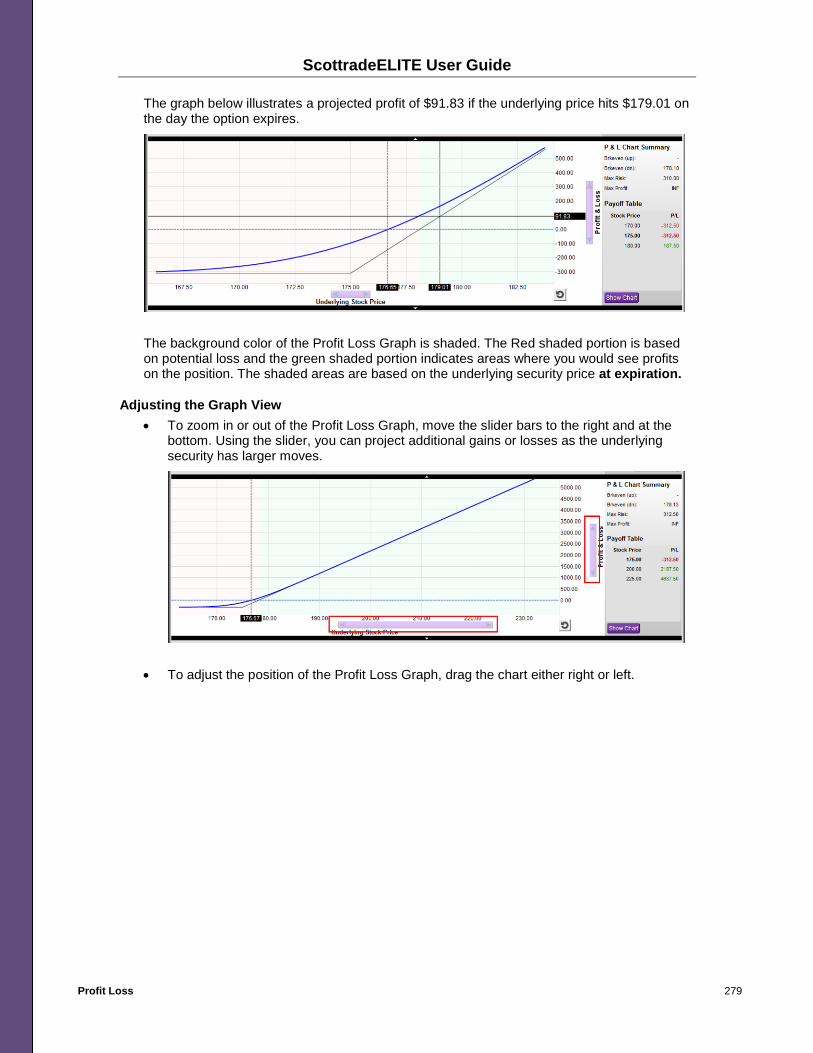
ScottradeELITE User Guide
Profit Loss 279
The graph below illustrates a projected profit of $91.83 if the underlying price hits $179.01 on the day the option expires.
The background color of the Profit Loss Graph is shaded. The Red shaded portion is based on potential loss and the green shaded portion indicates areas where you would see profits on the position. The shaded areas are based on the underlying security price at expiration.
Adjusting the Graph View • To zoom in or out of the Profit Loss Graph, move the slider bars to the right and at the
bottom. Using the slider, you can project additional gains or losses as the underlying security has larger moves.
• To adjust the position of the Profit Loss Graph, drag the chart either right or left.

ScottradeELITE User Guide
Profit Loss 280
P & L Chart Summary Elements
The P & L Chart Summary shows the breakeven (up and down) as well as maximum risk and maximum profit on the selected spread or position. These field or element calculations are based on security prices on the day of expiration (black line).
• Breakeven: (Brkeven up or Brkeven dn) represents the price that the underlying security must be at to incur no loss or gain on the day of expiration, in this example that is a price of $187.90. Since the $187.90 price is located next to “Brkeven (up):”, it implies that the security must move up from the current price. If the price is next to “Brkeven (dn):”, it implies the underlying must decrease in price for the breakeven to occur.

ScottradeELITE User Guide
Profit Loss 281
• Max Risk: This represents the maximum dollar amount you could lose of the option or spread expires with no value. If the maximum is INF, this implies that there is no maximum value and the number is infinite. Max Profit is the most money that could be made with the displayed spread or option; again, INF implies no limit to potential gains.
• Payoff Table: Based on the first and last prices on the Profit Loss Graph, the Payoff Table takes preselected values and displays them automatically to give a snapshot of prices that will return profits and losses. To see exact prices, you can follow the scenarios on the graph itself.

ScottradeELITE User Guide
Profit Loss 282
• Show Chart: To display a copy of the daily chart of the underlying security next to the Profit Loss Graph, click Show Chart. Using the chart, you can identify key areas and compare them to profit and loss on your spread or option position.

ScottradeELITE User Guide
Profit Loss 283
Understanding Scenarios At the bottom of the Profit Loss Window you can add, adjust, or delete different pricing scenarios that reflect changes in Days to Expiration, Volatility, and Interest Rate.
By default, two scenarios are included when you build the Profit Loss Graph. A black line represents the first scenario and is based on the pricing of the option on the day of expiration. The blue line represents option pricing based on the current option implied volatility and how far the option is from expiration on the current day. For option spreads, the Profit Loss Graph estimates the spread volatility by combining the individual current implied volatility of the various options that make up the spread. The Interest Rate defaults to the current 90 Day LIBOR Rate.

ScottradeELITE User Guide
Profit Loss 284
• To temporarily remove a scenario from the Profit Loss Graph, clear the Scenario box.
• To remove a scenario from the Profit Loss Graph completely, click X next to the scenario you want to delete.

ScottradeELITE User Guide
Profit Loss 285
The default black line cannot be removed completely; however, you can clear it from the graph view when you clear the Scenario box.
• To model an additional scenario, at the bottom of the Profit Loss window, click +Add Scenario. A scenario, represented by a red line, appears in the Profit Loss Graph.

ScottradeELITE User Guide
Profit Loss 286
• To change the colors of the Profit Loss Line, in the At Expiration or Scenario Line Color list, click the color you want.
• To change a scenario’s Days to Expiration or Interest Rate, move the slider bars to the
location you want or enter a number in the text box.

ScottradeELITE User Guide
Profit Loss 287
• To change volatility move the slider bar to the location you want or, in the Volatility list, click the volatility value you want.
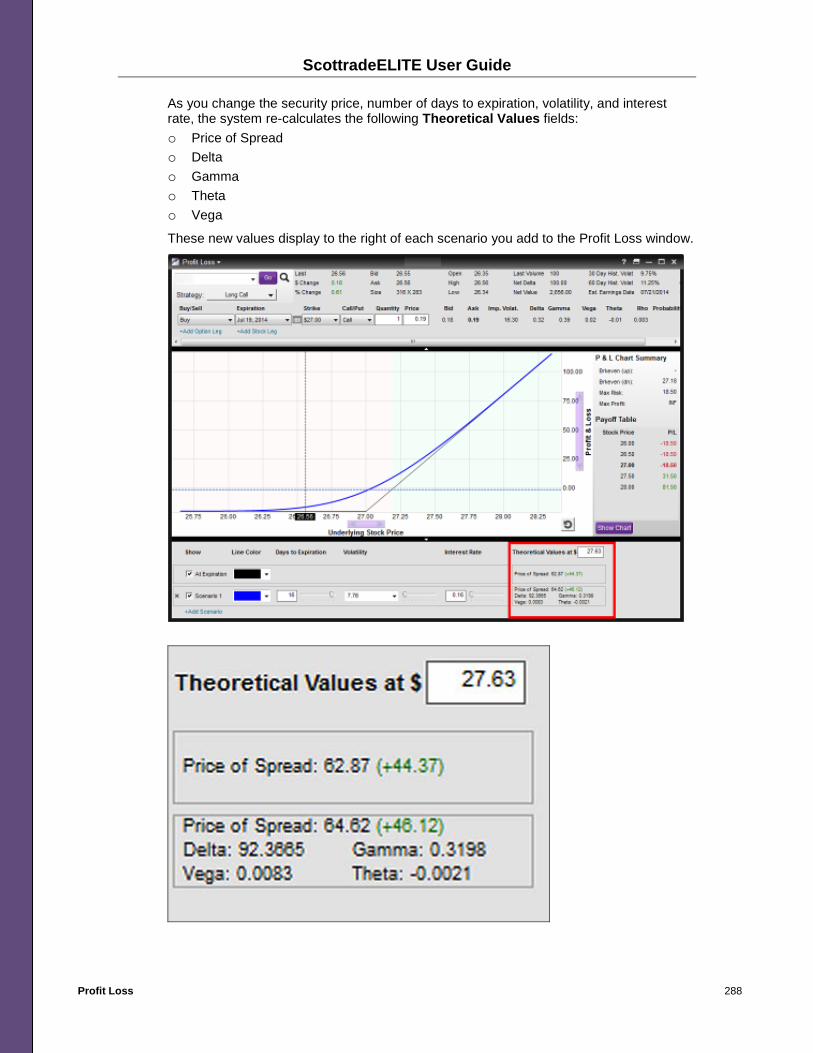
ScottradeELITE User Guide
Profit Loss 288
As you change the security price, number of days to expiration, volatility, and interest rate, the system re-calculates the following Theoretical Values fields: o Price of Spread o Delta o Gamma o Theta o Vega These new values display to the right of each scenario you add to the Profit Loss window.

ScottradeELITE User Guide
Profit Loss 289
• To change the theoretical value, in the Theoretical Values at $ box, enter the dollar amount you want, or click the Profit Loss Graph.
• When you enter a new theoretical value, the Price of Spread will adjust to the projected value of the option or spread at that new price.
<Tool Name> Menu The <Tool Name> menu contains options that allow you to execute common tasks. Options include printing, exporting data, refreshing or reloading trading data, accessing help information, detaching or attaching window positions, and closing windows. The options may vary slightly depending upon the tool you are using. For additional information, see <Tool Name> Menu.
Symbol Lookup Symbol Lookup, which is included within most tools in ScottradeELITE, provides you with more information about a company via its symbol. For more information, see Symbol Lookup.
Minimize / Restore Minimize and restore buttons are available on the top bar of all active windows on the ScottradeELITE platform. For more information, see Minimize / Restore.

ScottradeELITE User Guide
Skew Tool 290
Skew Tool The Skew Tool provides you with a visual display of an option price’s implied volatility (IV) so you can compare the values across the range of strike prices in a specific expiration period.
What Is Volatility? Volatility is one of many components that can influence the price of an option. A slight change in volatility can have a great impact on the option price.
There are two key volatility types:
• Historical volatility measures a security's actual price movement in the past within a defined time period.
• Implied volatility is an estimate of the direction a security's price may take going forward and it is a calculation of the fair value equal to the existing option price. You can consider it a "consensus" data type because it measures how expensive an option is considered in the marketplace prior to expiration. For example, as expectations of volatility increase, implied volatility goes up and option prices increase. An option trader can use this information to find opportunities to sell an overpriced or buy an underpriced option.
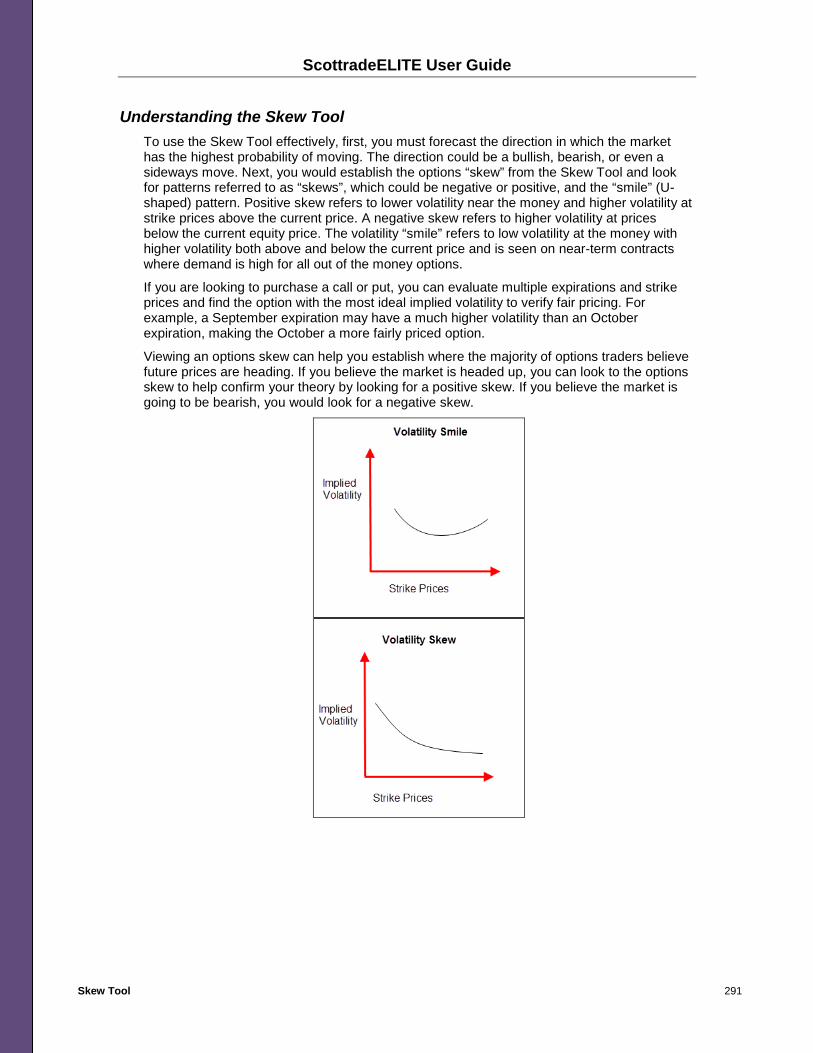
ScottradeELITE User Guide
Skew Tool 291
Understanding the Skew Tool To use the Skew Tool effectively, first, you must forecast the direction in which the market has the highest probability of moving. The direction could be a bullish, bearish, or even a sideways move. Next, you would establish the options “skew” from the Skew Tool and look for patterns referred to as “skews”, which could be negative or positive, and the “smile” (U-shaped) pattern. Positive skew refers to lower volatility near the money and higher volatility at strike prices above the current price. A negative skew refers to higher volatility at prices below the current equity price. The volatility “smile” refers to low volatility at the money with higher volatility both above and below the current price and is seen on near-term contracts where demand is high for all out of the money options.
If you are looking to purchase a call or put, you can evaluate multiple expirations and strike prices and find the option with the most ideal implied volatility to verify fair pricing. For example, a September expiration may have a much higher volatility than an October expiration, making the October a more fairly priced option.
Viewing an options skew can help you establish where the majority of options traders believe future prices are heading. If you believe the market is headed up, you can look to the options skew to help confirm your theory by looking for a positive skew. If you believe the market is going to be bearish, you would look for a negative skew.

ScottradeELITE User Guide
Skew Tool 292
Accessing Skew Tool The Skew tool allows you to view different options skews and modify the data depending on the strategy you wish to take. To launch Skew Tool:
1. On the Options menu, click Skew Tool.
2. In the Enter Symbol box, type a symbol you want to monitor, and then click Go.
By default the chart loads with the following settings:
o View: Calls o Strikes: Near-the-money o Chart Type: Show 3D (three-dimensional) Chart
3. To change the view to display calls, puts, or both, in the View list, click the view you want.
4. To change the strike type, in the Strikes list, click the strike type you want.
a. Near the Money shows three contracts above-the-money and below-the-money. b. Show More extends the skew chart to six strike prices above and below the money. c. Show All displays all available strike prices for the selected expiration period.

ScottradeELITE User Guide
Skew Tool 293
5. To set the expirations, in the Expirations area, select expiration box you want.
6. To change the line color in the chart, in the Line Color list, select the color you want.
7. To change the chart type, click Show 2D. This toggle button displays 2D or 3D Charts.

ScottradeELITE User Guide
Skew Tool 294
Using 2D Charts The 2D chart renders the skew as a line connecting the contracts based on expiration and defines current implied volatility value.
Using 3D Charts The 3D chart adds Days to Expiration to help you forecast where in the future options prices may gain or lose volatility. Similar to the 2D charts, you have the ability to select how many strike prices to view. The Expirations selections are not available in this chart.
To place a trade from Skew Tool, click .

ScottradeELITE User Guide
Skew Tool 295
<Tool Name> Menu The <Tool Name> menu contains options that allow you to execute common tasks. Options include printing, exporting data, refreshing or reloading trading data, accessing help information, detaching or attaching window positions, and closing windows. The options may vary slightly depending upon the tool you are using. For additional information, see <Tool Name> Menu.
Symbol Lookup Symbol Lookup, which is included within most tools in ScottradeELITE, provides you with more information about a company via its symbol. For more information, see Symbol Lookup.
Minimize / Restore Minimize and restore buttons are available on the top bar of all active windows on the ScottradeELITE platform. For more information, see Minimize / Restore.

ScottradeELITE User Guide
Company Profile 296
Company Profile The Company Profile provides a brief overview of basic information about the company, such as the company’s sector, industry, key fundamentals, financial statistics and ratios, peer comparison data and more. The Company Profile supplies facts about the company that can aid you in your research and can help you identify what direction to take with your investment decisions.
Accessing Company Profile To access Company Profile, click Company Profile under the Research menu.
The Company Profile window appears.
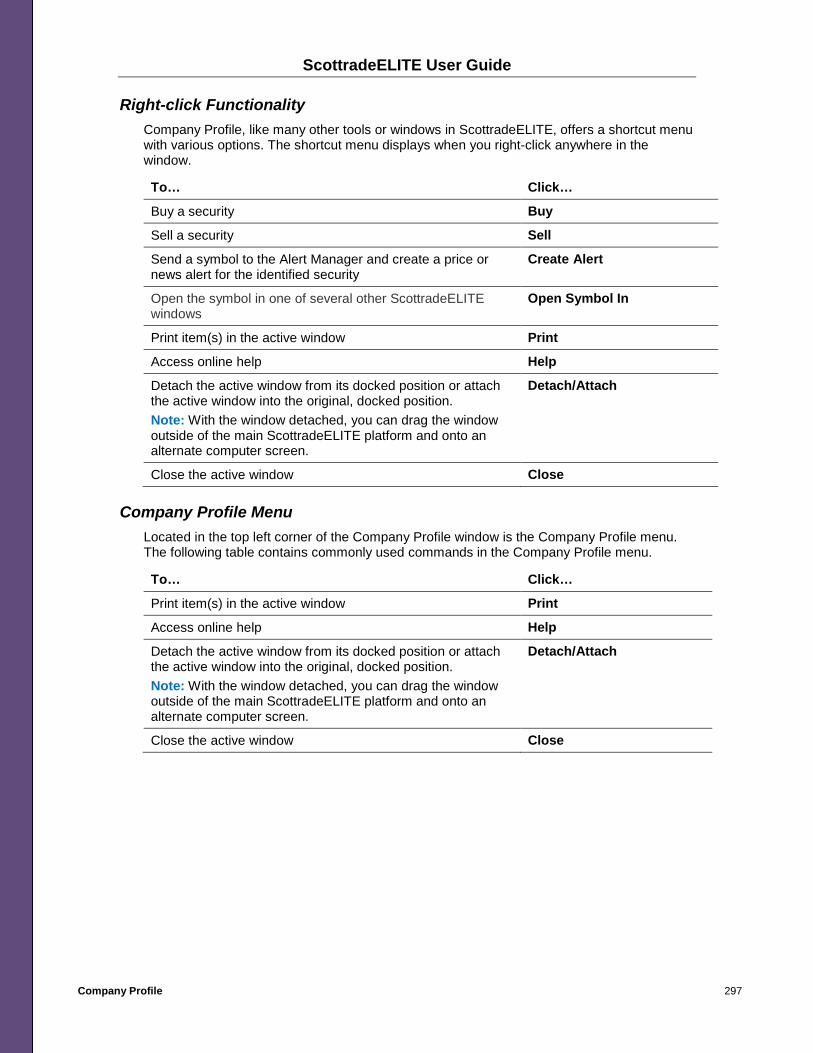
ScottradeELITE User Guide
Company Profile 297
Right-click Functionality Company Profile, like many other tools or windows in ScottradeELITE, offers a shortcut menu with various options. The shortcut menu displays when you right-click anywhere in the window.
To… Click…
Buy a security Buy
Sell a security Sell
Send a symbol to the Alert Manager and create a price or news alert for the identified security
Create Alert
Open the symbol in one of several other ScottradeELITE windows
Open Symbol In
Print item(s) in the active window Print
Access online help Help
Detach the active window from its docked position or attach the active window into the original, docked position. Note: With the window detached, you can drag the window outside of the main ScottradeELITE platform and onto an alternate computer screen.
Detach/Attach
Close the active window Close
Company Profile Menu Located in the top left corner of the Company Profile window is the Company Profile menu. The following table contains commonly used commands in the Company Profile menu.
To… Click…
Print item(s) in the active window Print
Access online help Help
Detach the active window from its docked position or attach the active window into the original, docked position. Note: With the window detached, you can drag the window outside of the main ScottradeELITE platform and onto an alternate computer screen.
Detach/Attach
Close the active window Close

ScottradeELITE User Guide
Company Profile 298
Company Statistics
Located in the Company Profile window, the Company Statistics section provides quote data, company data and financial valuation ratios. Company Statistics field names and descriptions are in the following table. Each field defines how the stock is trading and performing at the share level.
Field Name Description
Bid The price a market maker or broker is willing to pay for a security or commodity.
Ask The price at which a market maker or broker offers to sell a security or commodity.
Volume Volume is the number of shares traded today.
52 Wk High/Low The highest price at which a security traded during the previous 52 weeks is called the security's 52-week high. The lowest price at which a security traded during the previous 52 weeks is called the security's 52-week low.
Average Volume 100 Day
The average amount of shares traded daily in a 100-day period.
Dividend Yield The financial ratio that calculates the total payments issued by a company in dividends each year relative to the company's share price. Dividend yield is calculated by dividing annual dividends per share by the price per share. In the absence of capital gains, dividend yield equals the stock's return on investment.
Market Cap Market capitalization is the total dollar market value of all of a company's outstanding shares. The calculation for market cap. is a company's shares outstanding multiplied by the current market price of one share.
Beta A volatility measurement of a fund or stock vs. the S&P 500 is known as the security's beta. A fund or stock with a higher beta than the S&P 500 will rise or fall greater. Conversely, a stock or fund with a low beta will rise or fall less.
Moving Avg 200 Day The average price of a security over a 200-day time span.
Shares Outstanding The total number of shares held by the public plus any restricted shares held by officers and insiders at a company.
Last 12 Month EPS A security's estimated earnings per share for the current year.
Trailing PE Ratio The sum of a company's price-to-earnings, calculated by dividing the current stock price by the trailing earnings per share for the past 12 months.
Profit Margin A ratio of profitability calculated as net income divided by revenues, or net profits divided by sales. It measures how much out of every dollar of sales a company keeps in earnings.
Total Assets This figure is recorded in millions of dollars and represents the fund's total asset base, net of fees and expenses.

ScottradeELITE User Guide
Alerts 299
Alerts Security alerts are messages sent to your online trading account when the market criteria you set for a security is met.
Accessing Alerts You can launch Alerts in the following ways:
• On the Main Menu, point to Quotes, and then click Alerts.
• On the Quotes menu, click Alerts.

ScottradeELITE User Guide
Alerts 300
The table below defines the Alert History window column headings:
Column Name Description
Defined Alerts The name(s) of the alert(s) that have been set.
Rules The number of rules that have been set for a specific alert.
Status Shows if the alert has been triggered and how many times.
Status Waiting Indicates the alert has not been triggered.
Status # (Number) Displays the number of times the alert has been triggered.
First Time Triggered Displays the timestamp of the first time the alert was triggered
Last Time Triggered Displays the most recent time the alert was triggered.
News Alerts When a news alert is triggered, click the link in the alert message to open the News windows.
To view the detailed news story, click the headline in the News window. The complete story displays below the News Headlines.
Closing Alerts To close an alert window, in the top right corner of the Alert History window, click X.
Creating Alerts To create an alert in ScottradeELITE, in the top left corner of the Alerts History window, click Alerts Manager.

ScottradeELITE User Guide
Alerts 301
The Alerts Manager dialog box displays additional options and settings.
To create a new alert:
1. From the top left corner of the Alerts Manager dialog box, click Add New Alert.
2. In the blank field that has focus, type the name of the alert.
3. Click Add New Rule.

ScottradeELITE User Guide
Alerts 302
4. In the Rule parameters box, type your symbol.
5. To create rule for an option, click the Options Builder button.

ScottradeELITE User Guide
Alerts 303
6. To get a symbol via company information, click the Symbol Lookup button.
7. In the Alert Type list, select an option to categorize the alert.
8. In the Condition list, select the condition that will trigger the alert.
9. In the Value box, type a value that will trigger the alert.

ScottradeELITE User Guide
Alerts 304
10. To save the criteria you defined, click Set.
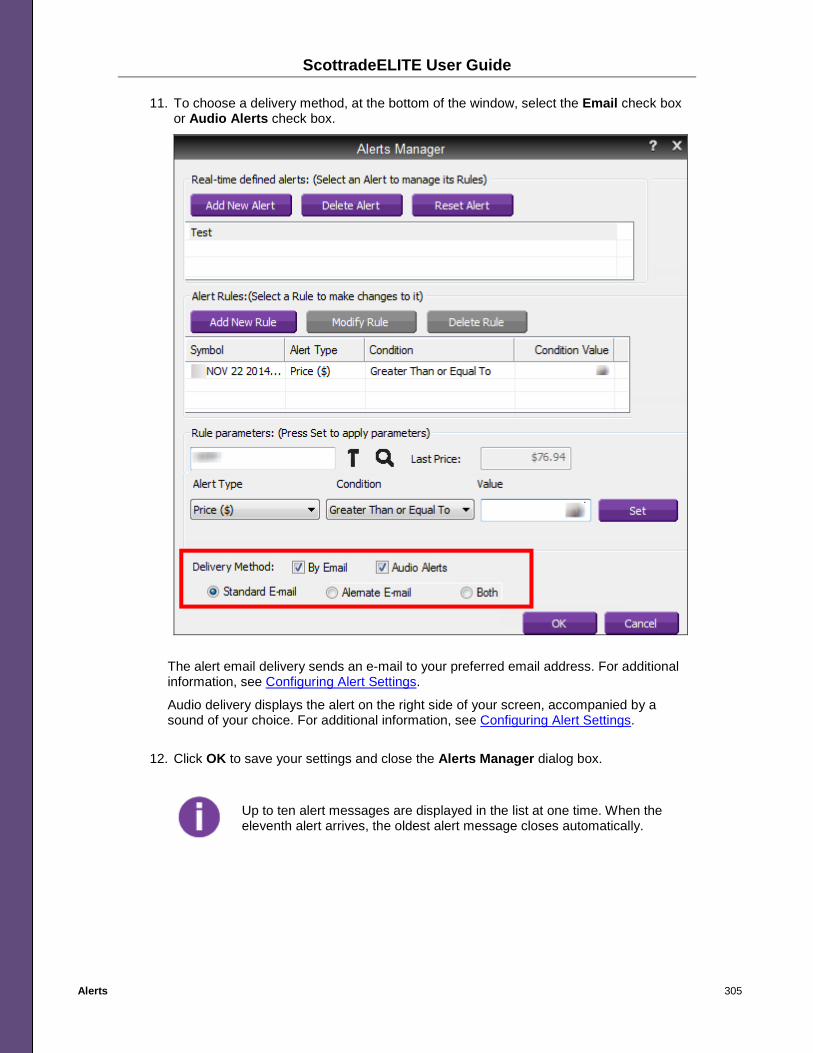
ScottradeELITE User Guide
Alerts 305
11. To choose a delivery method, at the bottom of the window, select the Email check box or Audio Alerts check box.
The alert email delivery sends an e-mail to your preferred email address. For additional information, see Configuring Alert Settings.
Audio delivery displays the alert on the right side of your screen, accompanied by a sound of your choice. For additional information, see Configuring Alert Settings.
12. Click OK to save your settings and close the Alerts Manager dialog box.
Up to ten alert messages are displayed in the list at one time. When the eleventh alert arrives, the oldest alert message closes automatically.

ScottradeELITE User Guide
Alerts 306
Creating an Alert with Multiple Rules 1. To create an alert with multiple rules, click Alerts Manager in the top left corner of the
Alerts window.
2. From the top left corner of the Alerts Manager dialog box, click Add New Alert.
3. In the text box, type the name of the alert.
4. Click Add New Rule.

ScottradeELITE User Guide
Alerts 307
5. In the Rule Parameters box, type your symbol.
a. To create rule for an option, click the Options Builder button.
b. To view information about a company via the symbol, click Symbol Lookup.
6. In the Alert Type list, select an option.
7. In the Condition list, select an option.
8. In the Value box, type a value that will trigger the alert.
9. Click Set to save the criteria you defined. You have set up the first rule.
10. To create another rule, in the Alerts Manager dialog box, click Add New Rule.
11. To set up the additional Alerts Rule parameters, see Creating Alerts, and repeat Steps 4 through 8.
Up to ten alert messages are displayed in the list at one time. When the eleventh alert arrives, the oldest alert message closes automatically.

ScottradeELITE User Guide
Alerts 308
Modifying an Existing Alert To make changes to the rule you created for an alert:
1. From the Alert History window, click Alerts Manager.
The Alerts Manager dialog box appears.

ScottradeELITE User Guide
Alerts 309
2. In the Alerts list, select the alert you want to modify.
3. Click Modify Rule.
4. To modify the Alert Rules parameters, complete Steps 5 through 10 in Creating Alerts.
Up to ten alert messages are displayed in the list at one time. When an eleventh alert arrives, the oldest alert message closes automatically.
Deleting an Alert To delete an alert:
1. From the Alert History window, click Alerts Manager.

ScottradeELITE User Guide
Alerts 310
The Alerts Manager dialog box appears:
2. In the Alerts list, click the alert you want to delete, and then click Delete Alert.

ScottradeELITE User Guide
Alerts 311
3. In the ScottradeELITE “Are you sure you want to delete alert New Alert 1?” message, click Yes.
4. To close the Alerts Manager dialog box, click OK.
Deleting an existing Alert Rule To delete an existing Alert Rule:
1. From the Alert History window, click Alerts Manager.
The Alerts Manager dialog box appears:

ScottradeELITE User Guide
Alerts 312
2. In the Alerts list, select the alert you want to modify.
3. In the Alert Rules list, select the rule you want to delete.
4. Click Delete Rule.
5. To save your changes and close the Alerts Manager dialog box, click OK.
Up to ten alert messages are displayed in the list at one time. When an eleventh alert arrives, the oldest alert message closes automatically.
Resetting an Alert To reset an alert to its original status:
1. From the Alert History window, click Alerts Manager.

ScottradeELITE User Guide
Alerts 313
The Alerts Manager dialog box appears:
2. In the Alerts list, select the alert you want to reset.
3. Click Reset Alert.
When you reset the alert, the alert reverts to its original status (as if you just created the alert). The triggered counts for the alert are also reset.

ScottradeELITE User Guide
Alerts 314
4. To save your changes and close the Alerts Manager dialog box, click OK.
Up to ten alert messages are displayed in the list at one time. When an eleventh alert arrives, the oldest alert message closes automatically.
Viewing Triggered Alerts When an event meets the conditions for the alert parameters you specified, ScottradeELITE triggers the alert and sends you a notification using the delivery method you selected.
When you are logged on and an event triggers an alert, a message with the alert's details appears on the right side of the computer screen.
• Alert Rules (One Rule Specified) - If the alert contains one rule, the rule displays within the pop-up window.
• Alert Rules (Multiple Rules Specified) - If the alert has multiple rules, click the pop-up window to view the full details of the alert.

ScottradeELITE User Guide
Alerts 315
Configuring Alert Settings
To configure your Alert settings, on the Alerts menu, click Configure.
The Configure Alerts dialog box appears:

ScottradeELITE User Guide
Alerts 316
See the table that follows for additional information about the Configure Alerts options.
To… Do this…
Change the sound that plays for new alerts
In the Sounds list, click a sound.
Play a sound when a change triggers an alert for the first time
Click Play Sound first time alert is triggered.
Play a sound until you acknowledge the alert
Click Play Sound continuously until acknowledged.
Modify the number of minutes an alert displays when it is triggered
Select the Automatically dismiss old alert window after check box. In the minutes box, type how many minutes the alert should appear before you dismiss it.
Change the delivery format for alerts In the Standard and/or Alternate Email Address boxes, type an email address. In the Type list, click an option (HTML, Plain Text or None). Note: Changing the email addresses in Alerts does not change the e-mail address within Scottrade.com.
Alter your Scottrade account e-mail address
From the My Account section of the Scottrade client website, click My Information and Preferences (specific to ScottradeELITE alerts only).
Alerts for Linked Accounts ScottradeELITE allows you to view all trade execution alerts for single or multiple (linked) accounts. You will see trade execution alerts for secondary accounts even if you are logged on to the primary account when you place a trade from a secondary account.

ScottradeELITE User Guide
Market Movers 317
Market Movers The ScottradeELITE Market Movers window displays securities that have reached a high or low for the current day. Information framed inside a yellow background indicates that the security displayed has reached a new high or low for the past 52-week period. The Market Movers window becomes active at 9:30 a.m. ET of the current trading day. Updates are not available during extended hours trading.
Accessing Market Movers You can access Market Movers in the following ways:
• On the Main Menu, point to Quotes, and then click Market Movers. • On the Quotes menu, at the top of the ScottradeELITE platform, click Market Movers.
The Market Movers window appears.
Pausing Market Movers You can pause the streaming data that displays in the Market Movers window in the following ways:
1. On the Market Movers toolbar, click Pause.
2. Click the vertical scroll bar.
When you pause Market Movers data, the Pause button becomes the Play button.
3. To resume streaming Market Movers data, click Play.
Configuring Market Movers
You can apply filters and display settings to the Market Movers window. Follow the steps below.
To configure the display settings of the Market Movers window, do one of the following:
1. On the Market Movers menu, located in the top left corner of the window, click Configure.
2. Anywhere in the Market Movers window, right-click to see the shortcut menu, and then click Configure.
3. In the Configure Market Movers dialog box that appears, select the filters and settings you want.
4. Click Apply, and then click OK.

ScottradeELITE User Guide
Market Movers 318
To revert to the default settings in the Market Movers window:
1. In the Configure Market Movers dialog box, click Restore Original Settings.
2. Click Apply and then click OK.
Linker Tool Use the Linker Tool to connect multiple windows so the symbol entered into one window displays in all linked windows simultaneously. The Linker Tools is available in several windows in the virtual trading environment. For additional information, see Linker Tool.
<Tool Name> Menu The <Tool Name> menu contains items that allow you to execute common tasks. Menu items include printing, exporting data, refreshing data, accessing help information, detaching or attaching window positions, and closing windows. Note that the options may vary slightly depending upon the tool you are using. For additional information, see <Tool Name> Menu.
Right-click Functionality Several tools in ScottradeELITE offer a shortcut menu with various options. The shortcut menu opens when you right-click anywhere in the window. For more information, see Right-click Functionality.
Symbol Lookup Symbol Lookup, which is included within most tools in ScottradeELITE, provides you with more information about a company via its symbol. For more information, see Symbol Lookup.
Minimize / Restore Minimize and restore buttons are available on the top bar of all active ScottradeELITE windows. For more information, see Minimize / Restore.
Template Manager Template Manager is functionality found in several tools or windows in the virtual trading environment. Located in the top right corner of the tool or active window, Template Manager is represented by a button. For more information, see Template Manager.

ScottradeELITE User Guide
Top Performers 319
Top Performers Top Performers provides you with a way to view or trade top performing securities by exchange or top performing options (calls or puts). You can filter the top performing securities or options by the following categories:
• Most active • Net gainers • Net losers • Percent gainers • Percent losers
Viewing Top Performers You can access and view Top Performers in the following ways:
• On the Main Menu, point to Quotes, and then click Top Performers.
• On the Quotes menu, click Top Performers.

ScottradeELITE User Guide
Top Performers 320
The Top Performers window appears.
To view and filter your list:
1. On the Source menu, click the exchange you want or the option type you want.
2. To filter your security or option list by additional categories, on the Type menu, click the filter type you want (Most Active, Net Gainers, Net Losers, Percent Gainers, or Percent Losers).
3. Click Refresh.

ScottradeELITE User Guide
Top Performers 321
The Top Performers window shows the top 15 securities filtered by the criteria you selected in the Source menu and Type menu.
Viewing Equity Events Information for a Security When you set up the Events column in your Top Performers window, icons will display for the security symbol entered for the following events:
• Projected Earnings – Displays if an event is approaching for an equity. • Historical Earnings – Shows the past events for an equity. • Offerings – Displays the offering type (IPO or SPO), exchange and settlement date. • Dividends – Provides the pay date, event type (dividend) and amount. • Recognia – Items: Shows when a Recognia Technical Event is available. • Splits – Shows the type (split), the date the split occurred and the ratio. • Zacks List Items – Signals that Zacks contains more information about an equity.
Viewing Projected Earnings
If an equity in the Symbol column of your Top Performers window has upcoming earnings information, an earnings icon will display in the Events column for that equity.
To view additional projected earnings information for a specific equity, add the Events column (for instructions, see Configuring Columns) and point to the earnings icon. A tooltip displays the following:
• Date expected • Consensus (low-high) • Number of analysts reporting

ScottradeELITE User Guide
Top Performers 322
Viewing Historical Earnings
If an equity in in the Symbol column of your Top Performers window has historical earnings information, an earnings icon will display in the Events column for that equity.
To view additional historical earnings information for a specific equity, point to the earnings icon. A tooltip displays the following:
• Date • Actual earnings amount • Number of Analysts reporting • % Surprise (difference between consensus and actual amounts)
Viewing Offerings
If an equity in in the Symbol column of your Top Performers window has an offering (IPO or SPO), an offerings icon will display in the Events column for that equity.
To view more offerings details for a specific equity, point to the offerings icon. A tooltip displays the following:
• Exchange • Type (IPO or SPO) • Settlement Date
Viewing Dividends
If an a dividend was paid for an equity in in the Symbol column of your Top Performers window, a dividends icon will appear in the Events column for that equity.
To view additional dividends details for a specific equity, point to the dividends icon. A tooltip displays the following:
• Date [mm/dd/yyyy] (this is the pay date) • Type: Dividend • Amount:
Viewing Recognia Items
If a Technical Event about an equity in the Symbol column of your Watch List window can be found in Recognia AlertWire, a Recognia icon will display in the Events column for that equity.
To view additional Recognia list information details for a specific equity, point to the Recognia icon.
Viewing Splits
If there is a split for an equity in in the Symbol column of your Top Performers window, a splits icon will display in the Events column for that equity.
To view additional splits information for a specific equity, point to the splits icon. A tooltip displays the following:
• Date [mm/dd/yyyy] • Type • Ratio

ScottradeELITE User Guide
Top Performers 323
Viewing Zacks List Items
If more information about an equity in the Symbol column of your Top Performers window can be found in Zacks Predefined Screener, a Zacks icon will display in the Events column for that equity.
To view additional Zacks list information details for a specific equity, point to the Zacks icon.
Configuring Columns Similar to the way you can configure your watch lists, you can add new or remove existing columns in your Top Performers window.
To add one column or multiple columns:
1. On the Top Performers menu, click Configure.
2. In the Configure Top Performers dialog box, in the Available list, locate the item in the item you want:
o Search. In the Search box, type the name of the item. The result displays in the Available list.

ScottradeELITE User Guide
Top Performers 324
o View. In the View section, click Alphabetical to sort the list in alphabetical order or click By Category to sort the list by available categories.
3. In the Available list, select the column you want to include on your watch list, and then
click Add.
To select multiple columns, hold down Shift or Ctrl key while clicking the columns you want.
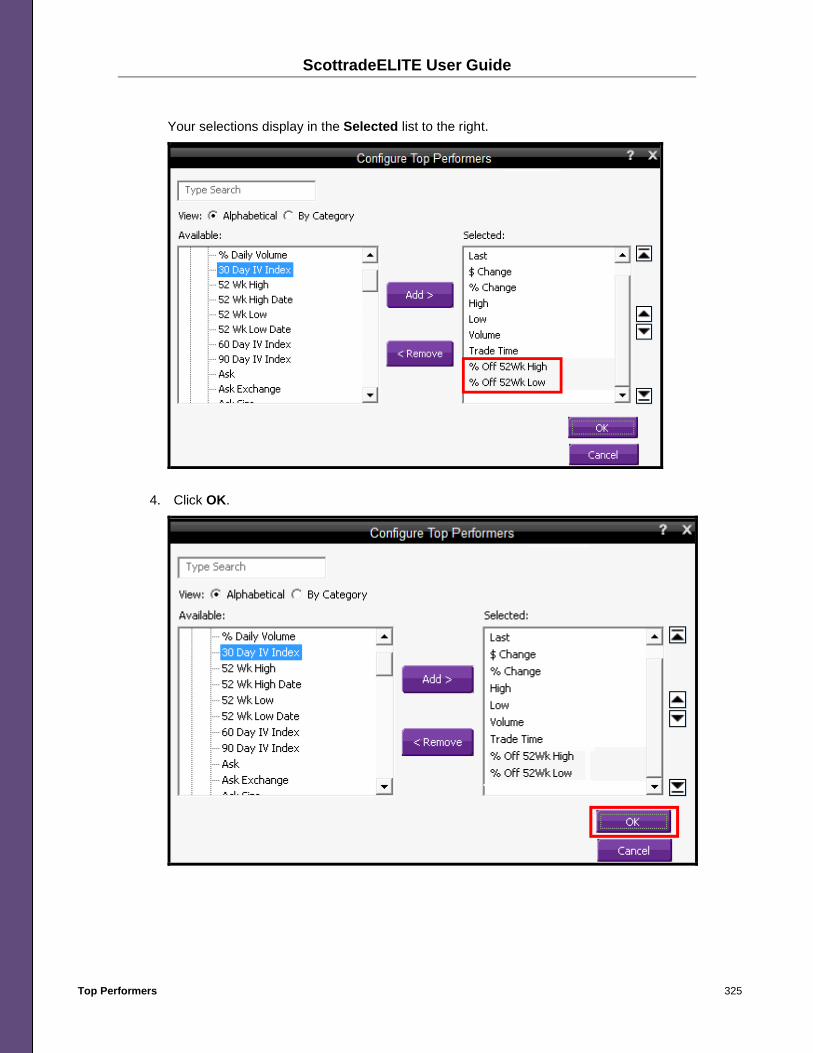
ScottradeELITE User Guide
Top Performers 325
Your selections display in the Selected list to the right.
4. Click OK.

ScottradeELITE User Guide
Top Performers 326
The columns display in your Top Performers window.
To remove one column or multiple columns:
1. On the Top Performers menu, click Configure.
2. In the Configure Top Performers window, in the Selected list, click the column(s) you want to remove from the Order Status window.

ScottradeELITE User Guide
Top Performers 327
3. Click Remove.
4. Click OK.
The column(s) will no longer display in your Top Performers window.

ScottradeELITE User Guide
Top Performers 328
Saving Top Performers to Watch Lists To save the Top Performers data to a watch list:
1. On the Top Performers menu, click Save as Watch List.
The Watch List window appears and contains a Top Performers tab.
2. If the Top Performers tab is not active, click the Top Performers tab to view the data.
3. To save the Top Performers Watch List, on the Watch Lists menu, click Save.
4. To save the Top Performers Watch List as a different name, on the Watch Lists menu, click Save List As.
Top Performers Actions See the table below for a list of available options located in the Top Performers menu.
To… Click…
View or modify settings in your Top Performers window
Configure.
Access the Template Manager, save the window as a template, or load a pre-defined template
Templates.
Print a top performers list Print. Opens the Print dialog box.
Send top performers data to a watch list so you can save it
Save as Watch Lists.
Access online help Help. Opens the Scottrade Knowledge Center.
Detach the window Detach. Allows you to detach the window from its docked position. You can drag the detached window outside of the main ScottradeELITE platform and onto an alternate computer screen.
Close the window Close.

ScottradeELITE User Guide
Top Performers 329
Using Right-click Functionality Several ScottradeELITE tools offer a shortcut menu with options. To see a shortcut menu to quickly perform the tasks below, right-click any symbol in the Top Performers list. For more information, see Right-click Functionality.
Linker Tool Use the Linker Tool to connect multiple windows so the symbol entered into one window displays in all linked windows simultaneously. The Linker Tools is available in several windows in the virtual trading environment. For additional information, see Linker Tool.
<Tool Name> Menu The <Tool Name> menu contains items that allow you to execute common tasks. Menu items include printing, exporting data, refreshing data, accessing help information, detaching or attaching window positions, and closing windows. Note that the options may vary slightly depending upon the tool you are using. For additional information, see <Tool Name> Menu.
Right-click Functionality Several tools in ScottradeELITE offer a shortcut menu with various options. The shortcut menu opens when you right-click anywhere in the window. For more information, see Right-click Functionality.
Symbol Lookup Symbol Lookup, which is included within most tools in ScottradeELITE, provides you with more information about a company via its symbol. For more information, see Symbol Lookup.
Minimize / Restore Minimize and restore buttons are available on the top bar of all active ScottradeELITE windows. For more information, see Minimize / Restore.
Template Manager Template Manager is functionality found in several tools or windows in the virtual trading environment. Located in the top right corner of the tool or active window, Template Manager is represented by a button. For more information, see Template Manager.

ScottradeELITE User Guide
Virtual Trading 330
Virtual Trading Use Virtual Trading to place mock trades with virtual cash in a simulated market environment separate from the authentic ScottradeELITE trading platform. Virtual Trading accounts are available to anyone that has a ScottradeELITE real account. Orders placed in the Virtual Trading environment will not interact with real account information or assets. The Virtual Trading system never submits orders through the real (live) execution system.
Accessing Virtual Trading To log onto the Virtual Trading environment:
1. In the ScottradeELITE Login box, select the Enable Virtual Trading check box.

ScottradeELITE User Guide
Virtual Trading 331
2. If you want ScottradeELITE to retain your login credentials, select the Remember My Account Number check box.
a. In the Account box, type your account number. b. In the Password box, type your password. c. In the Language list, select English, and then click Login.
3. In the ScottradeELITE Disclosure window, click OK.

ScottradeELITE User Guide
Virtual Trading 332
GUI and Navigation Differences When you log on to the Virtual Trading environment, you will see that the title bars of the windows that load in your default layout display a different color than the windows color theme in the actual ScottradeELITE environment. Likewise, when you place a trade, menu items signify that you are in the virtual trading environment. On the Main Menu or Virtual Account menus, you can select Place Virtual Trade, Virtual Balances, Virtual Order Status, or Virtual Positions.

ScottradeELITE User Guide
Virtual Trading 333
Placing a Virtual Trade You can place a virtual trade in the following ways:
• On the Main Menu, point to Virtual Account, and then click Place Virtual Trade.
• On the Virtual Account menu, click Place Virtual Trade.
The Order Entry window appears.
You can perform the following actions in the virtual trading environment:
• Enter virtual orders for stocks or ETFs only.
• Place trades on restricted securities, but restriction rules should not be monitored.
• View an order execution based on Last price.

ScottradeELITE User Guide
Virtual Trading 334
The trading activities or order functionalities listed below are not available in virtual trading environment:
• Placing options orders or advanced orders.
• GTD orders or Trailing Stop on Quote orders.
• Order execution is not based on Bid / Ask price.
• Shares available at each price level are not applicable.
When you place your order, a review window of the order ticket appears to remind you that you placed the order in a virtual trading environment. The virtual trading system will not generate order confirmations and account statements of the virtual account.
Viewing Virtual Balances The Balances window displays virtual account amounts. Balances update automatically throughout the day.
You may view a Virtual Balance in the following ways:
• On the Main Menu, point to Virtual Account, and then click Virtual Balances. • On the Virtual Account Menu, click Virtual Balances.
The Virtual Balances window appears.
Viewing Virtual Balances Menu Actions
Virtual Balances Menu Actions in the virtual trading environment are the same as the Balances Menu Actions in the live trading environment. See the image below for a list of available options located in the Balances menu.
To… Click…
Print Print. The Print dialog box appears.
Export data Export. This command exports your balances data into an Excel spreadsheet or csv file and asks you to specify a location where you want to save your sheet.
Refresh data Reload Trading Data. This command refreshes the window if the trading data stopped streaming due to technical issues.
Access online help Help. This command launches the Scottrade Knowledge Center.
Detach or attach a window
Detach. Allows you to detach the Balance window from its docked position. You can drag the window outside of the ScottradeELITE platform and onto an alternate computer screen to customize your virtual trading environment.
Close the window Close.

ScottradeELITE User Guide
Virtual Trading 335
Viewing Deposits
To make a deposit, to the right of the Virtual Account box, click the Deposit link.
Scottrade.com launches and takes you to the Deposits section where you can quickly make a deposit into your Scottrade account.
Account Types
Virtual Accounts vary from accounts in the actual trading environment as follows:
• All virtual accounts are Cash accounts only.
• As a default cash amount, you will receive $100,000 in your virtual account.
• Balances are updated at regular intervals throughout the day.
Cash Accounts
• Total Asset Value – The total value of your brokerage account is calculated as the sum of your positions market value plus your cash balance.
• Positions Market Value – The market value of all the positions in your account is calculated as the sum of your stocks, mutual funds, CDs & bonds market value plus your options market value.
• Cash Balance – The total amount of funds in the cash portion of your account is called your brokerage cash balance.

ScottradeELITE User Guide
Virtual Trading 336
• Funds Available for Trading – This balance indicates the total funds available for purchasing securities. You can use settled or unsettled funds for buying securities. If you wish to use only settled funds to purchase securities, view the settled funds available for trading balance.
• Funds Applied to Open Buy Orders – This balance is the total amount of funds that will be removed from your account if all of your open buy orders are executed.
Viewing Virtual Positions The Positions functionality in the virtual trading environment is no different than the Positions functionality in the actual trading environment. The Virtual Positions window is designed to help you track your investments and monitor their market performance with information you choose to display. With the ability to choose the information that's important to you, you can easily see how your individual investments are contributing to your overall trading strategy and monitor any investments that are approaching a sell target you may have established.
You can access the Virtual Positions window in the following ways:
• On the Main Menu, point to Virtual Account, and then click Virtual Positions.
• On the Virtual Account, click Positions.
From the Virtual Positions window, you can view your current positions across all your linked accounts.
To view the Virtual Positions in a linked account, use the Virtual Account drop-down menu below the Virtual Positions heading and select an available linked account.

ScottradeELITE User Guide
Virtual Trading 337
Configuring the Virtual Positions Window The Positions functionality in the virtual trading environment is no different than the Positions functionality in the actual trading environment. The Virtual Positions window is designed to help you track your investments and monitor their market performance with information you choose to display. With the ability to choose the information that's important to you, you can easily see how your individual investments are contributing to your overall trading strategy and monitor any investments that are approaching a sell target you may have established.
You can change the following settings of the Virtual Positions window:
• Adding or removing available data columns to your list view.
• Changing the order that each column appears.
• Sorting positions by alphabetical order or by category.
To change the settings of the Virtual Positions window:
• On the Virtual Positions menu in the top left corner of the Virtual Positions window, click Configure.
• The Configure Positions window appears, allowing you to add or remove columns, change the column order, or select how you want to sort your positions.

ScottradeELITE User Guide
Virtual Trading 338
• You can use the Search box to search for an available column.
To search for an available column by alphabetical order or by category:
1. Under the Search box in the top left corner of the Configure Positions dialog box, select Alphabetical or Category.

ScottradeELITE User Guide
Virtual Trading 339
2. In the Search box, type the column that you want to locate in the Available list.
To add a column to your Positions window:
1. On the Virtual Positions menu, click Configure.
2. In the Available list, choose the column you want to display in your Virtual Positions list, and then click Add.

ScottradeELITE User Guide
Virtual Trading 340
To remove a column from your Virtual Positions window:
1. On the Virtual Positions menu, click Configure.
2. In the Selected list, click the column you want to remove from the Virtual Positions list, and then click Remove.
To select multiple columns from the Available or Selected lists, hold Shift or Ctrl while clicking the columns you want.

ScottradeELITE User Guide
Virtual Trading 341
There are two ways to change the order in which each column is displayed in your Virtual Positions window:
• In the Selected list in the Configure Positions dialog box, click the desired field or fields and then, to the right, click the Up, Down, Move to Top, or Move to Bottom arrow.
• In the Virtual Positions window, click the column heading. Drag the column to the location you want (right or left).
To adjust the width of a column in your Virtual Positions window:
1. Point to the right of the column heading.
2. When the double arrow appears, drag the column heading to the left or right.
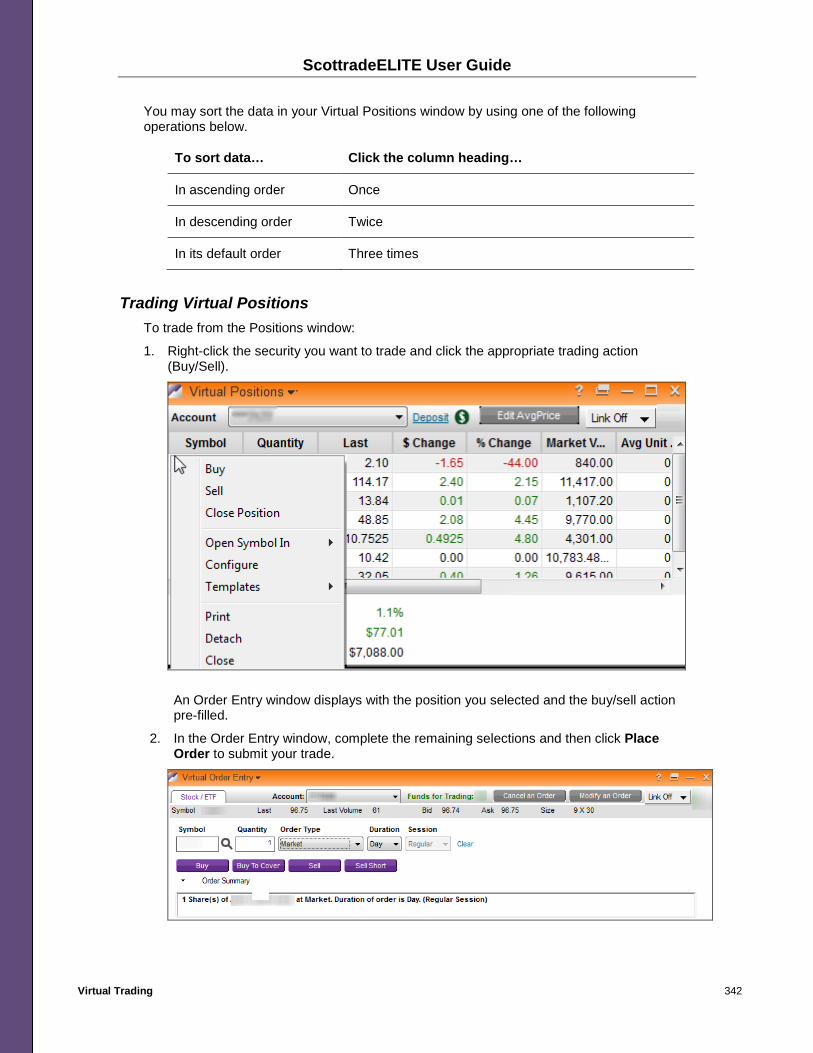
ScottradeELITE User Guide
Virtual Trading 342
You may sort the data in your Virtual Positions window by using one of the following operations below.
To sort data… Click the column heading…
In ascending order Once
In descending order Twice
In its default order Three times
Trading Virtual Positions To trade from the Positions window:
1. Right-click the security you want to trade and click the appropriate trading action (Buy/Sell).
An Order Entry window displays with the position you selected and the buy/sell action pre-filled.
2. In the Order Entry window, complete the remaining selections and then click Place Order to submit your trade.

ScottradeELITE User Guide
Virtual Trading 343
Virtual Positions Actions See the table below for a list of available options located in the Actions menu.
To… Click…
View or modify settings in your Virtual Positions window
Configure.
Access the Template Manager, save the window as a template, or load a pre-defined template
Templates.
Print a position Print. The Print dialog box appears.
Export positions data into an Excel spreadsheet
Export. In the Save As dialog box that appears, specify where you want your data saved.
Refresh data Reload Trading Data. This command refreshes the window if the trading data stopped streaming due to technical issues.
Access online help Help. This command launches the Scottrade Knowledge Center.
Detach virtual positions Detach. Detach allows you to detach the Positions window from its docked position. With the Positions window detached, you can drag the Positions window outside of the main ScottradeELITE platform and onto an alternate computer screen.
Close the Positions window Close.

ScottradeELITE User Guide
Virtual Trading 344
Portfolio Gain/Loss and Total Market Value The Portfolio Gain/Loss $, Portfolio Gain/Loss % and Total Market Value fields are static fields that always display at the bottom of your Positions window. These figures reflect the Gain & Loss figures for your current positions.
Linker Tool Use the Linker Tool to connect multiple windows so the symbol entered into one window displays in all linked windows simultaneously. The Linker Tools is available in several windows in the virtual trading environment. For additional information, see Linker Tool.
<Tool Name> Menu The <Tool Name> menu contains items that allow you to execute common tasks. Menu items include printing, exporting data, refreshing data, accessing help information, detaching or attaching window positions, and closing windows. Note that the options may vary slightly depending upon the tool you are using. For additional information, see <Tool Name> Menu.
Right-click Functionality Several tools in ScottradeELITE offer a shortcut menu with various options. The shortcut menu opens when you right-click anywhere in the window. For more information, see Right-click Functionality.
Symbol Lookup Symbol Lookup, which is included within most tools in ScottradeELITE, provides you with more information about a company via its symbol. For more information, see Symbol Lookup.
Minimize / Restore Minimize and restore buttons are available on the top bar of all active ScottradeELITE windows. For more information, see Minimize / Restore.
Template Manager Template Manager is functionality found in several tools or windows in the virtual trading environment. Located in the top right corner of the tool or active window, Template Manager is represented by a button. For more information, see Template Manager.

ScottradeELITE User Guide
Virtual Trading 345
Preventing Real Trades While in Virtual Mode ScottradeELITE contains built-in functionality to protect you from placing an order in your real account while you are in the virtual trading environment.
ScottradeELITE shows a disclaimer window when you access the following features:
Name or Icon Menu or Window Location
Contact Us icon Main Window (upper-right corner)
Messages icon Main Window (upper-right corner)
Help Main Menu
Account History Main Menu > Virtual Account
Account Management Main Menu > Virtual Account
Fund Account Main Menu > Virtual Account
Gain/Loss Tax Center Main Menu > Virtual Account
Messaging Main Menu > Virtual Account
Account History Main Menu > Virtual Account
More News News
More Research Research
Help Virtual Account
Fund Account Virtual Account
Gain/Loss Tax Center Virtual Account
Messaging Virtual Account
Virtual Balances (Deposit) Virtual Account
Virtual Balances (View Detailed Balances) Virtual Account
Virtual Positions (Deposit) Virtual Account
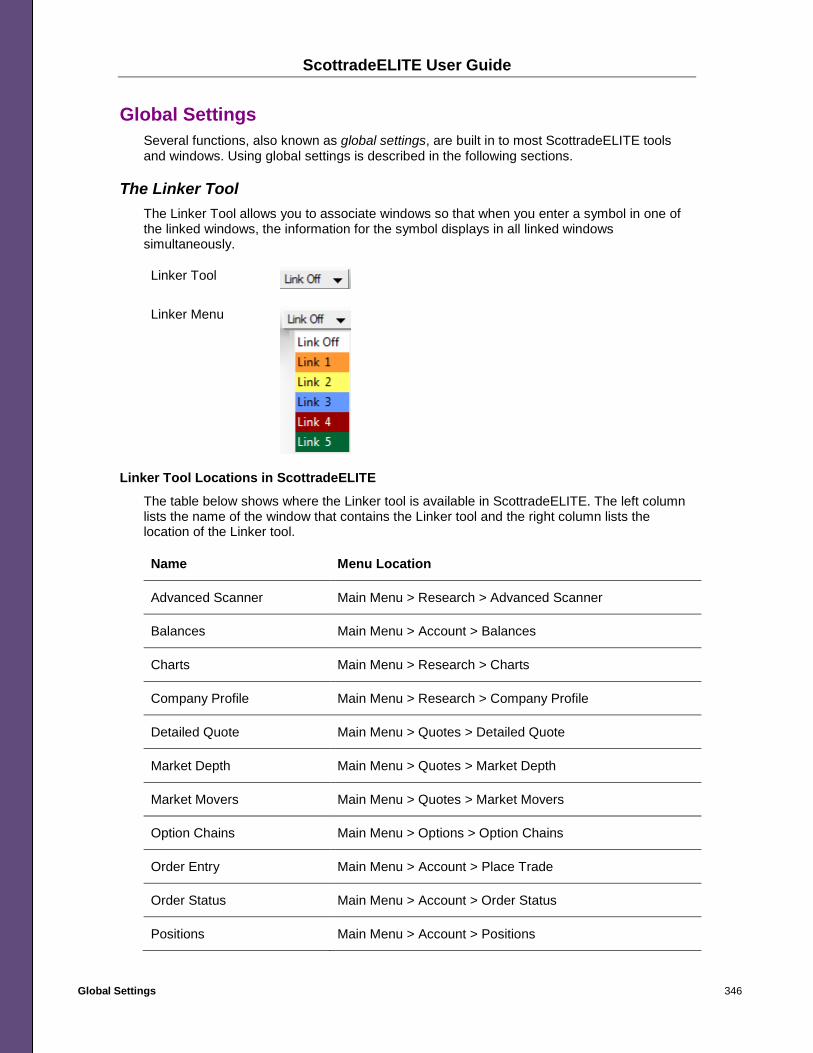
ScottradeELITE User Guide
Global Settings 346
Global Settings Several functions, also known as global settings, are built in to most ScottradeELITE tools and windows. Using global settings is described in the following sections.
The Linker Tool The Linker Tool allows you to associate windows so that when you enter a symbol in one of the linked windows, the information for the symbol displays in all linked windows simultaneously.
Linker Tool
Linker Menu
Linker Tool Locations in ScottradeELITE
The table below shows where the Linker tool is available in ScottradeELITE. The left column lists the name of the window that contains the Linker tool and the right column lists the location of the Linker tool.
Name Menu Location
Advanced Scanner Main Menu > Research > Advanced Scanner
Balances Main Menu > Account > Balances
Charts Main Menu > Research > Charts
Company Profile Main Menu > Research > Company Profile
Detailed Quote Main Menu > Quotes > Detailed Quote
Market Depth Main Menu > Quotes > Market Depth
Market Movers Main Menu > Quotes > Market Movers
Option Chains Main Menu > Options > Option Chains
Order Entry Main Menu > Account > Place Trade
Order Status Main Menu > Account > Order Status
Positions Main Menu > Account > Positions

ScottradeELITE User Guide
Global Settings 347
Name Menu Location
Time & Sales Main Menu > Quotes > Time & Sales
Top Performers Main Menu > Quotes > Top Performers
Trade Ideas Main Menu > Quotes > Trade Ideas
Upcoming Earnings Main Menu > Research > Upcoming Earnings
Velocity & Forces Main Menu > Quotes > Velocity & Forces
Virtual Trading In the virtual trading environment, the Linker tool is available in several tools or windows. For more information, see Virtual Trading.
Watch Lists Main Menu > Quotes > Watch Lists
Zacks Predefined Screener Main Menu > Research > Zacks Predefined Screener
Using the Linker Tool
To link one window to another:
1. In the top right corner of the application, click the Linker button.
2. On the menu, click the Linker option you want.
The table below contains descriptions of each Linker action:
Action Description
Link Off Use to disable the linking operation between tools and windows.
Link 1 Linked symbols display in orange.
Link 2 Linked symbols display in yellow.
Link 3 Linked symbols display in blue.
Link 4 Linked symbols display in red.
Link 5 Linked symbols display in green.

ScottradeELITE User Guide
Global Settings 348
To turn off the Linker tool:
1. In the top right corner of the Linker tool, click the Set Symbol Linking (Linker) button.
2. On the menu that appears, click Linker Off.
You cannot link to windows that do not have the Linker button available in the top right corner of the window.

ScottradeELITE User Guide
Global Settings 349
Configuring Linker Tool (Advanced Settings)
If desired, you can set up the Linker tool to link windows with the same color to send, receive, or send and receive data. The data delivery direction depends on the method you select for each window: Inbound & Outbound, Inbound, or Outbound.
To set up the linked window behavior for each window:
1. On the Main Menu, point to Configure, and then click Link Settings.
2. In the Link Settings dialog box, make your selections.
The example below shows the method name and description. The selected windows include Outbound for Watch Lists, Inbound for Charts, and Outbound & Inbound for Detailed Quote. ScottradeELITE links the Watch List so it will send data to both Detailed Quote and Chart. Neither the Detailed Quote, nor the Chart window can send data to the Watch List.
3. Click OK.
4. In the windows that you selected for linking, choose a linker color.
Using the example above, if you selected a Linker color for Watch Lists, Charts and Detailed Quote, ScottradeELITE links the Watch List so it will send data to both Detailed Quote and Chart. Neither the Detailed Quote nor the Chart window can send data to the Watch List.
Minimizing or Restoring Windows The Minimize and Restore buttons are available on the top bar of all active windows.
• To minimize the window, in the bottom left corner of the ScottradeELITE window, click the Minimize button.
• To restore the window to its default size, click the Restore button.
Symbol Entry Box The Symbol Entry box is located in the top left corner of most windows on the ScottradeELITE platform.
To display the research for a symbol in your active window, in the Symbol Entry box, type the company’s symbol, and click Go or Add (depending on the tool).
The symbol data populates in the active window.

ScottradeELITE User Guide
Global Settings 350
Symbol Lookup Symbol Lookup, which is available within most tools on the ScottradeELITE platform, provides more information about a company via its symbol. Symbol Lookup is located next to the Symbol Entry box in the top left corner of most ScottradeELITE windows. The magnifying glass icon denotes the Symbol Lookup functionality.
To use Symbol Lookup:
• Click the Symbol Lookup button (magnifying glass icon). • In the Search box, type the name.
• A list of potential matching companies, symbols, and primary exchanges displays in the window below the Search box.
• To add a symbol to the active window, in the Search results list, click the symbol, and then click Add.
The Search box closes, and the active window shows the trading activity for the symbol you entered.

ScottradeELITE User Guide
Global Settings 351
<Tool Name> Menu There is a menu located in the top left corner of every ScottradeELITE tool (for example, Positions, Order Entry, Charts, and so on). As listed in the table below, the <Tool Name> menu contains items that allow you to execute common tasks. The table below contains all available <Tool Name> menu items within ScottradeELITE tools or windows.
To… Click…
View or modify settings in your active window
Configure <Tool Name>
Access the Template Manager, save the window as a template, or load a pre-defined template
Templates.
Print item(s) in the active window Print <Tool Name>.
Export data from the tool or active window to a .csv file
Export <Tool Name>.
Refresh data in the window if the trading data stopped streaming due to technical issues.
Reload Trading Data.
Access online help Help.
Detach or Attach the active window. Detach removes the active window from its docked position. You can drag the window outside of the main ScottradeELITE platform and onto an alternate computer screen. Attach places the active window into the original docked position.
Detach/Attach.
Close the active window Close <Tool Name>.
The <Tool Name> menu items may vary slightly depending on the tool or window you are using.

ScottradeELITE User Guide
Global Settings 352
Right-click Functionality Several tools or windows on the ScottradeELITE platform offer a shortcut menu with various options. The shortcut menu displays when you right-click anywhere in the window.
To… Click…
Buy a security Buy.
Sell a security Sell.
Send a symbol to the Alert Manager and create a price or news alert for the identified security
Create an Alert for <Symbol>.
Open the symbol in one of ten other ScottradeELITE windows.
Open Symbol In.
Change settings within the tool or active window
Configure.
Create a template, save changes to a template, or choose from your list of saved templates
Templates.
Print item(s) in the active window Print <Tool Name>.
Detach or Attach the active window. Detach removes the active window from its docked position. You can drag the window outside of the main ScottradeELITE platform and onto an alternate computer screen. Attach places the active window into the original docked position.
Detach/Attach.
Close the active window Close <Tool Name>.
The options available in the shortcut menu may vary slightly depending upon the tool or window you are using.
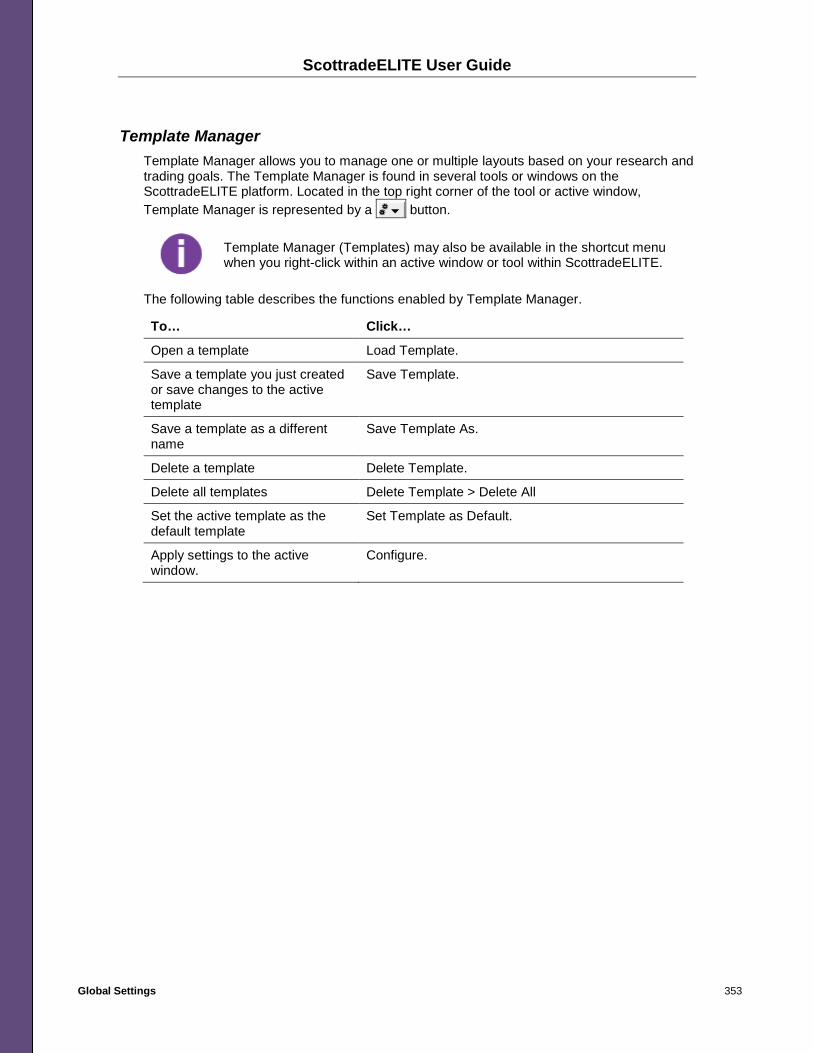
ScottradeELITE User Guide
Global Settings 353
Template Manager Template Manager allows you to manage one or multiple layouts based on your research and trading goals. The Template Manager is found in several tools or windows on the ScottradeELITE platform. Located in the top right corner of the tool or active window, Template Manager is represented by a button.
Template Manager (Templates) may also be available in the shortcut menu when you right-click within an active window or tool within ScottradeELITE.
The following table describes the functions enabled by Template Manager.
To… Click…
Open a template Load Template.
Save a template you just created or save changes to the active template
Save Template.
Save a template as a different name
Save Template As.
Delete a template Delete Template.
Delete all templates Delete Template > Delete All
Set the active template as the default template
Set Template as Default.
Apply settings to the active window.
Configure.

ScottradeELITE User Guide
Global Settings 354
Show or Hide Tabs in Select Windows The show or hide tabs feature allows you to save space and remove non-vital information from several windows. Use Global Settings to show or hide tabs in the following windows:
• Watch List • Option Chains • Advanced Scanner • Charts
The default setting is to display tabs in the four windows listed above. When you hide tabs, only new windows you open in your layout display with hidden tabs. Existing, open windows, windows saved to a layout, or windows saved as a template are not affected.
To display tabs:
1. On the Main Menu, point to Configure, and then click Global Settings.
2. In the Configure dialog box, select the Show Tabs in Windows check box.
3. Click OK.
When you launch a new Watch List, Option Chains, Advanced Scanner, or Charts window, the tab displays across the top.

ScottradeELITE User Guide
Global Settings 355
To hide tabs:
1. On the Main Menu, point to Configure, and then click Global Settings.
2. In the Configure dialog box, clear the Show Tabs in Windows check box.
3. Click OK.
When you launch a new Watch List, Option Chains, Advanced Scanner, or Charts window, no tab displays across the top.

ScottradeELITE User Guide
Global Settings 356
Show or Hide Account Quick View (Right Drawer) Like the show or hide tabs space-saving feature, you can use Global Settings to show or hide the Quick View (Right Drawer).
Although the default setting is to hide the Account Quick View (Right Drawer) from view, the bar displays on the right side of the main window. When you set the Account Quick View (Right Drawer) to hide or show and save the layout, the setting applies to the saved layout only.
To display Account Quick View:
1. On the Main Menu, point to Configure, and then click Global Settings.
2. In the Configure dialog box, select the Show Account Quick View check box.
3. Click OK.
The Account Quick View (Right Drawer) displays in the main window.

ScottradeELITE User Guide
Global Settings 357
To hide Account Quick View:
1. On the Main Menu, point to Configure, and then click Global Settings.
2. In the Configure dialog box, clear the Show Account Quick View check box.
3. Click OK.
The Account Quick View (Right Drawer) no longer displays in the main window.

ScottradeELITE User Guide
Global Settings 358
Show or Hide Layout Bar To gain extra space at the bottom of your window or display your available layouts, you can use Global Settings to show or hide the Layout Bar.
To display the Layout Bar:
1. On the Main Menu, point to Configure, and then click Global Settings.
2. In the Configure dialog box, select the Show Layout Bar check box.
3. Click OK.
The Layout Bar displays in the main window

ScottradeELITE User Guide
Global Settings 359
To hide the Layout Bar:
1. On the Main Menu, point to Configure, and then click Global Settings.
2. In the Configure dialog box, clear the Layout Bar check box.
3. Click OK.
The Layout Bar no longer displays in the main window.

ScottradeELITE User Guide
Global Settings 360
Viewing or Selecting Recently-Entered Symbols You can view or select up to 15 recently-entered symbols from the symbol entry box list in the following windows:
• Charts • Detailed Quote • Market Depth • Option Chain • Sector Trends • Streaming News • Time & Sales • Velocity & Forces • Watch List
To view the list in any of the windows above:
• Click the Symbol Entry box arrow.
• To select a recently-entered symbol, in the Symbol Entry box list, click the symbol you want. The Symbol Entry box displays your symbol.

ScottradeELITE User Guide
Appendix A. Glossary 361
Appendix A. Glossary For details about common investment, trading, or technical terms, see the Scottrade KnowledgeCenter Dictionary.

ScottradeELITE User Guide
Appendix B. Exchange Identifications (IDs) 362
Appendix B. Exchange Identifications (IDs) Following are IDs associated with common securities exchanges and publications.
Exchange ID Description
A NYSE MKT
B NASDAQ OMX BX
C National Stock Exchange (NSX)
I International Securities Exchange (ISE)
J EDGA Exchange, Inc. (EDGA)
K EDGX Exchange, Inc. (EDGX)
M Chicago Stock Exchange
N NYSE Euronext
P NYSE Arca
Q NASDAQ OMX
S NASCAQ Small Cap
T Third Market
U Pink Sheets
V NASDAQ Bulletin Board
W CBOE Stock Exchange (CBSX)
X NASDAQ OMX PHLX, Inc.
Y BATS Y Exchange, Inc. (BYX)
Z BATS Exchange, Inc. (BATS)

ScottradeELITE User Guide
Appendix C. Subscriber Account Status 363
Appendix C. Subscriber Account Status Accessibility to specific features and functionality in ScottradeELITE may vary depending on your subscriber account status. For more information about subscriber designations and Scottrade account types, see the Knowledge Center.
The following table describes the subscriber account status classifications.
Subscriber Account Status
Description
No Agreement or Delayed No-agreement (Delayed) users chose to opt out of the subscriber agreement application, and are not entitled to receive real-time quotes at any time, even during order placement.
Non-Professional Non-professional users are entitled to receive real time quotes during order placement. All other front end tools will display delayed quotes.
Pro-Pay Pro-pay users share the same classification as professional users, but they are paying for the entitlement to receive real-time quotes throughout all front ends.
Professional (Pro) Professional users are entitled to receive real time quotes during order placement. All other front end tools will display delayed quotes.
The following table illustrates the quote experience for clients by subscriber account status (including linked accounts).
Logged in as… Quote Experience
Has access to linked account…
Non-Pro Pro Pro-Pay No-
Agreement
Non-Pro Fully real-time Yes No Yes No Pro Partial delayed Yes Yes Yes No Pro-Pay Fully real-time Yes No Yes No No-Agreement Fully delayed Yes Yes Yes Yes

ScottradeELITE User Guide
Appendix C. Subscriber Account Status 364
The following tables outline the tools available to the client by subscriber account status.
Tool
Subscriber Account Status
Customer Experience A
dvan
ced
Scan
ner
Ale
rts
Mar
ket D
epth
Mar
ket M
over
s
Opt
ion
Cha
ins
Ord
er E
ntry
Posi
tions
Rec
ogni
a
Sect
or T
rend
s
Tim
e an
d Sa
les
Trad
e Id
eas
Top
Perf
orm
ers
Velo
city
and
For
ces
Wat
ch L
ists
Prof
essi
onal
Real-time static quotes
●
Disabled ● ● ● ● ● ● ● ● ●
No change ●
Hidden * ● ● ●
* For options quotes only, Bid Size, Ask Size, Bid Exchange, and Ask Exchange data will show as dashes.
Tool
Subscriber Account Status
Customer Experience A
dvan
ced
Scan
ner
Ale
rts
Mar
ket D
epth
Mar
ket M
over
s
Opt
ion
Cha
ins
Ord
er E
ntry
Posi
tions
Rec
ogni
a
Sect
or T
rend
s
Tim
e an
d Sa
les
Trad
e Id
eas
Top
Perf
orm
ers
Velo
city
and
For
ces
Wat
ch L
ists
No
Agr
eem
ent o
r D
elay
ed
15 minutes delayed quotes
●
Disabled ● ● ● ● ● ● ● ● ●
No change ●
Hidden ** ● ● ●
** For options quotes only, Bid Size, Ask Size, Bid Exchange, and Ask Exchange data will show as dashes.