Embed Size (px)
Citation preview
1
Scottish Household waste – summary data 2019 This release shows the 2019 calendar year summary of household waste data
generated in Scotland and managed by or on behalf of Scottish local authorities.
Information on the methodology used to prepare this release and a definition of terms is
in the methodology and glossary at the end of this document.
Key points
Scottish Household waste – 2019 calendar year
The total amount of household waste generated in Scotland was 2.4 million tonnes
(Table 1) in 2019, an increase of 17 thousand tonnes (1%) from 2018.
For 2019, the Scottish household waste recycling rate was 44.9%1, an increase of
0.2 percentage points from the 44.7% (Table 1) rate achieved in 2018. The amount
of household waste recycled between 2018 and 2019 increased by 12 thousand
tonnes to 1.1 million tonnes.
The amount of Scottish household waste landfilled in 2019 was 0.76 million tonnes,
a reduction of 273 thousand tonnes (26%) from 2018, and a reduction of 696
thousand tonnes (48%) since 2011. This is the eighth consecutive decrease in
household waste landfilled, and the first time that the amount of household waste
landfilled is less than one million tonnes.
For 2019, the total amount of Scottish household waste managed by other diversion
from landfill was 577 thousand tonnes, an increase of 278 thousand tonnes (93%)
from 2018. Most of the diverted waste in 2019 was managed by incineration (79%,
454 thousand tonnes), an increase of 233 thousand tonnes from 2018.
The carbon impact is a measure of the whole-life carbon impacts of waste, from
resource extraction and manufacturing emissions, right through to waste
management emissions. The carbon impact of Scottish household waste generated
and managed in 2019 was 5.7 million tonnes of carbon dioxide equivalent (TCO2e,
1 Recycling rates refer to Scotland’s national measure which differs from the Waste from
households measure published in Defra’s UK Statistics on Waste. For further information
about the differences refer to the Methodology section on page 20.
2
Table 1), which is the equivalent to 1.0 TCO2e per person (Table 2). This was a
decrease of 94 thousand TCO2e from 2018, and a reduction of 1.1 million TCO2e
from 2011.
Summary data tables are also available to download in Excel format on SEPA's web
site.
--------------------------------------------------------------------------------------------------------------------
Enquiries on this publication to: SEPA Communications Department:
This is an Official Statistics publication. These statistics have been produced to the high
professional standards defined in the Code of Practice for Official Statistics, which sets
out fourteen principles under the pillars of Trustworthiness, Quality and Value. More
information on the Official Statistics Code of Practice can be found here:
http://www.statisticsauthority.gov.uk/assessment/code-of-practice/index.html.
Lead statistician: Peter Ferrett
3
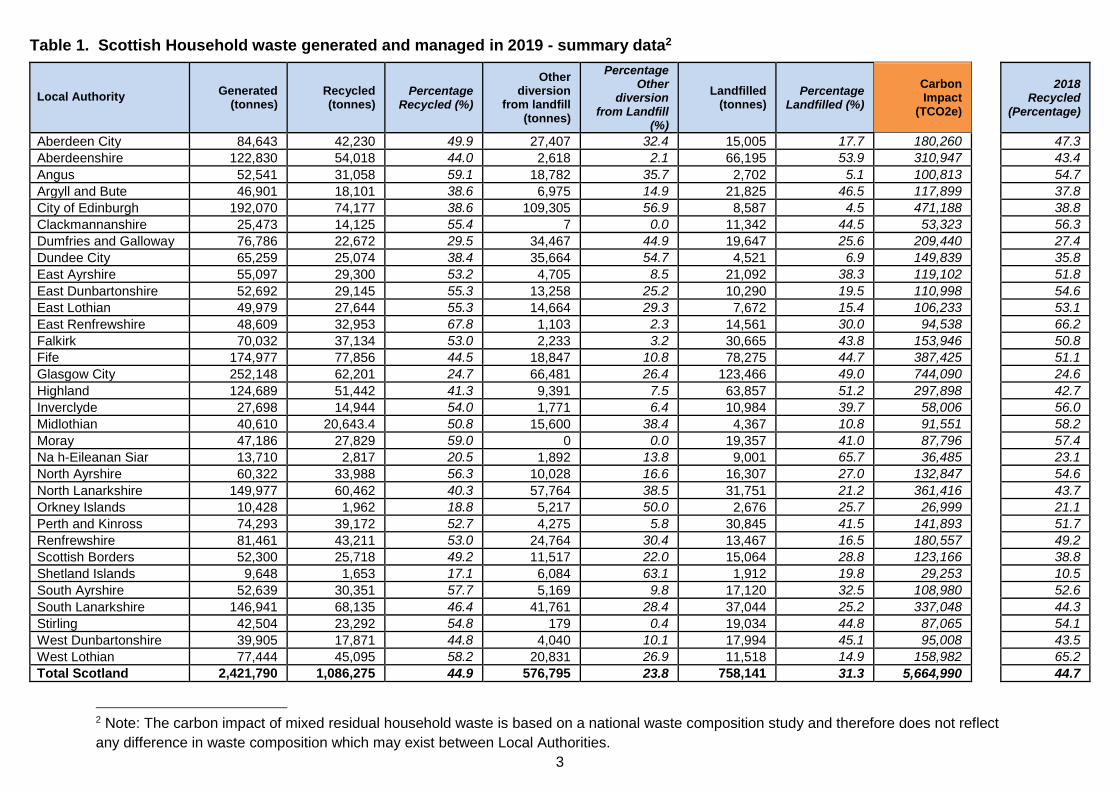
Table 1. Scottish Household waste generated and managed in 2019 - summary data2
Local Authority Generated
(tonnes) Recycled (tonnes)
Percentage Recycled (%)
Other diversion
from landfill (tonnes)
Percentage Other
diversion from Landfill
(%)
Landfilled (tonnes)
Percentage Landfilled (%)
Carbon Impact
(TCO2e)
2018 Recycled
(Percentage)
Aberdeen City 84,643 42,230 49.9 27,407 32.4 15,005 17.7 180,260 47.3
Aberdeenshire 122,830 54,018 44.0 2,618 2.1 66,195 53.9 310,947 43.4
Angus 52,541 31,058 59.1 18,782 35.7 2,702 5.1 100,813 54.7
Argyll and Bute 46,901 18,101 38.6 6,975 14.9 21,825 46.5 117,899 37.8
City of Edinburgh 192,070 74,177 38.6 109,305 56.9 8,587 4.5 471,188 38.8
Clackmannanshire 25,473 14,125 55.4 7 0.0 11,342 44.5 53,323 56.3
Dumfries and Galloway 76,786 22,672 29.5 34,467 44.9 19,647 25.6 209,440 27.4
Dundee City 65,259 25,074 38.4 35,664 54.7 4,521 6.9 149,839 35.8
East Ayrshire 55,097 29,300 53.2 4,705 8.5 21,092 38.3 119,102 51.8
East Dunbartonshire 52,692 29,145 55.3 13,258 25.2 10,290 19.5 110,998 54.6
East Lothian 49,979 27,644 55.3 14,664 29.3 7,672 15.4 106,233 53.1
East Renfrewshire 48,609 32,953 67.8 1,103 2.3 14,561 30.0 94,538 66.2
Falkirk 70,032 37,134 53.0 2,233 3.2 30,665 43.8 153,946 50.8
Fife 174,977 77,856 44.5 18,847 10.8 78,275 44.7 387,425 51.1
Glasgow City 252,148 62,201 24.7 66,481 26.4 123,466 49.0 744,090 24.6
Highland 124,689 51,442 41.3 9,391 7.5 63,857 51.2 297,898 42.7
Inverclyde 27,698 14,944 54.0 1,771 6.4 10,984 39.7 58,006 56.0
Midlothian 40,610 20,643.4 50.8 15,600 38.4 4,367 10.8 91,551 58.2
Moray 47,186 27,829 59.0 0 0.0 19,357 41.0 87,796 57.4
Na h-Eileanan Siar 13,710 2,817 20.5 1,892 13.8 9,001 65.7 36,485 23.1
North Ayrshire 60,322 33,988 56.3 10,028 16.6 16,307 27.0 132,847 54.6
North Lanarkshire 149,977 60,462 40.3 57,764 38.5 31,751 21.2 361,416 43.7
Orkney Islands 10,428 1,962 18.8 5,217 50.0 2,676 25.7 26,999 21.1
Perth and Kinross 74,293 39,172 52.7 4,275 5.8 30,845 41.5 141,893 51.7
Renfrewshire 81,461 43,211 53.0 24,764 30.4 13,467 16.5 180,557 49.2
Scottish Borders 52,300 25,718 49.2 11,517 22.0 15,064 28.8 123,166 38.8
Shetland Islands 9,648 1,653 17.1 6,084 63.1 1,912 19.8 29,253 10.5
South Ayrshire 52,639 30,351 57.7 5,169 9.8 17,120 32.5 108,980 52.6
South Lanarkshire 146,941 68,135 46.4 41,761 28.4 37,044 25.2 337,048 44.3
Stirling 42,504 23,292 54.8 179 0.4 19,034 44.8 87,065 54.1
West Dunbartonshire 39,905 17,871 44.8 4,040 10.1 17,994 45.1 95,008 43.5
West Lothian 77,444 45,095 58.2 20,831 26.9 11,518 14.9 158,982 65.2
Total Scotland 2,421,790 1,086,275 44.9 576,795 23.8 758,141 31.3 5,664,990 44.7
2 Note: The carbon impact of mixed residual household waste is based on a national waste composition study and therefore does not reflect
any difference in waste composition which may exist between Local Authorities.
4
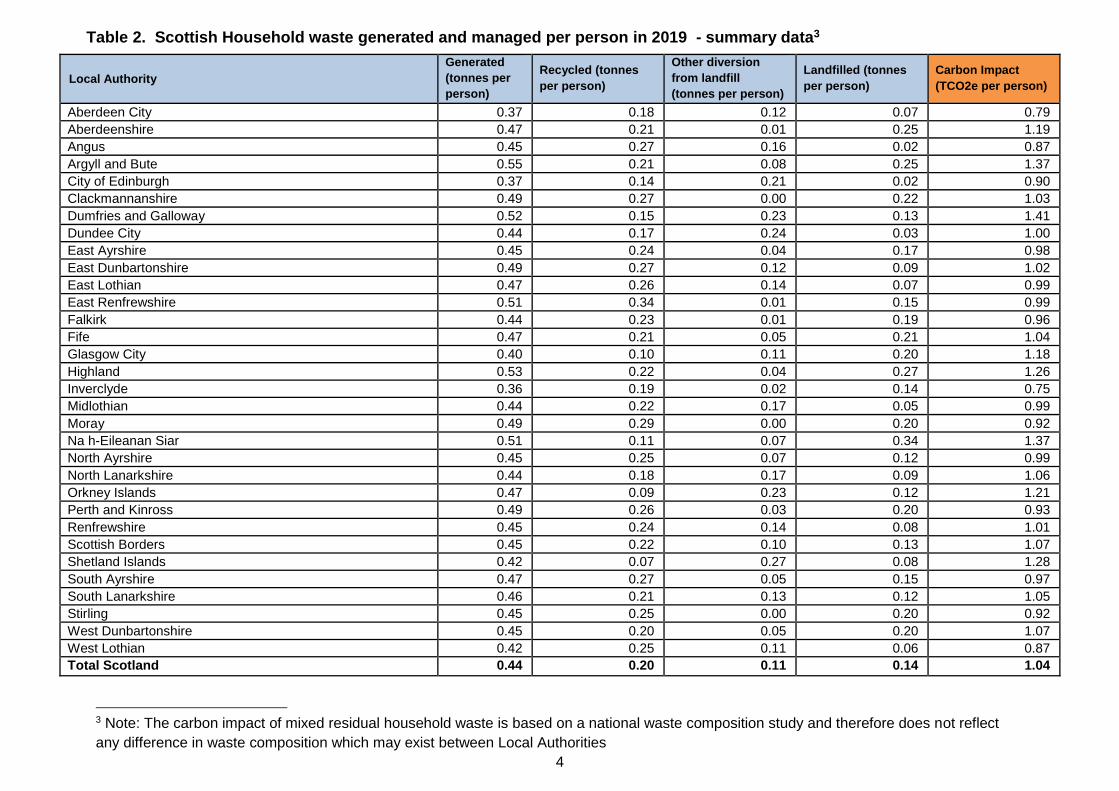
Table 2. Scottish Household waste generated and managed per person in 2019 - summary data3
Local Authority
Generated
(tonnes per
person)
Recycled (tonnes
per person)
Other diversion
from landfill
(tonnes per person)
Landfilled (tonnes
per person)
Carbon Impact
(TCO2e per person)
Aberdeen City 0.37 0.18 0.12 0.07 0.79
Aberdeenshire 0.47 0.21 0.01 0.25 1.19
Angus 0.45 0.27 0.16 0.02 0.87
Argyll and Bute 0.55 0.21 0.08 0.25 1.37
City of Edinburgh 0.37 0.14 0.21 0.02 0.90
Clackmannanshire 0.49 0.27 0.00 0.22 1.03
Dumfries and Galloway 0.52 0.15 0.23 0.13 1.41
Dundee City 0.44 0.17 0.24 0.03 1.00
East Ayrshire 0.45 0.24 0.04 0.17 0.98
East Dunbartonshire 0.49 0.27 0.12 0.09 1.02
East Lothian 0.47 0.26 0.14 0.07 0.99
East Renfrewshire 0.51 0.34 0.01 0.15 0.99
Falkirk 0.44 0.23 0.01 0.19 0.96
Fife 0.47 0.21 0.05 0.21 1.04
Glasgow City 0.40 0.10 0.11 0.20 1.18
Highland 0.53 0.22 0.04 0.27 1.26
Inverclyde 0.36 0.19 0.02 0.14 0.75
Midlothian 0.44 0.22 0.17 0.05 0.99
Moray 0.49 0.29 0.00 0.20 0.92
Na h-Eileanan Siar 0.51 0.11 0.07 0.34 1.37
North Ayrshire 0.45 0.25 0.07 0.12 0.99
North Lanarkshire 0.44 0.18 0.17 0.09 1.06
Orkney Islands 0.47 0.09 0.23 0.12 1.21
Perth and Kinross 0.49 0.26 0.03 0.20 0.93
Renfrewshire 0.45 0.24 0.14 0.08 1.01
Scottish Borders 0.45 0.22 0.10 0.13 1.07
Shetland Islands 0.42 0.07 0.27 0.08 1.28
South Ayrshire 0.47 0.27 0.05 0.15 0.97
South Lanarkshire 0.46 0.21 0.13 0.12 1.05
Stirling 0.45 0.25 0.00 0.20 0.92
West Dunbartonshire 0.45 0.20 0.05 0.20 1.07
West Lothian 0.42 0.25 0.11 0.06 0.87
Total Scotland 0.44 0.20 0.11 0.14 1.04
3 Note: The carbon impact of mixed residual household waste is based on a national waste composition study and therefore does not reflect
any difference in waste composition which may exist between Local Authorities
5
Trends
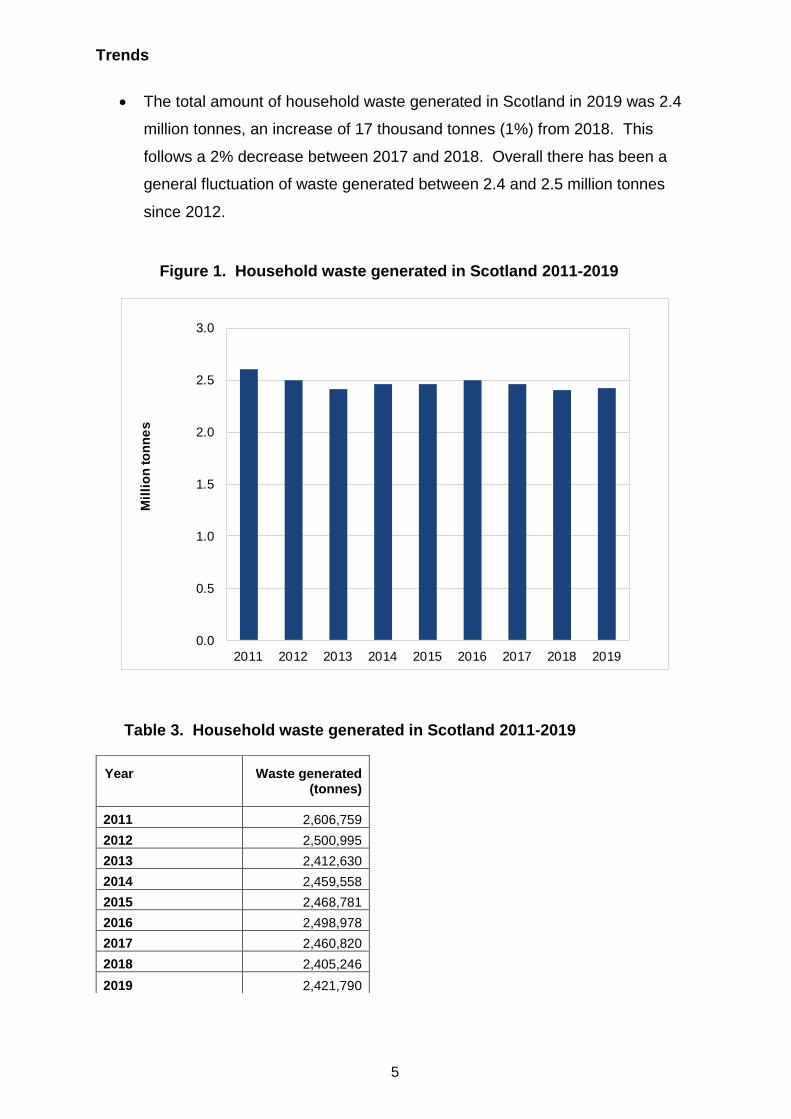
The total amount of household waste generated in Scotland in 2019 was 2.4
million tonnes, an increase of 17 thousand tonnes (1%) from 2018. This
follows a 2% decrease between 2017 and 2018. Overall there has been a
general fluctuation of waste generated between 2.4 and 2.5 million tonnes
since 2012.
Figure 1. Household waste generated in Scotland 2011-2019
0.0
0.5
1.0
1.5
2.0
2.5
3.0
2011 2012 2013 2014 2015 2016 2017 2018 2019
Mil
lio
n to
nn
es
Table 3. Household waste generated in Scotland 2011-2019
Year Waste generated (tonnes)
2011 2,606,759
2012 2,500,995
2013 2,412,630
2014 2,459,558
2015 2,468,781
2016 2,498,978
2017 2,460,820
2018 2,405,246
2019 2,421,790
6
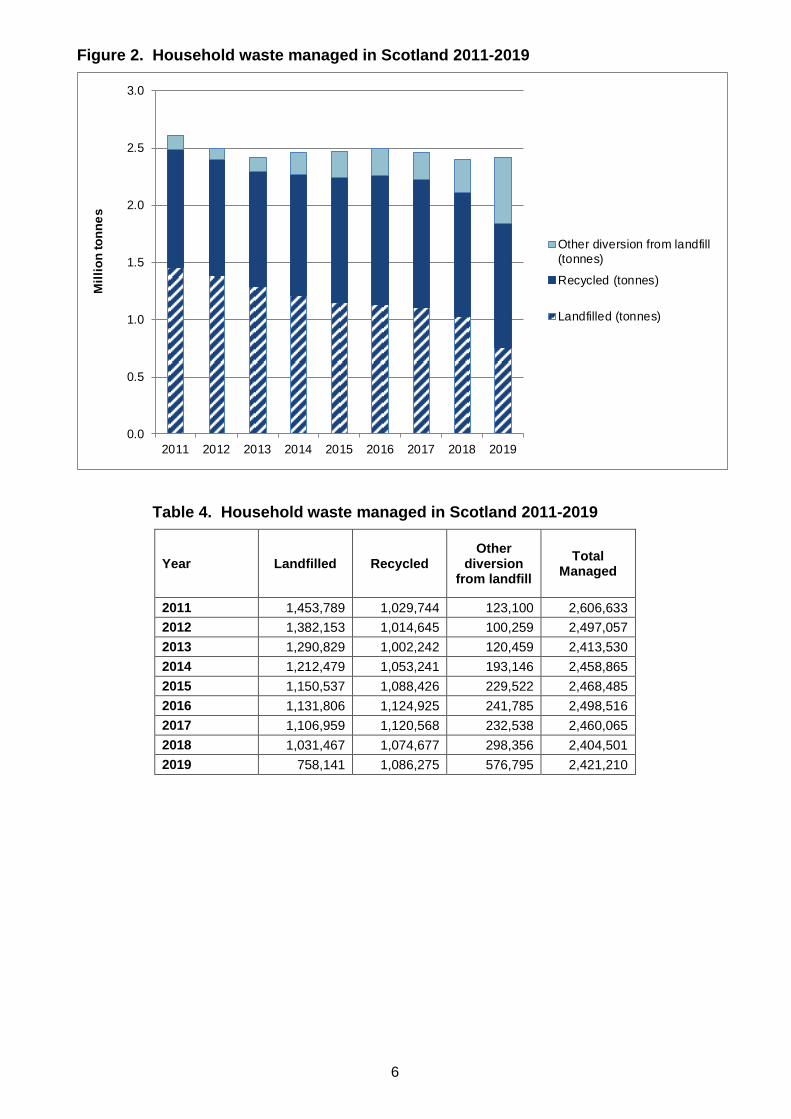
Figure 2. Household waste managed in Scotland 2011-2019
0.0
0.5
1.0
1.5
2.0
2.5
3.0
2011 2012 2013 2014 2015 2016 2017 2018 2019
Mil
lio
n to
nn
es
Other diversion from landfill
(tonnes)
Recycled (tonnes)
Landfilled (tonnes)
Table 4. Household waste managed in Scotland 2011-2019
Year Landfilled Recycled Other
diversion from landfill
Total Managed
2011 1,453,789 1,029,744 123,100 2,606,633
2012 1,382,153 1,014,645 100,259 2,497,057
2013 1,290,829 1,002,242 120,459 2,413,530
2014 1,212,479 1,053,241 193,146 2,458,865
2015 1,150,537 1,088,426 229,522 2,468,485
2016 1,131,806 1,124,925 241,785 2,498,516
2017 1,106,959 1,120,568 232,538 2,460,065
2018 1,031,467 1,074,677 298,356 2,404,501
2019 758,141 1,086,275 576,795 2,421,210
7
Waste Recycled
Waste recycled includes waste reused, recycled or composted. A full
description of recycling is given in the glossary.
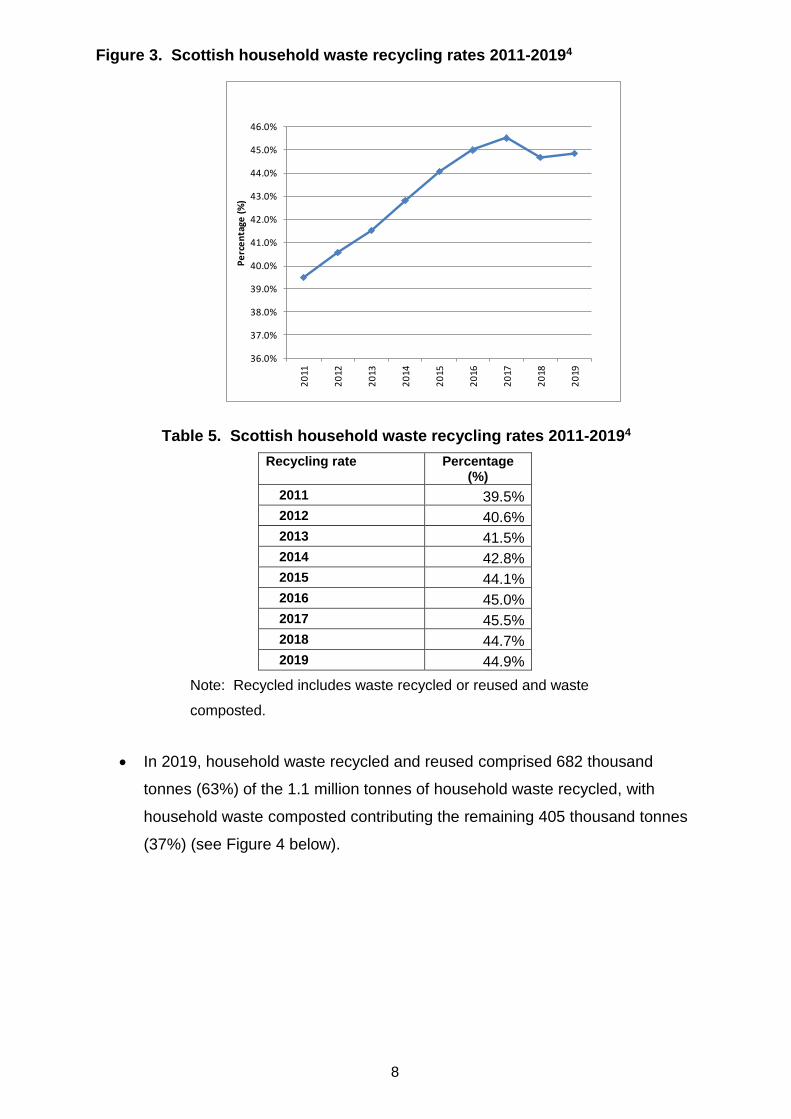
For 2019, the Scottish household waste recycling rate was 44.9% (Figure 3),
an increase of 0.2 percentage points from the 44.7% recycling rate achieved
in 2018, and a 5.4 percentage point increase from the 39.5% achieved in
20114 . The recycling rate appears to have plateaued from 2016 (see Figure
3 below).
For 2019, the total tonnage of Scottish household waste recycled was 1.1
million tonnes, an increase of 12 thousand tonnes (1%) from 2018 and 57
thousand tonnes (5%) greater than the 1.0 million tonnes of waste recycled in
20114.
4 The definition of recycling changed in 2014 to exclude non PAS compost. Recycling data
for 2011 - 2013 has been modelled under the new definition to provide consistency for the
time series.
8
Figure 3. Scottish household waste recycling rates 2011-20194
36.0%
37.0%
38.0%
39.0%
40.0%
41.0%
42.0%
43.0%
44.0%
45.0%
46.0%
20
11
20
12
20
13
20
14
20
15
20
16
20
17
20
18
20
19
Pe
rce
nta
ge (
%)
Table 5. Scottish household waste recycling rates 2011-20194
Recycling rate Percentage (%)
2011 39.5%
2012 40.6%
2013 41.5%
2014 42.8%
2015 44.1%
2016 45.0%
2017 45.5%
2018 44.7%
2019 44.9%
Note: Recycled includes waste recycled or reused and waste
composted.
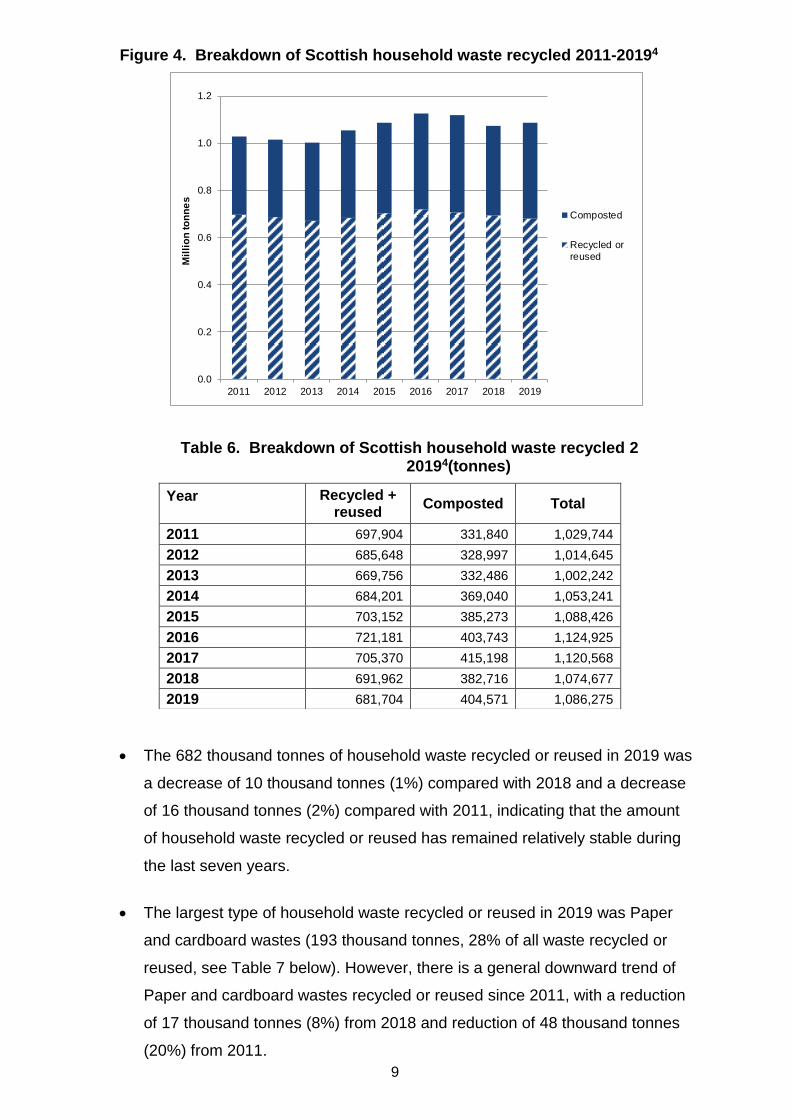
In 2019, household waste recycled and reused comprised 682 thousand
tonnes (63%) of the 1.1 million tonnes of household waste recycled, with
household waste composted contributing the remaining 405 thousand tonnes
(37%) (see Figure 4 below).
9
Figure 4. Breakdown of Scottish household waste recycled 2011-20194
0.0
0.2
0.4
0.6
0.8
1.0
1.2
2011 2012 2013 2014 2015 2016 2017 2018 2019
Mil
lio
n to
nn
es
Composted
Recycled or
reused
Table 6. Breakdown of Scottish household waste recycled 2011-20194(tonnes)
Year Recycled + reused
Composted Total
2011 697,904 331,840 1,029,744
2012 685,648 328,997 1,014,645
2013 669,756 332,486 1,002,242
2014 684,201 369,040 1,053,241
2015 703,152 385,273 1,088,426
2016 721,181 403,743 1,124,925
2017 705,370 415,198 1,120,568
2018 691,962 382,716 1,074,677
2019 681,704 404,571 1,086,275
The 682 thousand tonnes of household waste recycled or reused in 2019 was
a decrease of 10 thousand tonnes (1%) compared with 2018 and a decrease
of 16 thousand tonnes (2%) compared with 2011, indicating that the amount
of household waste recycled or reused has remained relatively stable during
the last seven years.
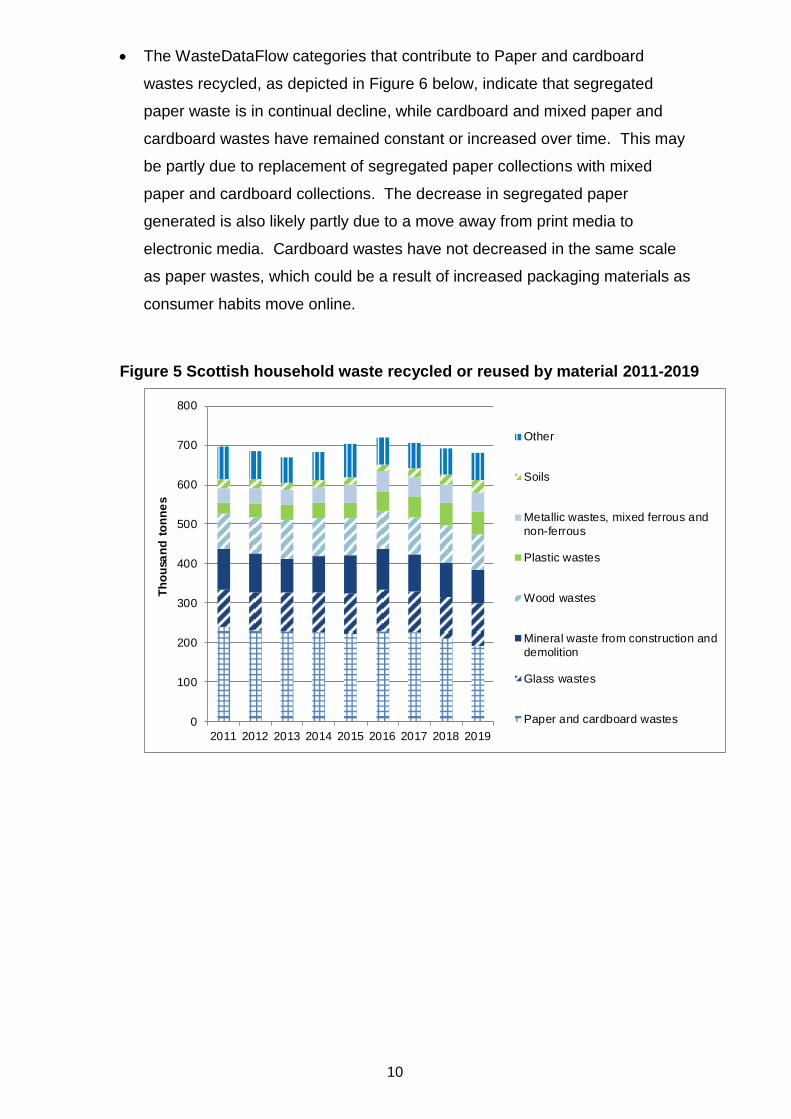
The largest type of household waste recycled or reused in 2019 was Paper
and cardboard wastes (193 thousand tonnes, 28% of all waste recycled or
reused, see Table 7 below). However, there is a general downward trend of
Paper and cardboard wastes recycled or reused since 2011, with a reduction
of 17 thousand tonnes (8%) from 2018 and reduction of 48 thousand tonnes
(20%) from 2011.
10
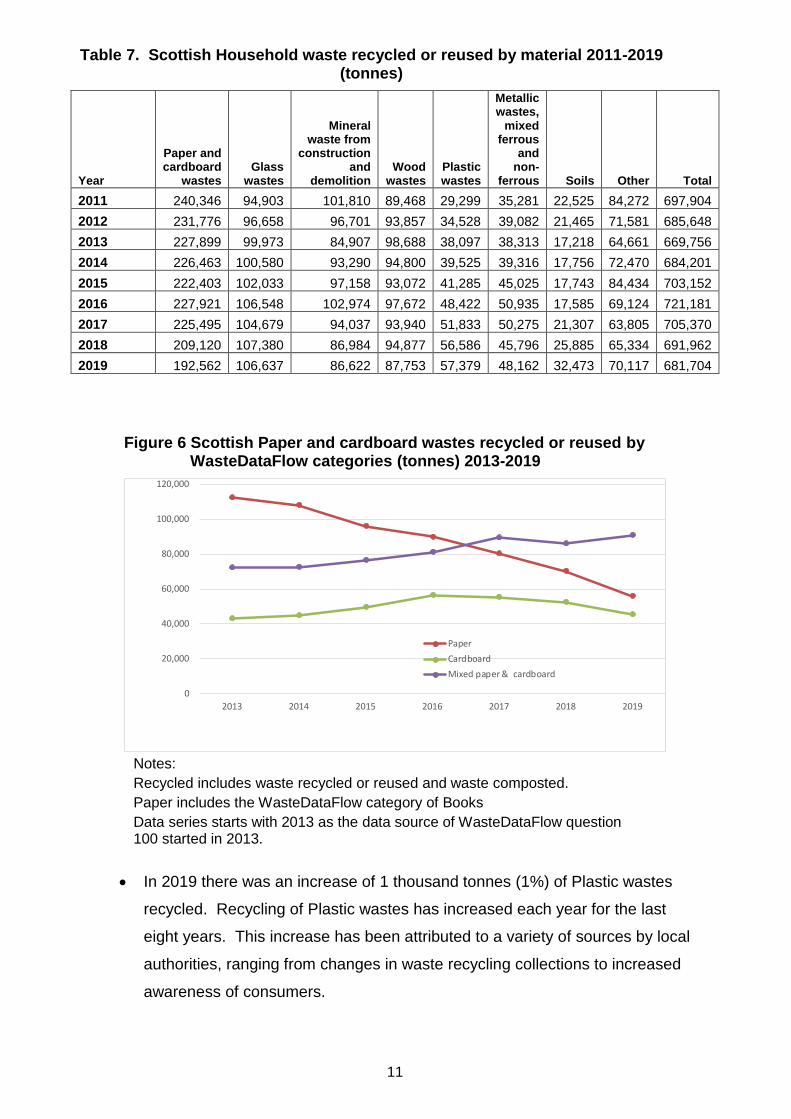
The WasteDataFlow categories that contribute to Paper and cardboard
wastes recycled, as depicted in Figure 6 below, indicate that segregated
paper waste is in continual decline, while cardboard and mixed paper and
cardboard wastes have remained constant or increased over time. This may
be partly due to replacement of segregated paper collections with mixed
paper and cardboard collections. The decrease in segregated paper
generated is also likely partly due to a move away from print media to
electronic media. Cardboard wastes have not decreased in the same scale
as paper wastes, which could be a result of increased packaging materials as
consumer habits move online.
Figure 5 Scottish household waste recycled or reused by material 2011-2019
0
100
200
300
400
500
600
700
800
2011 2012 2013 2014 2015 2016 2017 2018 2019
Th
ou
san
d t
on
ne
s
Other
Soils
Metallic wastes, mixed ferrous and
non-ferrous
Plastic wastes
Wood wastes
Mineral waste from construction and
demolition
Glass wastes
Paper and cardboard wastes
11
Table 7. Scottish Household waste recycled or reused by material 2011-2019 (tonnes)
Year
Paper and cardboard
wastes Glass
wastes
Mineral waste from
construction and
demolition Wood
wastes Plastic wastes
Metallic wastes,
mixed ferrous
and non-
ferrous Soils Other Total
2011 240,346 94,903 101,810 89,468 29,299 35,281 22,525 84,272 697,904
2012 231,776 96,658 96,701 93,857 34,528 39,082 21,465 71,581 685,648
2013 227,899 99,973 84,907 98,688 38,097 38,313 17,218 64,661 669,756
2014 226,463 100,580 93,290 94,800 39,525 39,316 17,756 72,470 684,201
2015 222,403 102,033 97,158 93,072 41,285 45,025 17,743 84,434 703,152
2016 227,921 106,548 102,974 97,672 48,422 50,935 17,585 69,124 721,181
2017 225,495 104,679 94,037 93,940 51,833 50,275 21,307 63,805 705,370
2018 209,120 107,380 86,984 94,877 56,586 45,796 25,885 65,334 691,962
2019 192,562 106,637 86,622 87,753 57,379 48,162 32,473 70,117 681,704
Figure 6 Scottish Paper and cardboard wastes recycled or reused by WasteDataFlow categories (tonnes) 2013-2019
0
20,000
40,000
60,000
80,000
100,000
120,000
2013 2014 2015 2016 2017 2018 2019
Paper
Cardboard
Mixed paper & cardboard
Notes:
Recycled includes waste recycled or reused and waste composted.
Paper includes the WasteDataFlow category of Books
Data series starts with 2013 as the data source of WasteDataFlow question 100 started in 2013.
In 2019 there was an increase of 1 thousand tonnes (1%) of Plastic wastes
recycled. Recycling of Plastic wastes has increased each year for the last
eight years. This increase has been attributed to a variety of sources by local
authorities, ranging from changes in waste recycling collections to increased
awareness of consumers.
12
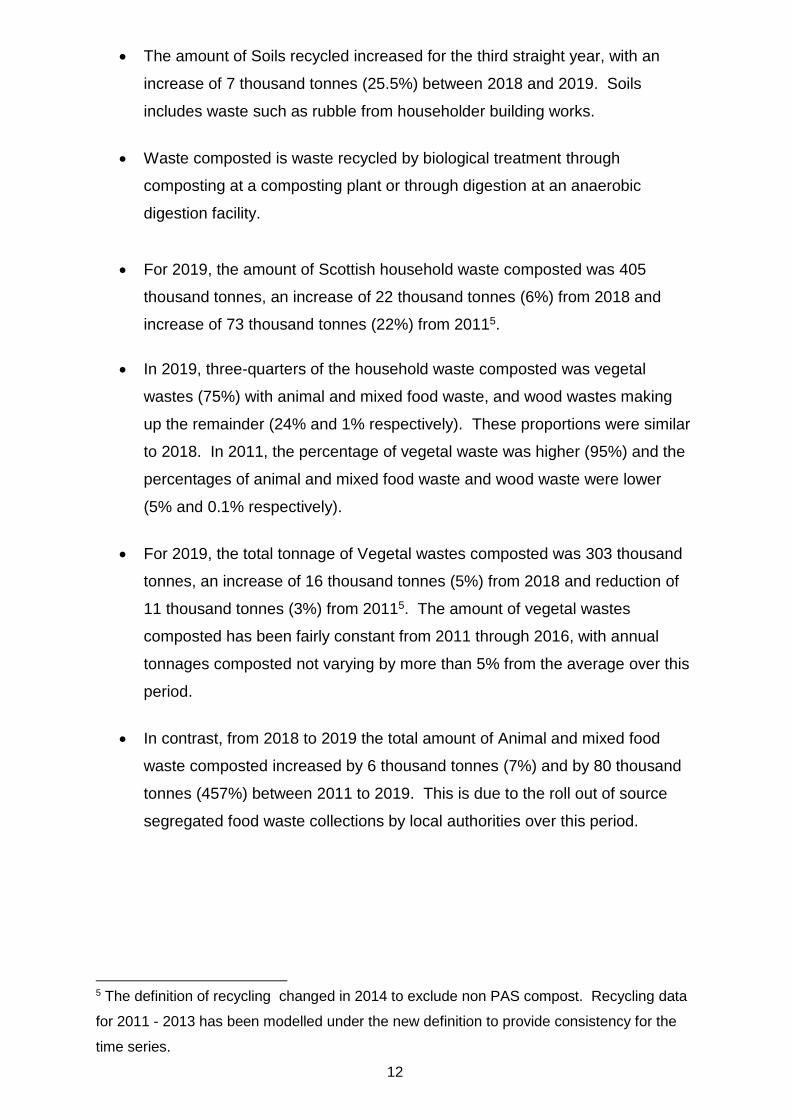
The amount of Soils recycled increased for the third straight year, with an
increase of 7 thousand tonnes (25.5%) between 2018 and 2019. Soils
includes waste such as rubble from householder building works.
Waste composted is waste recycled by biological treatment through
composting at a composting plant or through digestion at an anaerobic
digestion facility.
For 2019, the amount of Scottish household waste composted was 405
thousand tonnes, an increase of 22 thousand tonnes (6%) from 2018 and
increase of 73 thousand tonnes (22%) from 20115.
In 2019, three-quarters of the household waste composted was vegetal
wastes (75%) with animal and mixed food waste, and wood wastes making
up the remainder (24% and 1% respectively). These proportions were similar
to 2018. In 2011, the percentage of vegetal waste was higher (95%) and the
percentages of animal and mixed food waste and wood waste were lower
(5% and 0.1% respectively).
For 2019, the total tonnage of Vegetal wastes composted was 303 thousand
tonnes, an increase of 16 thousand tonnes (5%) from 2018 and reduction of
11 thousand tonnes (3%) from 20115. The amount of vegetal wastes
composted has been fairly constant from 2011 through 2016, with annual
tonnages composted not varying by more than 5% from the average over this
period.
In contrast, from 2018 to 2019 the total amount of Animal and mixed food
waste composted increased by 6 thousand tonnes (7%) and by 80 thousand
tonnes (457%) between 2011 to 2019. This is due to the roll out of source
segregated food waste collections by local authorities over this period.
5 The definition of recycling changed in 2014 to exclude non PAS compost. Recycling data
for 2011 - 2013 has been modelled under the new definition to provide consistency for the
time series.
13
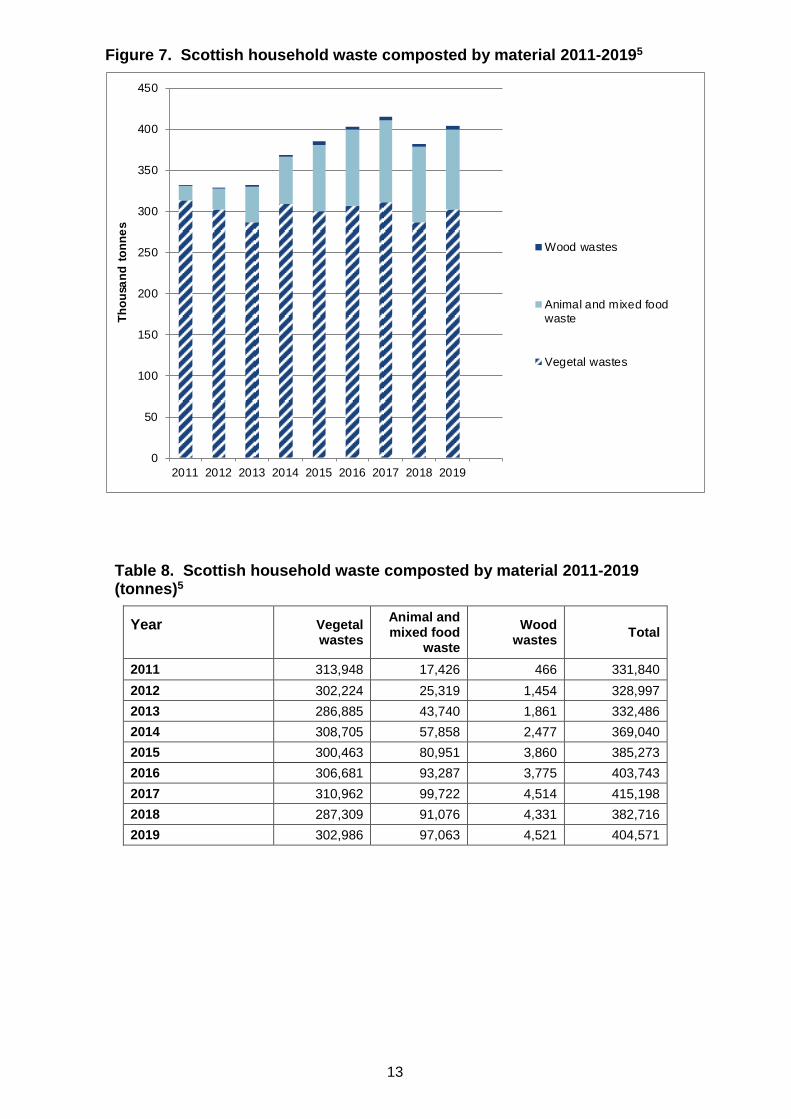
Figure 7. Scottish household waste composted by material 2011-20195
0
50
100
150
200
250
300
350
400
450
2011 2012 2013 2014 2015 2016 2017 2018 2019
Th
ou
san
d t
on
ne
s
Wood wastes
Animal and mixed food
waste
Vegetal wastes
Table 8. Scottish household waste composted by material 2011-2019 (tonnes)5
Year Vegetal wastes
Animal and mixed food
waste
Wood wastes
Total
2011 313,948 17,426 466 331,840
2012 302,224 25,319 1,454 328,997
2013 286,885 43,740 1,861 332,486
2014 308,705 57,858 2,477 369,040
2015 300,463 80,951 3,860 385,273
2016 306,681 93,287 3,775 403,743
2017 310,962 99,722 4,514 415,198
2018 287,309 91,076 4,331 382,716
2019 302,986 97,063 4,521 404,571
14
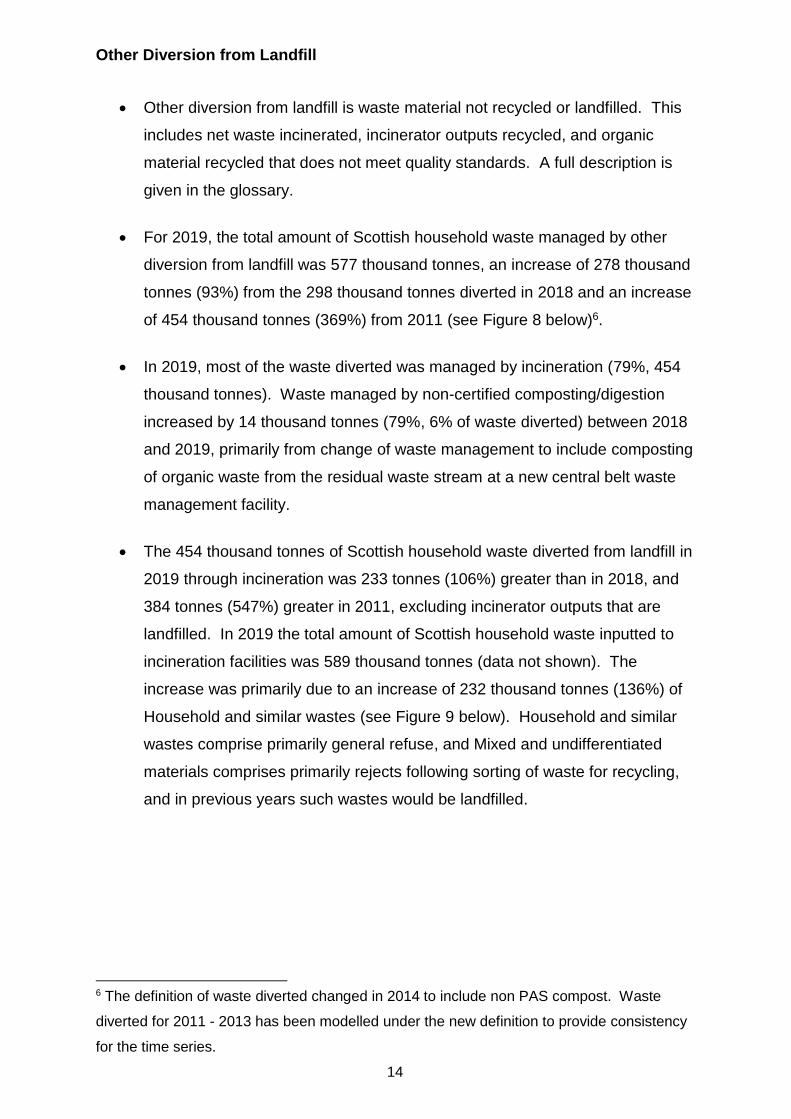
Other Diversion from Landfill
Other diversion from landfill is waste material not recycled or landfilled. This
includes net waste incinerated, incinerator outputs recycled, and organic
material recycled that does not meet quality standards. A full description is
given in the glossary.
For 2019, the total amount of Scottish household waste managed by other
diversion from landfill was 577 thousand tonnes, an increase of 278 thousand
tonnes (93%) from the 298 thousand tonnes diverted in 2018 and an increase
of 454 thousand tonnes (369%) from 2011 (see Figure 8 below)6.
In 2019, most of the waste diverted was managed by incineration (79%, 454
thousand tonnes). Waste managed by non-certified composting/digestion
increased by 14 thousand tonnes (79%, 6% of waste diverted) between 2018
and 2019, primarily from change of waste management to include composting
of organic waste from the residual waste stream at a new central belt waste
management facility.
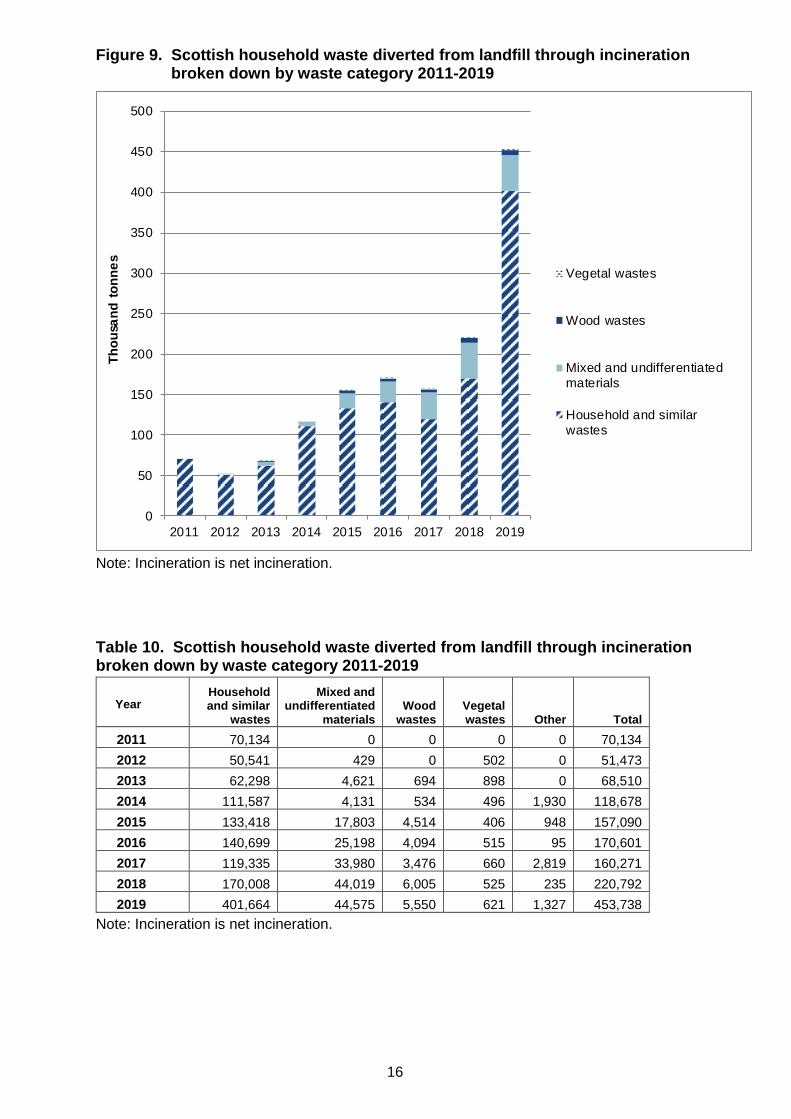
The 454 thousand tonnes of Scottish household waste diverted from landfill in
2019 through incineration was 233 tonnes (106%) greater than in 2018, and
384 tonnes (547%) greater in 2011, excluding incinerator outputs that are
landfilled. In 2019 the total amount of Scottish household waste inputted to
incineration facilities was 589 thousand tonnes (data not shown). The
increase was primarily due to an increase of 232 thousand tonnes (136%) of
Household and similar wastes (see Figure 9 below). Household and similar
wastes comprise primarily general refuse, and Mixed and undifferentiated
materials comprises primarily rejects following sorting of waste for recycling,
and in previous years such wastes would be landfilled.
6 The definition of waste diverted changed in 2014 to include non PAS compost. Waste
diverted for 2011 - 2013 has been modelled under the new definition to provide consistency
for the time series.
15
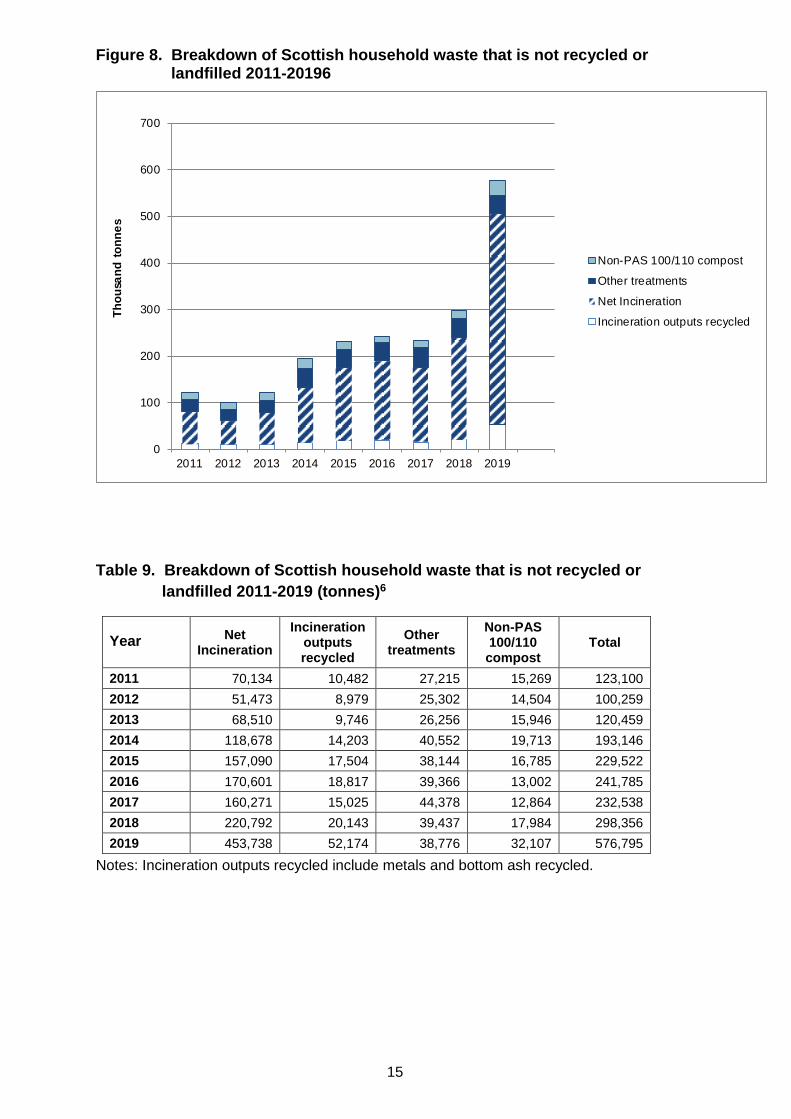
Figure 8. Breakdown of Scottish household waste that is not recycled or landfilled 2011-20196
0
100
200
300
400
500
600
700
2011 2012 2013 2014 2015 2016 2017 2018 2019
Th
ou
san
d t
on
ne
s
Non-PAS 100/110 compost
Other treatments
Net Incineration
Incineration outputs recycled
Table 9. Breakdown of Scottish household waste that is not recycled or
landfilled 2011-2019 (tonnes)6
Year Net Incineration
Incineration outputs recycled
Other treatments
Non-PAS 100/110 compost
Total
2011 70,134 10,482 27,215 15,269 123,100
2012 51,473 8,979 25,302 14,504 100,259
2013 68,510 9,746 26,256 15,946 120,459
2014 118,678 14,203 40,552 19,713 193,146
2015 157,090 17,504 38,144 16,785 229,522
2016 170,601 18,817 39,366 13,002 241,785
2017 160,271 15,025 44,378 12,864 232,538
2018 220,792 20,143 39,437 17,984 298,356
2019 453,738 52,174 38,776 32,107 576,795
Notes: Incineration outputs recycled include metals and bottom ash recycled.
16
Figure 9. Scottish household waste diverted from landfill through incineration broken down by waste category 2011-2019
0
50
100
150
200
250
300
350
400
450
500
2011 2012 2013 2014 2015 2016 2017 2018 2019
Th
ou
san
d t
on
ne
s
Vegetal wastes
Wood wastes
Mixed and undifferentiated
materials
Household and similar
wastes
Note: Incineration is net incineration.
Table 10. Scottish household waste diverted from landfill through incineration broken down by waste category 2011-2019
Year Household and similar
wastes
Mixed and undifferentiated
materials Wood
wastes Vegetal wastes Other Total
2011 70,134 0 0 0 0 70,134
2012 50,541 429 0 502 0 51,473
2013 62,298 4,621 694 898 0 68,510
2014 111,587 4,131 534 496 1,930 118,678
2015 133,418 17,803 4,514 406 948 157,090
2016 140,699 25,198 4,094 515 95 170,601
2017 119,335 33,980 3,476 660 2,819 160,271
2018 170,008 44,019 6,005 525 235 220,792
2019 401,664 44,575 5,550 621 1,327 453,738
Note: Incineration is net incineration.
17
Waste Landfilled
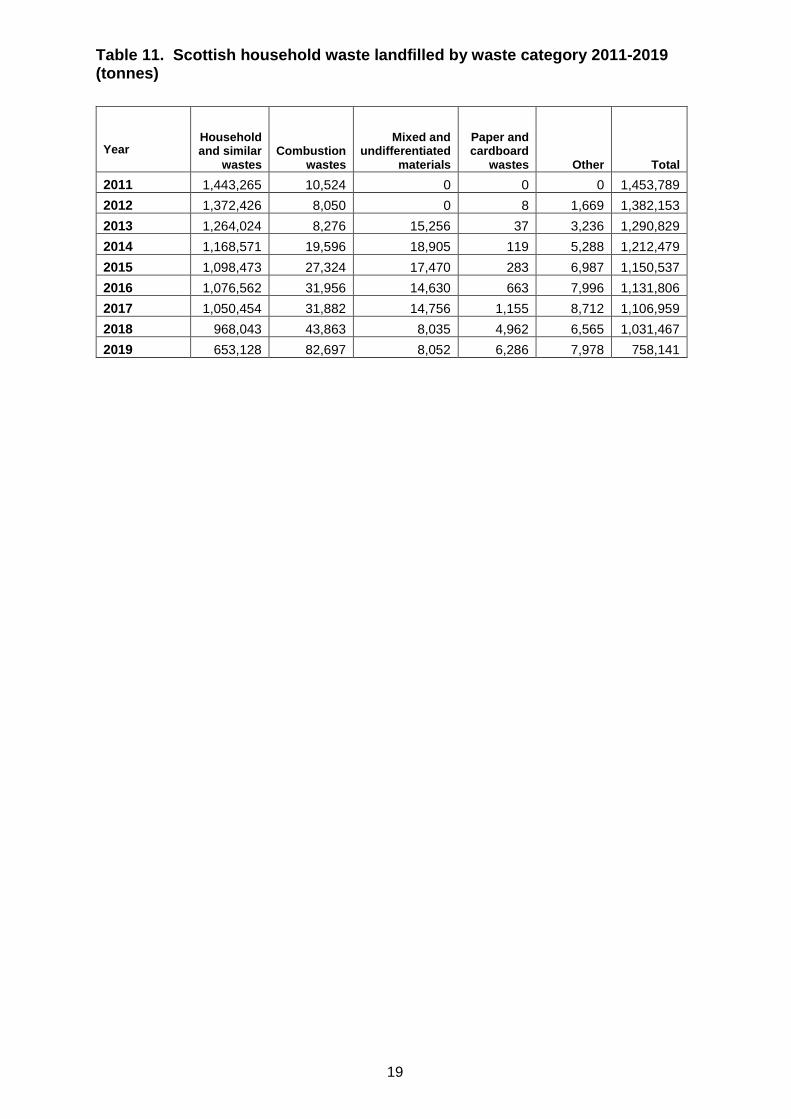
The amount of household waste landfilled in 2019 was 0.76 million tonnes, a
reduction of 273 thousand tonnes (26%) from 2018, and a reduction of 696
thousand tonnes (48%) from 2011. This is the eighth consecutive decrease
in household waste landfilled. This decrease is primarily due to more waste
being diverted from landfill to incineration and in part less waste being
generated.
For 2019, household waste landfilled as a percentage of waste generated
was 31.3%, a decrease of 11.6 percentage points from 2018 and a decrease
of 24.5 percentage points from 2011.
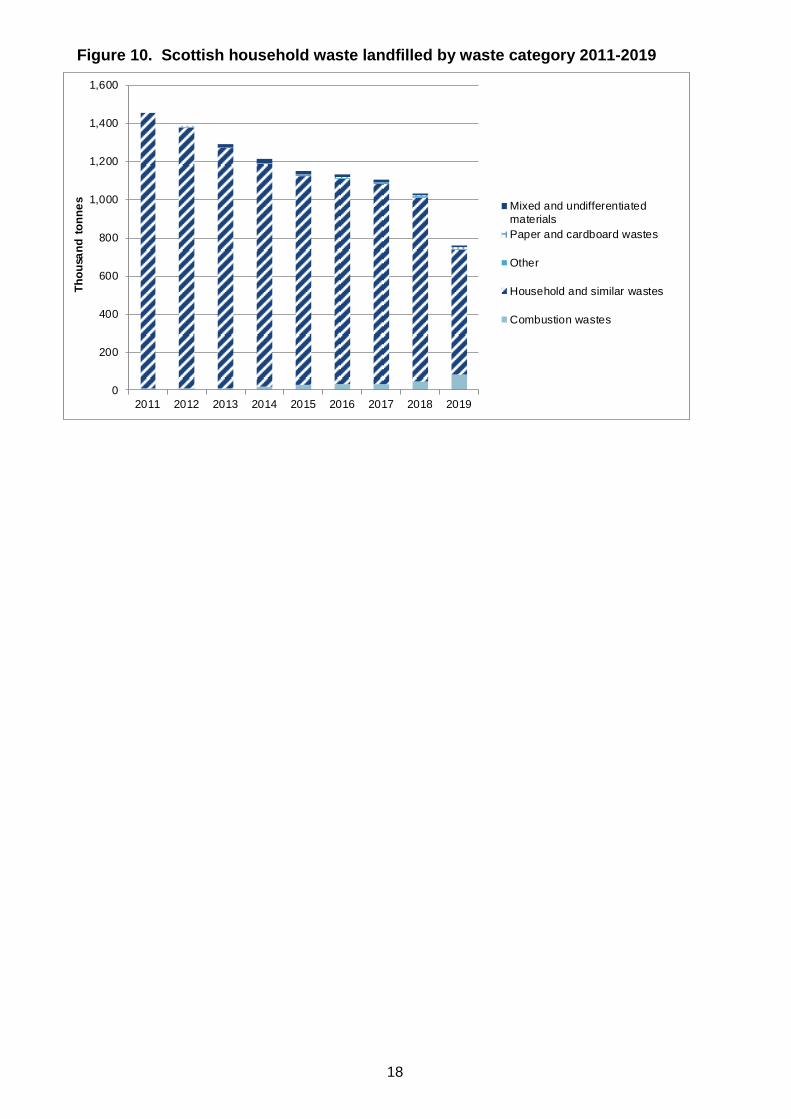
In 2019, 86% (0.65 million tonnes) of the total household waste landfilled
comprised Household and similar wastes (see Figure 10 below). Combustion
wastes comprised just over ten percent (11%, 83 thousand tonnes) of waste
landfilled in 2019, an increase of 39 thousand tonnes (89%) from 2018 and
increase of 72 thousand tonnes (686%) from 2011. The increase in landfilling
of Combustion wastes is consistent with the increase in incineration over the
same period.
18
Figure 10. Scottish household waste landfilled by waste category 2011-2019
0
200
400
600
800
1,000
1,200
1,400
1,600
2011 2012 2013 2014 2015 2016 2017 2018 2019
Th
ou
san
d t
on
ne
s
Mixed and undifferentiated
materials
Paper and cardboard wastes
Other
Household and similar wastes
Combustion wastes
19
Table 11. Scottish household waste landfilled by waste category 2011-2019 (tonnes)
Year Household and similar
wastes Combustion
wastes
Mixed and undifferentiated
materials
Paper and cardboard
wastes Other Total
2011 1,443,265 10,524 0 0 0 1,453,789
2012 1,372,426 8,050 0 8 1,669 1,382,153
2013 1,264,024 8,276 15,256 37 3,236 1,290,829
2014 1,168,571 19,596 18,905 119 5,288 1,212,479
2015 1,098,473 27,324 17,470 283 6,987 1,150,537
2016 1,076,562 31,956 14,630 663 7,996 1,131,806
2017 1,050,454 31,882 14,756 1,155 8,712 1,106,959
2018 968,043 43,863 8,035 4,962 6,565 1,031,467
2019 653,128 82,697 8,052 6,286 7,978 758,141
20
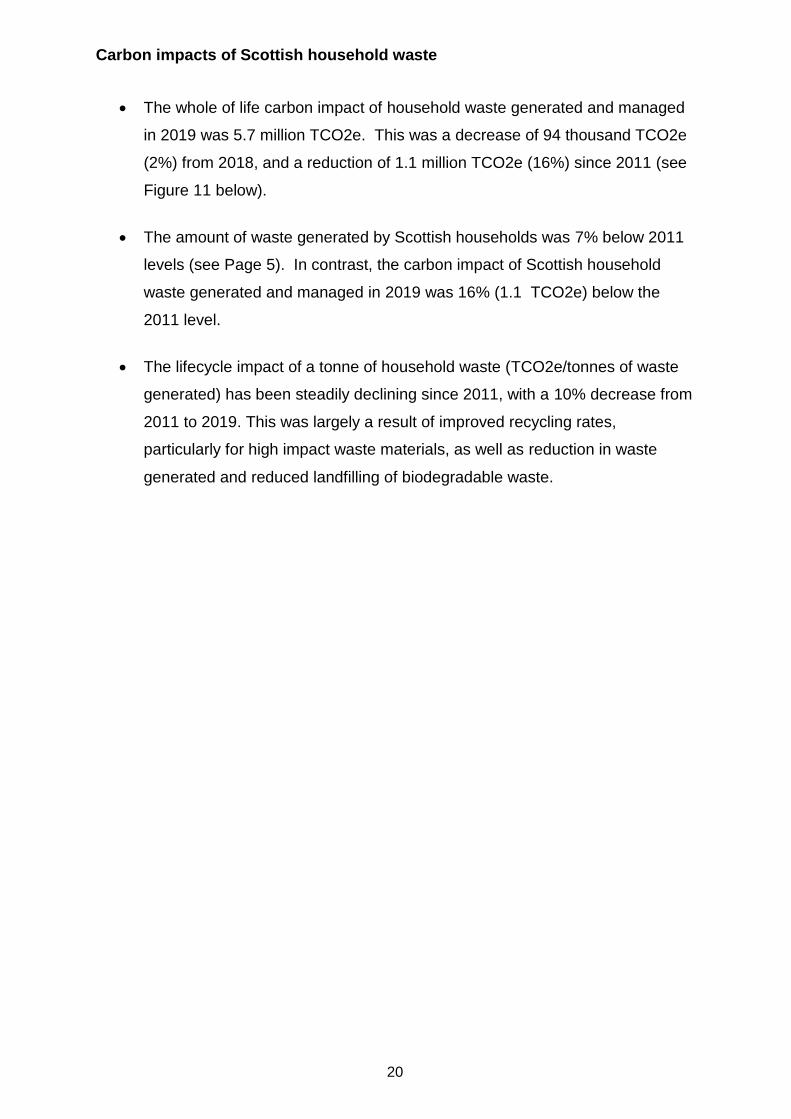
Carbon impacts of Scottish household waste
The whole of life carbon impact of household waste generated and managed
in 2019 was 5.7 million TCO2e. This was a decrease of 94 thousand TCO2e
(2%) from 2018, and a reduction of 1.1 million TCO2e (16%) since 2011 (see
Figure 11 below).
The amount of waste generated by Scottish households was 7% below 2011
levels (see Page 5). In contrast, the carbon impact of Scottish household
waste generated and managed in 2019 was 16% (1.1 TCO2e) below the
2011 level.
The lifecycle impact of a tonne of household waste (TCO2e/tonnes of waste
generated) has been steadily declining since 2011, with a 10% decrease from
2011 to 2019. This was largely a result of improved recycling rates,
particularly for high impact waste materials, as well as reduction in waste
generated and reduced landfilling of biodegradable waste.
21
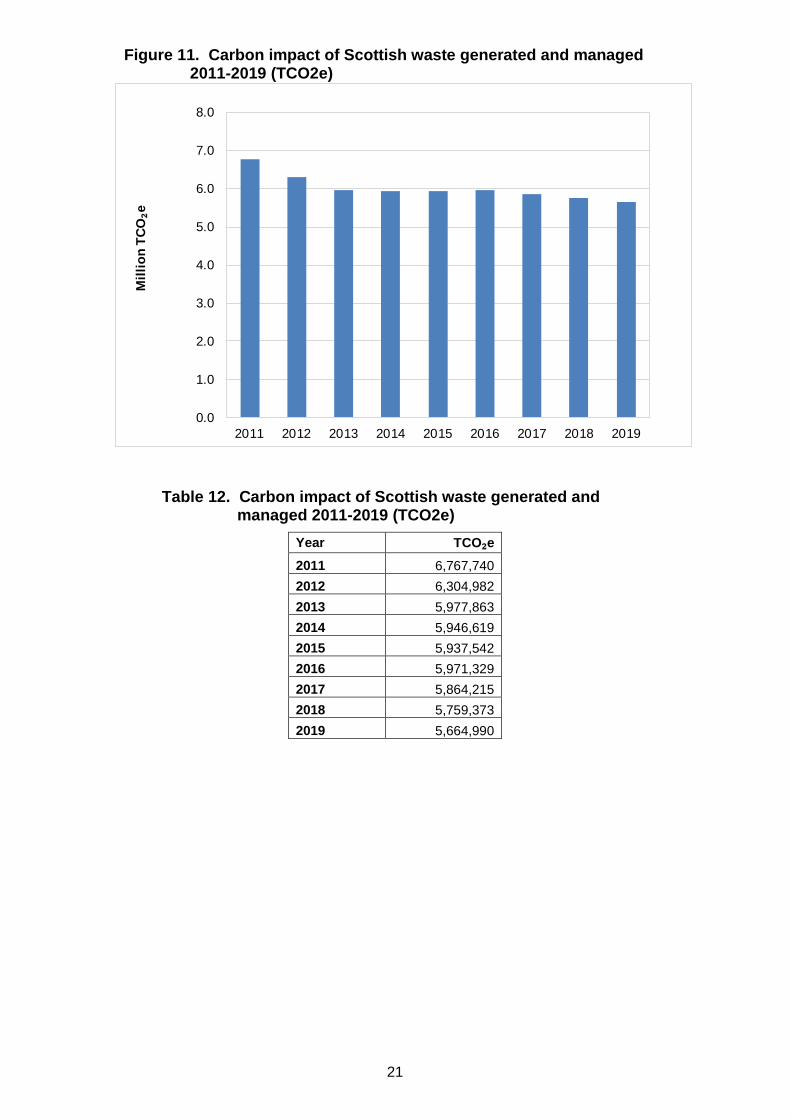
Figure 11. Carbon impact of Scottish waste generated and managed 2011-2019 (TCO2e)
0.0
1.0
2.0
3.0
4.0
5.0
6.0
7.0
8.0
2011 2012 2013 2014 2015 2016 2017 2018 2019
Mil
lio
n T
CO₂e
Table 12. Carbon impact of Scottish waste generated and managed 2011-2019 (TCO2e)
Year TCO₂e
2011 6,767,740
2012 6,304,982
2013 5,977,863
2014 5,946,619
2015 5,937,542
2016 5,971,329
2017 5,864,215
2018 5,759,373
2019 5,664,990
22
DATA USES, FEEDBACK, REVISIONS POLICY, METHODOLOGY, GLOSSARY
OF TERMS AND MEASURES, AND REFERENCES
User Statement
Data on Scottish household waste generation and management are collected to
support policy development and monitor policy effectiveness, particularly the
commitments in Making Things Last - A Circular Economy Strategy for Scotland.
The data are also used to meet legislative reporting targets on recycling as set out in
the Waste Framework Directive (2008/98/EC), and in the Commission Decision
establishing rules and calculation methods for verifying compliance with the targets
set in the Waste Framework Directive (2011/753/EU) and used to fulfil the reporting
requirements of the Waste Statistics Regulation (2002/2150/EC). The data are also
used extensively by local and central government, the waste industry, researchers
and the general public.
Feedback
We welcome feedback on the data from all users including how and why the data
are used. This helps us to understand the value of the statistics to external users.
Please see our contact details at the bottom of the first page of this notice or e-mail:
Revisions Policy
SEPA will provide information about any revisions made to published information in
this statistics release and the associated datasets. Revisions could occur for various
reasons, including when data from third parties is unavailable or provisional at the
time of publishing or if there are subsequent methodological improvements or
refinements.
The figures are accurate at the time of publication. However, the data may be
updated if further revisions are necessary. Normally these revisions will be published
concurrent with the next official release.
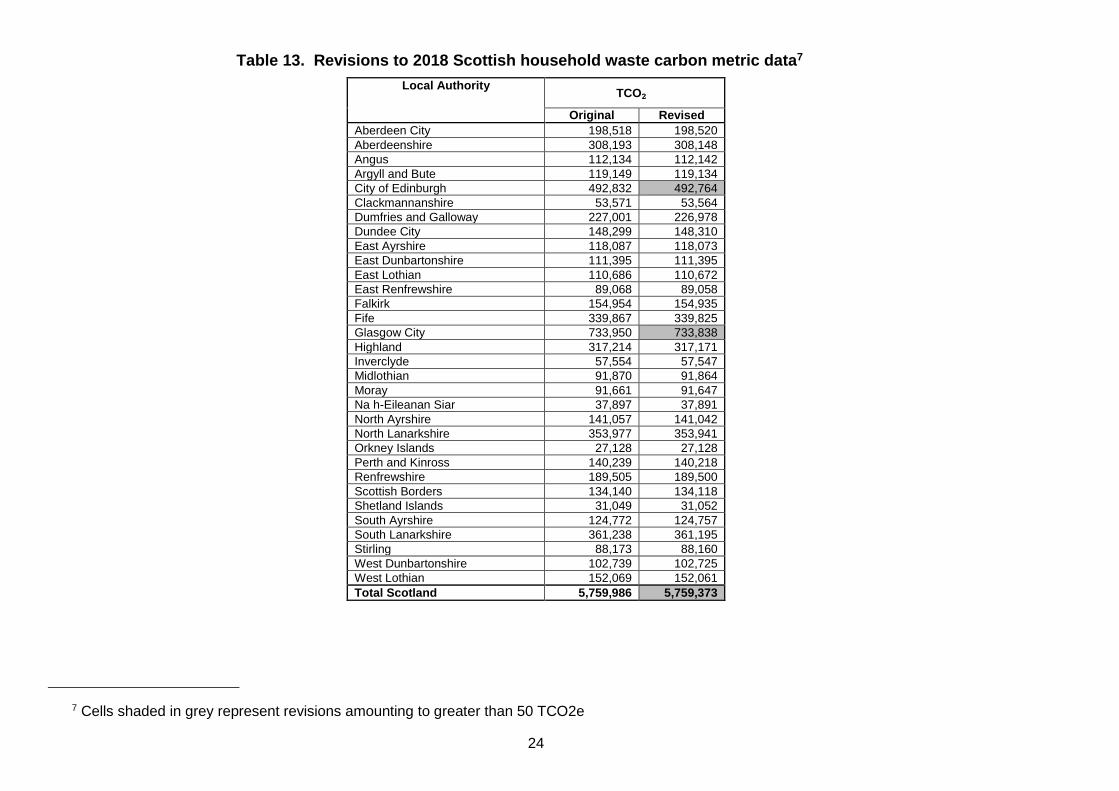
There were no revisions to 2018 local authority waste generated or managed data
since the last publication. There have been revisions to the 2018 carbon metric (see
23
Table 13 below). The revision is due to a minor update to the waste composition
data which is used to estimate the carbon metric. For further details on the carbon
metric methodology, refer to the Household waste quality report on SEPA’s web site.
24
Table 13. Revisions to 2018 Scottish household waste carbon metric data7
Local Authority TCO₂e
Original Revised
Aberdeen City 198,518 198,520
Aberdeenshire 308,193 308,148
Angus 112,134 112,142
Argyll and Bute 119,149 119,134
City of Edinburgh 492,832 492,764
Clackmannanshire 53,571 53,564
Dumfries and Galloway 227,001 226,978
Dundee City 148,299 148,310
East Ayrshire 118,087 118,073
East Dunbartonshire 111,395 111,395
East Lothian 110,686 110,672
East Renfrewshire 89,068 89,058
Falkirk 154,954 154,935
Fife 339,867 339,825
Glasgow City 733,950 733,838
Highland 317,214 317,171
Inverclyde 57,554 57,547
Midlothian 91,870 91,864
Moray 91,661 91,647
Na h-Eileanan Siar 37,897 37,891
North Ayrshire 141,057 141,042
North Lanarkshire 353,977 353,941
Orkney Islands 27,128 27,128
Perth and Kinross 140,239 140,218
Renfrewshire 189,505 189,500
Scottish Borders 134,140 134,118
Shetland Islands 31,049 31,052
South Ayrshire 124,772 124,757
South Lanarkshire 361,238 361,195
Stirling 88,173 88,160
West Dunbartonshire 102,739 102,725
West Lothian 152,069 152,061
Total Scotland 5,759,986 5,759,373
7 Cells shaded in grey represent revisions amounting to greater than 50 TCO2e
25
Methodology
Data was submitted by all 32 Scottish local authorities using the web-based
reporting tool WasteDataFlow.
From 2014, composted wastes that did not reach the quality standards set by PAS
100/110 were accounted for as other wastes diverted from landfill and not as wastes
composted, except where waste was processed at a new composting or anaerobic
digestion site and the site indicated they had applied for and were working toward
PAS compliance, in which case a 12-month grace period was applied for the
purpose of including of wastes composted in household recycling data. In 2019
there were no new sites that met this criterion.
As we move further away from the old composting measure, it becomes less
important and a back series is helpful for understanding changes over a long period
of time. For 2011 – 2013 the waste that met the PAS 100/110 standard was
modelled to produce a back series. For each authority, the proportion of waste that
was sent to a PAS 100/110 facility on average in 2014-2015 was applied to the
waste sent for composting for each of the years 2011, 2012 and 2013. For example,
if an authority sent 60% of its waste to a PAS 100/110 facility in 2014-15, then for
the back series years of 2011, 2012 and 2013, 60% of waste sent for composting
were counted as recycled. The non PAS 100/110 tonnes were allocated to the
“Other Diversion” category.
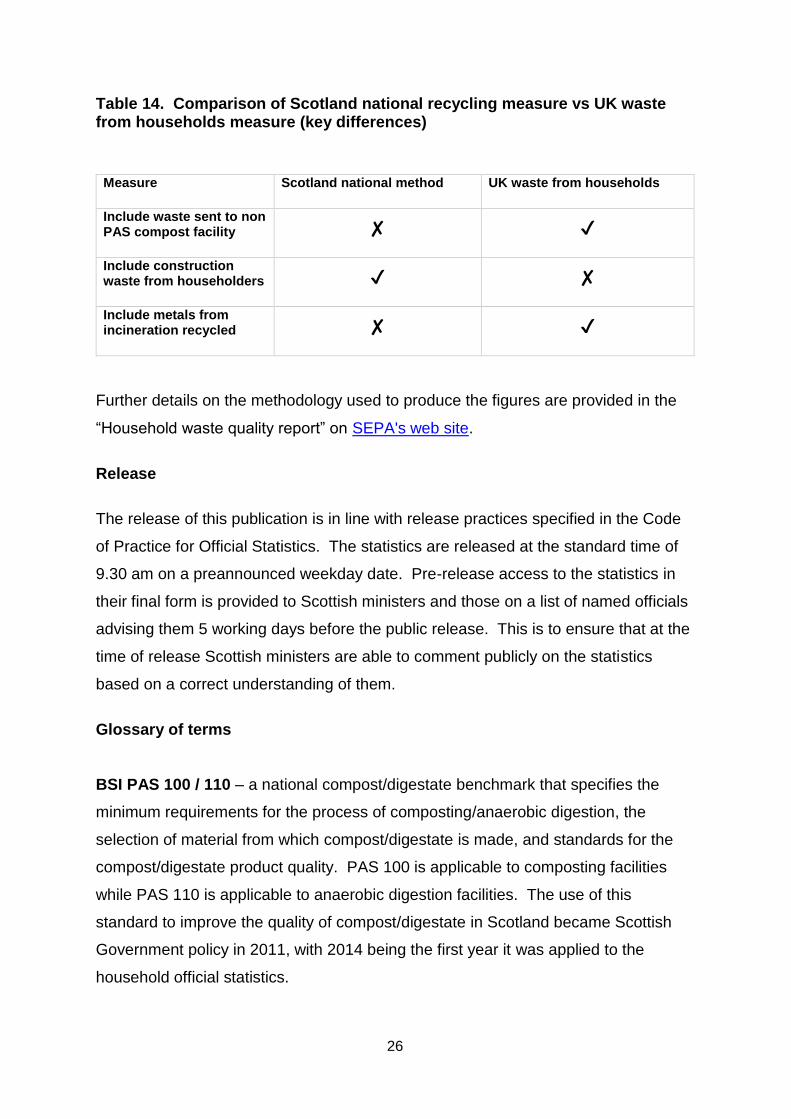
Recycling figures are calculated according to Scotland’s national recycling rate
methodology. The methodology differs to the Waste from households measure
published by Defra in its UK Statistics on waste publication. The differences are
summarised in Table 14 below.
26
Table 14. Comparison of Scotland national recycling measure vs UK waste from households measure (key differences)
Measure Scotland national method UK waste from households
Include waste sent to non PAS compost facility ✘ ✔
Include construction waste from householders ✔ ✘
Include metals from incineration recycled ✘ ✔
Further details on the methodology used to produce the figures are provided in the
“Household waste quality report” on SEPA's web site.
Release
The release of this publication is in line with release practices specified in the Code
of Practice for Official Statistics. The statistics are released at the standard time of
9.30 am on a preannounced weekday date. Pre-release access to the statistics in
their final form is provided to Scottish ministers and those on a list of named officials
advising them 5 working days before the public release. This is to ensure that at the
time of release Scottish ministers are able to comment publicly on the statistics
based on a correct understanding of them.
Glossary of terms
BSI PAS 100 / 110 – a national compost/digestate benchmark that specifies the
minimum requirements for the process of composting/anaerobic digestion, the
selection of material from which compost/digestate is made, and standards for the
compost/digestate product quality. PAS 100 is applicable to composting facilities
while PAS 110 is applicable to anaerobic digestion facilities. The use of this
standard to improve the quality of compost/digestate in Scotland became Scottish
Government policy in 2011, with 2014 being the first year it was applied to the
household official statistics.
27
Carbon Impact – a measure of the whole-life carbon impacts of waste, from
resource extraction and manufacturing emissions, right through to waste
management emissions, regardless of where in the world these impacts occur. The
carbon impact of waste was developed by Zero Waste Scotland
(https://www.zerowastescotland.org.uk/content/what-carbon-metric).
Compost like output (CLO) – partially digested waste outputs generated from the
biological treatment of residual municipal solid wastes at a process that involves
both mechanical and biological treatment. Outputs typically do not conform to
composting standards such as PAS 100/110.
Household waste – waste generated by households (see full definition in
Paragraph 1.2 of the Zero Waste Plan - guidance for local authorities on the
WasteDataFlow web site).
Landfill rate – waste landfilled as a percentage of all waste generated. Note that
total waste generated does not equal total waste managed due to stockpiled waste,
which is counted in the generation figures and will be included in the managed
figures in the year it is sent to final management.
Other diversion from landfill – describes the fate of waste material not recycled or
landfilled. It includes:
household waste treated by incineration, including any incinerator bottom ash
and metals from bottom ash that are diverted from landfill,
weight loss that occurs during the composting/digestion of waste to PAS
100/110 and non PAS 100/110 compost/digestate where the output is
landfilled,
CLO that is not landfilled,
weight loss that occurs during mechanical and biological treatment processes
(e.g. production of CLO and RDF),
from 2014, any waste composted/digested that has not reached the quality
standards set by PAS 100/110 and is not landfilled.
28
Recycling rate – waste recycled as a percentage of all waste generated. Note that
total waste generated does not equal total waste managed due to stockpiled waste,
which is counted in the generation figures and will be included in the managed
figures in the year it is sent to final management.
Refuse derived fuel (RDF) – waste separated from residual municipal solid waste
with a calorific value suitable for use as a fuel in combustion processes.
TCO2e – tonnes of carbon dioxide equivalent, which is a measure that allows the
comparison of greenhouse gases relative to one unit of CO2.
Waste composted - is waste recycled by biological treatment through composting
at a composting plant or through digestion at an anaerobic digestion facility.
Waste generated - is waste collected by or on behalf of local authorities that is
managed within the relevant reporting year. This might include treated waste
stockpiled prior to final management.
Waste landfilled – includes all household waste that is disposed of at a landfill site
instead of being recycled or diverted from landfill through other methods. It also
includes incinerator ash that is landfilled, plus any recycling and composting rejects
that occur during collection, sorting or further treatment that go to landfill.
Waste managed - includes all wastes recycled, diverted from landfill and landfilled
within the relevant reporting year. This includes stockpiled waste from a previous
year sent to final management but excludes treated waste stockpiled prior to final
management.
Waste recycled - includes recyclable materials that have been recycled or reused
and also biodegradable materials that have been composted or digested. The
amount of waste recycled, reused and composted is that accepted by the
reprocessor facility. As such it excludes any recycling rejects that occur during
collection, sorting or further treatment. From 2015, the composting figures using the
29
new calculation methodology do not include any waste composted that has not
reached the quality standards set by PAS 100/110.