Embed Size (px)
Citation preview
ISBN : 1363-5859
Fisheries Research Services
Fisheries Research Services is an agency of the Scottish Executive
FRS Marine Laboratory PO Box 101 375 Victoria Road Aberdeen AB11 9DB UK
tel +44 (0)1224 876544 fax +44 (0)1224 295620/295511
[email protected] http://www.frs-scotland.gov.uk © Crown copyright 2004
Scottish Fish FarmsAnnual Production Survey, 2003
SCOTTISH EXECUTIVEEnvironment and Rural Affairs Department
SCOTTISH FISH FARMS Annual Production Survey 2003 This report was prepared for the Scottish Executive by FRS Marine Laboratory FRS Marine Laboratory is a division of Fisheries Research Services, an agency of the Scottish Executive
Foreword The annual production survey of fish farms in Scotland for 2003 was carried out by Fisheries Research Services (FRS), an agency of the Scottish Executive Environment and Rural Affairs Department (SEERAD). This survey collates annual production data from registered Scottish fish farm sites. Surveys conducted by producer or consumer organisations may be collected annually or by quarter. These are produced independently of FRS and may not be directly comparable. Responses to questionnaires (detailed in Appendix 1 (a-d)) from Scottish fish farming companies covering the period 1 January - 31 December 2003 are summarised in this survey. The survey is structured to allow readers to follow industry trends within the trout, salmon and other farmed species sectors, in addition to providing information on production in 2003. Where available, statistics are given for the 13-year period 1991-2003. Data from previous years have been reassessed and updated where necessary. To allow direct comparison with data provided in previous surveys, production information by region is presented in SEERAD defined areas. The publication of this survey has been delayed due to an initial comparison of 2003 production totals with those of another public body which indicated anomalies at both regional and company levels. In the interests of accuracy SEERAD identified a number of questionnaires that required an independent audit. All anomalies were resolved but this process has taken a number of months to complete. The co-operation of the fish farming industry in completing the questionnaires is gratefully acknowledged. T S Hastings R J Smith December 2005
Table of Contents SUMMARY .............................................................................................................................. 1 1. RAINBOW TROUT (Oncorhynchus mykiss) ................................................................................. 3 Table 1a Total Production (tonnes) of Rainbow Trout during 1991-2003 .................................... 3 Table 1b Production (tonnes) for the Table Trade during 1994-2003 according to
Weight Category........................................................................................................... 3 Table 1c Production (tonnes) for the Restocking Trade during 1994-2003 according to
Weight Category .......................................................................................................... 4 Table 2 Numbers of Sites Grouped by Tonnage Produced during 1994-2003 .......................... 4 Table 3 Grouping of Rainbow Trout Sites by Production Tonnages, Main Method
of Production in 2003 and Comparison with Production in 2002 ................................. 5 Table 4 Number of Companies and Sites in Production during 1991-2003 .............................. 5 Table 5 Number of Staff Employed and Productivity Per Person during 1991-2003.. ................ 6 Table 6 Production and Staffing by Area in 2003 ..................................................................... 6 Figure 1 The Distribution of Active Rainbow Trout Sites 2003 .................................................... 7 Table 7 Number (000s) and Proportion (%) of Ova Types Laid Down to Hatch
during 1993-2003 ....................................................................................................... 8 Table 8 Number (000s) and Sources of Ova Laid Down to Hatch 1993-2003 ........................... 8 Table 9a Number (000s) and Sources of Ova Imported into Scotland during 1996-2003............ 9 Table 9b Seasonal Variation in Numbers (000s) and Sources of Ova Imported
into Scotland during 2003 ........................................................................................... 9 Table 10 Number (000s) of Fry and Fingerlings Traded during 1993-2003 ................................. 10 Table 11 Number of Sites Rearing Fish Vaccinated Against Enteric Redmouth
Disease (ERM) during 1992-2003 ................................................................................ 10 2. ATLANTIC SALMON (Salmo salar) - OVA AND SMOLTS ............................................................... 11 Table 12 Number of Companies and Sites in Production during 1995-2003 .............................. 11 Table 13 Number (000s) of Smolts Produced, Staff Employed and Smolt
Productivity during 1993-2003 .................................................................................... 11 Table 14 Number of Smolts (000s) Produced by Type during 1993-2003 .................................. 12 Table 15 Number and Capacity of Production Systems during 1999-2003 ................................. 12 Table 16 Number (000s) of Smolts Produced and Stocking Densities by Production
System during 1999-2003 .......................................................................................... 13 Table 17 Number (000s) of Salmon Ova Produced during 1996-2003 ........................................ 13 Table 18 Source, Number (000s) and previous year�s estimate of Ova Laid Down to Hatch during 1993-2004.............................................................................................. 13 Table 19 Actual and Projected Smolt Production and Smolts put to Sea (Millions)
during 1994-2005 ....................................................................................................... 14 Table 20 Smolt Producing Sites Grouped by Numbers (000s) of Smolts Produced
during 1991-2003........................................................................................................ 14 Table 21 Staffing and Ova Laid Down to Hatch 2002-2003, Smolt Production 2002-2003 and Projected Production 2004-2005 by Region........................................ 15 Figure 2 The Distribution of Active Smolt Sites 2003 ................................................................. 16 Table 22a Source and Number (000s) of Ova, Parr and Smolts Imported during 1993-2003 derived from Import Licences..................................................................... 17
Table 22b Destination and Number (000s) of Salmon Ova Exported during 1994-2003 derived from Export Certificates................................................................. 17 Table 23 Number of Sites Using Vaccines 1995-2003 and Number (million) of Fish
Vaccinated during 1995-2003 ..................................................................................... 18 3. ATLANTIC SALMON PRODUCTION .............................................................................................. 19 Table 24 Annual Production of Atlantic Salmon (Tonnes) During 1986-2003 and
Projected Production in 2004 ...................................................................................... 19 Table 25 Number (000s) and Production (Tonnes) of Salmon Harvested and Mean
Fish Weight (Kg) per Year Class during 1994-2003 ...................................................... 20 Table 26 Number (000s) and Production (Tonnes) of Grilse and Pre-Salmon
Harvested during 1994-2003 ....................................................................................... 21 Table 27 Percentage (By Weight) of Annual Production by Growth Stage Harvested
during 1995-2003........................................................................................................ 21 Table 28 Survival and Production in Smolt Year Classes during 1990-2003 ............................... 22 Table 29 Number (000s) and Origin of Smolts put to Sea during 1993-2003.............................. 23 Table 30 Number (000s) of Smolts put to Sea and Year Class Survival by Area
during 1992-2003........................................................................................................ 24 Figure 3 The Distribution of Active Salmon Production Sites 2003............................................. 26 Table 31 Number of Staff Employed in Salmon Production during 1993-2003............................ 27 Table 32 Production Methods, Capacity, Tonnage and Average Stocking Densities
(Kg/m³) during 2001-2003 .......................................................................................... 27 Table 33 Number of Sites Shown in Relation to their Production Grouping and
Percentage Share of Production 1994-2003 ................................................................ 28 Table 34 Number of Companies Grouped by Production (tonnes), Manpower and
Productivity (tonnes per person) during 2002-2003..................................................... 28 Table 35 Manpower and Production (tonnes) by Area 1994-2003 and Projected
Production in 2004 ...................................................................................................... 30 Table 36 Number of Companies and Sites Engaged in Salmon Production during
1993-2003 .................................................................................................................. 32 Table 37 Number of Seawater Sites Employing A Fallow Period during 1994-2003 .................................................................................................................. 32 Table 38 Number of Sites Holding Broodstock during 1992-2003 .............................................. 33 4. OTHER SPECIES ......................................................................................................................... 34 Table 39 Number of Staff Employed in Farming Other Species During 1999-2003 ..................... 34 Table 40 Number of Companies and Sites Producing Other Species and Production
of Other Species (tonnes) during 2000-2003 and Estimated Production in 2004 ....................................................................................................................... 34
Table 41 Source of Other Species� Ova Laid Down to Hatch during 2003.................................... 35 Table 42 Trade in Other Species Small Fish in 2003 .................................................................. 35 5. CONCLUSIONS .......................................................................................................................... 36 APPENDICES Appendix 1 Questionnaires Sent to Fish Farmers ............................................................................ 37 Appendix 2 Glossary and Abbreviations ......................................................................................... 46
1
SUMMARY The tables below summarise the full results from the 2003 fish farms annual production survey.
Rainbow Trout (Oncorhyncus mykiss)
2002 2003
Total production (tonnes) 6,659 7,085
Production for the table (tonnes) 5,711 6,189
Production for restocking (tonnes) 948 896
Number of staff employed 160 148
Mean productivity (tonnes/person) 41.6 47.9
Number of ova laid down to hatch (millions) 22.1 26.3
Number of ova imported (millions) 21.4 25.6
In 2003 rainbow trout production increased by 426 tonnes. Employment decreased by twelve staff members and productivity per person increased to 47.9 tonnes. There was an increase of 4.2 million ova laid down to hatch and the number of ova imported also increased.
Other Species (including Arctic charr, Salvelinus alpinus; Brown trout, Salmo trutta; Cod, Gadus morhua;
Halibut, Hippoglossus hippoglossus)
2002 2003
Total production (tonnes) 370.1 515.3
(full-time) 69 73 Number of staff employed
(part-time) 30 24
Number of ova laid down to hatch (millions) 134 141a
Number of ova imported (millions) 0 0b
a Excluding cod ova laid down to hatch from foreign sources or another GB company source. b Excluding cod ova imported.
In 2003 the production of other species increased by 145.2 tonnes. This was mainly due to the introduction of cod production (82.1 tonnes). Although overall employment decreased by two, the number of full time staff employed increased by four. There were also significant increases in the number of ova laid down to hatch, although due to the small number of companies involved, it is not possible to summarise these data without revealing the figures of individual companies.
2
Atlantic salmon (Salmo salar) Smolts
2002 2003
Number of ova produced (millions) 108 115.6
Number of ova laid down to hatch (millions) 86.7 80.7
Number of ova exported (millions) 8.2 2.2
Number of ova imported (millions) 22.6 21.2
Number of smolts produced (millions) 47.2 44.4
Number of smolts put to sea (millions) 50.1 43.8
Number of staff employed 405 373
Mean productivity (000s smolts/person) 116.4 119.1
The production of ova increased by over seven million in 2003 and the number of ova laid down to hatch decreased by almost six million. Imports of ova decreased, while there was a continued drop in ova exports. Smolt production was down by almost three million. The number of staff employed decreased by 32 and mean productivity increased. Production fish
2002 2003
Total production (tonnes) 144,589 169,736
Production of 0-year fish (tonnes) 824 276
Production of grilse (tonnes) 33,609 32,977
Production of pre-salmon (tonnes) 56,621 63,228
Production of salmon (tonnes) 53,535 73,255
Mean fish weight 0-year (kg) 3.03 3.37
Mean fish weight grilse (kg) 3.40 3.85
Mean fish weight pre-salmon (kg) 4.15 4.50
Mean fish weight salmon (kg) 4.71 4.69
Number of staff employed 1,306 1,217
Mean productivity tonnes/person 110.7 139.5
Production tonnage increased by 17.4% with an increased harvest at later stages of production. Staff numbers decreased by 89. Mean productivity showed a significant increase. The total production for 2002 has been altered compared to previous reports. This is due to data having been reassessed and updated where necessary. Smolt survival (percentage harvested)
Survival (%) Years 0+1 Year 2 Total
2000 input year class 52.0 25.1 77.1
2001 input year class 49.5 32.1 81.6
Overall smolt survival increased by 4.5% compared with the 2000 year class.
3
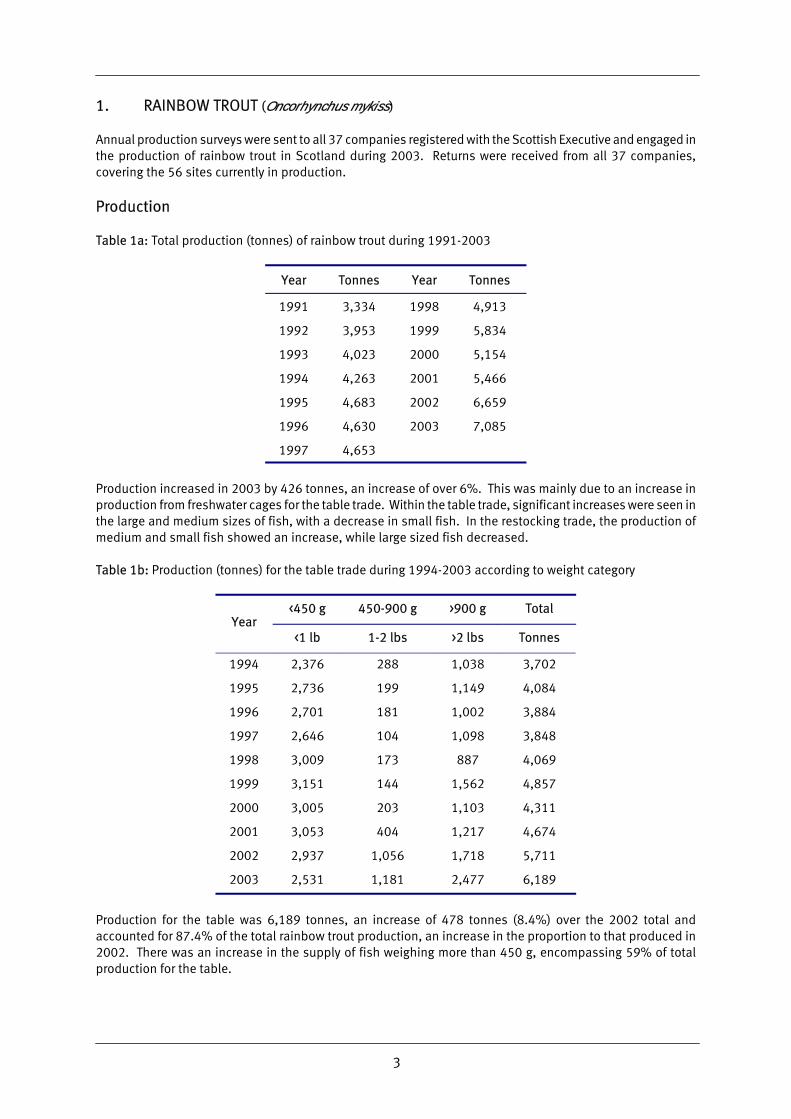
1. RAINBOW TROUT (Oncorhynchus mykiss) Annual production surveys were sent to all 37 companies registered with the Scottish Executive and engaged in the production of rainbow trout in Scotland during 2003. Returns were received from all 37 companies, covering the 56 sites currently in production.
Production Table 1a: Total production (tonnes) of rainbow trout during 1991-2003
Year Tonnes Year Tonnes
1991 3,334 1998 4,913
1992 3,953 1999 5,834
1993 4,023 2000 5,154
1994 4,263 2001 5,466
1995 4,683 2002 6,659
1996 4,630 2003 7,085
1997 4,653
Production increased in 2003 by 426 tonnes, an increase of over 6%. This was mainly due to an increase in production from freshwater cages for the table trade. Within the table trade, significant increases were seen in the large and medium sizes of fish, with a decrease in small fish. In the restocking trade, the production of medium and small fish showed an increase, while large sized fish decreased. Table 1b: Production (tonnes) for the table trade during 1994-2003 according to weight category
<450 g 450-900 g >900 g Total Year
<1 lb 1-2 lbs >2 lbs Tonnes
1994 2,376 288 1,038 3,702
1995 2,736 199 1,149 4,084
1996 2,701 181 1,002 3,884
1997 2,646 104 1,098 3,848
1998 3,009 173 887 4,069
1999 3,151 144 1,562 4,857
2000 3,005 203 1,103 4,311
2001 3,053 404 1,217 4,674
2002 2,937 1,056 1,718 5,711
2003 2,531 1,181 2,477 6,189
Production for the table was 6,189 tonnes, an increase of 478 tonnes (8.4%) over the 2002 total and accounted for 87.4% of the total rainbow trout production, an increase in the proportion to that produced in 2002. There was an increase in the supply of fish weighing more than 450 g, encompassing 59% of total production for the table.
4
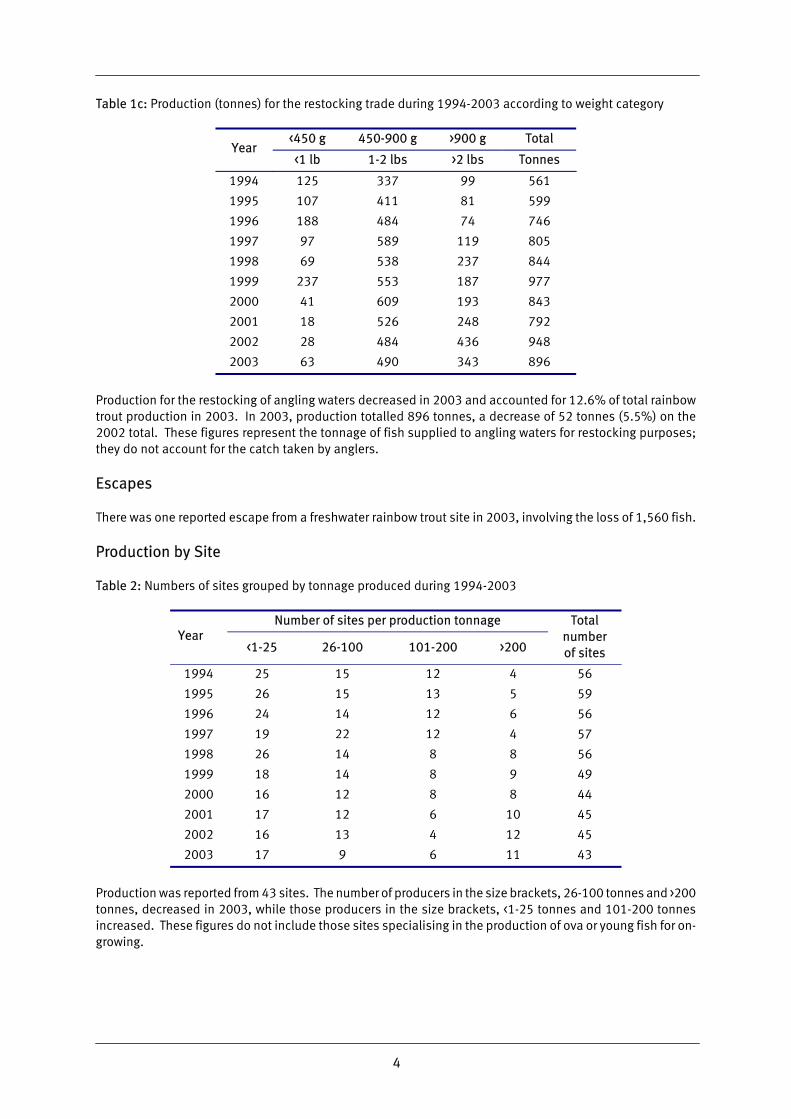
Table 1c: Production (tonnes) for the restocking trade during 1994-2003 according to weight category
<450 g 450-900 g >900 g Total Year
<1 lb 1-2 lbs >2 lbs Tonnes
1994 125 337 99 561
1995 107 411 81 599
1996 188 484 74 746
1997 97 589 119 805
1998 69 538 237 844
1999 237 553 187 977
2000 41 609 193 843
2001 18 526 248 792
2002 28 484 436 948
2003 63 490 343 896
Production for the restocking of angling waters decreased in 2003 and accounted for 12.6% of total rainbow trout production in 2003. In 2003, production totalled 896 tonnes, a decrease of 52 tonnes (5.5%) on the 2002 total. These figures represent the tonnage of fish supplied to angling waters for restocking purposes; they do not account for the catch taken by anglers.
Escapes There was one reported escape from a freshwater rainbow trout site in 2003, involving the loss of 1,560 fish.
Production by Site Table 2: Numbers of sites grouped by tonnage produced during 1994-2003
Number of sites per production tonnage Year
<1-25 26-100 101-200 >200
Total number of sites
1994 25 15 12 4 56
1995 26 15 13 5 59
1996 24 14 12 6 56
1997 19 22 12 4 57
1998 26 14 8 8 56
1999 18 14 8 9 49
2000 16 12 8 8 44
2001 17 12 6 10 45
2002 16 13 4 12 45
2003 17 9 6 11 43
Production was reported from 43 sites. The number of producers in the size brackets, 26-100 tonnes and >200 tonnes, decreased in 2003, while those producers in the size brackets, <1-25 tonnes and 101-200 tonnes increased. These figures do not include those sites specialising in the production of ova or young fish for on-growing.
5
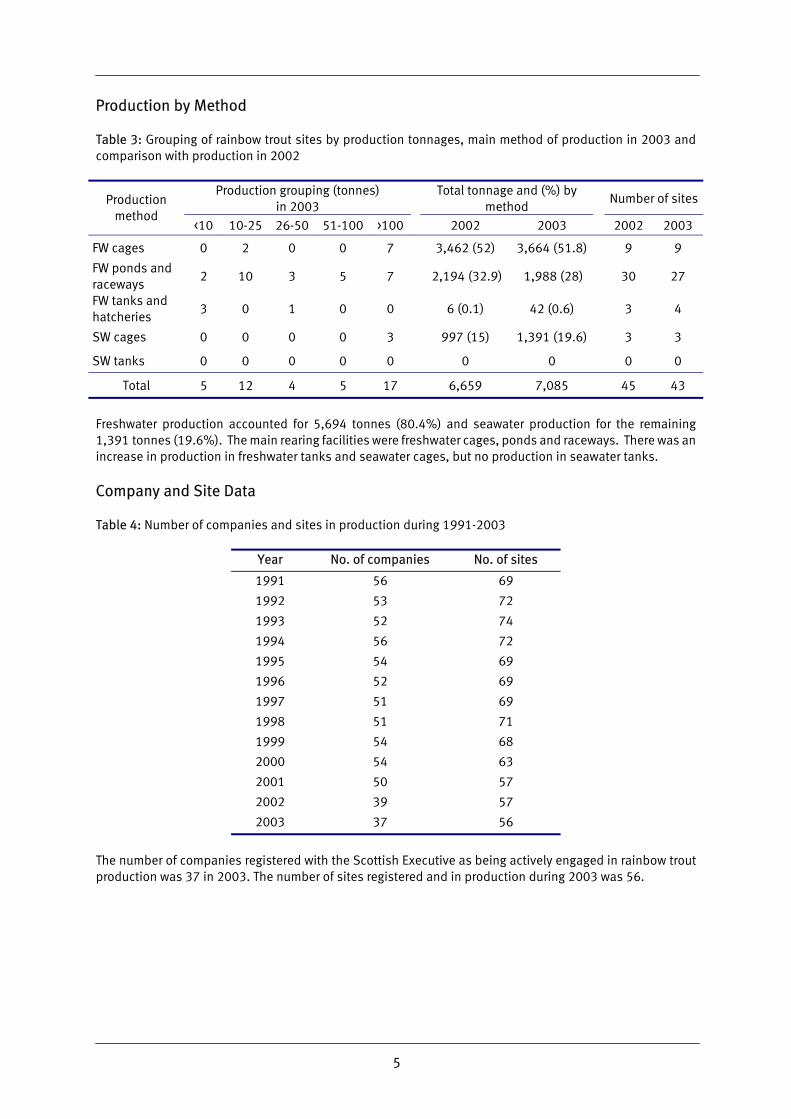
Production by Method Table 3: Grouping of rainbow trout sites by production tonnages, main method of production in 2003 and comparison with production in 2002
Production grouping (tonnes) in 2003
Total tonnage and (%) by
method
Number of sites Production method
<10 10-25 26-50 51-100 >100 2002 2003 2002 2003
FW cages 0 2 0 0 7 3,462 (52) 3,664 (51.8) 9 9
FW ponds and raceways
2 10 3 5 7
2,194 (32.9) 1,988 (28)
30 27
FW tanks and hatcheries
3 0 1 0 0
6 (0.1) 42 (0.6)
3 4
SW cages 0 0 0 0 3 997 (15) 1,391 (19.6) 3 3
SW tanks 0 0 0 0 0 0 0 0 0
Total 5 12 4 5 17 6,659 7,085 45 43
Freshwater production accounted for 5,694 tonnes (80.4%) and seawater production for the remaining 1,391 tonnes (19.6%). The main rearing facilities were freshwater cages, ponds and raceways. There was an increase in production in freshwater tanks and seawater cages, but no production in seawater tanks.
Company and Site Data Table 4: Number of companies and sites in production during 1991-2003
Year No. of companies No. of sites
1991 56 69
1992 53 72
1993 52 74
1994 56 72
1995 54 69
1996 52 69
1997 51 69
1998 51 71
1999 54 68
2000 54 63
2001 50 57
2002 39 57
2003 37 56
The number of companies registered with the Scottish Executive as being actively engaged in rainbow trout production was 37 in 2003. The number of sites registered and in production during 2003 was 56.
6
Staffing and Productivity Table 5: Number of staff employed and productivity per person during 1991-2003
Year Full-time Part-time Total Productivity
(tonnes/person)
1991 133 51 184 18.1
1992 135 73 208 19.0
1993 134 73 207 19.4
1994 139 70 209 20.4
1995 132 64 196 23.9
1996 129 60 189 24.5
1997 130 52 182 25.6
1998 137 49 186 26.4
1999 126 51 177 33.0
2000 121 47 168 30.7
2001 118 41 159 34.4
2002 114 46 160 41.6
2003 107 41 148 47.9
The overall number of staff employed in 2003 decreased by twelve to 148. The number of full-time staff decreased by seven and the number of part-time employees decreased by five. Productivity, measured as tonnes produced per person, increased by more than six tonnes per person in 2003. No distinction was made between full and part-time employees when calculating productivity.
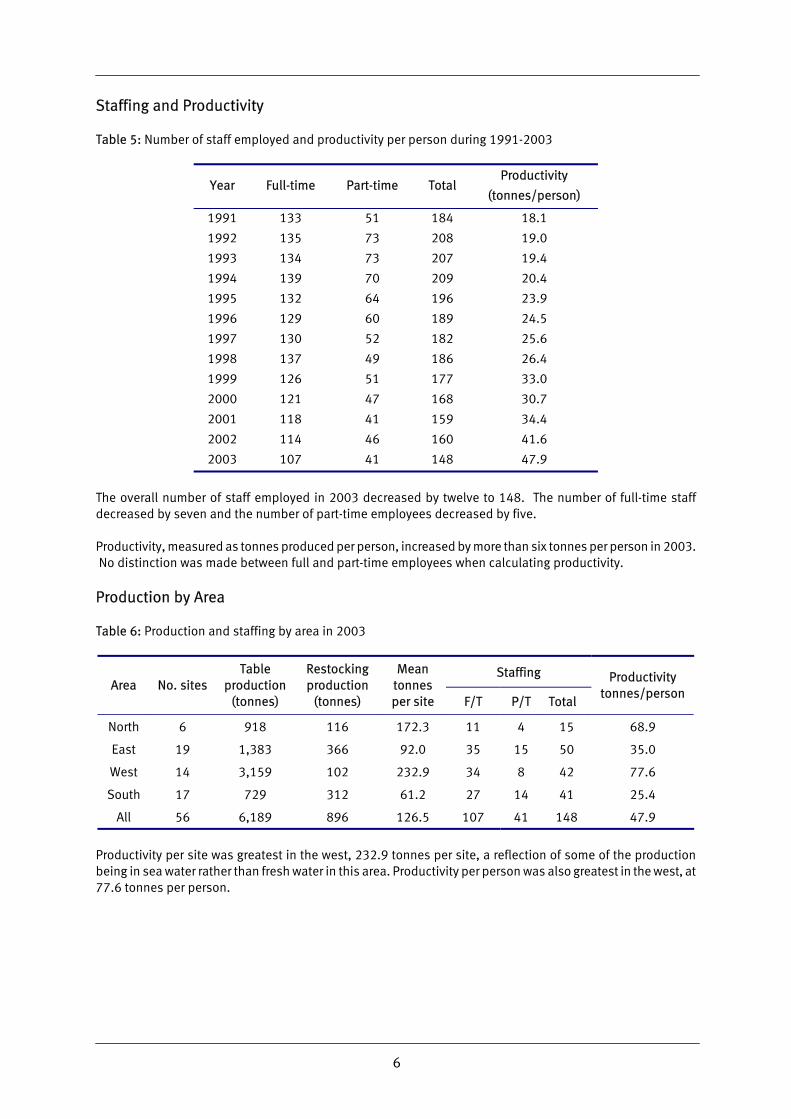
Production by Area Table 6: Production and staffing by area in 2003
Staffing Area No. sites
Table production
(tonnes)
Restocking production
(tonnes)
Mean tonnes per site F/T P/T Total
Productivity tonnes/person
North 6 918 116 172.3 11 4 15 68.9
East 19 1,383 366 92.0 35 15 50 35.0
West 14 3,159 102 232.9 34 8 42 77.6
South 17 729 312 61.2 27 14 41 25.4
All 56 6,189 896 126.5 107 41 148 47.9
Productivity per site was greatest in the west, 232.9 tonnes per site, a reflection of some of the production being in sea water rather than fresh water in this area. Productivity per person was also greatest in the west, at 77.6 tonnes per person.
7
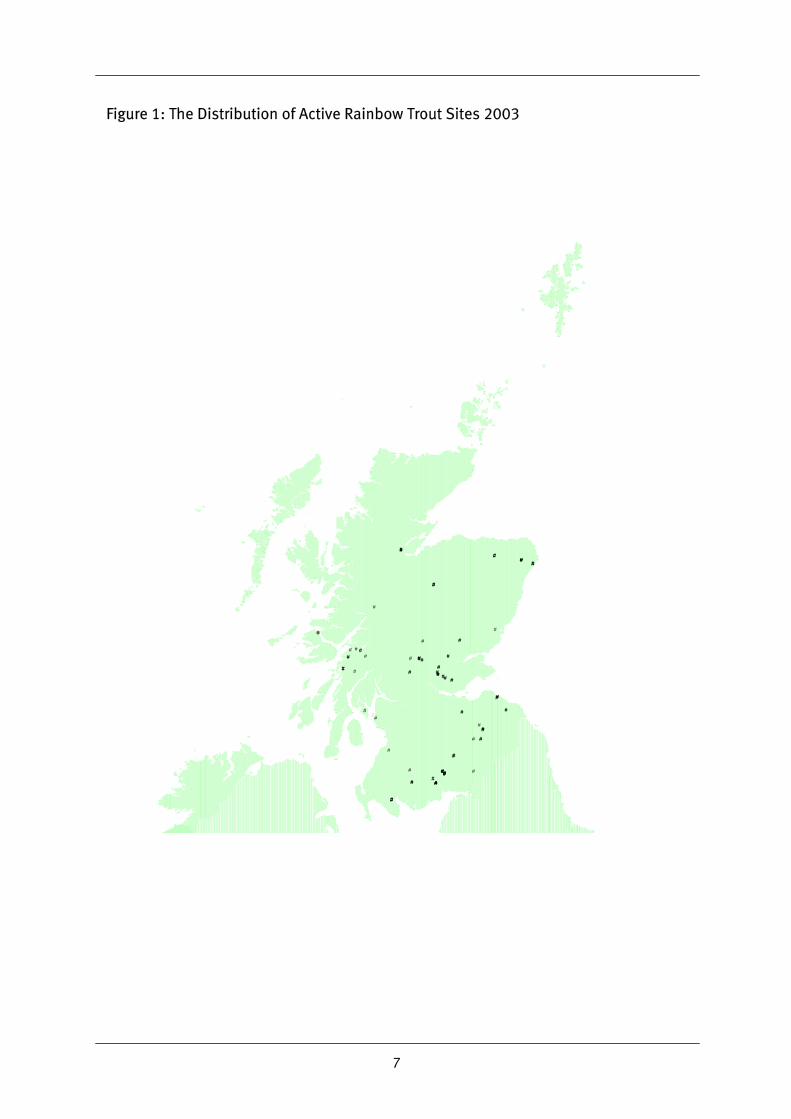
Figure 1: The Distribution of Active Rainbow Trout Sites 2003
###
#
##
###
#
#
####
##
#
###
##
##
###
#
###
#
###
#
#
#
###
#
#
#
##
#
#
##
##
#
#
#
##
##
#
###
###
#
#
#
##
##
#####
####
###
###
###
##
##
#
#
#
#
#
#
#
#
#
##
###
#
8
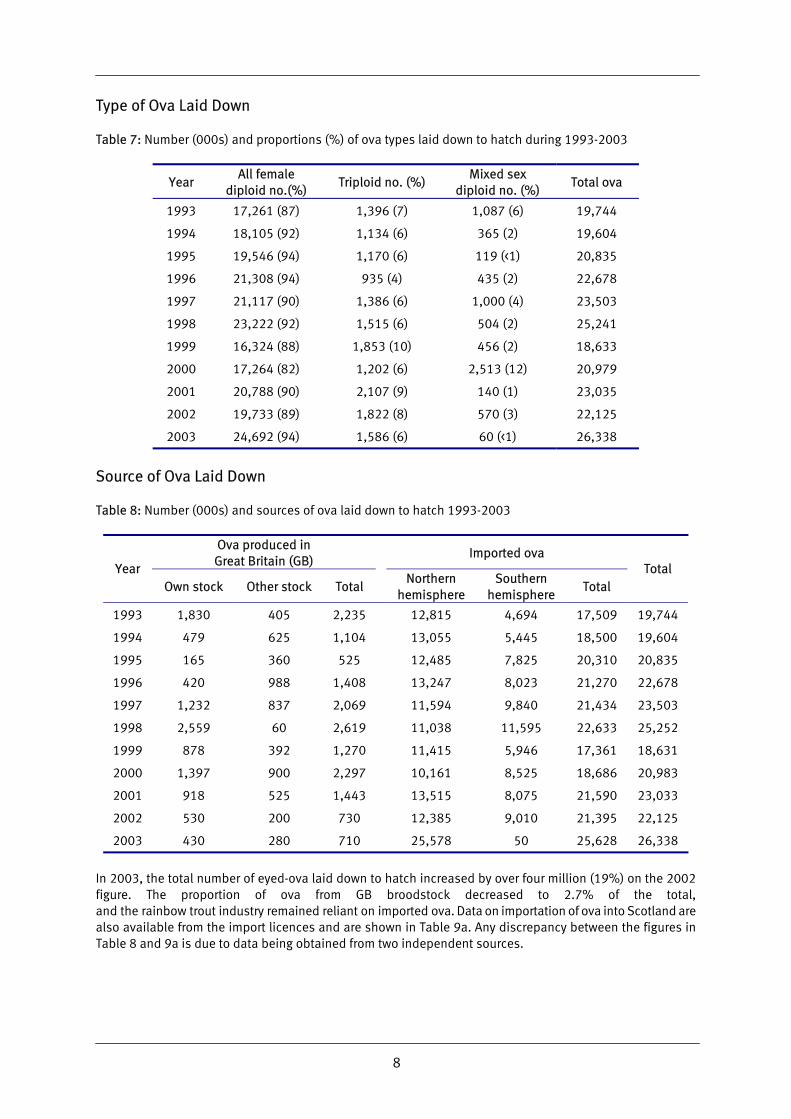
Type of Ova Laid Down Table 7: Number (000s) and proportions (%) of ova types laid down to hatch during 1993-2003
Year All female
diploid no.(%) Triploid no. (%)
Mixed sex diploid no. (%)
Total ova
1993 17,261 (87) 1,396 (7) 1,087 (6) 19,744
1994 18,105 (92) 1,134 (6) 365 (2) 19,604
1995 19,546 (94) 1,170 (6) 119 (<1) 20,835
1996 21,308 (94) 935 (4) 435 (2) 22,678
1997 21,117 (90) 1,386 (6) 1,000 (4) 23,503
1998 23,222 (92) 1,515 (6) 504 (2) 25,241
1999 16,324 (88) 1,853 (10) 456 (2) 18,633
2000 17,264 (82) 1,202 (6) 2,513 (12) 20,979
2001 20,788 (90) 2,107 (9) 140 (1) 23,035
2002 19,733 (89) 1,822 (8) 570 (3) 22,125
2003 24,692 (94) 1,586 (6) 60 (<1) 26,338
Source of Ova Laid Down Table 8: Number (000s) and sources of ova laid down to hatch 1993-2003
Ova produced in Great Britain (GB)
Imported ova
Year Own stock Other stock Total
Northern hemisphere
Southern hemisphere
Total Total
1993 1,830 405 2,235 12,815 4,694 17,509 19,744
1994 479 625 1,104 13,055 5,445 18,500 19,604
1995 165 360 525 12,485 7,825 20,310 20,835
1996 420 988 1,408 13,247 8,023 21,270 22,678
1997 1,232 837 2,069 11,594 9,840 21,434 23,503
1998 2,559 60 2,619 11,038 11,595 22,633 25,252
1999 878 392 1,270 11,415 5,946 17,361 18,631
2000 1,397 900 2,297 10,161 8,525 18,686 20,983
2001 918 525 1,443 13,515 8,075 21,590 23,033
2002 530 200 730 12,385 9,010 21,395 22,125
2003 430 280 710 25,578 50 25,628 26,338
In 2003, the total number of eyed-ova laid down to hatch increased by over four million (19%) on the 2002 figure. The proportion of ova from GB broodstock decreased to 2.7% of the total, and the rainbow trout industry remained reliant on imported ova. Data on importation of ova into Scotland are also available from the import licences and are shown in Table 9a. Any discrepancy between the figures in Table 8 and 9a is due to data being obtained from two independent sources.
9
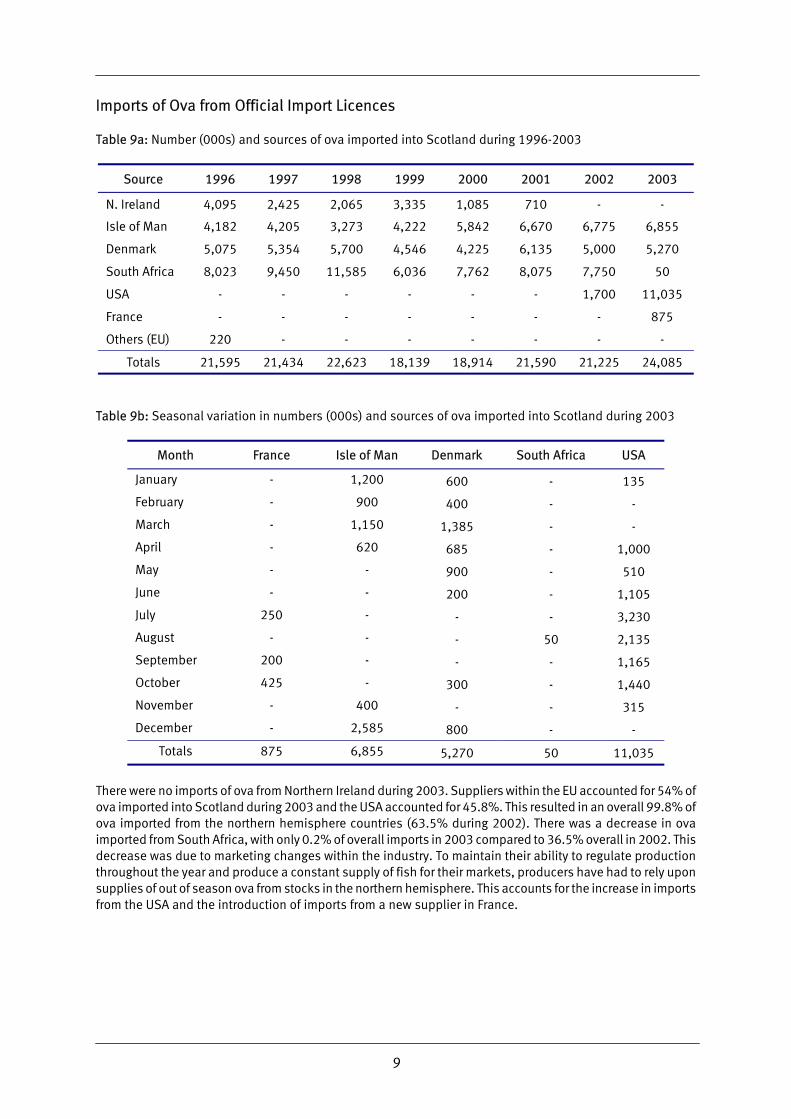
Imports of Ova from Official Import Licences Table 9a: Number (000s) and sources of ova imported into Scotland during 1996-2003
Source 1996 1997 1998 1999 2000 2001 2002 2003
N. Ireland 4,095 2,425 2,065 3,335 1,085 710 - -
Isle of Man 4,182 4,205 3,273 4,222 5,842 6,670 6,775 6,855
Denmark 5,075 5,354 5,700 4,546 4,225 6,135 5,000 5,270
South Africa 8,023 9,450 11,585 6,036 7,762 8,075 7,750 50
USA - - - - - - 1,700 11,035
France - - - - - - - 875
Others (EU) 220 - - - - - - -
Totals 21,595 21,434 22,623 18,139 18,914 21,590 21,225 24,085
Table 9b: Seasonal variation in numbers (000s) and sources of ova imported into Scotland during 2003
Month France Isle of Man Denmark South Africa USA
January - 1,200 600 - 135
February - 900 400 - -
March - 1,150 1,385 - -
April - 620 685 - 1,000
May - - 900 - 510
June - - 200 - 1,105
July 250 - - - 3,230
August - - - 50 2,135
September 200 - - - 1,165
October 425 - 300 - 1,440
November - 400 - - 315
December - 2,585 800 - -
Totals 875 6,855 5,270 50 11,035
There were no imports of ova from Northern Ireland during 2003. Suppliers within the EU accounted for 54% of ova imported into Scotland during 2003 and the USA accounted for 45.8%. This resulted in an overall 99.8% of ova imported from the northern hemisphere countries (63.5% during 2002). There was a decrease in ova imported from South Africa, with only 0.2% of overall imports in 2003 compared to 36.5% overall in 2002. This decrease was due to marketing changes within the industry. To maintain their ability to regulate production throughout the year and produce a constant supply of fish for their markets, producers have had to rely upon supplies of out of season ova from stocks in the northern hemisphere. This accounts for the increase in imports from the USA and the introduction of imports from a new supplier in France.
10
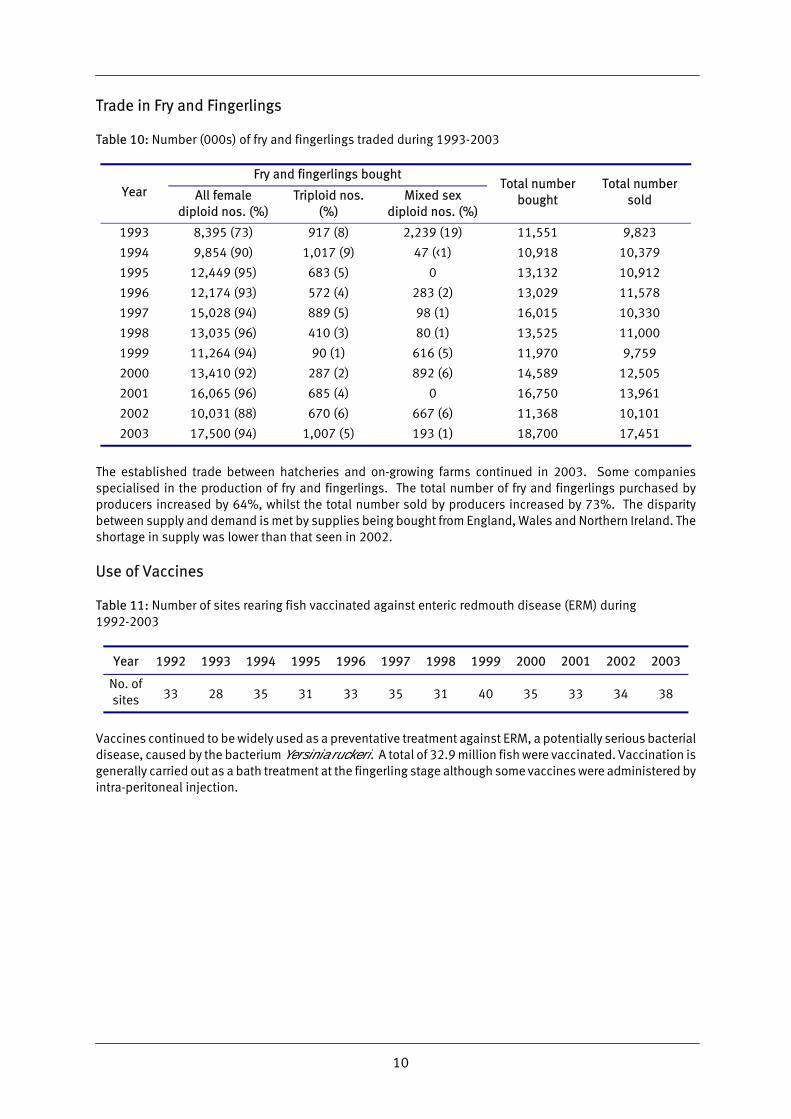
Trade in Fry and Fingerlings Table 10: Number (000s) of fry and fingerlings traded during 1993-2003
Fry and fingerlings bought Year All female
diploid nos. (%) Triploid nos.
(%) Mixed sex
diploid nos. (%)
Total number bought
Total number sold
1993 8,395 (73) 917 (8) 2,239 (19) 11,551 9,823
1994 9,854 (90) 1,017 (9) 47 (<1) 10,918 10,379
1995 12,449 (95) 683 (5) 0 13,132 10,912
1996 12,174 (93) 572 (4) 283 (2) 13,029 11,578
1997 15,028 (94) 889 (5) 98 (1) 16,015 10,330
1998 13,035 (96) 410 (3) 80 (1) 13,525 11,000
1999 11,264 (94) 90 (1) 616 (5) 11,970 9,759
2000 13,410 (92) 287 (2) 892 (6) 14,589 12,505
2001 16,065 (96) 685 (4) 0 16,750 13,961
2002 10,031 (88) 670 (6) 667 (6) 11,368 10,101
2003 17,500 (94) 1,007 (5) 193 (1) 18,700 17,451
The established trade between hatcheries and on-growing farms continued in 2003. Some companies specialised in the production of fry and fingerlings. The total number of fry and fingerlings purchased by producers increased by 64%, whilst the total number sold by producers increased by 73%. The disparity between supply and demand is met by supplies being bought from England, Wales and Northern Ireland. The shortage in supply was lower than that seen in 2002.
Use of Vaccines Table 11: Number of sites rearing fish vaccinated against enteric redmouth disease (ERM) during 1992-2003
Year 1992 1993 1994 1995 1996 1997 1998 1999 2000 2001 2002 2003
No. of sites 33 28 35 31 33 35 31 40 35 33 34 38
Vaccines continued to be widely used as a preventative treatment against ERM, a potentially serious bacterial disease, caused by the bacterium Yersinia ruckeri. A total of 32.9 million fish were vaccinated. Vaccination is generally carried out as a bath treatment at the fingerling stage although some vaccines were administered by intra-peritoneal injection.
11
2. ATLANTIC SALMON (Salmo salar) - OVA AND SMOLTS Annual production surveys were sent to all 48 companies registered with the Scottish Executive as being actively engaged in the freshwater production of Atlantic salmon in Scotland during 2003. Returns were received from all companies, covering the 176 sites currently in production.
Company and Site Data Table 12: Number of companies and sites in production during 1995-2003c
Year No. of companies No. of sites
1995 69 162
1996 67 166
1997 65 171
1998 64 177
1999 65 189
2000 60 184
2001 56 169
2002 55 173
2003 48 176
In 2003 the number of companies registered with the Scottish Executive as being actively engaged in the freshwater production of Atlantic salmon decreased by seven to 48. A total of 278 freshwater sites were registered and of these 98 sites were inactive and 180 active. One hundred and seventy six of the active sites were in commercial production, the difference being accounted for by farms that were not used during 2003.
Production and Staffing Table 13: Number (000s) of smolts produced, staff employed and smolt productivity during 1993-2003
Year 1993 1994 1995 1996 1997 1998 1999 2000 2001 2002 2003
Number (000s) of smolts produced
21,043 23,117 26,539 33,619 38,187 44,853 39,763 45,583 47,546 47,161 44,414
Full-time
233 245 279 308 344 318 300 341 317 312 291
Part-time
115 133 117 133 166 96 124 103 111 93 82
Staffing
Total 348 378 396 441 510 414 424 444 428 405 373
Productivity, 000s of smolts per person
60.5 61.2 67.0 76.2 74.9 108.3 93.8 102.7 111.1 116.4 119.1
Smolt production in 2003 decreased by over 2.7 million, a decrease of 5.8% compared to 2002.
c Under the term of the Registration of Fish Farming and Shellfish Farming Business Order 1985, all persons engaged in the practice of fish farming in Scotland are required to register the details of their business within two months of the commencement of commercial activity. Fisheries Research Services is the Scottish Executive agency responsible for administering the fish farms business register and is the point of contact for farmers who wish to change registration details or register a new business. Although registration details of specific sites and businesses are confidential under the Diseases of Fish Act 1937 as Amended 1983, the company and site information is published here in summary form, in accordance with the terms of the Act.
12
The number of staff employed decreased by 32 and productivity increased by 2%, to a figure of 119,100 smolts produced per employee.
Escapes There was one reported escape from a freshwater Atlantic salmon site in 2003, involving the loss of 47,176 fish.
Smolts by Age Group Table 14: Number of smolts (000s) produced by type during 1993-2003
Year S1⁄2 S1 S11⁄2 S2 Total
1993 686 19,698 202 457 21,043
1994 1,672 20,712 511 222 23,117
1995 2,663 22,705 365 806 26,539
1996 6,298 26,334 523 464 33,619
1997 9,333 27,679 692 483 38,187
1998 8,478 35,383 686 306 44,853
1999 10,770 28,345 586 62 39,763
2000 11,841 33,722 0 20 45,583
2001 14,684 32,732 110 20 47,546
2002 15,791 30,527 843 0 47,161
2003 14,907 28,836 671 0 44,414
In 2003 production was dominated by S1 smolts, although numbers produced decreased by 6%. The production of S1⁄2 smolts decreased by 6%. There was also a decrease in the production of S11⁄2, while no S2 smolts were produced.
Production Systems Table 15: Number and capacity of production systems during 1999-2003
System No. of sites with system Total capacity, 000s cubic metres
Year 1999 2000 2001 2002 2003 1999 2000 2001 2002 2003
Cages 86 85 76 81 80 457 344 328 409 391
Tanks and Raceways
103 99 93 92 96
39 45 48 41 40
Total 189 184 169 173 176 496 389 376 450 431
There are two principal types of facility used for the production of smolts in fresh water - tanks and cages. In 2003, the number of farms employing tanks, ponds and raceways increased by four, and the number of farms employing cages decreased by one. In terms of volume, tank capacity decreased by 1,000 m³, and cage volume decreased by 18,000 m³. This resulted in a net decrease in volume of 19,000 m³ available for the production of smolts in Scotland during 2003.
13
Table 16: Number (000s) of smolts produced and stocking densities by production system during 1999-2003
Number of smolts produced (000s) Stocking densities(smolts /m3)
Year
1999 2000 2001 2002 2003 1999 2000 2001 2002 2003
Cages 22,242 24,052 25,237 27,076 24,094 49 70 77 66 62 All others 17,521 21,531 22,309 20,085 20,320 449 478 465 490 508
Total 39,763 45,583 47,546 47,161 44,414 - - - - -
The average stocking densities of cages decreased compared to 2002, whilst the stocking densities of tanks increased; in the case of cages from 66 to 62 fish per m³ and in the case of tanks, from 490 to 508 fish per m³.
Ova Production Table 17: Number (000s) of salmon ova produced during 1996-2003
Year 1996 1997 1998 1999 2000 2001 2002 2003 No. of ova 122,665 186,470 151,841 122,649 124,619 99,921 107,996 115,569
Over one hundred and fifteen million ova were stripped in 2003, an increase of over seven million (7%) on the 2002 season. Table 18: Source, number (000s) and previous year�s estimate of ova laid down to hatch during 1993-2004
Year In-house
broodstock Out-sourced GB
broodstock GB wild
broodstock Foreign
ova Total
Previous year's
estimate
1993 44,524 19,281 514 4,381 68,700 54,415
1994 25,883 14,991 450 5,347 46,671 49,064
1995 37,176 25,063 475 2,160 64,874 46,538
1996 46,545 23,784 65 8,045 78,439 71,635
1997 60,421 23,308 323 1,750 85,802 76,629
1998 49,207 19,085 0 1,010 69,302 69,632
1999 52,122 25,804 4,291 500 82,717 68,644
2000 38,674 33,592 1,605 4,660 78,531 69,220
2001 40,086 32,002 615 10,720 83,423 83,458
2002 40,732 30,664 120 15,184 86,700 80,679
2003 38,766 21,138 0 20,822 80,726 73,193
2004 - - - - - 74,464
The number of ova laid down to hatch was 80.7 million, a decrease of almost six million (6.9%) on the 2002 figure. The majority of the ova (48%) were derived from producers' own broodstock, the proportion being slightly more than that seen in 2002. Supplies from other producer's broodstock were proportionally smaller, with an increasing proportion being derived from sources outside Great Britain. Producers' estimates for the number of ova to be laid down in 2004 shows a projected decrease compared to the actual number of ova laid down in 2003. No ova derived from wild stocks were laid down to hatch in 2003.
14
Smolts Produced and Put to Sea Table 19: Actual and projected smolt production and smolts put to sea (millions) during 1994-2005
1994 1995 1996 1997 1998 1999 2000 2001 2002 2003 2004 2005
Actual smolts put to sea 22.0 26.8 30.8 42.8 45.9 41.1 45.2 48.6 50.1 43.8
Smolts produced 23.1 26.5 33.6 38.2 44.8 39.8 45.6 47.5 47.2 44.4
Estimated production 22.1 25.2 31.8 41.6 45.3 49.6 42.1 50.2 49.3 44.2 40.0 46.0
Ratio of ova laid down to smolts produced
2.0 2.4 2.3 2.2 1.5 1.7 1.8 1.8 1.8 1.8
The figure for the number of smolts put to sea includes smolts produced in England and fish imported from elsewhere whereas smolt production data relate only to those produced in Scotland. Any discrepancy may be due to smolts that were produced in Scotland but were not put to sea in Scotland. Farmers estimate putting 40.0 million smolts to sea in 2004. The ratio of ova laid down to hatch to smolts produced in 2003 remained similar to the ratio in 2002.
Scale of Production Table 20: Smolt producing sites grouped by numbers (000s) of smolts produced during 1991-2003
Scale of production Year
1-10 11-25 26-50 51-100
101-250
251-500
501-1,000
>1,000
No. of sites in production
Total smolts
produced
1991 2 11 17 22 26 26 5 2 111 22,404
1992 3 8 14 17 41 23 4 0 110 20,828
1993 1 9 15 17 32 21 9 0 104 21,043
1994 4 5 13 24 37 17 13 0 113 23,117
1995 1 6 15 29 30 26 14 1 122 26,540
1996 1 7 13 29 33 26 17 3 129 33,619
1997 0 3 13 22 39 24 18 6 125 38,187
1998 1 3 12 24 33 29 20 8 130 44,853
1999 1 1 15 25 29 24 21 7 123 39,763
2000 1 2 10 17 36 24 24 9 123 45,583
2001 0 1 7 19 30 26 13 14 110 47,546
2002 1 1 11 17 29 34 17 10 120 47,161
2003 2 0 7 20 32 31 12 10 114 44,414
Note: These data refer only to sites producing smolts. The sites holding only ova, fry or parr are excluded. There has been a decrease in the number of sites producing smolts since 2002. The number of sites producing less than 101,000 smolts has decreased by one, and there has been a decrease of five in the number of sites producing more than 100,000 smolts. The number of sites producing in excess of one million smolts per year remained the same, and a decrease in the number of sites producing between 501,000 and one million smolts
15
per year. This drop in the number of sites producing smolts has resulted in an overall decrease in smolts produced.
Production of Ova and Smolt by Production Area Table 21: Staffing, and ova laid down to hatch, 2002-2003, smolt production 2002-2003 and projected production 2004-2005 by region
Number of staff
employed in 2003
Ova laid down to hatch (000s)
Smolt production (000s)
Estimated smolt production (000s) Region
F/T P/T
2002 2003
2002 2003
2004 2005
Northwest 136 30 49,760 48,363 23,295 23,448 19,834 21,983
Orkney 7 7 700 200 681 682 694 844
Shetland 16 13 3,938 2,520 1,449 1,468 2,330 2,400
West 58 19 13,809 13,370 9,155 9,548 9,174 10,160
Western Isles 64 8 14,612 13,315 9,906 7,092 6,071 8,444
East and South 10 5 3,881 2,958 2,675 2,176 1,928 2,210
All Scotland 291 82 86,700 80,726 47,161 44,414 40,031 46,041
The north west, west and the Western Isles were the main ova and smolt producing areas in 2003, and employed the greatest number of staff.
International Trade in Ova Since the introduction of the EU single market on 1 January 1993 and the associated Fish Health Regulations common to all EU member states, a trade in live salmon and ova has been established. In addition, the European Economic Area (EEA) Agreement allows trade between the EU and the member states of the European Free Trade Association (EFTA). Until 2003, trade under the EEA Agreement, was restricted to halibut alevins and salmonid eggs or gametes. With the cessation of these restrictions, trade became based on the same rules as are established within the EU, regarding approval of farms and zones for listed diseases. Norway has an equivalent status to Great Britain with regard to List II diseases, but protective measures in place against infectious salmon anaemia (ISA) and Gyrodactylus salaris have prevented trade. Changes introduced to these protective measures in 2003 mean the importation of salmonid ova is permitted from Norway. Trade with Third Countries has also been established, but imports are permitted only under licence, from sources that have met rigorous health testing requirements. Exports to countries outside the EU are subject to the health conditions placed by the importing country. FRS advises potential exporters to ascertain with the importing country any specific health testing requirements that may be a condition of import.
16
Figure 2: The Distribution of Active Smolt Sites 2003
#
#
#
####
#
####
#
##
#
##
####
##
##
###
##
#
##
#
###
#
###
#
#
#
## #
#
##
#
#
##
#
#
#
#
#
##
##
##
#
##
####
##
##
#
#
#
###
#
#
##
#
##
###
#
###
#
#
#
#
#
#
#
#
#
##
##
#
#
##
##
##
#
#
##
##
##
####
#
#
#
#
#
#
###
#
##
#
#
## #
#
#
#
#
##
#
#
#
#
#
#
#
#
#
#
#
##
#
#
#
##
#
#
#
#
#
##
#
#
#
##
#
##
##
#
#
#
#
#
#
#
##
#
#
#
##
#
##
#
#
#
#
#
#
##
#
#
#
#
#
#
#
#
#
17
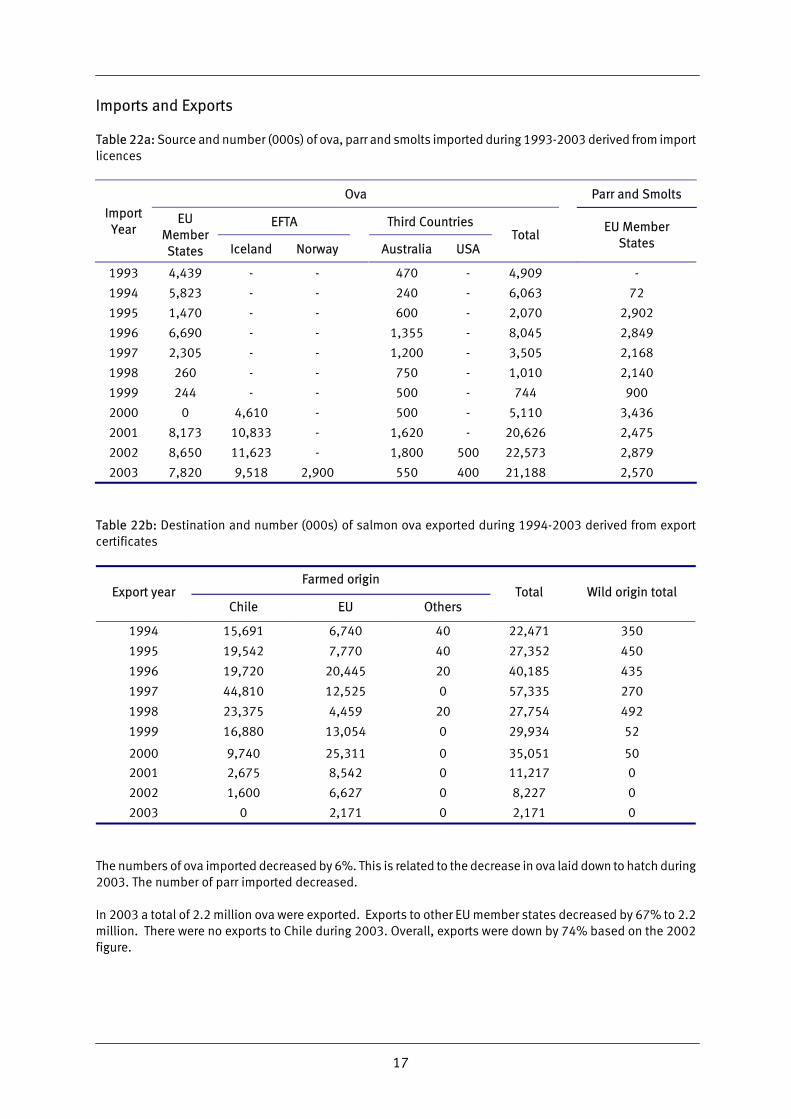
Imports and Exports Table 22a: Source and number (000s) of ova, parr and smolts imported during 1993-2003 derived from import licences
Ova Parr and Smolts
EFTA Third Countries Import Year
EU Member States Iceland Norway Australia USA
Total
EU Member States
1993 4,439 - - 470 - 4,909 -
1994 5,823 - - 240 - 6,063 72
1995 1,470 - - 600 - 2,070 2,902
1996 6,690 - - 1,355 - 8,045 2,849
1997 2,305 - - 1,200 - 3,505 2,168
1998 260 - - 750 - 1,010 2,140
1999 244 - - 500 - 744 900
2000 0 4,610 - 500 - 5,110 3,436
2001 8,173 10,833 - 1,620 - 20,626 2,475
2002 8,650 11,623 - 1,800 500 22,573 2,879
2003 7,820 9,518 2,900 550 400 21,188 2,570
Table 22b: Destination and number (000s) of salmon ova exported during 1994-2003 derived from export certificates
Farmed origin Export year
Chile EU Others Total Wild origin total
1994 15,691 6,740 40 22,471 350
1995 19,542 7,770 40 27,352 450
1996 19,720 20,445 20 40,185 435
1997 44,810 12,525 0 57,335 270
1998 23,375 4,459 20 27,754 492
1999 16,880 13,054 0 29,934 52
2000 9,740 25,311 0 35,051 50
2001 2,675 8,542 0 11,217 0
2002 1,600 6,627 0 8,227 0
2003 0 2,171 0 2,171 0
The numbers of ova imported decreased by 6%. This is related to the decrease in ova laid down to hatch during 2003. The number of parr imported decreased. In 2003 a total of 2.2 million ova were exported. Exports to other EU member states decreased by 67% to 2.2 million. There were no exports to Chile during 2003. Overall, exports were down by 74% based on the 2002 figure.
18
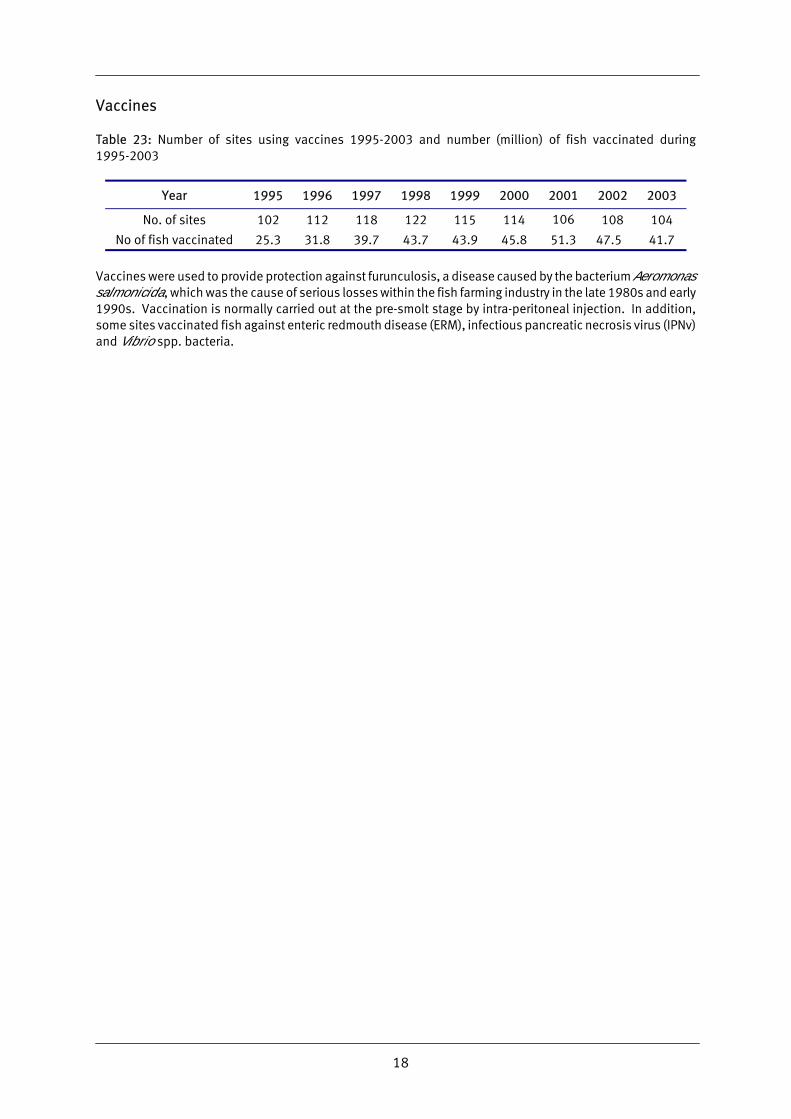
Vaccines Table 23: Number of sites using vaccines 1995-2003 and number (million) of fish vaccinated during 1995-2003
Year 1995 1996 1997 1998 1999 2000 2001 2002 2003
No. of sites 102 112 118 122 115 114 106 108 104
No of fish vaccinated 25.3 31.8 39.7 43.7 43.9 45.8 51.3 47.5 41.7
Vaccines were used to provide protection against furunculosis, a disease caused by the bacterium Aeromonas salmonicida, which was the cause of serious losses within the fish farming industry in the late 1980s and early 1990s. Vaccination is normally carried out at the pre-smolt stage by intra-peritoneal injection. In addition, some sites vaccinated fish against enteric redmouth disease (ERM), infectious pancreatic necrosis virus (IPNv) and Vibrio spp. bacteria.
19
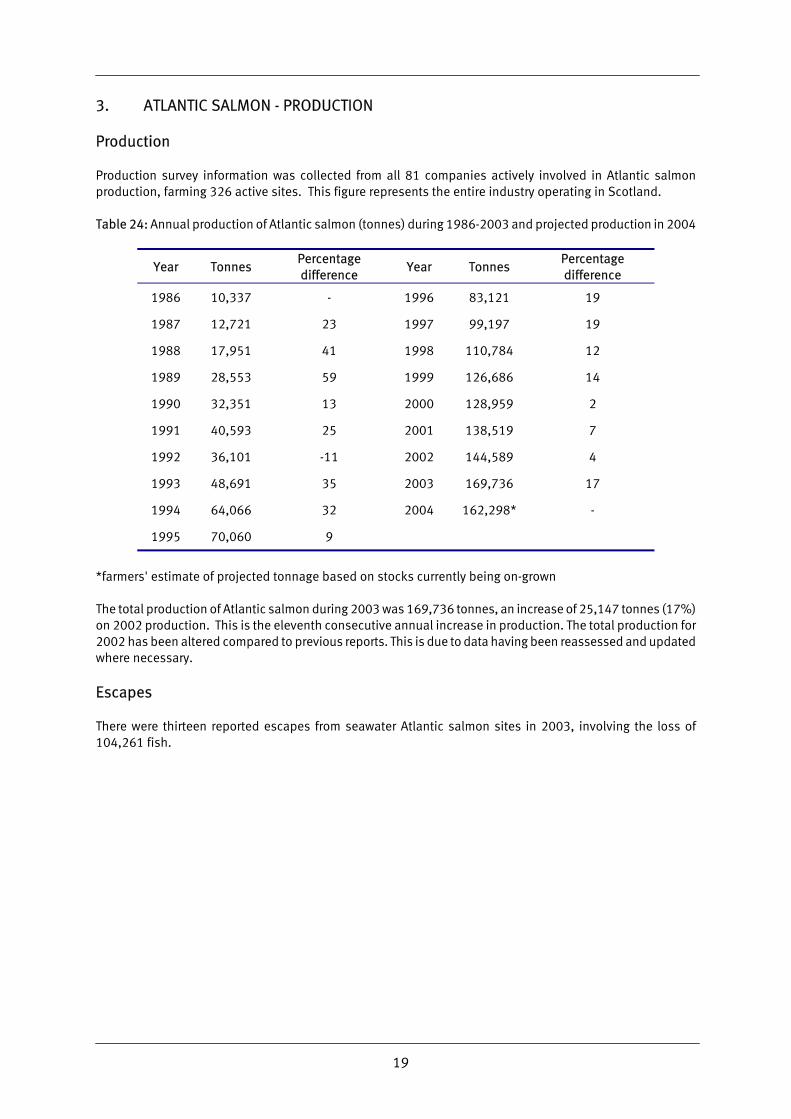
3. ATLANTIC SALMON - PRODUCTION
Production Production survey information was collected from all 81 companies actively involved in Atlantic salmon production, farming 326 active sites. This figure represents the entire industry operating in Scotland. Table 24: Annual production of Atlantic salmon (tonnes) during 1986-2003 and projected production in 2004
Year Tonnes Percentage difference
Year Tonnes Percentage difference
1986 10,337 - 1996 83,121 19
1987 12,721 23 1997 99,197 19
1988 17,951 41 1998 110,784 12
1989 28,553 59 1999 126,686 14
1990 32,351 13 2000 128,959 2
1991 40,593 25 2001 138,519 7
1992 36,101 -11 2002 144,589 4
1993 48,691 35 2003 169,736 17
1994 64,066 32 2004 162,298* -
1995 70,060 9
*farmers' estimate of projected tonnage based on stocks currently being on-grown The total production of Atlantic salmon during 2003 was 169,736 tonnes, an increase of 25,147 tonnes (17%) on 2002 production. This is the eleventh consecutive annual increase in production. The total production for 2002 has been altered compared to previous reports. This is due to data having been reassessed and updated where necessary.
Escapes There were thirteen reported escapes from seawater Atlantic salmon sites in 2003, involving the loss of 104,261 fish.
20
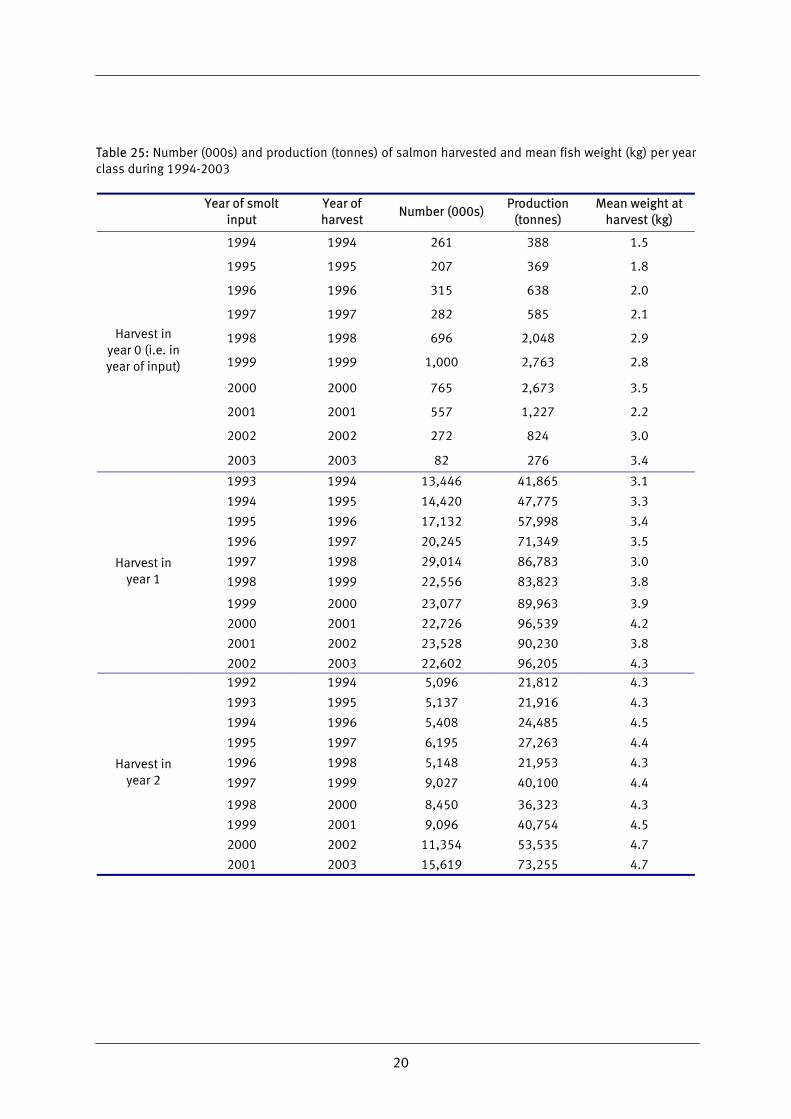
Table 25: Number (000s) and production (tonnes) of salmon harvested and mean fish weight (kg) per year class during 1994-2003
Year of smolt
input Year of harvest
Number (000s) Production
(tonnes) Mean weight at
harvest (kg)
1994 1994 261 388 1.5
1995 1995 207 369 1.8
1996 1996 315 638 2.0
1997 1997 282 585 2.1
1998 1998 696 2,048 2.9
1999 1999 1,000 2,763 2.8
2000 2000 765 2,673 3.5
2001 2001 557 1,227 2.2
2002 2002 272 824 3.0
Harvest in year 0 (i.e. in year of input)
2003 2003 82 276 3.4
1993 1994 13,446 41,865 3.1
1994 1995 14,420 47,775 3.3
1995 1996 17,132 57,998 3.4
1996 1997 20,245 71,349 3.5
1997 1998 29,014 86,783 3.0
1998 1999 22,556 83,823 3.8
1999 2000 23,077 89,963 3.9
2000 2001 22,726 96,539 4.2
2001 2002 23,528 90,230 3.8
Harvest in year 1
2002 2003 22,602 96,205 4.3 1992 1994 5,096 21,812 4.3
1993 1995 5,137 21,916 4.3
1994 1996 5,408 24,485 4.5
1995 1997 6,195 27,263 4.4
1996 1998 5,148 21,953 4.3
1997 1999 9,027 40,100 4.4
1998 2000 8,450 36,323 4.3
1999 2001 9,096 40,754 4.5
2000 2002 11,354 53,535 4.7
Harvest in year 2
2001 2003 15,619 73,255 4.7
21
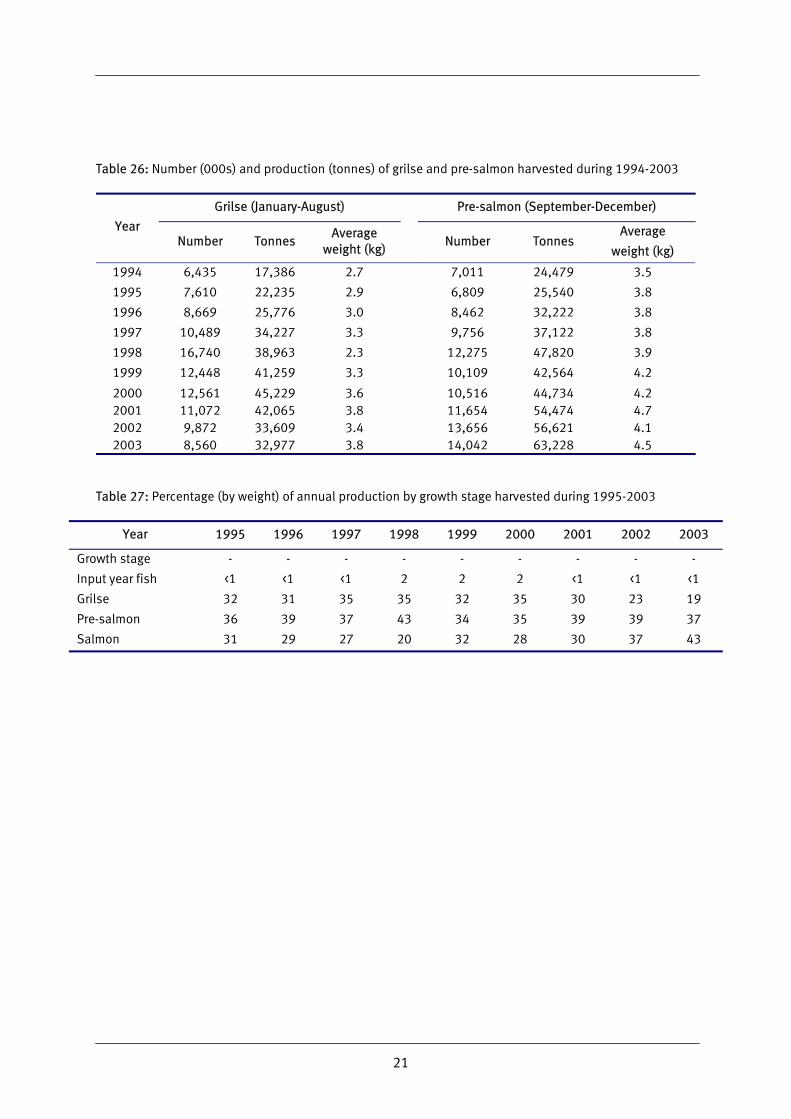
Table 26: Number (000s) and production (tonnes) of grilse and pre-salmon harvested during 1994-2003
Grilse (January-August) Pre-salmon (September-December)
Year Number Tonnes
Average weight (kg)
Number Tonnes
Average
weight (kg)
1994 6,435 17,386 2.7 7,011 24,479 3.5
1995 7,610 22,235 2.9 6,809 25,540 3.8
1996 8,669 25,776 3.0 8,462 32,222 3.8
1997 10,489 34,227 3.3 9,756 37,122 3.8
1998 16,740 38,963 2.3 12,275 47,820 3.9
1999 12,448 41,259 3.3 10,109 42,564 4.2
2000 12,561 45,229 3.6 10,516 44,734 4.2 2001 11,072 42,065 3.8 11,654 54,474 4.7 2002 9,872 33,609 3.4 13,656 56,621 4.1 2003 8,560 32,977 3.8 14,042 63,228 4.5
Table 27: Percentage (by weight) of annual production by growth stage harvested during 1995-2003
Year 1995 1996 1997 1998 1999 2000 2001 2002 2003
Growth stage - - - - - - - - -
Input year fish <1 <1 <1 2 2 2 <1 <1 <1
Grilse 32 31 35 35 32 35 30 23 19
Pre-salmon 36 39 37 43 34 35 39 39 37
Salmon 31 29 27 20 32 28 30 37 43
22
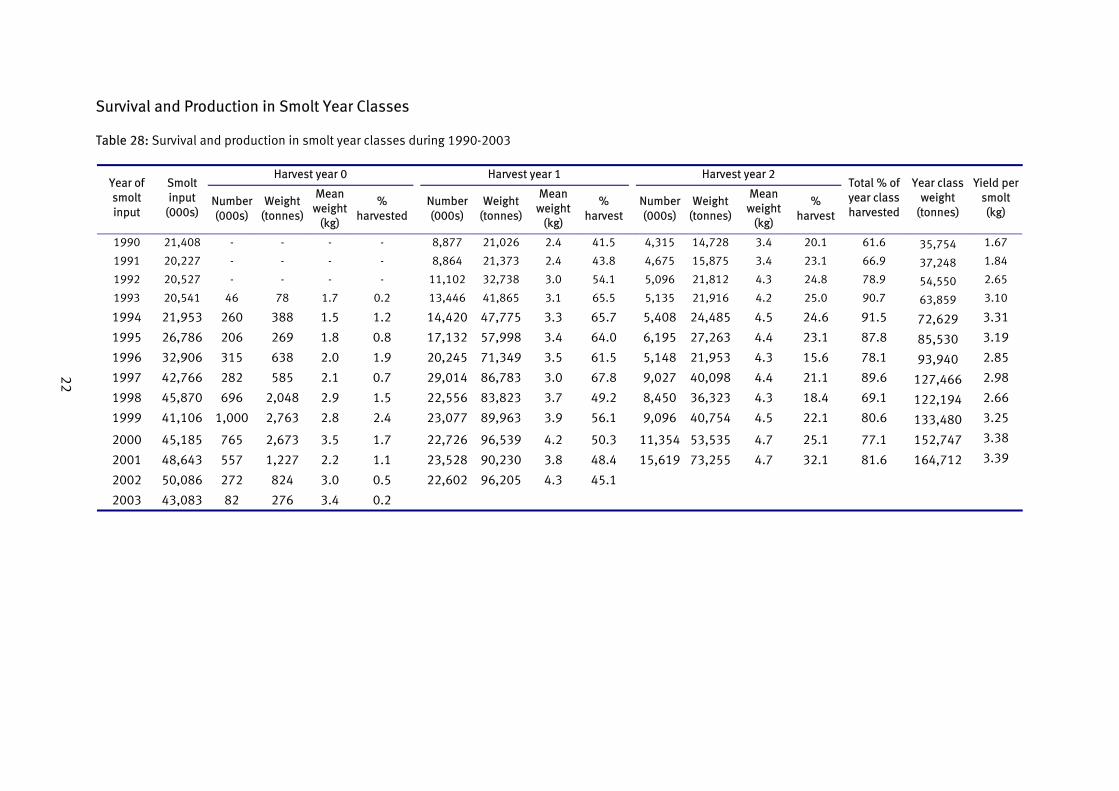
Survival and Production in Smolt Year Classes Table 28: Survival and production in smolt year classes during 1990-2003
Harvest year 0 Harvest year 1 Harvest year 2 Year of smolt input
Smolt input
(000s) Number (000s)
Weight (tonnes)
Mean weight
(kg)
% harvested
Number (000s)
Weight (tonnes)
Mean weight
(kg)
% harvest
Number (000s)
Weight (tonnes)
Mean weight
(kg)
% harvest
Total % of year class harvested
Year class weight
(tonnes)
Yield per smolt (kg)
1990 21,408 - - - - 8,877 21,026 2.4 41.5 4,315 14,728 3.4 20.1 61.6 35,754 1.67
1991 20,227 - - - - 8,864 21,373 2.4 43.8 4,675 15,875 3.4 23.1 66.9 37,248 1.84
1992 20,527 - - - - 11,102 32,738 3.0 54.1 5,096 21,812 4.3 24.8 78.9 54,550 2.65
1993 20,541 46 78 1.7 0.2 13,446 41,865 3.1 65.5 5,135 21,916 4.2 25.0 90.7 63,859 3.10
1994 21,953 260 388 1.5 1.2 14,420 47,775 3.3 65.7 5,408 24,485 4.5 24.6 91.5 72,629 3.31
1995 26,786 206 269 1.8 0.8 17,132 57,998 3.4 64.0 6,195 27,263 4.4 23.1 87.8 85,530 3.19
1996 32,906 315 638 2.0 1.9 20,245 71,349 3.5 61.5 5,148 21,953 4.3 15.6 78.1 93,940 2.85
1997 42,766 282 585 2.1 0.7 29,014 86,783 3.0 67.8 9,027 40,098 4.4 21.1 89.6 127,466 2.98
1998 45,870 696 2,048 2.9 1.5 22,556 83,823 3.7 49.2 8,450 36,323 4.3 18.4 69.1 122,194 2.66
1999 41,106 1,000 2,763 2.8 2.4 23,077 89,963 3.9 56.1 9,096 40,754 4.5 22.1 80.6 133,480 3.25
2000 45,185 765 2,673 3.5 1.7 22,726 96,539 4.2 50.3 11,354 53,535 4.7 25.1 77.1 152,747 3.38
2001 48,643 557 1,227 2.2 1.1 23,528 90,230 3.8 48.4 15,619 73,255 4.7 32.1 81.6 164,712 3.39
2002 50,086 272 824 3.0 0.5 22,602 96,205 4.3 45.1
2003 43,083 82 276 3.4 0.2
22
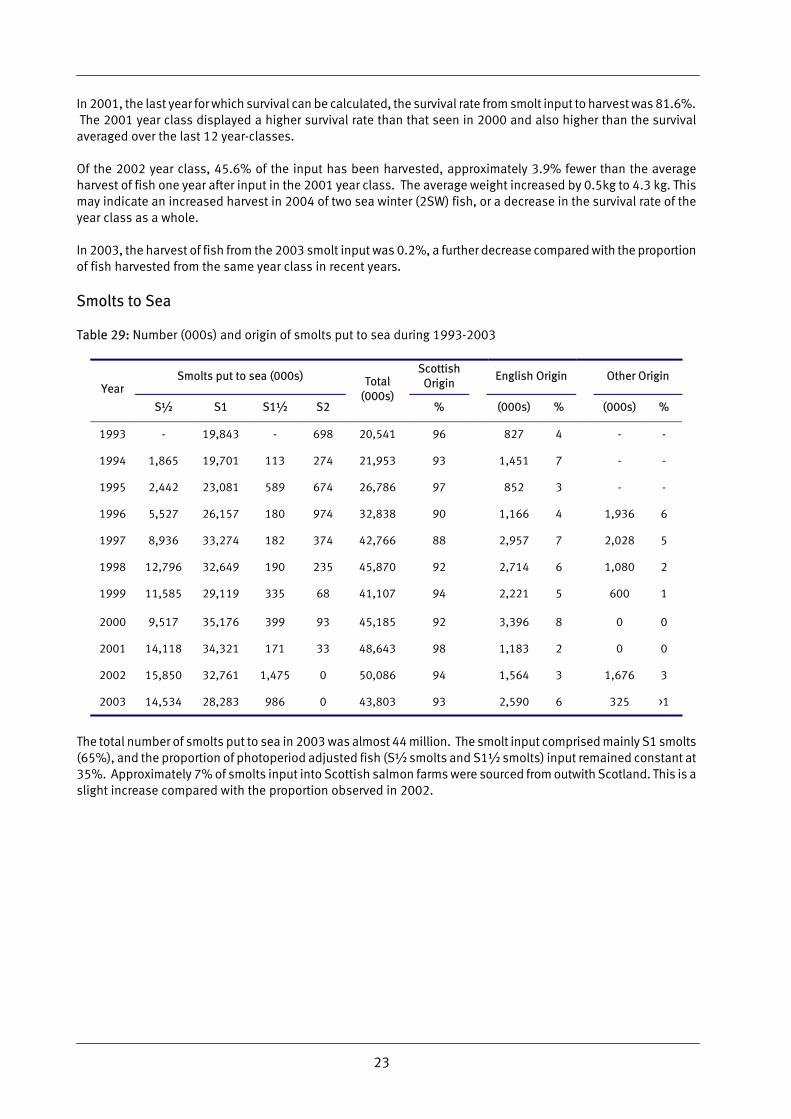
23
In 2001, the last year for which survival can be calculated, the survival rate from smolt input to harvest was 81.6%. The 2001 year class displayed a higher survival rate than that seen in 2000 and also higher than the survival averaged over the last 12 year-classes. Of the 2002 year class, 45.6% of the input has been harvested, approximately 3.9% fewer than the average harvest of fish one year after input in the 2001 year class. The average weight increased by 0.5kg to 4.3 kg. This may indicate an increased harvest in 2004 of two sea winter (2SW) fish, or a decrease in the survival rate of the year class as a whole. In 2003, the harvest of fish from the 2003 smolt input was 0.2%, a further decrease compared with the proportion of fish harvested from the same year class in recent years.
Smolts to Sea Table 29: Number (000s) and origin of smolts put to sea during 1993-2003
Smolts put to sea (000s) Scottish
Origin
English Origin
Other Origin Year
S1⁄2 S1 S11⁄2 S2
Total (000s)
% (000s) % (000s) %
1993 - 19,843 - 698 20,541 96 827 4 - -
1994 1,865 19,701 113 274 21,953 93 1,451 7 - -
1995 2,442 23,081 589 674 26,786 97 852 3 - -
1996 5,527 26,157 180 974 32,838 90 1,166 4 1,936 6
1997 8,936 33,274 182 374 42,766 88 2,957 7 2,028 5
1998 12,796 32,649 190 235 45,870 92 2,714 6 1,080 2
1999 11,585 29,119 335 68 41,107 94 2,221 5 600 1
2000 9,517 35,176 399 93 45,185 92 3,396 8 0 0
2001 14,118 34,321 171 33 48,643 98 1,183 2 0 0
2002 15,850 32,761 1,475 0 50,086 94 1,564 3 1,676 3
2003 14,534 28,283 986 0 43,803 93 2,590 6 325 >1
The total number of smolts put to sea in 2003 was almost 44 million. The smolt input comprised mainly S1 smolts (65%), and the proportion of photoperiod adjusted fish (S1⁄2 smolts and S11⁄2 smolts) input remained constant at 35%. Approximately 7% of smolts input into Scottish salmon farms were sourced from outwith Scotland. This is a slight increase compared with the proportion observed in 2002.
23
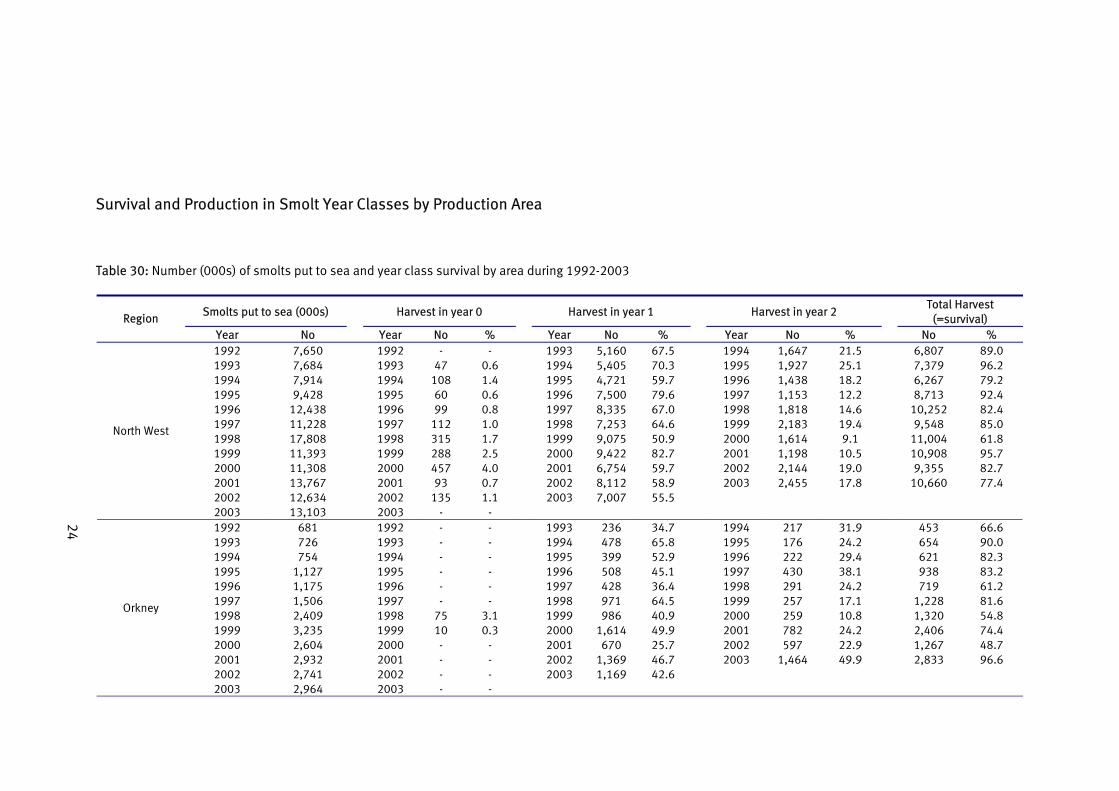
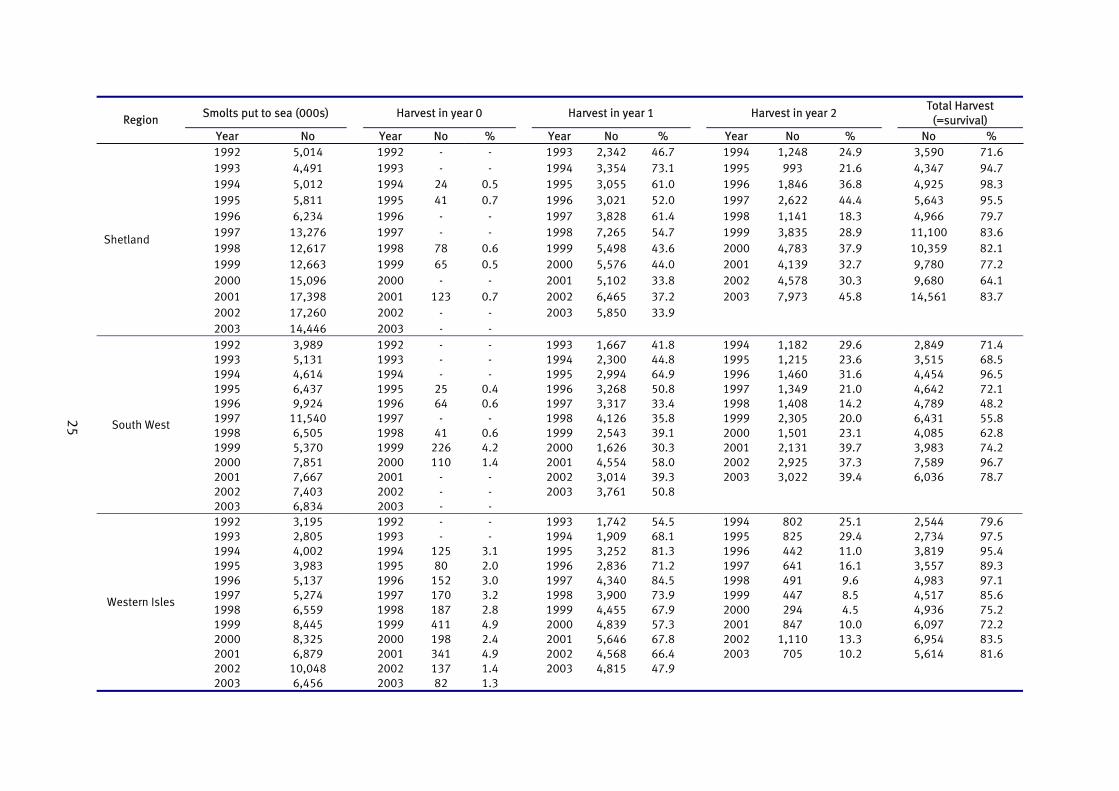
Survival and Production in Smolt Year Classes by Production Area Table 30: Number (000s) of smolts put to sea and year class survival by area during 1992-2003
Smolts put to sea (000s)
Harvest in year 0
Harvest in year 1
Harvest in year 2 Total Harvest
(=survival) Region Year No Year No % Year No % Year No % No % 1992 7,650 1992 - - 1993 5,160 67.5 1994 1,647 21.5 6,807 89.0 1993 7,684 1993 47 0.6 1994 5,405 70.3 1995 1,927 25.1 7,379 96.2 1994 7,914 1994 108 1.4 1995 4,721 59.7 1996 1,438 18.2 6,267 79.2 1995 9,428 1995 60 0.6 1996 7,500 79.6 1997 1,153 12.2 8,713 92.4 1996 12,438 1996 99 0.8 1997 8,335 67.0 1998 1,818 14.6 10,252 82.4 1997 11,228 1997 112 1.0 1998 7,253 64.6 1999 2,183 19.4 9,548 85.0 1998 17,808 1998 315 1.7 1999 9,075 50.9 2000 1,614 9.1 11,004 61.8 1999 11,393 1999 288 2.5 2000 9,422 82.7 2001 1,198 10.5 10,908 95.7 2000 11,308 2000 457 4.0 2001 6,754 59.7 2002 2,144 19.0 9,355 82.7 2001 13,767 2001 93 0.7 2002 8,112 58.9 2003 2,455 17.8 10,660 77.4 2002 12,634 2002 135 1.1 2003 7,007 55.5
North West
2003 13,103 2003 - - 1992 681 1992 - - 1993 236 34.7 1994 217 31.9 453 66.6 1993 726 1993 - - 1994 478 65.8 1995 176 24.2 654 90.0 1994 754 1994 - - 1995 399 52.9 1996 222 29.4 621 82.3 1995 1,127 1995 - - 1996 508 45.1 1997 430 38.1 938 83.2 1996 1,175 1996 - - 1997 428 36.4 1998 291 24.2 719 61.2 1997 1,506 1997 - - 1998 971 64.5 1999 257 17.1 1,228 81.6 1998 2,409 1998 75 3.1 1999 986 40.9 2000 259 10.8 1,320 54.8 1999 3,235 1999 10 0.3 2000 1,614 49.9 2001 782 24.2 2,406 74.4 2000 2,604 2000 - - 2001 670 25.7 2002 597 22.9 1,267 48.7 2001 2,932 2001 - - 2002 1,369 46.7 2003 1,464 49.9 2,833 96.6 2002 2,741 2002 - - 2003 1,169 42.6
Orkney
2003 2,964 2003 - -
24
42
SSmmoollttss ppuutt ttoo sseeaa ((000000ss)) HHaarrvveesstt iinn yyeeaarr 00 HHaarrvveesstt iinn yyeeaarr 11 HHaarrvveesstt iinn yyeeaarr 22 TToottaall HHaarrvveesstt
((==ssuurrvviivvaall))RReeggiioonnYYeeaarr NNoo YYeeaarr NNoo %% YYeeaarr NNoo %% YYeeaarr NNoo %% NNoo %%
6.17 095,3 9.42 842,1 4991 7.64 243,2 3991 - - 2991 410,5 2991 7.49 743,4 6.12 399 5991 1.37 453,3 4991 - - 3991 194,4 3991 3.89 529,4 8.63 648,1 6991 0.16 550,3 5991 5.0 42 4991 210,5 4991 5.59 346,5 4.44 226,2 7991 0.25 120,3 6991 7.0 14 5991 118,5 5991 7.97 669,4 3.81 141,1 8991 4.16 828,3 7991 - - 6991 432,6 6991 6.38 001,11 9.82 538,3 9991 7.45 562,7 8991 - - 7991 672,31 7991 1.28 953,01 9.73 387,4 0002 6.34 894,5 9991 6.0 87 8991 716,21 8991 2.77 087,9 7.23 931,4 1002 0.44 675,5 0002 5.0 56 9991 366,21 9991 1.46 086,9 3.03 875,4 2002 8.33 201,5 1002 - - 0002 690,51 0002 7.38 165,41 8.54 379,7 3002 2.73 564,6 2002 7.0 321 1002 893,71 1002
9.33 058,5 3002 - - 2002 062,71 2002
dnaltehS
- - 3002 644,41 3002 4.17 948,2 6.92 281,1 4991 8.14 766,1 3991 - - 2991 989,3 2991 5.86 515,3 6.32 512,1 5991 8.44 003,2 4991 - - 3991 131,5 3991 5.69 454,4 6.13 064,1 6991 9.46 499,2 5991 - - 4991 416,4 4991 1.27 246,4 0.12 943,1 7991 8.05 862,3 6991 4.0 52 5991 734,6 5991 2.84 987,4 2.41 804,1 8991 4.33 713,3 7991 6.0 46 6991 429,9 6991 8.55 134,6 0.02 503,2 9991 8.53 621,4 8991 - - 7991 045,11 7991 8.26 580,4 1.32 105,1 0002 1.93 345,2 9991 6.0 14 8991 505,6 8991 2.47 389,3 7.93 131,2 1002 3.03 626,1 0002 2.4 622 9991 073,5 9991 7.69 985,7 3.73 529,2 2002 0.85 455,4 1002 4.1 011 0002 158,7 0002 7.87 630,6 4.93 220,3 3002 3.93 410,3 2002 - - 1002 766,7 1002
8.05 167,3 3002 - - 2002 304,7 2002
tseW htuoS
- - 3002 438,6 3002 6.97 445,2 1.52 208 4991 5.45 247,1 3991 - - 2991 591,3 2991 5.79 437,2 4.92 528 5991 1.86 909,1 4991 - - 3991 508,2 3991 4.59 918,3 0.11 244 6991 3.18 252,3 5991 1.3 521 4991 200,4 4991 3.98 755,3 1.61 146 7991 2.17 638,2 6991 0.2 08 5991 389,3 5991 1.79 389,4 6.9 194 8991 5.48 043,4 7991 0.3 251 6991 731,5 6991 6.58 715,4 5.8 744 9991 9.37 009,3 8991 2.3 071 7991 472,5 7991 2.57 639,4 5.4 492 0002 9.76 554,4 9991 8.2 781 8991 955,6 8991 2.27 790,6 0.01 748 1002 3.75 938,4 0002 9.4 114 9991 544,8 9991 5.38 459,6 3.31 011,1 2002 8.76 646,5 1002 4.2 891 0002 523,8 0002 6.18 416,5 2.01 507 3002 4.66 865,4 2002 9.4 143 1002 978,6 1002
9.74 518,4 3002 4.1 731 2002 840,01 2002
selsI nretseW
3.1 28 3002 654,6 3002
25
26
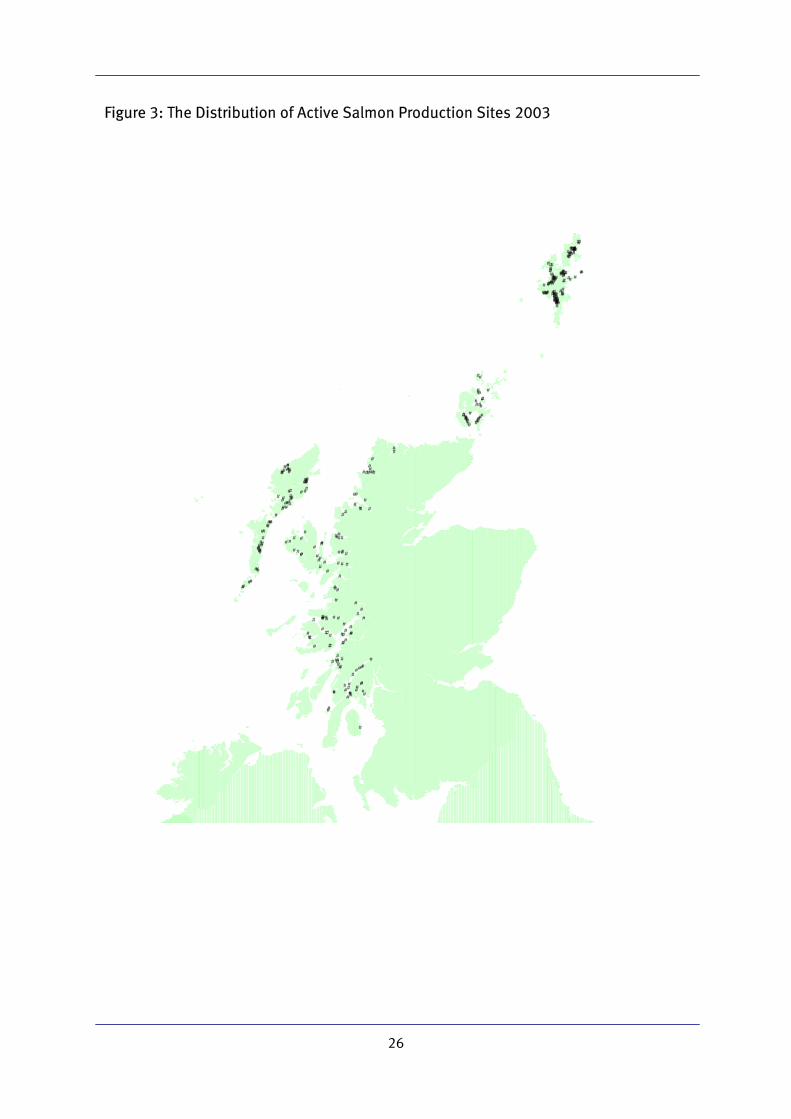
Figure 3: The Distribution of Active Salmon Production Sites 2003
#
#
#
#
#
#
#
#
#
###
#
#
#
#
##
#
#
#
#
#
#
## #
#
#
#
#
#
#
#
#
#
#
#
#
##
#
#
##
#
#
#
#
#
#
#
#
#
#
#
#
#
#
#
#
#
#
#
#
#
#
#
#
#
#
#
##
#
#
#
#
#
#
#
#
#
#
#
#
#
#
#
#
##
#
##
#
#
##
#
#
#
#
#
#
#
#
#
#
#
#
##
#
#
#
#
#
#
##
#
#
#
#
##
#
#
#
#
##
#
#
#
#
#
#
##
# #
#
#
#
#
#
#
#
#
#
#
#
##
#
#
#
##
#
#
##
#
#
#
#
#
#
#
#
#
#
#
#
#
#
#
#
##
#
#
#
#
#
#
#
#
#
#
#
#
#
#
#
#
#
#
##
#
#
#
###
#
#
##
#
##
#
#
##
#
#
#
#
#
#
#
#
##
#
#
#
#
#
#
#
##
#
#
##
#
#
#
#
#
#
#
##
#
#
#
#
#
#
#
#
#
#
#
#
#
#
#
###
#
#
#
#
#
#
#
#
#
#
#
#
#
#
# #
###
#
#
#
#
#
#
#
#
##
##
#
#
#
#
#
#
#
#
#
# #
#
#
#
#
#
#
#
#
#
## #
#
#
#
###
#
##
27
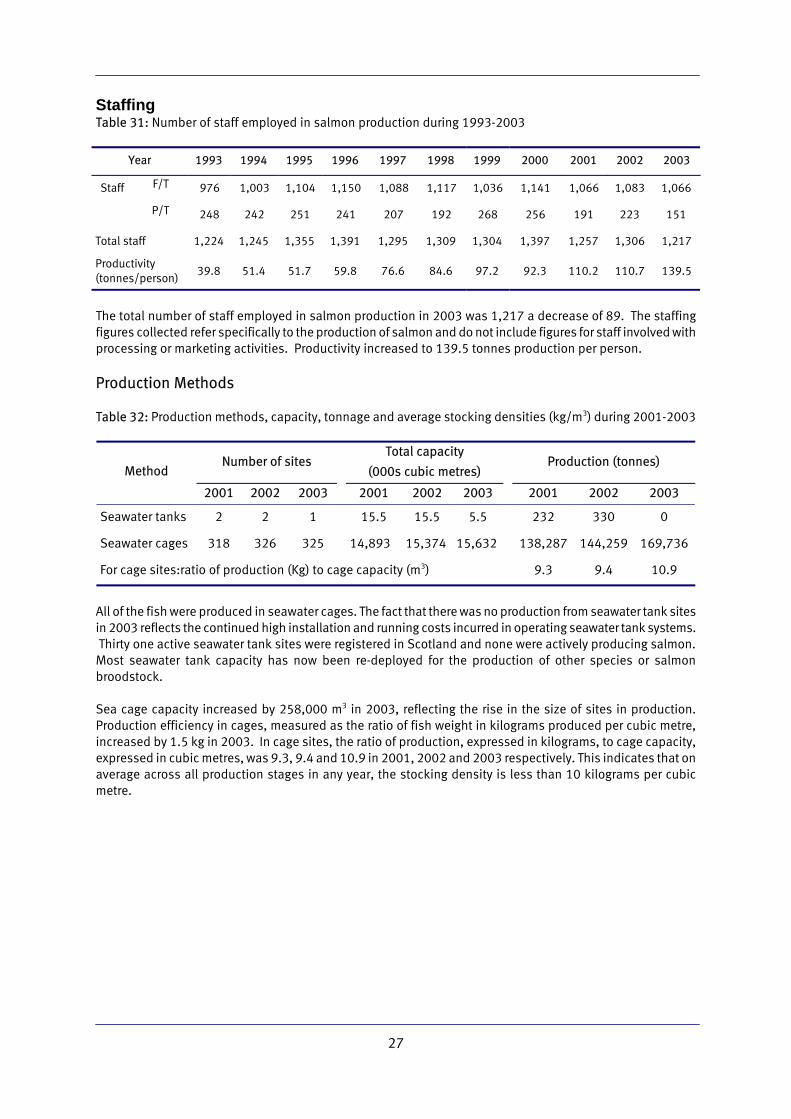
Staffing Table 31: Number of staff employed in salmon production during 1993-2003
Year 1993 1994 1995 1996 1997 1998 1999 2000 2001 2002 2003
Staff F/T 976 1,003 1,104 1,150 1,088 1,117 1,036 1,141 1,066 1,083 1,066
P/T 248 242 251 241 207 192 268 256 191 223 151
Total staff 1,224 1,245 1,355 1,391 1,295 1,309 1,304 1,397 1,257 1,306 1,217
Productivity (tonnes/person)
39.8 51.4 51.7 59.8 76.6 84.6 97.2 92.3 110.2 110.7 139.5
The total number of staff employed in salmon production in 2003 was 1,217 a decrease of 89. The staffing figures collected refer specifically to the production of salmon and do not include figures for staff involved with processing or marketing activities. Productivity increased to 139.5 tonnes production per person.
Production Methods Table 32: Production methods, capacity, tonnage and average stocking densities (kg/m3) during 2001-2003
Number of sites Total capacity
(000s cubic metres)
Production (tonnes)
Method
2001 2002 2003 2001 2002 2003 2001 2002 2003
Seawater tanks 2 2 1 15.5 15.5 5.5 232 330 0
Seawater cages 318 326 325 14,893 15,374 15,632 138,287 144,259 169,736
For cage sites:ratio of production (Kg) to cage capacity (m3) 9.3 9.4 10.9
All of the fish were produced in seawater cages. The fact that there was no production from seawater tank sites in 2003 reflects the continued high installation and running costs incurred in operating seawater tank systems. Thirty one active seawater tank sites were registered in Scotland and none were actively producing salmon. Most seawater tank capacity has now been re-deployed for the production of other species or salmon broodstock. Sea cage capacity increased by 258,000 m3 in 2003, reflecting the rise in the size of sites in production. Production efficiency in cages, measured as the ratio of fish weight in kilograms produced per cubic metre, increased by 1.5 kg in 2003. In cage sites, the ratio of production, expressed in kilograms, to cage capacity, expressed in cubic metres, was 9.3, 9.4 and 10.9 in 2001, 2002 and 2003 respectively. This indicates that on average across all production stages in any year, the stocking density is less than 10 kilograms per cubic metre.
28
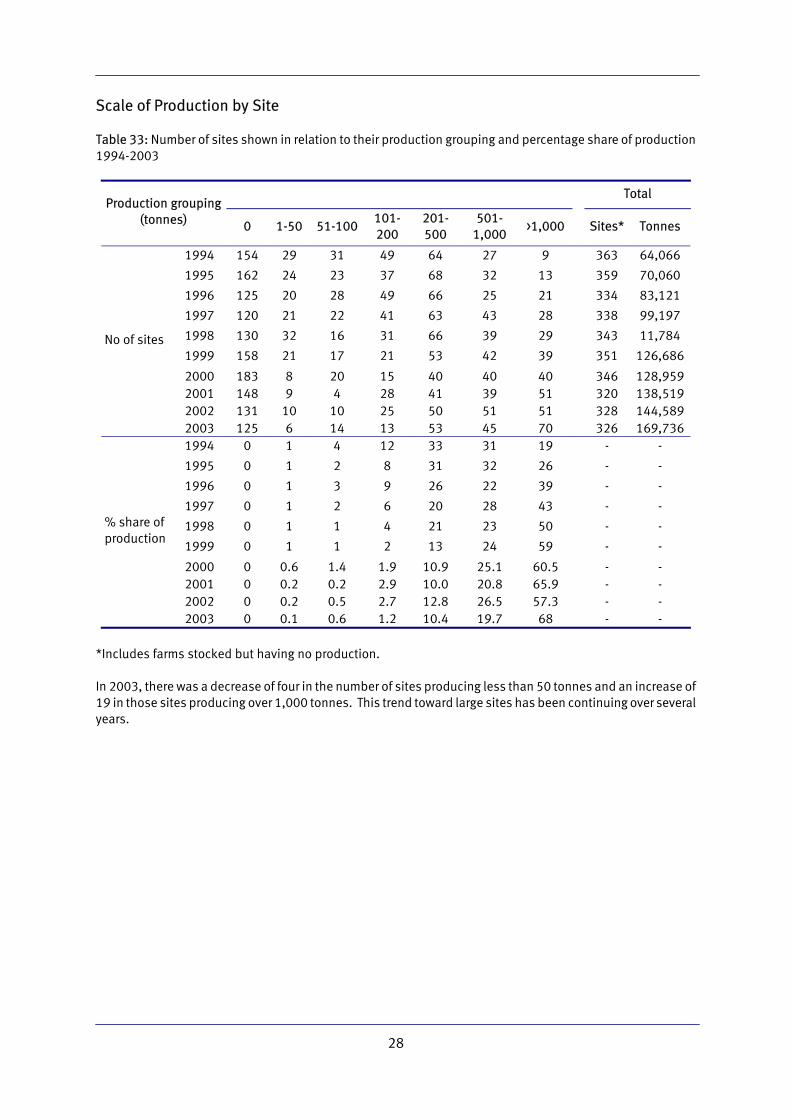
Scale of Production by Site Table 33: Number of sites shown in relation to their production grouping and percentage share of production 1994-2003
Total Production grouping
(tonnes) 0 1-50 51-100 101-200
201-500
501-1,000
>1,000 Sites* Tonnes
1994 154 29 31 49 64 27 9 363 64,066
1995 162 24 23 37 68 32 13 359 70,060
1996 125 20 28 49 66 25 21 334 83,121
1997 120 21 22 41 63 43 28 338 99,197
1998 130 32 16 31 66 39 29 343 11,784
1999 158 21 17 21 53 42 39 351 126,686
2000 183 8 20 15 40 40 40 346 128,959 2001 148 9 4 28 41 39 51 320 138,519 2002 131 10 10 25 50 51 51 328 144,589
No of sites
2003 125 6 14 13 53 45 70 326 169,736 1994 0 1 4 12 33 31 19 - -
1995 0 1 2 8 31 32 26 - -
1996 0 1 3 9 26 22 39 - -
1997 0 1 2 6 20 28 43 - -
1998 0 1 1 4 21 23 50 - -
1999 0 1 1 2 13 24 59 - -
2000 0 0.6 1.4 1.9 10.9 25.1 60.5 - - 2001 0 0.2 0.2 2.9 10.0 20.8 65.9 - - 2002 0 0.2 0.5 2.7 12.8 26.5 57.3 - -
% share of production
2003 0 0.1 0.6 1.2 10.4 19.7 68 - -
*Includes farms stocked but having no production. In 2003, there was a decrease of four in the number of sites producing less than 50 tonnes and an increase of 19 in those sites producing over 1,000 tonnes. This trend toward large sites has been continuing over several years.
29
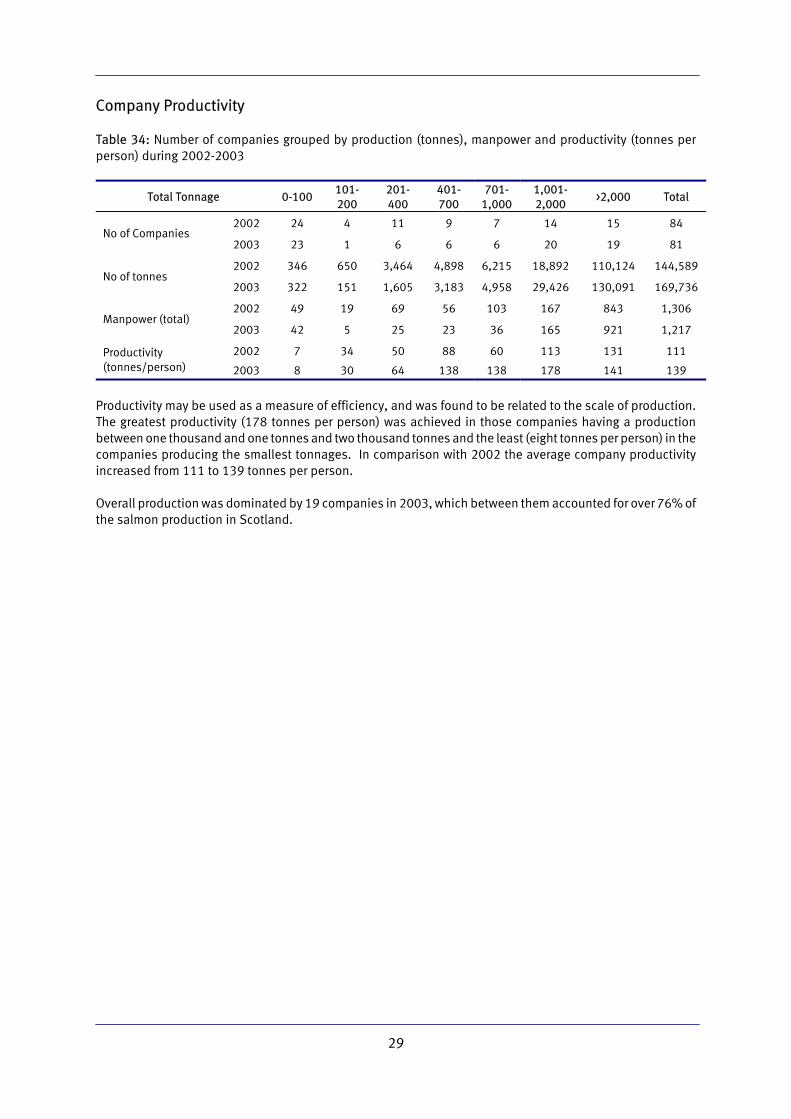
Company Productivity Table 34: Number of companies grouped by production (tonnes), manpower and productivity (tonnes per person) during 2002-2003
Total Tonnage 0-100 101-200
201-400
401-700
701-1,000
1,001-2,000
>2,000 Total
2002 24 4 11 9 7 14 15 84 No of Companies
2003 23 1 6 6 6 20 19 81
2002 346 650 3,464 4,898 6,215 18,892 110,124 144,589 No of tonnes
2003 322 151 1,605 3,183 4,958 29,426 130,091 169,736
2002 49 19 69 56 103 167 843 1,306 Manpower (total)
2003 42 5 25 23 36 165 921 1,217
2002 7 34 50 88 60 113 131 111 Productivity (tonnes/person) 2003 8 30 64 138 138 178 141 139
Productivity may be used as a measure of efficiency, and was found to be related to the scale of production. The greatest productivity (178 tonnes per person) was achieved in those companies having a production between one thousand and one tonnes and two thousand tonnes and the least (eight tonnes per person) in the companies producing the smallest tonnages. In comparison with 2002 the average company productivity increased from 111 to 139 tonnes per person. Overall production was dominated by 19 companies in 2003, which between them accounted for over 76% of the salmon production in Scotland.
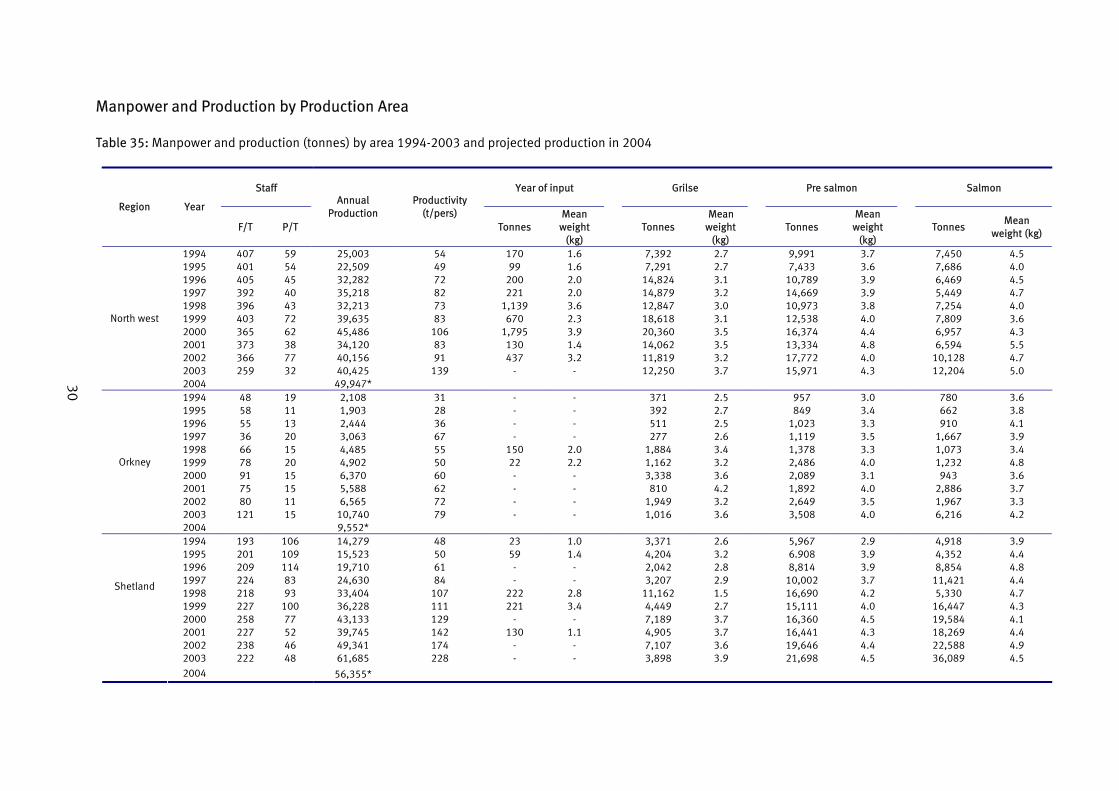
Manpower and Production by Production Area Table 35: Manpower and production (tonnes) by area 1994-2003 and projected production in 2004
Staff Year of input
Grilse
Pre salmon
Salmon
Region Year
F/T P/T
Annual Production
Productivity (t/pers)
Tonnes Mean
weight (kg)
Tonnes
Mean weight
(kg)
Tonnes
Mean weight
(kg)
Tonnes
Mean weight (kg)
1994 407 59 25,003 54 170 1.6 7,392 2.7 9,991 3.7 7,450 4.5 1995 401 54 22,509 49 99 1.6 7,291 2.7 7,433 3.6 7,686 4.0 1996 405 45 32,282 72 200 2.0 14,824 3.1 10,789 3.9 6,469 4.5 1997 392 40 35,218 82 221 2.0 14,879 3.2 14,669 3.9 5,449 4.7 1998 396 43 32,213 73 1,139 3.6 12,847 3.0 10,973 3.8 7,254 4.0 1999 403 72 39,635 83 670 2.3 18,618 3.1 12,538 4.0 7,809 3.6 2000 365 62 45,486 106 1,795 3.9 20,360 3.5 16,374 4.4 6,957 4.3 2001 373 38 34,120 83 130 1.4 14,062 3.5 13,334 4.8 6,594 5.5 2002 366 77 40,156 91 437 3.2 11,819 3.2 17,772 4.0 10,128 4.7 2003 259 32 40,425 139 - - 12,250 3.7 15,971 4.3 12,204 5.0
North west
2004 49,947* 1994 48 19 2,108 31 - - 371 2.5 957 3.0 780 3.6 1995 58 11 1,903 28 - - 392 2.7 849 3.4 662 3.8 1996 55 13 2,444 36 - - 511 2.5 1,023 3.3 910 4.1 1997 36 20 3,063 67 - - 277 2.6 1,119 3.5 1,667 3.9 1998 66 15 4,485 55 150 2.0 1,884 3.4 1,378 3.3 1,073 3.4 1999 78 20 4,902 50 22 2.2 1,162 3.2 2,486 4.0 1,232 4.8 2000 91 15 6,370 60 - - 3,338 3.6 2,089 3.1 943 3.6 2001 75 15 5,588 62 - - 810 4.2 1,892 4.0 2,886 3.7 2002 80 11 6,565 72 - - 1,949 3.2 2,649 3.5 1,967 3.3 2003 121 15 10,740 79 - - 1,016 3.6 3,508 4.0 6,216 4.2
Orkney
2004 9,552* 1994 193 106 14,279 48 23 1.0 3,371 2.6 5,967 2.9 4,918 3.9 1995 201 109 15,523 50 59 1.4 4,204 3.2 6.908 3.9 4,352 4.4 1996 209 114 19,710 61 - - 2,042 2.8 8,814 3.9 8,854 4.8 1997 224 83 24,630 84 - - 3,207 2.9 10,002 3.7 11,421 4.4 1998 218 93 33,404 107 222 2.8 11,162 1.5 16,690 4.2 5,330 4.7 1999 227 100 36,228 111 221 3.4 4,449 2.7 15,111 4.0 16,447 4.3 2000 258 77 43,133 129 - - 7,189 3.7 16,360 4.5 19,584 4.1
Shetland
2001 227 52 39,745 142 130 1.1 4,905 3.7 16,441 4.3 18,269 4.4 2002 238 46 49,341 174 - - 7,107 3.6 19,646 4.4 22,588 4.9
2003 222 48 61,685 228 - - 3,898 3.9 21,698 4.5 36,089 4.5 2004 56,355*
30
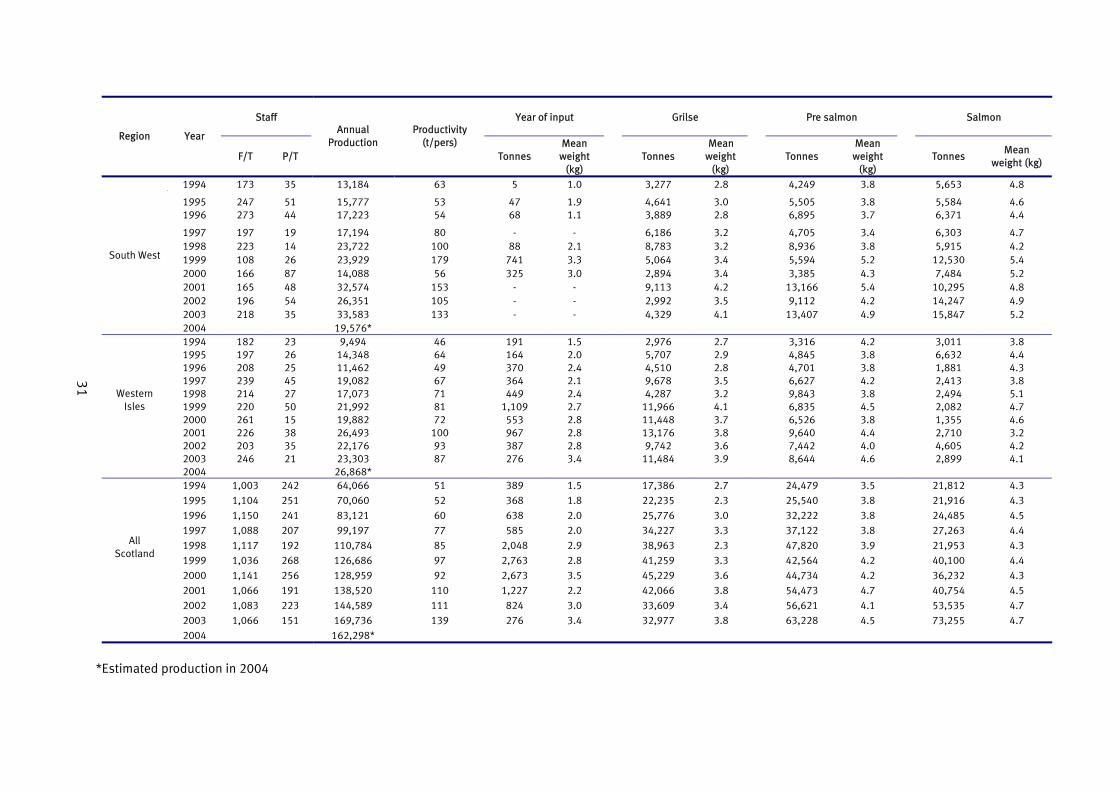
Staff Year of input
Grilse
Pre salmon
Salmon
Region Year
F/T P/T
Annual Production
Productivity (t/pers)
Tonnes Mean
weight (kg)
Tonnes
Mean weight
(kg)
Tonnes
Mean weight
(kg)
Tonnes
Mean weight (kg)
1994 173 35 13,184 63 5 1.0 3,277 2.8 4,249 3.8 5,653 4.8
1995 1996
247 273
51 44
15,777 17,223
53 54
47 68
1.9 1.1
4,641 3,889
3.0 2.8
5,505 6,895
3.8 3.7
5,584 6,371
4.6 4.4
1997 197 19 17,194 80 - - 6,186 3.2 4,705 3.4 6,303 4.7 1998 223 14 23,722 100 88 2.1 8,783 3.2 8,936 3.8 5,915 4.2 1999 108 26 23,929 179 741 3.3 5,064 3.4 5,594 5.2 12,530 5.4 2000 166 87 14,088 56 325 3.0 2,894 3.4 3,385 4.3 7,484 5.2 2001 165 48 32,574 153 - - 9,113 4.2 13,166 5.4 10,295 4.8 2002 196 54 26,351 105 - - 2,992 3.5 9,112 4.2 14,247 4.9 2003 218 35 33,583 133 - - 4,329 4.1 13,407 4.9 15,847 5.2
South West
2004 19,576* 1994 182 23 9,494 46 191 1.5 2,976 2.7 3,316 4.2 3,011 3.8 1995 197 26 14,348 64 164 2.0 5,707 2.9 4,845 3.8 6,632 4.4 1996 208 25 11,462 49 370 2.4 4,510 2.8 4,701 3.8 1,881 4.3 1997 239 45 19,082 67 364 2.1 9,678 3.5 6,627 4.2 2,413 3.8 1998 214 27 17,073 71 449 2.4 4,287 3.2 9,843 3.8 2,494 5.1 1999 220 50 21,992 81 1,109 2.7 11,966 4.1 6,835 4.5 2,082 4.7 2000 261 15 19,882 72 553 2.8 11,448 3.7 6,526 3.8 1,355 4.6 2001 226 38 26,493 100 967 2.8 13,176 3.8 9,640 4.4 2,710 3.2 2002 203 35 22,176 93 387 2.8 9,742 3.6 7,442 4.0 4,605 4.2
Western Isles
2003 246 21 23,303 87 276 3.4 11,484 3.9 8,644 4.6 2,899 4.1 2004 26,868*
1994 1,003 242 64,066 51 389 1.5 17,386 2.7 24,479 3.5 21,812 4.3 1995 1,104 251 70,060 52 368 1.8 22,235 2.3 25,540 3.8 21,916 4.3 1996 1,150 241 83,121 60 638 2.0 25,776 3.0 32,222 3.8 24,485 4.5 1997 1,088 207 99,197 77 585 2.0 34,227 3.3 37,122 3.8 27,263 4.4 1998 1,117 192 110,784 85 2,048 2.9 38,963 2.3 47,820 3.9 21,953 4.3 1999 1,036 268 126,686 97 2,763 2.8 41,259 3.3 42,564 4.2 40,100 4.4 2000 1,141 256 128,959 92 2,673 3.5 45,229 3.6 44,734 4.2 36,232 4.3 2001 1,066 191 138,520 110 1,227 2.2 42,066 3.8 54,473 4.7 40,754 4.5 2002 1,083 223 144,589 111 824 3.0 33,609 3.4 56,621 4.1 53,535 4.7 2003 1,066 151 169,736 139 276 3.4 32,977 3.8 63,228 4.5 73,255 4.7
All Scotland
2004 162,298*
*Estimated production in 2004
31
32
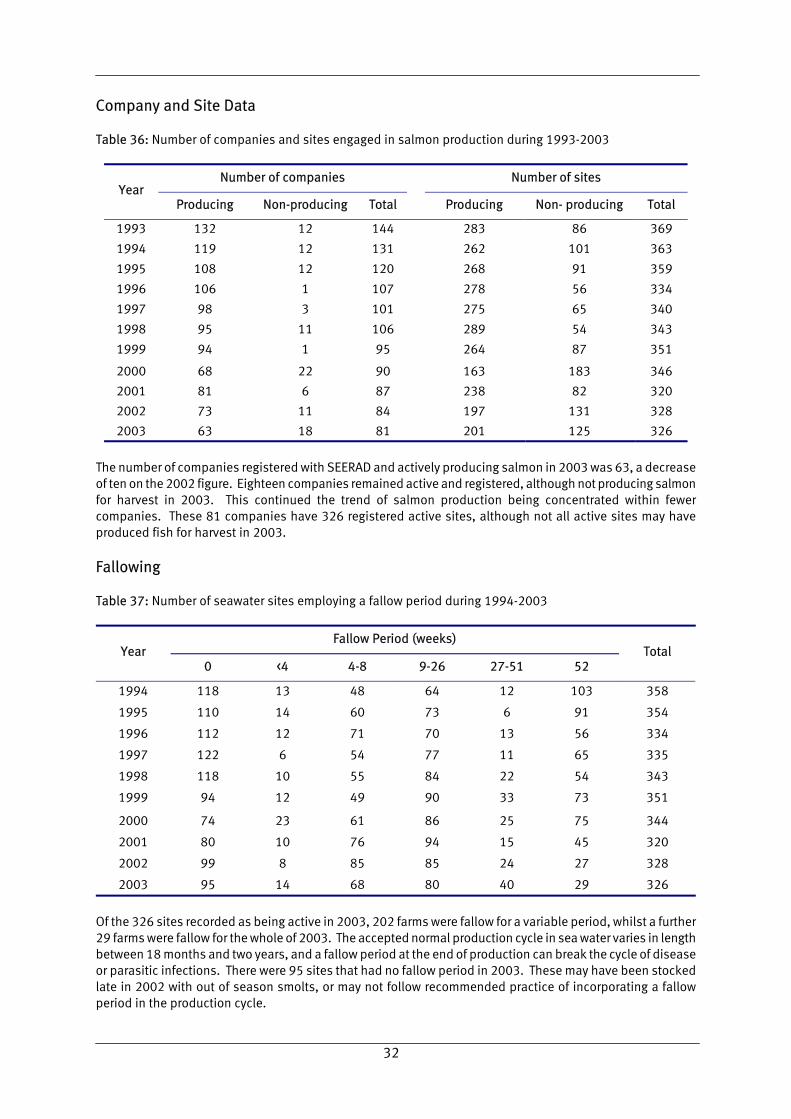
Company and Site Data Table 36: Number of companies and sites engaged in salmon production during 1993-2003
Number of companies Number of sites Year
Producing Non-producing Total
Producing Non- producing Total
1993 132 12 144 283 86 369
1994 119 12 131 262 101 363
1995 108 12 120 268 91 359
1996 106 1 107 278 56 334
1997 98 3 101 275 65 340
1998 95 11 106 289 54 343
1999 94 1 95 264 87 351
2000 68 22 90 163 183 346
2001 81 6 87 238 82 320
2002 73 11 84 197 131 328
2003 63 18 81 201 125 326
The number of companies registered with SEERAD and actively producing salmon in 2003 was 63, a decrease of ten on the 2002 figure. Eighteen companies remained active and registered, although not producing salmon for harvest in 2003. This continued the trend of salmon production being concentrated within fewer companies. These 81 companies have 326 registered active sites, although not all active sites may have produced fish for harvest in 2003.
Fallowing Table 37: Number of seawater sites employing a fallow period during 1994-2003
Fallow Period (weeks) Year
0 <4 4-8 9-26 27-51 52 Total
1994 118 13 48 64 12 103 358
1995 110 14 60 73 6 91 354
1996 112 12 71 70 13 56 334
1997 122 6 54 77 11 65 335
1998 118 10 55 84 22 54 343
1999 94 12 49 90 33 73 351
2000 74 23 61 86 25 75 344
2001 80 10 76 94 15 45 320
2002 99 8 85 85 24 27 328
2003 95 14 68 80 40 29 326
Of the 326 sites recorded as being active in 2003, 202 farms were fallow for a variable period, whilst a further 29 farms were fallow for the whole of 2003. The accepted normal production cycle in sea water varies in length between 18 months and two years, and a fallow period at the end of production can break the cycle of disease or parasitic infections. There were 95 sites that had no fallow period in 2003. These may have been stocked late in 2002 with out of season smolts, or may not follow recommended practice of incorporating a fallow period in the production cycle.
33
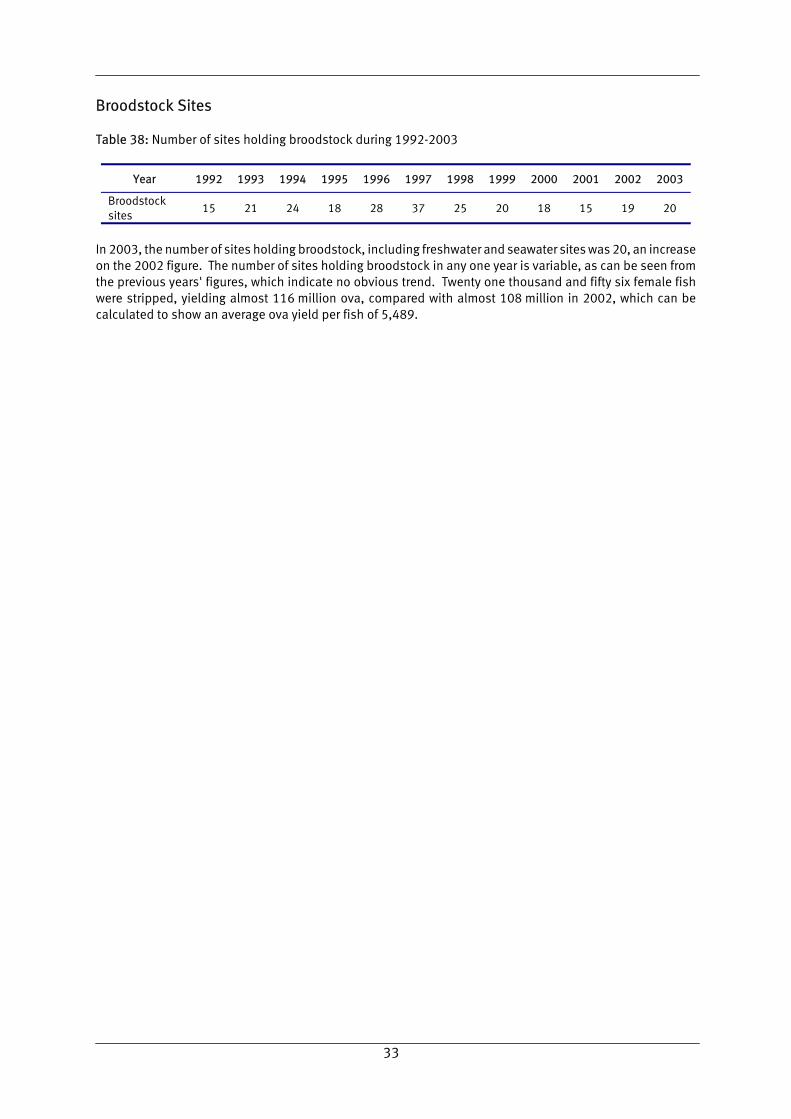
Broodstock Sites Table 38: Number of sites holding broodstock during 1992-2003
Year 1992 1993 1994 1995 1996 1997 1998 1999 2000 2001 2002 2003
Broodstock sites
15 21 24 18 28 37 25 20 18 15 19 20
In 2003, the number of sites holding broodstock, including freshwater and seawater sites was 20, an increase on the 2002 figure. The number of sites holding broodstock in any one year is variable, as can be seen from the previous years' figures, which indicate no obvious trend. Twenty one thousand and fifty six female fish were stripped, yielding almost 116 million ova, compared with almost 108 million in 2002, which can be calculated to show an average ova yield per fish of 5,489.
34
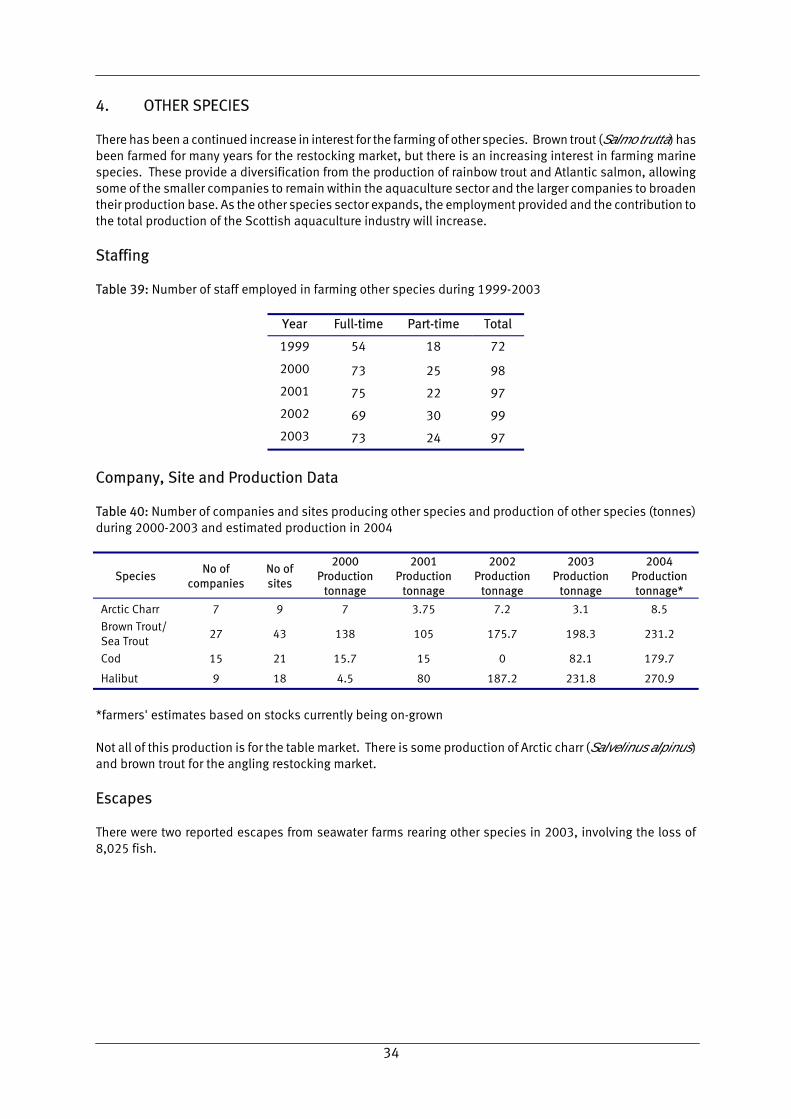
4. OTHER SPECIES There has been a continued increase in interest for the farming of other species. Brown trout (Salmo trutta) has been farmed for many years for the restocking market, but there is an increasing interest in farming marine species. These provide a diversification from the production of rainbow trout and Atlantic salmon, allowing some of the smaller companies to remain within the aquaculture sector and the larger companies to broaden their production base. As the other species sector expands, the employment provided and the contribution to the total production of the Scottish aquaculture industry will increase.
Staffing Table 39: Number of staff employed in farming other species during 1999-2003
Year Full-time Part-time Total
1999 54 18 72
2000 73 25 98
2001 75 22 97
2002 69 30 99
2003 73 24 97
Company, Site and Production Data Table 40: Number of companies and sites producing other species and production of other species (tonnes) during 2000-2003 and estimated production in 2004
Species No of
companies No of sites
2000 Production
tonnage
2001 Production
tonnage
2002 Production
tonnage
2003 Production
tonnage
2004 Production tonnage*
Arctic Charr 7 9 7 3.75 7.2 3.1 8.5
Brown Trout/ Sea Trout
27 43 138 105 175.7 198.3 231.2
Cod 15 21 15.7 15 0 82.1 179.7
Halibut 9 18 4.5 80 187.2 231.8 270.9
*farmers' estimates based on stocks currently being on-grown Not all of this production is for the table market. There is some production of Arctic charr (Salvelinus alpinus) and brown trout for the angling restocking market.
Escapes There were two reported escapes from seawater farms rearing other species in 2003, involving the loss of 8,025 fish.
35
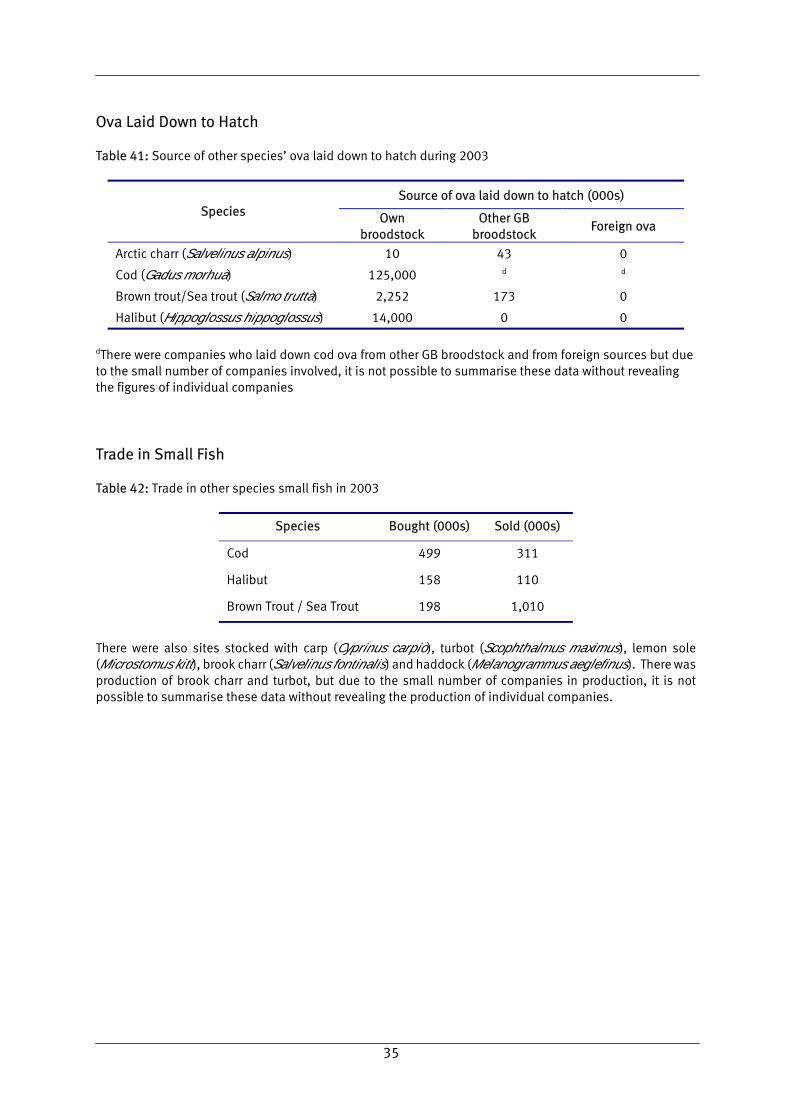
Ova Laid Down to Hatch Table 41: Source of other species� ova laid down to hatch during 2003
Source of ova laid down to hatch (000s) Species Own
broodstock Other GB
broodstock Foreign ova
Arctic charr (Salvelinus alpinus) 10 43 0
Cod (Gadus morhua) 125,000 d d
Brown trout/Sea trout (Salmo trutta) 2,252 173 0
Halibut (Hippoglossus hippoglossus) 14,000 0 0
dThere were companies who laid down cod ova from other GB broodstock and from foreign sources but due to the small number of companies involved, it is not possible to summarise these data without revealing the figures of individual companies
Trade in Small Fish Table 42: Trade in other species small fish in 2003
Species Bought (000s) Sold (000s)
Cod 499 311
Halibut 158 110
Brown Trout / Sea Trout 198 1,010
There were also sites stocked with carp (Cyprinus carpio), turbot (Scophthalmus maximus), lemon sole (Microstomus kitt), brook charr (Salvelinus fontinalis) and haddock (Melanogrammus aeglefinus). There was production of brook charr and turbot, but due to the small number of companies in production, it is not possible to summarise these data without revealing the production of individual companies.
36
5. CONCLUSIONS
Rainbow trout (Oncorhynchus mykiss) The production of rainbow trout increased by 6% in 2003 to 7,085 tonnes and was directed at both the table (87.4%) and restocking (12.6%) markets. The total numbers of staff employed by the sector decreased by twelve to 148. As a consequence of this, the overall productivity of the industry increased to reach 47.9 tonnes per person. One of the reasons for this is the continued increase in the proportion of production from large farms that produce in excess of 200 tonnes. The number of ova laid down to hatch increased by over four million and was almost exclusively either all-female diploid (94%) or sterile triploid (6%) stocks. Only 2.7% of these ova were sourced within GB reflecting a continued rise in the numbers imported from abroad and a decline in the numbers of home produced ova. There was a significant decrease in the number of imports from South Africa with only 0.2% of the total. To meet the needs of out of season production there was an increase in the level of imports from the USA (43% of total ova imported) and the introduction of imports from a new supplier in France. The trend reflecting the high dependence of the Scottish trout industry on imported ova was maintained. There was a continuing trade in fingerlings, with the majority still being sourced within Scotland. A high percentage of stock was vaccinated against ERM, indicating producers' awareness of the risk of infectious diseases.
Atlantic salmon (Salmo salar) The survey shows increased production of salmon, improved productivity per person and improved yield from smolts. There was a decrease in the production of smolts and the yield from ova stayed the same. Smolt production decreased by 5.8% to 44.4 million with slightly under two thirds (64.9%) being S1 and the majority of the remainder being S½ (33.6%) smolts. The number of staff directly employed on freshwater sites decreased by 32. This resulted in an increase in productivity to over 119,000 fish per person. Although productivity per person increased, the actual number of smolts produced decreased by 5.8%. The number of ova laid down to hatch has decreased by 7%. The ratio of ova laid down to smolts produced has remained at 1.8 in 2003. Projected estimates for 2004 suggest that fewer ova were laid down to hatch, and that less smolts will be produced in 2004 followed by an increase in 2005. The majority of ova for the production of Scottish salmon was derived from Scottish farmed stocks, with 26% derived from non-Scottish stocks, an increase of 8% on reliance from foreign sources. The export of ova to other countries within the EU decreased by 67% and there were no exports to Chile. The production tonnage in sea water increased by 17.4% in 2003; due mainly to an increased average weight giving a higher yield per smolt put to sea. The number of staff directly employed on site decreased, with the loss of 89 jobs in the seawater industry. The estimated smolt placement in 2004 has decreased to 40.0 million and a decrease in production is expected in 2004 given the decrease in the number of smolts put to sea in 2003. The estimated harvest forecast for 2004 is 162,298 tonnes, a decrease of 4.4% on the 2003 total. Although the production tonnage increased in 2003, the number of sites in production decreased from 328 to 326. The trend towards increasing the size of producing sites continued with 57% of sites producing over 500 tonnes in 2003.
Other Species Interest in the diversification of aquaculture continues as steady progress within this sector was maintained. In 2003 there were significant increases in the tonnages of cod, halibut and sea trout produced. Industry has predicted further increases in production for 2004.
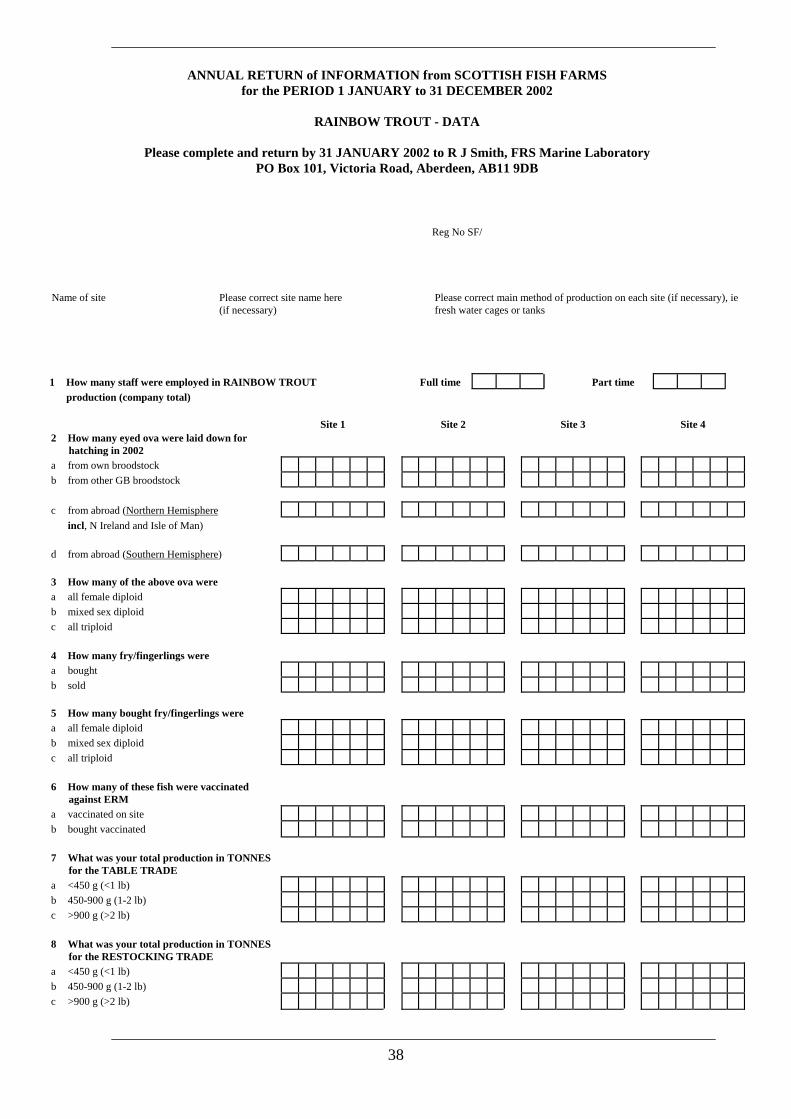
APPENDIX 1
Questionnaires sent to Fish Farmers
38
ANNUAL RETURN of INFORMATION from SCOTTISH FISH FARMS for the PERIOD 1 JANUARY to 31 DECEMBER 2002 RAINBOW TROUT - DATA Please complete and return by 31 JANUARY 2002 to R J Smith, FRS Marine Laboratory PO Box 101, Victoria Road, Aberdeen, AB11 9DB
Reg No SF/ Name of site
Please correct site name here (if necessary)
Please correct main method of production on each site (if necessary), ie fresh water cages or tanks
1 How many staff were employed in RAINBOW TROUT
Full time
Part time
production (company total)
Site 1 Site 2 Site 3 Site 4
2 How many eyed ova were laid down for hatching in 2002
a from own broodstock
b from other GB broodstock
c from abroad (Northern Hemisphere
incl, N Ireland and Isle of Man)
d from abroad (Southern Hemisphere)
3 How many of the above ova were
a all female diploid
b mixed sex diploid
c all triploid
4 How many fry/fingerlings were a bought
b sold
5 How many bought fry/fingerlings were
a all female diploid
b mixed sex diploid
c all triploid
6 How many of these fish were vaccinated against ERM
a vaccinated on site
b bought vaccinated
7 What was your total production in TONNES
for the TABLE TRADE
a <450 g (<1 lb)
b 450-900 g (1-2 lb)
c >900 g (>2 lb)
8 What was your total production in TONNES for the RESTOCKING TRADE
a <450 g (<1 lb)
b 450-900 g (1-2 lb)
c >900 g (>2 lb)
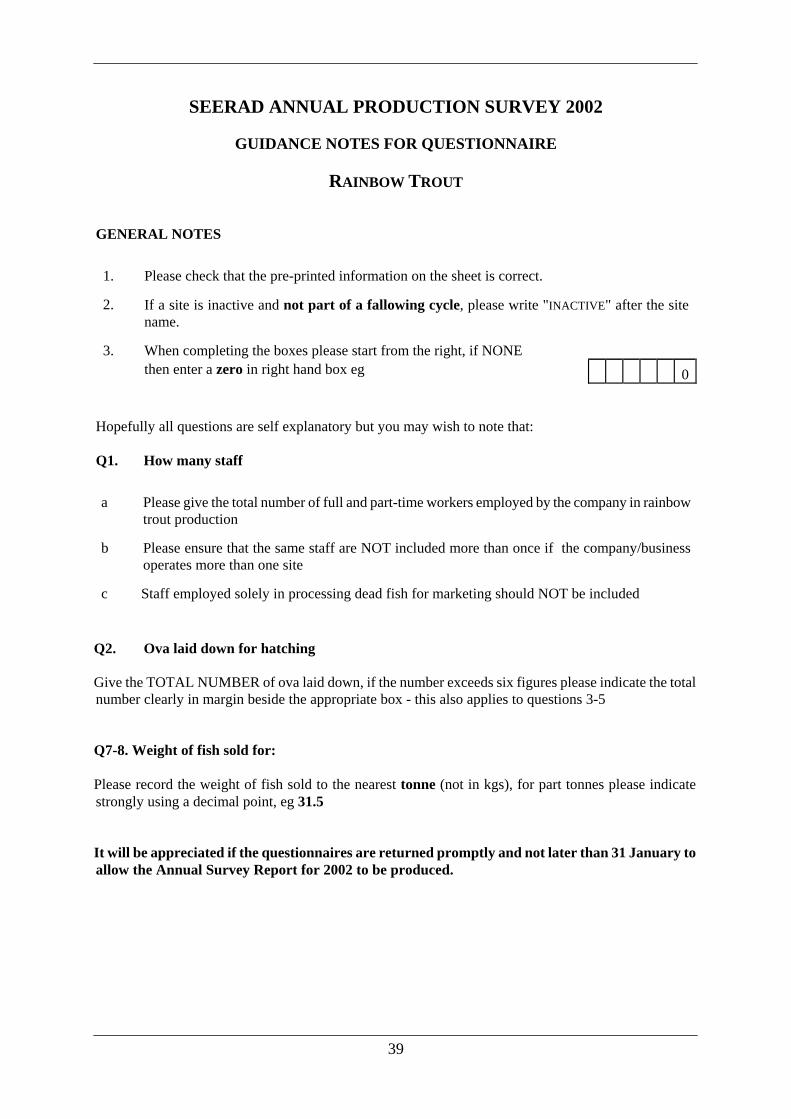
39
SEERAD ANNUAL PRODUCTION SURVEY 2002
GUIDANCE NOTES FOR QUESTIONNAIRE
RAINBOW TROUT GENERAL NOTES 1.
Please check that the pre-printed information on the sheet is correct.
2.
If a site is inactive and not part of a fallowing cycle, please write "INACTIVE" after the site name.
3.
When completing the boxes please start from the right, if NONE
then enter a zero in right hand box eg 0 Hopefully all questions are self explanatory but you may wish to note that: Q1. How many staff a
Please give the total number of full and part-time workers employed by the company in rainbow trout production
b
Please ensure that the same staff are NOT included more than once if the company/business operates more than one site
c
Staff employed solely in processing dead fish for marketing should NOT be included
Q2. Ova laid down for hatching Give the TOTAL NUMBER of ova laid down, if the number exceeds six figures please indicate the total number clearly in margin beside the appropriate box - this also applies to questions 3-5 Q7-8. Weight of fish sold for: Please record the weight of fish sold to the nearest tonne (not in kgs), for part tonnes please indicate strongly using a decimal point, eg 31.5 It will be appreciated if the questionnaires are returned promptly and not later than 31 January to allow the Annual Survey Report for 2002 to be produced.

40
ANNUAL RETURN OF INFORMATION FROM SCOTTISH FISH FARMS FOR THE PERIOD 1 JANUARY TO 31 DECEMBER 2002 ATLANTIC SALMON - SMOLT DATA Please complete and return by 31 JANUARY 2003 to R J Smith, FRS Marine Laboratory PO Box 101, Victoria Road, Aberdeen, AB11 9DB
Reg No SF/ Name of site
Please correct site name here (if necessary)
Please correct main method of production on each site (if necessary) ie fresh water cages or tanks
1 How many staff were employed in smolt production
Full time
Part time
(company total)
2 How many ova were produced in the winter
of 2001-2002 (company total)
3 How many eyed ova were laid down for
hatching in winter of 2001-2002 Site 1 Site 2 Site 3 Site 4
a From own farmed broodstock
b From other GB farmed broodstock
c From GB wild broodstock
d From foreign sources
4 How many eyed ova do you expect to hatch this winter (2002-2003)
5 How many fry or parr were a Transferred into the site
b Transferred out of the site
6 How many smolts were produced as a S2s (ie from 2002 hatch)
b S1s (ie from 2001 hatch)
c S12s (ie from 2000 hatch)
d S2s (ie from 2000 hatch)
7 How many smolts were sold as a S1s (incl S2s)
b S2s (incl S12s)
8 How many smolts do you expect to
produce for sea winter on-growing next spring (2003) as
a S1s (incl S2s)
b S2s (incl S12s)
9 How many smolts do you plan to
produce in 2004
10 What is the fish holding capacity of each site in cubic metres
11 Duration of FALLOW PERIOD in WEEKS (cage sites only)
12 How many fish did you vaccinate a against furunculosis
b against ERM
c against IPN
d against Vibrio spp.
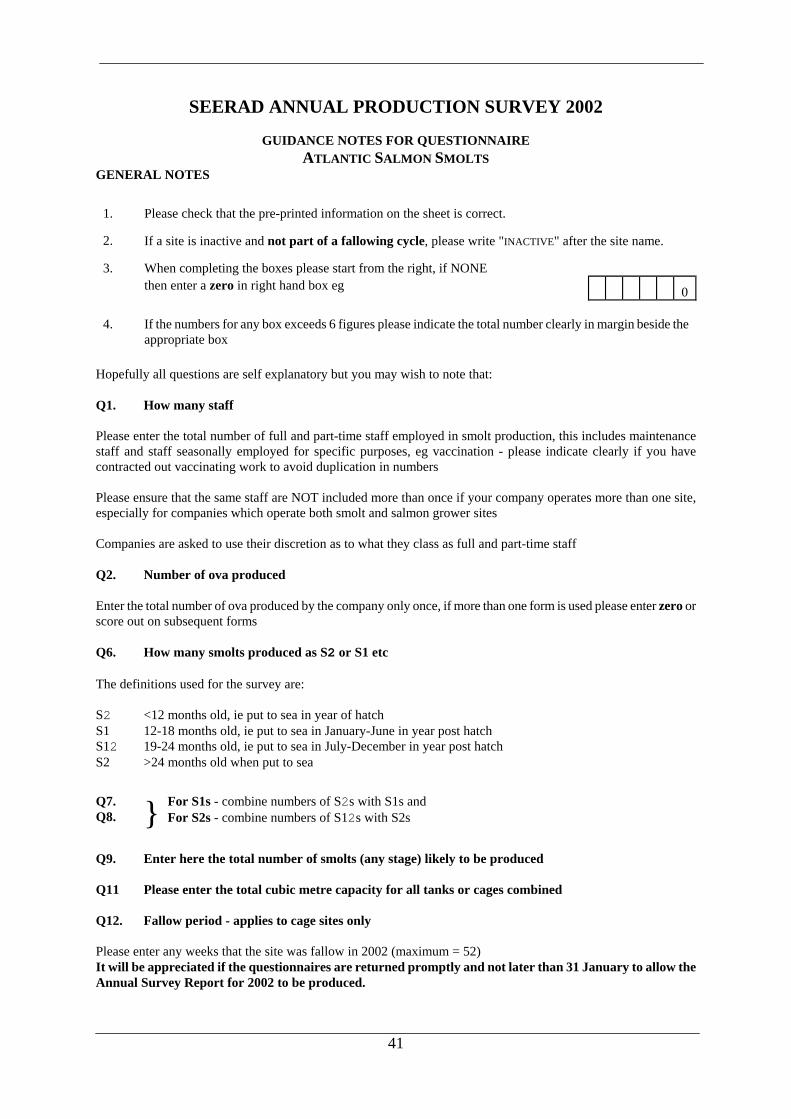
41
SEERAD ANNUAL PRODUCTION SURVEY 2002
GUIDANCE NOTES FOR QUESTIONNAIRE ATLANTIC SALMON SMOLTS
GENERAL NOTES
1.
Please check that the pre-printed information on the sheet is correct.
2.
If a site is inactive and not part of a fallowing cycle, please write "INACTIVE" after the site name.
3.
When completing the boxes please start from the right, if NONE
then enter a zero in right hand box eg 0 4.
If the numbers for any box exceeds 6 figures please indicate the total number clearly in margin beside the appropriate box
Hopefully all questions are self explanatory but you may wish to note that: Q1. How many staff Please enter the total number of full and part-time staff employed in smolt production, this includes maintenance staff and staff seasonally employed for specific purposes, eg vaccination - please indicate clearly if you have contracted out vaccinating work to avoid duplication in numbers Please ensure that the same staff are NOT included more than once if your company operates more than one site, especially for companies which operate both smolt and salmon grower sites Companies are asked to use their discretion as to what they class as full and part-time staff Q2. Number of ova produced Enter the total number of ova produced by the company only once, if more than one form is used please enter zero or score out on subsequent forms Q6. How many smolts produced as S2 or S1 etc The definitions used for the survey are: S2 <12 months old, ie put to sea in year of hatch S1 12-18 months old, ie put to sea in January-June in year post hatch S12 19-24 months old, ie put to sea in July-December in year post hatch S2 >24 months old when put to sea Q7. Q8.
}
For S1s - combine numbers of S2s with S1s and For S2s - combine numbers of S12s with S2s
Q9. Enter here the total number of smolts (any stage) likely to be produced Q11 Please enter the total cubic metre capacity for all tanks or cages combined Q12. Fallow period - applies to cage sites only Please enter any weeks that the site was fallow in 2002 (maximum = 52) It will be appreciated if the questionnaires are returned promptly and not later than 31 January to allow the Annual Survey Report for 2002 to be produced.
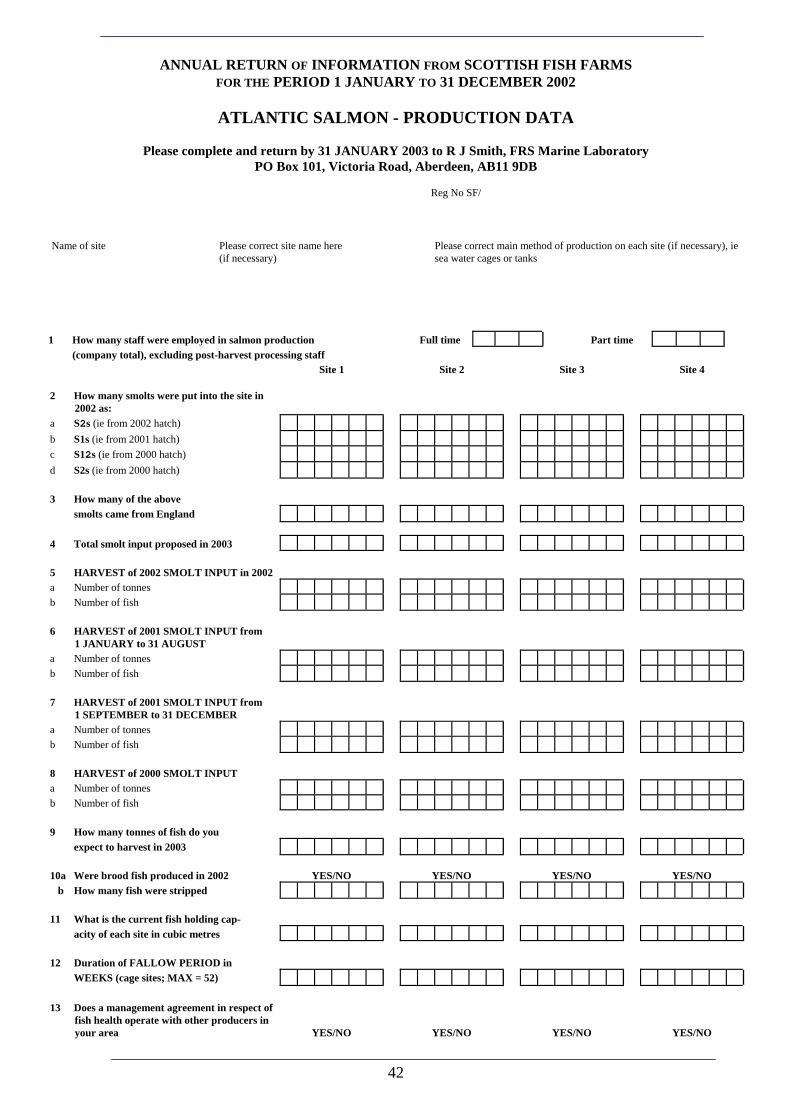
42
ANNUAL RETURN OF INFORMATION FROM SCOTTISH FISH FARMS FOR THE PERIOD 1 JANUARY TO 31 DECEMBER 2002
ATLANTIC SALMON - PRODUCTION DATA
Please complete and return by 31 JANUARY 2003 to R J Smith, FRS Marine Laboratory
PO Box 101, Victoria Road, Aberdeen, AB11 9DB
Reg No SF/ Name of site
Please correct site name here (if necessary)
Please correct main method of production on each site (if necessary), ie sea water cages or tanks
1 How many staff were employed in salmon production
Full time
Part time
(company total), excluding post-harvest processing staff
Site 1 Site 2 Site 3 Site 4
2 How many smolts were put into the site in 2002 as:
a S2s (ie from 2002 hatch)
b S1s (ie from 2001 hatch)
c S12s (ie from 2000 hatch)
d S2s (ie from 2000 hatch)
3 How many of the above
smolts came from England
4 Total smolt input proposed in 2003
5 HARVEST of 2002 SMOLT INPUT in 2002 a Number of tonnes
b Number of fish
6 HARVEST of 2001 SMOLT INPUT from
1 JANUARY to 31 AUGUST
a Number of tonnes
b Number of fish
7 HARVEST of 2001 SMOLT INPUT from
1 SEPTEMBER to 31 DECEMBER
a Number of tonnes
b Number of fish
8 HARVEST of 2000 SMOLT INPUT a Number of tonnes
b Number of fish
9 How many tonnes of fish do you expect to harvest in 2003
10a Were brood fish produced in 2002 YES/NO YES/NO YES/NO YES/NO b How many fish were stripped
11 What is the current fish holding cap-
acity of each site in cubic metres
12 Duration of FALLOW PERIOD in WEEKS (cage sites; MAX = 52)
13 Does a management agreement in respect of fish health operate with other producers in your area YES/NO YES/NO YES/NO YES/NO

43
SEERAD ANNUAL PRODUCTION SURVEY 2003
GUIDANCE NOTES FOR QUESTIONNAIRE ATLANTIC SALMON GENERAL NOTES
1.
Please check that the pre-printed information on the sheet is correct.
2.
If a site is inactive and not part of a fallowing cycle, please enter "INACTIVE" after the site name.
3.
If a site was used only to hold broodstock for stripping please enter "BRD" after the site name.
4.
When completing the boxes please start from the right eg for 250 tonnes enter
as 2 5 0 or if NONE then enter as 0 Hopefully all questions are self explanatory but you should note that: Q1. How many staff Please enter the total number of full and part-time workers employed in salmon production; this includes site staff, veterinary and maintenance staff, vaccination teams, administrative and harvesting staff but NOT processing or marketing staff Please ensure that the same staff are NOT included more than once if the company operates more than one site, especially if your company operates both salmon grower and smolt sites Q2. How many smolts put to sea The definitions used for the survey are: S2 <12 months old, ie put to sea in year of hatch S1 12-18 months old, ie put to sea in January-June in the year post hatch S12 19-24 months old, ie put to sea in July-December in the year post hatch S2 >24 months old, ie when put to sea Q10. Broodstock production Please circle YES if broodfish were produced on the site Q11. Fish holding capacity Please enter the total cubic metre capacity for all tanks and cages combined or, if not known, give the size of tanks or cages (area or circumference plus depth x nos tanks or cages) Q12. Fallow period For cage sites only; please enter any number of weeks a site was fallow in 2002; the total number of fallow weeks should not exceed 52 It will be appreciated if the questionnaires are returned promptly and not later that 31 January to allow the Annual Survey Report for 2002 to be produced.

44
ANNUAL RETURN of INFORMATION from SCOTTISH FISH FARMS for the PERIOD 1 JANUARY to 31 DECEMBER 2002
OTHER SPECIES - DATA
Please complete and return by 31 JANUARY 2003 to R J Smith, FRS Marine Laboratory,
PO Box 101, Victoria Road, Aberdeen, AB11 9DB
Business address:
Business number:
FB/0
Name of site
Site no
Species code
Main method of production
1
FS
2
FS
3
FS
4
FS
1.
How many staff in total were employed in other
Full time
Part time
species production (company total)
Site
Site
Site
Site
Species code
2.
How many ova were laid
down for hatching in 2002
a)
From own brood stock
b)
From GB brood stock
c)
From foreign sources
3.
How many fry/small fish were
a)
Bought
b)
Sold
4.
What was your total production
for the market in TONNES 5.
What is your predicted
production for the market in 2003 in TONNES
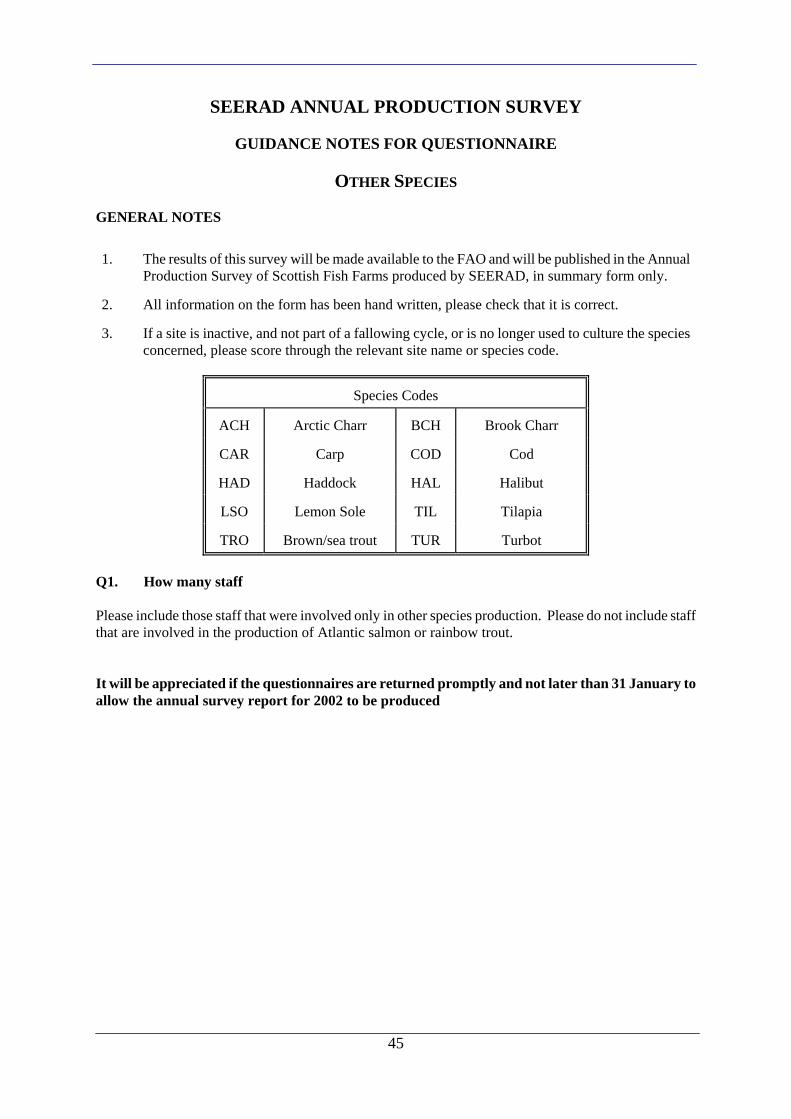
45
SEERAD ANNUAL PRODUCTION SURVEY
GUIDANCE NOTES FOR QUESTIONNAIRE
OTHER SPECIES GENERAL NOTES 1.
The results of this survey will be made available to the FAO and will be published in the Annual Production Survey of Scottish Fish Farms produced by SEERAD, in summary form only.
2.
All information on the form has been hand written, please check that it is correct.
3.
If a site is inactive, and not part of a fallowing cycle, or is no longer used to culture the species concerned, please score through the relevant site name or species code.
Species Codes
ACH
Arctic Charr
BCH
Brook Charr
CAR
Carp
COD
Cod
HAD
Haddock
HAL
Halibut
LSO
Lemon Sole
TIL
Tilapia
TRO
Brown/sea trout
TUR
Turbot
Q1. How many staff Please include those staff that were involved only in other species production. Please do not include staff that are involved in the production of Atlantic salmon or rainbow trout. It will be appreciated if the questionnaires are returned promptly and not later than 31 January to allow the annual survey report for 2002 to be produced
APPENDIX 2
Glossary and Abbreviations
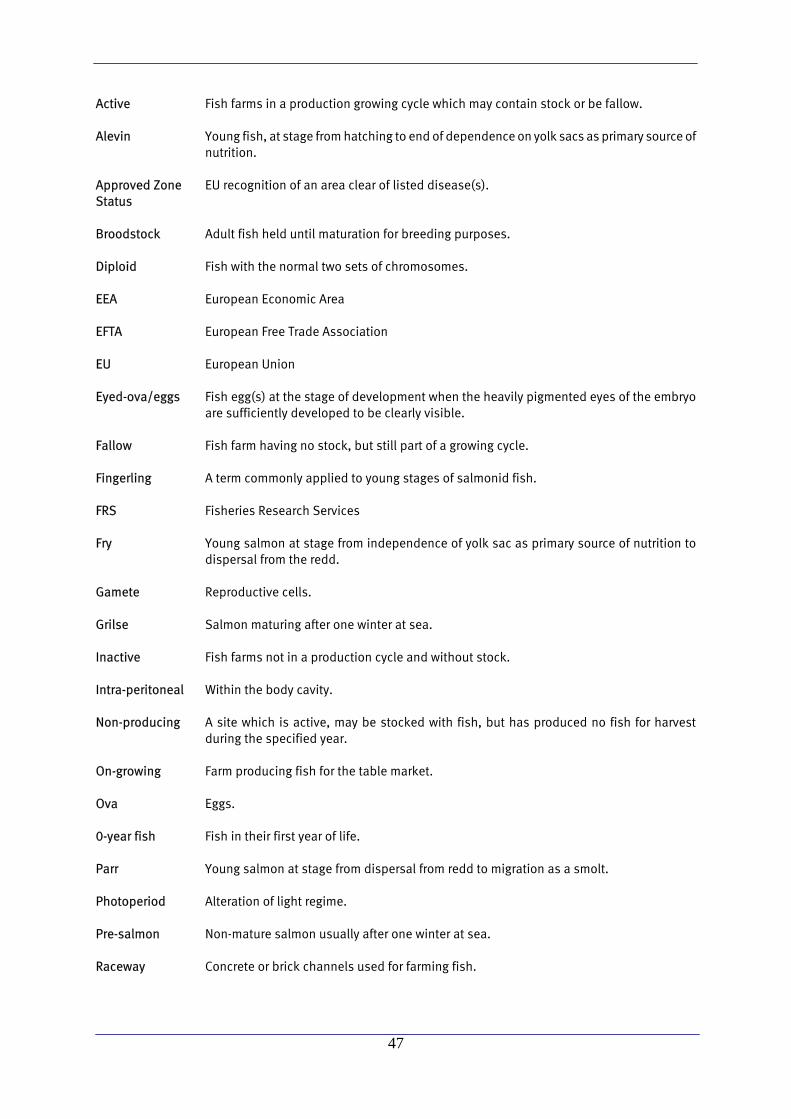
47
Active Fish farms in a production growing cycle which may contain stock or be fallow. Alevin Young fish, at stage from hatching to end of dependence on yolk sacs as primary source of
nutrition. Approved Zone EU recognition of an area clear of listed disease(s). Status Broodstock Adult fish held until maturation for breeding purposes. Diploid Fish with the normal two sets of chromosomes. EEA European Economic Area EFTA European Free Trade Association EU European Union Eyed-ova/eggs Fish egg(s) at the stage of development when the heavily pigmented eyes of the embryo
are sufficiently developed to be clearly visible. Fallow Fish farm having no stock, but still part of a growing cycle. Fingerling A term commonly applied to young stages of salmonid fish. FRS Fisheries Research Services Fry Young salmon at stage from independence of yolk sac as primary source of nutrition to
dispersal from the redd. Gamete Reproductive cells. Grilse Salmon maturing after one winter at sea. Inactive Fish farms not in a production cycle and without stock. Intra-peritoneal Within the body cavity. Non-producing A site which is active, may be stocked with fish, but has produced no fish for harvest
during the specified year. On-growing Farm producing fish for the table market. Ova Eggs. 0-year fish Fish in their first year of life. Parr Young salmon at stage from dispersal from redd to migration as a smolt. Photoperiod Alteration of light regime. Pre-salmon Non-mature salmon usually after one winter at sea. Raceway Concrete or brick channels used for farming fish.
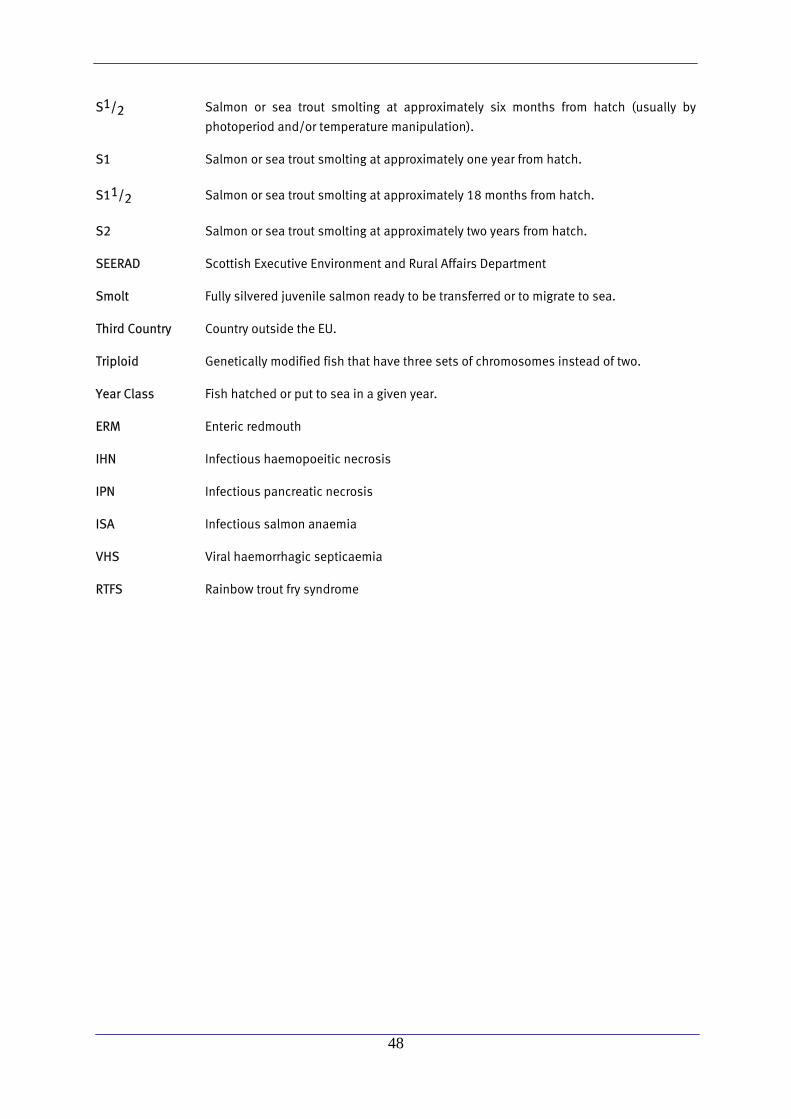
48
S1/2 Salmon or sea trout smolting at approximately six months from hatch (usually by
photoperiod and/or temperature manipulation). S1 Salmon or sea trout smolting at approximately one year from hatch.
S11/2 Salmon or sea trout smolting at approximately 18 months from hatch.
S2 Salmon or sea trout smolting at approximately two years from hatch. SEERAD Scottish Executive Environment and Rural Affairs Department Smolt Fully silvered juvenile salmon ready to be transferred or to migrate to sea. Third Country Country outside the EU. Triploid Genetically modified fish that have three sets of chromosomes instead of two. Year Class Fish hatched or put to sea in a given year. ERM Enteric redmouth IHN Infectious haemopoeitic necrosis IPN Infectious pancreatic necrosis ISA Infectious salmon anaemia VHS Viral haemorrhagic septicaemia RTFS Rainbow trout fry syndrome