Embed Size (px)
DESCRIPTION
Scotia Gas Networks Annual Report 2010
Citation preview

Scotia Gas Networks Annual Report and Accounts 2011
Sco
tia Gas N
etwo
rks Annual R
eport and Accounts 2011
Scotia Gas NetworksSt Lawrence HouseStation ApproachHorley, SurreyRH6 9HJ Scotland Gas Networks 0845 070 1432 Southern Gas Networks0845 070 1431
www.sgn.co.uk
If you smell gas or are worried about gas safety you can call the National Gas Emergency Number on 0800 111 999
This report is printed onto paper that is made from 75% recycled fibre and 25% virgin fibre of which 70% is FSC certified.
FSC logo to go here

Business Review01 Financial and operational highlights 02 Our business at a glance04 Operational review10 Financial review
Corporate Governance12 Board of Directors 14 Directors’ report 16 Statement of Directors’ responsibilities17 Corporate governance statement
ContentsAccounts20 Independent auditors’ report21 Consolidated profit and loss account22 Consolidated statement of total
recognised gains and losses23 Balance sheets24 Consolidated cash flow statement25 Reconciliation of net cash flow
to movement in net debt26 Notes to the financial statements
Scotia Gas Networks Limited (the “Company”) is a holding company which does not trade. This operating and financial review sets out the main trends and factors underlying the development and performance of the Company and its subsidiary undertakings (together the “Group”) during the year ended 31 March 2011 as well as those matters which are likely to affect its future development and performance.
The Directors, in preparing this operating and financial review, have sought to comply with the Accounting Standard Board’s 2006 Reporting Statement: Operating and Financial Review as far as it applies to the circumstances of the Group.
Gas Company of the Year 2010
IGEM/sbgi Gas Industry Awards
RAV (Regulated Asset Value)
£4.3bnMarch 2011
Designed and produced by Tayburn

01Business Review Financial and operational highlights
Financial and operational highlights
Overall Safety Achievement Award
GISG 2011 Winner
Biogas
1stFirst UK Biogas plant at Didcot
Ofgem DRS Awards
£2.95mLeading Gas Distribution Network 2009-2011: Reward for safety, fuel poverty and environmental initiatives
Network investment
£399mCapital and replacement expenditure in 2010/11

Our business at a glance
Regulated by Ofgem, the Group operates gas transportation and distribution networks in Scotland and the south and south-east of England.
Our focus
The Group’s principal objectives are:• to deliver natural gas safely, reliably and
efficiently across the gas distribution networks • to provide the highest standard
of service to our customers• to deliver value to our shareholders.
The Group’s overall financial objective is:• to focus on operational efficiency and the
efficient delivery of capital and replacement expenditure programme. Therefore, financial objectives are set to ensure the regulatory targets are achieved or outperformed.
02 Scotia Gas NetworksAnnual Report and Accounts 2011
Our structure
Scotia Gas NetworksThe Company is owned by three shareholders including SSE plc (50%), Borealis Infrastructure Europe (UK) Limited (25%) which is indirectly wholly owned by OMERS Administration Corporation and OTPPB Investments (U.K.) Limited (25%) which is owned by Ontario Teachers’ Pension Plan Board.
Scotia Gas Networks
SGN Commercial Services
SGNContracting
SGNConnections

Our values
Our values underpin everything we do.
SafetyWe all take responsibility for our own safety and for the safety of others
PerformanceWe strive for commercial success through efficiency, continuous improvement and innovation
PeopleWe work and develop together with honest communication and respect
CustomersWe listen to and understand our customers’ needs, deliver a quality service and keep our promises
Our worldWe show through our actions that we care about the world and the communities around us
Our visionTo be the leading operator of gas networks in the UK
03Business Review Our business at a glance
Our operations throughout the UK
Our Scottish network distributes gas across all of Scotland to 75% of households, including remote areas through the Scottish Independent Undertakings (SIU) at Stornoway, Wick, Thurso, Oban and Campbeltown.
Our Southern network stretches from Milton Keynes in the north, to Dover in the east and Lyme Regis in the west, including London boroughs to the south of the river Thames, distributing gas to around 90% of households.
Edinburgh
Aberdeen
Glasgow
London
Southampton
Oxford
SGN gas network areas
The scale of our business
The Group operates the regulated gas transportation networks in Scotland and the south and south-east of England and two of eight regional gas distribution networks in the United Kingdom.
5.8million5.8 million domestic, commercial and industrial customers in the Southern region and throughout Scotland
74,000km74,000km of gas mains delivering natural gas throughout our regions
3,9213,921 full-time employees at 31 March 2011 (2010: 3,996)

04 Scotia Gas NetworksAnnual Report and Accounts 2011
Operational review
The winter of 2010/11 was the worst for several decades. The weather brought with it many operational challenges across both of the Group’s gas network areas with some of the coldest temperatures being recorded since records began in 1910 and snow bringing transport networks to a standstill. The impact of the extreme cold weather and significant snowfall had severe restrictions on mobility and significantly impacted on the emergency service provided by the Group’s First Call Operatives (FCOs).
However, despite the extreme conditions, the gas network stood up very effectively and the efforts of staff and contractors to meet the Group’s standards of service and generally look after its customers was exceptional.
£21mDuring the year the Group commenced its £21m project to replace three high pressure gas pipelines from the mainland to the Isle of Wight.
A landmark project at Didcot in Oxfordshire with partners Thames Water and Centrica saw, for the first time in the UK, gas produced from human waste safely introduced to the gas network. This biogas was previously flared to atmosphere and the energy wasted, but the project at Didcot cleans and enriches the biogas before injecting it into the existing gas network. The plant marks an important milestone in the UK’s efforts to de-carbonise the gas grid and move towards a low-carbon economy, with expertise provided by the Group’s engineers to get the gas connected to the network and the related onsite infrastructure.
It is hoped this will be the first of many similar projects and is a demonstration of utility companies from different sectors working well together. Gas has been delivered to customers in its traditional form for many years, but this project demonstrates how biomethane can offer a unique, green solution to heating homes for decades to come and is recycling at its very best.
During the year the Group commenced its £21m project to replace three high pressure gas pipelines from the mainland to the Isle of Wight. The old pipes were laid on the seabed of the Solent and were replaced with two new 300mm (12”) diameter steel pipelines installed under the seabed using Horizontal Directional Drilling (HDD) techniques. The drilling and pipe installation works were completed in early 2011, exceeding a distance of 3.9km.
In the course of the project, a number of public exhibitions and meetings were held to engage with local people and groups. At the same time, safety and environmental standards were managed to exceptional levels, with no significant injuries and no environmental incidents occurring during the course of the project. In addition, the SGN Project Manager was awarded the accolade of Gas Industry Manager of the Year at the 2011 IGEM/sbgi award ceremony, being cited for her work on this project.
The Group carries out quarterly postal customer satisfaction surveys covering both planned (replacement) and unplanned (emergency and repair) work, which is used to further assess quality of service performance. The results of the surveys have been very encouraging and are highlighted on page 9. A programme of Commitment Based Management (CBM) techniques for customer-facing staff has been in operation for several months and the results are starting to show in the surveys.
Didcot Biogas plant – recycling at its best.

05Business Review Operational review
Information systemsDuring the year, as part of a Back Office Replacement Programme, Oracle Financials went live on 1 June 2010. This system has enabled the business to analyse project activities across its operations as well as providing more detail about how resources are deployed. This has already seen improvements in the internal control environment and the provision of management information and work is ongoing to modify established processes to fully exploit the system’s capabilities.
0.05This year the Group has reduced its lost time injury performance rate to 0.05 injuries per 100,000 hours (2010: 0.06).
SafetyInjury performanceThe Group’s overriding goal is to distribute gas safely and reliably and to ensure a safe workplace for its workforce, with everyone striving towards eliminating injuries. This year the Group has reduced its lost time injury performance rate to 0.05 injuries per 100,000 hours (2010: 0.06).
The Group also achieved, once again, a Royal Society for the Prevention of Accidents Occupational Health and Safety gold award, which is awarded to recognise and celebrate the achievement of a very high standard of health and safety at work.
Our marketExternal and regulatory environmentThe management and operation of the Group’s gas transportation assets are subject to a series of legislative requirements to ensure that assets are managed and operated in a safe and reliable manner. The Group must also ensure that arrangements are in place to respond to emergency situations and to ensure hazardous work is carried out safely and with minimum disruption.
The primary legislation controlling the Group’s activities as a gas transporter is the Gas Act 1986 (as amended). Under the Gas Act, the Group holds licences which allow it to operate the gas distribution networks it owns. Such businesses are regulated by Ofgem, which has established price control mechanisms that govern the amount of revenue that can be earned by regulated businesses, typically covering five year price control periods. Ofgem assesses the revenue and investment plans of the businesses in order to determine an efficient level of expenditure and the quality of service requirements for the networks are also taken into account. A cost of capital for the required investment in the networks is also determined.
The Group is also subject to safety legislation that is enforced by the Health and Safety Executive (HSE) in the UK. The organisation processes and procedures are covered in a safety case, which has been accepted by the HSE.
Market climateThe UK is in a period where gas supply patterns are moving to a position where more reliance is placed on imported gas. The decline in UK continental shelf gas reserves and the UK energy policy taking cognisance of climate change is driving this shift towards greater use of imported gas.
Factors affecting the business The Group’s principal activity is the operation of highly complex infrastructure networks. As a consequence, there are a number of factors that may influence the development and performance of the business and the financial returns that can be achieved. The principal factors that influence the business are as follows:
Regulatory price controls •
As outlined above, the prices that can be charged for the use of the Group’s networks are determined in accordance with Regulator approved price controls. The outcome of the five-year review baselined the revenues that will be obtained over the five-year price control period from 2008 to 2013. In addition, targeted incentive schemes were introduced by the Regulator whereby the Group is able to earn additional revenues by outperforming the targets, or alternatively is penalised if the Group does not meet them. Additionally, the regulatory price controls include an allowed rate of return for the investment the Group makes in its networks. The level of the allowed rate of return determines the extent to which investment to increase the quality and capacity of the networks is economically viable.
Safety and reliability of the networks •
The Group’s ability to operate the networks safely and reliably is of the highest importance. Its performance in these areas affects the costs it incurs and the overall financial performance.
Efficiency •
The Group’s objective is to ensure gas is delivered as efficiently as possible through its networks. This allows the Group to limit price increases and improve its own financial performance.
Interest rates •
The costs of financing the operations are affected by changes in interest rates as some of the Group’s borrowings are held at floating rates. Exposure to changes in interest rates are hedged by holding both fixed rate and index-linked borrowings and by holding derivative financial instruments (interest rate swaps) where necessary to achieve the desired profile of interest rate risk.Taking responsibility for the safety
of employees and the general public.

06 Scotia Gas NetworksAnnual Report and Accounts 2011
Gas mains replacement programmeThe Group has, in agreement with Ofgem and the Health and Safety Executive (HSE), embarked on an extensive safety-led programme of gas mains replacement across its networks to replace all iron pipes that are located within 30 metres of any property, which includes the replacement of the individual services connecting the premises to the mains network.
The Group has a considerable amount of work to carry out and appreciates that this will inevitably cause some disruption. However, the polyethylene pipes being placed in the ground now, if left undisturbed, have a lifespan of at least 80 years, so when the work is complete, customers can expect to enjoy greater security of supply for many years to come. During the year, the Group increased its investment in replacement activities to £256.0m, 4.6% up on the year ended 31 March 2010.
£256.0mDuring the year, the Group increased its investment in replacement activities to £256.0m, 4.6% up on the year ended 31 March 2010.
Replacing old mains with new plastic pipes.
The Group is committed to working closely with the local authorities and police to plan its work, so that the minimum amount of disruption is caused to residents, road users, businesses and traders. Wherever possible, the Group uses modern, minimum-dig techniques, which allow the laying of gas mains without digging long trenches in the road, causing less impact on the environment and on local communities.
97.2%Despite the extreme winter conditions, the Group’s engineers attended 97.2% of uncontrolled gas escapes within one hour, exceeding the Ofgem target.
Gas escapes standards of serviceThe Group’s engineers respond to reports of suspected gas leaks 24 hours a day, 365 days a year, regardless of from whom people buy their gas. Its engineers aim to attend all uncontrolled gas escapes within one hour and all controlled gas escapes within two hours. A controlled gas escape is one where the person reporting it has confirmed that the gas emergency control valve serving the premises has been turned off and the smell of gas has gone. An uncontrolled gas escape covers all others. Despite the extreme winter conditions, the Group’s engineers attended 97.2% of uncontrolled gas escapes within one hour, exceeding Ofgem targets.
The Board has a Safety, Health and Environmental Advisory Committee that is responsible for monitoring the Group’s health and safety performance and ensuring that the health and safety policy statement is adhered to. The Committee provides the Board with reports on any key areas identified and further details regarding the Committee are set out on page 17 (Corporate Governance Statement).
EnvironmentThe Group is committed to the protection and enhancement of the environment and consideration for the environment is a feature of all its business activities. New ways to minimise the environmental impact of its activities are constantly sought.
The Group constantly benchmarks its environmental performance, allowing it to identify new opportunities, share best practice and achieve continuous improvements. During the year a number of employee briefings, campaigns and training events were held with the specific aim of increasing employees’ knowledge and awareness of environmental matters, as well as health and safety issues.
This process of continual development provides staff with the information and competence they need to recognise and manage the significant environmental issues, risks, incidents and opportunities with which they are faced, thereby proactively avoiding pollution to land, air or water and protecting or enhancing the environment.
As part of its commitment to the environment, the Group also works in partnership with conservation charities, schools and a wide range of community groups. The Safety, Health and Environmental Advisory Committee is also responsible for monitoring the Group’s environmental performance and ensuring that the environmental policy statement is adhered to.
Targets for 2010/11 included reducing methane emissions through leakage and active pressure management, reducing paper usage in offices and operational sites, reducing commercial fuel usage and reducing impact on the environment through reusing excavated materials and reducing the use of virgin aggregate. Progress to date has been positive.
Keeping the gas flowing despite the harsh winter weather.
Operational review (continued)

07
Principal risks and uncertaintiesAs well as the opportunities the Group has to grow and develop its business, certain risks and uncertainties are faced in achieving its objectives. The principal risks and uncertainties identified are as follows:
Regulatory price control treatments of •
certain costs and allowed regulatory rate of return on investments;
Changes in laws or regulation affecting •
the business, for example environmental or health and safety law or regulation;
Breaches of laws or regulation •
affecting the business, or breaches of licence conditions;
Credit market conditions, including •
the availability and cost of financing and re-financing;
Failure of the network or other critical •
non-network operations;
Pension scheme funding requirements; •
and
Changes in tax allowances or rates.•
The Board reviews the principal risks and uncertainties facing the business and considers the risk management processes in place, which are designed to safeguard assets and to manage, rather than eliminate, material risks to the achievement of business objectives. These reviews recognise that any such process can provide only reasonable, and not absolute, assurance against material misstatement or loss. Further details of the processes the Board has in place are also set out in the Corporate Governance Statement on pages 17 to 19.
Business Review Operational review
Taking advantage of our 150 year old gas holder overlooking the Oval, a banner was put up promoting awareness of the dangers of carbon monoxide and the need to get an alarm.
The Group is developing a dynamic environmental strategy and ten year plan which can be revised to meet changes in internal or external policy or public/industry expectations as and when necessary. In line with its ambition to achieve environmental excellence, the Group will go beyond legislative compliance by seeking to meet internationally accepted good practice wherever it operates. This is reflected in the retention of the ISO 14001 standard (environmental management system standard) which is recognition of continuously reducing the impact on the environment. The Group will be setting equally challenging environmental objectives and targets for 2011/12 in accordance with its environmental strategy and ten year environmental improvement plan.
ISO 14001The group retains the ISO 14001 standard which is recognition of continuously reducing the impact on the environment.
Future developmentsRegulationOfgem have issued a new regulatory framework for the price control period commencing April 2013. It is anticipated that the new price control period will be for eight years and will see a greater focus on innovation, incentives and outputs. Following extensive stakeholder engagements the Group will be submitting business plans to Ofgem in the autumn of 2011 as part of this process.

08 Scotia Gas NetworksAnnual Report and Accounts 2011
Operational review (continued)
InvestmentLonger-term priorities include continued major replacement investment to replace metallic mains with polyethylene mains, a programme which has been developed in consultation with the HSE and Ofgem. In addition, continued major investment to upgrade the gas network is expected in order to meet instances of peak demand. The efficient and economic delivery of this capital investment will further increase the Group’s Regulated Asset Value (the regulated asset value attributed to each of the Distribution Networks by Ofgem).
Further detailsFurther details on the long-term development plans of Southern Gas Networks plc and Scotland Gas Networks plc can be found in their respective long-term development statements (published in accordance with Special Condition D3 of their Gas Transporter Licences) and available on the Group’s website – www.sgn.co.uk. The long-term development plans set out the forecast gas demand over the ten year period and outlines the capital investment plans which are required to ensure the continued operation of both networks in accordance with the Group’s licence conditions.
Approved by the Board of Directors and signed on its behalf by:
Stephen DowdChairman26 July 2011
Detailed planning in all capital projects.
StakeholdersThe Group has a range of external stakeholders including gas customers, employees, suppliers and contractors, Ofgem, local government bodies and communities. The Group adopts an open and constructive approach, both in terms of the way it operates, the services it provides and the impact its activities have on each of its stakeholders.
The Group encourages and enables its employees to be active citizens in the communities in which they live and work, through schemes which support staff who are either raising money for, or giving their time to, UK charities, local community or youth sports groups. The Group matches eligible fund raising by individual members of staff.
Working in the community SGN staff give the centre of a music-based charity a complete make-over.

09Business Review Operational review
Key performance indicatorsThe Group measures the achievement of its objectives through the use of quantitative assessments and, where quantitative measures are less relevant, through the use of qualitative assessments. The principal key performance indicators (KPIs) which are used to assess whether principal operating objectives have been achieved are set out below:
1 EBITDA is a non-statutory measure and is calculated by adding back goodwill amortisation and depreciation to operating profit.2 RAV is defined as Ofgem Regulatory Asset Value of the Southern and Scotland networks plus additions in excess of current allowances expected to be recovered in
future periods. Debt for the purposes of the Debt to RAV ratio excludes shareholders’ loans and liabilities arising from derivative financial instruments. The percentages stated are as at 31 March 2011 and 31 March 2010 respectively.
3 Based on customer satisfaction survey reports obtained for the nine month period ended 31 December 2010 for Southern Gas Networks plc and Scotland Gas Networks plc. 4 Based on customer satisfaction survey reports obtained for the nine month period ended 31 December 2009 for Southern Gas Networks plc and Scotland Gas Networks plc.
In considering financial performance, the Group uses EBITDA and Adjusted EBITDA. EBITDA is calculated by adding back goodwill amortisation and depreciation, which are non-cash costs, to operating profit. Adjusted EBITDA is calculated by adding back goodwill amortisation, depreciation and 100% of replacement expenditure to operating profit. Replacement expenditure, which, under UK GAAP, is written off to the profit and loss account as it is incurred, improves the future safety and reliability of the networks through the replacement of older gas pipes with modern pipes. Ofgem treats 50% of projected replacement expenditure as recoverable during the year and 50% as recoverable over future years. Accordingly, the Group believes the use of these adjusted measures best illustrates the underlying performance of the business.
Capital expenditureAdditions to tangible fixed assets
2011
£143.1m2010: £167.9m
Adjusted EBITDA1
EBITDA excluding replacement expenditure
2011
£483.5m2010: £485.4m
EBITDA1
Earnings before interest, tax, depreciation and goodwill amortisation
2011
£227.5m2010: £240.7m
Replacement expenditureThe cost of planned maintenance of mains and services
2011
£256.0m2010: £244.7m
Debt to RAV ratio2
The Group’s debt to RAV ratio
2011
67.3%2010: 67.0%
Employee lost time incidentsIncidents resulting in employees taking time off work (per 100,000 hrs worked)
2011
0.052010: 0.06
Escapes attendanceProportion of uncontrolled escapes attended in one hour – percentage (target 97%)
2011
97.2%2010: 97.9%
Customer satisfaction: unplanned interruptionsResults from customer satisfaction surveys (10 = very satisfied)
2011
8.43
2010: 8.34
Customer satisfaction: planned interruptionsResults from customer satisfaction surveys (10 = very satisfied)
2011
7.93
2010: 8.04

10 Scotia Gas NetworksAnnual Report and Accounts 2011
Financial review
The Group sets out below its financial review for the year ended 31 March 2011. The comparative figures presented are for the year ended 31 March 2010, as reported in the audited financial statements, unless otherwise stated.
Turnover for the year ended 31 March 2011 was £802.0m (2010: £783.4m). The majority of turnover was earned from charges for the provision of gas transportation capacity as well as revenue based upon gas volumes transported in the year.
Loss for the year before taxation amounted to £121.2m (2010: £52.9m) and loss for the year after taxation amounted to £102.2m (2010: £66.9m).
Adjusted EBITDA for the year ended 31 March 2011 was £483.5m (2010: £485.4m). Adjusted EBITDA is calculated by adding back goodwill amortisation of £9.5m (2010: £9.7m), depreciation of £105.0m (2010: £97.8m) and replacement expenditure of £256.0m (2010: £244.7m) to reported operating profit of £113.0m (2010: £133.2m).
On 13 October 2010, the Company paid an interim dividend of £60.0m (2010: £nil).
Capital expenditure during the year amounted to £143.1m (2010: £167.9m). Capital expenditure is incurred to ensure that the networks continue to operate at minimum agreed pressures and that sufficient storage capacity is available to meet instances of peak demand, as well as when new connections or increased capacity are added to the networks.
Treasury policies and capital structureThe Group’s operations are financed by a combination of equity and loans from shareholders, bank borrowings and long-term bonds. The Group’s funding and liquidity are managed within a framework of policies and guidelines authorised by the Board of Directors. Further details are set out in the Directors’ Report on page 14.
As a matter of policy a minimum of 75.0% of debt, excluding shareholders’ loans, is maintained at either fixed rates of interest or index-linked. In accordance with these policies, a target interest rate profile has been set for long-term borrowings, excluding shareholders’ loans, of between 80 and 85% of borrowings at either fixed rate or index-linked. This target is kept under review from time to time. Interest rate swaps are used, where necessary, in order to achieve this desired profile.
At 31 March 2011, the Group’s total debt (before issue costs), excluding shareholders’ loans and liabilities arising from derivative financial instruments, amounted to £3,172.4m (2010: £3,122.0m) and the debt to RAV ratio was 67.3% (2010: 67.0%). Of the total long-term borrowings at 31 March 2011, excluding shareholders’ loans and after taking into account the effect of interest rate swaps, 80.8% were at either fixed rates of interest or were index-linked (2010: 81.4%).
Dividend and capital reductionDuring the year the Company paid a dividend of £60m (2010: £nil) following a share capital reduction exercise using the solvency statement procedure which is provided for private companies by sections 641 to 644 of the Companies Act 2006. This is further detailed in note 19.

11Business Review Financial review
Pension commitmentsA significant proportion of the Group’s employees are members of the Scotia Gas Networks Pension Scheme which provides final salary defined benefits for members.
In accordance with FRS 17 (Retirement benefits), the Group’s balance sheet accounts for any pension asset or liability. The net pension liability as at 31 March 2011 was £48.3m (2010: £107.6m). Following the valuation carried out by scheme’s actuary as at 31 March 2009, the Group agreed, with effect from 1 April 2010, to increase annual special pension contributions from £13.5m to £23.5m over the next fifteen year period to 31 March 2025 to repair the pension deficit, with £43.5m paid in the year to 31 March 2011. The Group’s normal contributions remain at 37.3%.
Liquidity and cash flowsLiquidity is maintained through a mixture of long-term borrowings and short term liquid funds in order that there are sufficient funds available for the Group’s current and planned operations. Committed facilities are in place in order to provide funding for future capital and replacement expenditure as well as to provide sufficient available facilities to meet the seasonal working capital requirements of the Group.
During the year, the €365m floating rate bond was redeemed at par and the related euro to sterling swaps were settled. At 31 March 2011 the Group’s committed undrawn revolving credit facility amounted to £110.0m (2010: £350.0m). This facility expires in October 2013. The Group secured additional loan financing in September 2010 of £250.0m from the European Investment Bank, of which £175.0m was drawn at 31 March 2011.
Net cash inflow from operating activities for the year amounted to £192.7m (2010: £230.2m). The decrease is principally due to the increased level of expenditure for mains replacement. The net cash outflow from returns on investments and servicing of finance was £193.4m (2010: £177.2m) with the increase being attributable to an increase in interest rates during the year and issue of new debt. Net cash outflow for capital expenditure and financial investment was £121.3m (2010: £165.0m) reflecting a decrease in capital expenditure during the year following completion of the Farningham Pipeline project last year. After taking into account movements in short term deposits and financing items, overdrafts increased by £0.8m in the year (2010: decrease of £6.4m).
Counterparty credit risk The Group transacts with banks for the provision of interest rate and currency hedging transactions. The Group maintains a minimum credit rating requirement of “A” or equivalent with its counterparties, however it recognises that at times the market conditions for banks can be unusually tight.
At the year end the Group had £11.4m receivable and £200.5m payable relating to financial instruments with bank counterparties.
Dividend policyThe Group’s policy is to distribute to shareholders any available surplus funds, after taking into account the cash requirements needed to continue to invest in the business and the Group’s level of gearing and subject to the availability of distributable profits.
Accounting policiesThe Group’s accounting policies are set out in note 1 to the financial statements. These accounting policies have been applied consistently during the year and in the preceding year and, as previously highlighted in this report, operating profit is stated after writing off replacement expenditure during the year.

12 Scotia Gas NetworksAnnual Report and Accounts 2011
Board of Directors
Registered officeSt Lawrence House Station Approach Horley, Surrey RH6 9HJ
Registered auditorsDeloitte LLP Chartered Accountants London
Registered Number: 04958135
Gregor Alexander, DirectorGregor joined the Board of the Company at its inception and is also the Chairman of the Audit Committee. He is Finance Director of SSE plc and previously worked with the accountancy firm Arthur Andersen.
James McPhillimy, DirectorJames joined the Board of the Company at its inception. He is Managing Director Group Services at SSE plc. James is Chairman of the Safety, Health and Environmental Advisory Committee and a member of the People and Reward Committee.
Sebastien Sherman, DirectorSebastien joined the Board of the Company in March 2007. He is Senior Vice President at Borealis Infrastructure Management Inc. He is a member of the Audit Committee and the Safety, Health and Environmental Advisory Committee.
Olivia Steedman, DirectorOlivia joined the Board of the Company in July 2008. She is a Vice President at Ontario Teachers’ Pension Plan Board and is a member of the Audit Committee.
Robert McDonald, DirectorRobert joined the Board of the Company in July 2006. He is Managing Director Regulation and Strategy at SSE plc and has previously worked with the industry’s regulatory body. Robert is a member of the Audit Committee.
Stephen Dowd, ChairmanStephen joined the Board of the Company in November 2006 and was appointed Chairman of SGN in May 2008. He is Senior Vice President (Infrastructure) at Ontario Teachers’ Pension Plan Board.

13Corporate Governance Board of Directors
Michael Rolland, DirectorMichael is President & Chief Executive Officer of Borealis Infrastructure Management Inc. He is a Chartered Accountant having previously worked with an international accounting firm. Michael is Chairman of the People and Reward Committee.
Colin Hood, DirectorColin joined the Board of the Company at its inception and was its Chairman from 2005 until 2008. He is Chief Operating Officer of SSE plc and is also a Fellow of the Institute of Engineering and Technology. Colin is a member of the People and Reward Committee.
Chris Brook, Chief Financial OfficerChris joined the Company in September 2008. He spent the previous 11 years with United Utilities where he was Finance Director of United Utilities Contract Solutions between 2003 and 2007. From 2007, Chris was Finance Director of United Utilities Water, the regulated water business, before joining the Company. Chris is a Chartered Accountant having trained and qualified with Touche Ross.
John Morea, Chief Executive OfficerJohn joined the Company in May 2005 from Scottish and Southern Energy plc where he was Director of Distribution having previously been Head of Operations for Southern Electric plc. He has extensive experience of electricity distribution, managing business change and delivering significant improvements in business efficiency. He has twice taken distribution companies to the efficiency frontier, with Southern Electric plc in 1999 and SSE plc in 2004. John has over 20 years experience within the utilities industry. He is a companion of the Institute of Gas Engineers and Managers, a member of the Institute of Engineering and Technology and holds an MBA.
John Morea and Chris Brook are the senior managers who attend board meetings.

14 Scotia Gas NetworksAnnual Report and Accounts 2011
Directors’ report
The Directors present their report and the audited consolidated financial statements for the year ended 31 March 2011. The financial statements consolidate the financial statements of the Company and its subsidiary undertakings (together the “Group”).
Principal activitiesThe Company is a holding company which does not trade.
The subsidiary undertakings principally affecting the profits or net assets of the Group in the year are listed in note 13 to the financial statements.
The Group’s principal activity is the development, administration, maintenance and safe operation of the Southern and Scotland regional gas distribution systems and the supply of associated transportation, connection and metering services. It will continue these activities for the foreseeable future.
Directors The Directors of the Company who served during the year ended 31 March 2011, all of whom have been Directors for the whole of the year, are listed below:
Gregor Alexander Stephen Dowd (Chairman) Colin HoodRobert McDonald James McPhillimyMichael Rolland Sebastien Sherman Olivia Steedman
Directors’ insurance and indemnitiesThe Directors of the Company have the benefit of the indemnity provisions in the Company’s Articles of Association. The Directors have been granted a qualifying third party indemnity provision which was in force throughout the year. In addition, the Company has purchased and maintained throughout the year directors’ and officers’ liability insurance in respect of itself, the Group, the Directors and other senior executives of the Group.
Review of business The review of business for the year, including an analysis using key performance indicators, together with a description of the principal risks and uncertainties facing the Group are set out in the Operational and Financial Review on pages 4 to 11.
Results and dividendsThe consolidated profit and loss account is set out on page 21 and is reviewed on pages 10 and 11. The Group paid an interim dividend of £60.0m (2010: £nil) in October 2010. The Directors do not recommend the payment of any final dividend for the year (2010: £nil).
Financial risk managementThe Group’s funding, liquidity and exposure to interest rate, foreign exchange and credit risks are managed within a framework of policies and guidelines authorised by the Board of Directors.
Interest rate riskThe Group has interest bearing liabilities and as a matter of policy a minimum of 75% of debt is maintained at either fixed rates of interest or index-linked. In accordance with this policy, a target interest rate profile has been set for long-term borrowings of between 80 and 85% of borrowings at either fixed rate or index-linked, excluding borrowings from shareholders. The Group uses interest rate swaps, where necessary, in order to achieve this desired profile.
Liquidity risk The Group maintains a mixture of long-term funding and short term liquid funds in order that there are sufficient funds available for the Group’s current and planned operations.
Foreign exchange riskAll of the Group’s borrowings are currently denominated in Sterling, so there is no foreign exchange risk. However, in accordance with the its policy, should the Group decide to raise finance in currency other than Sterling, cross currency swaps would be used to fully hedge the borrowings into Sterling.
Credit riskCounterparty credit risks arising from financial derivatives are managed through the maintenance of financial limits, subject to a minimum credit rating of “A” or equivalent allocated by a recognised major ratings group. In respect of short term cash management, counter parties are subject to review and approval according to defined criteria.
Trade receivables predominantly relate to transportation income from gas shippers. Credit risk arising from the Group’s regulated business is managed in accordance with industry standards as set out by the Unified Network Code. The Group contracts with shippers having investment grade ratings only, or where suitable collateral or cash prepayments are made.

15
Pricing riskThe Group’s gas transportation charges are subject to price control formulae set within the regulatory regime. The Group’s maximum allowed revenue in a given price period is dependent upon a number of factors that are not known in advance (such as actual transportation volumes and performance against incentives) and therefore the maximum allowed annual revenue is not known until the end of the relevant period. However, transportation tariffs are set on a prospective basis based upon expected transportation volumes and incentive performance, so actual revenue received or receivable in any one year may differ from the maximum allowed revenue. Where revenues received or receivable differ from the maximum allowed annual revenue, adjustments are made to future prices to reflect this over or under recovery.
Charitable contributions The Group made charitable donations of £75,000 in the year (2010: £53,000) in support of community and employee initiatives across its operations. There were no political donations in either the current or prior year.
EmployeesThe Group places considerable value on the involvement of its employees and has continued to keep them informed on matters affecting them as employees and on the various factors affecting the Group. Participation by employees generally is encouraged through team meetings, briefings, an internal newspaper and an intranet site. The Chief Executive Officer and other senior executives regularly communicate with employees through these channels and employee representatives are consulted regularly on a wide range of matters affecting their current and future interests.
Applications for employment by disabled persons are always fully considered, bearing in mind the aptitudes of the applicant concerned. In the event of members of staff becoming disabled, every effort is made to ensure their employment within the Group continues and that appropriate training and development is arranged. It is the policy of the Group that the training, career development and promotion of disabled persons should, as far as possible, be identical to that of other employees.
Creditors payment policyThe Group is committed to maintaining good commercial relationships with its creditors and suppliers and its current policy concerning payment is to:
agree the terms of payment with those •
creditors/suppliers when agreeing the terms of each transaction;
ensure that those creditors/suppliers •
were made aware of the terms of payment by inclusion of the relevant terms in contracts; and
pay in accordance with its contractual •
and other legal obligations.
The payment policy applies to all payments to creditors/suppliers for revenue and capital supplies of goods and services without exception.
At 31 March 2011, the Group had an average of 29 days (2010: 35 days) outstanding in its trade creditors. The Company has not traded in either the current or prior year and accordingly has no trade creditors.
Going concernThe Group’s financial position, cash flows, liquidity position and borrowing facilities together with the factors likely to affect its future performance and the Group’s principal risks and uncertainties are set out in the Operational and Financial Review on pages 4 to 11. The Group’s financial risk management objectives and risk exposures are set out above.
As stated in the Operational and Financial Review the Group operates the regulated gas distribution networks in South of England and Scotland. The revenue of the Group is regulated by Ofgem via established price control mechanisms based on the distribution network capacity. The Group has considerable financial resources together with committed financing facilities as discussed in Note 16 to finance the current and future operations. The Group’s forecasts and projections, taking into account reasonably possible changes in trading performance, show that the Group should be able to operate within the level of its current facilities. As a consequence, the Directors believe that the Group is well placed to manage its business risks successfully despite the current uncertain economic outlook. After making enquiries, the Directors have a reasonable expectation that the Company and the Group have adequate resources to continue in operational existence for the foreseeable
future. Accordingly, they continue to adopt the going concern basis in preparing the annual report and accounts.
AuditorsEach of the Directors at the date of this report confirms that:
1) so far as the Director is aware, there is no relevant audit information of which the Company’s auditors are unaware; and
2) the Director has taken all the steps that he/she ought to have taken as a Director to make himself/herself aware of any relevant audit information and to establish that the Company’s auditors are aware of that information.
This confirmation is given and should be interpreted in accordance with the provisions of section 418 of the Companies Act 2006.
Deloitte LLP have expressed their willingness to continue in office as auditors and a resolution to reappoint them will be proposed at the forthcoming Annual General Meeting of the Company.
By Order of the Board
Jonathan AdamsCompany Secretary26 July 2011
Corporate Governance Directors’ report
16 Scotia Gas NetworksAnnual Report and Accounts 2011
Statement of Directors’ responsibilities
The Directors are responsible for preparing the annual report and the financial statements in accordance with applicable law and regulations.
Company law requires the Directors to prepare financial statements for each financial year. Under that law the Directors have elected to prepare the financial statements in accordance with United Kingdom Generally Accepted Accounting Practice (United Kingdom Accounting Standards and applicable law). Under company law the Directors must not approve the financial statements unless they are satisfied that they give a true and fair view of the state of affairs of the Company and of the profit or loss of the Company for that period. In preparing these financial statements, the Directors are required to:
select suitable accounting policies •
and then apply them consistently;
make judgements and accounting •
estimates that are reasonable and prudent;
state whether applicable UK Accounting •
Standards have been followed, subject to any material departures disclosed and explained in the financial statements; and
prepare the financial statements on •
the going concern basis unless it is inappropriate to presume that the Company will continue in business.
The Directors are responsible for keeping adequate accounting records that are sufficient to show and explain the Company’s transactions and disclose with reasonable accuracy at any time, the financial position of the Company and to enable them to ensure that the financial statements comply with the Companies Act 2006. They are also responsible for safeguarding the assets of the Company and hence for taking reasonable steps for the prevention and detection of fraud and other irregularities.
The Directors are responsible for the maintenance and integrity of the corporate and financial information included on the Company’s website. Legislation in the United Kingdom governing the preparation and dissemination of financial statements may differ from legislation in other jurisdictions.
The Directors confirm to the best of their knowledge that:
the financial statements, prepared in •
accordance with the applicable set of accounting standards, give a true and fair view of the of the assets, liabilities, financial position and profit or loss of the Company and the undertakings included in the consolidation taken as a whole as at 31 March 2011; and
the Directors’ report includes a fair •
and true view of the development and performance of the business and the position of the Company and the undertakings included in the consolidation taken as a whole, together with a description of its principal risks and uncertainties.
Signed on behalf of the Board of Directors of Scotia Gas Networks Limited:
Stephen Dowd Chairman26 July 2011

17Corporate Governance Corporate governance statement
Corporate governance statement
The Board of Directors is the principal decision making forum for the Company and is committed to the highest standards of corporate governance. The Board believes that strong governance improves the performance of the Group and enhances shareholder value. This report sets out the key governance principles and practices of the Company and of the Group.
The Company, being unlisted, is not subject to the UK Financial Reporting Council’s UK Corporate Governance Code1 (the “Governance Code”) and the Board of Directors does not believe that all of the guidance set out in the Governance Code is applicable to the Company. However, for the purposes of this statement, the Directors have applied the Governance Code insofar as they believe it to be applicable.
Board of DirectorsThe Board of Directors is comprised entirely of non-executive Directors and is the principal decision-making forum for the Company. It has overall responsibility for leading and controlling the Group as well as its financial and operational performance.
As a commercial joint venture, the composition of the Board reflects the shareholders’ interests in the consortium. Each of the Directors is an employee of a shareholder or an affiliate of a shareholder of the Company. As the relationship of the shareholders is governed by a Shareholders’ and Governance Agreement, any conflict of interest in the position of the Directors would be addressed in accordance with the provisions of the Shareholders’ and Governance Agreement. Directors are nominated to the Board in accordance with the terms of the Shareholders’ and Governance Agreement. The Directors have been briefed on the duties that have been conferred on them under the Companies Act 2006.
The powers of the Directors are set out in the Company’s Articles of Association. The Board has also adopted a formal schedule of matters detailing key aspects of the Company’s affairs reserved to it for decision. This schedule is reviewed regularly. Furthermore, the Board has established three committees with specific responsibilities to ensure focused and effective leadership. Details of the committees are set out on page 18.
The Board meets regularly and held eight meetings during the year.
Board constitution and appointmentsThe Board consists of seven non-executive Directors in addition to the non-executive Chairman. The Board of Directors is the same for the Company and each company within the Group.
Biographical details for each of the Directors are set out on page 12.
ChairmanStephen Dowd was appointed as Chairman on 27 May 2008 for a three year period until the end of July 2011, succeeding Colin Hood.
Chief Executive Officer and Chief Financial Officer Below the Board, executive responsibility rests with John Morea, Chief Executive Officer (CEO) and Chris Brook, Chief Financial Officer (CFO). The CEO and CFO are each employed by the Group and are not Directors of the Company. They are supported by an executive committee which meets on a monthly basis and is responsible for managing the day-to-day operations of the Group.
Biographical details for the CEO and CFO are set out on page 12.
1 The UK Corporate Governance Code was issued in May 2010 (replacing the Combined Code on Corporate Governance), applies to financial years beginning on or after 29 June 2010 and is available on the Financial Reporting Council’s website (www.frc.org.uk).

18 Scotia Gas NetworksAnnual Report and Accounts 2011
Timeliness and quality of Board informationThe Board has sought to ensure that Directors are properly briefed on issues arising at board meetings by establishing procedures for distributing board papers one week in advance of meetings; considering the adequacy of the information provided before making decisions; adjourning meetings or deferring decisions when Directors have concerns about the information available to them and making the Company Secretary responsible to the Board for the timeliness and quality of information.
All Directors have access to the advice and services of the Company Secretary.
Directors’ remunerationThe Directors did not receive any remuneration for their services to the Company, or to the Group, during the year ended 31 March 2011 or in the prior year. Accordingly, no further information requires to be disclosed.
Conflicts of interestWith effect from 1 October 2008, the Companies Act 2006 introduced a statutory duty on Directors to avoid conflicts of interest. During the year, the Company Secretary reviewed all of the Directors’ reported actual and potential conflicts of interest and the Board then considered and authorised each Director’s reported actual and potential conflicts of interest at its meeting in September 2010.
The Board has put into place a procedure to consider any future actual or potential conflicts of interest that the Directors may have and will review the position regularly.
Board CommitteesIn order to provide effective and focused leadership, the Board has established three committees with specific responsibilities. These are the Audit Committee, the People and Reward Committee and the Safety, Health and Environmental Advisory Committee, each of which meets regularly.
Each Committee’s performance, constitution and terms of reference are reviewed annually to ensure that they are operating effectively. The Company Secretary acts as secretary for each committee and further details are set out below.
Attendance at Board and Board Committee meetingsThe attendance of the Board of Directors and the Board committees during the year is as set out in the table below.
Audit CommitteeThe current members of the Audit Committee are Gregor Alexander (Committee Chairman), Graham Laughland (appointed in 2009 as independent member of the audit committee), Sebastien Sherman, Robert McDonald and Olivia Steedman.
The principal responsibilities of the Audit Committee are as follows:
Ensuring that the Company’s financial •
reports represent an accurate, clear and balanced assessment of the Company’s position and prospects;
Ensuring the economy, efficiency •
and effectiveness of the Company’s operations and internal controls, the reliability and integrity of information and accounting systems and the implementation of established policies and procedures;
Monitoring and reviewing the Company’s •
internal audit function; and
Maintaining a close relationship with •
the Company’s external auditors and reviewing the effectiveness of the external audit process.
As part of its activities, the Audit Committee also reviews and approves key regulatory filings prior to their issue to Ofgem.
The Chairman of the Audit Committee reports to the Board of Directors following each committee meeting on the main areas and subjects the Committee has reviewed such as risk management, internal control, internal audit reports and any issues arising from its review of the financial statements.
The Board considers that the membership of the Audit Committee as a whole has sufficient recent and relevant financial experience to discharge its functions. The Committee met 3 times during the year.
Safety, Health and Environmental Advisory CommitteeThe current members of the Safety, Health and Environmental Advisory Committee are James McPhillimy (Committee Chairman), Stephen Dowd, Sebastien Sherman, John Morea (Chief Executive Officer) and Gary Barnes (Director of Safety, Customers and Human Resources).
The principal responsibilities of the Safety, Health and Environmental Advisory Committee are as follows:
Ensuring that the health and safety •
policy statement and environmental policy statement remain fit for purpose and are being adhered to;
Board meetingsAudit Committee
meetingsPeople and Reward Committee meetings
Safety, Health and Environmental
Committee meetings
Attended Possible* Attended Possible Attended Possible Attended Possible
Gregor Alexander 6 6 3 3 – – – –Stephen Dowd 6 6 – – 4 4 3 3Colin Hood 6 6 – – 4 4 1 1Robert McDonald 6 6 3 3 – – – –James McPhillimy 6 6 – – 4 4 3 3Michael Rolland 6 6 – – 4 4 – –Olivia Steedman 6 6 3 3 – – – –Sebastien Sherman 6 6 3 3 – – 3 3* In addition to the six bi-monthly meetings, there were two extraordinary meetings convened to approve EIB loan facility documentation. An extraordinary
meeting’s quorum consists of three Directors.
Corporate governance statement (continued)

19
Reviewing and monitoring the safety, •
health and environmental strategy and action plan, which shall be designed to eliminate, reduce or otherwise control personal and process related data;
Reviewing and monitoring the safety, •
health and environmental compliance and assurance plan (and liaising with the internal auditors in relation thereto);
Setting health and safety and •
environmental targets to improve the Group’s performance;
Monitoring health and safety and •
environmental performance against planned targets and identified key improvement areas by means of appropriate leading and lagging key performance indicators; and
Encouraging greater awareness of the •
importance of health, safety and the environment and higher achievement in performance in these areas.
The Chairman of the Safety, Health and Advisory Committee reports to the Board of Directors following each committee meeting on the main areas and subjects the Committee has reviewed. Three meetings were held during the year.
People and Reward CommitteeThe current members of the People and Reward Committee are Michael Rolland (Committee Chairman), Stephen Dowd, Colin Hood and James McPhillimy.
The principal responsibilities of the People and Reward Committee are as follows:
To determine and agree with the Board •
of Directors the Group’s framework or broad policy for executive and senior management remuneration. The Committee has delegated authority for setting the remuneration of the CEO, CFO and their direct reports; and
To review the ongoing appropriateness •
and relevance of the remuneration policy.
The Chairman of the People and Reward Committee reports to the Board of Directors following each committee meeting on the remuneration matters which the Committee has reviewed. Four meetings were held during the year.
Board and Committee Performance EvaluationsDuring the year, the Board has undertaken a comprehensive evaluation of its own performance and that of its three Committees and individual Directors. This was conducted internally using detailed questionnaires which the Chairman then discussed with each Director and the Company Secretary. The Board has considered and discussed the outcomes of the evaluations and is satisfied that it is operating well and focused on the correct strategic issues. Some areas for improvement were highlighted and these will be progressed during 2011/12. Performance of the Board and the Directors will continue to be reviewed on an annual basis.
Internal Controls in relation to the Company’s financial reporting processThe Board of Directors is ultimately responsible for the Group’s internal control systems and risk management. The Group’s system of internal control and embedded risk management, which has been in place throughout the year, helps to safeguard the assets and is designed to manage, rather than eliminate, material risks to the achievement of the business objectives. The Board recognises that these systems can provide only reasonable, and not absolute, assurance against material misstatement or loss.
Accordingly, the Directors have regard to what controls, in their judgement, are appropriate to the business, to the materiality of the risks inherent in the business and to relative costs and benefits of implementing specific controls.
Internal control is maintained through an organisation structure with clearly defined responsibilities, authority levels and lines of reporting, the appointment of suitably qualified staff in specialised business areas and continuing investment in high quality information systems. These methods of control are subject to periodic review as to their implementation and continued suitability.
There were no changes in the Company’s internal controls over financial reporting during the period covered by this report that has materially affected, or is reasonably likely to materially affect, the Company’s internal control over financial reporting.
Internal auditThe Board of Directors has established the scope of the internal audit function which is responsible for reviewing the effectiveness of the Group’s systems of internal control and reports to the Audit Committee of the Board. The internal audit manager reports to the Audit Committee on the audit programme, progress against the programme and any follow-up actions on a bi-monthly basis.
Corporate Governance Corporate governance statement

20 Scotia Gas NetworksAnnual Report and Accounts 2011
Independent auditors’ report to the members of Scotia Gas Networks LimitedWe have audited the financial statements of Scotia Gas Networks Limited for the year ended 31 March 2011 which comprise the consolidated profit and loss account, the consolidated statement of total recognised gains and losses, the consolidated and Company balance sheets, the consolidated cash flow statement, the reconciliation of net cash flow to movement in net debt and the related notes 1 to 27. The financial reporting framework that has been applied in their preparation is applicable law and United Kingdom Accounting Standards (United Kingdom Generally Accepted Accounting Practice).
This report is made solely to the Company’s members, as a body, in accordance with Chapter 3 of Part 16 of the Companies Act 2006. Our audit work has been undertaken so that we might state to the Company’s members those matters we are required to state to them in an auditors’ report and for no other purpose. To the fullest extent permitted by law, we do not accept or assume responsibility to anyone other than the Company and the Company’s members as a body, for our audit work, for this report, or for the opinions we have formed.
Respective responsibilities of Directors and auditorsAs explained more fully in the Directors’ Responsibilities Statements, the Directors are responsible for the preparation of the financial statements and for being satisfied that they give a true and fair view.
Our responsibility is to audit and express an opinion on the financial statements in accordance with applicable law and International Standards on Auditing (UK and Ireland). Those standards require us to comply with the Auditing Practice Board’s (APB’s) Ethical Standards for Auditors.
Scope of the audit of financial statementsAn audit involves obtaining evidence about the amounts and disclosures in the financial statements sufficient to give reasonable assurance that the financial statements are free from material misstatement, whether caused by fraud or error. This includes an assessment of: whether the accounting policies are appropriate to the Group’s and the parent Company’s circumstances and have been consistently applied and adequately disclosed; the reasonableness of significant accounting estimates made by the Directors; and the overall presentation of the financial statements.
OpinionIn our opinion the financial statements:
give a true and fair view of the state of the Group’s and the parent Company’s affairs as at 31 March 2011 and of the Group’s loss •
for the year then ended;
have been properly prepared in accordance with United Kingdom Generally Accepted Accounting Practice; and•
have been prepared in accordance with the requirements of the Companies Act 2006.•
Opinion on matters prescribed in the Companies Act 2006In our opinion the information in the Directors’ Report for the financial year for which the financial statements are prepared is consistent with the financial statements.
Matters on which we are required to report by exceptionWe have nothing to report in respect of the following matters where the Companies Act 2006 requires us to report to you if, in our opinion:
adequate accounting records have not been kept by the parent Company, or returns adequate for our audit have not been from •
branches not visited by us; or
the parent Company financial statements are not in agreement with the accounting records and returns; or•
certain disclosures of Directors’ remuneration specified by law are not made; or•
we have not received all the information and explanations we require for our audit.•
Makhan Chahal (Senior Statutory Auditor)for and on behalf of Deloitte LLPChartered Accountants and Statutory Auditors London, United Kingdom26 July 2011
Independent auditors’ reportto the members of Scotia Gas Networks Limited

21Accounts Primary accounting statements
Notes2011
£m2010
£m
Turnover 2 802.0 783.4Net operating costs 3 (689.0) (650.2)
Operating profit 3 113.0 133.2Income from fixed asset investments 13 0.6 0.5Interest receivable and similar income 6 1.3 2.0Interest payable and similar charges 7 (236.1) (188.6)
Loss on ordinary activities before taxation 4 (121.2) (52.9)Tax credit/(charge) on loss on ordinary activities 8 19.0 (14.0)
Loss for the financial year 20 (102.2) (66.9)
The above results relate to continuing operations in both the current and previous year.
Consolidated profit and loss accountfor the year ended 31 March 2011
22 Scotia Gas NetworksAnnual Report and Accounts 2011
Notes2011
£m2010
£m
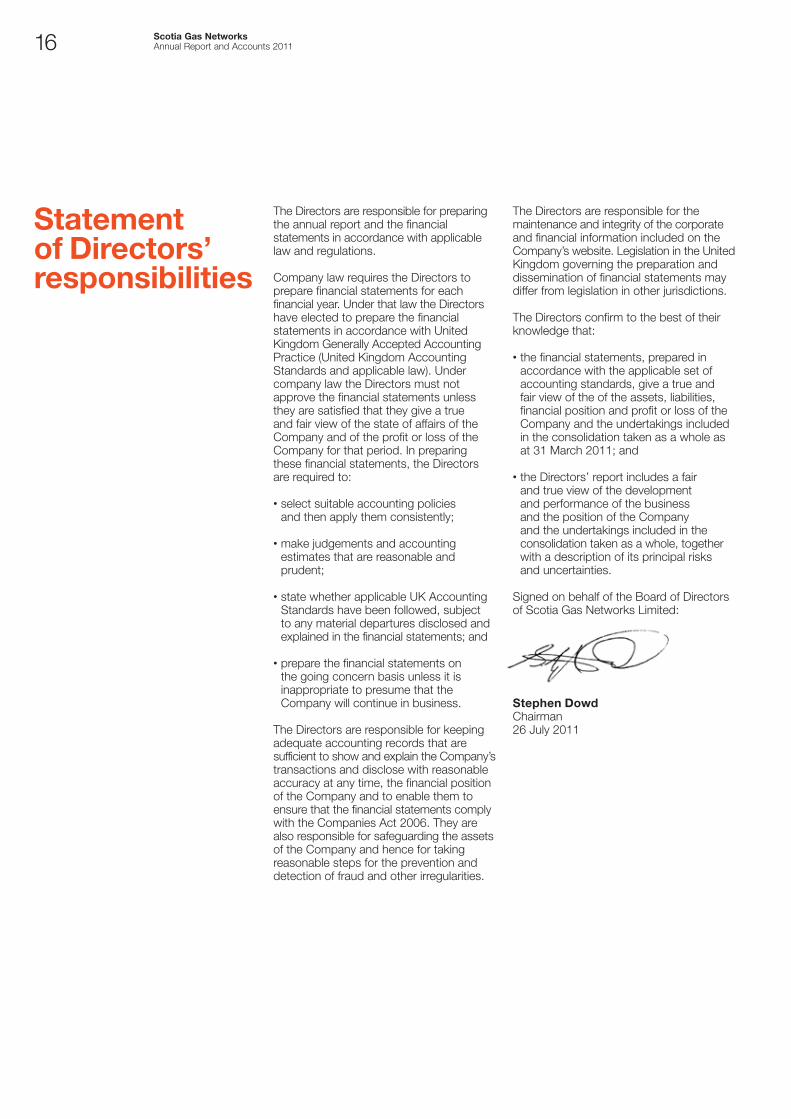
Loss for the financial year 20 (102.2) (66.9)Cash flow hedges (net of deferred tax) 20 1.9 2.5Actuarial gain/(loss) recognised on defined benefit pension scheme 26 42.4 (115.7)Movement on deferred tax relating to pension scheme 26 (11.6) 32.4
Total recognised losses for the year (69.5) (147.7)
Consolidated statement of total recognised gains and lossesfor the year ended 31 March 2011

23
Group Company
Notes2011
£m2010
£m2011
£m2010
£m
Fixed assetsIntangible assets – goodwill 11 421.6 431.1 – –Tangible assets 12 3,504.2 3,466.1 – –Investments 13 0.2 0.2 948.4 948.4
3,926.0 3,897.4 948.4 948.4Current assetsDebtors 14 64.8 133.3 80.9 128.7Short term deposits 45.8 138.3 45.8 138.3
110.6 271.6 126.7 267.0
Creditors: amounts falling due within one year 15 (285.9) (590.8) (365.3) (463.9)
Net current liabilities (175.3) (319.2) (238.6) (196.9)
Total assets less current liabilities 3,750.7 3,578.2 709.8 751.5
Creditors: amounts falling due after more than one year 16 (3,693.4) (3,309.7) (533.6) (533.6)Provisions for liabilities 18 (392.5) (430.8) – –Deferred income 12 (130.5) (114.6) – –
Net (liabilities)/assets excluding pension liabilities (465.7) (276.9) 176.2 217.9Defined benefit pension liabilities 26 (48.3) (107.6) – –
Net (liabilities)/assets including pension liabilities (514.0) (384.5) 176.2 217.9
Capital and reservesCalled up share capital 19 200.0 269.1 200.0 269.1Hedge reserve 20 (30.4) (32.3) – –Profit and loss account 20 (683.6) (621.3) (23.8) (51.2)
Shareholders’ (deficit)/funds 21 (514.0) (384.5) 176.2 217.9
The financial statements of Scotia Gas Networks Limited, registered number 04958135, were approved by the Board of Directors on 26 July 2011.
Signed on behalf of the Board of Directors
Stephen Dowd Gregor AlexanderDirector Director
Balance sheetsas at 31 March 2011
Accounts Primary accounting statements

24 Scotia Gas NetworksAnnual Report and Accounts 2011
Notes2011
£m2010
£m
Net cash inflow from operating activities 22 192.7 230.2
Returns on investments and servicing of financeInterest paid (194.0) (177.8)Interest received – 0.1Dividends received from fixed asset investments 0.6 0.5
Net cash outflow from returns on investments and servicing of finance (193.4) (177.2)
Taxation 27 5.6 –
Capital expenditure and financial investmentPurchase of tangible fixed assets (140.8) (187.6)Sale of tangible fixed assets 0.8 0.5Customer contributions received 12 18.7 17.6Refund on cost of investment 11 – 4.5
Net cash outflow for capital expenditure and financial investment (121.3) (165.0)
Equity dividends paid 10 (60.0) –
Net cash outflow before management of liquid resources and financing (176.4) (112.0)
Management of liquid resourcesDecrease/(increase) in short term deposits 23 92.5 (104.4)
Net cash inflow/(outflow) from management of liquid resources 92.5 (104.4)
FinancingRepayment of bonds 23 (325.6) –Settlement of swaps 23 75.3 –Issue of bonds 23 175.0 419.1Drawdown/(repayment) of bank borrowings 23 170.0 (180.0)Payments in respect of financial instruments 23 (11.6) (16.3)
Net cash inflow from financing 83.1 222.8
(Increase)/decrease in bank overdrafts 23 (0.8) 6.4
Consolidated cash flow statementfor the year ended 31 March 2011

25
Notes2011
£m2010
£m
(Increase)/decrease in bank overdraft in the year (0.8) 6.4(Decrease)/increase in short term deposits (92.5) 104.4Movement in borrowings (83.1) (222.8)
Change in net debt resulting from cash flows 23 (176.4) (112.0)Other non-cash changes 23 (30.0) 1.7Net debt at beginning of year (3,637.6) (3,527.3)
Net debt at end of year 23 (3,844.0) (3,637.6)
Reconciliation of net cash flow to movement in net debtfor the year ended 31 March 2011
Accounts Primary accounting statements

26 Scotia Gas NetworksAnnual Report and Accounts 2011
1. PRINCIPAL ACCOUNTING POLICIES
The financial statements have been prepared in accordance with applicable accounting standards in the United Kingdom and the Companies Act 2006.
The financial statements of the Group present the results for the year ended 31 March 2011. The comparative period presented is the year ended 31 March 2010.
A summary of the more significant Group accounting policies, which have been applied consistently in both years, is as follows.
Basis of preparation These financial statements have been prepared under the historical cost convention except that assets and liabilities were stated at fair value when acquired and certain derivative financial instruments are also recorded at fair value.
The financial statements have been prepared on the going concern basis as set out in the Directors’ Report.
Basis of consolidationThe financial statements consolidate the financial statements of the Company and its subsidiary undertakings drawn up to 31 March each year. Subsidiaries are those entities controlled by the Group or the Company.
Subsidiaries acquired are consolidated in the financial statements of the Group from the date that control commences until the date control ceases, using the acquisition method of accounting.
Intra-Group balances and any unrealised gains and losses or income and expenses arising from intra-Group transactions, are eliminated in preparing the consolidated financial statements.
TurnoverTurnover is stated net of value added tax and is attributable to the continuing activity of transportation of natural gas and the provision of related services. Turnover includes an assessment of transportation services supplied to customers between the date of the last meter reading and the year end.
Where revenues received or receivable differ from the amount permitted by regulatory agreements, adjustments will be made to future prices to reflect this over or under recovery.
Replacement expenditureReplacement expenditure represents the cost of planned maintenance of gas mains and services assets by replacing or lining sections of pipe. This expenditure is principally undertaken to repair and maintain the safety of the network and is written off as incurred. Expenditure that enhances the performance of mains and services assets is treated as an addition to tangible fixed assets.
TaxationCurrent tax, including UK corporation tax, is provided at amounts expected to be paid (or recovered) using the tax rates and laws that have been enacted or substantively enacted by the balance sheet date.
Deferred tax is recognised in respect of all timing differences that have originated but not reversed at the balance sheet date where transactions or events that result in an obligation to pay more or a right to pay less tax in the future have occurred at the balance sheet date, with the following exceptions:
Provision is made for gains on disposal of fixed assets that have been rolled over into replacement assets only where, at the balance •
sheet date, there is a commitment to dispose of the replacement assets with no likely subsequent rollover or available capital losses;
Provision is made for gains on revalued fixed assets only where there is a commitment to dispose of the revalued assets and the •
attributable gain can neither be rolled over nor eliminated by capital losses; and
Deferred tax assets are recognised only to the extent that the Directors consider that it is more likely than not that there will be suitable •
taxable profits from which the future reversal of the underlying timing difference can be deducted.
Deferred tax is measured on an undiscounted basis.
Intangible assets – goodwillGoodwill is capitalised and amortised on a straight line basis to the profit and loss account over its expected useful life. Goodwill represents the excess of the fair value of the consideration paid for the acquisition of businesses over the fair value of the separable net assets acquired.
The useful life of goodwill related to acquired businesses has been estimated to be 50 years.
Notes to the financial statementsfor the year ended 31 March 2011

27Accounts Notes to the financial statements
A review for impairment of goodwill is carried out at the end of each financial year. Impairment reviews comprise a comparison of the carrying amount of the goodwill with its recoverable amount (the higher of net realisable value and value in use). To the extent that the carrying amount exceeds the recoverable amount, the goodwill is impaired and an impairment loss is recognised in the profit and loss account.
Fixed asset investmentsFixed asset investments are stated at cost less a provision for any impairment in value. Costs of the investments include all costs directly related to the acquisition of the investments.
Tangible fixed assetsTangible fixed assets are stated at cost less depreciation and any provision for impairment. The cost is the purchase cost of the asset, together with any directly attributable costs of acquisition. In respect of assets purchased as part of a business combination, the cost is the fair value of the assets acquired.
The carrying values of tangible fixed assets are reviewed for impairment when events or changes in circumstances indicate the carrying value may not be recoverable.
Depreciation is provided on all tangible fixed assets other than freehold land, at rates calculated to write off the cost of each asset evenly over its expected useful life, as follows:
Freehold buildings Up to 50 yearsLeasehold buildings Over the shorter of lease term and 50 yearsPlant and machinery:– Mains and services 60 to 65 years– Regulating equipment 30 to 50 years– Gas storage 40 yearsMotor vehicles and office equipment 3 to 10 years
Grants and contributionsCapital grants and customer contributions in respect of additions to fixed assets are treated as deferred income and released to the profit and loss account over the estimated useful lives of the related assets.
Revenue grants and contributions are credited to the profit and loss account in the year to which they relate. Deferred income in respect of revenue grants and contributions is included within creditors: amounts falling due within one year.
Finance leasesAssets held under finance leases, which confer rights and obligations similar to those attached to owned assets, are capitalised as tangible fixed assets and are depreciated over the shorter of the lease terms and their useful lives. The capital elements of future lease payments are recorded as liabilities, while the interest elements are charged to the profit and loss account.
Operating leasesRentals under operating leases are charged on a straight-line basis over the lease term, even if the payments are not made on such a basis. Benefits received and receivable as an incentive to sign an operating lease are similarly spread on a straight-line basis over the lease term, except where the period to the review date on which the rent is first expected to be adjusted to the prevailing market rate is shorter than the full lease term, in which case the shorter period is used.
PensionsDefined benefit pension schemeThe amounts charged to the profit and loss account are the current service costs and gains and losses on settlements and curtailments. They are included within staff costs. Past service costs are recognised immediately in the profit and loss account if the benefits have vested. If the benefits have not vested immediately the costs are recognised over the period until vesting occurs. The interest cost and the expected return on the assets are shown as a net amount of other finance costs or credits within interest payable or receivable. Actuarial gains and losses are recognised immediately in the consolidated statement of total recognised gains and losses.
The defined benefit scheme is funded, with the assets of the scheme held separately from those of the Group, in separate trustee administered funds. Pension scheme assets are measured at fair value and liabilities are measured on an actuarial basis using the projected unit method and discounted at a rate equivalent to the current rate of return on a high quality corporate bond of equivalent currency and term to the scheme liabilities. The actuarial valuations are obtained at least triennially and are updated at each balance sheet date.
The resulting defined benefit asset or liability, net of the related deferred tax, is presented separately after other net assets on the face of the balance sheet. Any pension asset is recognised in the balance sheet to the extent that the benefits may be derived from the surplus in the form of reduced cash contributions in the future or cash refunds.
28 Scotia Gas NetworksAnnual Report and Accounts 2011
1. PRINCIPAL ACCOUNTING POLICIES (continued)
Defined contribution pension schemes The Group also operates defined contribution pension schemes. The assets of the schemes are held separately from those of the Group in independently administered funds. The amounts charged to the profit and loss account represent the contributions payable to the schemes in the period. Differences between contributions payable in the year and contributions actually paid are shown as either accruals or prepayments in the balance sheet.
ProvisionsA provision is recognised in the balance sheet when the Group has a present legal or constructive obligation as a result of a past event and it is probable that an outflow of economic benefits will be required to settle the obligation. Provisions are discounted where the impact of discounting the expected future cash flows is material.
Financial instrumentsThe Group’s funding, liquidity and exposure to interest rate risks are managed within a framework of policies and guidelines authorised by the Board of Directors. In accordance with these policies financial derivative instruments are used to manage interest rate and currency exposure.
Where appropriate these instruments are recorded at fair value and accounted for as described below.
Effective interest methodThe effective interest method is a method of calculating the amortised cost of a financial asset and of allocating interest income over the relevant period. The effective interest rate is the rate that exactly discounts estimated future cash receipts (including all fees paid or received that form an integral part of the effective interest rate, transaction costs and other premiums or discounts) through the expected life of the financial asset, or, where appropriate, a shorter period.
Income and expense is recognised on an effective interest basis for debt instruments other than those financial assets designated as ‘at fair value through profit or loss’ (FVTPL).
Financial AssetsInvestments are recognised and derecognised on a trade date where the purchase or sale of an investment is under a contract whose terms require delivery of the investment within the timeframe established by the market concerned and are initially measured at fair value, plus transaction costs, except for those financial assets classified as FVTPL, which are initially measured at fair value.
Financial assets at the balance sheet date are classified into the following specified categories: financial assets at FVTPL ‘held-to-maturity’ investments, ‘available-for-sale’ (AFS) financial assets and ‘loans and receivables’. The classification depends on the nature and purpose of the financial assets and is determined at the time of initial recognition.
Impairment of financial assetsFinancial assets, other than those at FVTPL, are assessed for indicators of impairment at each balance sheet date. Financial assets are impaired where there is objective evidence that, as a result of one or more events that occurred after the initial recognition of the financial asset, the estimated future cash flows of the investment have been impacted.
The carrying amount of the financial asset is reduced by the impairment loss directly for all financial assets with the exception of trade debtors.
If in a subsequent period, the amount of the impairment loss decreases and the decrease can be related objectively to an event occurring after the impairment was recognised, the previously recognised impairment loss is reversed through profit or loss to the extent that the carrying amount of the asset at the date the impairment is reversed does not exceed what the amortised cost would have been had the impairment not been recognised.
Derecognition of financial assetsThe Group derecognises a financial asset only when the contractual rights to the cash flows from the asset expire, or when it transfers the financial asset and substantially all the risks and rewards of ownership of the asset to another entity.
Trade debtorsTrade debtors are initially recognised at fair value. The carrying amount is reduced through the use of an allowance account. Appropriate allowances for estimated irrecoverable amounts are recognised where the estimated cash flows are less than the carrying amount. Subsequent recoveries of amounts previously written off are credited against the allowance account. Changes in the carrying amount of the allowance account are recognised in profit or loss.
Notes to the financial statements (continued)
for the year ended 31 March 2011

29
Cash and cash equivalentsCash and cash equivalents comprise cash on hand and demand deposits and other short-term highly liquid investments that are readily convertible to a known amount of cash and are subject to an insignificant risk of changes in value.
Financial liabilities Financial liabilities are classified as either financial liabilities ‘at FVTPL’ or ‘other financial liabilities’.
Financial liabilities at FVTPL Financial liabilities are classified as at FVTPL where the financial liability is either held for trading or it is designated as at FVTPL.A financial liability is classified as held for trading if:
it has been incurred principally for the purpose of disposal in the near future; or•
it is a part of an identified portfolio of financial instruments that the Group manages together and has a recent actual pattern •
of short-term profit-taking; or
it is a derivative that is not designated and effective as a hedging instrument. •
A financial liability other than a financial liability held for trading may be designated as at FVTPL upon initial recognition if:
such designation eliminates or significantly reduces a measurement or recognition inconsistency that would otherwise arise; or •
the financial liability forms part of a group of financial assets or financial liabilities or both, which is managed and its performance is •
evaluated on a fair value basis, in accordance with the Group’s documented risk management or investment strategy and information about the Group is provided internally on that basis; or
it forms part of a contract containing one or more embedded derivatives and IAS 39 Financial Instruments: Recognition and •
Measurement permits the entire combined contract (asset or liability) to be designated as at FVTPL.
Financial liabilities at FVTPL are stated at fair value, with any resultant gain or loss recognised in profit or loss. The net gain or loss recognised in profit or loss incorporates any interest paid on the financial liability.
Other financial liabilities Other financial liabilities, including borrowings, are initially measured at fair value, net of transaction costs. Other financial liabilities are subsequently measured at amortised cost using the effective interest method, with interest expense recognised on an effective yield basis. The effective interest method is a method of calculating the amortised cost of a financial liability and of allocating interest expense over the relevant period. The effective interest rate is the rate that exactly discounts estimated future cash payments through the expected life of the financial liability, or, where appropriate, a shorter period.
De-recognition of financial liabilitiesThe Group derecognises financial liabilities when, and only when, the Group’s obligations are discharged, cancelled or they expire.
Derivative financial instruments and hedge accountingThe Group uses interest rate swaps and foreign exchange forward contracts to hedge interest rate and foreign currency risk arising on debt instruments. On inception of the hedge relationship the Group documents the relationships between the hedged item and the hedging instrument along with the risk management objectives and its strategy for undertaking various transactions. Furthermore, at inception of the hedge and on an ongoing basis the Group documents whether the hedging relationship is highly effective.
Changes in fair value of derivatives that are designated and are effective as hedges of future cash flows are recognised directly in equity within the hedge reserve. Changes in fair value of derivatives that are designated and are effective as fair value hedges are recognised in the profit and loss account but effectively offset changes in fair value of the hedged item.
Changes in the fair value of derivatives that do not qualify for hedge accounting are recognised in the profit and loss account as they arise.
Hedge accounting is discontinued when the hedge instrument expires or is terminated.
Financial assets and financial liabilities are offset where they are settled net as a matter of practice and there is legal right to offset.
Accounts Notes to the financial statements

30 Scotia Gas NetworksAnnual Report and Accounts 2011
2. SEGMENTAL REPORTING
Turnover arises entirely in the United Kingdom and is attributable to the continuing activity of transportation of natural gas and the provision of related services, which the Directors consider a single class of business.
3. OPERATING PROFIT AND NET OPERATING COSTS2011
£m2010
£m
Turnover 802.0 783.4
Distribution costs (692.6) (653.1)Profit on disposal of fixed assets 0.8 0.5Other operating income 2.8 2.4
Total net operating costs (689.0) (650.2)
Operating profit 113.0 133.2
Distribution costs include the costs of operating the distribution network together with depreciation, goodwill amortisation and replacement expenditure.
4. LOSS ON ORDINARy ACTIVITIES BEFORE TAxATION
Group loss on ordinary activities before taxation is stated after charging/(crediting):2011
£m2010
£m
Auditors’ remuneration 0.3 0.4Goodwill amortisation 9.5 9.7Depreciation of owned assets 105.0 97.8Profit on disposal of fixed assets (0.8) (0.5)Replacement expenditure 256.0 244.7Impairment of trade debtors – (0.8)Rentals under operating leases – other assets 1.1 1.4
Auditors’ remuneration for the Group comprises £187,000 (2010: £178,000) in respect of statutory and regulatory audit services, £50,000 (2010: £50,000) in respect of other services pursuant to legislation, £nil (2010: £58,000) in respect of bond issue assurance work, £29,000 (2010: £125,000) in respect of IT consultancy services and £20,000 (2010: £nil) in respect of the capital reduction.
Auditors’ remuneration in respect of statutory audit services for the Company amounted to £10,000 (2010: £10,000).
In addition to the above services, the Group’s auditors acted as auditors to the Scotia Gas Networks Pension Scheme and fees of £15,000 (2010: £15,000) have been charged by the auditors to the Group in respect of these services.
5. EMPLOyEE INFORMATION AND DIRECTORS’ EMOLUMENTS
The Group had 3,921 full time equivalent employees as of 31 March 2011 (2010: 3,996). The average monthly number of full time equivalent employees during the year was 3,993 (2010: 4,017).
The Directors did not receive any remuneration for their services to the Group during the year, or during the prior year. No retirement benefits are accruing in the year or in the prior year to any Directors under money purchase or defined benefit schemes, in respect of their services to the Group.
Staff costs for the Group during the year are as follows:2011
£m2010
£m
Staff costsWages and salaries 136.4 131.6Social security costs 12.4 11.5Pension costs (see note 26) 24.7 16.1
173.5 159.2
The Company had 9 employees as of 31 March 2011 (2010: 10).
Notes to the financial statements (continued)
for the year ended 31 March 2011

31
6. INTEREST RECEIVABLE AND SIMILAR INCOME2011
£m2010
£m
Interest receivable on short term deposits 0.7 0.4Other finance income:Movement on financial derivatives (see note 17) 0.6 1.6
Total interest receivable and similar income 1.3 2.0
7. INTEREST PAyABLE AND SIMILAR CHARGES2011
£m2010
£m
Bank loans 0.2 1.1Index-linked bond interest 54.1 9.5Other interest payable on bonds 100.6 92.6Shareholders’ loan interest (see note 27) 66.7 67.5Other interest payable 7.2 5.5Net pension charge (see note 26) 0.1 3.4Unwind of discounts in provisions (see note 18) 7.2 9.0
236.1 188.6
8. TAx CREDIT/(CHARGE) ON LOSS ON ORDINARy ACTIVITIES
a) Analysis of the tax credit/(charge) on ordinary activities2011
£m2010
£m
Current taxCorporation tax at 28% – –Adjustment in respect of prior year 5.6 –
Total current tax credit 5.6 –
Deferred taxDeferred tax credit/(charge) for the year 19.8 (13.6)Adjustments in respect of prior year (6.4) (0.4)
Total deferred tax credit/(charge) for the year 13.4 (14.0)
Total tax credit/(charge) on loss on ordinary activities 19.0 (14.0)
b) Factors affecting the current tax credit for the year2011
£m2010
£m
Loss on ordinary activities before tax (121.2) (52.9)Loss on ordinary activities multiplied by standard rate of corporation tax in the UK of 28% (33.9) (14.8)Effects of:Non taxable income (0.2) (0.1)Deferred tax on accelerated capital allowances (7.5) (10.7)Deferred tax recognised on unutilised losses 23.5 1.5Depreciation on non-qualifying assets 8.0 7.9Other short term timing differences (10.9) (4.8)Tax losses not recognised 18.0 18.0Expenses not deductible for tax purposes 3.0 3.0Adjustment in respect of prior year – proceeds from sale of tax losses (5.6) –
Current tax credit (5.6) –
The Emergency Budget on 22 June 2010 announced that the UK corporation tax rate will reduce from 28% to 24% over a period of four years from 2011. The March 2011 Budget reduced the UK corporation tax rate by a further 1% with the first reduction being from 28% to 26%. This was substantively enacted on 29 March 2011 and is effective from 2011. This will reduce the Group’s future tax charge accordingly.
Accounts Notes to the financial statements

32 Scotia Gas NetworksAnnual Report and Accounts 2011
8. TAx ON LOSS ON ORDINARy ACTIVITIES (continued)
As the rate change has been substantively enacted, it has the effect of reducing the Group’s net deferred tax liabilities recognised at 31 March 2011 by £14.9m. It has not yet been possible to quantify the full anticipated effect of the announced further 3% rate reduction, due to legislation not being enacted, although this will further reduce the Group’s future current tax charge and reduce the Group’s deferred tax liabilities accordingly.
9. PROFIT OF THE COMPANy FOR THE FINANCIAL yEAR
The Company’s loss for the year amounted to £18.3m (2010: Loss of £67.3m). In accordance with the exemption available under section 408 of the Companies Act 2006, no separate profit and loss account is presented in respect of the Company.
10. DIVIDENDS 2011
£m2010
£m
Equity sharesInterim dividends paid of 12.7646 p (2010: pence nil) 60.0 –
11. INTANGIBLE FIxED ASSETS
GroupGoodwill
£m
Cost
At 1 April 2010 and at 31 March 2011 477.6
Accumulated amortisationAt 1 April 2010 46.5Charge for the year 9.5
At 31 March 2011 56.0
Net book value
At 31 March 2011 421.6
At 31 March 2010 431.1
The goodwill, which arose on the acquisitions of Scotland Gas Networks plc and Southern Gas Networks plc, is being amortised on a straight line basis over 50 years. This is the period over which the Directors estimate that the value of the underlying businesses acquired are expected to exceed the value of the underlying assets.
A review for impairment of goodwill is carried out at the end of each financial year. No impairment loss has been recorded in either the current or the prior year.
Notes to the financial statements (continued)
for the year ended 31 March 2011

33
12. TANGIBLE FIxED ASSETS
GroupShort
leasehold properties
£m
Freehold properties
£m
Plant and machinery
£m
Motor vehicles and office
equipment £m
Total £m
CostAt 1 April 2010 0.7 62.7 3,654.1 162.7 3,880.2Additions – 3.9 118.3 20.9 143.1
At 31 March 2011 0.7 66.6 3,772.4 183.6 4,023.3
DepreciationAt 1 April 2010 0.1 5.3 362.4 46.3 414.1Charge for the year – 2.3 82.5 20.2 105.0
At 31 March 2011 0.1 7.6 444.9 66.5 519.1
Net book value
At 31 March 2011 0.6 59.0 3,327.5 117.1 3,504.2
At 31 March 2010 0.6 57.4 3,291.7 116.4 3,466.1
The Company had no assets held under finance leases in the current or prior financial year.
The Company had no tangible fixed assets in either year.
The Group has received customer contributions relating to plant and machinery. In accordance with the Group’s accounting policy the assets are capitalised within fixed assets and the contributions are recognised as deferred income in the balance sheet. The deferred income is released to the profit and loss account over the estimated lives of the related assets. The amount deferred under this policy was as follows:
Deferred income Group
2011 £m
2010 £m
Customer contributions brought forward 114.6 99.4Customer contributions received in year 18.7 17.6Amortisation in year (2.8) (2.4)
130.5 114.6
The Company has no deferred income.
13. FIxED ASSET INVESTMENTS
Cost and net book valueGroup
£mCompany
£m
Shares in Group undertakingsAt 1 April 2010 and at 31 March 2011 – 948.4
Other investmentsAt 1 April 2010 and at 31 March 2011 0.2 –
0.2 948.4
Accounts Notes to the financial statements

34 Scotia Gas NetworksAnnual Report and Accounts 2011
13. FIxED ASSET INVESTMENTS (continued)
Other fixed asset investmentsOther fixed asset investments relate to the Group’s investments in Xoserve Limited, which provides transportation transactional services on behalf of all the major gas network transportation companies. The Group holds 23.1% (2010: 23.1%) of the ordinary shares of Xoserve Limited.
During the year the Group received dividends of £0.6m (2010: £0.5m) in relation to this investment.
Interests in Group undertakingsDetails of the principal subsidiary undertakings at the end of the year, which are directly wholly owned by the Company, are as follows:
Name of subsidiary Description of shares held Country of registration Principal activities
Southern Gas Networks plc 160,174,772 ordinary shares of £1 each
England & Wales Development, administration, maintenance and operation of regional gas distribution system and supply of transportation services.
Scotland Gas Networks plc 49,392,787 ordinary shares of £1 each
Scotland Development, administration, maintenance and operation of regional gas distribution system and supply of transportation services.
SGN Contracting Limited 1 ordinary share of £1 England & Wales Supply of contracting services.
SGN Connections Limited 1 ordinary share of £1 England & Wales Supply of gas connections services.
SGN Commercial Services Limited
1 ordinary share of £1 England & Wales Meter asset manager and supply of commercial services.
14. DEBTORSGroup Company
2011 £m
2010 £m
2011 £m
2010 £m
Amounts falling due within one yearTrade debtors 44.8 37.6 – –Amounts owed by Group undertakings – – 80.9 126.8Prepayments and accrued income 8.6 9.0 – 1.9Derivative financial instruments (see note 17) 11.4 86.7 – –
64.8 133.3 80.9 128.7
Trade debtors are stated net of bad debt provisions of £0.3m (2010: £0.3m) and credit note provisions of £2.0m (2010: £2.3m).
Within amounts owed by Group undertakings are loans amounting to £80.9m (2010: £22.2m) which incur interest at 1.5% (2010: 1.5%).
15. CREDITORS: AMOUNTS FALLING DUE WITHIN ONE yEARGroup Company
2011 £m
2010 £m
2011 £m
2010 £m
Bank loans and overdrafts 7.3 6.5 – 6.8€365m floating rate loan note due 2010 – 324.8 – –Trade creditors 38.0 35.2 – –Amounts owed to Group undertakings – – 342.8 434.5Other taxation and social security 27.8 19.3 0.2 0.3Other creditors 3.6 3.1 – –Accrued interest 61.2 58.7 22.3 22.2Other accruals 85.5 79.0 – 0.1Deferred income 18.6 16.1 – –Derivative financial instruments (see note 17) 43.9 48.1 – –
285.9 590.8 365.3 463.9
The amount owed to Group undertaking represents loans which incur interest at 0.5% (2010: 0.5%).
Notes to the financial statements (continued)
for the year ended 31 March 2011

35
16. CREDITORS: AMOUNTS FALLING DUE AFTER MORE THAN ONE yEARGroup Company
2011 £m
2010 £m
2011 £m
2010 £m
Bonds:Fixed rate and index-linked:£165m 2.127% index-linked due 2022 194.5 185.9 – –£250m 2.013% index-linked due 2035 294.6 281.6 – –£150m 2.066% index-linked due 2025 176.8 169.0 – –£15m 2.580% index-linked due 2028 16.0 15.2 – –£125m 2.31% index-linked due 2039 133.3 126.4 – –£257m 4.75% fixed rate due 2017 255.7 255.2 – –£300m 5.25% fixed rate due 2018 298.1 297.7 – –£225m 4.875% fixed rate due 2034 224.3 224.3 – –£215m 4.875% fixed rate due 2020 214.3 214.2 – –£375m 4.875% fixed rate due 2029 373.5 373.4 – –£225m 6.38% fixed rate due 2040 223.5 223.4 – –£25m 3.12% fixed rate due 2018 25.0 – – –£25m 3.25% fixed rate due 2018 25.0 – – –
2,454.6 2,366.3 – –
Floating rates:£233m floating rate loan note due 2015 232.6 232.6 – –£100m floating rate loan note due 2015 99.8 99.8 – –£80m floating rate loan note due 2043 79.5 79.5 – –£75m floating rate loan note due 2018 75.0 – – –£50m floating rate loan note due 2019 50.0 – – –
536.9 411.9 – –
Total bonds 2,991.5 2,778.5 – –Revolving credit facility drawn 168.3 (2.4) – –Shareholders’ loans (see note 27) 533.6 533.6 533.6 533.6
3,693.4 3,309.7 533.6 533.6
The shareholder loans, which are subordinated, are redeemable at par on 31 May 2015, or may be redeemed at par by the Company by giving due notice. Interest accrues at a fixed rate of 12.5% per annum and the Company may, upon giving due notice, elect to pay some or all of the interest payable through the issuance of further loans to shareholders.
The total revolving credit facility is £280.0m and expires in November 2013.
Maturity of borrowingsGroup
2011 £m
2010 £m
Due within one year – 324.8Between one and five years 1,034.3 –After five years 2,659.1 3,309.7
3,693.4 3,634.5
The Company’s borrowings fall due in more than five years.
The above borrowings are unsecured and are stated after the deduction of unamortised issue costs of £12.6m (2010: £14.5m). These costs together with the interest expense are allocated to the profit and loss account over the term of the borrowings. Interest is calculated using the effective interest rate method.
Certain interest costs in respect of index-linked bonds are not payable until the principal amount of the bond is repaid and are included within the carrying value of the borrowings stated above. The amount included in the carrying value of the borrowings at 31 March 2011 is £112.5m (2010: £75.5m).
Accounts Notes to the financial statements

36 Scotia Gas NetworksAnnual Report and Accounts 2011
17. FINANCIAL INSTRUMENTS
The Group’s funding, liquidity and exposure to interest rate, foreign currency exchange and credit risks are managed within a frame work of policies and guidelines authorised by the Board of Directors. In accordance with these policies and in accordance with covenants set out as part of bond issuances made by the Company, financial derivatives are used to manage financial exposures.
The Treasury function is responsible for managing banking and liquidity requirements of the Group, risk management relating to interest rate and foreign exchange exposures and for managing the credit risk relating to banking counterparties with which it transacts. The function’s operations are governed by policies determined by the Board.
Categories of financial instrumentsThe categories of financial assets and liabilities held by the Group were as follows:
Book Value
2011 £m
2010 £m
Financial assets held at amortised costTrade debtors (1) 44.8 37.6Short term deposits (1) 45.8 138.3
90.6 175.9Financial assets at fair valueDerivative financial instruments in designated hedging relationships (2) – 76.3Derivative financial instruments through the profit and loss account 11.4 10.4
11.4 86.7
Available for sale financial assets (1) 0.2 0.2
Total financial assets 102.2 262.8(1) The carrying amount of financial assets approximates to their fair value.
(2) During the year the Euro currency Swaps expired and were settled resulting in no gain or loss.Book Value
2011 £m
2010 £m
Financial liabilities held at amortised costTrade creditors 38.0 35.2Accrued interest 61.2 58.7Other accruals 85.5 79.0Bank loans and overdrafts 175.6 6.5Bonds 2,991.5 2,778.5Shareholder loans 533.6 533.6
3,885.4 3,491.5Financial liabilities at fair value Bonds – 324.8Derivative financial instruments in designated hedging relationships 43.9 48.1Onerous contract swaps 156.6 171.1
200.5 544.0
Total financial liabilities 4,085.9 4,035.5
The carrying amount of financial liabilities approximates to their fair value.
The following table provides an analysis of financial instruments that are measured subsequent to initial recognition at fair value, grouped into Levels 1 to 3 based on the degree to which the fair value is observable:
Level 1: Valued using unadjusted quoted prices in active markets for identified financial instruments. •
Level 2: Valued using techniques based significantly on observable market data. Instruments in this category are valued using valuation •
techniques where all of the inputs that have a significant impact on the valuation are directly or indirectly based on observable market data.
Level 3: Instruments in this category have been valued using a valuation technique where at least one input (which has a significant •
input on the financial instruments’ valuation) is not based on observable market data. Where inputs can be observed from market data with not undue cost and effort, the observed input is used. Otherwise management determines a reasonable estimate for the input.
Notes to the financial statements (continued)
for the year ended 31 March 2011

37
An analysis of financial assets and liabilities that are recorded at fair value at 31 March 2011 is as follows:
2011
Level 1 £m
Level 2 £m
Level 3 £m
Total £m
Financial assetsAt fair value through profit and loss – other financial assets (derivatives) – 11.4 – 11.4
– 11.4 – 11.4
Financial liabilities At fair value through profit and loss – other financial liabilities (derivatives) – 156.6 – 156.6Derivatives used for hedging – 43.9 – 43.9
– 200.5 – 200.5
2010
Level 1 £m
Level 2 £m
Level 3 £m
Total £m
Financial assetsAt fair value through profit and loss – other financial assets (derivatives) – 10.4 – 10.4Derivatives used for hedging – 76.3 – 76.3
– 86.7 – 86.7
Financial liabilities At fair value through profit and loss – other financial liabilities (derivatives) – 171.1 – 171.1Derivatives used for hedging – 48.1 – 48.1Debt instruments 324.8 – – 324.8
324.8 219.2 – 544.0
Onerous contract swapsIn 2005 the Group entered into interest rate swap contracts to fix the Group’s interest cost relating to (floating rate) bridging loans which were in place at the time. In October 2005, permanent long-term capital markets debt was issued to replace floating rate bridging loans. At that point these swaps became obsolete and consequently matching swaps were transacted (under which the Group received fixed rate interest) to close out the position. The crystallised loss was recognised in the profit and loss and a discounted provision equal to the market value of the matched swaps was established under onerous contract provision (see note 18). At 31 March 2011 the provision for onerous contract swap loss was £156.6m (2010: £171.1m).
Fair valuesThe Group’s financial instruments recorded at amortised cost are shown below together with their fair values:
31 March 2011 31 March 2010
Book Value £m
Fair Value £m
Book Value £m
Fair Value £m
Bonds 2,991.5 3,168.3 2,778.5 3,081.0Shareholder loans 533.6 545.4 533.6 520.8
3,525.1 3,713.7 3,312.1 3,601.8
Fair values of bonds and shareholder loans have been determined by reference to closing quoted market values where available or otherwise by discounting future cash flows at their market interest rate.
The carrying value of all other financial assets and liabilities approximates to their book value.
Accounts Notes to the financial statements

38 Scotia Gas NetworksAnnual Report and Accounts 2011
17. FINANCIAL INSTRUMENTS (continued)
RisksExposure to counterparty credit risk, interest rate risk, currency risk and liquidity risk arise in the normal course of business. The extent of any exposures and the policies implemented to manage them are set out below:
Credit riskCredit risk is the risk that a counterparty will default on its obligation resulting in financial loss to the Company.
The maximum exposure to credit risk is the carrying value of financial assets as follows:2011
£m2010
£m
Net trade receivables 44.8 37.6Financial derivative assets 11.4 86.7Short term deposits 45.8 138.3
102.0 262.6
Counterparty credit risks arising from financial derivatives are managed through the maintenance of financial limits, subject to a minimum credit rating of “A” or equivalent allocated by a recognised major ratings group. In respect of short-term cash management, counterparties are subject to review and approval according to defined criteria. The Group conducted a review of counterparty credit risk and concluded that no adjustment was required to reflect the net credit risk in arriving at the fair value of financial instruments stated in the balance sheet.
Trade receivables predominantly relate to transportation income from gas shippers. Credit risk arising from the Group’s regulated business is managed in accordance with industry standards as set out by the Unified Network Code. The Group contracts with shippers having investment grade ratings only, or where suitable collateral or cash prepayments are made.
Trade receivables from non-transportation income relates to consumers and businesses in relation to works for alterations, diversions, meters or damage repairs. In 2010/11 non-transportation receivables were 17.2% (2010: 21.0 %) of net trade receivables. An impairment allowance has been set aside according to the Group’s impairment policy.
The largest transportation debtor is £10.6m (2010: £11.9m). There is no material credit exposure to any one customer.
The ageing of trade receivables net of impairment allowance were:2011
£m2010
£m
Not past due 44.0 37.2Past due 0-30 days 0.8 0.4Past due 31-90 days – –Past due over 90 days – –
44.8 37.6
The movement in the allowance for impairment of trade receivables was:2011
£m2010
£m
Balance at 1 April 2010 0.3 1.1Increase/(decrease) in allowance for impairment (0.1) (0.8)
Balance at 31 March 2011 0.2 0.3
In addition there are credit note provisions against trade debtors of £2.0m (2010: £2.3m).
The amount released of £0.1m is in respect of debtors 30 days past. None of the trade debtors that are past due or impaired have had their terms renegotiated.
The maximum exposure to credit risk at the reporting date is the fair value of each class of debtors mentioned above. The Company does not hold any collateral as security.
At the end of each reporting period a review of the provision for bad and doubtful debts is performed taking in to account the age, status and risk of recovery for each receivable.
Notes to the financial statements (continued)
for the year ended 31 March 2011
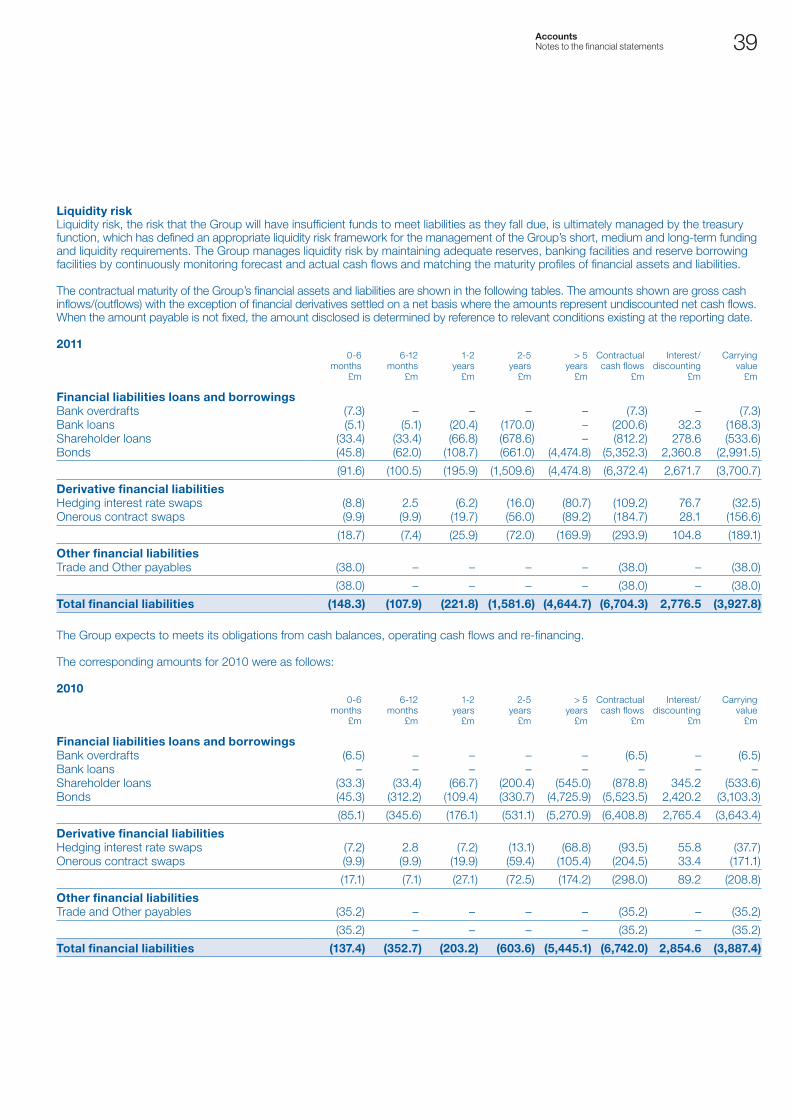
39
Liquidity riskLiquidity risk, the risk that the Group will have insufficient funds to meet liabilities as they fall due, is ultimately managed by the treasury function, which has defined an appropriate liquidity risk framework for the management of the Group’s short, medium and long-term funding and liquidity requirements. The Group manages liquidity risk by maintaining adequate reserves, banking facilities and reserve borrowing facilities by continuously monitoring forecast and actual cash flows and matching the maturity profiles of financial assets and liabilities.
The contractual maturity of the Group’s financial assets and liabilities are shown in the following tables. The amounts shown are gross cash inflows/(outflows) with the exception of financial derivatives settled on a net basis where the amounts represent undiscounted net cash flows. When the amount payable is not fixed, the amount disclosed is determined by reference to relevant conditions existing at the reporting date.
2011 0-6
months £m
6-12 months
£m
1-2 years
£m
2-5 years
£m
> 5 years
£m
Contractual cash flows
£m
Interest/discounting
£m
Carrying value
£m
Financial liabilities loans and borrowingsBank overdrafts (7.3) – – – – (7.3) – (7.3)Bank loans (5.1) (5.1) (20.4) (170.0) – (200.6) 32.3 (168.3)Shareholder loans (33.4) (33.4) (66.8) (678.6) – (812.2) 278.6 (533.6)Bonds (45.8) (62.0) (108.7) (661.0) (4,474.8) (5,352.3) 2,360.8 (2,991.5)
(91.6) (100.5) (195.9) (1,509.6) (4,474.8) (6,372.4) 2,671.7 (3,700.7)
Derivative financial liabilitiesHedging interest rate swaps (8.8) 2.5 (6.2) (16.0) (80.7) (109.2) 76.7 (32.5)Onerous contract swaps (9.9) (9.9) (19.7) (56.0) (89.2) (184.7) 28.1 (156.6)
(18.7) (7.4) (25.9) (72.0) (169.9) (293.9) 104.8 (189.1)
Other financial liabilitiesTrade and Other payables (38.0) – – – – (38.0) – (38.0)
(38.0) – – – – (38.0) – (38.0)
Total financial liabilities (148.3) (107.9) (221.8) (1,581.6) (4,644.7) (6,704.3) 2,776.5 (3,927.8)
The Group expects to meets its obligations from cash balances, operating cash flows and re-financing.
The corresponding amounts for 2010 were as follows:
20100-6
months £m
6-12 months
£m
1-2 years
£m
2-5 years
£m
> 5 years
£m
Contractual cash flows
£m
Interest/discounting
£m
Carrying value
£m
Financial liabilities loans and borrowingsBank overdrafts (6.5) – – – – (6.5) – (6.5)Bank loans – – – – – – – –Shareholder loans (33.3) (33.4) (66.7) (200.4) (545.0) (878.8) 345.2 (533.6)Bonds (45.3) (312.2) (109.4) (330.7) (4,725.9) (5,523.5) 2,420.2 (3,103.3)
(85.1) (345.6) (176.1) (531.1) (5,270.9) (6,408.8) 2,765.4 (3,643.4)
Derivative financial liabilitiesHedging interest rate swaps (7.2) 2.8 (7.2) (13.1) (68.8) (93.5) 55.8 (37.7)Onerous contract swaps (9.9) (9.9) (19.9) (59.4) (105.4) (204.5) 33.4 (171.1)
(17.1) (7.1) (27.1) (72.5) (174.2) (298.0) 89.2 (208.8)
Other financial liabilitiesTrade and Other payables (35.2) – – – – (35.2) – (35.2)
(35.2) – – – – (35.2) – (35.2)
Total financial liabilities (137.4) (352.7) (203.2) (603.6) (5,445.1) (6,742.0) 2,854.6 (3,887.4)
Accounts Notes to the financial statements

40 Scotia Gas NetworksAnnual Report and Accounts 2011
17. FINANCIAL INSTRUMENTS (continued)
Currency riskThe Group generally transacts in sterling denominated currency with the exception of certain material purchases and bond financing.
The Group enters into cross currency swap agreements from time to time with the effect of converting contractual commitments denominated in foreign currencies into sterling obligations. At 31 March 2011 the Group had minimal foreign currency exposure in relation to purchase contract commitments, or bond financing.
The Group redeemed the 365m Euro denominated floating rate bonds during the year (2010 carrying value: £324.8m) and the relevant Euro to Sterling swaps were settled.
Inflation risk The Group’s index-linked borrowings and interest liabilities are exposed to a risk of change in the carrying value due to changes in the UK Retail Price Index (‘RPI’). This form of liability is a good match to the Group’s regulated asset value which is also index-linked to RPI due to the price setting mechanism imposed by the regulator. The turnover capacity charges are also linked to RPI.
By matching liabilities and assets, index-linked debt hedges the exposure to changes in RPI and delivers cash flow benefit. The compensation for the inflation risk is recorded as payable on the balance sheet, with related principal as opposed to a cash payment. Assuming sensitivity to the RPI does not take into account the changes to revenue or operating costs that are affected by RPI or inflation generally, the following table shows the illustrative effect on the profit and loss account that would result from a 1% movement on movement in RPI before the effects of tax.
£m
Impact on income statement Index-linked bonds accretion 8.1Transportation income (7.4)
Total 0.7
Interest rate riskThe Group limits the impact of interest rate risk by implementing a policy of 80-85% of borrowing being either at fixed or index-linked, excluding borrowing from shareholders. Derivative financial instruments are transacted to hedge risk in accordance with this policy.
The impact of a change in interest rates on financial derivatives is dependent on whether their designation is fair value through the profit or loss, or if designated as cash flow hedges then the impact will be through equity.
The following table represents the annualised impact (net of deferred tax) of 100 basis point change in short term interest rates at the reporting date in relation to equity and income statement. The analysis assumes that all other variables remain constant.
2011 £m
2010 £m
Impact on income statementFloating rate instruments (7.1) (6.6)Fixed to floating swaps (2.7) (1.9)
(9.8) (8.5)
Impact on equityFloating to fixed swaps 3.6 3.6
Notes to the financial statements (continued)
for the year ended 31 March 2011

41
Cash flow hedgesCash flow hedges comprise floating to fixed interest rate swaps of future interest payments relating to existing bonds. Receipts and payments for the swaps and the underlying bonds are exactly matched and in accordance with FRS 26 any gain or loss that is deferred to equity is recognised in profit or loss over the period that the floating rate interest payments impact on profit.
The movement before deferred tax taken to equity in respect of cash flow hedges in the year was £4.2m gain (2010: £3.1m loss). The hedge reserve movement is expected to unwind in profit or loss over the life of the swaps.
The notional principle amount of the outstanding cashflow hedges at 31 March 2011 was £363m (2010: £363m). At 31 March 2011 the fixed interest rates vary from 3.1% to 6.3% and floating rates 1.0% (Libor plus 140bp).
Fair value hedgesThe Group has no fair value hedges at 31 March 2011.
The Group entered into cross currency swaps to hedge the fair value of €365m floating rate bonds. These swaps were designated as fair value hedge.
On 20 October, the €365m floating rate bond was redeemed at par and the related euro to sterling swaps were settled.
Movement in derivatives included in income statementThe net movement included within interest in the income statement for financial derivatives is as follows:
2011 £m
2010 £m
Net fair value losses (7.6) (1.9)Less: net amounts received 8.2 3.5
Net movement in financial derivatives 0.6 1.6
In addition the movement on onerous swap contracts in the period was £5.3 loss (2010: £7.2m) included in discount unwind within interest payable.
18. PROVISIONS FOR LIABILITIES
Group Onerous financial
instruments £m
Environmental £m
Deferred tax £m
Other provisions
£mTotal
£m
At 1 April 2010 171.1 28.2 224.8 6.7 430.8Arising during the year – 0.2 – 1.0 1.2Utilised during the year (19.8) (0.8) – (1.4) (22.0)Net movement in deferred tax – – (24.6) – (24.6)Amortisation of discount 5.3 1.8 – – 7.1
At 31 March 2011 156.6 29.4 200.2 6.3 392.5
Onerous financial instruments The onerous financial instruments provision relates to interest rate swap contracts which the Group holds (see note 17). The provision recorded at each balance sheet date represents the aggregate fair value of the swap contracts held. The provision will be utilised as cash settlement payments are made over the life of the swaps over the next seventeen years.
Environmental The environmental provision represents the Directors’ best estimate of environmental restoration costs, where the Group has a legal obligation to restore sites at the balance sheet date. The provision has been discounted and is stated at the present value of the estimated expenditure to settle the obligation. This provision is expected to be utilised over the next twenty years.
Accounts Notes to the financial statements

42 Scotia Gas NetworksAnnual Report and Accounts 2011
18. PROVISIONS FOR LIABILITIES (continued)
Deferred tax The net movement on the deferred tax provision has arisen as a result of a surrender of tax losses during the year, offset by other movements in the year of which £26.7m is recorded as a credit to the profit and loss account and £2.1m is recorded as a charge to the Statement of Total Recognised Gains and Losses.
The Company has no provisions in either year.
Deferred tax recognised in the financial statements (excluding deferred tax recognised in respect of pension liabilities – see note 26) is as follows:
Group Company
2011 £m
2010 £m
2011 £m
2010 £m
Accelerated capital allowances (289.4) (303.9) – –Deferred tax asset on losses 66.4 54.1 – –Deferred tax on cash flow hedges 11.4 13.5 – –Other timing differences 11.4 11.5 – –
(200.2) (224.8) – –
The movement in provision for deferred tax is as follows: Group
2011 £m
2010 £m
At 1 April (224.8) (215.0)Charged to profit and loss account 26.7 (9.1)Charged to Statement of Recognised Gains and Losses (2.1) (0.7)
At 31 March (200.2) (224.8)
The Group has unrecognised deferred tax assets in respect of unutilised tax losses of £253.2m (2010: £221.7m). Deferred tax assets have been recognised in respect of tax losses to the extent that it is considered probable that these assets will be recovered. Deferred tax assets have not been recognised in respect of unutilised tax losses in the Company amounting to £65.8m (2010: £62.1m).
In accordance with FRS 19 (“Deferred tax”), deferred tax has been measured based upon a corporation tax rate of 26% (2010: 28%), being the tax rate substantively enacted at the balance sheet date.
Other provisionsThis represents a provision for other legal and constructive obligations held by the Group. This provision is expected to be utilised over the next thirteen years.
19. SHARE CAPITAL31 March 2011 31 March 2010
Number Value (£m) Number Value (£m)
Allotted, called up and fully paid shares‘A’ ordinary shares of 42.55p (2010: 57.25p) each 235,025,002 100.0 235,025,002 134.5‘B’ ordinary shares of 42.55p (2010: 57.25p) each 117,512,501 50.0 117,512,501 67.3‘C’ ordinary shares of 42.55p (2010: 57.25p) each 117,512,501 50.0 117,512,501 67.3
Total 470,050,004 200.0 470,050,004 269.1
The ‘A’, ‘B’ and ‘C’ ordinary shares rank pari passu in all respects.
On 7 October 2010, the Company reduced the nominal value of its issued, called and fully paid shares to 42.55p each. Consequently, the total value of called up share capital decreased by £69.1m.
Notes to the financial statements (continued)
for the year ended 31 March 2011
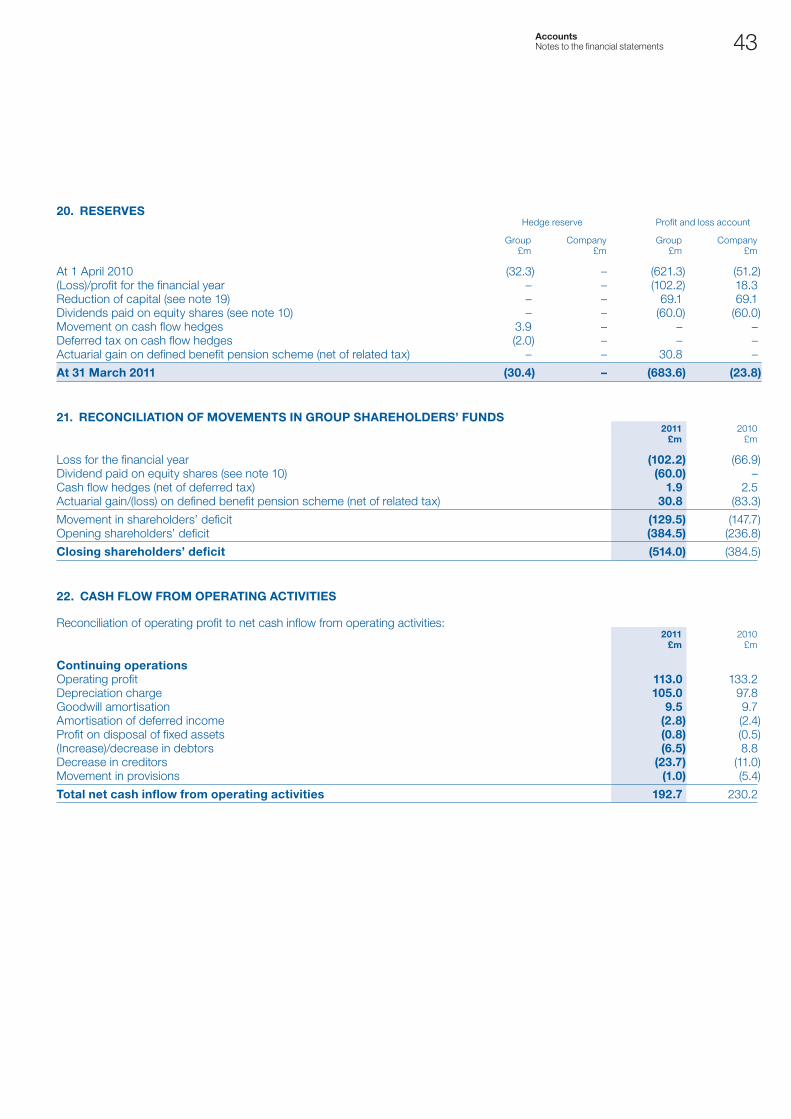
43
20. RESERVES Hedge reserve Profit and loss account
Group £m
Company £m
Group £m
Company £m
At 1 April 2010 (32.3) – (621.3) (51.2)(Loss)/profit for the financial year – – (102.2) 18.3Reduction of capital (see note 19) – – 69.1 69.1Dividends paid on equity shares (see note 10) – – (60.0) (60.0)Movement on cash flow hedges 3.9 – – –Deferred tax on cash flow hedges (2.0) – – –Actuarial gain on defined benefit pension scheme (net of related tax) – – 30.8 –
At 31 March 2011 (30.4) – (683.6) (23.8)
21. RECONCILIATION OF MOVEMENTS IN GROUP SHAREHOLDERS’ FUNDS2011
£m2010
£m
Loss for the financial year (102.2) (66.9)Dividend paid on equity shares (see note 10) (60.0) –Cash flow hedges (net of deferred tax) 1.9 2.5Actuarial gain/(loss) on defined benefit pension scheme (net of related tax) 30.8 (83.3)
Movement in shareholders’ deficit (129.5) (147.7)Opening shareholders’ deficit (384.5) (236.8)
Closing shareholders’ deficit (514.0) (384.5)
22. CASH FLOW FROM OPERATING ACTIVITIES
Reconciliation of operating profit to net cash inflow from operating activities:2011
£m2010
£m
Continuing operationsOperating profit 113.0 133.2Depreciation charge 105.0 97.8Goodwill amortisation 9.5 9.7Amortisation of deferred income (2.8) (2.4)Profit on disposal of fixed assets (0.8) (0.5)(Increase)/decrease in debtors (6.5) 8.8Decrease in creditors (23.7) (11.0)Movement in provisions (1.0) (5.4)
Total net cash inflow from operating activities 192.7 230.2
Accounts Notes to the financial statements

44 Scotia Gas NetworksAnnual Report and Accounts 2011
23. ANALySIS OF NET DEBT1 April
2010 £m
Cash flow £m
Non-cash changes
£m
31 March2011
£m
Bank overdraft (6.5) (0.8) – (7.3)Debt due within one year: – Financial Instruments (48.1) – 4.2 (43.9)– Floating rate loan (324.8) 325.6 (0.8) –Debt due after more than one year: – Bonds (2,778.5) (175.0) (38.0) (2,991.5)– Bank loans – (170.0) 1.7 (168.3)– Shareholders’ loans (533.6) – – (533.6)Onerous financial instruments (171.1) 19.8 (5.3) (156.6)Other financial instruments 86.7 (83.5) 8.2 11.4Short term deposits 138.3 (92.5) – 45.8
(3,637.6) (176.4) (30.0) (3,844.0)
Short term deposits comprise short term highly liquid investments with a maturity of three months or less.
Non-cash changes noted above represent fair value movements on financial instruments (see note 17) and interest incurred on index-linked bonds during the year which has not been paid and has been included within the carrying value of amounts borrowed.
24. OPERATING LEASE COMMITMENTS
The Group has lease agreements in respect of properties for which the payments extend over a number of years.
2011 £m
2010 £m
Annual commitments under non-cancellable operating leases expiring:Within one year – 0.1Within two to five years – –After five years 0.5 0.5
0.5 0.6
The Company has no operating lease commitments in either year.
25. CAPITAL COMMITMENTS
Capital projects contracted for by the Group but not provided in the financial statements amounted to £20.4m at 31 March 2011 (2010: £39.5m). The Company has no capital commitments at 31 March 2011 (2010: £nil).
26. PENSION COMMITMENTS
A significant proportion of the Group’s employees are members of the Scotia Gas Networks Pension Scheme (“the Scheme”). The Scheme provides final salary defined benefits for employees who joined the Lattice Group Scheme prior to 31 March 2002. A defined contribution section was added to the Lattice Group Scheme from 1 April 2002 for employees joining the Lattice Group Scheme from that date. Employees of the Group who were previously members of the Lattice Group Scheme transferred to the Scotia Gas Networks Pension Scheme on 1 December 2005.
Notes to the financial statements (continued)
for the year ended 31 March 2011

45
a) Defined benefit schemeThe Scheme is operated by the Group and is funded with assets held in separate trustee administered funds. It is subject to independent valuations at least every three years, on the basis of which the qualified actuary determines the rate of employers’ contribution, which, together with the specified contributions payable by the employees and proceeds from the scheme’s assets, are expected to be sufficient to fund the benefits payable under the scheme.
The latest full actuarial valuation was carried out as at 31 March 2009. In accordance with FRS 17, a limited actuarial review has been carried out by Hymans Robertson at 31 March 2011 using the projected unit method.
The following financial assumptions have been used:
As at 31 March 2011 2010 2009 2008
Discount rate 5.5% p.a. 5.5% p.a. 6.7% p.a. 6.9% p.a.Inflation assumption 3.5% p.a. 3.7% p.a. 3.0% p.a. 3.5% p.a.Rate of increase of salaries 5.0% p.a. 5.2% p.a. 4.5% p.a. 5.0% p.a.Rate of increase of pensions payment 3.5% p.a. 3.7% p.a. 3.0% p.a. 3.5% p.a.
The assumptions relating to longevity underlying the pension liabilities reflect the characteristics of the Scheme membership (‘VitaCurves’) for base mortality with an allowance for further improvements in life expectancy in line with the medium cohort adjustments subject to a 1.5% p.a. underpin in the longevity assumption. The assumed life expectancy in years for a member once they reach age 65 is as follows:
As at 31 March2011 2010 2009
Male Female Male Female Male Female
Member currently aged 65 21 23 21 23 23 26Member currently aged 45 24 27 24 27 26 28
The fair value of the assets in the scheme, the present value of the liabilities in the scheme and the expected rate of return were:
As at 31 March 2011 2010 2009 2008 2007
Long term rate of return
expectedValue
£m
Long term rate of return
expectedValue
£m
Long term rate of return
expectedValue
£m
Long term rate of return
expectedValue
£m
Long term rate of return
expectedValue
£m
Equities 7.8% 279.5 8.0% 308.3 7.7% 194.7 8.0% 234.5 8.0% 235.7Government bonds 4.3% 99.2 4.5% 50.7 4.2% 63.6 4.5% 71.5 4.5% 64.3Corporate bonds 5.5% 134.3 5.5% 63.1 6.7% 30.2 6.9% 25.8 5.1% 31.3Property 5.3% 36.3 5.5% 20.2 5.2% 12.4 5.5% 22.5 5.5% 15.3Cash 1.5% 9.9 1.1% 26.6 2.2% 17.2 5.8% 14.6 5.9% 1.0
Total market value of assets 559.2 468.9 318.1 368.9 347.6Actuarial value of liabilities (624.7) (618.4) (368.8) (341.7) (414.6)
(Deficit)/surplus in scheme (65.5) (149.5) (50.7) 27.2 (67.0)Related deferred tax asset/(liability) 17.2 41.9 14.2 (7.6) 20.1
Net pension (liability)/ asset (48.3) (107.6) (36.5) 19.6 (46.9)
The expected return on scheme assets represents the expected return of each major class of assets in which the scheme invests. Expected yield on fixed interest instruments are based on gross redemptions yields at the balance sheet date. Expected return on equity interests reflect real rates of return experienced in the relevant markets.
Accounts Notes to the financial statements

46 Scotia Gas NetworksAnnual Report and Accounts 2011
26. PENSION COMMITMENTS (continued)
Movement in fair value of scheme assets2011
£m2010
£m
At 1 April 468.9 318.1Expected return on scheme assets 34.4 21.7Contributions from scheme members 1.7 1.7Contributions from the Company 64.4 34.5Actuarial (losses)/gains (3.3) 98.1Benefits paid (6.9) (5.2)
As at 31 March 559.2 468.9
Movement in fair value of scheme liabilities2011
£m2010
£m
At 1 April (618.4) (368.8)Service cost (22.7) (14.2)Interest cost (34.5) (25.1)Contributions from scheme members (1.7) (1.7)Actuarial gains/(losses) 45.7 (213.8)Benefits paid 6.9 5.2
At 31 March (624.7) (618.4)
The Group’s contribution rate during the year was 37.3% of pensionable earnings. Additionally, the Group made special pension contributions to repair the deficit amounting to £43.5m. The expected contributions to be made in the year to 31 March 2012 are 37.3% of pensionable salary.
The actual loss on scheme assets was £37.7m (2010: gain of £76.4m).
The cumulative amount of actuarial losses recognised in the statement of total recognised gains and losses since the adoption of FRS 17 is £68.3m (2010: £110.7m).
Analysis of the amounts recognised in the profit and loss account2011
£m2010
£m
Amount charged to operating profit:Current service cost (22.7) (14.2)Analysis of the amount credited to finance income:Expected return on pension scheme assets (see note 6) 34.4 21.7Interest on pension scheme liabilities (see note 6) (34.5) (25.1)
Net finance charge (0.1) (3.4)
Net charge to the profit and loss account (22.8) (17.6)
Analysis of the amount recognised in the statement of total recognised gains and losses (STRGL)
2011 £m
2010 £m
Actual return less expected return on pension scheme assets (3.3) 98.1Experience losses on scheme liabilities (15.6) (20.7)Changes in financial assumptions underlying the present value of the scheme liabilities 61.3 (193.1)Deferred tax (11.6) 32.4
Actuarial gain/(loss) recognised in STRGL 30.8 (83.3)
Notes to the financial statements (continued)
for the year ended 31 March 2011

47
History of experience gains and losses2011 2010 2009 2008 2007
Difference between the expected and actual return on scheme assets (£3.3m) £98.1m (£82.8m) (£36.8m) (£3.4m)– Percentage of scheme assets at year end (0.6%) 20.9% (26.0%) (10.0%) (1.0%)Experience gains/(losses) on scheme liabilities £15.6m (£20.7m) – – (£31.3m)– Percentage of the present value of scheme liabilities at year end 2.5% (3.3%) – – (7.5%)Changes in financial assumptions underlying scheme liabilities £30.1m (£193.1m) £8.1m £112.6m £31.0m– Percentage of the present value of scheme liabilities at year end 9.8% (31.2%) 2.2% 32.2% 7.5%Total actuarial gains/(losses) recognised in the statement of total recognised gains and losses £42.4m (£115.7m) (£74.7m) £75.8m (£3.7m)– Percentage of the present value of scheme liabilities at year end 6.8% (18.7%) (20.2%) 22.2% (0.9%)
Movement in deficit during the year 2011
£m2010
£m2009
£m2008
£m2007
£m
Deficit in scheme at start of year (149.5) (50.7) – (67.0) (59.2)Movement in year:– Current service costs (22.7) (14.2) (13.5) (18.4) (19.7)– Contributions 64.4 34.5 34.5 34.2 12.8– Other finance (expense)/income (0.1) (3.4) 3.0 2.6 2.8– Actuarial gain/(loss) 42.4 (115.7) (74.7) 75.8 (3.7)Restriction of recognised surplus – – – (27.2) –
Deficit in scheme at end of year (65.5) (149.5) (50.7) – (67.0)
b) Defined contribution schemesThe amounts recognised in the profit and loss account are as follows:
2011 £m
2010 £m
Amount charged in respect of defined contribution schemes 2.0 1.9
27. RELATED PARTIES
The Company is owned by a consortium consisting of Scottish and Southern Energy plc (50%), OTPPB Investments (UK) Limited (25%), which is owned by Ontario Teachers’ Pension Plan Board and Borealis Infrastructure Europe (UK) Limited (25%) which is indirectly wholly owned by OMERS Administration Corporation.
It is the opinion of the Directors that the Group and Company have no single controlling party as the Company is controlled jointly by the consortium.
Accounts Notes to the financial statements

48 Scotia Gas NetworksAnnual Report and Accounts 2011
27. RELATED PARTIES (continued)
Transactions with shareholdersAmounts owed to shareholders and loans from shareholders are set out below:
Group
2011 £m
2010 £m
Shareholders’ loans:Scottish and Southern Energy plc 266.8 266.8Borealis (Luxembourg) SCA (1) 133.4 133.4OTPPB Investments (UK) Limited 133.4 133.4
533.6 533.6
Interest owed to shareholders:Scottish and Southern Energy plc 11.3 11.3Borealis (Luxembourg) SCA 5.7 5.7OTPPB Investments (UK) Limited 5.7 5.7
22.7 22.7
Other amounts owed to shareholders:Scottish and Southern Energy plc 16.1 13.6(1) Borealis (Luxembourg) SCA is an affiliate of Borealis Infrastructure Europe (UK) Limited.
The aggregate interest expense charged to the profit and loss account in respect of shareholders’ loans was £66.7m (2010: £67.5m). Interest accrues on the shareholders’ loans at a fixed rate of 12.5% per annum and is payable semi-annually in arrears on 30 November and 31 May each year. The Company may, upon giving due notice, elect to pay some or all of the interest payable through the issuance of further loans to its shareholders.
Other than interest charges relating to shareholder loans, the following transactions took place during the year between the Group and the Scottish and Southern Energy plc group of companies (SSE).
2011 £m
2010 £m
Sales of goods and services 131.2 145.0Purchase of goods and services (62.4) (55.8)Sale of tax losses 5.6 –
Sales of goods and services to SSE primarily represent gas transportation services. At 31 March 2011 an amount of £12.1m (2010: £12.8m) was owed by SSE in relation to these services and is included within trade debtors.
SSE provides services to the Group in the form of a management services agreement for corporate services. The Group also purchases certain items such as consumables stock, shrinkage gas and public liability insurance from SSE. Included within purchases of goods and services are direct costs in relation to tangible fixed asset and acquisitions projects incurred by SSE which have been recharged to the Group and capitalised. These costs amounted to £0.6m (2010: £1.1m).
During the year, the Group surrendered gross tax losses of £22.8m to SSE (2010: £nil) relating to the year ended 31 March 2009 for an aggregate cash consideration of £5.6m (2010: £nil).
Negotiations are ongoing for the proposed purchase by the Group from SSE of the anaerobic digester plant at Barkip, in Ayrshire Scotland.
Notes to the financial statements (continued)
for the year ended 31 March 2011

Business Review01 Financial and operational highlights 02 Our business at a glance04 Operational review10 Financial review
Corporate Governance12 Board of Directors 14 Directors’ report 16 Statement of Directors’ responsibilities17 Corporate governance statement
ContentsAccounts20 Independent auditors’ report21 Consolidated profit and loss account22 Consolidated statement of total
recognised gains and losses23 Balance sheets24 Consolidated cash flow statement25 Reconciliation of net cash flow
to movement in net debt26 Notes to the financial statements
Scotia Gas Networks Limited (the “Company”) is a holding company which does not trade. This operating and financial review sets out the main trends and factors underlying the development and performance of the Company and its subsidiary undertakings (together the “Group”) during the year ended 31 March 2011 as well as those matters which are likely to affect its future development and performance.
The Directors, in preparing this operating and financial review, have sought to comply with the Accounting Standard Board’s 2006 Reporting Statement: Operating and Financial Review as far as it applies to the circumstances of the Group.
Gas Company of the Year 2010
IGEM/sbgi Gas Industry Awards
RAV (Regulated Asset Value)
£4.3bnMarch 2011
Designed and produced by Tayburn

Scotia Gas Networks Annual Report and Accounts 2011
Sco
tia Gas N
etwo
rks Annual R
eport and Accounts 2011
Scotia Gas NetworksSt Lawrence HouseStation ApproachHorley, SurreyRH6 9HJ Scotland Gas Networks 0845 070 1432 Southern Gas Networks0845 070 1431
www.sgn.co.uk
If you smell gas or are worried about gas safety you can call the National Gas Emergency Number on 0800 111 999