Embed Size (px)
Citation preview

Scorecard 2014/15 Poole Hospital NHS Foundation Trust
= those items shaded in column A (Ind No.) are duplicated in the Integrated Performance Report
Ind
No.Area of Practice Quality Requirement Data Source
Thresh-
oldApril May June July Aug Sep Oct Nov Dec Jan
1Percentage of women see a midwife by 12 weeks and 6 days of
pregnancyDawn Jackson 90% 90% 96% 94.40% 97% 97% 95.20% 97.40% 97% 97.50% 97%
2 Percentage of women breastfeeding at 48 hours Dawn Jackson 80% 78% 78% 78.40% 80.40% 82% 78.70% 81% 80.20% 81.50% 82.40%
3 Reduction in percentage of women smoking at delivery Dawn Jackson <13% 12% 12% 13% 12.20% 9% 9.25% 10.40% 9.20% 11.30% 12%
4Percentage of service users admitted or discharged within 4
hours of their arrival at A&EDavid Hannington 95% 95.23% 95.28% 96.31% 93.67% 93.44% 95.53% 92.26% 93.75% 86.51% 90.78%
512 hour trolley waits
David Hannington 0 0 0 0 0 0 0 0 0 0 0
6All handovers between ambulance and A&E to take place within
15 minutes with none waiting more than 30 minutes
David Hannington 0 45 18 22 38 21 14 32 17 42 23
7 All handovers between ambulance and A&E to take place within
15 minutes with none waiting more than 60 minutes
David Hannington 0 2 6 6 3 0 1 1 2 15 5
8Percentage of patients admitted directly to specialist stroke unit
within 4 hours of arrival at hospitalBarry Duell 90% 71% 80% 70% 89% 83% 86% 76% 88% 81% 76%
9 Percentage of patients assessed for thrombolysis Barry Duell 100% see SSNAP see SSNAP see SSNAP see SSNAP see SSNAP see SSNAP see SSNAP see SSNAP see SSNAP
10Percentage of patients receiving thrombolysis if clinically
indicatedBarry Duell 100% see SSNAP see SSNAP see SSNAP see SSNAP see SSNAP see SSNAP see SSNAP see SSNAP see SSNAP
11 Percentage of patients assessed and managed by stroke nursing
staff within 24 hours of admissionBarry Duell 100% See SSNAP See SSNAP See SSNAP See SSNAP see SSNAP see SSNAP see SSNAP see SSNAP see SSNAP
12Percentage of patients assessed by all members of the specialist
rehab team within 72 hours of admissionBarry Duell 100% See SSNAP See SSNAP See SSNAP See SSNAP see SSNAP see SSNAP see SSNAP see SSNAP see SSNAP
13 Percentage of patients with documented MDT goals Barry Duell 100% See SSNAP See SSNAP See SSNAP See SSNAP see SSNAP see SSNAP see SSNAP see SSNAP see SSNAP
14 ChildrenPercentage of children and young people who have had bacterial
meningococcal septicaemia who have a follow up appointment
with consultant paediatrician within 6 weeks of discharge
tbc 100% tbc tbc tbc tbc tbc tbc tbc tbc tbc tbc
15 Summary hospital level mortality indicator Kate Thomas 2 or 3 tbc n/a n/a 101.34 n/a n/a n/a n/a n/a n/a
16 Hospital Standardised Mortality rate Kate Thomas <100 84.4 117.15 100.36 100.92 99.58 100.34 97.57 n/a n/a n/a
17
Percentage staff trained in LD
Deborah McFarland 0 tbc tbc LD formal
training starts
Sept 2014
LD formal
training starts
Sept 2014
3% 5% 8% 7% 9%
18 Percentage of patients who have an enhanced assessment of care
needs upon emergency admission to hospital
Karen Edge 95% n/a n/a n/a n/a n/a n/a n/a n/a n/a
19 Fractured NOF Percentage of clinically appropriate patients with #NOF
operated on within 36 hours of admissionHelen Currie 95% 74% 88% 75% 84% 90% 84% 84% 85% 94% 93%
20 PROMSReported Health Gain
Sarah Morrisdata req'd
tbc 74% 79% 70% 80% 100% 100% 94% 100% 100% 100%
21 Heart Failure Percentage of people admitted with heart failure who receive a
clinical assessment within 2 weeks of discharge
TBC 100% 78% 100%95%
quarterly93% 95% 88% tbc tbc tbc
22Percentage of people supported to die in their preferred place
Clive Hunt/Andi
Stone75% tbc tbc tbc tbc tbc tbc tbc tbc
see Q3
report
Mortality
Stroke
Emergency
Department
Maternity
Learning
Disability
End of Life

23Number of quality statements maintained at amber or green
against ELCQU measures
Clive Hunt/Andi
Stone9 or more 14 14 14 14 14 14 14 14
24Number of cancellations of surgery on day of admission for non
clinical reasonsDavid Collier 7 37 13 24 21 10 35 36 17 42
25Percentage of cancelled surgery on day of admission who are
offered another binding date within 28 days David Collier 100% 100% 100% 100% 100% 100% 100% 100% 94.40% 88.25%
25a
% Compliance with WHO Surgical Checklist
Vivian StevensMonthly Audit
Sept onwards
Monthly Audit
Sept onwards
To be
included in
Q2 report
- - 89% 90%
26Sufficient slots
data req'd
tbc tbc tbc tbc tbc tbc tbc tbc tbc
27Percentage of falls assessments completed within 24 hours of
admissionJulie Haddock 95% 99% 96% 95% 95% 95% 95% 93% 96% 91% 93%
28 Number of falls resulting in fracture or severe harm Julie Haddock 0 3 1 3 2 1 2 1 5 2 3
29 NutritionPercentage of admissions screened within 24 hours of admission
to hospitalDebbie Reeves 95% 82% 81% 83% 85% 83% 81% 87% 83% 70% 83%
30Percentage of admissions that have a risk assessment completed
within 6 hours of admission Julie Haddock 95% 95% 88% 92% 98% 98% 98% 87% 100% 100% 98%
31 Number of New Pressure Ulcers Grade 3/4 Julie Haddock 0 0 0 0 1 3 2 1 1 0 3
32 Number of all Hospital acquired pressure ulcers Julie Haddock 0 14 11 7 12 11 12 20 13 12 21
33 Staffing Levels Publicly displayed Mandy Baker Y/N Pilot roll out Y Y Y Y Y Y Y Y Y
34 Staff turnover Phil Gold 0.78 0.72 0.83% 0.98% 1.56% 1.14% 1.01% 1.20% 0.84%
35Staff appraisal rate
Phil Gold 90% 73% 76% 77% 74% 72% 77% 76% 77%75%
36 Mandatory training rate Deborah McFarland 90% 75% 76% 77% 79% 77% 81% 82% 83% 83% 83%
37 Sickness rate Phil Gold 3.73% 3.66% 3.66% 3.88% 3.66% 3.56% 3.49% 3.67% 3.76%
38 Number of staff receiving Clinical supervision Yvonne Jeffrey N/a tbc n/a n/a n/a n/a n/a n/a n/a n/a n/a
39Percentage of eligible staff receiving clinical supervision
Yvonne Jeffrey 90% tbc n/a n/a n/a n/a n/a n/a n/a n/a n/a
40
Mixed Sex
accomodation
Breach number of mixed sex accommodation breaches
Jen Bennett 0 0 0 1 0 0 0 0 0 0 0
41 MRSA Bacteraemia Denise Richards 0 1 0 0 0 0 0 0 0 0 0
42 Clostridium Difficile Denise Richards 13 0 2 0 0 2 2 3 0 2 2
43Norovirus number of cases
Denise Richards N/A 0 0 0 0 0 0 0 03
6
44Norovirus number of bed days lost Denise Richards N/A 0 0 0 0 0 0 0 0
not countednot counted
45 Percentage of patients screened for MRSA Kate Thomas 95% tbc tbc 93% tbc tbc tbc tbc tbc tbc
46MSSA Denise Richards N/A 0 0 1 0 1 1 0 2
31
47E-Coli
Denise Richards N/A 6 3 4 3 3 0 6 13
2
48Percentage of risk assessments completed upon admission
Bradley Postill 95%97.70% 97.00% 97.40% 97.63%
96.91% 97.40% 97.30% 97.50% 98.20%
49Percentage of patients who receive appropriate prophylaxis
Helen Ross 100% 97.45% 99% 98.40% 99.50% 97.60% 98.30% 99.30% 98.80% 99.60% 100%
50Number of Hospital acquired thrombus with a completed RCA
Bradley Postill N/A 40% 33% 25% 30% 0% tbc tbcsee qrtly
report
see qrtly
report
see qrtly
report
51 Publication of a formulary Deryck Burton Yes/No Y Y Y Y Y Y Y Y Y Y
52 Number of medication errors Richard Longstaff 43 50 77 76 73 68 66 64 54 62
Staffing
Medicines
VTE
Infection Control
Pressure ulcers
Falls
Surgery
End of Life

53Number of medication errors relating to controlled drugs
Richard Longstaff 0 1 1 8 3 6 1 7 3 7
54 Duty of CandourNumber of times duty of candour used
Carrie Stone N/A (81) (79) 4 5 1 4 2 4 3 5
55 Never Events Number of Never Events Carrie Stone 0 0 0 0 1 0 0 0 0 0 0
56 Serious IncidentsNumber of serious incidents
Carrie Stone N/A 9 3 8 5 5 4 1 7 7 6
57 Number of incidents by harms; Richard Longstaff 556 691 731 743 780 818 674 817 646 715
58 Harm Richard Longstaff 237 285 259 321 324 315 265 319 267 287
59 No Harm Richard Longstaff 319 406 472 422 456 503 409 498 379 428
60Early Warning
Score Percentage of observations and scores completed100% 97% 100% 98% 98% 97% 98% 98% 94% 98% 97%
61Percentage staff trained in Level 1 Safeguarding Children
Deborah McFarland 90% 89% 89% 90% 90% 88% 90% 90% 90% 90% 90%
62Percentage staff trained in Level 2 Safeguarding Children
Deborah McFarland 90% 87% 88% 89% 90% 87% 90% 90% 90% 90% 90%
63Percentage staff trained in Level 3 Safeguarding Children
Deborah McFarland 90% 81% 87% 87% 85% 85% 84% 84% 85% 86% 87%
64Percentage staff trained in Safeguarding Adults
Deborah McFarland 90% 68% 68% 70% 71% 69% 74% 75% 76% 77% 77%
65Percentage staff trained in relation to Mental Capacity Act and
DOLsDeborah McFarland 90% 68% 68% 70% 71% 69% 74% 75% 76% 77% 77%
66 COPDPercentage of patients of eligible patients discharged with a
completed COPD bundleAnne-Marie Helyar 85% - - 83% see CQUIN - quarterly
See
CQUIN
See
CQUIN
See
CQUIN
See
CQUIN
67Number of complaints received Carrie Stone N/A 32 45 47 53 39 48 47 40
3444
68Percentage of complaints acknowledged within 3 operational
daysCarrie Stone 95% 100% 91% 93% 98% 92% 98% 98% 94% 94% tbc
69Percentage of complaints responded to within agreed timescales
Carrie Stone 85% 93% 84% 93% 86% 92% 90% 90% 79% 81% tbc
70Date when last complaints summary published on website
Carrie Stone N/A tba tbc tbc tbc 30.07.14 30.07.14 30.07.14 30.07.14 31.12.14 31.12.14
Thresh-
old April May June July Aug Sep Oct Nov Dec Jan1a Implementation of staff friends and family test Marie Cleary Y Y Y Y Y Y Y
1bEarly implementation of FFT in all outpatient and day case
departments by 31 October 2014 Maria Bennett n/a n/a n/a n/a n/a n/a Y Y Y 15.10%
1.2FFT increased response rates: ED
Maria BennettQ1 -15%
Q4 - 20%15% 12% 11.20% 8.60% 13.80% 15.70% 15.60% 14.30% 17.20% 18.50%
1.2aFFT Increased response rates; inpatients
Maria BennettQ1 - 25%
Q4 -30% 65% 60% 60.50% 56.50% 55.30% 42.50% 44.40% 57.40% 59.80% 53.70%
1.3 FFT decreasing negative responses Maria Bennett <1.5% 1.83% 2.47% 3.14% 2.36% 1.92% 2.66% 2.96% 2.71% 4.55% 1.58%
2.1a Reduction in prevalence of pressure ulcers Helen Ross 0.98 0.4 0.00% 0.83 0.98% 1.49% 0.65% 1.84% 0.60% 0.96%
2.1bNumber of patients recorded with a new or old pressure ulcers
as measured using STHelen Ross 21 19 12 27 26 20 15 23 24 27
2.1cIncident report sent to commissioners for all inherited pressure
ulcersJulie Haddock Yes Yes Yes Yes Yes Yes Yes Yes Yes Yes
3.1a Find Helen Ross 90% 97% 98% 99% 99% 95% 99% 99% 99% 99% tbc
3.1b Assess Helen Ross 90% 98% 99% 99% 99% 95% 99% 99% 99% 98% tbc
3.1c Refer Helen Ross 90% 95% 93% 94% 93.50% 93.10% 91% 81% 99% 99% tbc
3.2Clinical Leader and Training
Helen Ross tbc tbc tbcSee CQUIN
tbc tbcSee
CQUIN
See
CQUIN
See
CQUIN
See
CQUIN
3.3Carers Survey
Helen Ross tbc tbc tbcSee CQUIN
tbc tbcSee
CQUIN
See
CQUIN
See
CQUIN
See
CQUIN
Dementia
Safety
Thermometer
Friends and
Family
Safeguarding
CQUIN
see exception report
Complaints
Incidents
Medicines

5.1Early Assessment
Helen Ross to checkdata req'd
tbctba tba tba
See CQUIN See CQUIN See CQUIN
See
CQUIN
See
CQUIN
See
CQUIN
See
CQUIN
5.2Impact of Early Assessment
Helen Ross to checkdata req'd
tbctba tba tba
See CQUIN See CQUIN See CQUIN
See
CQUIN
See
CQUIN
See
CQUIN
See
CQUIN
6.1Admission
Avoidance Early assessment by consultantHelen Ross to check 100% Q4 tba tba tba
See CQUIN See CQUIN See CQUIN
See
CQUIN
See
CQUIN
See
CQUIN
See
CQUIN
7.1 Reduction of late discharges 415 423 421 508 tbc tbc tbc tbc tbc tbc
7.2 Weekend Discharges Jane Brennan 400 448 475 368 490 384 415 714 385
7.3 Completed discharge summaries tbc tbc tbc tbc tbc tbc tbc tbc tbc tbc
8.1 Delayed TransferNumbers of delayed discharges or transfers of care each month
3.46% 3.46% 2.17% 3.26% 4.86% 5.13% 6.21% 7.84% 7.49% tbc
Discharges
Admission

Scorecard 2014/15 Royal Bournemouth and Christchurch Hospitals NHS Foundation Trust
Ind No. Area of Practice Quality Requirement Threshold April May June July Aug Sep Oct Nov Dec Jan Feb MarRAG
Rating
1Percentage of women see a midwife by 12 weeks and 6 days
of pregnancy90%
2 Percentage of women breastfeeding at 48 hours 80%
3 Reduction in percentage of women smoking at delivery <13%
4Percentage of service users admitted or discharged within 4
hours of their arrival at an A&E95% 94% 94.45% 95.24% 93.15% 95.91% 92.56% 92.93% 94.12% 89.94%
5 12 hour trolley waits 0 0 0 0 0 0 0 0 0 1
6All handovers between ambulance and A&E taking place in
30-60 minutes (unvalidated)0 15 46 25 52 28 33 75 74 73
7All handovers between ambulance and A&E taking place in
over 60 minutes (unvalidated)0 13 14 9 4 9 9 13 13 28
8Percentage of patients admitted directly to specialist stroke
unit within 4 hours of arrival at hospital90% 66.2% 60.7% 54.2%
9Percentage of patients assessed for thrombolysis (and
received thrombolysis) 10% 9.2% 9.8 % 11.90%
10
Percentage of patients receiving thrombolysis if clinically
indicated (proportion of eligible patients given
thrombolysis)
100% n/a n/a n/a
11Percentage of patients assessed and managed by stroke
nursing staff within 24 hours of admission100% 89.2% 82.0% 93.2%
12Percentage of patients assessed by all members of the
specialist rehab team within 72 hours of admission100% n/a n/a n/a
13Percentage of patients with documented MDT goals (within
5 days) 100% n/a n/a n/a
13.1Percentage of patients that spend more than 90% of their
stay on a Stroke ward 70% 59.3% 61.4%
13.2Percentage of patients that are scanned within 1 hr of
Admission 26.2% 39.3% 35.6%
14 Children
Percentage of children and young people who have had
bacterial meningococcal septicaemia who have a follow up
appoint with consultant paediatrician within 6 weeks of
discharge
100% n/a n/a n/a n/a n/a n/a n/a n/a n/a
15
88.5 95.3 79.4 77.5 99.2
201.9 161.2 165.1 163 150.4
17 Percentage staff trained in LD 86% 86.10% 86.2 86.20% 87.20% 87.1% 86.3% 86.3% 87.4%
18Number of patients who have an enhanced assessment of
care needs upon emergency admission to hospital (CPI flag)95%
LD = 10,
Reasonable
Adj=6,
100% care
plans in
place
LD = 15,
Reasonable
Adj=6,
100% care
plans in
place
LD = 12,
Reasonable
Adj=9,
100% care
plans in
place
LD = 10,
Reasonable
Adj=4,
100% care
plans in
place
LD = 11,
Reasonable
Adj = 4,
100% had
care plans
in place
LD = 10,
Reasonable
Adj = 2,
100% had
care plans
in place
LD = 10,
Reasonable
Adj = 8,
100% had
care plans
in place
LD = 13,
Reasonable
Adj = 9,
100% had
care plans
in place
LD = 14,
Reasonable
Adj = 8,
100% had
care plans
in place
19 Fractured NOFAverage time of transfer for clinically appropriate
inpatients with #NOF 95% No NOFs
1 case -
Transfer time
> 24 hours
from request
to transfer
2 cases -
Both
transfers
within 90
minutes of
request
No NOFs No NOFs No NOFs No NOFs
3 cases -
Transfer
times to be
reviewed as
part of RCA
3 cases -
Transfer
times to be
reviewed as
part of RCA
Dec 14 not
yet
available
Learning Disability
Oct 14 not
yet
available
Nov 14 not
yet
available
16
Hospital Standardised Mortality rate
RBH
MacMillan Unit - Christchurch
<100
Sept 14 not
yet
available
Q3 not yet available
Emergency
Department
Stroke
64.50% 68.30%
15.50%
75.70%
90.90%
73.20%
97.50%
70.90%
38.00%
Q3 not yet available
Q3 not yet available
70.30%
96.60%
73.80%
Q2 - 85.1%
Mortality
30.20%
Q1 - 90.3%Maternity
Q1 - 88.9%
13.70%
96.40%
88.80%
Q1 - 15.9% Q2 - 4%
Q2 - 82.7%

20 PROMS
EQ-5D Reported Health Gain. Case mix adjusted
average health gains for;
i) Groin hernia 0.072
No new
PROMS
data issued
No new
PROMS
data issued
No new
PROMS
data issued
No new
PROMS
data issued
No new
PROMS
data issued
No new
PROMS
data issued
No new
PROMS
data issued
No new
PROMS
data issued
ii) Varicose vein N/A " " " " " " " "
iii) Hip replacement (primary) 0.422 " " " " " " " "
iv) Knee replacement (primary) 0.304 " " " " " " " "
21 Heart FailurePercentage of people admitted with heart failure who
receive a clinical assessment within 2 weeks of discharge100%
22Percentage of people supported to die in their preferred
place75%
23Number of quality statements maintained at amber or green
against ELCQU measures 9 or more
24Number of cancellations of surgery on day of admission for
non clinical reasons14 27 40 26 25 15 23 11 11
25Percentage of cancelled surgery on day of admission who
are offered another binding date within 28 days100% 100% 100% 96.15% 100% 100% 95.6% 100%
26 Sufficient slots
27Percentage of falls assessments completed within 24 hours
of admission95% 83% 92% 91% 91% 88% 91% 91% 88% 93%
28Number of falls (Reported as AIRS) resulting in moderate or severe harm
0 1 3 3 2 0 1 1 4 4
29 NutritionPercentage of admissions screened within 24 hours of
admission to hospital95% 77% 88% 88% 89% 90% 91% 87% 80% 87%
30Percentage of admissions that have a risk assessment
completed within 6 hours of admission 95% 87% 96% 95% 96% 94% 96% 96% 93% 97%
31 Number of New Pressure Ulcers Grade 3/4 (AIRS reported) 0 2 2 2 4 9 7 4 6 4
32Number of all Hospital acquired pressure ulcers (AIRS
reported, Category 1-4)0 65 67 61 69 65 73 82 74 47
33 Staffing Levels Publicly displayed Y/N Yes Yes Yes Yes Yes Yes Yes Yes Yes
34 Staff turnover 10.6% 10.8% 11.4% 11.1% 11.5% 11.2% 11.3% 12.5% 12.5%
35 Staff appraisal rate 90% 78.8% 76.3% 72.9% 73.8% 74.3% 72.2% 72.4% 72.5% 72.4%
36 Mandatory training rate 90% 78.6% 78.6% 78.7% 79.1% 79.7% 79.3% 78.9% 78.6% 78.9%
37 Sickness rate 3.76% 3.74% 3.70% 3.71% 3.75% 3.82% 3.83% 3.84% 3.83%
38 Number of staff receiving Clinical supervision N/A
39 Percentage of eligible staff receiving clinical supervision 90%
Data not
currently
recorded
Data not
currently
recorded
Data not
currently
recorded
Data not
currently
recorded
Data not
currently
recorded
Data not
currently
recorded
Data not
currently
recorded
Data not
currently
recorded
Data not
currently
recorded
40
Mixed Sex
accommodation
Breach
number of mixed sex accommodation breaches 0 0 0 0 0 0 0 0 0 0
41 MRSA Bacteraemia 0 0 0 0 0 1 0 0 0 0
42 Clostridium Difficile 25 0 1 0 2 3 1 3 1 1
43 Norovirus number of cases N/A 0 0 0 0 0 0 0 0 2
44 Norovirus number of bed days lost N/A 0 0 0 0 0 0 0 0 17
45 Percentage of patients screened for MRSA 95% 87.50%77%
(unvalidated)84.9% 89.5% 89.6% 83.2%
Not yet
available
Not yet
available
Not yet
available
46 MSSA N/A 2 0 0 2 1 0 2 1 2
47 E-Coli N/A 1 6 3 9 4 3 6 3 5
(Q4 PROMS data)
End of Life
Surgery Dec 14 not
yet
available
Pressure ulcers
Staffing
Infection Control
Falls
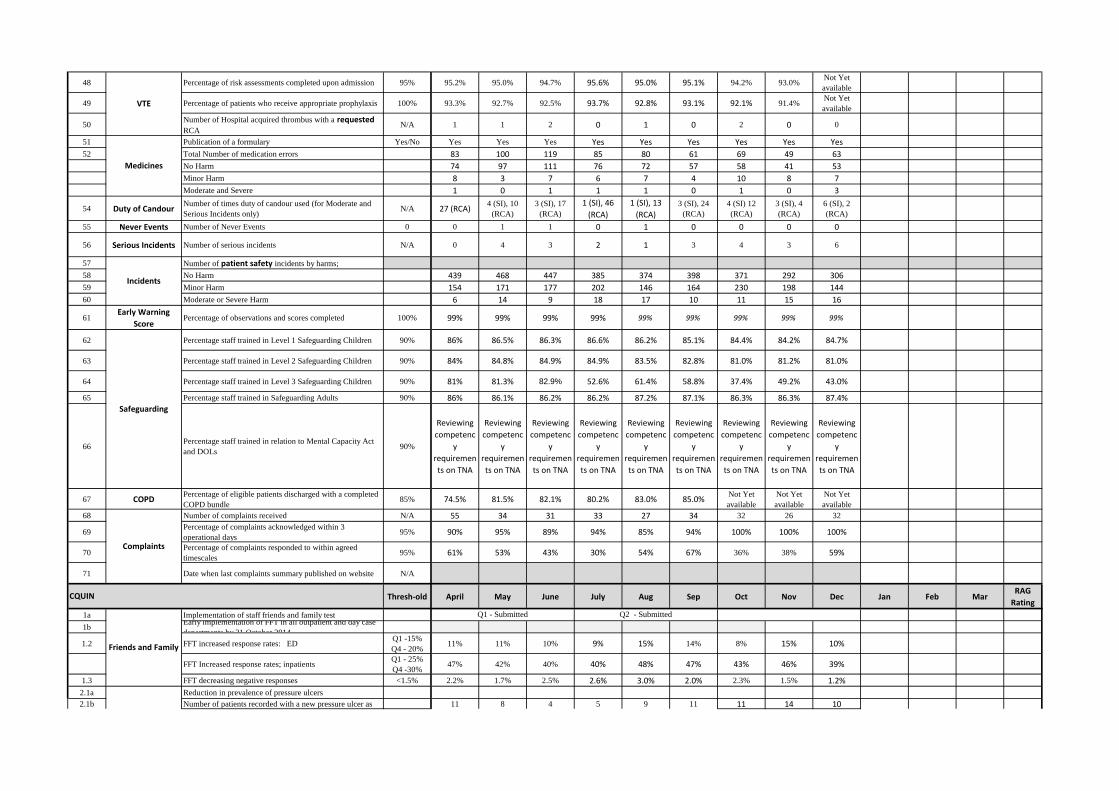
48 Percentage of risk assessments completed upon admission 95% 95.2% 95.0% 94.7% 95.6% 95.0% 95.1% 94.2% 93.0%Not Yet
available
49 Percentage of patients who receive appropriate prophylaxis 100% 93.3% 92.7% 92.5% 93.7% 92.8% 93.1% 92.1% 91.4%Not Yet
available
50Number of Hospital acquired thrombus with a requested RCA
N/A 1 1 2 0 1 0 2 0 0
51 Publication of a formulary Yes/No Yes Yes Yes Yes Yes Yes Yes Yes Yes
52 Total Number of medication errors 83 100 119 85 80 61 69 49 63
No Harm 74 97 111 76 72 57 58 41 53
Minor Harm 8 3 7 6 7 4 10 8 7
Moderate and Severe 1 0 1 1 1 0 1 0 3
54 Duty of CandourNumber of times duty of candour used (for Moderate and
Serious Incidents only)N/A 27 (RCA)
4 (SI), 10
(RCA)
3 (SI), 17
(RCA)
1 (SI), 46
(RCA)
1 (SI), 13
(RCA)
3 (SI), 24
(RCA)
4 (SI) 12
(RCA)
3 (SI), 4
(RCA)
6 (SI), 2
(RCA)
55 Never Events Number of Never Events 0 0 1 1 0 1 0 0 0 0
56 Serious Incidents Number of serious incidents N/A 0 4 3 2 1 3 4 3 6
57 Number of patient safety incidents by harms;
58 No Harm 439 468 447 385 374 398 371 292 306
59 Minor Harm 154 171 177 202 146 164 230 198 144
60 Moderate or Severe Harm 6 14 9 18 17 10 11 15 16
61Early Warning
ScorePercentage of observations and scores completed 100% 99% 99% 99% 99% 99% 99% 99% 99% 99%
62 Percentage staff trained in Level 1 Safeguarding Children 90% 86% 86.5% 86.3% 86.6% 86.2% 85.1% 84.4% 84.2% 84.7%
63 Percentage staff trained in Level 2 Safeguarding Children 90% 84% 84.8% 84.9% 84.9% 83.5% 82.8% 81.0% 81.2% 81.0%
64 Percentage staff trained in Level 3 Safeguarding Children 90% 81% 81.3% 82.9% 52.6% 61.4% 58.8% 37.4% 49.2% 43.0%
65 Percentage staff trained in Safeguarding Adults 90% 86% 86.1% 86.2% 86.2% 87.2% 87.1% 86.3% 86.3% 87.4%
66Percentage staff trained in relation to Mental Capacity Act
and DOLs90%
Reviewing
competenc
y
requiremen
ts on TNA
Reviewing
competenc
y
requiremen
ts on TNA
Reviewing
competenc
y
requiremen
ts on TNA
Reviewing
competenc
y
requiremen
ts on TNA
Reviewing
competenc
y
requiremen
ts on TNA
Reviewing
competenc
y
requiremen
ts on TNA
Reviewing
competenc
y
requiremen
ts on TNA
Reviewing
competenc
y
requiremen
ts on TNA
Reviewing
competenc
y
requiremen
ts on TNA
67 COPDPercentage of eligible patients discharged with a completed
COPD bundle85% 74.5% 81.5% 82.1% 80.2% 83.0% 85.0%
Not Yet
available
Not Yet
available
Not Yet
available
68 Number of complaints received N/A 55 34 31 33 27 34 32 26 32
69Percentage of complaints acknowledged within 3
operational days95% 90% 95% 89% 94% 85% 94% 100% 100% 100%
70Percentage of complaints responded to within agreed
timescales95% 61% 53% 43% 30% 54% 67% 36% 38% 59%
71 Date when last complaints summary published on website N/A
Thresh-old April May June July Aug Sep Oct Nov Dec Jan Feb MarRAG
Rating
1a Implementation of staff friends and family test
1bEarly implementation of FFT in all outpatient and day case
departments by 31 October 2014
1.2 FFT increased response rates: ED Q1 -15%
Q4 - 20%11% 11% 10% 9% 15% 14% 8% 15% 10%
FFT Increased response rates; inpatientsQ1 - 25%
Q4 -30% 47% 42% 40% 40% 48% 47% 43% 46% 39%
1.3 FFT decreasing negative responses <1.5% 2.2% 1.7% 2.5% 2.6% 3.0% 2.0% 2.3% 1.5% 1.2%
2.1a Reduction in prevalence of pressure ulcers
2.1b Number of patients recorded with a new pressure ulcer as 11 8 4 5 9 11 11 14 10
Safety
Thermometer
Friends and Family
Q1 - Submitted Q2 - Submitted
VTE
Medicines
Incidents
Safeguarding
Complaints
CQUIN

Number of patients recorded with an old (community
acquired) pressure ulcer as measured using Safety
Thermometer
31 31 31 36 31 22 30 48 30
2.1cIncident report sent to commissioners for all inherited
pressure ulcersYes Yes Yes Yes Yes Yes Yes Yes Yes
3.1a Find 90% 86.8% 84.3% 89.6% 88.0% 80.2% 79.7% 70.4% 79.9%Not yet
Available
3.1b Assess 90% 44.6% 47.1% 56.1% 57.3% 48.8% 41.7% 44.1% 20.5%Not yet
Available
3.1c Refer 90% 66.7% 66.7% 76.5% 94.7% 71.4% 64.3% 54.5% 33.3%Not yet
Available
3.2 Clinical Leader and Training
3.3 Carers Survey
5.1 Early Assessment
5.2 Impact of Early Assessment
6.1Admission
AvoidanceEarly assessment by consultant 100% Q4
7.1 Reduction of late discharges
7.2 Weekend Discharges
7.3 Completed discharge summaries
8.1 Delayed TransferNumbers of delayed discharges or transfers of care each
month15 16 8 20 28 30 26 24 21
8.1 Delayed TransferNumbers of delayed discharges or transfers of care each
month15 16 8 20 28 30 26 24
Safety
Thermometer
Dementia
Update provided in quarterly report Update provided in quarterly report
Admission
Discharges
Update provided in quarterly report Update provided in quarterly report

2013/14Target
2014/15Apr-14 May-14 Jun-14 Jul-14 Aug-14 Sep-14 Oct-14 Nov-14 Dec-14 Jan-15 Feb-15 Mar-15
No. adverse incidents reported on STEIS 6 9 6 9 11 11 7 9 6
% compliance with STEIS data entry requirements - reporting 100% 100% 100% 100% 100% 100% 100% 100% 100%
% compliance with STEIS data entry requirements - closing 100% 37.5% 41% 58% 50% 69% 67% 100% 50%
No. of never events 1 0 0 0 0 0 0 0 0 0 0
Child Safeguarding Level 1 – No. & % staff trained Q4 99% 99.5% 99.5% 99.5%
Child Safeguarding Level 2 - No. & % staff trained Q4 91% 90% 90% 89%
Child Safeguarding Level 3 - No. & % staff trained Q4 97% 95% 95% 97%
Adult Safeguarding - No. & % staff trained Q4 91% 92% 92% 92%
MCA/DOLS - No. & % staff trained Q4 89% 90% 90% 90%
Learning Disability Awareness - No. & % staff trained 90% 90% 90%
Number of patients with hospital accuired thrombosis 2
% patients who may be at risk of crisis offered a crisis plan 95%
Percentage of patients screened for MRSA (elective) 93% 100% 100% 100% 100% 95% 100% 100% 100%
Percentage of patients screened for MRSA (non elective) 71% 74% 60% 82% 50% 70% 68% 82% 83%
Number of patients with MRSA Bacteraemia 0 0 0 0 0 0 0 0 0 0
Number of cases of C Diff 7 1 2 2 1 1 0 0 0 0
Number of C Diff outbreaks (2 or more cases in same area within 28 days) 0 0 0 0 0 0 0 0 0 0
Number of patients whose death certificates include C-diff in part 1(a) 0 0 0 0 1 0 0 0 0 0
Number of patients with Norovirus symptoms 0 0 0 0 0 0 4 0 0
Number of bays and ward closures 0 0 0 0 0 0 1 0 0
Number of bed days lost 0 0 0 0 0 0 0 0 0
Number and % of identified infected patients (inc C Diff and Norovirus) isolated within 2hrs
of symptoms onset of diarrhoea0 0 0 0 0 N/A 4 100% N/A N/A
% of service users who have been in hospital/long-term health care for >1yr who have had
an annual physical health checkAv. 98% 100% 100% 75% 100% 100% 100% 100% 100% 100% 100%
% of patients having a falls risk assessments carried out within 48 hrs of admission (Comm
hosps and OPMH inpts)Av. 93% 95% 95% 97% 94% 97% 87% 90% 96% 97% 97%
% of patients having a nutritional screening assessment within 24 hrs of admission (Comm
hosps and OPMH inpts)Av. 94% 95% 94% 91% 92% 90% 90% 91% 96% 94% 94%
% of pts whose pressure ulcer risk assessment was commenced within 4hrs of admission
(Comm hosps and OPMH inpts)Av. 86% 95% 97% 96% 96% 95% 95% 96% 97% 98% 99%
% of patients whose VTE risk assessment was completed in 24 hrs Av. 98% 95% 98% 97% 97% 96% 95% 96% 99% 98% 98%
Number and % of patients commenced on appropriate prophylaxis 95% 77 (100%) 63 (100%) 49 (100%) 20 (100%) 12 (100%) 0 N/A 2 100% 3 100% 1 100%
% patient admitted for >48hrs to hospital with COPD have a COPD bundle on discharge 100% 100%
% of patients with a learning disability admitted as an emergency to hospital who have had
an enhanced assessment
95% 100% 100% 100% 100% 0 admissions 100% 100% 100%100%
% new cases of psychosis served by the Early Intervention Service 100% 100% 100% 100% 95% 79% 88% 96% 100% 94% 100%
5
61.2%
50%
0 1
68.9% 65.4%
100% 100%
QUALITY AND PERFORMANCE INTEGRATED SCORECARD Dorset Healthcare University NHS Foundation Trust
Safe?
Infection Control
Effective?
Responsive?

% main carers offered an assessment within 4 weeks 100%
Number of times duty of candour used 6 5 5 7 11 3 2 0 0
% patients with a long-term condition who have a personalised up to date care plan Q4 100%95%
Number and % written complaints acknowledged in 3 days 90%
Number and % written complaints responded to in agreed timeframes 39%
Number complaints referred to the ombudsman 4
Friends and Family Test response rate
NHS Safety Thermometer – no. of pts with a new cat. 2-4 pressure ulcer (hospital
acquired)* 0% 0.6% 0% 0% 0% 0.3% 0% 0% 0%
% patients >75 y.o. admitted asked dementia case finding question
% adult patients having a VTE risk assessment on admission
0 3
100.00%
90% (see CHS performance report
for narrative)
106 (96%)
49 (62%)
2
CQUINS
Caring?
98.5% 98.3%
93% 93%
113 (99%) 112 (98%)37 (32%) 30 (43%)

Ind No. Area of Practice Quality Requirement April May June July Aug Sep Oct Nov Dec JanRAG
Rating
1Percentage of women see a midwife by 12 weeks and 6 days of
pregnancy
2 Percentage of women breastfeeding at 48 hours
3 Reduction in percentage of women smoking at delivery
4Percentage of service users admitted or discharged within 4 hours of
their arrival at an A&E95.1% 94.4% 97.3% 97.8% 97.2% 94.5% 97.2% 97.9% 94.0% 92.3%
5 12 hour trolley waits 0 0 0 0 0 0 0 0 0 0
6All handovers between ambulance and A&E taking place in 30-60
minutes30 41 16 15 5 41 4 9 47 80
7All handovers between ambulance and A&E taking place in over 60
minutes10 17 4 5 5 14 3 1 10 34
8Percentage of patients admitted directly to specialist stroke unit within
4 hours of arrival at hospital71.0% 78.6% 50.0% 81.0% 93.8% 76.0% 80.0% 78.6% 73.9% 68.2%
9 Percentage of patients assessed for thrombolysis
10 Percentage of patients receiving thrombolysis if clinically indicated
11Percentage of patients assessed and managed by stroke nursing staff
within 24 hours of admission
12Percentage of patients assessed by all members of the specialist rehab
team within 72 hours of admission
13 Percentage of patients with documented MDT goals
14 ChildrenPercentage of children and young people who have had bacterial
meningococcal septicaemia who have a follow up appoint with
consultant paediatrician within 6 weeks of discharge
15Summary hospital level mortality indicator (banding) 6 months in
arears (published quarterly)2 2 tbc
16Summary hospital level mortality indicator 6 months in arears
(published quarterly)1.122 1.112 tbc
17 Percentage staff trained in LD
18Number of patients who have an enhanced assessment of care needs
upon emergency admission to hospital (CPI flag)
19 Fractured NOFFracture Neck of Femur - % of # NoF patients operated on <36 hour
of admission96.6% 100.0% 100.0% 95.8% 90.0% 100.0% 85.7% 88.9% 87.8% 92.0%
22 Percentage of people supported to die in their preferred place
23Number of quality statements maintained at amber or green against
ELCQU measures
24Number of cancellations of surgery on day of admission for non
clinical reasons9 17 10 24 12 10 16 10 23 26
25Number of cancelled surgery on day of admission who are NOT
offered another binding date within 28 days0 0 0 0 0 1 0 0 1 2
Who Checklist 99.29% 99.61% 99.52% 99.05% 99.10% 98.62% 99.68% 99.60% 99.39% 98.03%
26 Outpatients Sufficient slots choose and book 20.3% 18.0% 17.7% 19.2% 16.5% 14.7% 20.1% 20.30% 15.80% 18.10%
27Percentage of falls assessments completed within 24 hours of
admission
28 Number of falls resulting in # or severe harm
29 NutritionPercentage of adult admissions screened within 24 hours of admission
to hospital - quartely
30Percentage of admissions that have a risk assessment completed
within 6 hours of admission
31 Number of avoidable New Pressure Ulcers Grade 3/4
32 Number of all Hospital acquired pressure ulcers 9 20 10 12 14 7 8 7 8 tbc
33 Staffing Levels Publicly displayed
34 Staff turnover 9.57% 9.50% 9.50% 9.62% 9.86% 10.00% 9.90% 9.71% 9.59% tbc
35 Staff appraisal rate 86.0% 86.0% 82.0% 86.0% 89.0% 89.0% 87.0% 88.0% 88.0% tbc
36 Mandatory training rate 78.0% 79.0% 78.0% 78.0% 78.0% 76.0% 80.0% 81.0% 81.0% 82.0%
End of Life
Surgery
Falls
Pressure ulcers
Staffing
Scorecard 2014/15 Dorset County Hospital NHS Foundation Trust
Maternity
Emergency Department
Stroke
Mortality
Learning Disability

37 Sickness rate 3.49% 2.91% 3.02% 3.02% 3.36% 3.52% #REF! 3.86% #REF! tbc
40Mixed Sex
accommodation Breachnumber of mixed sex accommodation breaches 0 0 0 0 0 0 0 0 0 0
41 MRSA Bacteraemia 0 0 0 0 0 0 0 0 0 0
42 Clostridium Difficile 0 0 2 1 1 1 0 0 2 0
43 Norovirus number of outbreaks
44 Percentage of patients screened for MRSA - elective 94.3% 97.3% 97.0% 97.2% 97.8% 97.1% 93.3% 92.8% 93.3% 63.0%
Percentage of patients screened for MRSA - non-elective 96.6% 97.3% 100.0% 97.5% 100.0% 97.9% 89.9% 97.7% 96.3% 96.3%
45 MSSA 0 0 1 0 0 4 0 0 1 2
46 E-Coli 1 1 0 0 0 0 3 1 1 1
48 Percentage of risk assessments completed upon admission
49 Percentage of patients who receive appropriate prophylaxis
50 Number of Hospital acquired thrombus with a completed RCA
51 Medicines Publication of a formulary Yes Yes Yes Yes Yes Yes Yes Yes Yes Yes
54 Duty of Candour Number of times duty of candour used tbc tbc tbc tbc tbc tbc tbc tbc tbc tbc
55 Never Events Number of Never Events 0 0 0 0 0 0 0 0 0 0
56 Serious Incidents Number of serious incidents 4 6 7 2 2 2 4 4 2 4
57 Number of incidents by harm total
Death
58 Severe
Moderate
Low
59 none
60 Early Warning Score Percentage of observations and scores completed 98% 98% 98% 98% 98% 98% 98% 98% 98% 98%
61 Percentage staff trained in Level 1 Safeguarding Children
62 Percentage staff trained in Level 2 Safeguarding Children
63 Percentage staff trained in Level 3 Safeguarding Children
64 Percentage staff trained in Safeguarding Adults
65 Percentage staff trained in relation to Mental Capacity Act and DOLs
66 COPDPercentage of eligible patients discharged with a completed COPD
bundle
67 Number of complaints received 80 67 71 80 72 63 62 83 48 63
68 Percentage of complaints acknowledged within 3 operational days
Percentage of complaints responded to within agreed timescales *
developmental
Number of complaints referred to Ombudsmen
Number of complaints upheld by Ombudsmen
69 Number of complaints re-opened.
70 Date when last complaints summary published on website
CQUIN April May June July Aug Sep Oct Nov Dec JanRAG
Rating
a) Implementation of Staff FFT compliant compliant compliant compliant compliant compliant n/a n/a n/a compliant
b) Early Implementation of FFT - Outpatients - - - -
b) Early Implementation of FFT - Daycase - - - -
Increased response rate - Inpatients minimum 25% by Q1 and
30% by Q444.4% 39.2% 42.2% 39.4% 38.9% 33.4% 36.0% 37.4% 38.1% 40.0%
Increased response rate - ED minimum of 15% by Q1 and
20% by Q422.4% 20.0% 20.0% 20.9% 21.4% 19.4% 20.6% 22.8% 22.5% 20.9%
Friends and Family Test:Increased response rate - Inpatients 40% for the month of
March 2015
Friends and Family Test:
VTE
Incidents
Safeguarding
Complaints
Friends and Family Test:
Staffing
Infection Control

Friends and Family Test:
Increased response rate - Negative responses to FFT in ED
and inpatients must not exceed 1.5% in aggregate in each
month of Q4
NHS Safety Thermometer -
Improvement
Reduction in the prevalence of pressure ulcers category 2-4
new only. (Mean for last 6 months of 13-14 = 1.14%, 50% of this
= 0.57%)
#REF! #REF! #REF! #REF! #REF! #REF! #REF! #REF! #REF! #REF!
Dementia Screening - 90% of applicable patients with a known
diagnosis of dementia or clinical diagnosis of delirium or who
have been asked the dementia case finding question
47.0% 38.0% 42.3% 32.5% 33.8% 31.4% 31.8% 20.6% 26.2% 28.0%
Dementia Risk Assessment - 90% of applicable patients who
have had a diagnostic assessment including investigations100% 100% 100% 100% 100% 100% 100% 100% 100% 100%
Dementia Specialist Referral - 90% of applicable patients
referred for further diagnostic advice in line with local pathways
agreed with commissioners
100% 100% 100% 100% 100% 100% 100% 100% 100% 100%
Dementia - Clinical
Leadership
Named Lead Clinician for Dementia and appropriate training for
staff (planned training plan to be provided and undertaken)Compliant Compliant Compliant Compliant Compliant Compliant Compliant Compliant Compliant Compliant
Dementia - Supporting
Carers of people with
dementia
Undertake monthly audit of carers of people with dementia to
test whether they feel supported and report results to the Board.
Provider and Commissioner to agree content of audit.
Compliant Compliant Compliant Compliant Compliant Compliant Compliant Compliant Compliant Compliant
Emergency Admission -
Early Assessment
Initial Consultant Assessment within 14 hours, all ages, 7 days
per week. Q1 agree system, Q2 baseline audit and set
trajectories to achieve for Q4. Stretch target 100%
89%
Emergency Admission -
Impact of Early
Assessment
Assessment of impact of Consultant Assessment within 14
hours, all ages, 7 days per week. Identify Clinical Lead, agree
data set, submit report
Emergency Admission
Avoidance
Reduce admissions associated with the 19 ambulatory care
conditions. Q1 agree baseline and set trajectories, Q2 agree
action plan to achieve. Monitor against trajectories for Q3, Q4.
326 342 336 340 328 300 320 307 401 tbc
Transfer and Discharge -
reduction in late
discharges/transfers
Reduction in % of patients aged 70+ discharged or transferred
between 21:00 and 07:59 the following day.1.7% 1.7% 2.0% 2.1% 1.7% 2.4% 1.7% 0.9% 2.0% 2.2%
Transfer and Discharge -
weekend dischargesIncrease % of patients discharged at weekends. 10.6% 13.2% 12.5% 11.1% 15.0% 11.3% 10.2% 16.4% 10.8% 12.8%
Transfer and Discharge -
discharge summaries
Increase % of discharge summaries issued within 24 hours -
outturn 13/14 - 65.5%65.7% 63.6% 66.4% 68.6% 65.5% 68.7% 69.5% 69.5% 69.8% 69.4%
Transfer and Discharge -
delayed transfers of care
Dorset County Council area: reduce average from 50.1 people to
24 by April 2015. (Clarity requested from CCG. In the meantime
delayed transfer % being reported - threshold of 3.5% as per
contract.)
3.69% 2.30% 2.71% 3.57% 2.50% 3.34% 4.8% 5.9% 7.2% 5.6%
Dementia & Delirium -
Find, Assess, Investigate
and Refer: % of patients
aged >75 admitted as an
emergency with length of
stay >72 hours