Embed Size (px)
Citation preview

Score Comparability of Online and Paper Administrations of the
Texas Assessment of Knowledge and Skills
Walter D. Way
Laurie Laughlin Davis
Steven Fitzpatrick
Pearson Educational Measurement
Paper presented at the annual meeting of the National Council on Measurement in Education, San Francisco, CA, April, 2006

1
Score Comparability of Online and Paper Administrations of the
Texas Assessment of Knowledge and Skills
Introduction
A rapidly increasing number of state education departments are exploring or
implementing online assessments as part of their statewide assessment programs. The potential
advantages of online testing in K-12 settings are obvious. These include quicker turnaround of
results, cost savings related to printing and shipping paper test materials, improved test security,
more flexible and less burdensome test administrations, and a technological basis for introducing
innovative item formats and test delivery algorithms. In addition, recent surveys indicate that
students testing online enjoy their experiences, feel comfortable with taking tests by computer,
and tend to prefer it to traditional paper testing (Glassnapp, Poggio, Poggio, & Yang, 2005;
O’Malley et al., 2005; Ito & Sykes, 2004).
In states where online testing has been introduced as part of their high-stakes
assessments, not all schools have had the infrastructure and equipment to test online. For this
reason, paper and online versions of the same tests are typically offered side-by-side. Any time
both paper-based and online assessments co-exist, professional testing standards indicate the
need to ensure comparable results across paper and online mediums. The Guidelines for
Computer-Based Tests and Interpretations (APA, 1986) states: “...when interpreting scores from
the computerized versions of conventional tests, the equivalence of scores from computerized
versions should be established and documented before using norms or cut scores obtained from
conventional tests.” (p. 18). The joint Standards for Educational and Psychological Testing also
recommends empirical validation of score interpretations across computer-based and paper-
based tests (AERA, APA, NCME, 1999, Standard 4.10).
The comparability of test scores based on online versus paper testing has been studied for
more than 20 years. Reviews of the comparability literature research were reported by Mazzeo
and Harvey (1988), who reported mixed results, and Drasgow (1993), who concluded that there
were essentially no differences in examinee scores by mode-of-administration for power tests.
Paek (2005) provided a summary of more recent comparability research and concluded that, in
general, computer and paper versions of traditional multiple-choice tests are comparable across
grades and academic subjects. However, when tests are timed, differential speededness can lead

2
to mode effects. For example, a recent study by Ito and Sykes (2004) reported significantly
lower performance on timed web-based norm-referenced tests at grades 4-12 compared with
paper versions. These differences seemed to occur because students needed more time on the
web-based test than they did on the paper test. Pommerich (2004) reported evidence of mode
differences due to differential speededness in tests given at grades 11 and 12, but in her study
online performance on questions near the end of several tests was higher than paper performance
on these same items. She hypothesized that students who are rushed for time might actually
benefit from testing online because the computer makes it easier to respond and move quickly
from item to item.
A number of studies have suggested that no mode differences can be expected when
individual test items can be presented within a single screen (Poggio, Glassnapp, Yang, &
Poggio, 2005; Hetter, Segall & Bloxom, 1997; Bergstrom, 1992; Spray, Ackerman, Reckase, &
Carlson, 1989). However, when items are associated with text that requires scrolling, such as is
typically the case with reading tests, studies have indicated lower performance for students
testing online (O’Malley, 2005; Pommerich, 2004; Bridgeman, Lennon, & Jackenthal, 2003;
Choi & Tinkler, 2002; Bergstrom, 1992).
In general, the results of comparability research are difficult to evaluate for several
reasons. First, there has been a continual evolution in both computer technology and the
computer skills of test-takers. Thus, earlier studies have limited generalizability, and more
recent studies may not generalize well to future settings. Second, most comparability research is
carried out in the context of operational testing programs, where less-than-desirable experimental
control is usually the norm. In such studies, conclusions are often tempered because of design
limitations such as lack of random assignment, insufficient statistical power, order-of-
administration effects, and effects due to differences in test forms given across modes. Finally,
the content areas, test designs, test administration systems, and testing populations can differ
considerably across comparability studies, and differences in any of these factors could lead to
different findings from one study to another.
For a policy maker interested in introducing online assessments for a high-stakes K-12
testing program, the need to assess comparability creates a number of challenges. While some
stakeholders will lobby for immediate and widespread introduction of online testing, researchers

3
and psychometricians will advise more cautious and controlled experimental studies. Such
studies can be expensive and usually require efforts beyond those needed to meet the usual
challenges associated with the ongoing paper-based program. Furthermore, no matter how well
a comparability study is designed, executing the design depends on the volunteer participation of
individual schools and districts. As such, one can expect that schools will vary in their ability to
execute the procedures called for in the experimental design, and that a nontrivial number of
schools signed up for the study will invariably drop out.
Poggio et al. (2005) and Poggio, Glasnapp, Yang, Beauchamp, and Dunham, (2005)
reported on an approach to comparability research in the live context of Kansas’ assessment
program that balanced an aggressive approach to online implementation with the need to collect
comparability data. In their studies, all schools were invited to administer the Kansas
Computerized Assessment (KCA), and online volunteers were further asked if they would be
willing to “double” test their students by administering a paper form of the test in addition to the
online assessment. Studies were carried out for grade 7 mathematics in spring 2003 and for
mathematics (grades 4, 7, and 10) and reading (grades 5, 8, and 11) in 2004. The studies reported
no evidence of mode effects for any of the tests evaluated. However, some of the findings may
have been confounded by order-of-administration effects and limited samples of students for
whom testing order could be reliably identified. If a mode effect for reading did exist, it is not
clear whether the design carried out could have identified it, and if so, whether a sufficient
statistical adjustment could have been applied. Because only a subset of students taking the
KCA also took the paper test, it would not have been possible to assign each online student the
higher of two scores.
In this paper, we present results from two online comparability studies that were
conducted for the Texas statewide assessment program in spring 2005. The purpose of the
studies were to evaluate the comparability of online and paper versions of the Texas Assessment
of Knowledge and Skills (TAKS) in mathematics, reading/English language arts, science and
social studies at grades 8 and 11 for the purposes of test score reporting, and to appropriately
adjust equated score conversion tables for students testing online as warranted. In the sections
that follow, we will describe the TAKS program and initial efforts to transition the program to
online testing, introduce the design and methodology used for the comparability studies at each
grade level, and present results of the score comparability studies conducted at grades 8 and 11.

4
In particular, we will introduce an approach and design to studying the comparability of online
and paper tests that we refer to as “matched samples comparability analyses” (MSCA). We
believe this approach is particularly well-suited to monitoring comparability as states transition
their high-stakes testing programs to online testing. In the last section of this paper, we will
report on some additional analyses that evaluate the sensitivity of the MSCA approach for
detecting differences in online and paper group performance when these groups differ in terms of
overall proficiency.
The TAKS Program and Online Testing
TAKS is the primary state-mandated assessment in Texas, and represents the latest and
most comprehensive testing implementation of statewide assessments in Texas that have been
ongoing for more than 20 years. First administered in spring 2003, TAKS is given to students in
mathematics at grades 3–10 and at the exit level (grade 11); in reading at grades 3–9; in writing
at grades 4 and 7; in English language arts (ELA) at Grade 10 and at the exit level; in science at
grades 5, 8, and 10 and at the exit level; and in social studies at grades 8 and 10 and at the exit
level. Spanish versions of TAKS are available at grades 3–6. Every TAKS test is directly aligned
to the Texas Essential Knowledge and Skills (TEKS) curriculum. On each TAKS test, the critical
knowledge and skills are measured by a series of test objectives. These objectives are not found
verbatim in the TEKS curriculum. Rather, the objectives are umbrella statements that serve as
headings under which student expectations from the TEKS can be meaningfully grouped. TAKS
test results are used to comply with the requirements of the No Child Left Behind (NCLB) act, as
well as for statewide accountability purposes. The exit level TAKS is part of high school
graduation requirements in Texas and is offered multiple times to students who do not pass. Test
results are reported to teachers and parents, and are used for instructional decisions as
appropriate. The TAKS tests are scaled separately at each grade, with a score of 2100
representing “met standard” and 2400 representing “commended performance” at each grade
level. In practice, the highest equated scale score below these thresholds is set to these threshold
values. Additional information on the TAKS can be found on the Texas Education Agency
(TEA) web site at http://www.tea.state.tx.us/student.assessment/taks/booklets/index.html.
The TEA first began testing by computer in fall 2002, when an end-of-course
examination in Algebra I was made available online and districts were given the option of using

5
this test either in online or paper format. In spring 2004, an online testing pilot was carried out
in three grade 8 TAKS subject areas, reading, mathematics, and social studies. The goals of the
pilot were to determine the administrative procedures necessary to deliver online assessments in
the schools, to assess the readiness of Texas school districts to administer online assessments, to
document administrative challenges, and to the extent possible, to compare performance on
online assessments with paper test performance. The pilot tests were administered in
volunteering campuses during a two-week window prior to the operational grade 8 TAKS
administration. Although data related to online performance were collected, the design of the
pilot did not permit conclusive comparisons of online and paper performance.
In spring 2005, the TEA carried out additional studies of online testing at grades 8 and 11
to compare online and paper test performance in reading, mathematics, social studies, and
science. Score comparability for science was assessed only at grade 11, although a science field-
test at grade 8 included an online component. The grade 8 and 11 studies involved different data
collection designs. At grade 8, schools that volunteered to participate were randomly assigned to
administer one of the three TAKS content areas online. The same test form was administered
both in paper and online. Each student tested only one time in a given content area; thus, the
results for students testing online were to be reported as part of the statewide assessment results.
At grade 11 (exit level) TAKS, a special re-test administration was offered in June. Students in
the participating schools who had not yet passed exit-level TAKS in at least one of the four
subject areas were offered an extra testing opportunity as part of this administration. In addition,
a small number of students that would be entering grade 11 in the fall were allowed to participate
in the administration (these students will be referred to as “rising juniors”). For each exit-level
TAKS subject area, volunteering students in these schools were randomly assigned to take either
an online or a paper version of the same test form.
Research Methodology
The comparability study design required conducting analyses that would support score
adjustments for those students testing online, if such adjustments were warranted. To
accomplish this, we utilized an approach that considered score comparability in the context of
test equating. Specifically, we equated the online version of the tests to the paper version of the

6
tests under the assumptions of a random groups design. The details of how the equatings were
accomplished differed for grade 8 and grade 11, as described below.
Matched Samples Comparability Analyses for Grade 8
For grade 8, we initially thought that the comparability data could be analyzed based on
random assignments to condition at the school level, as it was expected that approximately 40
schools would administer each of the three content areas online. However, voluntary
participation for the comparability study was much lower than expected, and the numbers of
schools testing in each subject area was too small to support analyses based on random
assignment at the school level. As a result, we compared test performance for students testing
online with comparison groups from the paper results that were matched to the online students in
terms of spring 2004 test performance. We refer to this approach as matched samples
comparability analyses (MSCA). In this approach, student scale scores for reading and
mathematics obtained in grade 7 were used as matching variables, and sub-samples of students
equal to the numbers of students testing online were selected from the paper TAKS tests. The
paper students were selected so that the grade 7 reading and mathematics scores in the online and
matched paper groups were identical.
In devising this approach, we first regressed 2004 grade 8 TAKS scale scores on 2003
grade 7 TAKS scale scores. We found the following multiple correlations across reading, math,
and social studies (note that there is no grade 7 social studies test):
Dependent Variable Independent Variable(s) r
G8ReadingSS G7ReadingSS 0.74 G8ReadingSS G7ReadingSS, G7MathSS 0.76
G8MathSS G7MathSS 0.82 G8MathSS G7ReadingSS, G7MathSS 0.83
G8SocSS G7ReadingSS, G7MathSS 0.72
The MSCA involved a bootstrap method that was designed to establish raw to scale score
conversions by equating the online form to the paper form, and also to estimate bootstrap
standard errors of the equating to assist in interpreting differences between the online and paper
score conversions (c.f., Kolen & Brennan, 2004, p. 232-235). The application of equating

7
methods was based on an assumption that the online and matched paper sample groups were
randomly equivalent. For each replication, we used IRT true score equating based on Rasch
calibrations of the online and paper samples using the WINSTEPS program (Linacre, 2001). The
MSCA involved sampling with replacement, in which both online and matched paper student
samples were drawn 500 times and analyses were repeated for each replicated sample. The
specific procedures used in the MSCA were as follows:
1. Each student testing online with grade 7 TAKS score in reading and mathematics was matched to a student from the available 2005 paper TAKS data with identical grade 7 reading and mathematics scale scores. Both reading and mathematics were used in the matching for all three grade 8 subject areas.
2. Online versus paper comparability analyses were performed using the matched groups of students by repeating the following steps 500 times:
a. A bootstrap sample of students (i.e., random sampling with replacement) was drawn from the online participants.
b. A matched stratified bootstrap sample (i.e., random sampling with replacement at each combination of mathematics and reading scores observed in the online sample drawn in step 2.a) was drawn from the available 2005 paper TAKS data.
c. A raw score-to-raw score equating was carried out with each of the bootstrap samples as follows:
i. WINSTEPS was used to calibrate the online group data, centering the calibrations so that the mean of the ability estimates was zero. The item difficulty estimates and raw score-to-theta conversions were retained.
ii. WINSTEPS was used to calibrate the paper comparison group data, centering the calibrations so that the mean of the ability estimates was zero. The item difficulty estimates and raw score-to-theta conversions were retained.
iii. IRT true score equating was used to find the raw score equivalents on the paper comparison group to each integer raw score for the online group by calculating ΣP(θ), where the summation is over the paper item difficulty estimates and θ is from the conversions for the integer raw score found in step 2.c.i.
iv. Using linear interpolation and the unrounded operational raw score-to-scale score conversions, the paper raw score equivalents found in step 3 were converted to scale score equivalents.
d. The raw score equivalents were transformed to scale scores using the operational 2005 score conversion tables and linear interpolation.
3. Online scale score conversions for each raw score were based on the average of the conversions calculated over each of the 500 replications. These average scale score values comprised the alternate online raw score to scale conversion table.
4. The standard deviation of online scaled score conversions at each raw score represented the conditional bootstrap standard errors of the linking.
To assist in comparing the online and paper score conversions, we considered the
following criterion suggested by Dorans and Lawrence (1990): “To assess equivalence, it is

8
convenient to compute the difference between the equating function and the identity
transformation, and to divide this difference by the standard error of equating. If the resultant
ratio falls within a bandwidth of plus or minus two, then the equating function is deemed to be
within sampling error of the identity function” (p. 247). It should be pointed out that the Dorans
and Lawrence criterion is only one of many justifiable approaches that could be used to interpret
the results. We also paid special attention to differences in the range of scaled scores around the
“met standard” score levels. Differences at extremes of the scale were considered less important,
given the purpose and primary uses of the TAKS tests.
Grade 11 Comparability Analyses
For the grade 11 comparability analyses, the researchers involved in the study randomly
assigned the participating students from each school to the online or paper testing conditions.
Because testing occurred over a single day for each subject area and many of the participating
schools were limited in how many students they could test in a single day, slightly more students
were assigned to the paper condition than to the online condition.
To evaluate score comparability for the grade 11 study, we employed some of the same
procedures that we used in the MSCA analyses for grade 8. Specifically, we randomly selected
students from the online and paper samples with replacement 500 times and equated the scores
obtained in each sampling replication. These bootstrap analyses resulted in alternate online score
conversion tables for each test and bootstrap standard errors of equating to assist in interpreting
results. One difference between the grade 11 and the grade 8 analyses was the bootstrap
replications involved simple random sampling with replacement, that is, that there was no need
to select a sample from the paper group that was matched to the online sample in terms of
previous test scores. Another difference was that the bootstrap analyses for grade 11 ELA
incorporated polytomously-scored constructed response and extended essay item types.
Results
Matched Samples Comparability Analyses for Grade 8
Table 1 presents the means and standard deviations of the grade 8 raw scores and grade 7
scale scores for each test evaluated using the MSCA. It can be seen in Table 1 that the mean raw
scores on the grade 8 tests for the online and paper groups are similar (within 0.16) for all three

9
tests. The grade 7 reading and mathematics scale scores used with the MSCA were very similar
for the mathematics and social studies online and paper samples (within 7 points). However, for
reading the previous scale scores were noticeably higher for the online group compared with the
paper group (e.g., the mean reading scale score was about 18 points higher and the mean
mathematics scale score was about 12 points higher).
Insert Table 1 about here
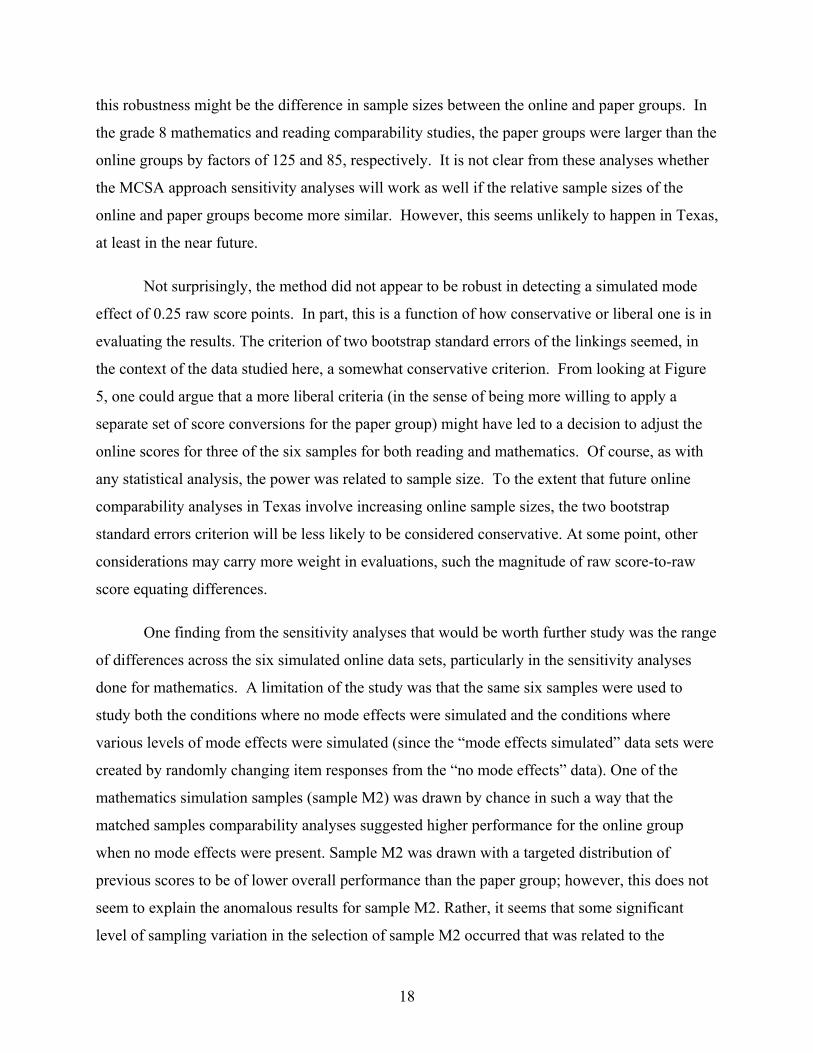
Tables 2 to 4 summarize the comparability analysis results for mathematics, reading, and
social studies. The columns of the tables are as follows:
RS – Paper test raw score CBT_RS – Equivalent raw scores on the online test based on the MSCA equating. Note that a higher equivalent raw score indicates that the online version of the test was more difficult. RS_SD – Standard deviation of the equivalent raw scores over the 500 replications. PAP_SS – Paper test scale score conversions, based on the 2005 TAKS equating results CBT_SS – Equivalent scale scores on the online test based on the MSCA equating. Again, higher equivalent scale scores indicate that the online version of the test was more difficult. SS_SD – Standard deviation of the equivalent scale scores over the 500 replications. RS_DIF – Difference between online raw score equivalent and paper raw score. SS_DIF – Difference between online scale score equivalent and paper scale score. SIG? – Scale score differences exceeding two bootstrap standard errors are noted by “**”.
Insert Tables 2 to 4 about here
In these tables, the equating conversions for the online and paper forms are assumed to be
the same for zero and perfect scores, since true score equating conversions cannot be estimated
with the Rasch model at these score points.
For mathematics (Table 2), the online versus paper differences were slight. In terms of
the raw score conversions, the differences were never as much as one-half of a point. In terms of
scaled score conversions, the differences were less than five points over most of the scale.
However, at the upper raw score points (41 and higher), scaled score differences exceeded two
standard errors of the linking.
For reading (Table 3), large differences occurred throughout the scale. Differences in
raw score conversions exceeded one and a half points over much of the score range. Differences

10
in scale score conversions were over 20 points over most of the score range. All of the
differences in scale score conversions exceeded two standard errors of the linking.
For social studies (Table 4) slight differences in both raw score and scale score
conversions occurred. The raw score differences were never as much as one-half of a point, and
the scale score differences were never as much as six points. None of the scale score differences
exceeded two standard errors of the linking.
Figure 1 presents differences between the online and paper scale score conversions
graphically as a function of raw score, along with upper and lower intervals defined by plus and
minus two bootstrap standard errors of equating. These graphs provide a relatively concise
summary of the patterns found in Tables 2 through 4.
Insert Figure 1 about here
Grade 11 Comparability Results
Table 5 presents univariate statistics for the online and paper groups participating in the
grade 11 comparability study. These data indicate higher raw scores for the paper group
compared to the online group for mathematics, science, and ELA. For social studies, the raw
score mean is slightly higher for the online group than for the paper group.
Insert Table 5 about here
Unlike the other exit level TAKS tests, which consist entirely of objectively scored items
(i.e., multiple-choice and a small number of grid-in response items for mathematics), ELA
contains both short-answer open-ended items and an extended essay item. Table 6 presents
univariate statistics for the online and paper groups on the ELA test broken down by the different
item types. The first entry in the table (ELA) is for the unweighted sum of the items and has a
possible maximum of 61 points (48 points for multiple-choice, 9 points for short-answer, and
four points for the essay). The second entry is weighted (ELA_WT), with the essay counting four
times its maximum point total. The maximum possible weighted score is 73. The scale score for
the ELA test is based on the weighted raw score. For the multiple-choice raw score, the essay

11
score, and two of the three open-ended scores, the mean for the paper group was slightly higher
than the mean for the online group.
Insert Table 6 about here
For many of the students participating in the grade 11 study, a previous TAKS score was
available. These scores are listed in Table 7 and include entries both for students for whom the
previously available TAKS score was from the grade 10 test (mostly the “rising juniors”) and
students for whom the previously available TAKS score was from the exit level test.
Insert Table 7 about here
Note that previous TAKS scores means were substantially higher for students for whom
the previous score was from the grade 10 test than it was for students for whom the previously
available scale score was from the exit level test.1 This was expected, given that the rising
juniors participating in the study were higher achieving students generally, as compared with
grade 11 students who had previously failed the exit level TAKS. For all four tests, the previous
TAKS score means were very similar (within three scale score points) for online and paper
students with a previous score from the grade 11 test. For mathematics, science, and social
studies, students testing online had higher previous TAKS score means from grade 10 than
students testing by paper. Although these scale score differences were comparatively large (16.2,
18.6, and 12.2, respectively), they seem less of a concern considering the small numbers of
students and the much larger scale score standard deviations for the students with a previous
TAKS scores from a grade 10 test. Considering all of the information from the analysis of
previous TAKS scores, we concluded that the assumption of randomly equivalent online and
paper groups was reasonable for the grade 11 TAKS comparability analyses.
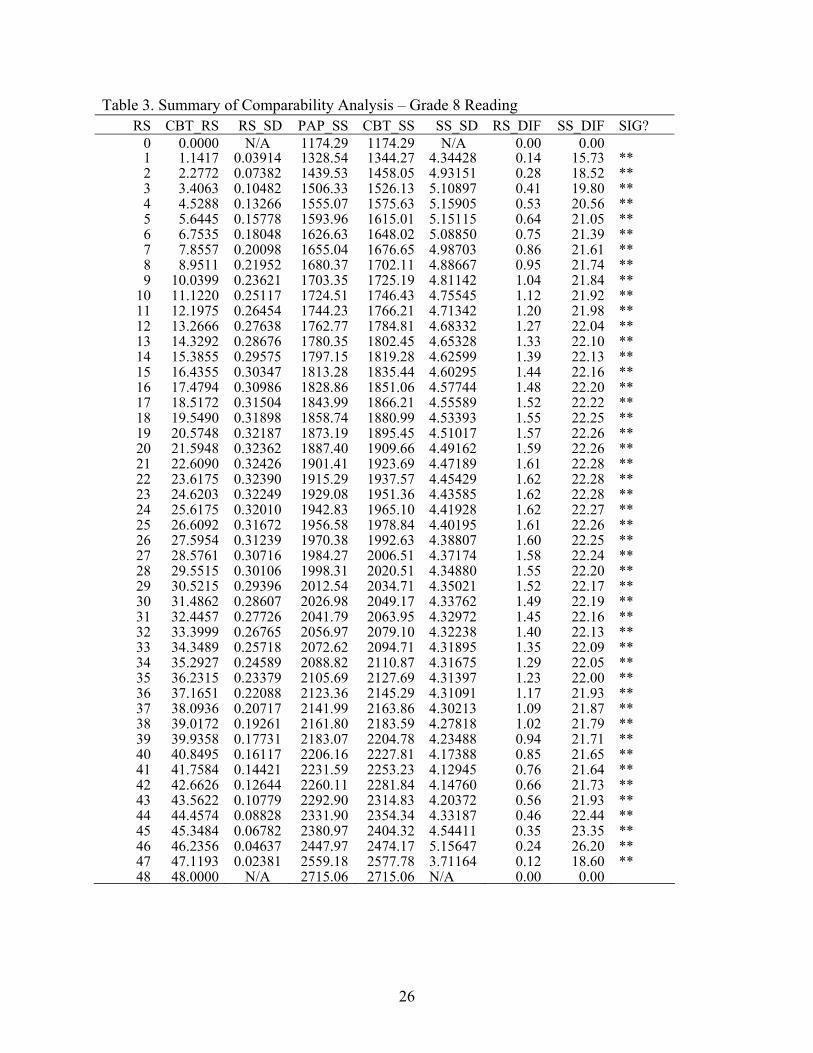
Figure 2 and 3 present graphs of the differences between the grade 11 online and paper
scale scores as a function of raw score, along with upper and lower intervals defined by ±2
1 Strictly speaking, the mean scale scores on the grade 10 and 11 tests are not directly comparable, since the scales are uniquely defined within each grade. However, since “met standard” and “commended performance” are defined at 2100 and 2400 for both grades, general comparative inferences seem reasonable.

12
bootstrap standard errors of equating. Figure 2 present results for mathematics and ELA and
Figure 3 presents results for science and social studies.
Insert Figures 2 and 3 about here
The results for grade 11 mathematics presented in Figure 2 are very similar to the results
for grade 8, except that both the online minus paper scale score differences and the intervals
defined by ±2 bootstrap standard errors are larger than they were for grade 8 mathematics. For
grade 11 mathematics, the online minus paper raw score differences were as high as 0.77 of a
raw score point, and these differences occurred in the region of the “met standard” cut score.
Thus, even though the scale score differences for grade 11 mathematics were within ±2 bootstrap
standard errors, there was evidence of a greater mode effect for grade 11 mathematics than there
was for grade 8 mathematics.
The results for grade 11 ELA presented in Figure 2 also indicated that the test was more
difficult for the online group than for the paper group, but as with grade 11 mathematics the scale
score differences were within ±2 bootstrap standard errors of equating over most of the score
range. The online minus paper differences were never as large as one weighted raw score point,
although the largest difference (0.95) occurred in the region of the “met standard” cut score. The
differences at extremely high score levels (i.e., above a weighted raw score of 65) reflect the fact
that ELA scale score conversions change by large amounts with changes in the weighted raw
scores in this region of the scale. For example, in the paper conversion table, a weighted raw
score of 70 corresponded to a scale score of 2802, and a weighted raw score of 71 corresponded
to a scale score of 2903. Thus, the online minus paper raw score difference of about -0.50 of a
point in this region of the scale converted to a scale score difference of about 50 points. In
addition, the Rasch true score equating was not accurate in this region of the scale because of the
limited numbers of high performing students participating in the study and the relative difficulty
of the open-ended constructed response items.2
2 In fact, to obtain Rasch scaling tables that extended to the entire range of possible scores, it was necessary to augment both the online and paper ELA samples with an “imputed” item response record that included maximum scores on the two open-ended items for which no student in either the online or paper samples obtained the maximum possible score (see Table 6).

13
The results for grade 11 science and social studies presented in Figure 3 indicate little or
no evidence of mode effects between the students testing online and the students testing by
paper. The results for science indicated the online version was slightly more difficult than the
paper version, but the raw score differences were never as high as one-half of a raw score point.
The scale score differences ranged between 3 and 7 score points over most of the scale, and these
differences never exceeded ±2 bootstrap standard errors. The social studies results indicated that
the online form was slightly easier than the paper version. Raw score differences were never
more than 0.40 of a raw score point and scale score differences were six points or lower over
most of the scale. The social studies differences never exceeded ±2 bootstrap standard errors,
although the bootstrap standard errors of equating for social studies were much larger than they
were for the other tests because there were only 355 online students and 388 paper students
taking the social studies test.
Summary of the Grade 8 and Grade 11 Comparability Study Results
To summarize the results of the grade 8 and grade 11 comparability studies, there was
evidence across grades and content areas that the online versions of the TAKS tests were more
difficult than the paper versions. In grade 8 reading, the mode differences were quite pronounced
and warranted the use of the alternate score conversion table for reporting online results. In grade
11 mathematics and ELA, the differences were less pronounced and the ELA results were also
complicated by the contributions of constructed response and extended essay items to the total
scores. Nevertheless, the alternate score conversions were used for reporting scores with these
tests, in part because of the magnitudes of raw score differences but also because of the high
stakes associated with these tests. For the social studies tests, there was little evidence of mode
effects across the two grades, since differences slightly favored the paper group at grade 8 and
slightly favored the online group at grade 11. The comparability results for grade 8 mathematics
and grade 11 science also favored the paper groups, although differences were slight and within
the ±2 bootstrap standard errors of equating for nearly all score points.
In general, the results of the comparability analyses for the TAKS tests at grades 8 and 11
were consistent with the existing literature on the comparability of online and paper assessments
in that the tests where the most significant mode differences were detected involved reading

14
passages that required scrolling. The mode differences in mathematics, although not large, were
less consistent with the comparability literature, which mostly supports thecomparability of
online and paper mathematics tests. Keng, McClarty and Davis (2006) further investigate the
mode differences found for these measures through item-level analyses.
Sensitivity of the MSCA Approach
Although the MSCA method appeared to work well in the context of the grade 8 TAKS
online tests, the conditions for the matched sample analyses were reasonably good in that the
ability levels of the paper and online groups (based on previous test scores) were reasonably
similar. In reviewing results of the analyses, technical advisors working with the state of Texas
recommended that the performance of the MCSA method should be studied further to see how
sensitive it is under conditions where the online group and the paper group are less similar in
overall ability. Such documentation is important given that the MCSA approach has been used
to determine and potentially apply alternate score conversions for students taking operational
TAKS tests online.
To address this recommendation, additional sensitivity analyses of the MCSA method
were carried out. The purpose of these analyses was to answer two specific questions:
1. How will the matched sample analyses perform when no “mode” differences exist but the online group and paper group differ in ability based on past test performance?
2. Will the matched sample analyses recover simulated mode differences when the online and paper groups differ in ability based on past test performance?
Sensitivity Analysis Procedures
The general approach for the sensitivity analyses was to select samples of students from
the paper data used in the spring 2005 grade 8 comparability study and to carry out matched
sample analyses as if these samples were students testing online. Analyses were conducted for
mathematics and reading. Four sets of analyses were undertaken. The first set utilized six
mathematics data sets and six readings data sets drawn from the overall paper data for each
measure. For each of the six data sets for a given test, a different target frequency distribution
was established for sampling students. The variables used to sample the data were the previous

15
spring’s scale scores (mathematics scale scores for mathematics, reading scale scores for
reading). The sample sizes were 1,275 for mathematics data sets and 1,850 for reading data sets,
roughly equivalent to the numbers of Spring 2005 grade online testers in these subjects. Tables 8
and 9 list the scale score frequencies and score means of the six selected sensitivity samples and
the overall paper group. For both mathematics and reading, performance increased from sample
1 to sample 6, and sample 4 was proportionally equivalent to the overall paper data.
Insert Tables 8 and 9 about here
The second, third, and fourth set of analyses simulated mode differences between the
online and paper groups. The data for these analyses were created by systematically modifying
the data sets from the first set of analyses to lower performance on the 2005 test. Three
conditions of lower performance (0.25, 0.5, and 1.0 raw score points, respectively) were
simulated for each data set from the first set of samples. To accomplish this, the responses to
randomly selected items were changed from correct to incorrect for approximately one-half of
the students. (Only one-half of the records were altered to ensure that some perfect and near-
perfect scores remained in the data). Because the process of changing responses from correct to
incorrect was random, it was built into the bootstrap replications. The SAS code to accomplish
this change is shown below:
compare=1/rawold*&mode.*2; rchange=ranuni(-1); if rchange>0.5 then do; do i=1 to &nitem.; if items{i}=1 then do; if compare>ranuni(-1) then items{i}=0; end; end; end;
The variable, rawold, is the student’s original raw score, and &mode is equal to 0.25, 0.5,
or 1.0, depending upon the condition. The SAS function ranuni generates a uniform random
variable between zero and one.
The total number of conditions in the sensitivity analyses was 48 (2 content areas × 6
samples × 4 sets of analyses). For each condition, we ran matched sample comparability
analyses involving 100 bootstrap replications according to the steps outlined above. To

16
summarize results within a condition, the differences in equating conversions between the paper
and simulated online forms were evaluated.
Results – No Mode Effects Simulated
Figure 4 presents the differences between the online score conversions resulting from the
100 bootstrap replications and the reported paper test scale score conversions. These differences
are graphed as a function of the paper form raw score. The bootstrap standard errors of the
linking for the online conversions are not shown in these graphs. For mathematics, the
differences ranged from about 3.5 to 4.5 scale score points across the six samples at most score
points. For reading, the differences ranged from about 4.5 to 5.5 across the six samples at most
score points. For both mathematics and reading, the bootstrap standard errors were higher at the
extreme score points, with a pattern similar to bootstrap standard errors from for the Spring 2005
mathematics and reading comparabilty analyses that are presented in Tables 2 and 3 and Figure1.
Insert Figure 4 about here
In general, the sensitivity analysis results suggested that the MSCA method is unlikely to
indicate either statistical significant or practically significant performance differences between
online and paper groups in situations where no true differences exist. Moreover, the differences
observed between the online and paper groups based on the matched samples analyses were not
related to the overall proficiency differences between the simulated online and paper samples.
Sample M2 from the mathematics simulation resulted in the largest differences between the
simulated online and paper groups. For this sample, the median raw score difference over 100
replications was about 0.35. However, this difference favored the online group over the paper
group. Since the online versus paper scale score differences were within two bootstrap standard
errors and there is currently no reason to hypothesize that the online group would be advantaged
by mode-of-administration effects for the TAKS program, these results would not have led to
any score adjustments for the online group.
Results – Mode Effects Simulated
Figures 5 to 7 present results of the sensitivity analyses when mode effects were
simulated. Figure 5 presents results based on a simulated mode effect of 0.25 raw score points,

17
Figure 6 presents results based on a simulated mode effect of 0.50 raw score points, and Figure 7
presents results based on a simulated mode effect of one raw score point.
Insert Figures 5 to 7 about here
The results in presented in Figure 5 suggest that the “significance” criterion of two
bootstrap standard errors was, for the most part, too conservative to identify a simulated mode
effect of 0.25 of a raw score point. For mathematics, the results varied over the six simulation
samples. For samples M1 and M4, scale score differences exceeded two bootstrap standard
errors over nearly all score points, suggesting a “significant” mode effect that would
disadvantage online students. For samples M3, M5, and M6, differences indicated that the
simulated online test was more difficult, but the differences were within 10 scale score points
and two bootstrap standard errors. For sample M2, no mode effects were indicated.
In the case of reading, the results over the six simulated samples were more consistent. In
all cases, the simulated online test was more difficult. However, scale score differences were
less than 10 points across virtually all score points for all simulated reading data sets, which was
within the “significance” criterion of two bootstrap standard errors.
The results presented in Figure 6 indicated that the matched samples comparability
analyses consistently detected simulated mode effects of 0.5 raw score points. For all
mathematics samples except M2 and all reading samples, the scale score differences exceeded
two bootstrap standard errors of the linkings. The average scale score differences were between
10 and 20 points for most of these samples.
As would be expected, the results shown in Figure 7 indicated that the simulated mode
effect of 1.0 raw score points was detected in all mathematics and reading samples. Evidence of
mode effects for these data sets was unequivocal.
Discussion of the MSCA Sensitivity Analyses
In general, the sensitivity analyses supported the MCSA approach. The method does not
seem to be affected by differences in the ability of the group taking an online test versus the
comparison paper test takers, at least within the range of differences studied here. One reason for
18
this robustness might be the difference in sample sizes between the online and paper groups. In
the grade 8 mathematics and reading comparability studies, the paper groups were larger than the
online groups by factors of 125 and 85, respectively. It is not clear from these analyses whether
the MCSA approach sensitivity analyses will work as well if the relative sample sizes of the
online and paper groups become more similar. However, this seems unlikely to happen in Texas,
at least in the near future.
Not surprisingly, the method did not appear to be robust in detecting a simulated mode
effect of 0.25 raw score points. In part, this is a function of how conservative or liberal one is in
evaluating the results. The criterion of two bootstrap standard errors of the linkings seemed, in
the context of the data studied here, a somewhat conservative criterion. From looking at Figure
5, one could argue that a more liberal criteria (in the sense of being more willing to apply a
separate set of score conversions for the paper group) might have led to a decision to adjust the
online scores for three of the six samples for both reading and mathematics. Of course, as with
any statistical analysis, the power was related to sample size. To the extent that future online
comparability analyses in Texas involve increasing online sample sizes, the two bootstrap
standard errors criterion will be less likely to be considered conservative. At some point, other
considerations may carry more weight in evaluations, such the magnitude of raw score-to-raw
score equating differences.
One finding from the sensitivity analyses that would be worth further study was the range
of differences across the six simulated online data sets, particularly in the sensitivity analyses
done for mathematics. A limitation of the study was that the same six samples were used to
study both the conditions where no mode effects were simulated and the conditions where
various levels of mode effects were simulated (since the “mode effects simulated” data sets were
created by randomly changing item responses from the “no mode effects” data). One of the
mathematics simulation samples (sample M2) was drawn by chance in such a way that the
matched samples comparability analyses suggested higher performance for the online group
when no mode effects were present. Sample M2 was drawn with a targeted distribution of
previous scores to be of lower overall performance than the paper group; however, this does not
seem to explain the anomalous results for sample M2. Rather, it seems that some significant
level of sampling variation in the selection of sample M2 occurred that was related to the

19
relationship between the previous test scores (e.g., the Spring 2004 grade 7 mathematics and
reading scale scores) and the criterion score (Spring 2005 grade 8 mathematics raw scores).
Thus, a more extensive set of simulations that incorporated the variation in sampling simulated
online test takers would be helpful in assessing the extent to which this might be a concern. It
might also help to inform decision rules regarding “significant” mode effects.
One final comment about the sensitivity analyses carried out in this study is that future
online comparability studies in Texas will involve matching on a different set of criteria than
those used for the Spring 2005 grade 8 study. For example, an attractive alternative matching
approach would be to create target frequencies based not only on previous scale scores but also
on other important demographic variables such as gender, ethnicity, and English language
proficiency. Because of the extremely large paper group sample sizes, a fairly refined “sampling
grid” could be defined that incorporates most or all of these variables, although it would be
necessary to group previous scale scores into intervals to prevent empty cells in the sampling
grid. A limitation of the current study is that it did not examine the sensitivity of the MSCA
approach to different ways of matching performance between the online and paper groups
besides using previously obtained scale scores. We are currently undertaking such sensitivity
analyses and will use the results to inform the design of Spring 2006 comparability analyses for
the TAKS tests.
Conclusions
In K-12 testing, the current advantages and future promises of online testing have reached
a tipping point that is encouraging virtually every state to consider or pursue online testing
initiatives as part of their testing program. It is easy to envision that K-12 assessments will be
administered almost exclusively online within the foreseeable future. In the enthusiasm to
embrace what Bennett (2002) refers to the “inexorable and inevitable” evolution of technology
and assessment, it is tempting to downplay or dismiss the comparability of online and paper
assessments. Nevertheless, state testing programs and the vendors that serve these programs are
clearly obliged to address the issue of score comparability between online and paper versions of
K-12 assessments, especially given the high-stakes that results from assessments have taken on
in recent years.

20
The strategy Texas has adopted for introducing online testing is similar to the strategy
that many states are using, where online testing is made available to those districts and schools
that are willing and able to pursue it. The comparability studies presented in this paper illustrate
how responsible and psychometrically defensible comparability analyses can be incorporated
within the constraints of a high-stakes, operational testing program. In Texas, the MSCA
approach is a central part of the strategy to offer online and paper versions of TAKS tests side-
by-side as the districts and schools in the state transition to online testing. By routinely including
these analyses both when online versions of tests are introduced and as they continue to be
offered, it will be possible to monitor the comparability of online and paper tests over time.
Although this approach will not be without challenges, it seems to be an equitable and viable
approach to a difficult assessment problem.

21
References
American Psychological Association Committee on Professional Standards and Committee on
Psychological Tests and Assessments (APA) (1986). Guidelines for computer-based
tests and interpretations. Washington, DC: Author.
American Educational Research Association (AERA), American Psychological Association
(APA), and the National Council on Measurement in Education (NCME). (1999).
Standards for educational and psychological testing. Washington, DC: AERA.
Bennett, R.E. (2002). Inexorable and inevitable: The continuing story of technology and
assessment. Journal of Technology, Learning, and Assessmen, 1(1). Available from
http://www.jtla.org.
Bergstrom, B. (1992, April). Ability measure equivalence of computer adaptive and pencil and
paper tests: A research synthesis. Paper presented at the annual meeting of the American
Educational Research Association: San Francisco.
Bridgeman, B., Lennon, M.L., & Jackenthal, A. (2001). Effects of screen size, screen resolution,
and display rate on computer-based test performance (ETS RR-01-23). Princeton, NJ:
Educational Testing Service.
Choi, S.W. & Tinkler, T. (2002). Evaluating comparability of paper and computer-based
assessment in a K-12 setting. Paper presented at the Annual Meeting of the National
Council on Measurement in Education, New Orleans, LA.
Dorans, N. J., & Lawrence, I. M. (1990). Checking the statistical equivalence of nearly identical
test forms. Applied Measurement in Education, 3, 245-254.
Glasnapp, D.R., Poggio, J., Poggio, A., & Yang, X. (2005). Student Attitudes and Perceptions
Regarding Computerized Testing and the Relationship to Performance in Large Scale
Assessment Programs. Paper presented at the annual meeting of the National Council on
Measurement in Education, Montreal, CA.

22
Ito, K., & Sykes, R. C. (2004). Comparability of Scores from Norm-Referenced Paper-and-
Pencil and Web-Based Linear Tests for Grades 4 – 12. Paper presented at the annual
meeting of the American Educational Research Association, San Diego, CA.
Keng, L., McClarty, K. L., & Davis, L. L. (2006). Item-Level Comparative Analysis of Online
and Paper Administrations of the Texas Assessment of Knowledge and Skills. Paper
presented at the annual meeting of the National Council on Measurement in Education,
San Francisco, CA.
Kolen, M.J., & Brennan, R.L. (2004). Test equating,scaling, and linking: methods and practices
(2nd ed.). New York: Springer.
Linacre, J. M. (2001). WINSTEPS Rasch Measurement Program, Version 3.32. Chicago: John
M. Linacre.
Mazzeo, J., & Harvey, A.L. (1988). The equivalence of scores from automated and conventional
educational and psychological tests. A review of the literature (ETS RR-88-21).
Princeton, NJ: Educational Testing Service.
Mead, A.D. & Drasgow, F. (1993). Equivalence of computerized and paper cognitive ability
tests: A meta-analysis. Psychological Bulletin, 114(3), 449-458.
O’Malley, K. J., Kirkpatrick, R., Sherwood, W.,Burdick, H. J., Hsieh, M.C., & Sanford, E.E.
(2005, April). Comparability of a Paper Based and Computer Based Reading Test in
Early Elementary Grades. Paper presented at the AERA Division D Graduate Student
Seminar, Montreal, Canada.
Paek, P. (2005). Recent trends in comparability studies (PEM Research Report 05-05). Available
from http://www.pearsonedmeasurement.com/downloads/research/RR_05_05.pdf.
Poggio, J., Glasnapp, D. R., Yang, X., & Poggio, A. J. (2005). A comparative evaluation of score
results from computerized and paper and pencil mathematics testing in a large scale state
assessment program. Journal of Technology, Learning, and Assessment,3(6). Available
from http://www.jtla.org.

23
Poggio, J., Glasnapp, D., Yang, X., Beauchamp, A., & Dunham, M. (2005). Moving from Paper
and Pencil to Online Testing: Findings from a State Large Scale Assessment Program.
Paper presented at the annual meeting of the National Council on Measurement in
Education, Montreal, Canada.
Pommerich, M. (2004). Developing computerized versions of paper-and-pencil tests: Mode
effects for passage-based tests. Journal of Technology, Learning, and Assessment, 2(6).
Available from http://www.jtla.org.
Spray, J. A., Ackerman, T. A., Reckase, M. D., & Carlson, J. E. (1989). Effect of the medium of
item presentation on examinee performance and item characteristics. Journal of
Educational Measurement, 26, 261-271.

24
Table 1. Online and Paper Sample Means and Standard Deviations for Grade 8 Raw Scores and Grade 7 Scale Scores used for the MSCA
Grade 8 Raw Score Grade 7 Reading SS Grade 7 Math SS Mode Subject N Mean Std Mean Std Mean Std
Reading 1,840 40.60 7.16 2241.32 183.49 2159.40 141.33 Mathematics 1,273 32.60 9.27 2225.88 171.18 2146.81 131.36 Online
Social Studies 1,449 33.97 7.73 2229.56 178.01 2148.38 134.31 Reading 158,282 40.73 7.35 2223.36 185.07 2147.76 150.97
Mathematics 158,809 32.76 9.78 2223.59 185.39 2148.25 150.73 Paper Social Studies 157,809 33.94 8.35 2223.48 185.40 2148.02 151.07
Note: Number of items per test: reading, 48; mathematics, 50; social studies, 48.

25
Table 2. Summary of Comparability Analysis Results – Grade 8 Math
RS CBT_RS RS_SD PAP_SS CBT_SS SS_SD RS_DIF SS_DIF SIG? 0 0.0000 N/A 1222.99 1222.99 N/A 0.00 0.00 1 1.0262 0.03489 1376.71 1379.48 4.19048 0.03 2.77 2 2.0469 0.06509 1488.99 1491.83 5.02326 0.05 2.84 3 3.0636 0.09144 1557.09 1560.06 4.91924 0.06 2.97 4 4.0772 0.11465 1607.10 1610.04 4.84358 0.08 2.94 5 5.0887 0.13525 1647.22 1650.11 4.76723 0.09 2.89 6 6.0987 0.15365 1681.09 1683.91 4.69091 0.10 2.82 7 7.1080 0.17022 1710.65 1713.43 4.62034 0.11 2.78 8 8.1169 0.18522 1737.08 1739.83 4.55582 0.12 2.75 9 9.1258 0.19881 1761.13 1763.87 4.49686 0.13 2.74
10 10.1350 0.21118 1783.32 1786.07 4.44182 0.14 2.75 11 11.1447 0.22248 1804.01 1806.79 4.39325 0.14 2.78 12 12.1551 0.23274 1823.48 1826.31 4.35233 0.16 2.83 13 13.1661 0.24203 1841.96 1844.86 4.31354 0.17 2.90 14 14.1779 0.25042 1859.60 1862.59 4.27712 0.18 2.99 15 15.1903 0.25795 1876.53 1879.62 4.24776 0.19 3.09 16 16.2035 0.26464 1892.88 1896.09 4.22228 0.20 3.21 17 17.2172 0.27048 1908.74 1912.08 4.19496 0.22 3.34 18 18.2315 0.27554 1924.17 1927.66 4.18301 0.23 3.49 19 19.2462 0.27979 1939.30 1942.93 4.15349 0.25 3.63 20 20.2611 0.28323 1954.09 1957.89 4.13358 0.26 3.80 21 21.2762 0.28583 1968.65 1972.62 4.11976 0.28 3.97 22 22.2912 0.28767 1983.04 1987.19 4.10697 0.29 4.15 23 23.3061 0.28874 1997.30 2001.64 4.09458 0.31 4.34 24 24.3207 0.28902 2011.47 2016.00 4.08511 0.32 4.53 25 25.3349 0.28851 2025.60 2030.32 4.07175 0.33 4.72 26 26.3483 0.28725 2039.71 2044.64 4.06389 0.35 4.93 27 27.3610 0.28517 2053.86 2059.00 4.05925 0.36 5.14 28 28.3727 0.28238 2068.10 2073.45 4.05312 0.37 5.35 29 29.3833 0.27876 2082.46 2088.03 4.04572 0.38 5.57 30 30.3925 0.27439 2096.98 2102.77 4.04454 0.39 5.79 31 31.4003 0.26926 2111.73 2117.74 4.03923 0.40 6.01 32 32.4064 0.26337 2126.74 2132.98 4.03989 0.41 6.24 33 33.4107 0.25669 2142.09 2148.56 4.04002 0.41 6.47 34 34.4129 0.24925 2157.84 2164.54 4.03999 0.41 6.70 35 35.4128 0.24105 2174.06 2181.00 4.04637 0.41 6.94 36 36.4104 0.23203 2190.86 2198.04 4.05234 0.41 7.18 37 37.4053 0.22224 2208.34 2215.76 4.06272 0.41 7.42 38 38.3974 0.21163 2226.64 2234.30 4.07537 0.40 7.66 39 39.3865 0.20014 2245.92 2253.83 4.09162 0.39 7.91 40 40.3724 0.18780 2266.39 2274.56 4.11313 0.37 8.17 41 41.3547 0.17456 2288.32 2296.76 4.14520 0.35 8.44 **42 42.3334 0.16032 2312.10 2320.82 4.18301 0.33 8.72 **43 43.3082 0.14506 2338.23 2347.24 4.23461 0.31 9.01 **44 44.2788 0.12870 2367.47 2376.82 4.30573 0.28 9.35 **45 45.2450 0.11112 2400.99 2410.73 4.40490 0.24 9.74 **46 46.2065 0.09221 2440.72 2450.97 4.56203 0.21 10.25 **47 47.1630 0.07185 2490.33 2501.37 4.84320 0.16 11.04 **48 48.1143 0.04983 2557.98 2570.78 5.54320 0.11 12.80 **49 49.0601 0.02597 2669.80 2679.01 3.96352 0.06 9.21 **50 50.0000 N/A 2822.97 2822.97 N/A 0.00 0.00
26
Table 3. Summary of Comparability Analysis – Grade 8 Reading RS CBT_RS RS_SD PAP_SS CBT_SS SS_SD RS_DIF SS_DIF SIG?
0 0.0000 N/A 1174.29 1174.29 N/A 0.00 0.00 1 1.1417 0.03914 1328.54 1344.27 4.34428 0.14 15.73 ** 2 2.2772 0.07382 1439.53 1458.05 4.93151 0.28 18.52 ** 3 3.4063 0.10482 1506.33 1526.13 5.10897 0.41 19.80 ** 4 4.5288 0.13266 1555.07 1575.63 5.15905 0.53 20.56 ** 5 5.6445 0.15778 1593.96 1615.01 5.15115 0.64 21.05 ** 6 6.7535 0.18048 1626.63 1648.02 5.08850 0.75 21.39 ** 7 7.8557 0.20098 1655.04 1676.65 4.98703 0.86 21.61 ** 8 8.9511 0.21952 1680.37 1702.11 4.88667 0.95 21.74 ** 9 10.0399 0.23621 1703.35 1725.19 4.81142 1.04 21.84 **
10 11.1220 0.25117 1724.51 1746.43 4.75545 1.12 21.92 ** 11 12.1975 0.26454 1744.23 1766.21 4.71342 1.20 21.98 ** 12 13.2666 0.27638 1762.77 1784.81 4.68332 1.27 22.04 ** 13 14.3292 0.28676 1780.35 1802.45 4.65328 1.33 22.10 ** 14 15.3855 0.29575 1797.15 1819.28 4.62599 1.39 22.13 ** 15 16.4355 0.30347 1813.28 1835.44 4.60295 1.44 22.16 ** 16 17.4794 0.30986 1828.86 1851.06 4.57744 1.48 22.20 ** 17 18.5172 0.31504 1843.99 1866.21 4.55589 1.52 22.22 ** 18 19.5490 0.31898 1858.74 1880.99 4.53393 1.55 22.25 ** 19 20.5748 0.32187 1873.19 1895.45 4.51017 1.57 22.26 ** 20 21.5948 0.32362 1887.40 1909.66 4.49162 1.59 22.26 ** 21 22.6090 0.32426 1901.41 1923.69 4.47189 1.61 22.28 ** 22 23.6175 0.32390 1915.29 1937.57 4.45429 1.62 22.28 ** 23 24.6203 0.32249 1929.08 1951.36 4.43585 1.62 22.28 ** 24 25.6175 0.32010 1942.83 1965.10 4.41928 1.62 22.27 ** 25 26.6092 0.31672 1956.58 1978.84 4.40195 1.61 22.26 ** 26 27.5954 0.31239 1970.38 1992.63 4.38807 1.60 22.25 ** 27 28.5761 0.30716 1984.27 2006.51 4.37174 1.58 22.24 ** 28 29.5515 0.30106 1998.31 2020.51 4.34880 1.55 22.20 ** 29 30.5215 0.29396 2012.54 2034.71 4.35021 1.52 22.17 ** 30 31.4862 0.28607 2026.98 2049.17 4.33762 1.49 22.19 ** 31 32.4457 0.27726 2041.79 2063.95 4.32972 1.45 22.16 ** 32 33.3999 0.26765 2056.97 2079.10 4.32238 1.40 22.13 ** 33 34.3489 0.25718 2072.62 2094.71 4.31895 1.35 22.09 ** 34 35.2927 0.24589 2088.82 2110.87 4.31675 1.29 22.05 ** 35 36.2315 0.23379 2105.69 2127.69 4.31397 1.23 22.00 ** 36 37.1651 0.22088 2123.36 2145.29 4.31091 1.17 21.93 ** 37 38.0936 0.20717 2141.99 2163.86 4.30213 1.09 21.87 ** 38 39.0172 0.19261 2161.80 2183.59 4.27818 1.02 21.79 ** 39 39.9358 0.17731 2183.07 2204.78 4.23488 0.94 21.71 ** 40 40.8495 0.16117 2206.16 2227.81 4.17388 0.85 21.65 ** 41 41.7584 0.14421 2231.59 2253.23 4.12945 0.76 21.64 ** 42 42.6626 0.12644 2260.11 2281.84 4.14760 0.66 21.73 ** 43 43.5622 0.10779 2292.90 2314.83 4.20372 0.56 21.93 ** 44 44.4574 0.08828 2331.90 2354.34 4.33187 0.46 22.44 ** 45 45.3484 0.06782 2380.97 2404.32 4.54411 0.35 23.35 ** 46 46.2356 0.04637 2447.97 2474.17 5.15647 0.24 26.20 ** 47 47.1193 0.02381 2559.18 2577.78 3.71164 0.12 18.60 ** 48 48.0000 N/A 2715.06 2715.06 N/A 0.00 0.00

27
Table 4. Summary of Comparability Analysis – Grade 8 Social Studies RS CBT_RS RS_SD PAP_SS CBT_SS SS_SD RS_DIF SS_DIF SIG?
0 0.0000 N/A 1361.76 1361.76 N/A 0.00 0.00 1 1.0085 0.03243 1506.93 1507.46 3.94365 0.01 0.53 2 2.0222 0.06223 1612.22 1612.97 4.94385 0.02 0.75 3 3.0399 0.08966 1675.72 1677.24 4.68584 0.04 1.52 4 4.0609 0.11492 1722.17 1724.22 4.59585 0.06 2.05 5 5.0843 0.13822 1759.29 1761.79 4.54612 0.08 2.50 6 6.1093 0.15967 1790.55 1793.43 4.51153 0.11 2.88 7 7.1354 0.17942 1817.79 1821.01 4.48432 0.14 3.22 8 8.1620 0.19754 1842.11 1845.64 4.46028 0.16 3.53 9 9.1885 0.21419 1864.22 1868.02 4.43932 0.19 3.80
10 10.2147 0.22936 1884.61 1888.66 4.42081 0.21 4.05 11 11.2400 0.24318 1903.64 1907.92 4.40239 0.24 4.28 12 12.2643 0.25565 1921.56 1926.04 4.38411 0.26 4.48 13 13.2872 0.26683 1938.57 1943.23 4.36923 0.29 4.66 14 14.3085 0.27682 1954.84 1959.66 4.35471 0.31 4.82 15 15.3281 0.28558 1970.49 1975.44 4.33894 0.33 4.95 16 16.3457 0.29319 1985.62 1990.70 4.32683 0.35 5.08 17 17.3614 0.29970 2000.33 2005.51 4.31226 0.36 5.18 18 18.3749 0.30502 2014.68 2019.95 4.30032 0.37 5.27 19 19.3864 0.30934 2028.75 2034.09 4.28813 0.39 5.34 20 20.3955 0.31254 2042.59 2047.99 4.27732 0.40 5.40 21 21.4025 0.31473 2056.26 2061.71 4.26525 0.40 5.45 22 22.4073 0.31594 2069.80 2075.28 4.25233 0.41 5.48 23 23.4098 0.31611 2083.25 2088.75 4.24609 0.41 5.50 24 24.4102 0.31530 2096.68 2102.19 4.23484 0.41 5.51 25 25.4083 0.31354 2110.11 2115.62 4.22563 0.41 5.51 26 26.4045 0.31085 2123.59 2129.08 4.21861 0.40 5.49 27 27.3986 0.30723 2137.17 2142.62 4.20100 0.40 5.45 28 28.3907 0.30263 2150.85 2156.29 4.20556 0.39 5.44 29 29.3810 0.29713 2164.77 2170.17 4.19772 0.38 5.40 30 30.3695 0.29074 2178.92 2184.27 4.19448 0.37 5.35 31 31.3564 0.28345 2193.38 2198.67 4.18920 0.36 5.29 32 32.3417 0.27523 2208.20 2213.42 4.18539 0.34 5.22 33 33.3255 0.26612 2223.46 2228.61 4.18150 0.33 5.15 34 34.3081 0.25610 2239.24 2244.31 4.18302 0.31 5.07 35 35.2894 0.24513 2255.66 2260.64 4.18271 0.29 4.98 36 36.2697 0.23325 2272.83 2277.72 4.18550 0.27 4.89 37 37.2491 0.22041 2290.91 2295.71 4.19165 0.25 4.80 38 38.2277 0.20659 2310.10 2314.84 4.22410 0.23 4.74 39 39.2057 0.19174 2330.79 2335.41 4.22980 0.21 4.62 40 40.1832 0.17583 2353.13 2357.66 4.24902 0.18 4.53 41 41.1603 0.15880 2377.69 2382.14 4.28007 0.16 4.45 42 42.1372 0.14058 2405.19 2409.57 4.32222 0.14 4.38 43 43.1140 0.12109 2436.72 2441.06 4.38615 0.11 4.34 44 44.0908 0.10025 2474.14 2478.49 4.48869 0.09 4.35 45 45.0677 0.07790 2520.90 2525.38 4.67900 0.07 4.48 46 46.0448 0.05387 2584.74 2589.75 5.17909 0.04 5.01 47 47.0223 0.02799 2690.37 2693.80 3.83598 0.02 3.43 48 48.0000 N/A 2837.51 2837.51 N/A 0.00 0.00

28
Table 5. Univariate Summary Statistics for Online and Paper Exit Level TAKS Raw Scores Online Testing Group Paper-Pencil Testing Group
Subject N Mean Std Min Max N Mean Std Min MaxMath 958 26.76 8.92 7 59 1198 27.47 8.81 9 60Science 1004 23.70 7.56 7 54 1197 24.17 7.92 9 55Social Studies 355 29.49 11.17 8 54 388 29.19 11.13 9 55ELA 649 37.52 11.10 9 58 719 38.24 10.76 8 58Note: Number of items per test: mathematics, 60; science, 54; social studies, 54, ELA, 58. Table 6. Univariate Summary Statistics for Online and Paper Component Scores – Exit Leve ELA
Online Testing Group Paper-Pencil Testing Group Score N Mean Std Min Max N Mean Std Min MaxELA 649 37.52 11.10 9 58 719 38.24 10.76 8 58ELA_WT 649 42.21 12.60 10 70 719 43.32 12.30 8 70ELA_MC 649 33.44 9.34 8 48 719 33.88 9.06 7 48Essay 649 1.56 0.73 0 4 719 1.69 0.71 0 4OE 1 649 0.87 0.71 0 2 719 0.96 0.71 0 2OE 2 649 0.96 0.69 0 2 719 1.06 0.70 0 3OE 3 649 0.69 0.68 0 3 719 0.66 0.69 0 3Note: The ELA score is weighted four times in calculating the overall ELA composite score (ELA_WT). Table 7. Univariate Statistics for Previous TAKS Scores for Exit Level Online and Paper-Pencil Groups
Online Testing Group Paper-Pencil Testing Group Subject Grade* N SS Mean SS Std SS Min SS Max N SS Mean SS Std SS Min SS MaxELA 10 96 2270.6 110.8 1940 2529 104 2275.1 122.7 1964 2665ELA 11 413 2043.2 48.3 1728 2126 464 2042.9 50.2 1703 2099Math 10 86 2314.5 200.8 1853 2780 96 2298.3 208.7 1853 2780Math 11 698 1979.7 50.9 1817 2083 873 1981.9 55.4 1295 2083Science 10 75 2288.6 169.8 1930 2846 98 2270.0 161.1 1791 2684Science 11 715 2005.2 41.0 1816 2081 867 2003.3 44.2 1835 2081Soc St 10 91 2438.5 169.4 1911 2796 89 2426.3 199.2 1969 2796Soc St 11 212 2014.3 43.5 1857 2067 224 2012.1 55.6 1415 2089
* Refers to the grade associated with the most recent previous test score.

29
Table 8: Scale Score Frequency Distributions and Means for the Math Sensitivity Analysis Samples
Math SS M Sample1 M Sample2 M Sample3 M Sample4 M Sample5 M Sample6 Paper1335 0 0 0 0 0 0 41473 0 0 0 0 0 0 11635 0 0 0 0 0 0 11680 0 0 0 0 0 0 31716 1 1 1 0 0 0 101747 3 2 2 0 0 0 171773 5 4 3 1 0 0 521796 8 6 4 1 0 0 1251818 9 7 5 2 1 0 2661837 24 19 7 4 1 0 4881855 16 13 9 5 2 0 6851873 19 15 13 9 4 1 10601889 22 18 15 11 6 3 14231904 25 21 18 14 10 5 17231919 27 23 21 17 13 9 21531934 27 24 23 20 17 13 25171948 31 28 26 24 20 16 29441961 35 31 28 25 22 17 31591975 36 33 31 29 26 23 35691988 36 34 33 32 29 28 39492001 39 36 35 34 32 31 42342023 41 37 36 35 34 33 43042026 43 41 39 37 36 33 46562039 44 43 41 39 40 37 48922061 44 44 42 42 41 39 52182064 45 45 43 43 42 41 54132077 46 45 44 44 43 42 54932100 46 45 45 45 44 44 56222103 46 46 46 45 45 45 55452117 46 46 46 46 46 45 57332130 47 47 46 46 46 46 57612144 47 47 47 47 46 46 57972159 46 46 48 47 47 47 58172174 45 46 46 47 47 47 59002189 44 46 46 48 48 47 59802206 43 45 46 47 48 48 58152223 42 45 45 46 47 48 57752241 41 43 44 46 47 48 57472260 39 41 42 45 46 47 55862281 35 38 41 44 46 47 53512305 31 35 38 42 45 47 51902331 25 30 34 40 44 46 50042360 16 23 30 35 43 46 44932400 7 15 24 31 38 45 38782439 2 10 18 25 32 42 31352499 1 7 13 18 25 35 21882597 0 3 8 12 17 24 15162732 0 1 3 5 9 14 617
Math SS 2088.25 2108.25 2128.25 2148.25 2168.25 2188.25 2148.25Reading 2171.32 2190.64 2207.22 2219.41 2245.80 2253.29 2223.59
Raw 29.56 31.15 31.82 32.49 33.73 34.44 32.76N 1275 1275 1275 1275 1275 1275 158809

30
Table 9: Scale Score Frequency Distributions and Means for the Reading Sensitivity Analysis Samples
Reading R Sample1 R Sample2 R Sample3 R Sample4 R Sample5 R Sample6 Paper1189 0 0 0 0 0 0 131498 0 0 0 0 0 0 11545 0 0 0 0 0 0 11583 0 0 0 0 0 0 41615 0 0 0 0 0 0 201644 1 1 1 0 0 0 241669 2 2 1 1 0 0 461693 5 3 3 1 0 0 841714 8 4 2 2 1 0 1511734 10 6 4 2 1 1 2131753 12 8 5 3 1 1 2711771 14 10 6 4 2 0 3441789 15 11 7 5 3 1 4231805 16 12 8 6 4 2 5121822 17 13 9 7 5 3 5931837 18 14 10 8 6 4 6661853 19 14 11 9 7 5 7681868 20 15 12 11 8 7 9181883 22 16 13 11 9 8 9671897 24 18 15 13 11 9 10851912 25 19 16 14 12 10 12301927 26 19 17 15 13 10 13091941 27 23 19 17 15 11 14391955 28 24 21 19 17 12 15891970 29 26 23 20 18 13 17201985 31 28 25 23 21 15 19272009 37 32 31 25 19 16 21452014 43 37 35 29 23 19 24902030 49 43 38 32 26 22 27142053 55 48 42 36 30 24 30742061 61 52 46 42 38 29 35922077 66 62 55 47 39 35 40332100 71 64 58 54 50 41 45782112 79 74 67 61 55 47 52432130 85 85 78 70 62 56 59982150 98 88 82 77 71 63 65832170 106 105 99 87 73 72 74582192 127 134 124 99 75 78 84342216 134 141 132 113 94 87 96162241 123 141 140 118 99 94 101392270 110 126 145 130 113 106 110822303 86 118 130 134 138 140 115362342 70 94 116 138 161 161 117672400 48 66 98 126 154 176 108122455 18 29 61 113 165 221 97542561 11 16 23 85 148 164 72592705 4 9 22 43 63 87 3657
Reading 2123.36 2153.36 2183.36 2223.36 2263.36 2293.36 2223.36Math SS 2092.24 2106.32 2120.90 2144.44 2171.69 2185.12 2147.76Raw Score 38.06 38.83 39.82 40.71 41.66 42.43 40.73N 1850 1850 1850 1850 1850 1850 158282

31
TAKS Grade 8 Mathematics
-15
-10
-5
0
5
10
15
1 4 7 10 13 16 19 22 25 28 31 34 37 40 43 46 49Raw Score
SS D
iffer
ence
TAKS Grade 8 Reading
-15-10
-505
1015202530
1 4 7 10 13 16 19 22 25 28 31 34 37 40 43 46Raw Score
SS D
iffer
ence
TAKS Grade 8 Social Studies
-15
-10
-5
0
5
10
15
1 4 7 10 13 16 19 22 25 28 31 34 37 40 43 46Raw Score
SS D
iffer
ence
C
Figure 1. Plots of Online Minus Paper Test Scale Score Conversions (Dark Line) and ±2 Bootstrap Standard Errors of the Differences (White Lines) as a function of Raw Score – Grade 8
32
TAKS Grade 11 Mathematics
-20
-15
-10
-5
0
5
10
15
20
1 4 7 10 13 16 19 22 25 28 31 34 37 40 43 46 49 52 55 58Raw Score
SS D
iffer
ence
TAKS Grade 11 English Language Arts
-50-40-30-20-10
01020304050
1 4 7 10 13 16 19 22 25 28 31 34 37 40 43 46 49 52 55 58 61 64 67 70Raw Score
SS D
iffer
ence
Figure 2. Plots of Online Minus Paper Test Scale Score Conversions (Dark Line) and ±2 Bootstrap Standard Errors of the Differences (White Lines) as a function of Raw Score – Grade 11 Mathematics and English Language Arts

33
TAKS Grade 11 Science
-15
-10
-5
0
5
10
15
1 4 7 10 13 16 19 22 25 28 31 34 37 40 43 46 49 52Raw Score
SS D
iffer
ence
TAKS Grade 11 Social Studies
-30
-20
-10
0
10
20
30
1 4 7 10 13 16 19 22 25 28 31 34 37 40 43 46 49 52Raw Score
SS D
iffer
ence
M h
Figure 3. Plots of Online Minus Paper Test Scale Score Conversions (Dark Line) and ±2 Bootstrap Standard Errors of the Differences (White Lines) as a function of Raw Score – Grade 11 Science and Social Studies

34
-8
-6
-4
-2
0
2
4
6
8
0 5 10 15 20 25 30 35 40 45 50
Raw Score
Scal
e Sc
ore
Diff
eren
ce
M_Sample1 M_Sample2 M_Sample3M_Sample4 M_Sample5 M_Sample6
-8
-6
-4
-2
0
2
4
6
8
0 4 8 12 16 20 24 28 32 36 40 44 48
Raw Score
Scal
e Sc
ore
Diff
eren
ce
R_Sample1 R_Sample2 R_Sample3R_Sample4 R_Sample5 R_Sample6
Figure 4. Bootstrap Mean Scale Score Differences (Online minus Paper) for Mathematics (Upper Graph) and Reading (Lower Graph) – No Mode Effects Simulated

35
-14
-7
0
7
14
0 5 10 15 20 25 30 35 40 45 50
Raw Score
Scal
e Sc
ore
Diff
eren
ce
M_Sample1 M_Sample2 M_Sample3M_Sample4 M_Sample5 M_Sample6
-14
-7
0
7
14
0 4 8 12 16 20 24 28 32 36 40 44 48
Raw Score
Scal
e Sc
ore
Diff
eren
ce
R_Sample1 R_Sample2 R_Sample3R_Sample4 R_Sample5 R_Sample6
Figure 5. Bootstrap Mean Scale Score Differences (Online minus Paper) for Mathematics (Upper Graph) and Reading (Lower Graph) – Simulated Mode Effects = 0.25

36
-20
-10
0
10
20
0 5 10 15 20 25 30 35 40 45 50
Raw Score
Scal
e Sc
ore
Diff
eren
ce
M_Sample1 M_Sample2 M_Sample3M_Sample4 M_Sample5 M_Sample6
-20
-10
0
10
20
0 4 8 12 16 20 24 28 32 36 40 44 48
Raw Score
Scal
e Sc
ore
Diff
eren
ce
R_Sample1 R_Sample2 R_Sample3R_Sample4 R_Sample5 R_Sample6
Figure 6. Bootstrap Mean Scale Score Differences (Online minus Paper) for Mathematics (Upper Graph) and Reading (Lower Graph) – Simulated Mode Effects = 0.50

37
-50
-25
0
25
50
0 5 10 15 20 25 30 35 40 45 50
Raw Score
Scal
e Sc
ore
Diff
eren
ce
M_Sample1 M_Sample2 M_Sample3M_Sample4 M_Sample5 M_Sample6
-50
-25
0
25
50
0 4 8 12 16 20 24 28 32 36 40 44 48
Raw Score
Scal
e Sc
ore
Diff
eren
ce
R_Sample1 R_Sample2 R_Sample3R_Sample4 R_Sample5 R_Sample6
Figure 7. Bootstrap Mean Scale Score Differences (Online minus Paper) for Mathematics (Upper Graph) and Reading (Lower Graph) – Simulated Mode Effects = 1.00