Embed Size (px)
Citation preview
LA‐UR‐15‐22097
Los Alamos National Laboratory
DC Microgrids Scoping Study—Estimate of Technical and
Economic Benefits
Scott Backhaus1, Gregory W. Swift1, Spyridon Chatzivasileiadis2, William Tschudi2, Steven Glover3,
Michael Starke4, Jianhui Wang5, Meng Yue6, and Donald Hammerstrom7
1. Los Alamos National Laboratory
2. Lawrence Berkeley National Laboratory
3. Sandia National Laboratory
4. Oak Ridge National Laboratory
5. Argonne National Laboratory
6. Brookhaven National Laboratory
7. Pacific Northwest National Laboratory
March 2015
This work was funded by the Office of Electricity Delivery and Energy Reliability of the U.S. Department of Energy under Contract DE‐AC52‐06NA25396 with Los Alamos National Laboratory, Contract DE‐AC02‐05CH11231 with Lawrence Berkeley National Laboratory, Contract DE‐AC04‐94AL85000 with Sandia National Laboratory, Contract DE‐AC05‐00OR22725 with Oak Ridge National Laboratory, Contract No. DE‐AC02‐06CH11357 with Argonne National Laboratory, Contract DE‐SC0012704 with Brookhaven National Laboratory, and Contract DE‐AC05‐76RL01830 with Pacific Northwest National Laboratory

Contents1 Executive Summary 2
2 Introduction 72.1 Terminology . . . . . . . . . . . . . . . . . . . . . . . . . . . . . 82.2 Metrics For Assessing the Impacts of DC Networks and Microgrids 102.3 Microgrid Reference Architectures . . . . . . . . . . . . . . . . . 112.4 Operating Modes and Load Profiles . . . . . . . . . . . . . . . . 16
3 Analysis of Microgrid Metrics 173.1 Safety and Protection . . . . . . . . . . . . . . . . . . . . . . . . 173.2 Reliability . . . . . . . . . . . . . . . . . . . . . . . . . . . . . . 173.3 Capital Cost . . . . . . . . . . . . . . . . . . . . . . . . . . . . . 193.4 Energy Efficiency . . . . . . . . . . . . . . . . . . . . . . . . . . 22
3.4.1 Operating Modes and Load Profiles . . . . . . . . . . . . 233.4.2 Analysis . . . . . . . . . . . . . . . . . . . . . . . . . . 24
3.5 Operating Costs . . . . . . . . . . . . . . . . . . . . . . . . . . . 283.6 Engineering Costs . . . . . . . . . . . . . . . . . . . . . . . . . . 28
3.6.1 Communication Systems . . . . . . . . . . . . . . . . . . 293.6.2 Control Systems . . . . . . . . . . . . . . . . . . . . . . 30
3.7 Environmental Impact . . . . . . . . . . . . . . . . . . . . . . . . 313.8 Power Quality . . . . . . . . . . . . . . . . . . . . . . . . . . . . 323.9 Resilience . . . . . . . . . . . . . . . . . . . . . . . . . . . . . . 343.10 Summary Metrics Analysis and Recommendations . . . . . . . . 34
4 Appendix A—Voltage-Conversion and Battery Efficiency Assumptions 39
5 Appendix B—DC Microgrid Applications 44
1
1. Executive SummaryMotivation: Microgrid demonstrations and deployments are expanding in USpower systems and around the world. Although goals are specific to each site,these microgrids have demonstrated the ability to provide higher reliability andhigher power quality than utility power systems and improved energy utilization[1] [2][3]. The vast majority of these microgrids are based on AC power transferbecause this has been the traditionally dominant power delivery scheme. Indepen-dently, manufacturers, power system designers and researchers are demonstratingand deploying DC power distribution systems for applications where the end-useloads are natively DC [4], e.g., computers [5], solid-state lighting [6], and buildingnetworks [6]. These early DC applications may provide higher efficiency, addedflexibility, reduced capital costs over their AC counterparts. Further, when onsiterenewable generation, electric vehicles and storage systems are present, DC-basedmicrogrids may offer additional benefits [7]. Early successes from these effortsraises a question—can a combination of microgrid concepts and DC distributionsystems provide added benefits beyond what has been achieved individually?
Scope: The intent of this study is to provide a preliminary examination of thebenefits and drawbacks of potential DC microgrid applications relative to theirAC counterparts and to provide recommendations for potential future researchand deployment activities. The performance of notional AC and DC microgridsare estimated and compared using several metrics:
1. safety and protection
2. reliability
3. capital cost
4. energy efficiency
5. operating cost
6. engineering costs
7. environmental impact
8. power quality
9. resilience.
2
Several types of AC and DC microgrids applications were compared. The initialcomparison is done using several generic microgrid architectures to reveal theimportance of and to initially screen the different metrics. Then, several specificmicrogrid applications are considered to draw out possible unique advantages ofDC over AC microgrids. These applications include:
1. DC Microgrid as an Efficient, Low-Cost Platform for Economic (Steady-State) Integration
2. High Survivability DC Microgrids
3. Low Power Network with Differentiated and Automatically Evolvable PowerQuality and Reliability
4. Converting AC Systems to Hybrid AC/DC Systems
5. Mobile and Remote Applications
6. Data Center Support Systems
7. Coupling a DC Microgrid to a HVDC Line
8. Electric Vehicles for Backup/Emergency Power.
We note that the assessment of the general architectures and specific applica-tions is done using the best estimates of the performance and cost of commercialor near-commercial technology. It should be noted that several emerging tech-nologies could change the conclusions and recommendations of this study. Themost prominent of these technologies is the use of wide bandgap semiconductorsin high-power applications such as rectifiers and DC-DC converters. Significantimprovements enabled by these semiconductors include higher reliability fromfewer junctions per device and availability of both AC and DC buses from a sin-gle power electronic device.
Recommendations: Analysis of the generic microgrid architectures and the spe-cific applications against the study metrics leads to two applications recommendedfor immediate further study and a third for potential study in the future:
1. DC Microgrid as an Efficient, Low-Cost Platform for Economic (Steady-State) Integration—Many new distributed energy resources are direct DC,e.g. photovoltaic (PV) generation, stationary batteries, mobile batteries, and
3

fuel cells. Also, many high efficiency loads are also direct DC [4]. A mi-crogrid utilizing a DC bus may avoid many of the power conversion stepsrequired when using an AC bus, potentially leading to higher energy ef-ficiency and improved economic operation for DC microgrids. However,these benefits need to be carefully weighed against the potentially highercost of interfacing a DC microgrid to the bulk AC power systems. To pro-vide more accurate estimates of these costs and benefits, this scoping studyrecommends a more detailed simulation-based study of comparable AC andDC microgrids that, at a minimum, accounts for the following factors:
(a) realistic microgrid load and generation profiles (daily and annual)
(b) the use of realistic AC-DC, DC-AC, and DC-DC power conversionefficiency curves that account for the typical decrease in efficiency atpart load
(c) fair and detailed treatment of the conductor losses in AC and DC mi-crogrids including the effects reactive power flow and mitigation oflosses through additional capital expenditures on conductors.
(d) sensitivity of the reliability of DC microgrids (i.e. the ability to deliverpower to the microgrid loads) to the sizing of the power electronicsat the AC-DC interface to the bulk power system and the sizing ofmicrogrid’s distributed energy resources.
(e) at equivalent reliability, the sensitivity of the economic performance ofDC microgrids to the sizing and capital cost of the microgrid energyresources and power electronics at the AC-DC interface to the bulkpower system, including the impact of this sizing on the ability of theDC microgrid to export power to the bulk AC system
We emphasize that all of the assessments and effect mentioned above shouldbe done using realistic load and generation profiles, not peaks or averages.The main objective of the recommended study is to provide accurate esti-mates of the economic performance of AC and DC microgrids for designsthat yield equivalent reliability, where reliability is considered in the N-1sense of being able to serve all critical load after the loss of any one com-ponent.
2. High Survivability DC Microgrids—Microgrids are subject to many dif-ferent types of internal and external disturbances. To be ”survivable”, the
4
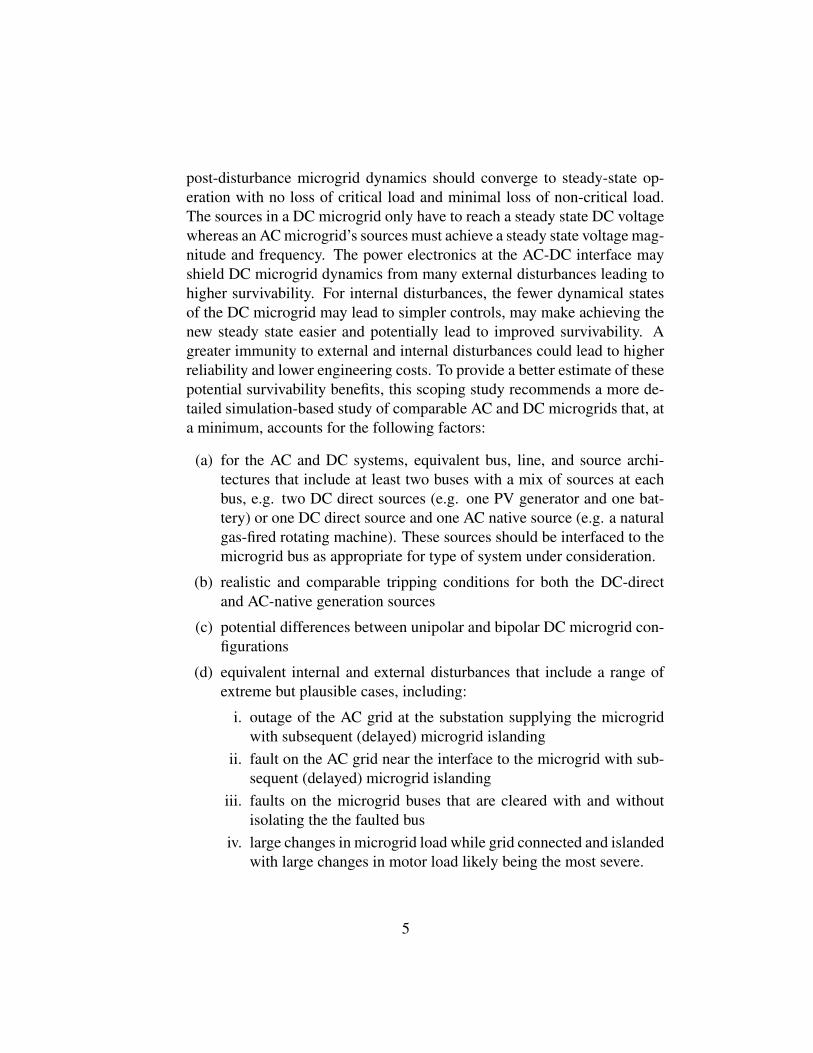
post-disturbance microgrid dynamics should converge to steady-state op-eration with no loss of critical load and minimal loss of non-critical load.The sources in a DC microgrid only have to reach a steady state DC voltagewhereas an AC microgrid’s sources must achieve a steady state voltage mag-nitude and frequency. The power electronics at the AC-DC interface mayshield DC microgrid dynamics from many external disturbances leading tohigher survivability. For internal disturbances, the fewer dynamical statesof the DC microgrid may lead to simpler controls, may make achieving thenew steady state easier and potentially lead to improved survivability. Agreater immunity to external and internal disturbances could lead to higherreliability and lower engineering costs. To provide a better estimate of thesepotential survivability benefits, this scoping study recommends a more de-tailed simulation-based study of comparable AC and DC microgrids that, ata minimum, accounts for the following factors:
(a) for the AC and DC systems, equivalent bus, line, and source archi-tectures that include at least two buses with a mix of sources at eachbus, e.g. two DC direct sources (e.g. one PV generator and one bat-tery) or one DC direct source and one AC native source (e.g. a naturalgas-fired rotating machine). These sources should be interfaced to themicrogrid bus as appropriate for type of system under consideration.
(b) realistic and comparable tripping conditions for both the DC-directand AC-native generation sources
(c) potential differences between unipolar and bipolar DC microgrid con-figurations
(d) equivalent internal and external disturbances that include a range ofextreme but plausible cases, including:
i. outage of the AC grid at the substation supplying the microgridwith subsequent (delayed) microgrid islanding
ii. fault on the AC grid near the interface to the microgrid with sub-sequent (delayed) microgrid islanding
iii. faults on the microgrid buses that are cleared with and withoutisolating the the faulted bus
iv. large changes in microgrid load while grid connected and islandedwith large changes in motor load likely being the most severe.
5
The performance of the AC and DC microgrids should primarily be judgedon their ability to maintain service to critical loads following the disturbancewith a secondary consideration of the cost of the control system, generationsources, and power electronics. The survivability study may want to con-sider using the same microgrid architectures as in the “Low-Cost Platform”study for comparison.
3. Low Power Network with Differentiated and Automatically EvolvablePower Quality and Reliability—These networks and microgrid are gen-erally low voltage Power Over Ethernet (PoE) systems where communica-tions and power distribution are naturally integrated into the same wiringand switching. The integrated architecture and communications protocolnaturally enables end device self identification with the potential for auto-mated network or microgrid reconfiguration. At current device power lev-els, it is not clear if these networks will ever achieve the minimum powerthreshold used in this study and become large enough to be relevant to DOEOffice of Electricity. However, the rapid evolution in this area justifies con-tinued monitoring of this technology.
Ancillary Benefits This scoping study makes a fundamental assumption that thedecision to convert from traditional AC to significantly more efficient DC loads[4] (DC-internal in the case of an AC architecture) is independent of the decisionto convert from an AC architecture to a DC architecture. Although is allows fora clean analysis of the benefits of the DC versus AC architectures, the humanfactors behind the decision to use efficient DC loads are less “clean”. PromotingDC architectures may be a path to the conversion to DC loads and their inherentlybetter energy efficiency.
6
2. IntroductionBecause AC traditionally enabled efficient voltage transformation and high volt-age power transmission over long distances, it dominated our bulk power sys-tem, and consequently so much of what lies downstream of it. Technology ad-vances, however, have led to highly efficient AC/DC and DC/DC converters,which have made high-voltage DC a more efficient means for long-distance bulkpower transmission[8]. At the same time, parts of the electricity system are evolv-ing towards local generation, storage, and use, where the majority of the localgenerating sources and loads produce and consume DC power. While the every-day power supply in our factories and buildings is AC, DC power systems arebecoming commonplace and ubiquitous, such as in building communications andIT networks, building automation and fire life safety and security systems, on-site renewable power generation, onsite storage, remote homes, vehicles, vessels,aircraft, and powering remote communications devices.
The basis for AC as the sole platform is eroding and reevaluation is timely.Compared to AC power, the distribution of DC power over DC networks has po-tential to provide several benefits to equipment manufacturers, electricity cus-tomers, electrical systems, and the environment including but not limited to:
• higher power system efficiency because of fewer AC-to-DC, DC-to-AC, orAC-to-AC power conversions in local power systems that include a signifi-cant amount of distributed generation or storage that naturally produce DCpower
• higher reliability in those same systems because fewer power conversionsrequire fewer power electronic components, with fewer potential points offailure
• lower capital cost because of fewer power electronic components and poten-tial reductions in conductor cost because DC allows higher current carryingcapability
• a potential for lower control system complexity and higher survivabilitywhen subject to external and internal disturbances because of the elimina-tion of synchronization requirements of AC systems.
• higher power quality and disturbance survivability because of the powerelectronics and (potentially) storage buffer between the DC microgrid andthe AC grid.
7
• “Managed DC” technologies have communications integrated with powerenabling control and configuration capabilities not present with today’s ACtechnology.
The promise of these benefits has spurred several demonstrations of DC networks,especially in data centers and commercial buildings, with some of these demon-strations providing evidence for subsets of the benefits listed above. An excellentsummary of these projects can be found in [6] and the reference contained therein.
Less clear are the added benefits of a DC microgrid, i.e. the aggregation of DCgeneration sources, storage, DC loads, etc., by a DC power distribution networkto form a single controlled grid that provides more benefit than just the gains froma passive DC network.
Scoping Study Objectives The objectives of this study are to describe appli-cations where DC microgrids may have advantages over their AC counterparts,estimate the benefits or drawbacks for these applications, consider how theseapplications could be combined into more comprehensive DC microgrid sys-tems, and estimate the market potential of these conceptual DC microgridsystems. In the discussion of the DC microgrid applications, the total benefits areto be compared to those from traditional AC service or microgrids.
2.1 Terminology
The discussion of the DC microgrid devices and applications will benefit from acommon terminology, which is defined here:
• AC load—An electrical load that interfaces with an AC power system anduses the AC current/voltage directly, e.g., a fixed speed induction motor.
• DC-internal or native-DC load—An electrical load that interfaces with anAC power system but converts the AC current/voltage to DC, which is thenused for powering the device, e.g. the majority of electronic devices, mostcompact fluorescent lighting , and variable speed motor drives.
• Direct-DC load—An electrical load that interfaces with a DC power sys-tem and uses the supplied DC current/voltage directly or may include a
8
DC-to-DC conversion step to obtain an acceptable DC voltage, e.g., light-emitting-diode lighting and DC motors in air conditioning, heat pumps, andrefrigerators.
• DC-to-AC converter/inverter—A power electronics device that converts DCvoltage/current to AC voltage/current compatible with standard AC powersystems.
• DC-to-DC converter—A power electronics device that converts one DCvoltage/current to a different DC voltage/current, e.g., 380 Vdc to 48 Vdc.
• AC-to-DC converter/rectifier—A power electronics device that converts stan-dard AC voltage/current to a DC voltage/current.
• Managed DC—Standard DC technologies that include communications formanaging power distribution within the power cable (over the power wiresor over adjacent wires). The most common examples today are UniversalSerial Bus (USB) and PoE.
• DC Network—A power system that transmits electricity in the form of di-rect current. DC sources and loads are connected to the network eitherdirectly or through DC/DC converters. AC sources and loads are connectedthrough AC/DC converters and DC/AC inverters, respectively. The DC net-work is connected to the AC power system over a bidirectional AC/DC con-verter and it can either withdraw or inject power to the AC grid.
• DC Microgrid—A DC network enhanced with advanced capabilities thatenable control of DC network resources for higher operational performanceand/or the ability to operate independently of the primary AC system forenhanced reliability. For this scoping study, the DC microgrid should havea minimum 100 kW capacity of aggregated source capacity.
• Low Voltage DC—Less than 50 VDC which includes DC applications intelecom, LED lighting, USB, and PoE and in at least one standard underdevelopment [9].
• High Voltage DC—Between 300 and 400 VDC which is consistent withmost power distribution systems in DC data center applications [5] [6] andin at least one standard under development [9]
9
• Utility Voltage DC—Voltages typically used by electrical distribution utili-ties to transmit power from a substation of a customer’s service transformer,e.g. 4-35 kV.
• Firm Generation—Electrical generation that is controllable and dispatch-able such as a Diesel generator, combined heat and power (CHP) genera-tion, or battery storage.
• Non-Firm Generation—Generation that is uncontrolled or has limited con-trollability such as PV or wind generation.
2.2 Metrics For Assessing the Impacts of DC Networks andMicrogrids
Assessing the total impacts (both positive and negative) of a DC microgrid beyonda traditional AC system or AC microgrid requires a common set of metrics. Themetrics considered in this study are introduced below and are discussed in greaterdetail in Section 3.
• Safety and Protection—The ability of the power system to prevent injury topeople and protect equipment from damage
• Reliability—AC power system reliability is typically measured using met-rics such as System Average Interruption Duration Index (SAIDI) and Sys-tem Average Interruption Frequency Index (SAIFI) [10] that measure thecustomer-averaged outage duration and interruption frequency, respectively.This study reinterprets these metrics with a focus on the reliability of powersupplied to individual loads or load classes within microgrids.
• Capital Costs—Total equipment and installation costs for the microgrid asincurred by the owner of the microgrid. The distribution utility that servesa DC microgrid may also see capital cost benefits. However, it is not clearhow the microgrid owner could monetize these benefits, and these benefitsto the greater system are not considered here.
• Energy Efficiency—Measured at the system level, the total input electricityrequired to serve an end use function. For the ownership model considered
10

in this study, the system boundary is at the micrgrid to local grid interface.1
• Operating Costs—Present value of total variable cost (primarily energy use,but also including ancillary revenue streams, maintenance, etc) for a powersystem to serve an end use function.
• Engineering Costs—Site specific engineering costs to integrate the compo-nents of the microgrid with each other and the microgrid to the surroundingpower systems.
• Environmental Impact—The total CO2 emissions produced by marginalelectricity generator used to deliver the net electrical needs at the interfaceof the microgrid and the local power system.
• Power Quality—The ability of a AC or DC microgrid to stay within its re-spective Computer Business Equipment Manufactures Association (CBEMA)/InformationTechnology Industry Council (ITIC) curve for a given type of disturbance.
• Resilience—Ability to serve electrical load when the main AC grid is un-available for extended periods of time, e.g. for typical multi-day outagetimes following major natural disasters such as hurricanes or earthquakes[11]
We note that, in several cases, there is insufficient data or analysis availableto provide a quantitative assessment of these metrics. In these cases, a qualitativeassessment is given if there appears to be a clear advantage of a DC microgridover a traditional AC system or AC microgrid.
2.3 Microgrid Reference Architectures
The DC microgrid applications proposed in Section 5 are only a subset of thepossible applications, and each of the proposed applications could utilize severaldifferent architectures. Prior to analyzing these applications in detail, Section 3analyzes the representative generic architectures in Figure 2.1 absent a specificapplication, which provides a foundation for the analysis of specific applicationsin Section 5.
1Note that this study does not include some of well known energy efficiency effects, e.g. thereduction in air conditioning load because of higher end use efficiency, because of the assumptionsmade about the use of DC-internal loads in AC microgrids.
11
PV+MPPT
Grid
AC
DCBattery
a) AC Network:
c) AC Microgrid, PV + Storage:
b) DC Network:
d) DC Microgrid, PV + Storage:
PV+MPPT
DC
DCBattery
PV + MPPT
AC
DC
PV+MPPT
Grid
DC
DC
DCAC
Grid
DCAC
Small LoadDCDC
Small LoadDCDC
Big Load
Small LoadDCDC
Small LoadDCDC
Big Load
Small LoadDCAC
Small LoadDCAC
Big Load
DCAC
Grid Firm generation
e) AC Microgrid, firm generation: f) DC Microgrid, firm generation:
Firm generation
ACDC
Grid
Small LoadDCDC
Small LoadDCDC
Big Load
DCDC
DC DC
DCAC
DC DC
480V
120V
Grid
Small LoadDCAC
Small LoadDCAC
Big Load
DCAC
480V
120V
Small LoadDCAC
Small LoadDCAC
Big Load
DCAC
480V
120V
150% Import100% Export
100% Import 0% Export
DCAC100% Import 0% Export
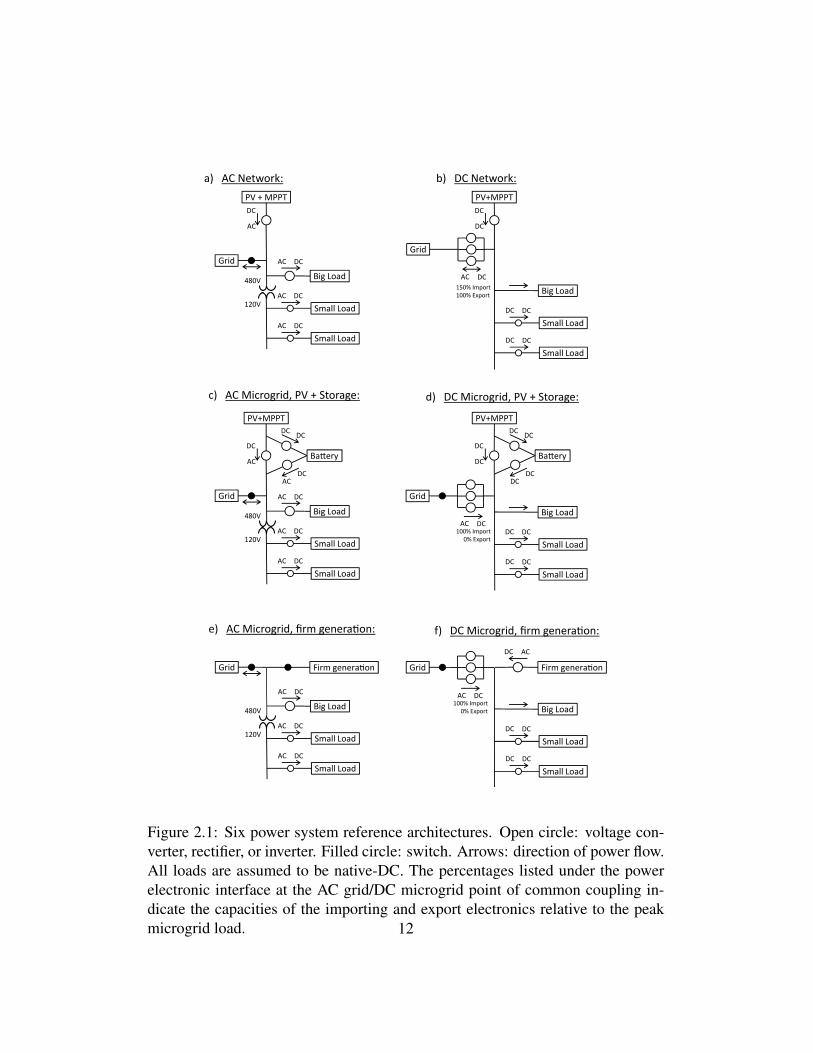
Figure 2.1: Six power system reference architectures. Open circle: voltage con-verter, rectifier, or inverter. Filled circle: switch. Arrows: direction of power flow.All loads are assumed to be native-DC. The percentages listed under the powerelectronic interface at the AC grid/DC microgrid point of common coupling in-dicate the capacities of the importing and export electronics relative to the peakmicrogrid load. 12

Figure 2.1 displays schematics for the six different power system referencearchitectures considered here in this work.2 We note that these architectures arevery similar to those used in [7] . There are some common architectural assump-tions shared by these different reference architectures (which should be revisitedfor each application in Section 5):
• At a minimum power level of 100 kW, the AC systems will likely be threephase power systems, and the analysis of the architectures in Figure 2.1 willassume a three-phase configuration. The DC systems could be unipolar orbipolar, however, at these power levels, the main wiring is expected to bebipolar.
• The microgrids are connected to the AC power grid at a 480V/277Y voltagelevel appropriate for a 100 kW load center.
• Both the AC and DC microgrid systems include a switch at the point ofcommon coupling (PCC) to disconnect the microgrid from the AC grid.
• Other studies [4][6] have concluded that the conversion from AC loads toDC-native or DC-internal loads provides significant energy efficiency bene-fits. To ensure that the comparison of AC and DC systems in this study is notbiased by the use of these higher efficiency loads in DC systems, we assumethat all loads are native-DC, and the AC systems will require an AC-to-DCconversion step. Under this assumption, the losses at the loads are very sim-ilar, eliminating energy efficiency gains due to secondary effects like lowerthermal loading on air conditioning.
• The DC-native loads are split into two categories—“Big Loads” that operateoff of a nominal DC bus voltage of 380 V and “Small Loads” that operateoff of a nominal 24 or 48 V. For the purposes of the estimates in this study,we will assume a 50/50 split between the Big and Small load classes.
• In the AC microgrid, a 75 kVA transformer is included to reduce the voltagefrom 480V to 120V before serving the “Small Loads”.
2We note that these reference architectures are not intended to represent a power system servingthe compute load of a large data center because this application is already well addressed byseveral industry demonstrations. These demonstrations and one controlled laboratory study byLawrence Berkeley National Laboratory have demonstrated the energy efficiency benefits andpotential reliability benefits of a DC power system for this application. A summary of thesedemonstrations can be found in [6] and citations therein.
13
• In the AC and DC microgrids with PV generation and battery storage, thebattery system is assumed to be integrated with the PV system. In Fig-ure 2.1, the three converters in this integrated subsystem are often lumpedtogether as a “charge controller”. Here, we split these out to account sepa-rately for losses in each conversion.
• We note that an equally valid architecture would interface the PV and bat-tery subsystems separately enabling the battery to charge directly from themicrogrid bus adding more flexibility to the operations. The main changeto the analysis discussed later in this report is a minor shift in the roundtrip efficiency for battery charging/discharging (1% lower round trip effi-ciency for the AC architecture). This minor difference does not change theconclusions of the analysis of the generalized architectures.
• For the AC microgrids without firm generation, the DC-AC inverter on thestorage or PV will have to be an “off-grid” inverter capable of supplying thereactive power needs of the microgrid and capable of regulating this reactivepower to control voltage while islanded. The firm generation is assumed tobe synchronous generation and capable of reactive power support.
The sizing of the sources in Fig. 2.1 is independent of the architecture andwill likely depend on the specific application under consideration. We note thatthese sizing assumptions directly affect capital cost of the component being sizedand can indirectly affect sizing and capital cost of the other components. The ef-fects on economic performance are important and should be investigated in muchmore detail in follow on work. Here, we discuss a few assumptions and issuessurrounding the sizing used in the analysis of the generic architectures in Fig. 2.1:
• The AC and DC networks and microgrids may include distributed PV gen-eration. For the purposes of the simplified analysis in this study, the dailyenergy output of the PV generation is assumed to be matched to the dailyenergy consumed by the loads.
• Instead of PV generation, the architectures could also include wind genera-tion or other forms of intermittent generation. However, under the assump-tions above, this modification would not materially change the outcome ofthis simplified analysis.3
3However, the effects of the change in the daily and annual generation profile from differentmixes of intermittent renewable generation requires detailed study in follow on work.
14
• The AC and DC microgrids may include some form of firm generation thatis fully dispatchable and is not energy limited. For the purposes of thissimplified analysis, the firm generation is sized so that it can supply thepeak load in the microgrid.4
• The AC and DC microgrids with PV generation also include battery storage.For the purposes of the simplified analysis in this study, the storage energyis sized so that it can meet the daily energy consumed by the loads, andthe storage power is sized to meet the peak load in the microgrid. Thisassumption enables the microgrids to serve their loads even during extendedoutages, such as those implied by the resilience metric of Section 2.2, whenavailability of PV or wind generation becomes suspect.
• For DC microgrids, the sizing of the bi-directional converter/inverter inter-face to the AC power system, when coupled to the sizing of the other micro-grid components, is critical to the microgrid reliability. Here, we considerarchitectures in Figs. 2.1b), d), and f) separately:
– DC Network (Fig. 2.1b)—The “failure” of the PV system to producesufficient power and energy to support the network loads is far morelikely than an N-1 failure. During these times, the DC Network iscompletely dependent on imports from the AC system and the AC-DCconverter must be able to withstand a single failure at this interface.Therefore, the AC-DC import power electronics must be composed ofat least three separate devices each sized to supply one-half of the totalload in the system. The sizing of the DC-AC export power electronicswill depend on the overlap of the PV generation and network load –ranging from zero capacity for perfectly matched generation and loadto full PV capacity (i.e. the DC Network load) for completely disjointgeneration and load.
– DC Microgrid, PV+Storage (Fig. 2.1d)—The addition of storage (sizedas discussed above) to the PV generation provides a significant reduc-tion in the likelihood that the combined system will not meet the powerand energy requirements of the microgrid load. Oversimplifying, weassume that the loss of the PV+Battery system now constitutes an N-1 failure. Therefore, the AC-DC import capacity can be reduced to
4For the “firm generation” architecture in Fig. 2.1e) and f), this assumption does not requireadditional investigation. However, if the firm generation is mixed with other sources, e.g. inter-mittent PV or wind, further investigation of the sizing is warranted.
15

100% of the microgrid load as opposed to 150% of the microgrid load.The presence of the battery now enables the PV generation to be man-aged so that exports to the AC system through the DC-AC interfaceare likely not required, and we eliminate these components here.
– DC Microgrid, firm generation (Fig. 2.1f)—The failure of the firmgeneration constitutes and N-1 failure, so like the PV+Storage case,the AC-DC import capacity is set to 100% of the microgrid load. De-termining the DC-AC export capacity is difficult because the reasonsfor running the firm generation may go beyond the need for electricalpower in the microgrid, e.g. if the firm generation is CHP and the ther-mal loads do not overlap with electrical loads. However, to simplifythe analysis, we set the export capacity to zero like in the PV+Batterycase.
2.4 Operating Modes and Load Profiles
The total power lost in the conversions depends on the energy5 that passes throughthe different devices which in turn depends on the relative timing of the microgridgeneration and load [7]. Two extreme “corner cases” are considered here: 1)perfectly matched generation and load profiles and 2) generation and load profilesthat are completely disjoint. Load and generation profiles that fall between thesetwo extremes can be analyzed by taking linear combinations of these two results.In the disjoint case, we assume the battery and firm generation (when present) arecontrolled so that power flow back to the AC grid is eliminated and no DC-ACpower conversion (or capital cost of this equipment) is required.
5The efficiency of the power conversions depends on the fractional loading of the devices. Thiseffect has been accounted for in detailed simulation and analysis of AC and DC architectures [7].This study considers a simplified setting where the power conversion devices are always operatingnear to their peak efficiency so that the total losses can be based only on energy exchanges. Thisscoping study recommends a more detailed follow-on study accounts for realistic load and gener-ation profiles as well as realistic part-load efficiency curves for the power electronic conversions.
16
3. Analysis of Microgrid MetricsBefore considering specific DC microgrid applications in Section 5, we first an-alyze the metrics of Section 2.2 using the reference architectures of Section 2.3.The applications in Section 5 can be analyzed relative to these reference architec-tures.
3.1 Safety and Protection
Low voltage DC The safety of people around and the protection of equipmentwithin a DC microgrid is crucial to its success. These properties are also depen-dent on the voltages used in the DC microgrid. The EMerge Alliance standard foroccupied spaces [9] specifies 24V for final distribution of power to lighting andother low-power devices. When individual 24V DC circuits are limited to 100VA,they qualify as Class 2 and are considered intrinsically safe from shock or firehazard [12]. At a somewhat higher voltage, the telecom industry has used 48VDC systems for many years. In either case, there do not appear to be any signifi-cant unresolved issues regarding safety and protection for distribution of power atthese voltages.
High voltage DC To reduce loss and serve larger loads, many of the data centerdemonstrations utilize a higher voltage DC distribution in the range of 350-400V, with 380 V being very common [5][6]. For these data center and other generalpurpose applications, several companies supply DC power distribution hardwareincluding circuit breakers [13] with rated currents ranging from 15A to 2500A[14].
The conclusion of the brief review in this Section is that safety and protec-tion metric does not provide a significant advantage to AC or DC microgrids.Therefore, for the purposes of this study, the ”Safety and Protection” metric fromSection 2.2 is not a major distinguishing factor in the applications in Section 5,unless an unusual system configuration arises.
3.2 Reliability
Data on the reliability of directly comparable AC and DC systems is rather sparse,but for the case of large data centers, there are studies [5] that report several orderof magnitude increases in reliability of DC-powered data centers as comparedto AC-powered data centers. However, the reasons identified for the increase
17
in reliability are all data center specific except for one—reduction in the overallpower electronic component count and/or the reduction in the number of powerelectronic conversion steps [5, 6]. This study evaluates reliability from the samepoint of view.
If we consider the architectures in Figure 2.1 and compare the AC systemswith their DC counterparts, we find three primary differences:
• The DC systems require large power electronic devices at their interface tothe AC grid. In the architectures of Fig. 2.1, these devices (for both importand export) have been appropriately sized in coordination with the otherenergy resources in the microgrid to ensure that these architectures have anN-1 reliability nearly the same as their AC counterparts.
• In the PV and battery subsystem, the AC systems have two DC-AC in-verters and one DC-DC converter versus three DC-DC converters in the DCsystem. However, the part count/power conversion step count is the same inthe AC and DC systems
• The firm generation subsystem is assumed to be some form of fuel-drivenrotating generation, e.g. natural gas-fired combined heat and power engine.In this case, the DC system requires an additional AC-DC converter to inter-face the firm generation with the DC bus. For a failure of this converter tocount against the reliability of service to the loads, the DC microgrid wouldhave to be in an N-2 state, i.e. the AC grid has failed and the AC-DC con-verter has failed. The likelihood of such a failure is very low, and we do notcount this against the reliability of the DC microgrid with firm generation.
• For the Big Loads, there is an additional AC-DC converter in the AC system
• For the Small Loads, there is a switch from AC-DC converters in the ACsystems to DC-DC converters in the DC systems. However, this does notchange the part count/power conversion step count.
• Although not a power electronics component or conversion, there is an ex-tra transformer for the AC systems. However, the cost of providing fullredundancy for this transformer is relatively small [15].
From this discussion, we conclude that the main difference in reliability forservice to the loads between the AC and DC systems is the addition of one AC-DC converter for each Big Load in the AC systems. If any of these Big Loads
18
Component Cost EstimateDC-AC grid-tied inverter (100 kW) [16, 17] $0.40/kWDC-AC off-grid inverter (100 kW) [18, 17] $1.60/kW
AC-DC rectifier (100 kW) [19] $0.41/kWDC-DC converter (10 kW) [20] $0.35/kW
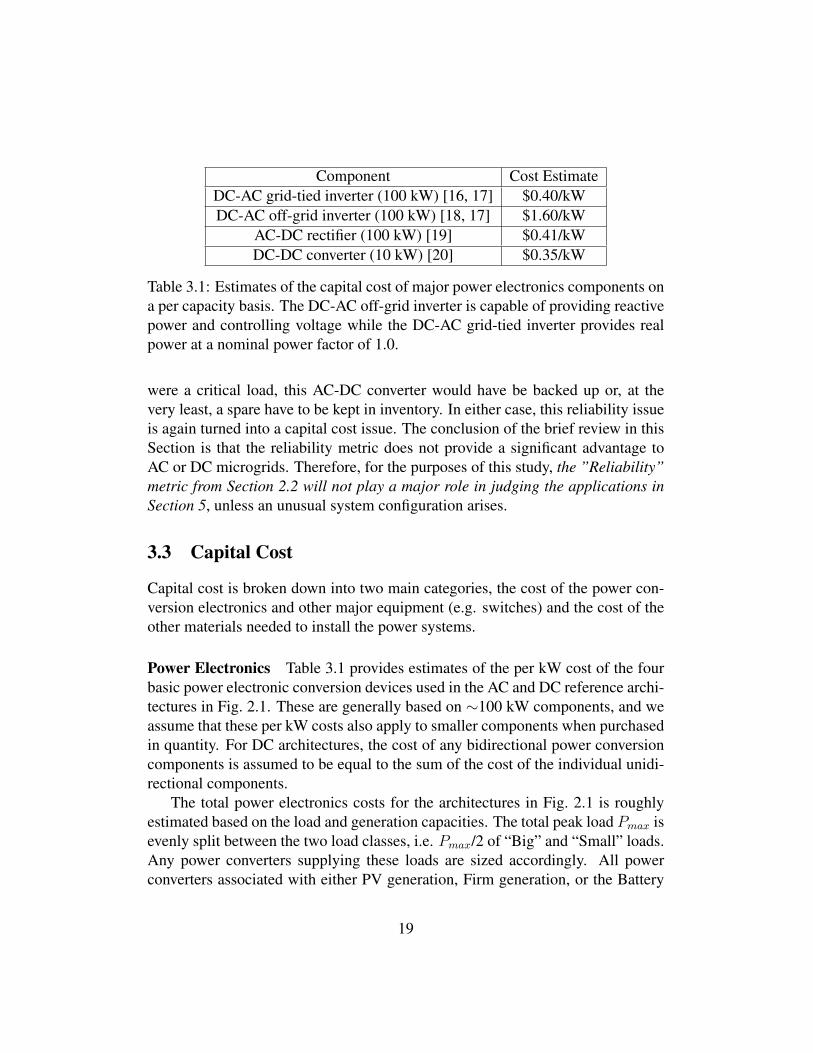
Table 3.1: Estimates of the capital cost of major power electronics components ona per capacity basis. The DC-AC off-grid inverter is capable of providing reactivepower and controlling voltage while the DC-AC grid-tied inverter provides realpower at a nominal power factor of 1.0.
were a critical load, this AC-DC converter would have be backed up or, at thevery least, a spare have to be kept in inventory. In either case, this reliability issueis again turned into a capital cost issue. The conclusion of the brief review in thisSection is that the reliability metric does not provide a significant advantage toAC or DC microgrids. Therefore, for the purposes of this study, the ”Reliability”metric from Section 2.2 will not play a major role in judging the applications inSection 5, unless an unusual system configuration arises.
3.3 Capital Cost
Capital cost is broken down into two main categories, the cost of the power con-version electronics and other major equipment (e.g. switches) and the cost of theother materials needed to install the power systems.
Power Electronics Table 3.1 provides estimates of the per kW cost of the fourbasic power electronic conversion devices used in the AC and DC reference archi-tectures in Fig. 2.1. These are generally based on ∼100 kW components, and weassume that these per kW costs also apply to smaller components when purchasedin quantity. For DC architectures, the cost of any bidirectional power conversioncomponents is assumed to be equal to the sum of the cost of the individual unidi-rectional components.
The total power electronics costs for the architectures in Fig. 2.1 is roughlyestimated based on the load and generation capacities. The total peak load Pmax isevenly split between the two load classes, i.e. Pmax/2 of “Big” and “Small” loads.Any power converters supplying these loads are sized accordingly. All powerconverters associated with either PV generation, Firm generation, or the Battery
19
Architecture AC Power Elec. Cost DC Power Elec. CostNetwork $81,000 $154,000
PV + Storage $276,000 $163,500Firm generation $41,000 $99,500
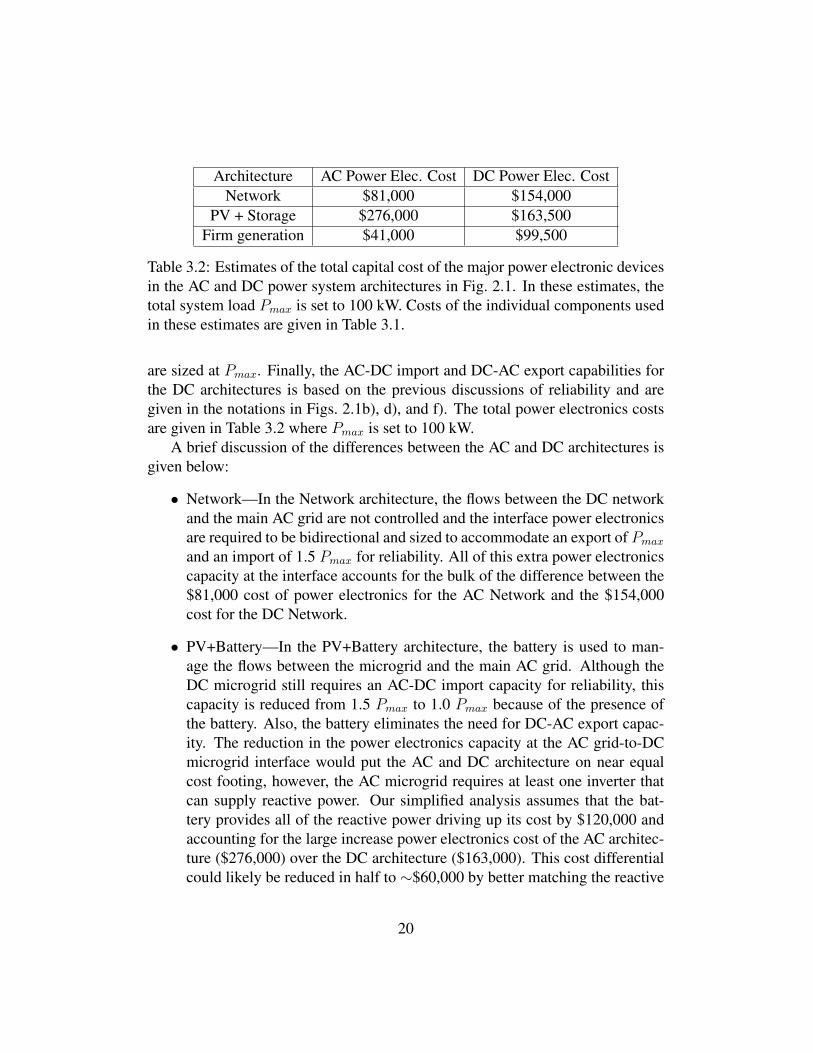
Table 3.2: Estimates of the total capital cost of the major power electronic devicesin the AC and DC power system architectures in Fig. 2.1. In these estimates, thetotal system load Pmax is set to 100 kW. Costs of the individual components usedin these estimates are given in Table 3.1.
are sized at Pmax. Finally, the AC-DC import and DC-AC export capabilities forthe DC architectures is based on the previous discussions of reliability and aregiven in the notations in Figs. 2.1b), d), and f). The total power electronics costsare given in Table 3.2 where Pmax is set to 100 kW.
A brief discussion of the differences between the AC and DC architectures isgiven below:
• Network—In the Network architecture, the flows between the DC networkand the main AC grid are not controlled and the interface power electronicsare required to be bidirectional and sized to accommodate an export of Pmax
and an import of 1.5 Pmax for reliability. All of this extra power electronicscapacity at the interface accounts for the bulk of the difference between the$81,000 cost of power electronics for the AC Network and the $154,000cost for the DC Network.
• PV+Battery—In the PV+Battery architecture, the battery is used to man-age the flows between the microgrid and the main AC grid. Although theDC microgrid still requires an AC-DC import capacity for reliability, thiscapacity is reduced from 1.5 Pmax to 1.0 Pmax because of the presence ofthe battery. Also, the battery eliminates the need for DC-AC export capac-ity. The reduction in the power electronics capacity at the AC grid-to-DCmicrogrid interface would put the AC and DC architecture on near equalcost footing, however, the AC microgrid requires at least one inverter thatcan supply reactive power. Our simplified analysis assumes that the bat-tery provides all of the reactive power driving up its cost by $120,000 andaccounting for the large increase power electronics cost of the AC architec-ture ($276,000) over the DC architecture ($163,000). This cost differentialcould likely be reduced in half to ∼$60,000 by better matching the reactive
20
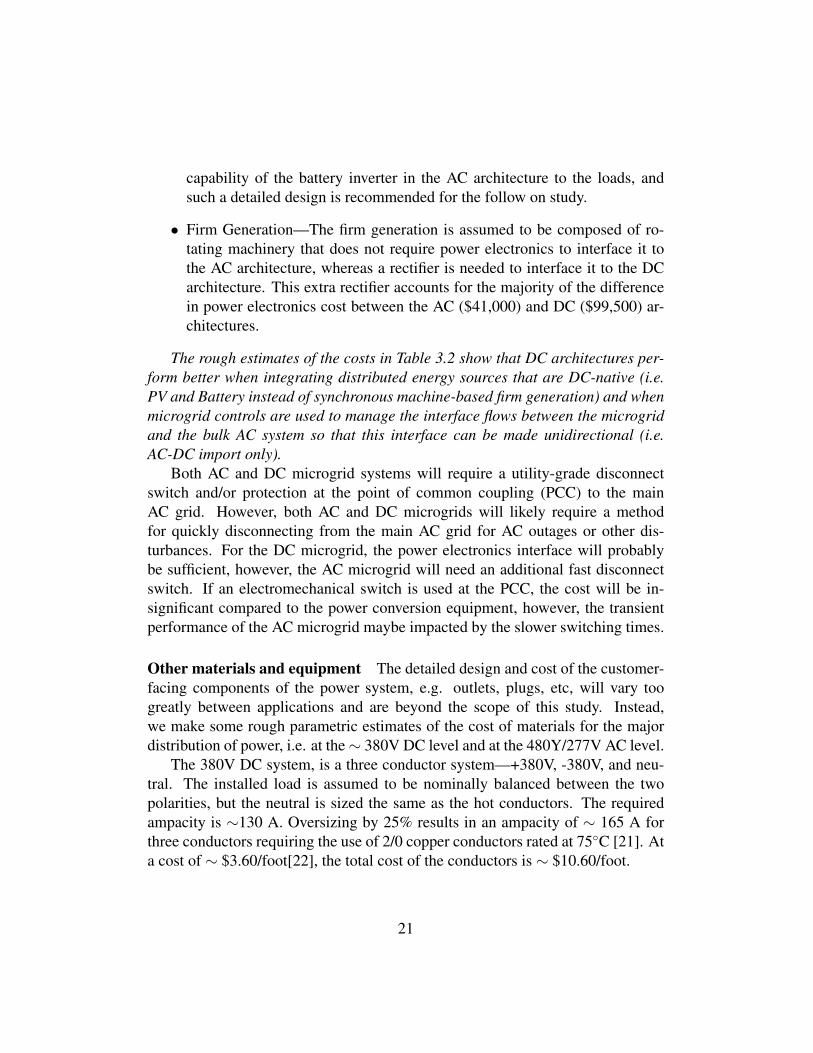
capability of the battery inverter in the AC architecture to the loads, andsuch a detailed design is recommended for the follow on study.
• Firm Generation—The firm generation is assumed to be composed of ro-tating machinery that does not require power electronics to interface it tothe AC architecture, whereas a rectifier is needed to interface it to the DCarchitecture. This extra rectifier accounts for the majority of the differencein power electronics cost between the AC ($41,000) and DC ($99,500) ar-chitectures.
The rough estimates of the costs in Table 3.2 show that DC architectures per-form better when integrating distributed energy sources that are DC-native (i.e.PV and Battery instead of synchronous machine-based firm generation) and whenmicrogrid controls are used to manage the interface flows between the microgridand the bulk AC system so that this interface can be made unidirectional (i.e.AC-DC import only).
Both AC and DC microgrid systems will require a utility-grade disconnectswitch and/or protection at the point of common coupling (PCC) to the mainAC grid. However, both AC and DC microgrids will likely require a methodfor quickly disconnecting from the main AC grid for AC outages or other dis-turbances. For the DC microgrid, the power electronics interface will probablybe sufficient, however, the AC microgrid will need an additional fast disconnectswitch. If an electromechanical switch is used at the PCC, the cost will be in-significant compared to the power conversion equipment, however, the transientperformance of the AC microgrid maybe impacted by the slower switching times.
Other materials and equipment The detailed design and cost of the customer-facing components of the power system, e.g. outlets, plugs, etc, will vary toogreatly between applications and are beyond the scope of this study. Instead,we make some rough parametric estimates of the cost of materials for the majordistribution of power, i.e. at the ∼ 380V DC level and at the 480Y/277V AC level.
The 380V DC system, is a three conductor system—+380V, -380V, and neu-tral. The installed load is assumed to be nominally balanced between the twopolarities, but the neutral is sized the same as the hot conductors. The requiredampacity is ∼130 A. Oversizing by 25% results in an ampacity of ∼ 165 A forthree conductors requiring the use of 2/0 copper conductors rated at 75◦C [21]. Ata cost of ∼ $3.60/foot[22], the total cost of the conductors is ∼ $10.60/foot.
21
The 480Y/277V AC system is a four conductor system—three phase conduc-tors at 277 V relative to the neutral conductor. The installed load is again nomi-nally balanced between the three phases, and the neutral is again sized the sameas the phase conductors. In contrast to the DC system, we must account for theflow of reactive power due to a power factor (PF) less than 1.0. After oversizingby 25%, the required ampacity as a function of PF is ∼ (150 A)/PF. The AC archi-tectures in Fig. 2.1 include native-DC loads, therefore their reactive power needsfrom the main AC bus is expected to be rather low. Using a power factor of 0.8,the required ampacity is ∼ 190 A requiring the use of 3/0 copper conductors ratedat 75◦C [21]. At a cost of ∼ $4.56/foot [22], the total cost of the four conductorsis ∼ $18.25/foot.
Because of the reactive power requirement, voltage level, and conductor con-figuration, the conductor cost in the AC system is estimated to be ∼ $8/foot higherthan in the DC system. The length of the conductor runs is very system depen-dent. Using 2000 feet as a nominal length, the cost reduction in the DC systemis $16,000—a reduction that is not expected to dominate the comparison of ACversus DC architectures.
3.4 Energy Efficiency
In Section 2.3, the different architectures in Fig. 2.1 were put on an equal footingby populating them with the similar energy efficient loads, i.e. native-DC loads forthe AC system and direct-DC loads for the DC system [4]. This assumption wasmade to focus on the difference between AC and DC architectures without biasingthe results by an independent choice of the type of loads to install. Conductorlosses are another source of losses that could distinguish AC and DC systems,however, the sizing of the copper conductors in the previous Section was doneusing the same methodology for the AC and DC systems and included the effectsof power factor in the AC system. Therefore, we expect similar losses in the ACand DC systems.
Under these load and conductor choices, the power electronics-based conver-sions (including those required by the use of internal-DC loads) and AC trans-formers are the remaining major sources of power loss in both the AC and DCreference architectures and form the basis for the analysis of the relative energyefficiencies of these architectures. The device efficiencies used in this study aregiven in Table 3.3 and nominally correspond to the peak-load efficiencies.1 Ta-
1The use of peak-load efficiency rather than an efficiency-load curve biases the results of this
22

InputVoltage
OutputVoltage
Power Sym-bol
Value Used For
DC High DC High High eDC−DC 0.976 MPPT, Chargecontroller
DC High DC Low Low esl,DC 0.960 DC bus to small loadsDC High AC High High eDC−AC 0.976 Battery or PV to AC
bus,AC High DC High High eAC−DC 0.965 AC bus to large DC
loadsAC High AC Low High eAC−AC 0.985 AC 480V-120V
transformerAC High DC Low Low esl,AC 0.950 AC bus to small DC
loads
Table 3.3: Representative peak-load conversion efficiencies of individual powerelectronic devices in the architectures of Fig. 2.1. Justification of these efficienciesis provided the Appendix and is based on [23, 24, 25, 26, 27]
ble 3.4 also provides the efficiency of composite functions or multi-step processuseful in subsequent analysis. The basis for the values in Tables 3.3 and 3.4 areprovided in the Appendix.
3.4.1 Operating Modes and Load Profiles
The operating modes and temporal relationship between the microgrid generationand load determine the energy flow through the power conversion devices in thearchitectures of Fig. 2.1. The assumptions made regarding these modes and pro-files were given in Sec. 2.4. However, these are crucial to the estimation of systemenergy efficiency and are repeated here.
The total power lost in the conversions depends on the energy2 that passesthrough the different devices which in turn depends on the relative timing of the
analysis to higher efficiency, however, the differences in the efficiency curves between the powerelectronic conversion devices are what will bias the results toward AC or DC architectures. Tofully account for these effects, a more detailed follow-on study is recommended.
2The efficiency of the power conversions depends on the fractional loading of the devices. Thiseffect has been accounted for in detailed simulation and analysis of AC and DC architectures [7].This study considers a simplified setting where the power conversion devices are always operatingnear to their peak efficiency so that the total losses can be based only on energy exchanges.
23
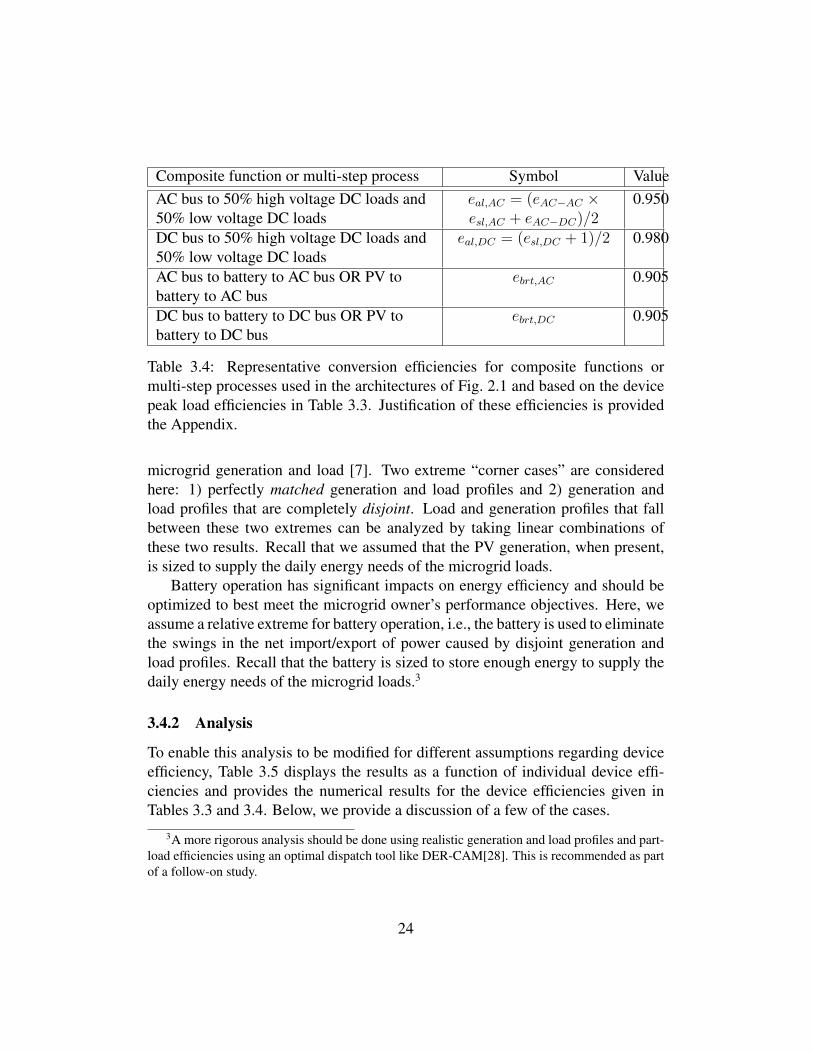
Composite function or multi-step process Symbol ValueAC bus to 50% high voltage DC loads and50% low voltage DC loads
eal,AC = (eAC−AC ×esl,AC + eAC−DC)/2
0.950
DC bus to 50% high voltage DC loads and50% low voltage DC loads
eal,DC = (esl,DC + 1)/2 0.980
AC bus to battery to AC bus OR PV tobattery to AC bus
ebrt,AC 0.905
DC bus to battery to DC bus OR PV tobattery to DC bus
ebrt,DC 0.905
Table 3.4: Representative conversion efficiencies for composite functions ormulti-step processes used in the architectures of Fig. 2.1 and based on the devicepeak load efficiencies in Table 3.3. Justification of these efficiencies is providedthe Appendix.
microgrid generation and load [7]. Two extreme “corner cases” are consideredhere: 1) perfectly matched generation and load profiles and 2) generation andload profiles that are completely disjoint. Load and generation profiles that fallbetween these two extremes can be analyzed by taking linear combinations ofthese two results. Recall that we assumed that the PV generation, when present,is sized to supply the daily energy needs of the microgrid loads.
Battery operation has significant impacts on energy efficiency and should beoptimized to best meet the microgrid owner’s performance objectives. Here, weassume a relative extreme for battery operation, i.e., the battery is used to eliminatethe swings in the net import/export of power caused by disjoint generation andload profiles. Recall that the battery is sized to store enough energy to supply thedaily energy needs of the microgrid loads.3
3.4.2 Analysis
To enable this analysis to be modified for different assumptions regarding deviceefficiency, Table 3.5 displays the results as a function of individual device effi-ciencies and provides the numerical results for the device efficiencies given inTables 3.3 and 3.4. Below, we provide a discussion of a few of the cases.
3A more rigorous analysis should be done using realistic generation and load profiles and part-load efficiencies using an optimal dispatch tool like DER-CAM[28]. This is recommended as partof a follow-on study.
24
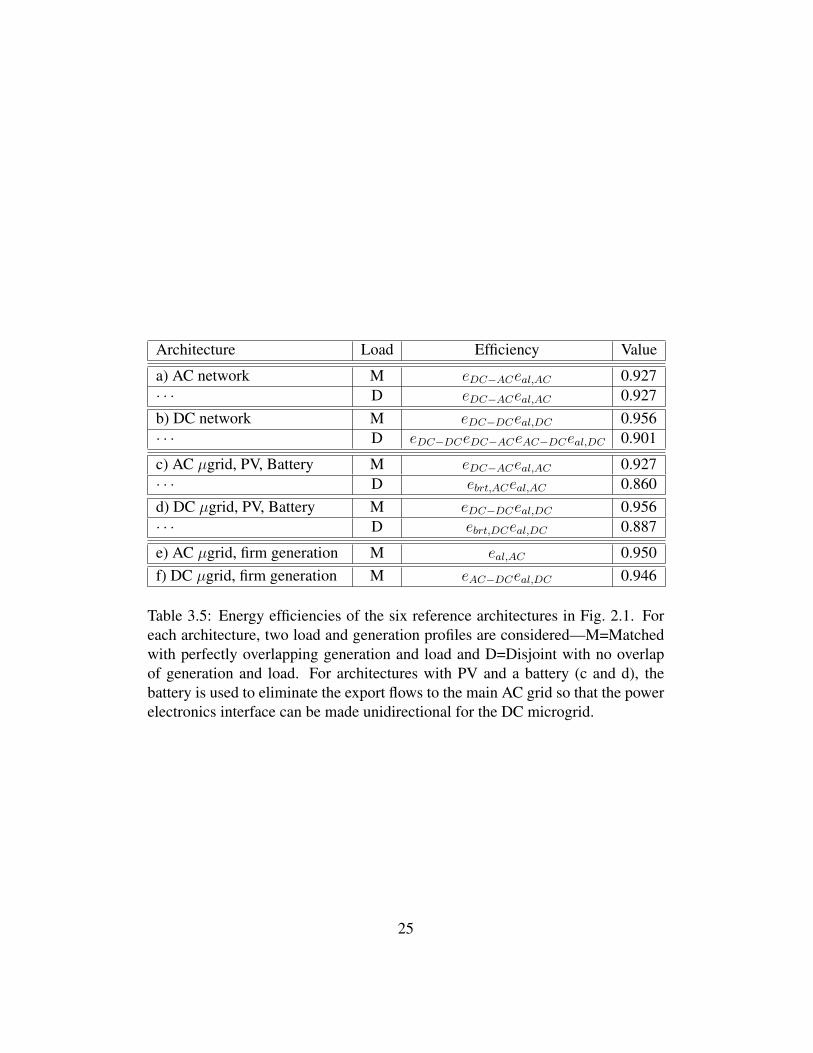
Architecture Load Efficiency Value
a) AC network M eDC−ACeal,AC 0.927· · · D eDC−ACeal,AC 0.927b) DC network M eDC−DCeal,DC 0.956· · · D eDC−DCeDC−ACeAC−DCeal,DC 0.901
c) AC µgrid, PV, Battery M eDC−ACeal,AC 0.927· · · D ebrt,ACeal,AC 0.860d) DC µgrid, PV, Battery M eDC−DCeal,DC 0.956· · · D ebrt,DCeal,DC 0.887
e) AC µgrid, firm generation M eal,AC 0.950f) DC µgrid, firm generation M eAC−DCeal,DC 0.946
Table 3.5: Energy efficiencies of the six reference architectures in Fig. 2.1. Foreach architecture, two load and generation profiles are considered—M=Matchedwith perfectly overlapping generation and load and D=Disjoint with no overlapof generation and load. For architectures with PV and a battery (c and d), thebattery is used to eliminate the export flows to the main AC grid so that the powerelectronics interface can be made unidirectional for the DC microgrid.
25
AC Network In an AC network, the AC grid acts like a 100% efficient storagesystem, and the timing of the PV generation relative to the load does not matter.In either the Matched or Disjoint case, the composite efficiency is the product ofthe efficiency of delivering power from the PV’s DC bus to the AC bus times theefficiency of delivering power from the AC bus to the aggregate DC internal loads,i.e. eDC−ACeal,AC = 0.976 X 0.950 = 0.927.
DC Network In the DC network, the bidirectional inverter/converter imposes around trip efficiency for exchanges with the AC grid equal to eDC−ACeAC−DC =0.976 X 0.965 = 0.942. For the Matched case, this round trip exchange is avoided,and composite efficiency is the product of the efficiency of delivering power fromthe PV’s DC bus to the main DC bus times the efficiency of delivering power fromthe main DC bus to the aggregate native DC loads, i.e. eDC−DCeal,DC = 0.976 X0.980 = 0.956. Avoiding the extra power conversion for the high-voltage, native-DC loads improves the overall efficiency. For the Disjoint case, the energy makesa round trip through the bidirectional inverter/converter lowering the efficiency toeDC−DCeal,DC X eDC−ACeAC−DC = 0.956 X 0.942 = 0.901.
Comparison of AC and DC Networks For this study, a Network is a powersystem that is not managed in any way to improve its economic or technical per-formance. Therefore, whether the load and generation are matched or disjoint isdependent on the existing load profiles rather than, e.g., active load management.If the load and generation are not well matched, a DC network will have an effi-ciency that is ∼ 2-3% lower than a comparable AC network. On the other hand,if the load and generation profiles happen to be matched, then the DC networkenjoys a ∼ 2-3% efficiency advantage.
AC Microgrid + PV + Battery When generation and load are already Matchedand there is no reason to charge or discharge the battery, the energy flows are thesame as in the AC network, and the efficiencies are also the same, i.e. eDC−ACeal,AC
= 0.976 X 0.950 = 0.927. In the Disjoint case, the battery must absorb all of the en-ergy from the PV system and then deliver that energy to the aggregate DC-internalloads at a later time. The efficiency of this two-step process is ebrt,ACeal,AC =0.905 X 0.950 = 0.860. As expected, the use of storage to manage the net flow ofpower leads to significant losses in the round trip through the battery.
26
DC Microgrid + PV + Battery With the same battery operating paradigm asfor the AC microgrid, similar logic can be applied to determine the efficiencies ofthe DC microgrid. In the Matched case, the battery is not charged or discharged,and the operation and efficiencies are the same as the DC network under Matchedload, i.e. eDC−DCeal,DC = 0.976 X 0.980 = 0.956. In the Disjoint case, the batterymust absorb all of the energy from the PV system and then deliver that energyto the aggregate DC internal loads at a later time. The efficiency of this two-step process is ebrt,DCeal,DC = 0.905 X 0.980 = 0.887. As expected, the use ofstorage to manage the net flow of power leads to significant losses in the roundtrip through the battery.
Comparison of AC and DC Microgrids With PV + Battery The addition ofthe battery enables the management of power flows and the elimination of powerflows though the lossy power electronic interface between the DC microgrid andthe main AC grid. With this management, the DC microgrid is able to retain its∼ 2-3% efficiency advantage over the the AC microgrid for both Matched andDisjoint generation/load profiles. Although the DC microgrid architecture canperform better than the AC microgrid architecture, both the AC and DC microgridarchitectures perform significantly worse when the battery is used in day-to-dayoperations to manage power flows locally.
AC Microgrid With Firm Generation The inclusion of firm generation com-plicates the analysis of the architecture efficiency because the efficiency of thegenerator can depend strongly on loading and speed. In fact, at least one manu-facturer uses an AC-to-DC-to-AC converter to allow more flexible prime moveroperation to reduce the emissions below regulatory levels [29]. In this generationunit, the prime mover’s energy efficiency is also improved which helps to offsetsome of the losses incurred in the multiple power conversion steps. Here, we willneglect these issues, assume the generator is run to cover microgrid loads, andfocus on the power conversion steps themselves. In the AC architecture, the elec-trical losses are from the conversion of power from the AC bus to the DC internalloads, i.e. eal,AC = 0.950.
DC Microgrid With Firm Generation Similar logic applies to the DC archi-tecture, but the power from the generator passes through an AC-DC conversionstep to get to the DC bus, but can then be used directly by the 50% of the nativeDC loads at high voltage, i.e. eAC−DCeal,DC = 0.965 X 0.980 = 0.946.
27
Comparison of AC and DC Microgrids With Firm Generation Althoughthere is a difference in efficiency of these two architectures, the uncertainty sur-rounding the effect of the architecture on prime mover efficiency is too large todraw any firm conclusions.
3.5 Operating Costs
A microgrid can reduce its net operating costs in three ways: 1) improvementsin energy efficiency reduces net energy imports, 2) the time of energy importscan be modified to reduce costs against a time-of-use tariff, demand charge, orother time-dependent energy billing, and 3) the microgrid collects revenue bysupplying ancillary services to the AC grid. With respect to supplying ancillaryservices, there is no fundamental difference between an AC and DC architecture.In the DC architecture, the ancillary services are supplied from a single powerelectronics interface, but just like and AC architecture, providing these servicesrequires coordination of multiple assets inside the microgrid.
In the context of this idealized study of generic architectures, the two managedmicrogrid systems (whether AC or DC architectures) are using microgrid genera-tion and storage to reduce power imports from the main AC grid to zero so that themicrogrid’s energy and demand charges are zero. Our assumptions do not allowthe ∼ 2-3% energy efficiency advantage of DC architecture for PV+Battery accrueas reduced operating costs. Instead, they show up as reduced capital cost becausefewer resources are need to offset the microgrid’s load. In Sec. 3.3, we estimatedthe capital cost of the power electronics components in AC and DC architectures,but did not include the generation or battery resources. A total of 100 kW of PVgeneration at ∼$4/W adds $400,000 to the the capital cost in Sec. 3.3 for bothAC and DC architectures. A 3% reduction in capital cost for the DC architecturecorresponds to a savings of $18,000. This difference could be significant enoughto influence an investment decision, however, it seems relatively small comparedto the larger difference in capital cost of power electronics devices driven by ar-chitectural considerations.
3.6 Engineering Costs
It is anticipated that microgrids will be installed in diverse environments that mayrequire individualized design solutions. Assessing the costs associated with thesedetails is beyond the scope of this generalized analysis, but it may be important for
28
the specific applications in Section 5. Here, we seek to analyze two common func-tionalities and components—control systems and communication systems. Thegoal is not to design these systems, rather, this study seeks to distinguish betweenthe properties of these systems for AC and DC architectures.
3.6.1 Communication Systems
Power Over Ethernet (PoE) [30], Universal Serial Bus (USB)[31], and Power OverHD Type-T (PoH) [32] have all combined communications with the distributionof DC power on the same set of wires at voltages up to ∼ 55 V DC and powersup to 100 W. The use of the same wires is perhaps not that advantageous—anadditional set of wires could be added to AC wiring to enable communicationsin a similar fashion. However, the logical connection between the wires that arecarrying the power and the power consuming device enables a mode of devicediscovery and power and voltage level negotiation [32]. This functionality couldenable an automatically reconfigurable DC microgrid that approaches the plug-and-play capability of today’s computers.
DC Architectures The implementation of these concepts in DC architecturesis not straightforward. Today’s power management capabilities of PoE, USB andPoH rely on a hub-and-spoke network architecture with a single device at the endof each spoke. Such an architecture may not be limiting for the low-voltage (24-48V DC) loads where cable lengths are limited by Ohmic losses. However, the high-voltage networks will certainly incorporate many devices on a single run of cable.The communication protocols used in PoE, USB, and PoH are not applicable inthis architecture. Plug-and-play DC architectures would require the developmentof new protocols that enable device identification and packet routing in this morecomplex network architecture.
AC Architectures If plug-and-play and automated configuration is a highly de-sirable functionality, it could also be built into an AC architecture. For example,a separate set of wires or fiber optic cable could be built directly into normal ACpower cabling. Such an approach would suffer from the same difficulty associatedwith multiple devices on a single cable run, but in a hub-and-spoke network, theidentification procedures could operate in a similar fashion. The lower voltage DCcircuits would ease safety considerations, however, the 380 V DC would presentthe same safety issues as an AC system.
29
Summary Because of restrictions on network architecture, the combined com-munications and power capability of PoE, USB, and PoH are not directly trans-ferable to high power DC microgrid architectures where high voltage (∼380 VDC) is needed. If desired, similar communication capabilities can be built intothe physical layer in AC microgrid architectures. For this high-level analysis, DCarchitectures do not appear to provide a major advantage over AC architecturesfor microgrids with a rating of larger than 100 kW.
3.6.2 Control Systems
Although DC microgrids do not have a power system frequency, their controlsystems can be analyzed in a framework similar to AC microgrids and powersystems. Specifically, the control is separated into two time scales—a fast timescale on the order of milliseconds to a few seconds or even a minute and a slower(∼ minutes) time scale. In analogy with AC power systems, we call control at thefast time scale “primary” and the slower time scale “secondary”.
The “secondary” controls generally use relatively slow communications tomanage generator, storage, and load power for economic considerations and volt-age set points for loss minimization. Other slow functions can also be managed atthe secondary control time scale, e.g. (potentially adaptive) protection settings ordevice status. The implementation of the secondary control is not anticipated tobe significantly different in the AC or DC architectures. In contrast, the primarycontrol responds to fast microgrid transients or other upsets. The required speed ofthe primary response and critical nature of the control makes a communication-based control perhaps less reliable. Below, we discuss the primary control in acommunication-free setting.
AC Architectures AC architectures are able to use frequency to communicatethe system-wide imbalance of real power. After transients settle, the steady-statefrequency is uniform throughout the microgid which enables well-controlled shar-ing of load deviations among the microgrid generation sources (or storage), e.g.by frequency droop control [33]. In addition, certain implementations [33] of thisform of control does not require the communication of microgrid state, i.e. is-landed or grid-connected. These advantages are somewhat tempered by the com-plexity of controlling and stabilizing transients in mixed microgrids, i.e. micro-grids with both rotating generation and inverter-based generation (this architectureis not shown directly in Fig. 2.1, but would be a combination of Fig. 2.1c and e).In these mixed systems, the components may have very different response speeds
30
creating very different transient dynamics depending on the location of a fault orother disturbance. These non-uniform device responses complicate the design ofcontrol and protection systems in mixed microgrids. AC-DC-AC power electronicinterfaces have been developed to simplify the integration of rotating generationwith inverter-based generation [29], but this begins to look much like a DC archi-tecture raising the possibility that a DC architecture would be more advantageous.
DC Architectures In a DC architecture, voltage replaces frequency as the phys-ical variable that can be used to communicate the imbalance of generation andload at the “primary” control time scale [34]. As opposed to frequency in ACarchitectures, voltage in DC architectures is a “local” variable, i.e. the droop ofvoltage depends on the location of the change in load relative to the location ofgeneration and the measurement point. When using voltage as the indicator ofgeneration-load imbalance, the response of the generation or storage sources willnot be uniform across DC microgrids. Although the configuration of the responseat the primary time scale may not be desirable, but it can be adjusted at a slowertime scale using the secondary control. However, at the faster primary time scale,the response is coming entirely from power electronic devices with more or lessequivalent dynamics avoiding the complications of controlling mixed microgridsin AC architectures.
Summary The power electronic components in DC microgrids can be designedto have fast and relatively uniform transient responses. In contrast, the naturaltransient response of large rotating machines is slower than power electronic de-vices and cannot be easily modified by design. The uniformity of the transientresponse in DC architectures potentially makes them less sensitive to the locationof faults and other disturbances, which may lead to control and protection sys-tem designs that are less sensitive to the details of the microgrid design and moreuniversal (and less expensive) than for AC architectures.
3.7 Environmental Impact
The extended discussion of energy efficiency will now pay dividends in the as-sessment of environmental impact, discussed here in terms of CO2 emissions.Repeating the overall conclusion from the energy efficiency discussion–when ACand DC systems are compared for similar architectures and for similar operating
31
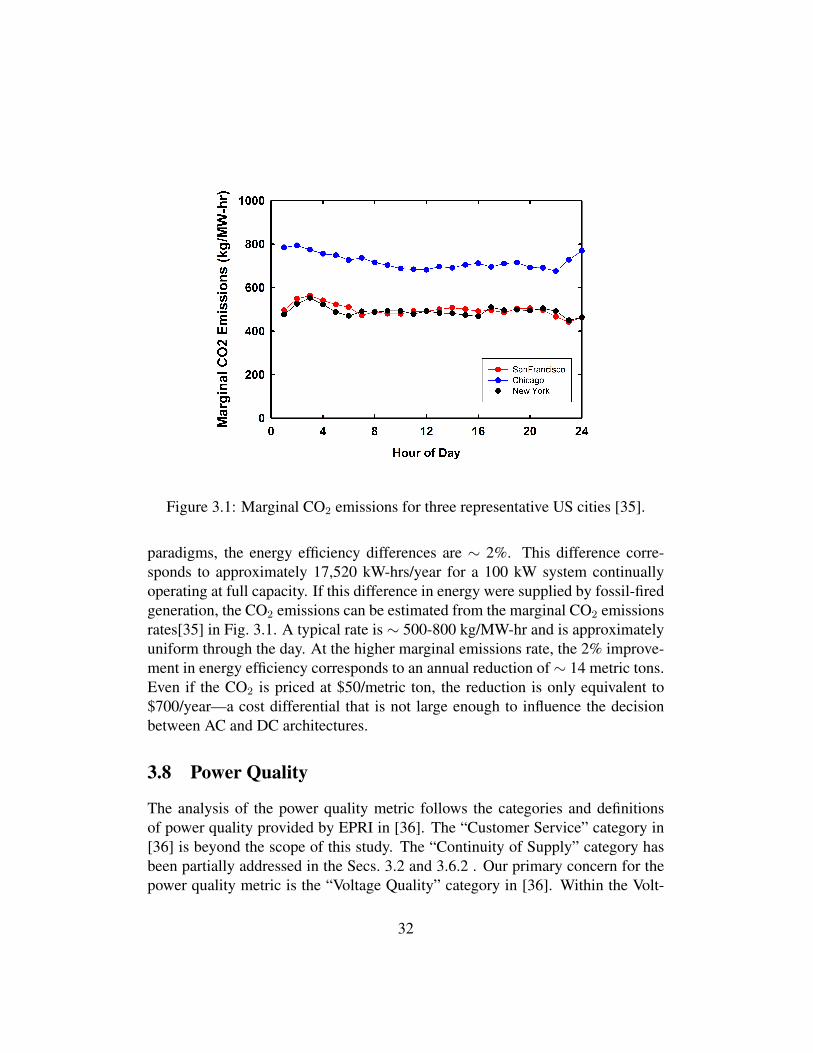
Figure 3.1: Marginal CO2 emissions for three representative US cities [35].
paradigms, the energy efficiency differences are ∼ 2%. This difference corre-sponds to approximately 17,520 kW-hrs/year for a 100 kW system continuallyoperating at full capacity. If this difference in energy were supplied by fossil-firedgeneration, the CO2 emissions can be estimated from the marginal CO2 emissionsrates[35] in Fig. 3.1. A typical rate is ∼ 500-800 kg/MW-hr and is approximatelyuniform through the day. At the higher marginal emissions rate, the 2% improve-ment in energy efficiency corresponds to an annual reduction of ∼ 14 metric tons.Even if the CO2 is priced at $50/metric ton, the reduction is only equivalent to$700/year—a cost differential that is not large enough to influence the decisionbetween AC and DC architectures.
3.8 Power Quality
The analysis of the power quality metric follows the categories and definitionsof power quality provided by EPRI in [36]. The “Customer Service” category in[36] is beyond the scope of this study. The “Continuity of Supply” category hasbeen partially addressed in the Secs. 3.2 and 3.6.2 . Our primary concern for thepower quality metric is the “Voltage Quality” category in [36]. Within the Volt-
32
age Quality category, EPRI breaks down power quality into several subcategoriesthat are primarily aligned with the time scale of the disturbance. However, themicrogrid architectures in Fig. 2.1 allow a natural separation of the analysis intodisturbances that originate from outside of the microgrid (external) and those thatoriginate inside (internal):
External disturbance For external disturbances that originate in the main ACgrid, the DC architectures in Fig. 2.1 have significant advantages. A fast respond-ing power electronics interface between the AC and DC systems (and potentialstorage on the DC bus) will provide a buffer from nearly all of the Voltage Qualitysubcategories in [36]. One exception is the very fast disturbances in the “Tran-sients” subcategory. Here, the speed or spectral content of the disturbance mayapproach or exceed the switching frequency of the power electronics interfaceallowing the disturbance to effect the voltage on the DC side of the interface.However, the disturbances in the other subcategories are generally slower thantypical switching frequencies and will be effectively filtered out by the interfacepower electronics.
In contrast, AC architectures are directly connected to the main AC grid witha Thevinin equivalent impedance that is typically quite low. This limits the abilityof reactive power sources inside the AC microgrid to mitigate a short-term andlong-term voltage sag or swell or voltage flicker. Therefore, when subject to anexternal disturbance, often the only option to improve the power quality insidethe AC microgrid is to island the system—an operation that always involves somerisk. For a power quality issue that appears suddenly (e.g. a voltage sag due to anearby fault), an AC microgrid will suffer reduced power quality until the switchat the PCC is able to open and island the microgrid, e.g. up to 6-10 AC cycles foran electromechanical switch. The interface power electronics in the DC microgridwill respond significantly faster and limit the exposure to reduced power quality.
Internal disturbance For internal disturbances, the distinction between AC andDC architectures is less clear. Fore the more continuous disturbances such asflicker and waveform distortion, the likely causes are the power electronics thatcomprise the microgrid. The origin and mitigation of these disturbances is outsidethe scope of this study. The shorter-term power quality issues (primarily voltagesag) are likely due to faults or other transients (e.g. motor starts) inside the micro-grid. For faults, the primary mode of mitigation is to isolate and clear the fault.The longer the time delay for fault identification and protection coordination, the
33
greater the impact of the voltage sag. In the DC architectures, the buffer providedby the AC-DC power electronics interface provides a clean separation betweenexternal and internal faults potentially leading to faster fault identification andclearing and smaller transients.
Summary Overall, the DC architectures have a clear qualitative advantage overAC architectures for power quality issues that originate from outside the micro-grid. DC microgrids have the potential to reduce the duration of transients andimprove power quality for faults inside the microgrid.
3.9 Resilience
Assuming a similar set of energy assets, there is little if any difference in the abilityof the power systems to serve loads during extended outages. Therefore, for thepurposes of this study, the ”Resilience” metric from Section 2.2 will not play amajor role in judging the applications in Section 5, unless an unusual systemconfiguration arises.
3.10 Summary Metrics Analysis and Recommendations
Table 3.6 is a summary of the analysis of the metrics from Section 2.2 based on theinformation available during this study and the assumptions made about microgridarchitecture and energy asset sizing in Fig. 2.1. Based on this summary, we rec-ommend two DC microgrid applications for further detailed simulation study tobetter identify the benefits and drawbacks of DC versus AC architectures. The firststudy focuses on the steady-state integration of DC-based microgrid sources andthe potential impact on capital cost and economic efficiency. The second study fo-cuses on the possibility of simplified primary control systems for DC microgridsand the potential impact on post-disturbance transient dynamics and the ability ofDC architectures to operate through major disturbances:
1. DC Microgrid as an Efficient, Low-Cost Platform for Economic (Steady-State) Integration—(This application is related to the PV+Battery micro-grids in Fig. 2.1 c) and d).) Many new distributed energy resources aredirect DC, e.g. PV generation, stationary batteries, mobile batteries, and
34
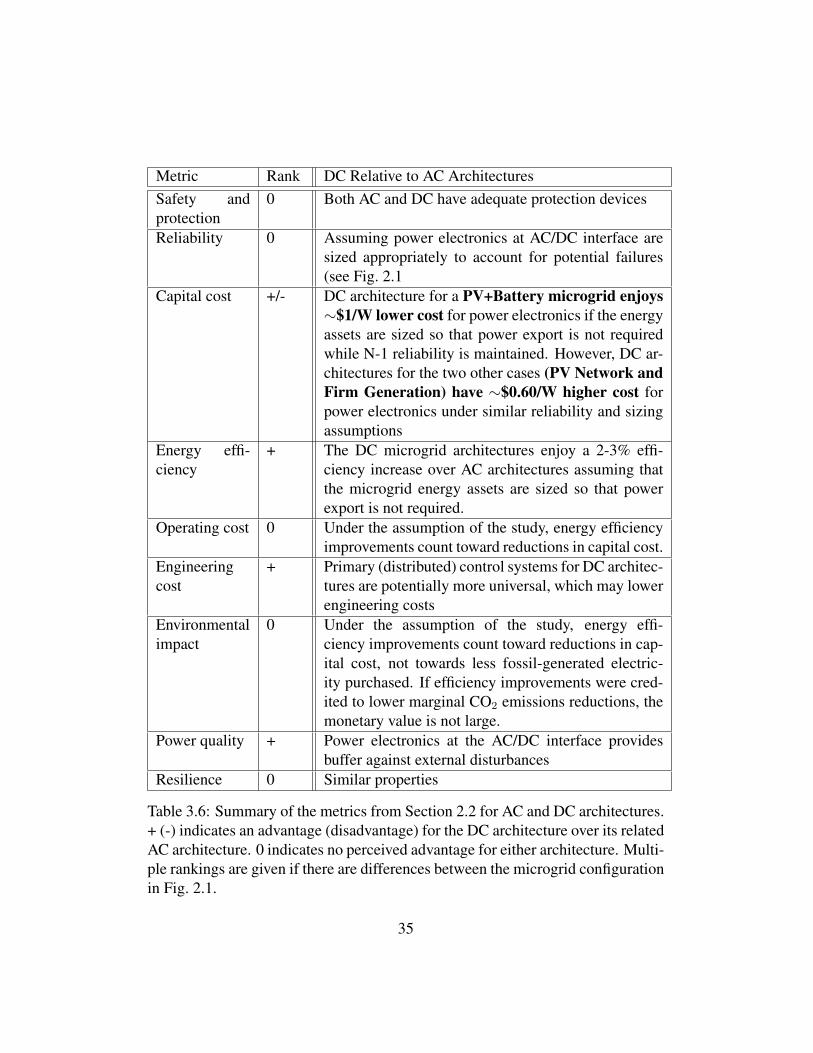
Metric Rank DC Relative to AC ArchitecturesSafety andprotection
0 Both AC and DC have adequate protection devices
Reliability 0 Assuming power electronics at AC/DC interface aresized appropriately to account for potential failures(see Fig. 2.1
Capital cost +/- DC architecture for a PV+Battery microgrid enjoys∼$1/W lower cost for power electronics if the energyassets are sized so that power export is not requiredwhile N-1 reliability is maintained. However, DC ar-chitectures for the two other cases (PV Network andFirm Generation) have ∼$0.60/W higher cost forpower electronics under similar reliability and sizingassumptions
Energy effi-ciency
+ The DC microgrid architectures enjoy a 2-3% effi-ciency increase over AC architectures assuming thatthe microgrid energy assets are sized so that powerexport is not required.
Operating cost 0 Under the assumption of the study, energy efficiencyimprovements count toward reductions in capital cost.
Engineeringcost
+ Primary (distributed) control systems for DC architec-tures are potentially more universal, which may lowerengineering costs
Environmentalimpact
0 Under the assumption of the study, energy effi-ciency improvements count toward reductions in cap-ital cost, not towards less fossil-generated electric-ity purchased. If efficiency improvements were cred-ited to lower marginal CO2 emissions reductions, themonetary value is not large.
Power quality + Power electronics at the AC/DC interface providesbuffer against external disturbances
Resilience 0 Similar properties
Table 3.6: Summary of the metrics from Section 2.2 for AC and DC architectures.+ (-) indicates an advantage (disadvantage) for the DC architecture over its relatedAC architecture. 0 indicates no perceived advantage for either architecture. Multi-ple rankings are given if there are differences between the microgrid configurationin Fig. 2.1.
35

fuel cells. Also, many high efficiency loads are also direct DC [4]. A mi-crogrid utilizing a DC bus may avoid many of the power conversion stepsrequired when using an AC bus, potentially leading to higher energy ef-ficiency and improved economic operation for DC microgrids. However,these benefits need to be carefully weighed against the potentially highercost of interfacing a DC microgrid to the bulk AC power systems. To pro-vide more accurate estimates of these costs and benefits, this scoping studyrecommends a more detailed simulation-based study of comparable AC andDC microgrids that, at a minimum, accounts for the following factors:
(a) realistic microgrid load and generation profiles (daily and annual)
(b) the use of realistic AC-DC, DC-AC, and DC-DC power conversionefficiency curves that account for the typical decrease in efficiency atpart load
(c) fair and detailed treatment of the conductor losses in AC and DC mi-crogrids including the effects reactive power flow and mitigation oflosses through additional capital expenditures on conductors.
(d) sensitivity of the reliability of DC microgrids (i.e. the ability to deliverpower to the microgrid loads) to the sizing of the power electronicsat the AC-DC interface to the bulk power system and the sizing ofmicrogrid’s distributed energy resources.
(e) at equivalent reliability, the sensitivity of the economic performance ofDC microgrids to the sizing and capital cost of the microgrid energyresources and power electronics at the AC-DC interface to the bulkpower system, including the impact of this sizing on the ability of theDC microgrid to export power to the bulk AC system
We emphasize that all of the assessments and effect mentioned above shouldbe done using realistic load and generation profiles, not peaks or averages.The main objective of the recommended study is to provide accurate esti-mates of the economic performance of AC and DC microgrids for designsthat yield equivalent reliability, where reliability is considered in the N-1sense of being able to serve all critical load after the loss of any one com-ponent.
2. High Survivability DC Microgrids—(This application is related to anyof the microgrids in Fig. 2.1.) Microgrids are subject to many different
36
types of internal and external disturbances. To be ”survivable”, the post-disturbance microgrid dynamics should converge to steady-state operationwith no loss of critical load and minimal loss of non-critical load. Thesources in a DC microgrid only have to reach a steady state DC voltagewhereas an AC microgrid’s sources must achieve a steady state voltage mag-nitude and frequency. The power electronics at the AC-DC interface mayshield DC microgrid dynamics from many external disturbances leading tohigher survivability. For internal disturbances, the fewer dynamical statesof the DC microgrid may lead to simpler controls, may make achieving thenew steady state easier and potentially lead to improved survivability. Agreater immunity to external and internal disturbances could lead to higherreliability and lower engineering costs. To provide a better estimate of thesepotential survivability benefits, this scoping study recommends a more de-tailed simulation-based study of comparable AC and DC microgrids that, ata minimum, accounts for the following factors:
(a) for the AC and DC systems, equivalent bus, line, and source archi-tectures that include at least two buses with a mix of sources at eachbus, e.g. two DC direct sources (e.g. one PV generators and one bat-tery) or one DC direct source and one AC native source (e.g. a naturalgas-fired rotating machine). These sources should be interfaced to themicrogrid bus as appropriate for type of system under consideration.
(b) realistic and comparable tripping conditions for both the DC-directand AC-native generation sources
(c) potential differences between unipolar and bipolar DC microgrid con-figurations
(d) equivalent internal and external disturbances that include a range ofextreme but plausible cases, including:
i. outage of the AC grid at the substation supplying the microgridwith subsequent (delayed) microgrid islanding
ii. fault on the AC grid near the interface to the microgrid with sub-sequent (delayed) microgrid islanding
iii. faults on the microgrid buses that are cleared with and withoutisolating the the faulted bus
iv. large changes in microgrid load while grid connected and islandedwith large changes in motor load likely being the most severe.
37

The performance of the AC and DC microgrids should primarily be judgedon their ability to maintain service to critical loads following the disturbancewith a secondary consideration of the cost of the control system, generationsources, and power electronics. The survivability study may want to con-sider using the same microgrid architectures as in the “Low-Cost Platform”study for comparison.
This study also suggests potentially revisiting a third application in the future.A trigger for revisiting this application is further increases in device power levelon PoE or PoH networks:
Low Power Network with Differentiated and Automatically EvolvablePower Quality and Reliability—(This application is related to the DC networkin Fig. 2.1 b) or the microgrid in Fig. 2.1 d).) These networks and microgrid aregenerally low voltage PoE systems where communications and power distribu-tion are naturally integrated into the same wiring and switching. The integratedarchitecture and communications protocol naturally enables end device self iden-tification with the potential for automated network or microgrid reconfiguration.At current device power levels, it is not clear if these networks will ever achievethe minimum power threshold used in this study and become large enough to berelevant to DOE Office of Electricity. However, the rapid evolution in this areajustifies continued monitoring of this technology.
38
4. Appendix A—Voltage-Conversion and Battery Ef-ficiency AssumptionsAt high enough power and high enough voltages, voltage-to-voltage conversionsare routinely accomplished with energy efficiency e > 0.95. AC-DC and DC-AC conversions tend to be slightly less efficient than purely DC-DC conversions.Here, we cite references that document efficiencies we consider to be commer-cially available and/or reasonable in 2014.
• Photovoltaic Maximum Power Point Trackers (MPPTs) are as high as 99.9%efficient [23]. We ignore MPPT losses and treat them as being essentially100% efficient and part of the photovoltaic strings themselves.
• Based on Refs. [23, 24] for commercially available photovoltaic inverters,we take eDC−AC = 0.976.
• High-voltage DC buses are still a novelty, with high-power, high-voltageDC-DC converters being rare. For converting photovoltaic power to 380 VDC, Ref. [25] documents an efficiency of 96%. However, this value wouldbe too conservative, because it is based on conversion to a low voltage, andother indications are that DC-DC conversions are more efficient than DC-AC conversions at high voltage. We expect that eDC−DC ≥ eDC−AC if andwhen photovoltaic DC-DC converters become widespread. Thus, we takeeDC−DC = 0.976 for the present study.
• Converting high-voltage DC to low-voltage DC (e.g., 380 V to 12 V) is lessefficient than converting to high-voltage DC to high-voltage DC. Based onRef. [25], we take esl,DC = 0.96 and esl,AC = 0.95 for low-voltage, “small”DC loads.
• Converting AC grid power to 54 V DC at kW powers is routine at 96.5%efficiency [26, 27]. Thus, we assume ebl,AC = eAC−DC = 0.965 for “big”loads.
• We assume that half of the total system power is consumed by small loadsand half by big loads. For an AC-grid bus, the average conversion efficiencysupplying power to the loads is then (ebl,AC + esl,AC)/2 = 0.958. For a DC-bus, the big loads are driven directly from the 380 V DC, so the averageconversion efficiency supplying power to loads is (1 + esl,DC)/2 = 0.980.
39

• The lithium-ion battery literature [37] specifies an electrochemical round-trip efficiency of over 95% for large lithium-ion batteries, not includingpower converters. (For sealed lead-acid batteries, this would be closer to90%.) For connection to AC, we also account for high voltage AC-DCand DC-AC conversions as the battery is charged and discharged, using thehigh-power, high-voltage conversion efficiencies discussed above, obtain-ing ebrt,AC = 0.976 × 0.95 × 0.976 = 0.905 for the round-trip DC-to-ACstorage in lithium-ion batteries. This is consistent with [38]. Similarly, foruse in a DC microgrid, we estimate ebrt,DC = 0.976×0.95×0.976 = 0.905for the round-trip DC-to-DC storage in lithium-ion batteries.
• Slightly higher AC-DC voltage-conversion efficiencies seem likely in thefuture [39, 40].
40
Bibliography[1] http://certs.lbl.gov/pdf/Final-Project-Report-05152010.pdf.
[2] https://www.smartgrid.gov/sites/default/files/doc/files/SRJ DOE FinalReport Submitted 20140717.pdf.
[3] http://www.microgridworldforum.com/pdf/phil-smith.pdf.
[4] Karina Garbesi, Vagelis Vossos, and Hongxia Shen. Catalog of dc appli-ances and power systems. Technical report, Energy Analysis DepartmentEnvironmental Energy Technologies Division Lawrence Berkeley NationalLaboratory, 2011. LBNL-5364E.
[5] W. Tschudi, B. Fortenbery, and M. Ton. Dc power for improved data centerefficiency. Technical report, Lawrence Berkeley National Laboratory, 2008.
[6] Strategen Consulting and Arup Group. Direct current scoping study: Oppor-tunities for direct current power in the built environment. Technical report,US Department of Energy, Building Technologies Office, 2014.
[7] Vagelis Vossos, Karina Garbesi, and Hongxia Shen. Energy savings fromdirect-DC in u.s. residential buildings. Energy and Buildings, 68:223–231,2014.
[8] http://www.solarec-egypt.com/resources/Larruskain HVAC to HVDC.pdf.
[9] http://www.emergealliance.org/Standards/OccupiedSpace/RequestStandard.aspx.
[10] Kristina Hamachi LaCommare and Joseph H. Eto. Understanding the cost ofpower interruptions to u.s. electricity consumers. Technical report, LawrenceBerkeley National Laboratory, 2004. LBNL-55718.
[11] Executive Office of the President. Economic benefits of increasing electricgrid resilience to weather outages. Technical report, Executive Office of thePresident, August 2013.
[12] http://www.reilproject.org/05-DC-Microgrids%20%281%29.pdf.
[13] http://starlinedcsolutions.com/docCenter/default.aspx?section=6&lang=en.
[14] http://www.eaton.com/Eaton/ProductsServices/Electrical/ProductsandServices/CircuitProtection/MoldedCaseCircuitBreakers/DCBreakers/index.htm.
41
[15] https://www.platt.com/platt-electric-supply/Dry-Type-Transformers-480-240-120/Eaton/V49E013-V48M22T49EE/product.aspx?zpid=666411.
[16] http://www.satcon.com/uploads/products/en/100kW-PG-US-UL.pdf.
[17] http://www.gogreensolar.com/products/satcon-powergate-plus-pvs-100-100kw-480vac-grid-tie-inverter-transformer?s=recomatic.
[18] http://www.satcon.com/temp foreign/downloads/solutions/100kW-Hybrid-US.pdf.
[19] Pricing from Dave Geary of Starline Enterprises, Frame and Controller $20K+ each 15 kW rectifier module is $3,000.
[20] Extrapolated Using $349/kW of Capacity—Alpha System 14kW, 380V to48V; 19/23” universal mount system.
[21] National Electric Code.
[22] http://www.encorewire.com/wp-content/uploads/previous price sheets/industrial/previouscom.pdf.
[23] Massimo Valentini, Alin Raducu, Dezso Sera, Remus Teodorescu, andJochen Hantschel. Pv inverter test setup for european efficiency, static anddynamic mppt efficiency evaluation. In Optimization of Electrical and Elec-tronic Equipment: OPTIM 2008, pages 433–438, 2008. E-ISBN: 978-1-4244-1545-8.
[24] Product manual, Samil Power, SolarRiver PV Grid-tied Inverter, Model5200TL, AC rated power 4600 W, 50 Hz, 230 volt AC, Euro efficiency =97.6%. Downloaded September 2014.
[25] Neil Rasmussen and James Spitaels. A quantitative comparison of high ef-ficiency AC vs. DC power distribution for data centers. Technical report,Schneider Electric, 2012. White paper 127, Revision 3.
[26] Delta Telecom Power Solutions, DPR 6000 EnergE. Downloaded September2014.
[27] Emerson Network Power, Netsure 701. Downloaded September 2014.
[28] https://der.lbl.gov/der-cam.
42
[29] http://www.tecogen.com/products-cogeneration-inv-100.htm.
[30] IEEE 802.3at-2009.
[31] USB Implementers Forum, Inc., 2013, at http://www.usb.org.
[32] Introduction to Power over HDBASET, HDBaseT Alliance, September,2011.
[33] P. Piagi and R.H. Lasseter. Autonomous control of microgrids. In PowerEngineering Society General Meeting, 2006. IEEE, pages 8 pp.–, 2006.
[34] J.M. Guerrero, J.C. Vasquez, J. Matas, L.G. de Vicua, and M. Castilla. Hier-archical control of droop-controlled ac and dc microgrids #x2014;a generalapproach toward standardization. Industrial Electronics, IEEE Transactionson, 58(1):158–172, Jan 2011.
[35] Kyle Siler-Evans, Ines Lima Azevedo, and M. Granger Morgan. Marginalemissions factors for the u.s. electricity system. Environmental Science &Technology, 46(9):4742–4748, 2012. PMID: 22486733.
[36] http://www.epri.com/abstracts/Pages/ProductAbstract.aspx?ProductId=000000000001008589&Mode=download.
[37] ESS MarketBrochure en 0412, Saft Groupe S.A. Downloaded September2014.
[38] EPRI. Electricity energy storage technology options: A white paper primeron applications, costs, and benefits. Technical report, Electric Power Re-search Institute, 2010. 1020676, updated December 2010.
[39] M. Kapser, D. Bortis, J. W. Kolar, and G. Deboy. Hyper-efficient (98%)and super-compact (3kw/dm3) 3.3kw telecom rectifier module based on se-ries/parallel multi-cell converter approach. In Proceedings of the IEEE En-ergy Conversion Congress and Exposition (ECCE USA 2014), 2014.
[40] T. Friedli, M. Hartmann, and J. W. Kolar. The essence of three-phase PFCrectifier systems - part II. IEEE Transactions on Power Electronics, 29:543–560, 2014.
43

5. Appendix B—DC Microgrid ApplicationsBelow, we present a summary of the available analysis for the DC microgrid ap-plications suggested by the members of the study team. Each of these analyses isa self-contained document with its own bibliography and caption numbering.
44
Application #1—DC Microgrid as an Efficient, Low-Cost Platform for
Economic (Steady-State) Integration
This application compares a benchmark AC microgrid with its counterpart in DC having two
objectives. First, we examine the electric power losses of each microgrid. These occur
because of (a) the distribution of electric power, i.e. AC line losses vs. DC line losses, and (b)
the efficiency of the converters, i.e. AC/DC/AC converter efficiency vs. DC/DC converter
efficiency. Second, we compare the equipment costs that are necessary for an AC vs. a DC
microgrid.
In order to carry out the comparison, we needed a benchmark microgrid model. As there is
significantly more research carried out in AC microgrids, we looked for a benchmark AC
microgrid, which we could then convert to an equivalent DC microgrid, with the same active
power consumption and generation, and study the difference between AC and DC
technology.
We could find no available benchmark AC microgrid system in 60 Hz, so we used the
microgrid system presented in Figure 1 to carry out our comparisons [1]. This assumes 50 Hz
system frequency and 400 V as the AC distribution voltage. Taking into account that in the
US the standard residential voltage is 120 V, we would probably expect higher losses in a
microgrid designed for the US system. A minor role in the increased losses will also be due to
the increased frequency (higher angular frequency ω and thus higher reactance for the
inductances).
Conversion Losses There are several different converters in the market. Usually DC/DC converters are
somewhat more efficient than AC/DC. In order to account for the best possible case for AC,
we assumed that both AC/DC and DC/DC converters have 97% efficiency. (Note: in a
discussion with Prof. J. Kolar from ETH Zurich, he mentioned that current state-of-the-art
transformerless AC/DC converters have efficiencies similar to state-of-the-art DC/DC
converters of about 97%. AC/DC converters including transformers – galvanic isolation is
necessary for several home appliances – have lower efficiencies). As a result the difference
in the conversion losses we will see in this study is only dependent on the actual amount of
energy that flows through the converter.
Description of the AC microgrid The benchmark AC microgrid consists of a 400 V low voltage radial feeder, which is
connected over a transformer to the 20 kV medium voltage network [1]. It consists of AC
loads, the main grid in-feed, and distributed generation (DG). The generating sources are a
30 kW battery storage, a 30 kW gas microturbine, a 10 kW fuel cell, a 10 kW wind turbine,
and two solar photovoltaic (PV) systems of 10 kW and 3kW respectively. Both solar PVs are
connected to a single phase, while all other generation is connected to all three phases.
45
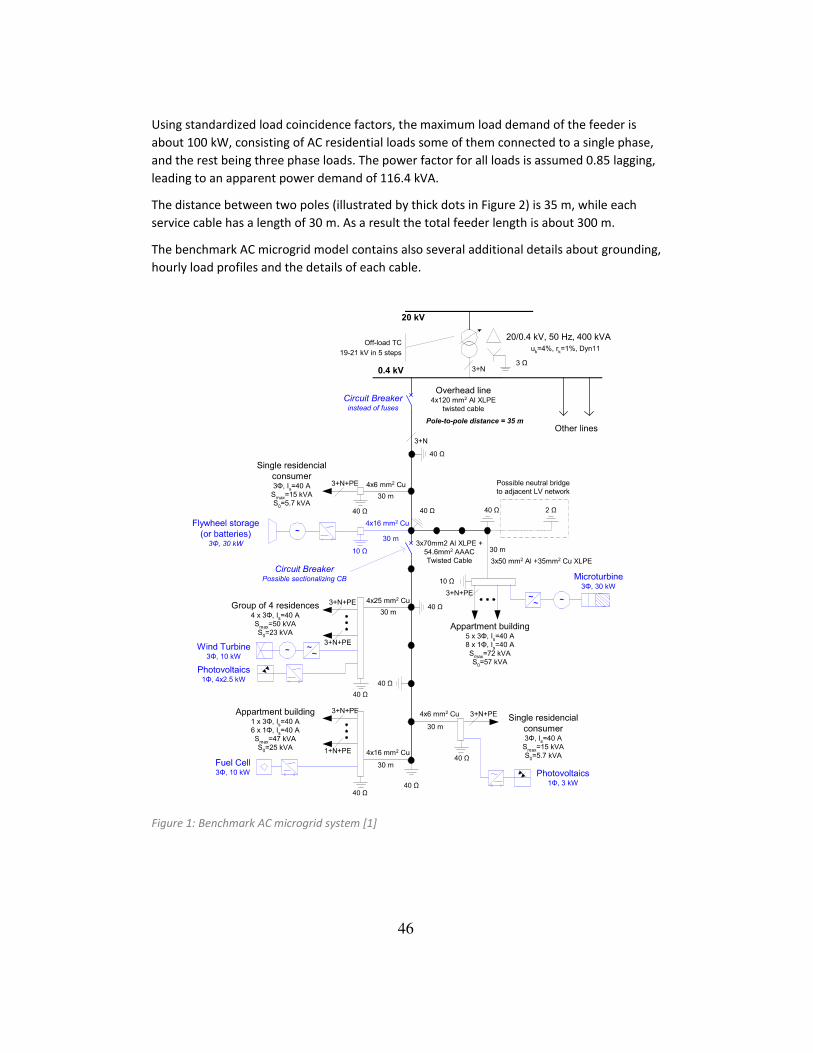
Using standardized load coincidence factors, the maximum load demand of the feeder is
about 100 kW, consisting of AC residential loads some of them connected to a single phase,
and the rest being three phase loads. The power factor for all loads is assumed 0.85 lagging,
leading to an apparent power demand of 116.4 kVA.
The distance between two poles (illustrated by thick dots in Figure 2) is 35 m, while each
service cable has a length of 30 m. As a result the total feeder length is about 300 m.
The benchmark AC microgrid model contains also several additional details about grounding,
hourly load profiles and the details of each cable.
Figure 1: Benchmark AC microgrid system [1]
46
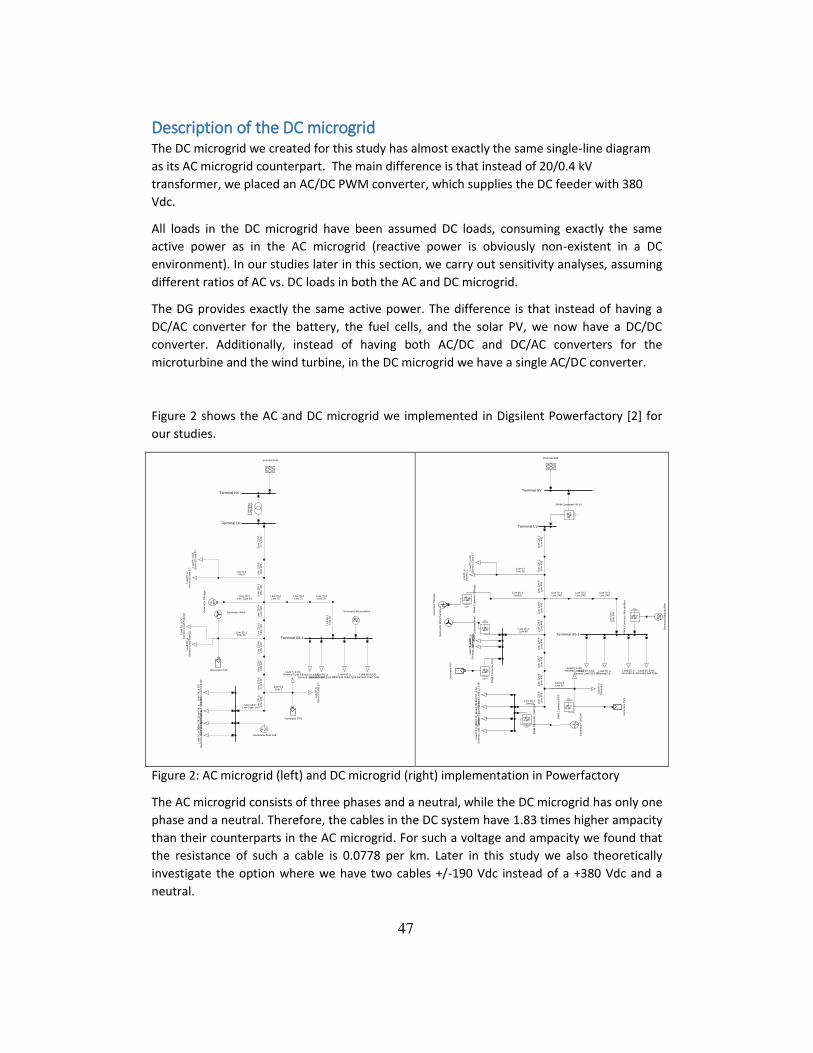
Description of the DC microgrid The DC microgrid we created for this study has almost exactly the same single-line diagram
as its AC microgrid counterpart. The main difference is that instead of 20/0.4 kV
transformer, we placed an AC/DC PWM converter, which supplies the DC feeder with 380
Vdc.
All loads in the DC microgrid have been assumed DC loads, consuming exactly the same
active power as in the AC microgrid (reactive power is obviously non-existent in a DC
environment). In our studies later in this section, we carry out sensitivity analyses, assuming
different ratios of AC vs. DC loads in both the AC and DC microgrid.
The DG provides exactly the same active power. The difference is that instead of having a
DC/AC converter for the battery, the fuel cells, and the solar PV, we now have a DC/DC
converter. Additionally, instead of having both AC/DC and DC/AC converters for the
microturbine and the wind turbine, in the DC microgrid we have a single AC/DC converter.
Figure 2 shows the AC and DC microgrid we implemented in Digsilent Powerfactory [2] for
our studies.
Figure 2: AC microgrid (left) and DC microgrid (right) implementation in Powerfactory
The AC microgrid consists of three phases and a neutral, while the DC microgrid has only one
phase and a neutral. Therefore, the cables in the DC system have 1.83 times higher ampacity
than their counterparts in the AC microgrid. For such a voltage and ampacity we found that
the resistance of such a cable is 0.0778 per km. Later in this study we also theoretically
investigate the option where we have two cables +/-190 Vdc instead of a +380 Vdc and a
neutral.
Terminal 50-1
Terminal HV
Terminal LV
Load 50_a DCGeneral Load 28.5-3P
Load 50_b DCGeneral Load Type
Load 6_b DCGeneral Load 5.7
Lo
ad
16
_b
DC
Ge
ne
ral L
oa
d T
yp
e(1
)L
oa
d 1
6_
a D
CG
en
era
l L
oa
d 1
2.5
-3P
Lo
ad
25
_a
DC
Ge
ne
ral L
oa
d T
yp
e(2
)
Lo
ad
6_
a D
CG
en
era
l L
oa
d 5
.7
Generator Microturbine
Line 16-1Line Type 16
~
Ge
ne
rato
r S
tora
ge
~
Generator PV2
H2 O2
Generator Fuel Cell
Lo
ad
25
_a
Ge
ne
ral L
oa
d T
yp
e(2
)
Generator Wind
~
Generator PV1
Lo
ad
16
_b
Ge
ne
ral L
oa
d T
yp
e(1
)
Load 50_bGeneral Load Type
Lin
e 5
0-1
Lin
e 5
0
Lo
ad
16
_a
Ge
ne
ral L
oa
d 1
2.5
-3P
Line 16-2Line Type 16
Lo
ad
6_
bG
en
era
l L
oa
d 5
.7
Line 6-2Line 6
Lin
e 1
20
-9L
ine
12
0L
ine
12
0-8
Lin
e 1
20
Line 25-1Line 25
Lin
e 1
20
-7L
ine
12
0L
ine
12
0-6
Lin
e 1
20
Lin
e 1
20
-5L
ine
12
0L
ine
12
0-4
Lin
e 1
20
Load 50_aGeneral Load 28.5-3P
Line 70-3Line 70
Line 70-2Line 70
Line 70-1Line 70
External Grid
Lo
ad
6_
aG
en
era
l L
oa
d 5
.7
Lin
e 1
20
-3L
ine
12
0
Line 6-1Line 6 L
ine
12
0-2
Lin
e 1
20
Lin
e 1
20
-1L
ine
12
0
2-W
ind
ing
..2
-Win
din
g..
DIgSILENT
Terminal 50-1
Terminal HV
Terminal LV
Line 25-1Line 95
Load 50_b ACGeneral Load Type
Load 50_a ACGeneral Load 28.5-3P
Load 6_b ACGeneral Load 5.7
Lo
ad
16
_b
AC
Ge
ne
ral L
oa
d T
yp
e(1
)L
oa
d 1
6_
a A
CG
en
era
l L
oa
d 1
2.5
-3P
Lo
ad
25
_a
AC
Ge
ne
ral L
oa
d T
yp
e(2
)L
oa
d 6
_a
AC
Ge
ne
ral L
oa
d 5
.7
Ge
ne
rato
r M
icro
turb
ine
PW
M C
on
ve
rte
r F
ue
ll C
ell
PW
M C
on
ve
rte
r M
icro
turb
ine
PWM Converter HV/LV
PW
M C
on
ve
rte
r S
tora
ge
PW
M C
on
ve
rte
r W
ind
PW
M C
on
ve
rte
r P
V1
PW
M C
on
ve
rte
r P
V2
Line 16-1Line50
~
Ge
ne
rato
r S
tora
ge
~
Ge
ne
rato
r P
V2
H2
O2
Ge
ne
rato
r F
ue
l C
ell
Lo
ad
25
_a
Ge
ne
ral L
o..
Ge
ne
rato
r W
ind
Tu
rbin
e
~
Ge
ne
rato
r P
V1
Lo
ad
16
_b
Ge
ne
ral L
o..
Load 50_bGeneral Lo..
Lin
e 5
0-1
Lin
e 1
50
Lo
ad
16
_a
Ge
ne
ral L
o.. Line 16-2
Line50
Lo
ad
6_
bG
en
era
l L
..Line 6-2Line 16
Lin
e 1
20
-9L
ine
40
0L
ine
12
0-8
Lin
e 4
00
Lin
e 1
20-7
Lin
e 4
00
Lin
e 1
20
-6L
ine
40
0L
ine
12
0-5
Lin
e 4
00
Lin
e 1
20
-4L
ine
40
0
Load 50_aGeneral Lo..
Line 70-3Line 240
Line 70-2Line 240
Line 70-1Line 240
External Grid
Lo
ad
6_
aG
en
era
l L
..
Lin
e 1
20
-3L
ine
40
0
Line 6-1Line 16 L
ine
12
0-2
Lin
e 4
00
Lin
e 1
20
-1L
ine
40
0
DIgSILENT
47

Case Studies As mentioned above, our comparison had two objectives: compare the electric power losses
and compare the equipment costs occurring in an AC vs. a DC microgrid.
Our performance criteria are:
- network losses, and
- the amount of power that needs to be absorbed from the main grid.
We carried out in total four sensitivity analyses investigating the following:
a) different cable lengths,
b) load demand and the power factor of the loads,
c) the ratio between the main grid infeed and the local generation in the microgrid, and
d) the ratio between AC and DC loads
Main Grid Infeed Papathanasiou et al. provides the kVA values of all loads and assumes a uniform power
factor of 0.85 inductive. In this section, we also studied two additional cases, where the
loads have the same apparent power but a power factor of 0.95 inductive and where the
loads have the same active power but a power factor of 0.95 inductive. In the base case with
a power factor of 0.85 inductive, the total apparent power of the load is 116.40 kVA and the
total active power is 99.02 kW.
As a first step, we assumed that all AC/DC, DC/AC and DC/DC converters are ideal and have
no losses. Our focus was to examine the difference in the grid infeed only because of the grid
topology. In the next step we will include the converter losses.
Table 1 presents the results of our study.
AC DC
P [kW] Q [kvar] S [kVA] P [kW] Diff. (%)
cos(ϕ)=0.85 Grid Infeed 9.05 62.36 63.01 6.6 -90%
cos(ϕ)=0.95 constant kW
Grid Infeed 7.87 33.01 33.94 6.6 -81%
cos(ϕ)=0.95 constant kVA
Grid Infeed 19.96 36.98 42.02 18.51 -56%
Table 1: Grid infeed for an AC Microgrid and its DC counterpart. Two different load power factors
were investigated.
As we can see from Table 1, for both load power factors, the DC microgrid requires a
substantially smaller power infeed from the main grid.
In the base case of cosφ=0.85, the AC Microgrid requires the injection of 63.01 kVA from the
grid, while the DC microgrid requires only the 1/10 of it – about 6.6 kW. Although the sizing
of the AC/DC converter should also take into account security of supply issues and the
reliability of the micro-sources, still the DC microgrid needs only a smaller size AC/DC
48
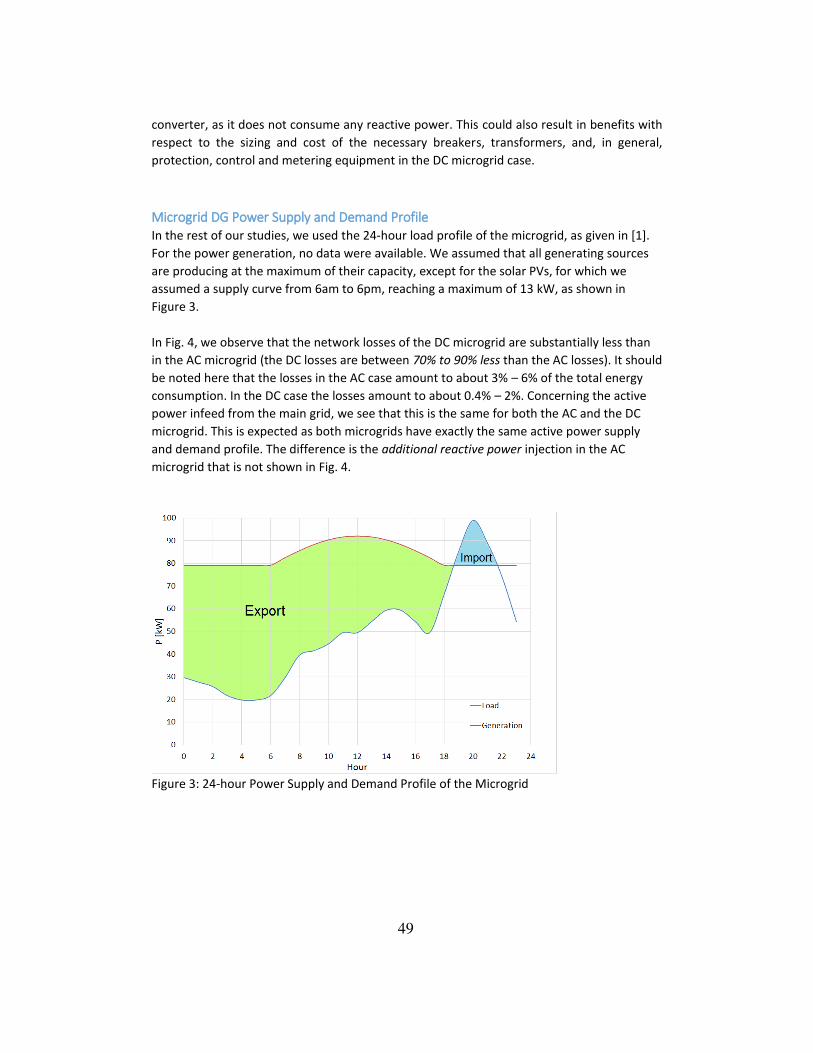
converter, as it does not consume any reactive power. This could also result in benefits with
respect to the sizing and cost of the necessary breakers, transformers, and, in general,
protection, control and metering equipment in the DC microgrid case.
Microgrid DG Power Supply and Demand Profile In the rest of our studies, we used the 24-hour load profile of the microgrid, as given in [1].
For the power generation, no data were available. We assumed that all generating sources
are producing at the maximum of their capacity, except for the solar PVs, for which we
assumed a supply curve from 6am to 6pm, reaching a maximum of 13 kW, as shown in
Figure 3.
In Fig. 4, we observe that the network losses of the DC microgrid are substantially less than
in the AC microgrid (the DC losses are between 70% to 90% less than the AC losses). It should
be noted here that the losses in the AC case amount to about 3% – 6% of the total energy
consumption. In the DC case the losses amount to about 0.4% – 2%. Concerning the active
power infeed from the main grid, we see that this is the same for both the AC and the DC
microgrid. This is expected as both microgrids have exactly the same active power supply
and demand profile. The difference is the additional reactive power injection in the AC
microgrid that is not shown in Fig. 4.
Figure 3: 24-hour Power Supply and Demand Profile of the Microgrid
49
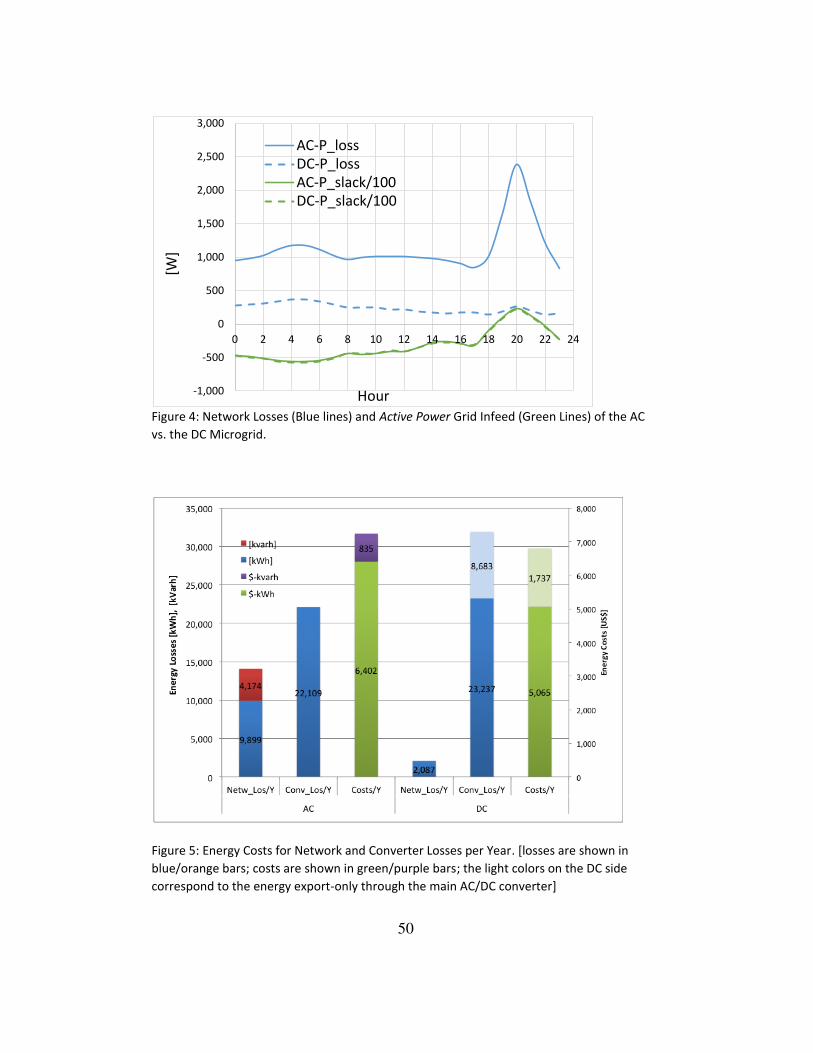
Figure 4: Network Losses (Blue lines) and Active Power Grid Infeed (Green Lines) of the AC
vs. the DC Microgrid.
Figure 5: Energy Costs for Network and Converter Losses per Year. [losses are shown in
blue/orange bars; costs are shown in green/purple bars; the light colors on the DC side
correspond to the energy export-only through the main AC/DC converter]
-1,000
-500
0
500
1,000
1,500
2,000
2,500
3,000
0 2 4 6 8 10 12 14 16 18 20 22 24
[W]
Hour
AC-P_loss DC-P_loss AC-P_slack/100 DC-P_slack/100
50
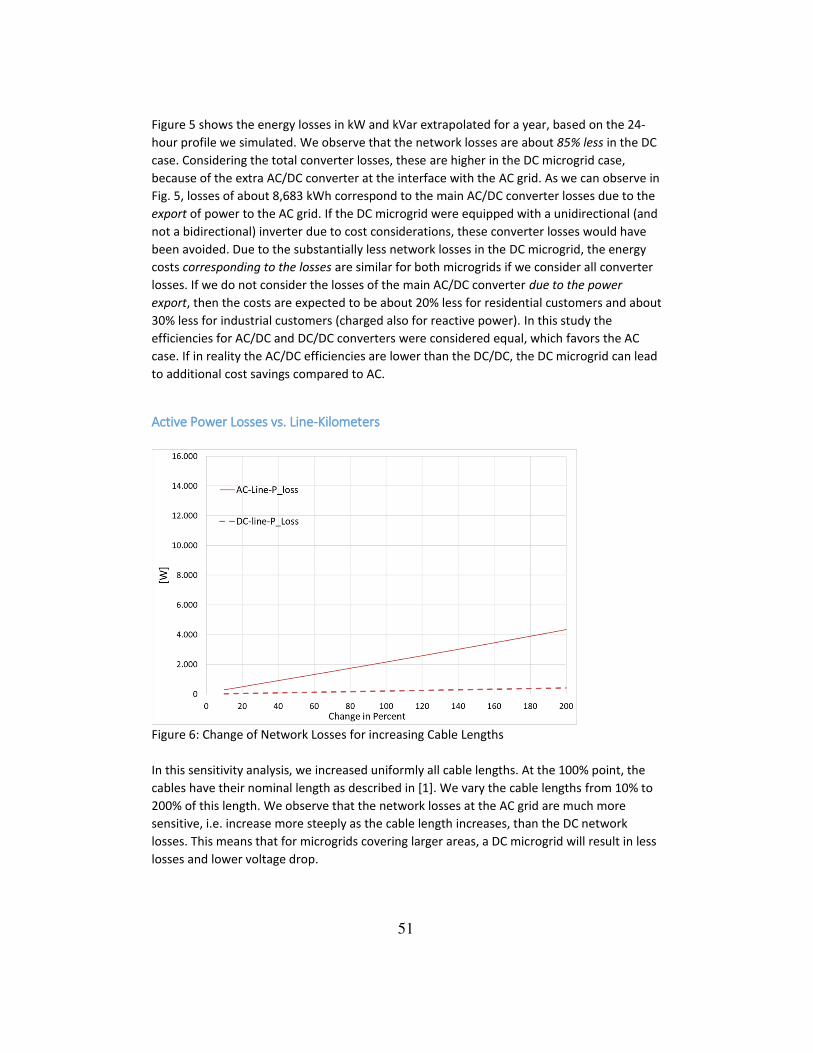
Figure 5 shows the energy losses in kW and kVar extrapolated for a year, based on the 24-
hour profile we simulated. We observe that the network losses are about 85% less in the DC
case. Considering the total converter losses, these are higher in the DC microgrid case,
because of the extra AC/DC converter at the interface with the AC grid. As we can observe in
Fig. 5, losses of about 8,683 kWh correspond to the main AC/DC converter losses due to the
export of power to the AC grid. If the DC microgrid were equipped with a unidirectional (and
not a bidirectional) inverter due to cost considerations, these converter losses would have
been avoided. Due to the substantially less network losses in the DC microgrid, the energy
costs corresponding to the losses are similar for both microgrids if we consider all converter
losses. If we do not consider the losses of the main AC/DC converter due to the power
export, then the costs are expected to be about 20% less for residential customers and about
30% less for industrial customers (charged also for reactive power). In this study the
efficiencies for AC/DC and DC/DC converters were considered equal, which favors the AC
case. If in reality the AC/DC efficiencies are lower than the DC/DC, the DC microgrid can lead
to additional cost savings compared to AC.
Active Power Losses vs. Line-Kilometers
Figure 6: Change of Network Losses for increasing Cable Lengths
In this sensitivity analysis, we increased uniformly all cable lengths. At the 100% point, the
cables have their nominal length as described in [1]. We vary the cable lengths from 10% to
200% of this length. We observe that the network losses at the AC grid are much more
sensitive, i.e. increase more steeply as the cable length increases, than the DC network
losses. This means that for microgrids covering larger areas, a DC microgrid will result in less
losses and lower voltage drop.
51
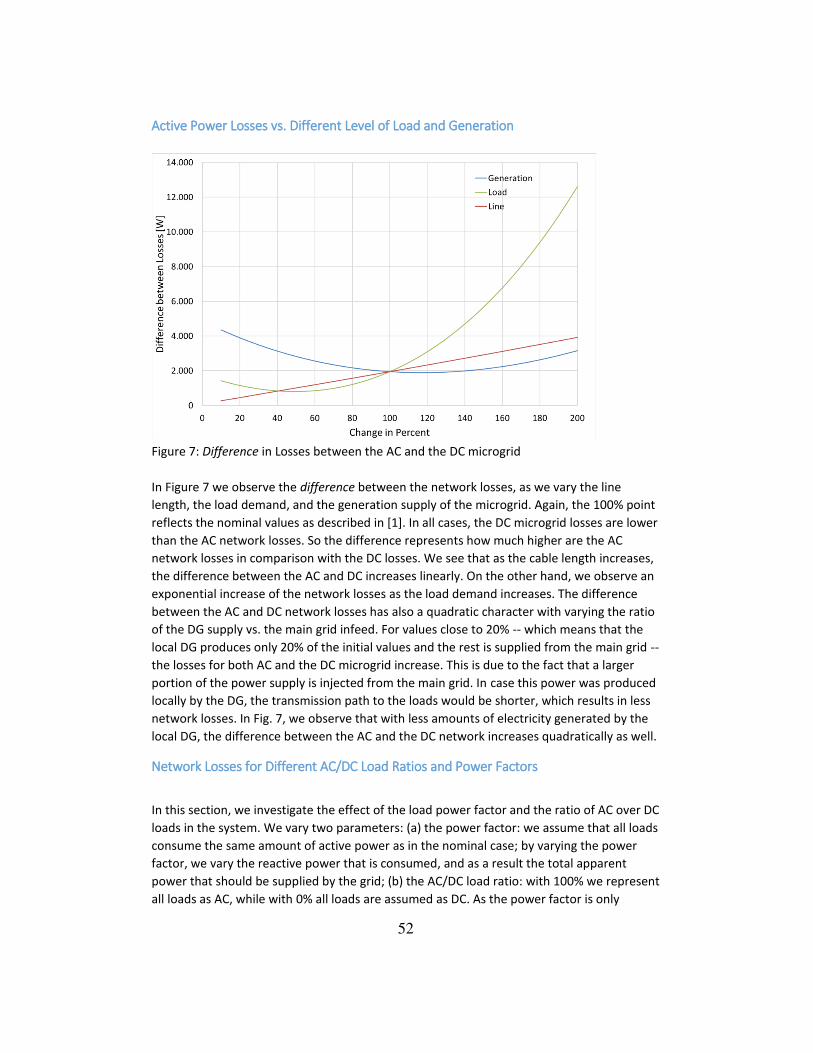
Active Power Losses vs. Different Level of Load and Generation
Figure 7: Difference in Losses between the AC and the DC microgrid
In Figure 7 we observe the difference between the network losses, as we vary the line
length, the load demand, and the generation supply of the microgrid. Again, the 100% point
reflects the nominal values as described in [1]. In all cases, the DC microgrid losses are lower
than the AC network losses. So the difference represents how much higher are the AC
network losses in comparison with the DC losses. We see that as the cable length increases,
the difference between the AC and DC increases linearly. On the other hand, we observe an
exponential increase of the network losses as the load demand increases. The difference
between the AC and DC network losses has also a quadratic character with varying the ratio
of the DG supply vs. the main grid infeed. For values close to 20% -- which means that the
local DG produces only 20% of the initial values and the rest is supplied from the main grid --
the losses for both AC and the DC microgrid increase. This is due to the fact that a larger
portion of the power supply is injected from the main grid. In case this power was produced
locally by the DG, the transmission path to the loads would be shorter, which results in less
network losses. In Fig. 7, we observe that with less amounts of electricity generated by the
local DG, the difference between the AC and the DC network increases quadratically as well.
Network Losses for Different AC/DC Load Ratios and Power Factors
In this section, we investigate the effect of the load power factor and the ratio of AC over DC
loads in the system. We vary two parameters: (a) the power factor: we assume that all loads
consume the same amount of active power as in the nominal case; by varying the power
factor, we vary the reactive power that is consumed, and as a result the total apparent
power that should be supplied by the grid; (b) the AC/DC load ratio: with 100% we represent
all loads as AC, while with 0% all loads are assumed as DC. As the power factor is only
52
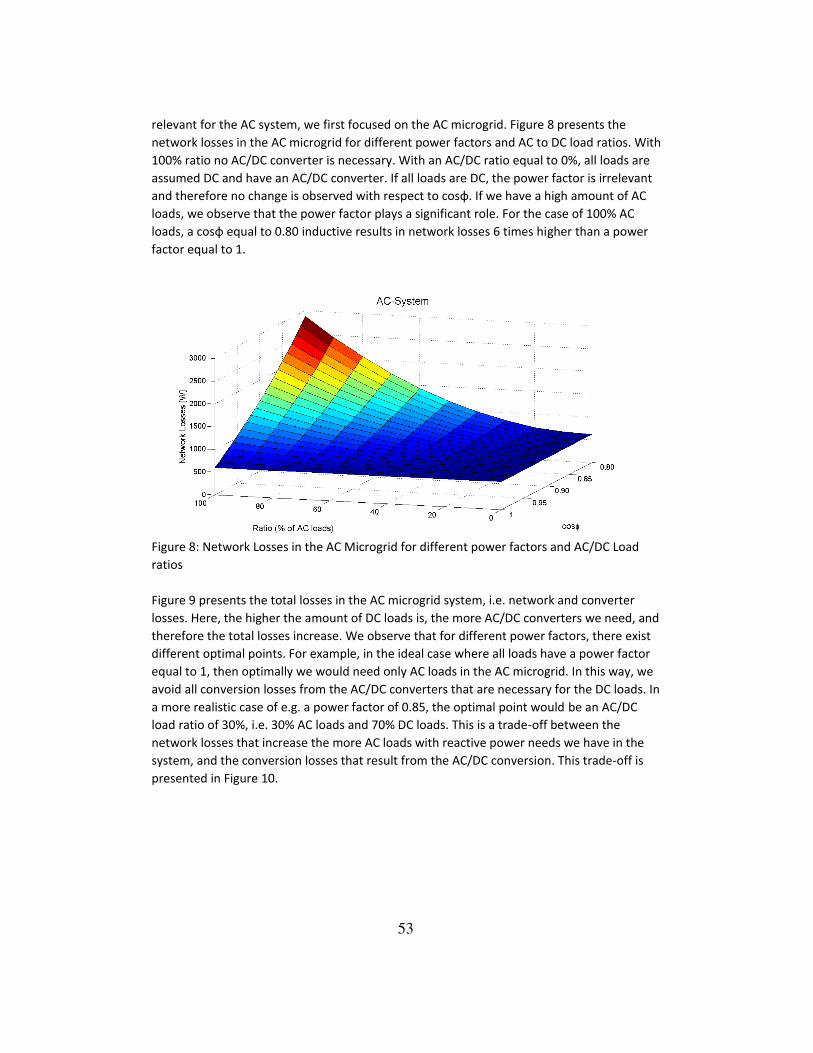
relevant for the AC system, we first focused on the AC microgrid. Figure 8 presents the
network losses in the AC microgrid for different power factors and AC to DC load ratios. With
100% ratio no AC/DC converter is necessary. With an AC/DC ratio equal to 0%, all loads are
assumed DC and have an AC/DC converter. If all loads are DC, the power factor is irrelevant
and therefore no change is observed with respect to cosφ. If we have a high amount of AC
loads, we observe that the power factor plays a significant role. For the case of 100% AC
loads, a cosφ equal to 0.80 inductive results in network losses 6 times higher than a power
factor equal to 1.
Figure 8: Network Losses in the AC Microgrid for different power factors and AC/DC Load
ratios
Figure 9 presents the total losses in the AC microgrid system, i.e. network and converter
losses. Here, the higher the amount of DC loads is, the more AC/DC converters we need, and
therefore the total losses increase. We observe that for different power factors, there exist
different optimal points. For example, in the ideal case where all loads have a power factor
equal to 1, then optimally we would need only AC loads in the AC microgrid. In this way, we
avoid all conversion losses from the AC/DC converters that are necessary for the DC loads. In
a more realistic case of e.g. a power factor of 0.85, the optimal point would be an AC/DC
load ratio of 30%, i.e. 30% AC loads and 70% DC loads. This is a trade-off between the
network losses that increase the more AC loads with reactive power needs we have in the
system, and the conversion losses that result from the AC/DC conversion. This trade-off is
presented in Figure 10.
53
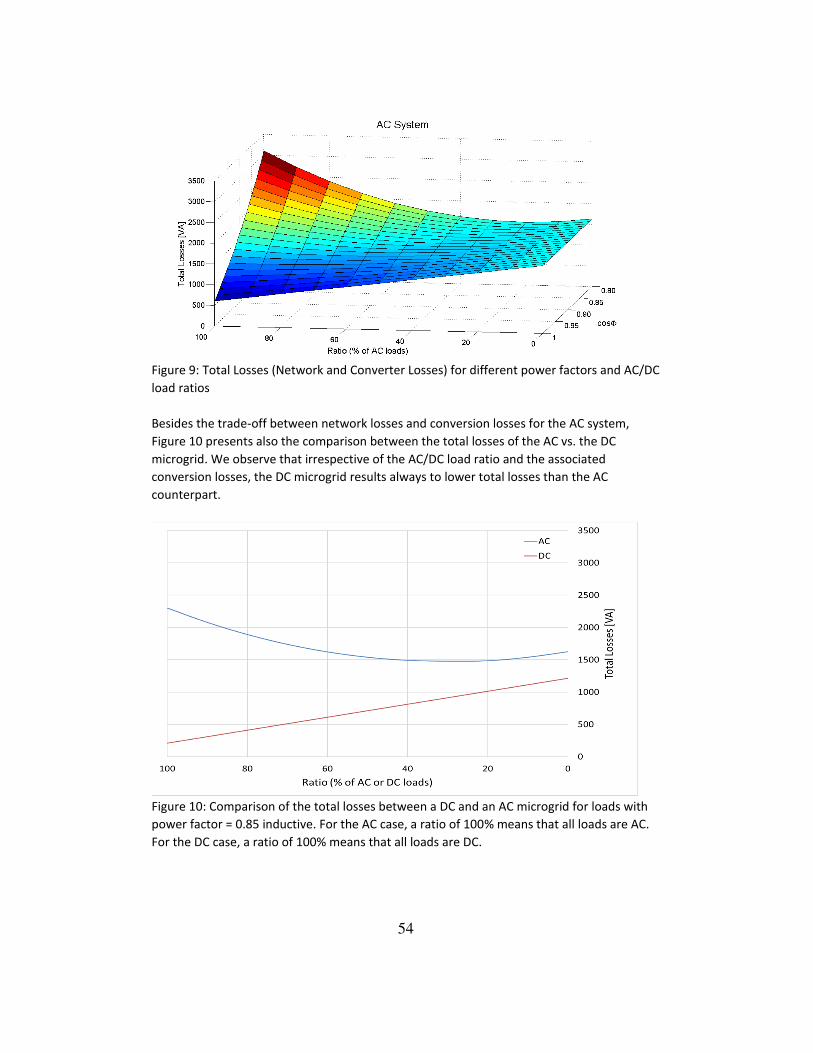
Figure 9: Total Losses (Network and Converter Losses) for different power factors and AC/DC
load ratios
Besides the trade-off between network losses and conversion losses for the AC system,
Figure 10 presents also the comparison between the total losses of the AC vs. the DC
microgrid. We observe that irrespective of the AC/DC load ratio and the associated
conversion losses, the DC microgrid results always to lower total losses than the AC
counterpart.
Figure 10: Comparison of the total losses between a DC and an AC microgrid for loads with
power factor = 0.85 inductive. For the AC case, a ratio of 100% means that all loads are AC.
For the DC case, a ratio of 100% means that all loads are DC.
54
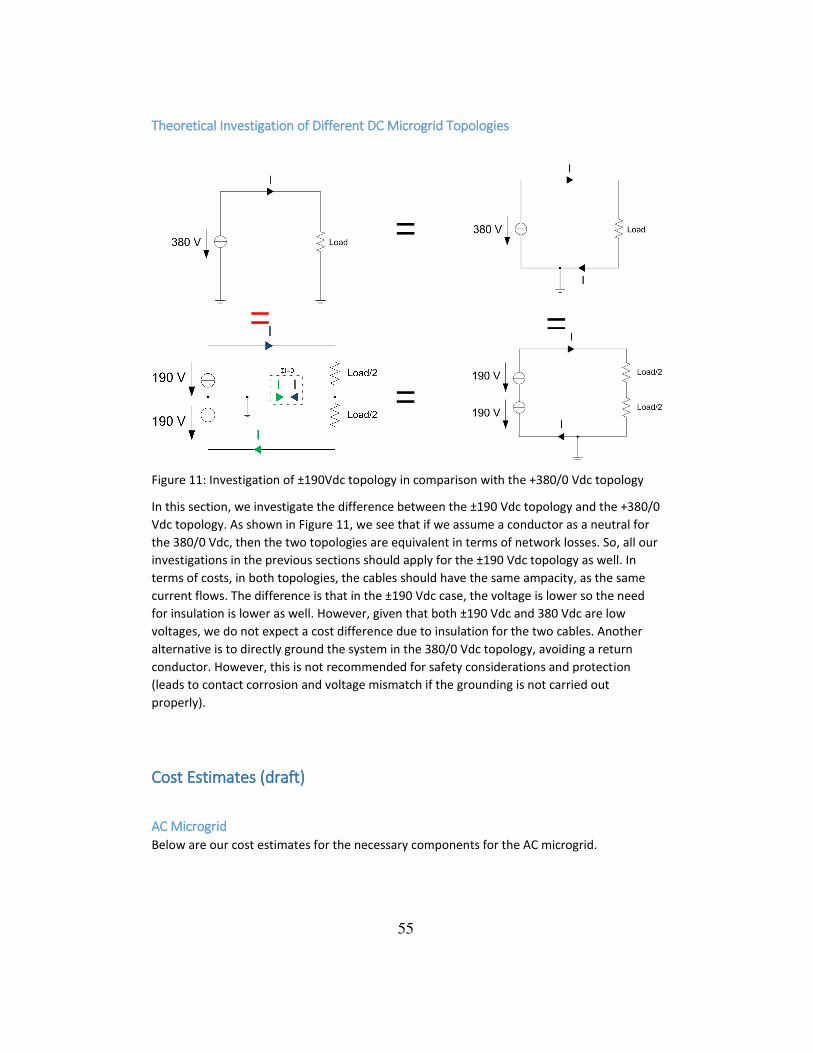
Theoretical Investigation of Different DC Microgrid Topologies
Figure 11: Investigation of ±190Vdc topology in comparison with the +380/0 Vdc topology
In this section, we investigate the difference between the ±190 Vdc topology and the +380/0
Vdc topology. As shown in Figure 11, we see that if we assume a conductor as a neutral for
the 380/0 Vdc, then the two topologies are equivalent in terms of network losses. So, all our
investigations in the previous sections should apply for the ±190 Vdc topology as well. In
terms of costs, in both topologies, the cables should have the same ampacity, as the same
current flows. The difference is that in the ±190 Vdc case, the voltage is lower so the need
for insulation is lower as well. However, given that both ±190 Vdc and 380 Vdc are low
voltages, we do not expect a cost difference due to insulation for the two cables. Another
alternative is to directly ground the system in the 380/0 Vdc topology, avoiding a return
conductor. However, this is not recommended for safety considerations and protection
(leads to contact corrosion and voltage mismatch if the grounding is not carried out
properly).
Cost Estimates (draft)
AC Microgrid Below are our cost estimates for the necessary components for the AC microgrid.
=
=
=
=
55
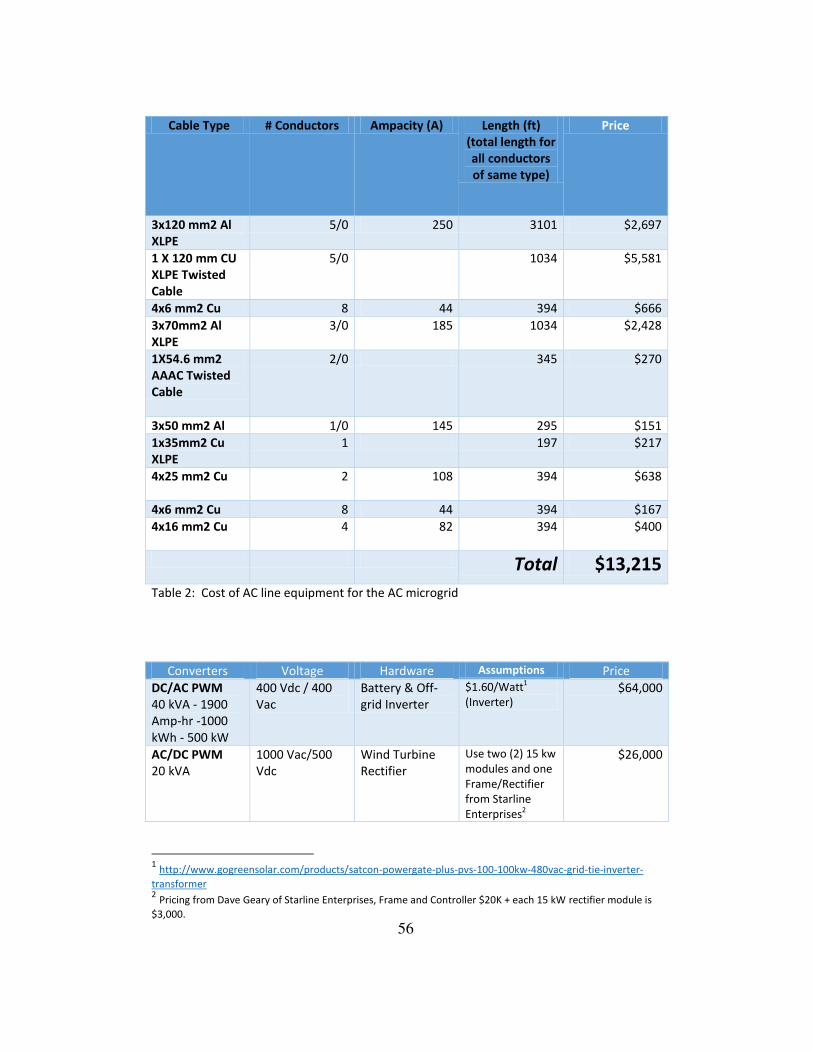
Cable Type # Conductors Ampacity (A) Length (ft) (total length for all conductors of same type)
Price
3x120 mm2 Al XLPE
5/0 250 3101 $2,697
1 X 120 mm CU XLPE Twisted Cable
5/0 1034 $5,581
4x6 mm2 Cu 8 44 394 $666
3x70mm2 Al XLPE
3/0 185 1034 $2,428
1X54.6 mm2 AAAC Twisted Cable
2/0 345 $270
3x50 mm2 Al 1/0 145 295 $151
1x35mm2 Cu XLPE
1 197 $217
4x25 mm2 Cu 2 108 394 $638
4x6 mm2 Cu 8 44 394 $167
4x16 mm2 Cu 4 82 394 $400
Total $13,215
Table 2: Cost of AC line equipment for the AC microgrid
Converters Voltage Hardware Assumptions Price
DC/AC PWM 40 kVA - 1900 Amp-hr -1000 kWh - 500 kW
400 Vdc / 400 Vac
Battery & Off-grid Inverter
$1.60/Watt1 (Inverter)
$64,000
AC/DC PWM 20 kVA
1000 Vac/500 Vdc
Wind Turbine Rectifier
Use two (2) 15 kw modules and one Frame/Rectifier from Starline Enterprises2
$26,000
1 http://www.gogreensolar.com/products/satcon-powergate-plus-pvs-100-100kw-480vac-grid-tie-inverter-
transformer 2 Pricing from Dave Geary of Starline Enterprises, Frame and Controller $20K + each 15 kW rectifier module is
$3,000. 56
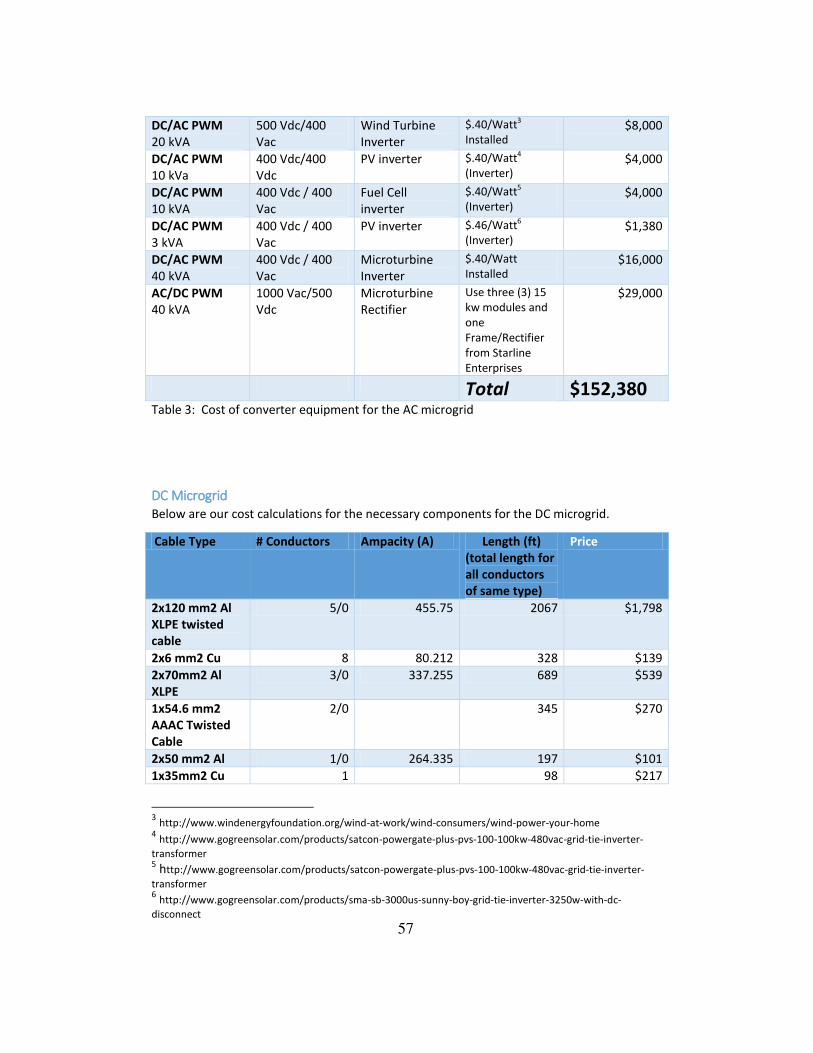
DC/AC PWM 20 kVA
500 Vdc/400 Vac
Wind Turbine Inverter
$.40/Watt3 Installed
$8,000
DC/AC PWM 10 kVa
400 Vdc/400 Vdc
PV inverter $.40/Watt4 (Inverter)
$4,000
DC/AC PWM 10 kVA
400 Vdc / 400 Vac
Fuel Cell inverter
$.40/Watt5 (Inverter)
$4,000
DC/AC PWM 3 kVA
400 Vdc / 400 Vac
PV inverter $.46/Watt6 (Inverter)
$1,380
DC/AC PWM 40 kVA
400 Vdc / 400 Vac
Microturbine Inverter
$.40/Watt Installed
$16,000
AC/DC PWM 40 kVA
1000 Vac/500 Vdc
Microturbine Rectifier
Use three (3) 15 kw modules and one Frame/Rectifier from Starline Enterprises
$29,000
Total $152,380 Table 3: Cost of converter equipment for the AC microgrid
DC Microgrid Below are our cost calculations for the necessary components for the DC microgrid.
Cable Type # Conductors Ampacity (A) Length (ft) (total length for all conductors of same type)
Price
2x120 mm2 Al XLPE twisted cable
5/0 455.75 2067 $1,798
2x6 mm2 Cu 8 80.212 328 $139
2x70mm2 Al XLPE
3/0 337.255 689 $539
1x54.6 mm2 AAAC Twisted Cable
2/0 345 $270
2x50 mm2 Al 1/0 264.335 197 $101
1x35mm2 Cu 1 98 $217
3 http://www.windenergyfoundation.org/wind-at-work/wind-consumers/wind-power-your-home 4 http://www.gogreensolar.com/products/satcon-powergate-plus-pvs-100-100kw-480vac-grid-tie-inverter-
transformer 5 http://www.gogreensolar.com/products/satcon-powergate-plus-pvs-100-100kw-480vac-grid-tie-inverter-
transformer 6 http://www.gogreensolar.com/products/sma-sb-3000us-sunny-boy-grid-tie-inverter-3250w-with-dc-
disconnect 57
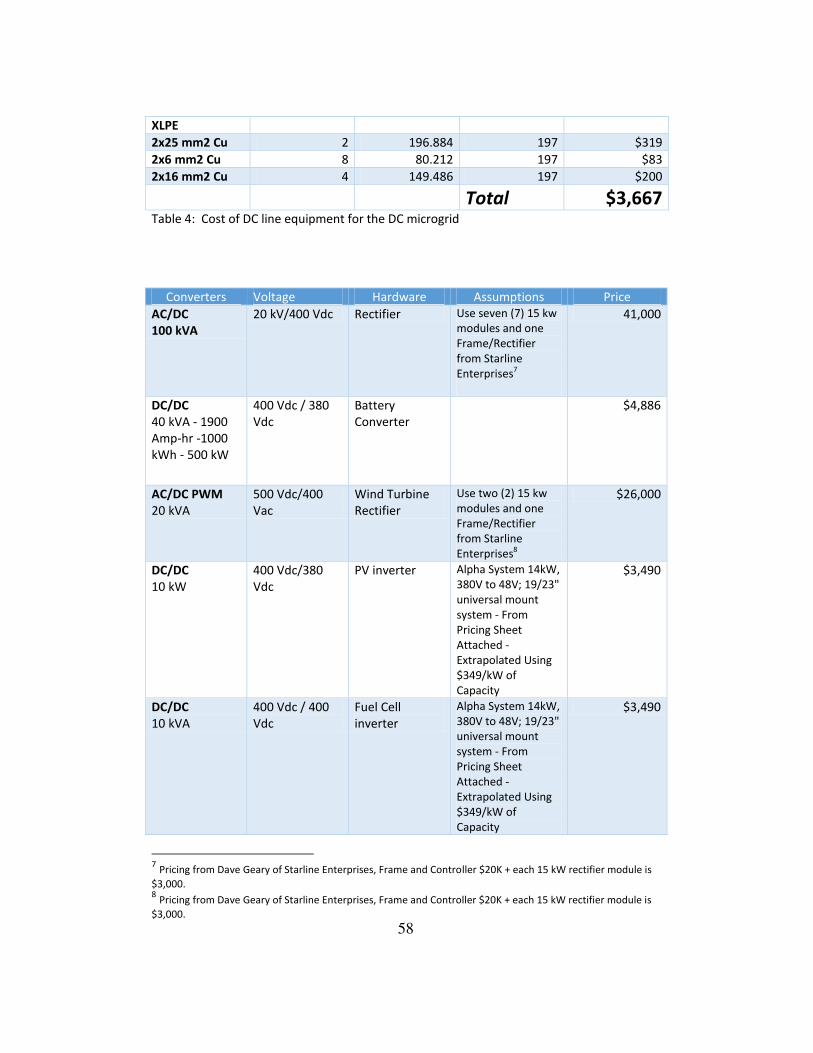
XLPE
2x25 mm2 Cu 2 196.884 197 $319
2x6 mm2 Cu 8 80.212 197 $83
2x16 mm2 Cu 4 149.486 197 $200 Total $3,667 Table 4: Cost of DC line equipment for the DC microgrid
Converters Voltage Hardware Assumptions Price
AC/DC 100 kVA
20 kV/400 Vdc Rectifier Use seven (7) 15 kw modules and one Frame/Rectifier from Starline Enterprises7
41,000
DC/DC 40 kVA - 1900 Amp-hr -1000 kWh - 500 kW
400 Vdc / 380 Vdc
Battery Converter
$4,886
AC/DC PWM 20 kVA
500 Vdc/400 Vac
Wind Turbine Rectifier
Use two (2) 15 kw modules and one Frame/Rectifier from Starline Enterprises8
$26,000
DC/DC 10 kW
400 Vdc/380 Vdc
PV inverter Alpha System 14kW, 380V to 48V; 19/23" universal mount system - From Pricing Sheet Attached - Extrapolated Using $349/kW of Capacity
$3,490
DC/DC 10 kVA
400 Vdc / 400 Vdc
Fuel Cell inverter
Alpha System 14kW, 380V to 48V; 19/23" universal mount system - From Pricing Sheet Attached - Extrapolated Using $349/kW of Capacity
$3,490
7 Pricing from Dave Geary of Starline Enterprises, Frame and Controller $20K + each 15 kW rectifier module is
$3,000. 8 Pricing from Dave Geary of Starline Enterprises, Frame and Controller $20K + each 15 kW rectifier module is
$3,000. 58

DC/DC 3 kVA
400 Vdc / 400 Vac
DC-DC Converter
Alpha System 14kW, 380V to 48V; 19/23" universal mount system - From Pricing Sheet Attached - Extrapolated Using $349/kW of Capacity
$1,047
AC/DC PWM 40 kVA
1000 Vac/500 Vdc
Microturbine Use three (3) 15 kw modules and one Frame/Rectifier from Starline Enterprises9
$29,000
Total $82,913
Table 5: Cost of converter equipment for the DC microgrid
Total Costs AC Microgrid: 165,595 USD
Total Costs DC Microgrid: 86,580 USD
Total Cost Savings: 79,016 USD
As we observe from the above tables, the major cost component for both microgrids are the
AC/DC or DC/DC converters. In total, we see that the DC microgrid results to about USD
79,016 less costs. This is about 50% less costs for building a DC microgrid in comparison with
an AC microgrid.
AC Microgrid 120 V – 60 Hz Our studies have been carried out on a 400 V / 50 Hz AC microgrid, as this was the only
widely available fully documented model in the literature. CERTS microgrid is also running on
480 Vac (phase/phase), with transformers 277/120 Vac (phase/neutral) to supply local loads.
For microgrid voltage levels similar to the CERTS microgrid we do not expect significant
differences from the results presented in this study.
Although 120 Vac is the standard residential voltage for the US, operating a microgrid at
120/208 Vac would be improbable, as it would lead to substantial losses. In any case, in this
section we attempt some estimates for the losses in such a case. The AC microgrid losses are
expected to increase for two reasons. First, due to the lower voltage, and, second, due to
the higher frequency, which results in higher reactance, i.e. X=j*2πf*L.
9 Pricing from Dave Geary of Starline Enterprises, Frame and Controller $20K + each 15 kW rectifier module is
$3,000. 59
For short distances a line can be approximated as a series impedance Z=R+jX. The losses are
equal to Slosses = I2 R + j I2 X. Due to the higher frequency, the reactive losses due to X will be
20% higher. Due to the lower voltage 208 Vac phase/phase vs. 400 Vac, for the same
amount of power, we need twice the amount of current. Assuming similar conductors to
keep infrastructure costs the same, the current will increase twice and the losses four times.
So, for the same conductors, comparing with Fig. 5, there will be an additional loss of 30,000
kWh, which results in costs of 6,000 USD per year. This doubles the annual costs for losses of
the AC microgrid. If new conductors, with lower resistance are selected, this will increase the
capital costs. A detailed study is necessary in this case to determine the necessary lengths of
each conductor type and identify the increase in these costs.
Conclusions Concluding this application, we find that DC microgrids are always superior to their AC
counterpart with respect to the total network losses. They result in up to 90% less losses and
have the potential to lead to up to 20% – 30% cost savings. We have also observed that the
load power factor plays a significant role for the efficiency, and replacing AC loads with low
power factor with DC loads leads to higher energy savings.
In terms of efficiency gains due to network and conversion losses, a DC microgrid is always
preferable, independent of the load mix, i.e. how many loads are native-AC and how many
native-DC. The final decision for a retrofit, however, is also dependent on the costs. Given
that several loads and Distributed Generation are native-DC, we expect that a DC microgrid
will also be cost-effective for new microgrids, especially if these are off-grid or usually
operated in islanded mode (thus avoiding the high capital costs and bidirectional losses of
the AC/DC converter at the interface with the AC grid).
As seen in our cost calculations, for new microgrids, building a DC microgrid results to about
50% costs less than its AC counterpart.
On the other hand, it is not clear if retrofitting existing grid-connected microgrids is
economically attractive based only on the efficiency gains, as the total losses amount to
about 3%-6% of the total energy consumed. Still, additional research is necessary to identify
additional benefits of DC microgrids, especially with respect to resiliency and power quality,
and determine if such advantages can substantially contribute in making DC microgrids
retrofits economically attractive for grid-connected applications as well.
References
[1] S. Papathanasiou, N. Hatziargyriou, K. Strunz, A Benchmark Low Voltage Microgrid
Network, CIGRE Symposium "Power systems with dispersed generation: technologies,
impacts on development, operation and performances", April 2005, Athens, Greece.
[2] DigSilent Powerfactory. Online: http://www.digsilent.de/
60

Application #2—High Survivability DC Microgrids
Introduction Power systems have notably been susceptible to severe environmental conditions during the past
decade. Events such as hurricane Katrina in 2005 and hurricane Sandy in 2012 have exacerbated some
of the weaknesses associated with our modern power grid to severe events. Other less extreme events
such as ice storms, snow storms, downed tree limbs, and small animals often result in more localized
power outages that can impact customers for minutes to days. The utilities have developed schemes to
clear smaller system faults.
Increasing survivability to unplanned damaging events is important to the military as well as commercial
utilities. In particular naval ships and forward operating bases are two examples for which this
characteristic is important.
Approaches to survivability can be classified into two classes, proactive and reactive (protection and
restoration) [1]. For the purposes of this discussion survivability will be considered in the context of
resiliency to a damaging event. From this point forward a damaging event and an event will be
synonymous for this discussion. In contrast to reliability, resiliency implies events that have low
probability but high consequence.
Increased survivability can be achieved by further reducing the likelihood of an event that results in
system damage, increasing the ability of the system to withstand an event, and reducing the
consequences associated with an event. The following sections discuss DC microgrids and approaches
to address survivability in the context of these three approaches.
Event exposure reduction Reducing or even preventing exposure to an event would be considered a proactive step. An approach
to reducing the likelihood of an event would be: only constructing power systems in areas that would
not be exposed to an event such as a hurricane, ice storm, etc. Utilities use a similar approach by
trimming tree limbs in the vicinity of power lines. These and other methods can help reduce the risk of
damage to power systems but are not always feasible due to existing inhabitants for the utilities or due
to the mission needs of forward operating bases and Naval ships. For systems such as these alternative
approaches must be taken to increase survivability.
Ruggedness Increasing the ruggedness of a power system would also be considered a proactive step. In cases where
reducing exposure to potentially damaging events is not possible an alternative is to increase the
ruggedness of the microgrid. This can be considered for events internal and external to the microgrid.
61
Each individual component in the microgrid can be designed to be more rugged to ensure that it will
survive an event. This can include moving distribution lines underground as well as redesigning
generation, storage, and load components so that they are capable of continued operation through
during floods, ice, etc. For some events this may be impossible, however, in all cases the cost will have
to be considered. At a high level DC microgrids would not be expected to have an advantage over AC
microgrids for this approach.
External events are events that occur outside the microgrid but within connected power systems. In this
case the power electronic interface between the microgrid and the other systems would act as a firewall
and/or a disconnect to ensure that the disturbance does not propagate into the microgrid [2,3,4].
Preventing events that occur internal to the microgrid from propagating out to other power systems will
also be prevented by the power electronic interface. DC microgrids may have an advantage over AC
microgrids due to the ability to filter out higher frequency content that may pass through AC/AC
connections.
System protection devices also increase the survivability. This includes fusing, circuit breakers, and
protection schemes. AC microgrids have advantages when it comes to protection considering many
decades of development have been devoted to the techniques used by utilities today. A significant
advantage for AC systems is the zero crossing of the current which enables arc extinguishing. Recent
advances in DC protection devices are starting to make improvements but at high current and voltage
levels the devices can become quite complex often involving techniques such as using magnetic fields to
break the arc.
Use of power electronics as protection devices is also a consideration. This involves converter designs
that detect fault currents followed by limiting or interrupting the current [5]. This approach does not
appear to provide advantages for either AC or DC systems and can decrease the reaction time for
eliminating the faults.
Utilization of ring-buses and fault location schemes continue to be developed to improve the ability to
provide both fault protection and identification of fault locations [6].
One last approach to increasing ruggedness may be to use forecasting. With this approach portions of
the power system may be shut down a priory to minimize damage caused by energy contained in the
power system itself. Bringing the power system back on line following an event will have to be carefully
staged to address unknown faults in the system.
Consequence reduction Both proactive and reactive steps can be taken to reduce consequences associated with an event
occurring to a power system. For the purposes here consequence reduction equates to minimizing the
time that loads are without power and minimizing the percentage of loads that are without power. The
latter should involve prioritization of loads to ensure that investments address the most critical loads
first. Local energy storage in the form of batteries, capacitor banks, and back up generation are a few
examples of components that may be added to a system to allow continued operation of loads. These
62

may even be targeted towards the most critical loads thereby addressing the most severe
consequences. Ensuring the survivability, simplifying maintenance, and maximizing the efficiency of
these added resources are important steps to enabling and maintaining power to loads for the greatest
amount of time following an event. DC microgrids would have an advantage over AC systems, regarding
efficiency, if the energy storage and the loads were matched DC components. Otherwise the
advantages would be system and load dependent.
Events such as flooding from hurricanes would likely damage most components in a power system
regardless of the AC or DC characteristics. Installation and protection schemes that would prevent
exposure of components to damaging conditions, such as elevating generators above the flood plane,
will be important for continued operation.
Reduction in the outage time or geographical area covered by the outage are additional approaches to
addressing the consequences of an event. Outage time may be reduced by simplifying the process for
bringing system generation back on line and clearing or isolating existing faults. AC power systems may
have an advantage regarding the clearing of transient faults. Otherwise the advantages of one microgrid
type over another are less clear.
Isolating faulted components or damaged areas of a microgrid can be addressed utilizing automatic
techniques already implemented by utilities today. However, microgrid networks either AC or DC may
enable more robust approaches though advanced controls [8] or by enabling topology changes [1,7,9].
This may include earlier detection of a problem or enhanced ability to prevent cascading outages.
Bibliography
1. Erol-Kantarci, M. ; Kantarci, B. ; Mouftah, H.T., “Reliable Overlay Topology Design for the Smart
Microgrid Network,” IEEE Network, Vol. 25, Issue 5, 2011, pp. 38-43.
2. K. Christidis, “Survivability Schemes for the Power Distribution Network in the Smart Grid Era,”
North Carolina State University, 2012
3. Ahmed T. Elsayed, Ahmed A. Mohamed, Osama A. Mohammed, “DC microgrids and distribution
systems: An overview,” Electric Power Systems Research, Vol. 119, February 2015, pp. 407–417.
4. Saeedifard, M. ; Energy Sources & Syst. Group, Purdue Univ., West Lafayette, IN; Graovac, M. ; Dias,
R.F.; Iravani, R., “DC power systems: Challenges and opportunities,” 2010 IEEE Power and Energy
Society General Meeting, July 25-29, 2010, pp. 1-7.
5. Tseng, K.J. ; Sch. of Electr. & Electron. Eng., Nanyang Technol. Univ., Singapore, Singapore; Guomin
Luo, “Power electronic-based protection for direct-current power distribution in micro-grids,” 2014
International Power Electronics Conference (IPEC-Hiroshima 2014 - ECCE-ASIA), May 18-21, 2014,
pp. 2145-2151.
6. Park, Jae-Do1; Candelaria, Jared1; Ma, Liuyan1; Dunn, Kyle1, “DC ring-bus microgrid fault protection
and identification of fault location,” IEEE Transactions on Power Delivery, Vol. 28, No. 4, 2013, pp.
2574-2584
63

7. Simonov, M. ; Ist. Superiore Mario Boella, Turin, Italy, “Dynamic Partitioning of DC Microgrid in
Resilient Clusters Using Event-Driven Approach,” IEEE Transactions on Smart Grid, Vol. 5 Issue 5,
April 25, 2014
8. Colson, C. M., M. H. Nehrir, and R. W. Gunderson, “Multi-agent microgrid power management,”
Proceedings of 18th IFAC World Congress. 2011
9. H. Gabbar, R. Islam, M. Isham, and V. Trivedi, “Risk-based performance analysis of microgrid
topology with distributed energy generation,” Electrical Power and Energy Systems Journal, Vol. 43,
2012, pp. 1363-1375.
64
Application #3—Low Power Network with Differentiated and
Automatically Evolvable Power Quality and Reliability
Challenges: Achieving systems of 100 kW of capacity
Brief Description— DC has always dominated communications networks. Telephone service was reliably
powered for generations with a low power DC grid that reached virtually every home and business—a
highly resilient system designed to survive extended periods without grid power. More familiar today,
Power Over Ethernet (PoE) networks are ubiquitous in commercial buildings. Such networks, or similar
ones, can be beneficially extended to serve other sensitive loads beyond communications, in an efficient
and reliable fashion while eliminating the need for individual power supplies. This includes end uses
such as computing, medical devices, entertainment, control systems, other electronics, emergency
equipment, etc. - indeed a few non-communications PoE devices, such as lighting, are already on the
market. The technology under consideration here delivers both power and data. It could be a low power
(<100 W loads) network like PoE or USB, or some higher power high PQR system. Automatic and
evolving segmentation of critical loads would provide backup power on a device-by-device level
eliminating the need for and providing greater flexibility than individual battery backups. A few large
battery backups would require less maintenance cost than many individual units. Segmenting power
quality sensitive loads to PoE networks and keeping them off of normal utility service can makes
industrial and building control systems more robust while permitting lower power quality service to the
much larger non-sensitive loads.
Base Case for Comparison— Devices powered individually using AC/DC power supplies connected to a
normal 120V AC supply with critical loads individually backed up. Smart devices individually managed,
and data collection independent of power supply..
Is This Uniquely a DC application?—No. The devices of interest are native DC, but they are generally
supplied now with standard AC service.
Potential Impacts— Assessing the cost-benefit of these microgrids has two levels. First, the PQR of
service delivered to the critical load, or sub-load. And second, the implications of its existence for other
loads and systems. As with other DC networks, there are peripheral effects worthy of consideration,
such as improved heat management, both within devices and buildings.
The scenarios described below are considered general.
The backbone of DC microgrid is either powered by centralized ac/dc rectifiers (denoted as Scenario A)
or the local dc generation such as solar or fuel cell assisted by battery storage systems (denoted as
Scenario B), and dc/dc converters are used to power individual native dc loads;
65

1. The backbone DC voltage can be 48V1 or 380V;
2. The AC loads are served directly by the existing AC power supply;
3. The ac/dc rectifiers needed for individual dc loads in an existing system are replaced by dc/dc
converters in DC microgrid that are converted from the existing system.
Reliability—primary benefit
o Positive—
For Scenario A, greatly reduced device outage statistics (SAIDI and/or SAIFI, or suitable
modification) because: back-up service is more easily managed centrally than
individually for small power high value added loads, smart environment enables
heterogeneity and prioritization of service, control of other larger devices enhances the
reliability of its service, better heat management improves device reliability.
For Scenario B, the local solar generation or other dc sources such as fuel cells, with
battery systems will potentially enhance the reliability of the DC microgrid. Otherwise,
the difference in reliability will stay the same.
o Negative— Overall reliability dependent on effective maintenance of the DC microgrid
including the reliability of the primary source of power, e.g., AC-to-DC power converters or
the local generation sources that supply the DC system
Power Quality—primary benefit
For Scenario A, due to the lack of power quality features designed for the DC native loads, the power
quality features have to be equipped with the backbone rectifiers to accommodate the non-sinusoid
currents provided the high volume of DC native loads to be installed. For Scenario B, this issue will be
eliminated.
o Positive—Fewer excursions outside of CBEMA/ITIC (for DC relative to AC) because of
isolation from AC system and generally lower power loads
o Negative:
For Scenario A, i.e., the backbone of DC microgrid is powered by centralized ac/dc
rectifiers. If the DC backbone is used directly as power source, the power quality is
expected to be lower 2 because this is inherent to power electronics of high
capacities. For lower voltage loads powered via low capacity dc/dc converters,
power quality issue is not a concern.
For Scenario B, i.e., the backbone of DC microgrid is powered by local generation,
there is no power quality issue compared to the system powered by AC supply.
Energy Efficiency—secondary benefit
1 This is how people most commonly reference PoE and similar systems. The voltage level for such systems can
vary between 43 and 57 V. Since PoE is the focus of this study, other applications such as 24V EMerge standard are not considered. 2 The total harmonic distortion (THD) for (1) a 6-pulse rectifier is between 30% and 50%; (2) a 12-pulse rectifier
between 10% and 15%; and (3) a PWM-rectifier between 3% and 5%.
66

o Positive—Lower losses because centralization of power conversion improves efficiency and
most power conversions are avoided entirely. Lower cooling demands if power supplies are
removed from the building.
o Positive – if 380V DC is adopted, the losses associated with delivery may be reduced for
both Scenarios A and B compared to AC power supply of existing buildings (110V or 220V)3.
o Positive – In both Scenarios A and B, the ac/dc rectifiers needed for individual dc loads in
current ac systems will be replaced by dc/dc converters in DC microgrid4.
o Negative—Potentially higher resistive losses in low voltage systems
Operating Costs—secondary benefit
o Positive— Avoids cost of managing individual back-up systems and several alternative PQR
or efficiency schemes
o Negative—N/A
o It is difficult to tell the difference in operating costs5 for the dc microgrid and the existing
system.
Capital Costs—primary benefit
o Positive— Avoided cost of purchasing many individual power supplies and UPSs . Inherently
safe plug-and-play technologies can reduce installation complexity and labor costs.
o Negative— Potentially costly and disruptive network installation, if not preexisting or
intended for data communication, e.g. if data communication is wireless.
Engineering Costs—primary benefit
o Positive—Networks are typically highly standardized, and if suitable standards are
established, local engineering is minimal. Communications to manage power distribution
enable functions not possible with traditional technology, AC or DC, such as plug-and-play
operation for local generation, storage, and critical load selection.
o Negative—N/A
Environment
o Positive— For Scenario B (A), (potentially) lower its carbon footprint, and reduce battery
replacement.
o Negative—N/A
Safety
o Positive—Low voltage enables physical reconfiguration while energized
o Negative—N/A
3 The loss reduction can be estimated assuming that the same amount of power can be provided with half of the
current if the voltage is doubled. Assuming that all the loads are of single phase, then the loss reductions I2R will be
90% for a change from 120VAC (line to neutral) to 380VDC, and 67% from 220VAC (line to neutral) to 380VDC. 4 For the AC distribution that has to use rectifiers and dc/dc converters to power the DC loads, a total efficiency of
88~93% can be achieved. For Scenario A that requires both rectifiers and dc/dc converters, the efficiency may stay the same. For Scenario B, the efficiency using the PoE can be increased to 92~95%. 5 Maintenance should be cheaper for DC as devices could be plug-and-play, even for storage and generation. The
associated cost reduction is, however, difficult to quantify.
67
Application #4—Converting AC Systems to Hybrid AC/DC Systems
Introduction / Background
Presently, AC distribution systems are the predominantly utilized method for distributing power. This has been true since the invention of AC synchronous generators and AC induction machines [1]. AC machines have been found more efficient, requiring less maintenance, and have relatively higher power densities than DC generators and motors. However, with the growth in DC loads from switched mode power electronics in machine drives, automation, lighting, air conditioning, and computational loads reviews of potential benefits in DC are underway. In this document, a review of the conventional approach of AC systems and DC systems is provided as well as four other possible options to distribute AC and DC power using the same distribution system or electrical installation in a wire.
Option 1: Traditional AC with conversions to DC The most implemented approach for building systems is a AC voltage with conversion steps to the DC components such as loads. These loads either use DC internally or the AC is first rectified and then inverted back to AC at a different phase, magnitude, and frequency in order to control the variable AC drives. Some example loads that require DC are computers, laptop and cell phone chargers, LED and LED lighting systems. In all these loads, 120V-60Hz AC line voltage is first rectified and filtered with a DC link capacitor. Then, this DC voltage is converted to 25V, 12V, 5V, and/or 3.3V DC levels using buck type DC/DC converters or flyback DC/DC converters. DC/DC step-down conversion and the number of DC voltage levels depend on the computer power supply architecture and the needs of the computer electronics. In the case of LED lighting systems, again, AC line voltage is rectified and stepped down to 3-5V and applied to the parallel connected LEDs or a higher DC voltage is applied to a series connected string of LEDs. Another popular example of DC load is the electric vehicles (RV). Instead of converting AC to DC and then boosting the rectified voltage, a DC distribution system would be more efficient for EV charging applications. Even with the wireless power transfer based EV chargers, first DC input is needed for the high frequency inverter inputs.
With regards to the loads with AC machines, such as refrigerators, air conditioners, and washers/dryers, AC machines working with the line voltage/frequency have historically been the most popular. However, with the recent advancements in power electronics based adjustable speed/torque drives, the efficiency and effectiveness of AC machines could be improved. For example, in “direct-drive” AC systems, all mechanical reduction mechanisms such as gear boxes, chains, and/or belts since the speed/torque of the machine can be reduced or increased electronically. This eliminates the noise, improves the efficiency, provides a longer lifetime, improves reliability, and provides faster and precise speeding and positioning. Recently, in addition to washing machines, there is a trend to have air conditioner compressors, fans, refrigerator compressors, and almost all the rotational loads directly driven. Direct drive
68
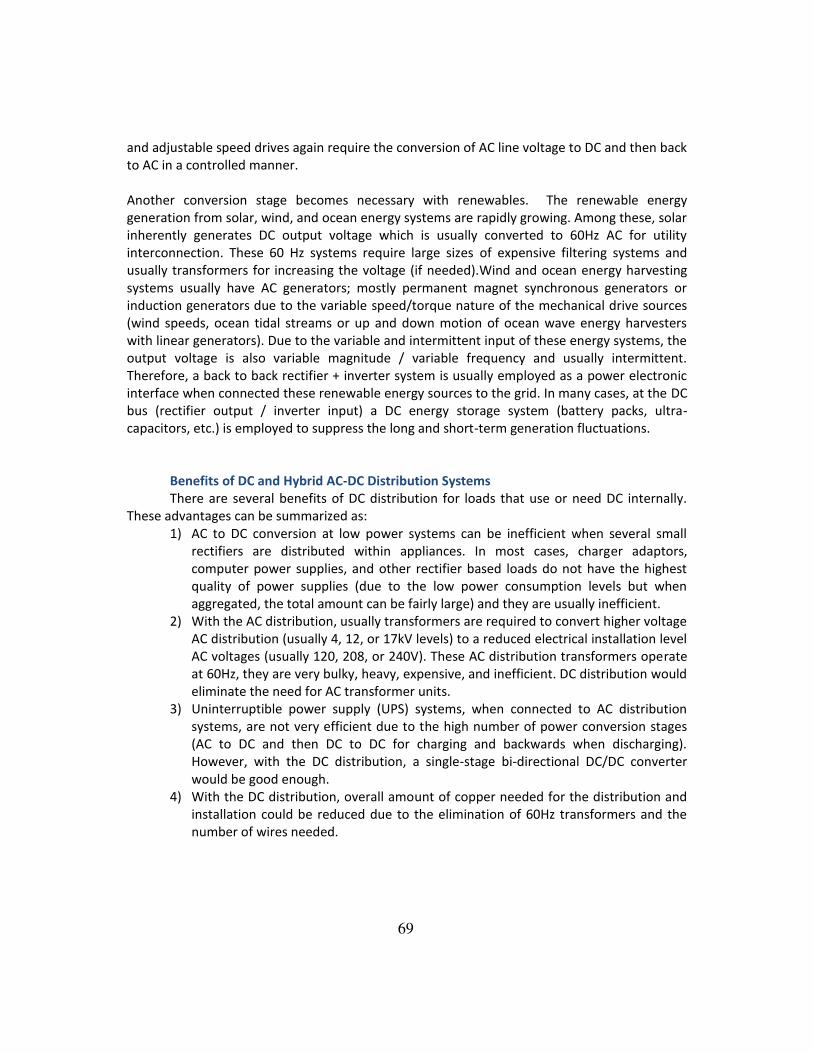
and adjustable speed drives again require the conversion of AC line voltage to DC and then back to AC in a controlled manner. Another conversion stage becomes necessary with renewables. The renewable energy generation from solar, wind, and ocean energy systems are rapidly growing. Among these, solar inherently generates DC output voltage which is usually converted to 60Hz AC for utility interconnection. These 60 Hz systems require large sizes of expensive filtering systems and usually transformers for increasing the voltage (if needed).Wind and ocean energy harvesting systems usually have AC generators; mostly permanent magnet synchronous generators or induction generators due to the variable speed/torque nature of the mechanical drive sources (wind speeds, ocean tidal streams or up and down motion of ocean wave energy harvesters with linear generators). Due to the variable and intermittent input of these energy systems, the output voltage is also variable magnitude / variable frequency and usually intermittent. Therefore, a back to back rectifier + inverter system is usually employed as a power electronic interface when connected these renewable energy sources to the grid. In many cases, at the DC bus (rectifier output / inverter input) a DC energy storage system (battery packs, ultra-capacitors, etc.) is employed to suppress the long and short-term generation fluctuations.
Benefits of DC and Hybrid AC-DC Distribution Systems There are several benefits of DC distribution for loads that use or need DC internally.
These advantages can be summarized as: 1) AC to DC conversion at low power systems can be inefficient when several small
rectifiers are distributed within appliances. In most cases, charger adaptors, computer power supplies, and other rectifier based loads do not have the highest quality of power supplies (due to the low power consumption levels but when aggregated, the total amount can be fairly large) and they are usually inefficient.
2) With the AC distribution, usually transformers are required to convert higher voltage AC distribution (usually 4, 12, or 17kV levels) to a reduced electrical installation level AC voltages (usually 120, 208, or 240V). These AC distribution transformers operate at 60Hz, they are very bulky, heavy, expensive, and inefficient. DC distribution would eliminate the need for AC transformer units.
3) Uninterruptible power supply (UPS) systems, when connected to AC distribution systems, are not very efficient due to the high number of power conversion stages (AC to DC and then DC to DC for charging and backwards when discharging). However, with the DC distribution, a single-stage bi-directional DC/DC converter would be good enough.
4) With the DC distribution, overall amount of copper needed for the distribution and installation could be reduced due to the elimination of 60Hz transformers and the number of wires needed.
69
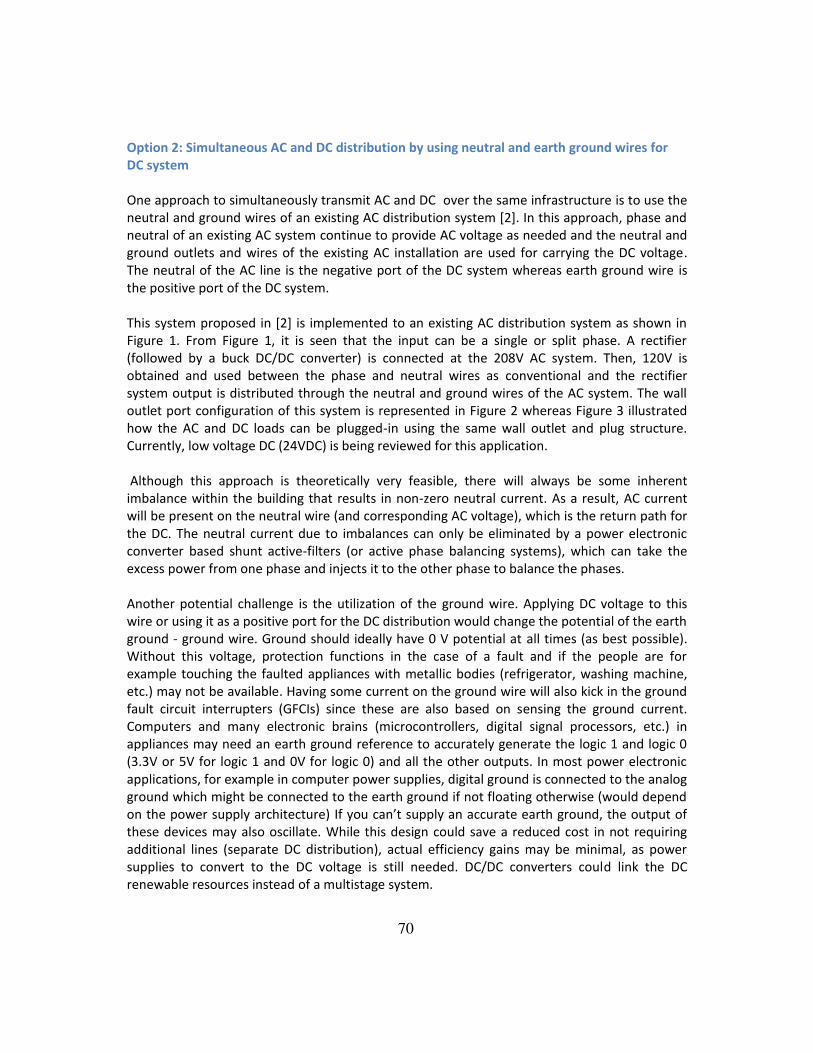
Option 2: Simultaneous AC and DC distribution by using neutral and earth ground wires for DC system One approach to simultaneously transmit AC and DC over the same infrastructure is to use the neutral and ground wires of an existing AC distribution system [2]. In this approach, phase and neutral of an existing AC system continue to provide AC voltage as needed and the neutral and ground outlets and wires of the existing AC installation are used for carrying the DC voltage. The neutral of the AC line is the negative port of the DC system whereas earth ground wire is the positive port of the DC system. This system proposed in [2] is implemented to an existing AC distribution system as shown in Figure 1. From Figure 1, it is seen that the input can be a single or split phase. A rectifier (followed by a buck DC/DC converter) is connected at the 208V AC system. Then, 120V is obtained and used between the phase and neutral wires as conventional and the rectifier system output is distributed through the neutral and ground wires of the AC system. The wall outlet port configuration of this system is represented in Figure 2 whereas Figure 3 illustrated how the AC and DC loads can be plugged-in using the same wall outlet and plug structure. Currently, low voltage DC (24VDC) is being reviewed for this application. Although this approach is theoretically very feasible, there will always be some inherent imbalance within the building that results in non-zero neutral current. As a result, AC current will be present on the neutral wire (and corresponding AC voltage), which is the return path for the DC. The neutral current due to imbalances can only be eliminated by a power electronic converter based shunt active-filters (or active phase balancing systems), which can take the excess power from one phase and injects it to the other phase to balance the phases. Another potential challenge is the utilization of the ground wire. Applying DC voltage to this wire or using it as a positive port for the DC distribution would change the potential of the earth ground - ground wire. Ground should ideally have 0 V potential at all times (as best possible). Without this voltage, protection functions in the case of a fault and if the people are for example touching the faulted appliances with metallic bodies (refrigerator, washing machine, etc.) may not be available. Having some current on the ground wire will also kick in the ground fault circuit interrupters (GFCIs) since these are also based on sensing the ground current. Computers and many electronic brains (microcontrollers, digital signal processors, etc.) in appliances may need an earth ground reference to accurately generate the logic 1 and logic 0 (3.3V or 5V for logic 1 and 0V for logic 0) and all the other outputs. In most power electronic applications, for example in computer power supplies, digital ground is connected to the analog ground which might be connected to the earth ground if not floating otherwise (would depend on the power supply architecture) If you can’t supply an accurate earth ground, the output of these devices may also oscillate. While this design could save a reduced cost in not requiring additional lines (separate DC distribution), actual efficiency gains may be minimal, as power supplies to convert to the DC voltage is still needed. DC/DC converters could link the DC renewable resources instead of a multistage system.
70
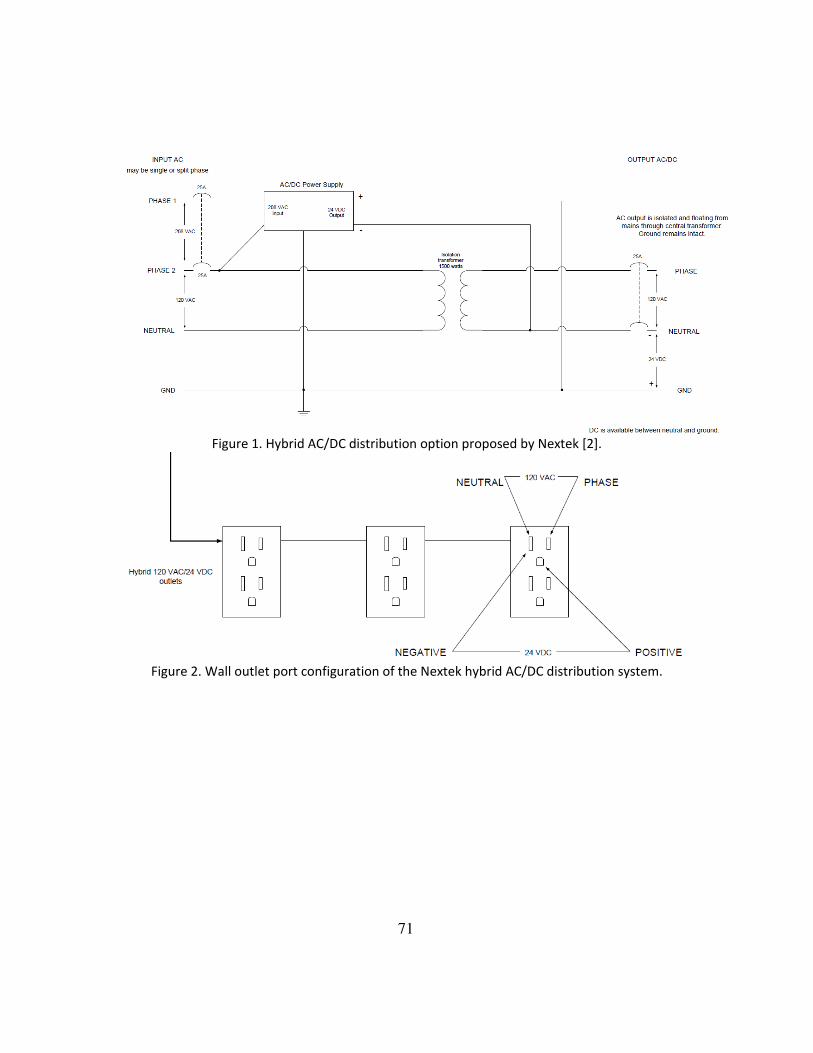
Figure 1. Hybrid AC/DC distribution option proposed by Nextek [2].
Figure 2. Wall outlet port configuration of the Nextek hybrid AC/DC distribution system.
71
Figure 3. Plugging-in the AC and DC loads with the same plug and wall outlet.
Option 3: Additional, independent DC ceiling grid installation: Proposed by the E-Merge Allinace [3], which is claimed to be an open industry
association, the DC ceiling wiring is used to bring the AC power into the existing building architecture without performing the major rewiring work that would normally require the removal or alteration of the building walls to have the DC distribution wires installed. This approach can reduce the complexity, reduce the installation time, and is a cost-effective solution without interfering the building existing AC wiring my any means. Since DC distribution has its own wires, no existing AC wires (phase, neutral, ground) are used for the DC unlike the previous option. Therefore, it is a simple and flexible reconfiguration. This approach can bring power to the DC devices/loads while providing the integration of solar panels, wind, fuel cell, and energy storage systems such as batteries [4]. The overall architecture is illustrated in Figure 4.
72
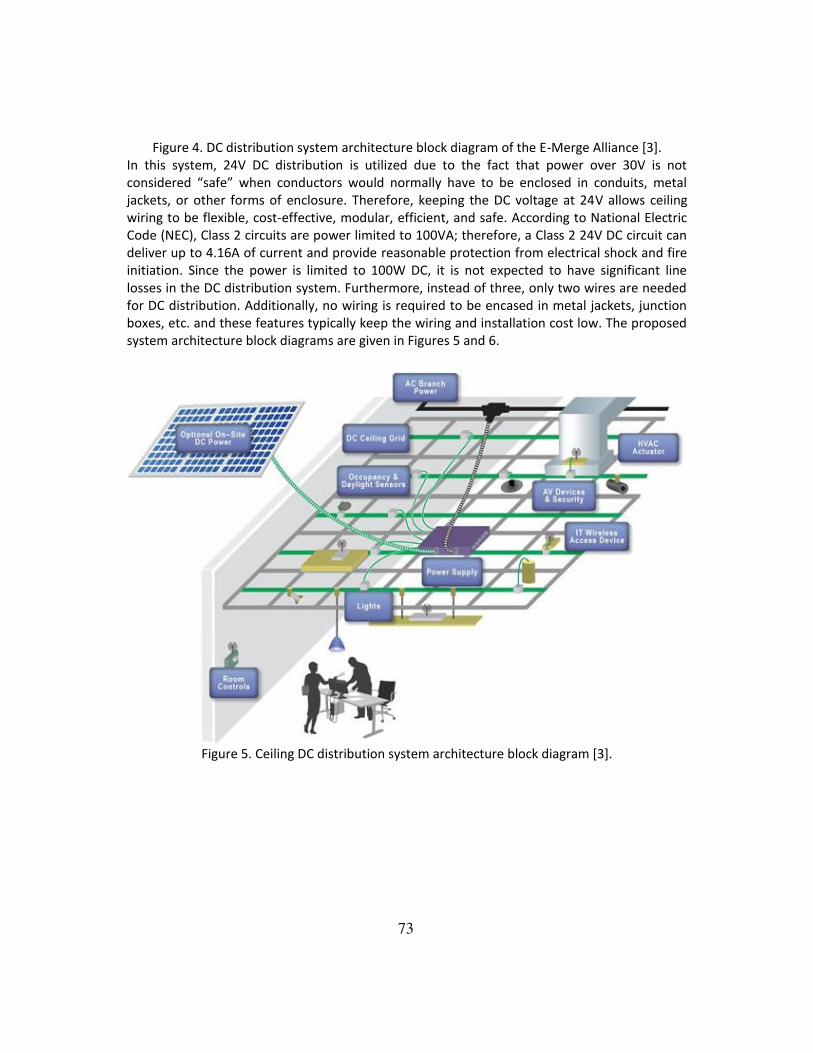
Figure 4. DC distribution system architecture block diagram of the E-Merge Alliance [3]. In this system, 24V DC distribution is utilized due to the fact that power over 30V is not considered “safe” when conductors would normally have to be enclosed in conduits, metal jackets, or other forms of enclosure. Therefore, keeping the DC voltage at 24V allows ceiling wiring to be flexible, cost-effective, modular, efficient, and safe. According to National Electric Code (NEC), Class 2 circuits are power limited to 100VA; therefore, a Class 2 24V DC circuit can deliver up to 4.16A of current and provide reasonable protection from electrical shock and fire initiation. Since the power is limited to 100W DC, it is not expected to have significant line losses in the DC distribution system. Furthermore, instead of three, only two wires are needed for DC distribution. Additionally, no wiring is required to be encased in metal jackets, junction boxes, etc. and these features typically keep the wiring and installation cost low. The proposed system architecture block diagrams are given in Figures 5 and 6.
Figure 5. Ceiling DC distribution system architecture block diagram [3].
73
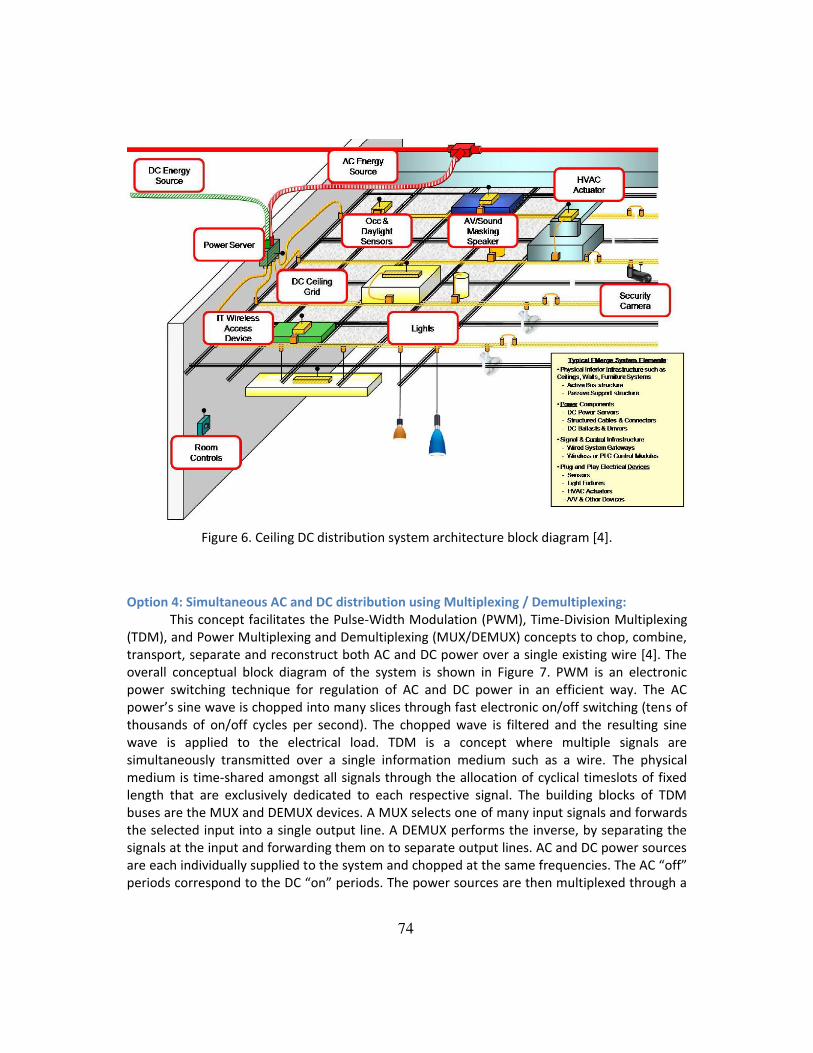
Figure 6. Ceiling DC distribution system architecture block diagram [4].
Option 4: Simultaneous AC and DC distribution using Multiplexing / Demultiplexing: This concept facilitates the Pulse-Width Modulation (PWM), Time-Division Multiplexing
(TDM), and Power Multiplexing and Demultiplexing (MUX/DEMUX) concepts to chop, combine, transport, separate and reconstruct both AC and DC power over a single existing wire [4]. The overall conceptual block diagram of the system is shown in Figure 7. PWM is an electronic power switching technique for regulation of AC and DC power in an efficient way. The AC power’s sine wave is chopped into many slices through fast electronic on/off switching (tens of thousands of on/off cycles per second). The chopped wave is filtered and the resulting sine wave is applied to the electrical load. TDM is a concept where multiple signals are simultaneously transmitted over a single information medium such as a wire. The physical medium is time-shared amongst all signals through the allocation of cyclical timeslots of fixed length that are exclusively dedicated to each respective signal. The building blocks of TDM buses are the MUX and DEMUX devices. A MUX selects one of many input signals and forwards the selected input into a single output line. A DEMUX performs the inverse, by separating the signals at the input and forwarding them on to separate output lines. AC and DC power sources are each individually supplied to the system and chopped at the same frequencies. The AC “off” periods correspond to the DC “on” periods. The power sources are then multiplexed through a
74
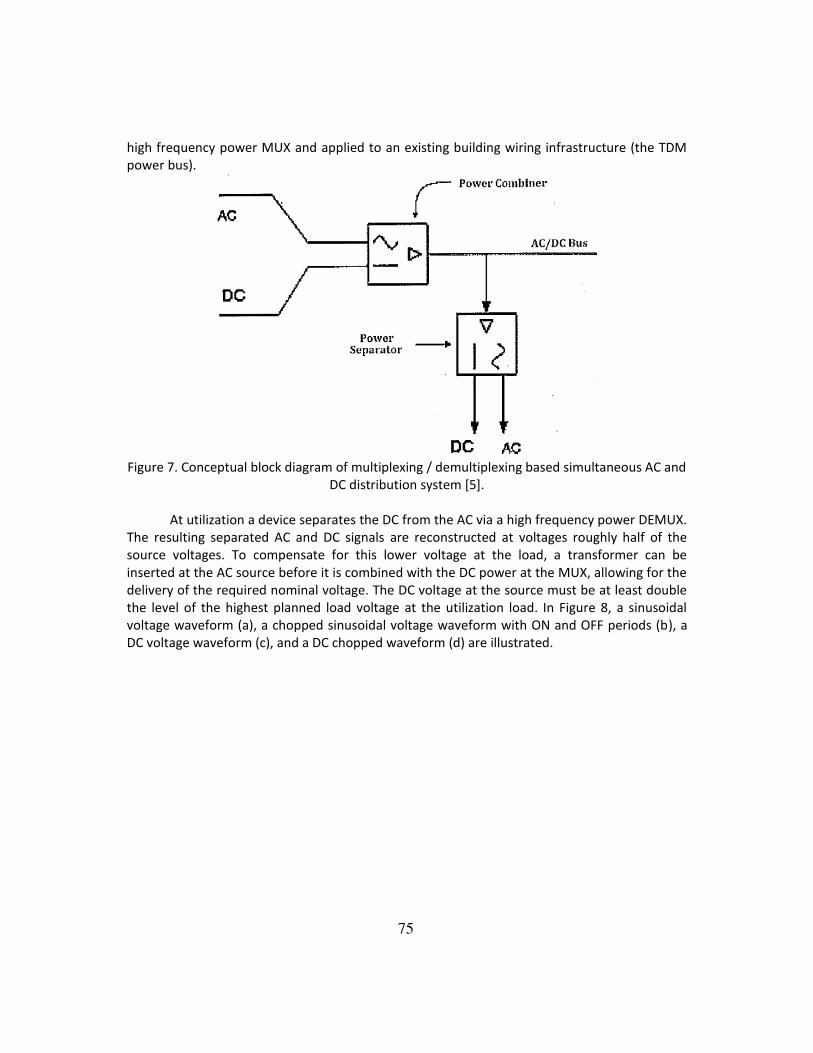
high frequency power MUX and applied to an existing building wiring infrastructure (the TDM power bus).
Figure 7. Conceptual block diagram of multiplexing / demultiplexing based simultaneous AC and
DC distribution system [5].
At utilization a device separates the DC from the AC via a high frequency power DEMUX. The resulting separated AC and DC signals are reconstructed at voltages roughly half of the source voltages. To compensate for this lower voltage at the load, a transformer can be inserted at the AC source before it is combined with the DC power at the MUX, allowing for the delivery of the required nominal voltage. The DC voltage at the source must be at least double the level of the highest planned load voltage at the utilization load. In Figure 8, a sinusoidal voltage waveform (a), a chopped sinusoidal voltage waveform with ON and OFF periods (b), a DC voltage waveform (c), and a DC chopped waveform (d) are illustrated.
75
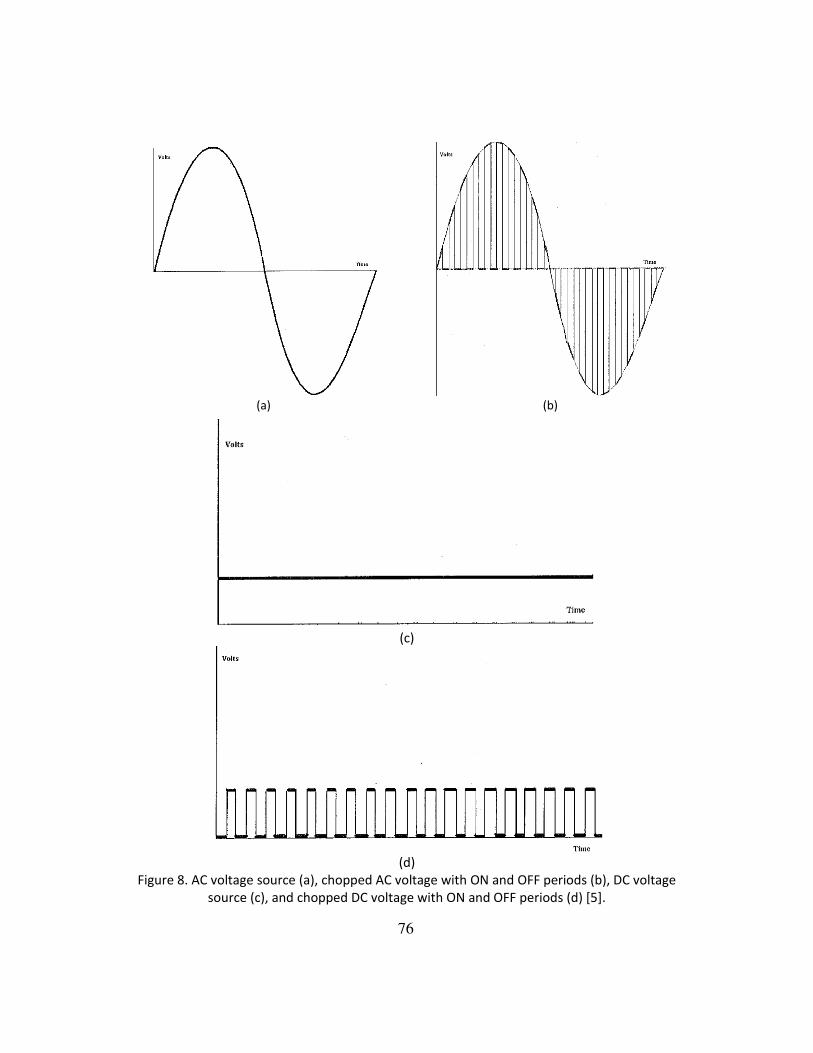
(a)
(b)
(c)
(d)
Figure 8. AC voltage source (a), chopped AC voltage with ON and OFF periods (b), DC voltage source (c), and chopped DC voltage with ON and OFF periods (d) [5].
76

Although this method is feasible and applicable, there are a a number of potential drawbacks. Once the AC voltage is chopped, a LC filter is needed at the receive-end (load side) of the system to reduce the harmonic distortions. This filter should be sized based on the number of switching instants in one period of the AC line voltage. Therefore, in order to reduce the size and cost of the passive components, switching frequency should be increased. However, as the switching frequency increases, switching losses will also increase. Considering this trade-off, an optimal switching frequency should be selected. Similarly, for the DC distribution part, a capacitive filtering should be utilized to average the DC voltage applied to the load so that the load can see a smoother effective DC voltage averaged with respect to the duty cycle and frequency of the chopped DC waveform.
Option 5: DC biasing (offset) based simultaneous AC and DC distribution system: In this concept, the AC voltage is positively biased with the addition of the DC voltage with a symmetrical drive. This system might be the most suitable for double circuit AC line since there already exist two sets of lines. By positively shifting the ground of one of the lines by the magnitude of the DC voltage and by negatively shifting the positive polarity of the other AC line, both DC and AC energy can be carried on the same system as shown in Figure 9 [6]. The drawback of this architecture is that it inherently requires an existing double AC circuit line distribution system; therefore, although this approach might be feasible for new distribution systems, retrofitting buildings is likely to be a challenge. References / Further Reading: [1] D. J. Hammerstrim, “AC versus DC distribution systems – Did we get it right?,” in Proc., IEEE Power Engineering Society General Meeting, June 2007, Tampa, FL. [2] Nextek Power Systems Hybrid Plug Power Supply, available online: http://www.nextekpower.com/#smart-power-smart-light [3] E-Merge Alliance Occupied Space Standard, available online: http://www.emergealliance.org/Standards/OccupiedSpace/RequestStandard.aspx [4] B. Patterson, P. Savage, P. Ziegenbein, and J. Zwier, “A hybrid approach to building power: Adding DC power to interior architecture”, The Youniversal, October 2009, Orlando, FL. [5] Luigi Gentile Polese, “Simultaneous Distribution of AC and DC Power,” US Patent 2012/0181853 A1, July 2012. [6] H. Rahman and B. H. Khan, “Power upgrading by simultaneous ac-dc power transfer in a double circuit ac line,” in Proc., IEEE Power India Conference, New Delhi, India, April 2006.
77
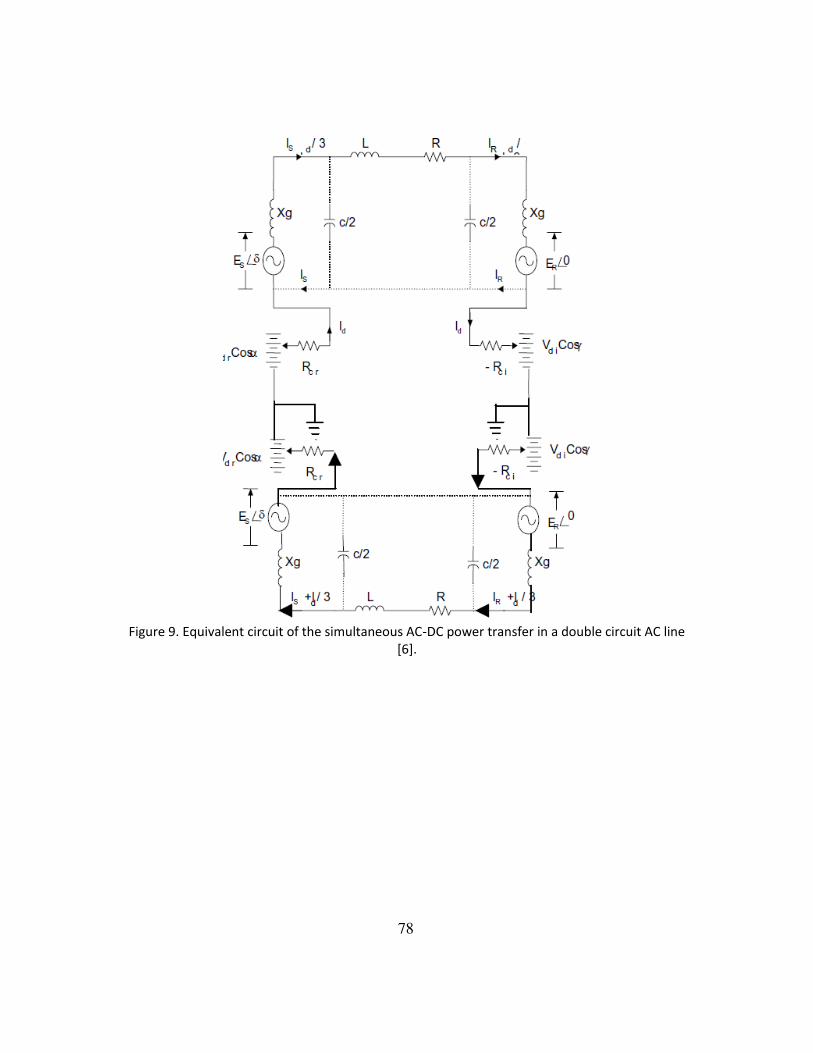
Figure 9. Equivalent circuit of the simultaneous AC-DC power transfer in a double circuit AC line
[6].
78
Application #5—Mobile and Remote Applications
Remote Microgrid Characteristics Remote microgrids face a unique challenge in that, unlike microgrids within more developed
infrastructure, there is no expectation of external energy support. Remote microgrids almost
always operate in island mode, making energy adequacy the primary concern. Before
addressing the question of AC vs. DC in remote microgrids, it is helpful to consider a few of the
common scenarios and characteristics that make remote microgrids a unique challenge.
Perhaps the most obvious remote microgrid scenario is that of an isolated community that has
not and may never be reached by the bulk electricity infrastructure. Geography often plays a
significant role in preventing the infrastructure from reaching these communities and (in a bit of
a chicken-and-egg problem) low population density in the area often makes such expansion
financially untenable [1]. These communities can be found in remote areas of both developed
and undeveloped countries, leading to widely varying expectations of microgrid performance.
The needs of communities in or associated with developed countries are likely very similar to
those of their urban counterparts: dependable, high-quality, and (seemingly) limitless electrical
energy readily available at the flick of a switch. The loads of the community would also
relatively closely match those of the nearest town or city: electric ovens and ranges, clothes
washers and driers, air-conditioners, refrigeration, and electric lighting. These communities are
likely to be powered by diesel generation, potentially with attached energy storage and some
renewables.
Remote communities in developing countries are in a far different situation. These communities
have likely never had ready access to electrical energy and likely have a microgrid in their
community to meet basic needs and/or enable basic economic development. There may or may
not be a diesel generator, and if there is, it is unlikely to be run continuously or regularly due to
expense and availability of fuel [2]. Without electric energy, lighting and heating is often
provided by kerosene and biomass, and labor is manual/animal-assisted. A microgrid in such a
community might exist to provide night-time lighting, power a pump for drinking water or
irrigation, or provide energy to a motor for small-scale manufacturing [3]. In these
communities, any semi-reliable electrical energy provides a significant marginal benefit to
quality of life and economic productivity.
A third common scenario for remote microgrids, which is something of a hybrid of the two
described above, is an expedition camp, similar to a forward military base or
surveying/prospecting trip. Like remote communities in developed countries, expedition camps
have a greater expectation of and requirement for high quality power. Though some
“convenience” loads such as air-conditioning and electric cooking may not be present, there is
likely to be specialized “mission-critical” equipment that must operate reliably. However,
because expedition camps are temporary, diesel generation may not be an option and fuel
resupply may be too infrequent. In addition, the camp may need to relocate frequently during
its mission, moving the supporting infrastructure along with it.
79

AC vs. DC
In light of these three varied scenarios, the question of whether remote microgrids are best
served by an AC or DC architecture should be considered carefully. These remote microgrids
serve a broad range of functions and loads, and the most suitable approach will likely be
influenced significantly by the unique aspects of each scenario. To reiterate, for remote
microgrids, energy adequacy is the fundamental challenge.
For remote communities in developed countries, the backbone of the existing microgrid is likely
to be an existing diesel generator that produces AC electrical energy. The loads the community
purchases and adds to the grid will also likely be AC loads as these are manufactured for the
developed world with which they interact. There may be some PV and energy storage on the
microgrid to reduce diesel fuel consumption, but unless these sources are providing a significant
portion of the energy the community uses, implementing or converting to a DC microgrid in
unlikely to offer significant advantages (economic or technical). These types of communities are
essentially remote extensions of the developed AC world and are likely best served by
conforming to the existing AC standard.
If DC-powered equipment (lighting, appliances, etc.) were to become common in the developed
world, it would justify a technical analysis of the costs and benefits to determine if conversion
from AC to DC would be beneficial overall. Even for these developed remote microgrids, the
cost and delivery of the diesel fuel is significant enough to place a practical limit on the amount
of electrical energy used. Any conversion to a DC microgrid would have to offer efficiency gains
that would noticeably reduce the concerns of economical energy adequacy.
Barring the commonplace occurrence of DC consumer products in the developed world, a DC
microgrid may still offer advantages if the energy source were to change from primarily diesel to
renewable generation, particularly if DC energy storage were included. If the most available
and/or economical energy source is primarily DC-based but the loads are still AC-based, an
inverter would be required to provide energy to the community. The choice of AC or DC would
be driven by the economic adequacy question. Is diesel generation still needed to power the
community? What is the efficiency of the power electronics involved? How does the cost of the
additional equipment compare with diesel fuel costs? What is the payback period?
Remote communities in developing countries have very different needs and expectations.
Assuming that dependable diesel generation is likely to remain economically out of reach and
that the loads of the community are much lower than those in the developed world,
renewable energy, likely PV, will be the essential generation source. Batteries are also
likely to play an important role, particularly in providing nighttime lighting. If an
architecture similar to this is implemented, a DC microgrid makes the most sense; there
is little immediate benefit gained in converting these DC sources to provide AC electrical
energy.
There are a few exceptions to using a DC microgrid in remote communities. Light industrial loads such as motors and pumps could play a significant role in enabling
80

economic development, and the most robust implementations use AC motors. DC motors routinely use brushes that require regular replacement and thus are less suitable to remote, undeveloped locations. AC motors or DC brushless motors could be used with the help of power electronics, but this is an additional expense and adds complexity. Additionally, for some of these communities it is possible that the “remote” microgrid is not very remote, and there could be an expectation that at some point the larger power transmission and distribution system will connect with this existing microgrid. If this were to occur, it would be most advantageous if the existing loads were already AC compatible [4]. Again, power electronics could remedy this AC-DC mismatch at an additional financial cost. For remote microgrids associated with expedition camps, the choice of AC or DC is least clear. Diesel generation with frequent fuel resupply may or may not be a part of normal operation, and consequentially the significance of renewable generation will also vary. The degree of mobility will vary case-by-case, as will the particular loads that will need powering. The best general approach in considering expedition camp applications is to determine whether the needs and circumstances of the microgrid are closer to that of the developed or developing world. Developed world expeditions with some connection to fuel supplies and more conventional AC loads (large forward operating military bases, for example) will likely best be served by an AC microgrid architecture [5]. (As in the above discussion, the exception would be when there is a preponderance of DC generation and/or loads, in which case a DC-based system might make most sense.) Expeditions that are less connected to fuel supplies and are thus more self-sufficient (renewable generation, energy storage) and/or have more minimal load requirements might be best constructed as DC microgrids.
References [1] O. M. Longe, K. Ouahada, H. C. Ferreira, and S. Chinnappen, “Renewable Energy
Sources microgrid design for rural area in South Africa,” presented at the Innovative Smart Grid Technologies Conference (ISGT), 2014 IEEE PES, 2014, pp. 1–5.
[2] T. T. Erbato and T. Hartkopf, “Smarter Micro Grid for energy solution to rural Ethiopia,” Innovative Smart Grid Technologies (ISGT), 2012 IEEE PES, pp. 1–7, 2012.
[3] M. J. Sarker, B. Asare-Bediako, J. G. Slootweg, W. L. Kling, and B. Alipuria, “DC micro-grid with distributed generation for rural electrification,” presented at the Universities Power Engineering Conference (UPEC), 2012 47th International, 2012, pp. 1–6.
81

[4] B. K. Blyden and W.-J. Lee, “Modified microgrid concept for rural electrification in Africa,” Power Engineering Society General Meeting, 2006. IEEE, p. 5 pp., 2006.
[5] V. Prado, T. P. Seager, A. R. Mechtenberg, and E. Bennett, “A systemic thermodynamic analysis of fuel consumption at forward operating bases,” Sustainable Systems and Technology (ISSST), 2011 IEEE International Symposium on, pp. 1–6, 2011.
82
Application #6—Data Center Support Systems
Data centers contain complex electrical systems that power computing equipment and the supporting infrastructure systems. Although the critical energy end use in data centers is the computational (IT) equipment, the infrastructure systems’ energy end uses (HVAC, power distribution and Uninterruptible Power Supplies, standby generation, lighting, communications, etc.) also consume a large amount of energy. [1]. It has been reported [2] that the electrical efficiency of data centers can be as low as 30%. One efficiency measure evaluated recently is to convert the power architecture from AC to DC systems [3, 4]. Many studies have shown that Data centers distributing DC to the IT equipment eliminates several electrical power conversions resulting in lower electrical power losses than their AC counterparts [2, 5, and 6]. This also results in lower energy use for the HVAC systems since the power losses create additional heat that must be removed. The main subsystems/loads in Data centers are [2]: IT loads/equipment (Servers, networking devices, storage systems). Within IT
equipment, energy use includes power supply conversion losses. HVAC (e.g. Fans, Pumps, Compressor based equipment) Power distribution devices (UPS, PDU, Transformers, Wiring, Switchgear.) Backup generators (Heater and Controls losses) Lighting,
Energy Efficiency The comparison study here will consider the energy efficiency improvements if the entire data center is converted to operate with DC systems. It should be noted that modern state of the art data centers can have Power Usage Effectiveness (PUE) values closer to 1 (several examples of PUE of 1.2 or less) and in most case less than 2. Power usage effectiveness is defined as [7]:
Typical data centers have PUE values in the range of 1.8 to 2.0. Legacy data centers can have PUE values of 2.5[1] or greater. A PUE of 2 means that for every kilowatt-hour consumed by IT equipment, there is one kilowatt-hour consumed by other infrastructure systems. While today’s data centers are often designed to have relatively lower PUE values (less than 1.2 in some cases), it is important to focus on both IT and infrastructure energy use. In data centers (even with low PUE values), conversion of infrastructure systems as well as IT equipment to operate on DC would result in additional savings. However in these types of centers the relative percentage of savings would be less than from a traditional data center with higher PUE values. The study of two different AC and DC systems [6] is considered here. It has been shown that the components in the DC system are superior or at least equal to their AC counterparts in terms of energy efficiency. In particular, in an AC distribution system, UPS systems provide
83
uninterrupted power to the IT equipment and sometimes to other infrastructure systems. The UPS systems first convert AC to DC and charge batteries. Then another conversion restores the DC back to AC. Both power conversions consume some of the energy and create heat. The AC is then distributed to the IT equipment. This distribution may involve power distribution units that contain transformers transforming one AC voltage to another (e.g. 480V to 208V). This conversion also consumes energy and creates heat. Finally, inside the IT equipment, AC power is converted to DC power further losing energy and creating heat inside the IT equipment. All of the power conversions create heat that then drives the need for additional HVAC energy use. The DC voltage at this point is 380V. In DC distribution, a conversion from AC (typically 480VAC) to 380V DC takes place (or slightly higher to account for other losses). Batteries are charged, but there is no need for conversion back to AC. The DC power is delivered to the IT equipment where a conversion from AC to DC in the power supply is not necessary. For this reason, DC UPS efficiency can be greater than the AC counterpart, other distribution conversions are eliminated, and there is additional conversion loss savings within the IT equipment. All of these savings also reduce the HVAC load in the data center. Previous studies and demonstrations have focused on the power chain to the IT equipment. In a truly DC powered data center, the infrastructure systems could also operate with DC. This includes lighting, DC motors and drives, communications, etc. These systems similarly have native DC as the end use, and elimination of unnecessary power conversions would further reduce loads and less heat would need to be removed. There is no published data on efficiency gains for DC powering of infrastructure systems, however, similar efficiency gains as in the distribution to IT equipment are expected. In addition, DC powered equipment (e.g. LED lighting, electrically commutated DC motors, etc.) is more efficient than their AC counterparts. DC UPSs efficiency can be comparable or better than AC UPSs, the 208/120 VAC requires extra conversion, and there will be a need for Power Distribution Unit (PDU) transformers (that causes about 4-7% of the total losses in standard transformers and about 1-3% in premium transforms [1] according to the loading conditions). The power supply of IT loads in DC systems is more efficient than its counterpart, since the first stage conversion in the power source can be eliminated and this make it 2% more efficient compared to AC power sources. In addition, less cooling is required if these transformers are eliminated from the system (elimination of heat produced by these transformers, decrease in the space required in the data center, lower capital and installation cost, fewer points of potential failure). For the purposes of this study, we are comparing the two following systems: 380 VDC system, and 120VAC system. These two systems are shown in the figure below:
84
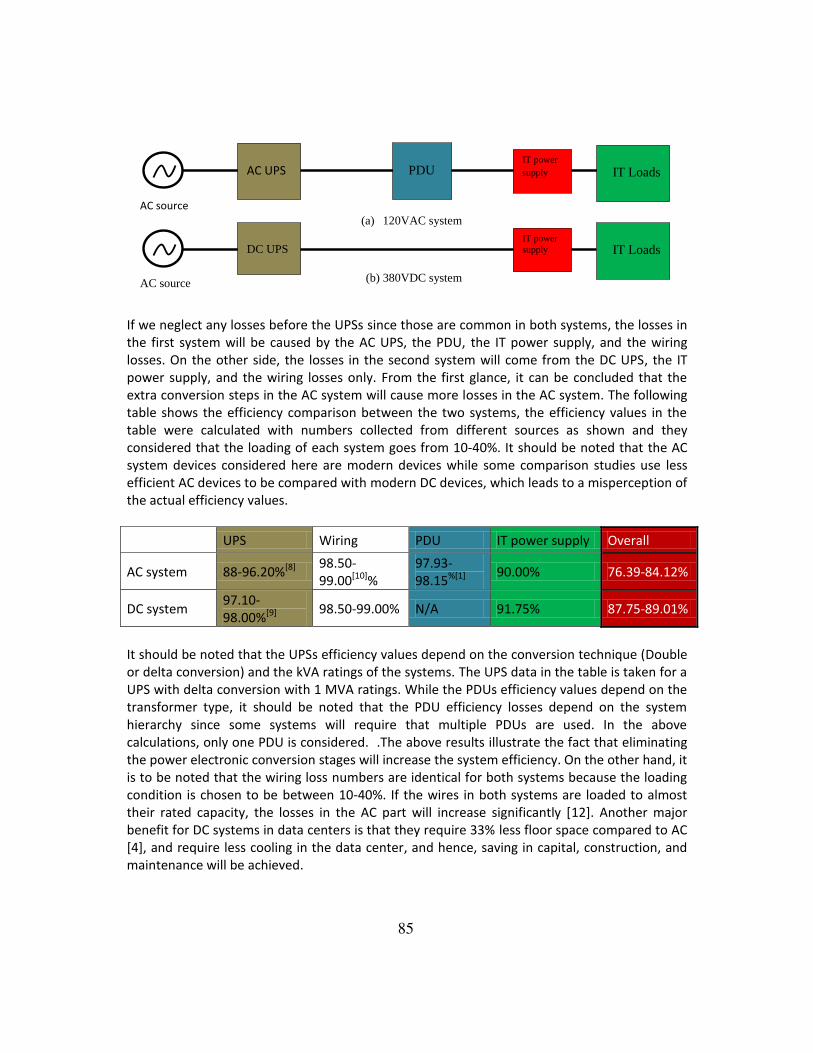
If we neglect any losses before the UPSs since those are common in both systems, the losses in the first system will be caused by the AC UPS, the PDU, the IT power supply, and the wiring losses. On the other side, the losses in the second system will come from the DC UPS, the IT power supply, and the wiring losses only. From the first glance, it can be concluded that the extra conversion steps in the AC system will cause more losses in the AC system. The following table shows the efficiency comparison between the two systems, the efficiency values in the table were calculated with numbers collected from different sources as shown and they considered that the loading of each system goes from 10-40%. It should be noted that the AC system devices considered here are modern devices while some comparison studies use less efficient AC devices to be compared with modern DC devices, which leads to a misperception of the actual efficiency values.
UPS Wiring PDU IT power supply Overall
AC system 88-96.20%[8] 98.50-99.00[10]%
97.93-98.15%[1]
90.00% 76.39-84.12%
DC system 97.10-98.00%[9]
98.50-99.00% N/A 91.75% 87.75-89.01%
It should be noted that the UPSs efficiency values depend on the conversion technique (Double or delta conversion) and the kVA ratings of the systems. The UPS data in the table is taken for a UPS with delta conversion with 1 MVA ratings. While the PDUs efficiency values depend on the transformer type, it should be noted that the PDU efficiency losses depend on the system hierarchy since some systems will require that multiple PDUs are used. In the above calculations, only one PDU is considered. .The above results illustrate the fact that eliminating the power electronic conversion stages will increase the system efficiency. On the other hand, it is to be noted that the wiring loss numbers are identical for both systems because the loading condition is chosen to be between 10-40%. If the wires in both systems are loaded to almost their rated capacity, the losses in the AC part will increase significantly [12]. Another major benefit for DC systems in data centers is that they require 33% less floor space compared to AC [4], and require less cooling in the data center, and hence, saving in capital, construction, and maintenance will be achieved.
AC source
AC UPS
DC UPS
PDU IT Loads
IT Loads
(a) 120VAC system
(b) 380VDC system
AC source
IT power
supply
IT power
supply
85

Reliability Besides higher efficiency levels, DC systems are found to be more reliable (in part because there are fewer potential failure points); a study by Nippon Telegraph and Telephone (NTT) was done for 10,000 AC UPS and 23,000 DC systems between 1996 and 2004. The field data showed that the unavailability of the AC system was in the range between 10-7 and 10-8, while the DC systems showed no failure for all years under study except for 1999 where the unavailability was 10-9 [13]. In [4], the authors presented a calculated reliability comparison that shows higher improvements in DC system reliability. The reliability of 380 VDC with regulated bus availability was 0.999998 with 200% improvement compared to 208 VAC systems, while the 380 VDC with direct connect to battery bus availability was 0.9999996 with 1000% improvement. Wiring Costs Comparison: To compare the electrical wires costs between the above two systems, we consider the following cases [6]:
a) For the 400/280 VAC system if we consider a 50 Amp wire, for a 3 phase with a neutral system the power delivered will be 34.6 kW with 8.65 kW per wire.
b) For the 380 VDC system if we consider a 50 Amp wire, for a 2 wire system the power delivered will be 19 kW with 9.5 kW per wire.
If we compared the above two results, we can conclude that the copper reduction in DC systems is about 10%. However, it should be noted that neutral wires for AC systems must be oversized for harmonics considerations based on the harmonics contents in the system. The AC system neutral wire size may be required to be increased according to the third harmonic percentage in the system [14]. For example, if the third harmonic contents in the system are 20%, the neutral wire must be oversized for the upper size available.(change from 16 mm2 to 25 mm2 for example) References
[1] Qureshi, A., “Power-Demand Routing in Massive Geo-distribution Systems,” PhD dissertation in MIT, September 2010. [2] Rasmussen, N.; Spitaels, J., “ A Quantitative Comparison of High Efficiency AC vs. DC Power Distribution for Data
Centers,” Schneider electric white paper 127.
[3]Justo, Jackson John; Mwasilu, Francis; Lee, Ju; Jung, Jin-Woo Jung, “AC-microgrids versus DC-microgrids with
distributed energy resources: A review,” Renewable and Sustainable Energy Reviews, vol. 24, pp. 387,405, August
2013.
[4]AlLee, G.; Tschudi, W., "Edison Redux: 380 Vdc Brings Reliability and Efficiency to Sustainable Data
Centers," Power and Energy Magazine, IEEE , vol.10, no.6, pp.50,59, Nov.-Dec. 2012.
[5]Salomonsson, D.; Soder, L.; Sannino, A, "An Adaptive Control System for a DC Microgrid for Data
Centers," Industry Applications, IEEE Transactions on , vol.44, no.6, pp.1910,1917, Nov.-Dec. 2008.
[6] Rasmussen, N., “AC vs. DC Power Distribution for Data Centers,” Schneider electric white paper 63.
http://www.apcmedia.com/salestools/SADE-5TNRLG/SADE-5TNRLG_R6_EN.pdf
[7] Mondal, S.; Keisling, E., "Efficient data center design using novel modular DC UPS, server power supply with DC
voltage and modular CDU cooling," Power Electronics, Drives and Energy Systems (PEDES), 2012.
86

[8] Sawyer, R. “Making large UPS systems more effeceint,” APC white paper #108.
[9] Lai, T. “Using 380 Vdc power feeds for data center,” Delta products corporation.
[10] Salim, M.; Tozer, M., “Data centers energy auditing and benchmarking-progress update,” American Society of
Heating, Refrigerating and Air-Conditioning Engineers, Inc, 2010.
[11] The Green Grid’s Power Task Force of the Technology and Strategy Work Group, “DC Power for improved data
center efficiency,” Lawrence Berkeley national laboratory, 2008.
[12] Du-Hwan Kim; Taesik Yu; Hyosung Kim; Mok, Hyungsoo; Kyung-Seok Park, "300V DC feed system for Internet
data center," Power Electronics and ECCE Asia (ICPE & ECCE), 2011 IEEE 8th International Conference on , vol., no.,
pp.2352,2358, May 30 2011-June 3 2011.
[13] Becker, D.J.; Sonnenberg, B. J., "DC microgrids in buildings and data centers," Telecommunications Energy
Conference (INTELEC), 2011 IEEE 33rd International , vol., no., pp.1,7, 9-13 Oct. 2011.
[14] Desmet J., Baggini A., Harmonics – neutral sizing in harmonic rich installations. Leonardo Power Quality
Application Guide – Part 3.5.1, 2003.
87

Application #7—Coupling a DC Microgrid to a HVDC Line
Introduction Significant amounts of research is being conducted to enable direct current (DC) microgrids. For non-
islanded applications connections to local distribution, transmission, or microgrid networks becomes an
important consideration that impacts power quality and availability for microgrid loads. This section
focuses on high voltage DC (HVDC) interfaces of DC microgrids to other systems. For this discussion DC
voltage ranges are defined according to the International Electrotechnical Commission (IEC) [4].
High: > 1500 V
Low: 120V – 1500 V
Extra low: < 120
Historically the majority of electric power transmission and distribution systems have been alternating
current (AC) because of the simplicity associated with transforming and transmission of AC power.
However, there are a number of advantages associated with HVDC transmission when the distances are
long. These include reduced conductor per unit length and no skin effects which equate to lower capital
costs and lower losses [2]. Loss reduction for this long distance transmission ranges from 33.3% to 76%
[3].
DC transmission was first demonstrated in 1882 at Miesbach-Munich Power Transmission [2] and first
used in a commercial transmission system developed in the late 19th century by Thomas Edison [5].
Technology development for HVDC was extensively pursued in the 1930s by the General Swedish
Electric Company (ASEA) and followed by early commercial installations in the 1950s [2].
Today DC power and DC coupling are used for more than long distance cost and efficiency gains.
Independent AC power systems can be interconnected without the complication of matching voltage
frequency and phase. Transients in one power system can be isolated from generation and load in
another power system improving power quality and overall system resiliency. Improved matching to
energy storage by eliminating AC/DC and DC/AC conversions is also leveraged but DC/DC conversion is
still typically used for power flow control. In addition, losses associated with water in submerged
applications often prevent the use of AC power.
Many countries have invested in HVDC interconnections. Examples include:
1. Moscow to Kahira connection in the Soviet Union, 1951 [2]
2. Gotland to mainland Sweden 100 kV, 20 MW system, 1954 [2]
3. Xiangjiaba to Shanghai connection in the China 2,071 km (1,287 mi), ±800 kV, 6400 MW link [2]
4. Porto Velho to Rondonia, Rio Madeira link in Brazil, [2,3]
5. Baltic Cable, undersea between Sweden and Germany [2]
6. NorEd cable, undersea between Norway and the Netherlands [2]
88

7. Basslink, undersea between Tasmania and mainland Australia [2]
8. Nelson River DC transmission system in Canada [2]
9. Tres Amigas SuperStation project connecting the Western Interconnection, Eastern
Interconnection, and ERCOT for controlled power sharing across North America. [7]
10. English channel interconnection between England and France [2]
China continues to make significant investments in HVDC connections and is on a path to have the
largest capacity of DC transmission in comparison to other countries [10].
As microgrids become more prominent in usage and include connections to distribution lines,
transmission lines, and other microgrids additional advantages of the interconnections will be leveraged.
Improved utility performance through isolation of stochastic renewable sources and loads in microgrids
is achievable through proper control design of the coupling. This can result in the virtual creation of
more ideal generation and load behaviors. Other ancillary services such as voltage regulation for the
larger utility are also possible. Research in these areas often focuses on the controls [9, 12] and
converter topologies [11].
Metrics
Safety and Protection As with any DC system protection can be complex in comparison to AC systems. The challenge with DC
systems is often disruption of fault currents. In AC systems the zero crossings in the current shape allow
for arcs to be extinguished and not reclose. Techniques for disrupting DC currents often involve
methods such as using magnetic fields to stretch and break the arcs.
Utilities that own HVDC transmission have been operating with this challenge for many decades.
However, as HV converter technologies become more semiconductor based safety and protection will
be an ongoing challenge that must be addressed.
An equally important but somewhat opposite concern regarding the safe design of microgrids connected
to the utility or other microgrids is achieving large enough fault currents to activate circuit protection.
As an example fuses have a time response that shortens as the currents reach higher amplitudes. If a
microgrid is dependent upon the utility to provide some of this fault current to activate the circuit
protection the surge capability of the HVDC coupling will become important.
So, safe operation of HVDC components and systems have been successfully performed by utilities for
many years but as microgrids become the load on the down side of these coupling points the approach
and likely the complexity associated with designing a safe system will change and must be addressed in
future research.
89

Reliability
When considering the reliability of a system it can be helpful to think of probability of an event and the
consequences resulting from that event. In this section high reliability would imply a high probability of
an event occurring but low consequences as a result.
When considering consequences the total loss of energy in a power system, for the purposes here,
would be considered a high consequence event. Therefore if a power system relied on a single energy
source the consequences associated with losing that source would be high. The number of sources
increases for a DC microgrid when it is connected to a utility distribution line, utility transmission line, or
a network of microgrids. This has two results. First, the likelihood for a total loss of generation for a
microgrid would decrease because of the increase to the number of potential energy sources. This
allows a greater ability to source critical loads during a partial loss of generation and thereby reduce the
consequence associated with that loss. Second, as the number of sources for a microgrid increases the
probability that one of them will fail will increase but as already stated the consequences should be
lower. For these reasons the reliability of the microgrid would expected to be increase. This is also true
for the utility or network of microgrids that the DC microgrid is connected to if the DC microgrid can also
share power.
When considering the reliability of HVDC interface hardware between the DC microgrid and an external
power system comparisons can be made between
the HVDC DC/DC link and a high voltage AC/DC link and
the HVDC DC/DC link and a high voltage AC/AC transformer.
In simplest form a basic buck-boost DC/DC converter would have one active and three passive
components [6]. A basic bidirectional three phase AC/DC converter would have six active and eight
passive components [6]. For either converter a loss of a component would result a nonoperational
state. The AC/DC converter could potentially service two of the three phases for AC to DC energy flow
but overall power quality would be expected to decrease.
Parallel DC/DC converters could be constructed with fewer components than required for one AC/DC
converter. In this configuration the loss of one DC/DC converter component would still allow power
sharing and therefore be a configuration that would increase the overall reliability of the system.
When using a DC/DC link or even an AC/DC link rather than an AC/AC conventional transformer the
reliability of the interface is expected to decrease. This is because conventional transformer technology
does not have active components, has few components, and is a very robust technology. However, this
needs to be weighed against other services that an active link can provide. Active interfaces can provide
an additional level of isolation between power systems in addition to other ancillary services such as
increased power quality through power conditioning. For DC/DC links this power conditioning can be
simpler to implement due to lack of frequency requirements.
For power electronic based converters many of these active components require a series connection of
many active components to reach the voltage hold off needs or a parallel connection of many active
90

components to reach the peak current needs. Research in improved thermal management and
advanced materials such as wide band gap semiconductors continues to address these issues. Enabling
reductions in the required numbers of components will enable a greater amount of redundancy in
converter designs resulting in higher reliability.
Capital Cost Capital costs for DC converters can be significant. For example cost estimates for HVDC converter
station equipment capable of 2000 MW, 500 kV bipolar DC link between England and France is
estimated to be $173.7 M [2]. This equates to about $87k per MW.
Technology advancements will continue to bring these costs down. Examples include:
Improved thermal management through technologies such as the Sandia Cooler [8] which
increases the heat transfer per unit surface by a factor of ten over conventional air cooled heat
exchangers.
Increased junction voltage enabled through ultra wide band gap semiconductor material
research. High voltage devices enabled by materials such as GaN would reduce component
count and therefore converter complexity and costs. Sandia National Laboratories is presently
pursuing the development of these materials to enable device manufacturing with reduced
defects.
Efficiency A number of factors impact the coupling efficiency between a DC microgrid and a HVDC line. To control
power flow and enable step changes in voltages DC to DC converters are utilized. This introduces a
number of complexities and loss mechanisms that would not necessarily be found in an AC voltage
transformation. These include:
Semiconductors losses and
Passive component losses.
These losses are driven by the types of materials, design of the converter, and the ratio of the HVDC line
voltage to the microgrid bus voltage [6] (chapter 7 buck-boost converter).
Corona discharge can also impact efficiency. Losses associated with the formation and oscillation of ions
around high voltage components and cables is an effect that is less of an issue for DC systems [2].
Bibliography
1. Nasirian, V. ; Moayedi, S. ; Davoudi, A. ; Lewis, F.L.¸ ”Distributed Cooperateive Control of DC
Microgrids,” IEEE Transactions on Power Electronics, 2015, vol. 30, issue 4, pp. 2288-2303
2. High-voltage direct current, http://en.wikipedia.org/wiki/High-voltage_direct_current
91

3. Kiger, Patrick, “High-Voltage DC Breakthrough Could Boost Renewable Energy,” National Geographic
News, December 5, 2012, http://news.nationalgeographic.com/news/energy/2012/12/121206-high-
voltage-dc-breakthrough/
4. High Voltage, Wikipedia , http://en.wikipedia.org/wiki/High_voltage
5. Direct Current, Wikipedia , http://en.wikipedia.org/wiki/Direct_current
6. N. Mohan, T. M. Undeland, W. P. Robbins, “Power Electronics Converters, Applications, and Design,”
Third Edition, John Wiley & Sons Inc., 2003.
7. E. Trinklein, G. Parker, W. Weaver, R. Robinett, L. Babe, C. Ten, W. Bower, S. Glover, S. Bubowski,
“Scoping Study: Networked Microgrids,” Sandia National Laboratories Report, September 2014,
SAND2014-17718.
8. Jeffrey P. Koplow. (2009, September). "A Fundamentally New Approach to Air-Cooled Heat
Exchangers." Prepared by Sandia National Laboratories Albuquerque, New Mexico 87185 and
Livermore, California 94550. SAND2009-135192.
9. A. Ortiz, T. Ostrem, and W. Sulkowski, “Tapping power from a microgrid based on a BtB converter,”
2011 2nd IEEE PES International Conference and Exhibition on Innovative Smart Grid Technologies
(ISGT Europe), 2011, pp. 1 – 6.
10. Cao Wen-jia ; Wen Jun ; Zhou Si-yu ; Lv Si-zhuo ,”Application and prospect of direct current in
modern society,” International Conference on Sustainable Power Generation and Supply (SUPERGEN
2012), 2012, pp. 1 – 5
11. C. Sheridan, M. T. Green, "Assessment of DC/DC converters for use in DC nodes for offshore grids,”
10th IET International Conference on AC and DC Power Transmission (ACDC 2012), 2012, pp. 1 – 6.
12. Honglin Zhou ; Geng Yang, "Control of DFIG-based wind farms with hybrid HVDC connection,” IEEE
6th International Power Electronics and Motion Control Conference, 2009, pp. 1085 – 1091.
92

Application #8—Electric Vehicles for Backup/Emergency Power
With recent natural disasters, policy makers and Federal, State and local agencies have become
interested in “Shelter-In-Place” approaches that allow citizens to stay located in buildings. Electric
and Plug-In Electric Vehicles (EVs & PHEVs) are considered one potential very useful component to
offer backup, emergency power to buildings and microgrids that would enable the “Shelter-In-Place”
strategy.
With regard to DC microgrids, this application investigates if associating the batteries of EVs and
PHEVs that operate at 350 Vdc to a DC microgrid offer any advantages along the metrics outlined in
this report.
The results presented in Application #1 are also valid for Application #8. The difference between the
two applications is the addition of Plug-In Electric Vehicles (PHEVs) and Electric Vehicles (EVs). From
an efficiency point of view, and not focusing on any resiliency or other considerations, EVs can be
modeled as batteries and PHEV can be modeled as batteries and generators. If we assume that the
AC/DC converters have a similar efficiency to the DC/DC converters, then adding some batteries in
the microgrids of Application #1 and focusing on the comparison between the AC and the DC
microgrid, should lead to different results than the ones described in Application #1. Given however,
that the EV and PHEV batteries operate in the range 300-400 Vdc, a DC/DC converter might not be
necessary in the DC microgrid case, leading to higher efficiency gains for DC microgrids.
Certainly, however, if DC/DC converters are less expensive than AC/DC converters, a high number of
EVs will result in lower capital costs for the DC microgrid in comparison with its AC counterpart.
93


![Scoping Study—Estimate of Technical and · fuel cells. Also, many high efficiency loads are also direct DC [4]. A mi-crogrid utilizing a DC bus may avoid many of the power conversion](https://img.pdfslide.us/doc/110x75/5b7534157f8b9a924c8d0e97/scoping-studyestimate-of-technical-fuel-cells-also-many-high-efciency.jpg)