Embed Size (px)
Citation preview

Scoping Study – “Linking RE Promotion Policies with
International Carbon Trade (LINK)”
Paula Castro Daisuke Hayashi Kjell Olav Kristiansen Axel Michaelowa Martin Stadelmann June 2011 Study commissioned by IEA-RETD

University of Zurich, perspectives GmbH, Point Carbon Scoping Study “Linking RE Promotion Policies with International Carbon Trade” for IEA RETD
Page 2
Acknowledgments The authors wish to thank the members of IEA RETD and its Project Steering Group, particularly
Kristian Petrick (RETD Operating Agent, Spain), Ulrika Raab (Swedish Energy Agency) and Konrad
Raeschke-Kessler (German Federal Environmental Agency) for useful comments to previous versions of
this study.
About IEA RETD The RETD Implementing Agreement is one of the key outcomes from the International Conference for Renewable Energies in Germany in June 2004. Members of the RETD are countries that want to encourage the international deployment of renewable energy through improved policies. While the other IEA implementing agreements on renewable energy focus on specific technologies, the RETD is crosscutting from a technological point of view and intends to complement these.
About the consortium University of Zurich Founded in year 2006, the Chair of Political Economy and Development at the University of Zurich has experience in the fields of development and climate policies. The research group on climate policy has been analyzing the flexible mechanisms under the Kyoto Protocol as well as new market mechanisms such as sectoral crediting and trading for the past 5 years.
Perspectives GmbH A competence-tank for national and international climate policy with broad practical experiences with the Kyoto-Mechanisms. Perspectives offers high quality, comprehensive and tailor-made solutions needed for the efficient and effective implementation of CDM/JI projects and development of new methodologies.
Point Carbon A Thomson Reuters company, Point Carbon is a world-leading provider of independent news, analysis and consulting services for European and global power, gas and carbon markets. Its comprehensive services provide professionals with market-moving information through monitoring fundamental information, key market players and business and policy developments.

University of Zurich, perspectives GmbH, Point Carbon Scoping Study “Linking RE Promotion Policies with International Carbon Trade” – Inception Report
Page 3
Contents Acknowledgments ...................................................................................................................................... 2 About IEA RETD ......................................................................................................................................... 2 About the consortium .................................................................................................................................. 2 Contents ..................................................................................................................................................... 3 Executive summary .................................................................................................................................... 5 List of abbreviations .................................................................................................................................... 8 1 Introduction........................................................................................................................................... 9 2 Current practices in RE promotion under the CDM/JI ....................................................................... 11
2.1 National policies for RE promotion in CDM/JI host countries ...................................................... 11
2.1.1 RE deployment status ........................................................................................................... 11 2.1.2 Status of RE projects under the CDM/JI ............................................................................... 12 2.1.3 RE promotion policies in developing countries ..................................................................... 15 2.1.4 General barriers to RE promotion in developing countries ................................................... 17
2.2 Barriers to RE promotion under the CDM/JI ................................................................................ 19
2.2.1 Financial barriers .................................................................................................................. 19 2.2.2 Technical barriers ................................................................................................................. 21 2.2.3 Regulatory barriers ............................................................................................................... 23
2.3 Current practices at the UNFCCC in the treatment of RE promotion policies ............................ 25
2.3.1 The E+/E- rule ....................................................................................................................... 25 2.4 Implications of new developments in the carbon markets ........................................................... 27
2.4.1 Nationally appropriate mitigation actions .............................................................................. 27 2.4.2 Sectoral crediting mechanism ............................................................................................... 28 2.4.3 Emissions trading schemes in emerging economies ............................................................ 29 2.4.4 Other issues influencing demand for carbon credits from RE projects ................................ 29
3 The way forward: Approaches for removing barriers to RE promotion in the international carbon market ....................................................................................................................................................... 30
3.1 Approaches to address financial barriers .................................................................................... 31 3.1.1 Reducing costs of the CDM project cycle through CDM Programmes of Activity (PoAs) .... 31 3.1.2 Combining the CDM with NAMAs ......................................................................................... 34 3.1.3 Optimizing the mix of unilateral, supported and credited NAMAs ........................................ 35 3.1.4 Electricity feed-in tariffs as supported and credited NAMAs ................................................. 36 3.1.5 Other policy instruments as supported and credited NAMAs ............................................... 37

University of Zurich, perspectives GmbH, Point Carbon Scoping Study “Linking RE Promotion Policies with International Carbon Trade” – Inception Report
Page 4
3.1.6 High long-term carbon price as sole driver of RE projects ................................................... 37 3.2 Approaches to address technical barriers ................................................................................... 38
3.2.1 Default grid emission factors ................................................................................................ 38 3.2.2 Default emission factors per installation ............................................................................... 39
3.3 Approaches to address regulatory barriers and threats/opportunities emerging from new market mechanisms .......................................................................................................................................... 40
3.3.1 Clarification of the E+/E- rule ................................................................................................ 40 3.3.2 Country- or region-specific positive lists for additionality determination ............................... 41 3.3.3 Reformed rules for PoAs....................................................................................................... 42 3.3.4 Use of new market mechanisms instead of CDM ................................................................. 42 3.3.5 Use of subsidized NAMAs instead of CDM .......................................................................... 43 3.3.6 Use of credited NAMAs instead of CDM............................................................................... 43 3.3.7 Global emissions trading instead of CDM............................................................................. 43
4 Conclusions and recommendations for future action ......................................................................... 44 4.1 Key challenges ............................................................................................................................ 44 4.2 Solutions ...................................................................................................................................... 45
4.2.1 Short-term measures ............................................................................................................ 45 4.2.2 Longer-term opportunities ..................................................................................................... 47
4.3 Need for further analysis ............................................................................................................. 48 References ............................................................................................................................................... 50

University of Zurich, perspectives GmbH, Point Carbon Scoping Study “Linking RE Promotion Policies with International Carbon Trade” for IEA RETD
Page 5
Executive summary The Implementing Agreement on Renewable Energy Technology Development of the International Energy Agency (IEA-RETD) has the mandate of addressing cross‐cutting issues influencing the deployment of renewable energy and acting as a vehicle to accelerate the market introduction and deployment of renewable energy technologies. With this goal, it appointed the consortium comprising the University of Zurich, Perspectives GmbH and Point Carbon to deliver a scoping study on the interplay between national renewable energy promotion policies and the international carbon market, with a special focus on the barriers that prevent a more positive interaction between both sets of policies, and possible solutions to address them.
The deployment of renewable energy (RE) is regarded as one of the solutions to combat climate change, increase energy security, reduce pollution and create jobs. RE still cannot fully compete with conventional energy sources such as fossil fuels, but an accelerated deployment has nonetheless been witnessed in the last years, both in industrialized and in developing countries. This evolution has been possible thanks to the implementation of policies that promote and financially support the development and the deployment of RE at the national level. Additionally, the international carbon market – mainly through the Clean Development Mechanism (CDM) and Joint Implementation (JI) – provides opportunities for increased financial support that may further enhance RE deployment.
This report explores the barriers that currently prevent a more effective promotion of RE through the carbon market and a positive interaction between the market and domestic RE promotion policies. While the main focus is on CDM/JI, the report also looks beyond CDM/JI to find possible solutions among the new instruments being proposed for the new climate regime and the carbon market after 2012.
Beyond the general barriers existing for a faster deployment of RE, there are several specific barriers that prevent a more successful interaction between domestic RE promotion policies and the international carbon market in the form of CDM/JI.
In terms of finance, at current carbon prices the flexibility mechanisms CDM and JI only achieve a marginal contribution towards the financial attractiveness of most RE projects. Due to the ex-post nature of carbon crediting they are not capable of tackling the high upfront costs that many RE investments entail. High transaction costs exacerbate these challenges. Specifically in the CDM, this limited financial contribution of the carbon market also results in a weak financial additionality of the projects, which in turn reduces their chances of getting carbon credits.
Technically, data collection for establishing emission baselines is costly, especially for grid-connected electricity. Dispersed renewable energy applications, such as solar water heaters, solar cookers, or biofuels for transportation suffer from cumbersome monitoring of emission reductions in the case of CDM. Rural on-grid RE applications in poor CDM host countries are at a comparative disadvantage due to the fact that baselines in general do not reflect the suppressed energy demand of poor households.

University of Zurich, perspectives GmbH, Point Carbon Scoping Study “Linking RE Promotion Policies with International Carbon Trade” for IEA RETD
Page 6
A key regulatory question within the CDM is additionality: demonstrating that a project would not have been implemented without the benefits provided by the CDM. The regulator is concerned that the additionality of RE projects can be questioned when support policies – specifically feed-in tariffs (FITs) – are in place. While the CDM E+/E- rule1 intends to prevent discouraging countries from implementing policies that contribute to climate change mitigation domestically, its application has been inconsistent in the case of FITs across different countries. Other regulatory barriers are related to the unresolved liability issue for Programmes of Activities, which prevents an improved access of small-scale projects to the CDM, and the interaction between JI and the EU ETS, in particular in the case of grid-connected RE projects.
The report proposes several immediate and long-term solutions to address these barriers. Among them, the following three recommendations should be taken up by policy makers in the short term.
Firstly, in order to simplify data collection efforts and reduce transaction costs of RE-related CDM/JI projects, an increased standardization of baseline and monitoring methodologies for RE projects should be pursued. For grid-connected RE, this could be achieved through benchmarks for the calculation of grid emissions factors; for RE projects outside the electricity sector, default emission reduction values per installation could be defined and used to simplify monitoring requirements, based on assumptions regarding utilization intensity, baseline technology and baseline fuel. .
Secondly, an increased emphasis on Programmes of Activities would also help reduce transaction costs and broaden the scope of CDM/JI activities, especially for small-scale and dispersed RE applications such as household-level thermal energy or biofuels for transportation. However, specifically in the case of the CDM, this needs to be accompanied by a resolution of the regulatory barriers preventing the take-off of Programmes of Activities: the strong liability for validators in case of mistakes in the selection of individual programme components, and the definition of acceptable criteria for determining additionality of these components.
Thirdly, a clarification of the additionality of CDM/JI projects in relation to the presence of domestic RE support policies needs to be found. One possibility is to work on the basis of the CDM E+/E- rule, which so far regulates how domestic policies should be accounted for when establishing project baselines under the CDM. In this case, an agreement – coherent for all countries and all types of RE support policies – needs to be reached in terms of whether this rule also applies to additionality determination and the manner in which it does. Awareness of country governments about the risks in terms of additionality of potential CDM/JI projects when too high unilateral incentives for RE are set
1 The E+/E- rule, agreed by the CDM Executive Board in 2005, establishes that policies that provide a comparative advantage to less emissions-intensive technologies or fuels over more emissions-intensive ones (E- policies), implemented after 2001, are not to be taken into account for defining a baseline. The purpose of this rule is to avoid discouraging CDM host countries from enacting climate-friendly policies due to fear of jeopardizing the additionality of potential CDM projects. Similarly, policies that give advantages to more emissions-intensive technologies or fuels (E+ policies), implemented after 1997, should not be considered for CDM projects’ baseline scenarios, to prevent countries from artificially setting high emissions baselines, so that CDM projects earn more credits.

University of Zurich, perspectives GmbH, Point Carbon Scoping Study “Linking RE Promotion Policies with International Carbon Trade” for IEA RETD
Page 7
should be increased to prevent further project rejections. A more radical solution would be to establish country- or region-specific positive lists of RE technologies that are to be considered automatically additional, on the basis of a comparison of generation costs and revenues achieved with existing power tariffs that exclude the effect of RE power tariff subsidies (such as FITs). These positive lists would be country- or region-specific and would have to be updated regularly to account for technology developments and changes in electricity markets. By excluding the effect of RE power tariff subsidies, this option gives a clear signal to host countries that introduction of RE promotion policies will not negatively affect additionality of CDM/JI projects. Furthermore, the positive list approach helps streamline the CDM/JI process by shifting the burden of additionality demonstration from an individual project to a country or regional coordinator.
Longer-term opportunities and threats are mainly related to the future development of the carbon market and the uncertainties regarding a future climate change regime, and are in most cases conditional on how the negotiations towards a new climate regime evolve. Opportunities could be found in an increased use of PoAs to establish roll-out plans for specific RE technologies. Also, provided the concept of Nationally Appropriate Mitigation Actions (NAMAs) for developing countries is defined, a combination of CDM with other financial support or risk reduction options financed internationally through NAMAs could be conceived. For example, FITs or other RE promotion policies and facilitative measures (even non-financial ones, such as capacity building, regulatory improvements, infrastructure development, etc.) could be proposed as domestic or supported NAMAs, in a way that their combination with the carbon market makes RE just competitive. If the concept of credited NAMAs is adopted, RE support policies (FITs for electricity generation, but also investment grants or rebates, also applicable to non-electricity applications), could themselves become a NAMA that helps reduce upfront costs of costly RE technologies, or improve long-term financial sustainability. The potential establishment of sectoral crediting mechanisms and of national (or regional) emissions trading systems could help broaden the deployment of RE technologies but still have important challenges. Sectoral crediting would require a strong government and policies that clearly transfer the carbon price signal to the private actors in the sector. Emissions trading systems would need to be designed so that they create positive incentives for RE installations, for example by including RE installations in the scheme and/or avoiding grandfathering of emission permits to high emitters. In both cases, the transition from the project-based CDM/JI would need to be regulated in a way that does not discourage investors.
Finally, the carbon market cannot function without demand, and carbon prices need to be high enough if they are to contribute to close the competitiveness gap of RE technologies. Carbon prices will ultimately depend on the type and level of emission reduction targets countries are willing to commit to; on possible quality restrictions that may be imposed on demand; on competition from other potential sources of cheaper credits; on the willingness of countries (or other actors) to voluntarily buy and cancel carbon credits instead of using them for offsetting; and on the level of consolidation of the carbon market.

University of Zurich, perspectives GmbH, Point Carbon Scoping Study “Linking RE Promotion Policies with International Carbon Trade” for IEA RETD
Page 8
List of abbreviations
CDM Clean Development Mechanism
CERs Certified Emission Reductions
COP Conference of the Parties (to the UNFCCC)
CPA CDM Programme Activities
CPA-DD CDM Programme Activities Design Document
DOE Designated Operational Entity
ERUs Emission Reduction Units
ETS Emissions trading system
EU European Union
EUAs European Union Allowances
FIT Feed-in tariff
GHG Greenhouse gases
JI Joint Implementation
LDC Least Developed Country
LED Light emitting diode
MRV Measurement, reporting and verification
NAMA Nationally Appropriate Mitigation Action
OECD Organization of Economic Cooperation and Development
PDD Project Design Document
PoA Programme of Activities
PoA-DD Programme of Activities Design Document
PPA Power purchase agreement
PV Photovoltaic
RE Renewable energy
RECs Renewable energy certificates
REDD Reducing emissions from deforestation and forest degradation
RPS Renewable portfolio standards
UNFCCC United Nations Framework Convention on Climate Change

University of Zurich, perspectives GmbH, Point Carbon Scoping Study “Linking RE Promotion Policies with International Carbon Trade” for IEA RETD
Page 9
1 Introduction The consortium comprising the University of Zurich, Perspectives GmbH and Point Carbon has been appointed by the Implementing Agreement on Renewable Energy Technology Development of the International Energy Agency (IEA-RETD) to deliver a scoping study on the interplay between national renewable energy (RE) promotion policies and the international carbon market, with a special focus on the barriers that prevent a more positive interaction between both sets of policies, and possible solutions to address them.
This report presents the findings of the scoping study. After an introduction on the background of the study in Section 1, Section 2 will first provide a general overview of the status of RE promotion policies and of RE within the carbon market, before detailing the main financial, technical and regulatory barriers to RE deployment, in particular those related to the carbon market and to the treatment of RE promotion policies in the carbon market. Finally, in Section 3 we present a set of possible solutions to the barriers described, which are summarized in terms of conclusions and recommendations for future action in Section 4.
The deployment of renewable energy (RE) is regarded as one of the major solutions to combat climate change, as well as an option to increase energy security, facilitate energy access, reduce pollution and create jobs2. While in many cases RE still cannot fully compete with more conventional and carbon-intensive energy sources, such as fossil fuels, accelerated deployment has been witnessed in the last years, both in industrialized and in developing countries.
Policies to promote the development and the deployment of RE have been instrumental in this respect. Two types of renewable energy policies are used: technology-push and market-pull policies. On the one hand, several countries have recognized the need to support research and development in new low-carbon technologies, and are providing subsidies for such R+D through technology-push policies. Their aim is to reduce production costs and to gain a competitive advantage in the market for RE technologies, in view of the increasing demand worldwide.
On the other hand, even more countries are enacting market-pull policies that support the deployment of RE. Several types of policies are common. In the electricity sector, a liberalized market and a general enabling environment may already encourage a diversification of generation towards renewable sources3. Infrastructure development (expansion of the electricity grid), legal support to allow feeding power from independent power producers into the grid, and the availability of standardized power purchase agreements can all contribute to RE deployment. However, usually more specific promotion policies are also needed to overcome the higher costs of RE in comparison to conventional technologies. These policies can be quantity-based (e.g. renewable portfolio standards or renewable energy targets), price-based (feed-in tariffs, competitive bids) or cost-reducing in nature (capital subsidies, investment
2 Philibert 2011 3 Martinot et al. 2002; Martinot 2002

University of Zurich, perspectives GmbH, Point Carbon Scoping Study “Linking RE Promotion Policies with International Carbon Trade” for IEA RETD
Page 10
and production tax credits, public loans)4. In the transport sector, biofuels are being promoted through blending mandates and through tax incentives. Brazil is the best-known example of a successful biofuels policy. In this country not only blending mandates for bioethanol and biodiesel are in place, but also financial incentives for the farmers producing the raw materials for biodiesel, and, in the case of ethanol, with an important component of market development through the production of flex-fuel vehicles. Rural energy policies usually focus on the use of RE for the provision of energy services in remote areas that are not connected to the grid. In this case, information instruments (such as labels or information platforms) may also increase the awareness about the options available.
In parallel to the increased adoption of policies to support RE at the domestic level, policies to tackle climate change have been implemented at the (national and) international level. The Kyoto Protocol set up mandatory emission reduction targets for a group of industrialized countries, and established a carbon market to facilitate a cost-effective achievement of the targets. Two project-based flexibility mechanisms were set up: the Clean Development Mechanism (CDM) and Joint Implementation (JI), which allow for the generation of emission credits through the implementation of projects that reduce emissions below a baseline. While JI takes place in countries with emission caps (so-called Annex I countries), CDM takes place in the countries that do not have emission caps (so-called non-Annex I countries, which are mainly developing countries but also include five OECD members, i.e. countries not classified as “developing countries” in other circumstances).
As RE projects can both be supported through domestic-level RE promotion policies and through the international-level CDM/JI, an interaction – possibly a synergy – between these two types of instruments can be expected. This report aims to explore this interaction, focusing especially on the barriers that prevent a more effective promotion of RE through the carbon market and a positive interaction between the carbon market and the domestic policies. The focus will be on CDM/JI and technology-pull policies (such as feed-in tariffs, tax rebates or capital subsidies), but the report will also look beyond CDM/JI to find possible solutions among the new instruments being proposed for the climate regime after 2012.
The report is also embedded in two types of discussions. It tries to build a bridge between two partly conflicting views: one point of view sees RE as a goal in itself and thus the carbon market as an opportunity to further this goal through the provision of additional finance for RE. The other view sees climate change mitigation as the goal and RE as a means to achieve this goal. According to this view, carbon markets first need to pay attention to environmental integrity and the so-called additionality of emission reductions. Under this view, also, it is very difficult to find a clear causality between a particular policy and achieved emission reductions, so that so far, emission reduction credits have been issued only to concrete emission reduction activities and not to policies. It is often these two different views that generate difficulties in terms of linking national promotion policies and the carbon market.
4 Beck & Martinot, 2004; REN21, 2007; REN21, 2010

University of Zurich, perspectives GmbH, Point Carbon Scoping Study “Linking RE Promotion Policies with International Carbon Trade” for IEA RETD
Page 11
2 Current practices in RE promotion under the CDM/JI This chapter aims to identify key areas of the CDM/JI that need to be improved in order to enhance a link between RE promotion policies and the international carbon market mechanisms. The analysis will set a basis for the next chapter on analyzing approaches for removing barriers to RE promotion in the international carbon market. First, it provides an overview of RE promotion policies in CDM/JI countries with a brief summary of general barriers to RE promotion in these countries. Second, CDM/JI-specific barriers to RE promotion are analyzed in order to identify the areas where improvement is needed. Third, a summary of the current practice at the United Nations Framework Convention on Climate Change (UNFCCC) in the treatment of RE promotion policies aims to assess how RE policies interact with the CDM/JI. The analysis ends with a set of implications of possible new developments in the carbon markets for RE promotion through the CDM/JI.
2.1 National policies for RE promotion in CDM/JI host countries
2.1.1 RE deployment status
According to REN21 (2010), recent energy trends reflect the increasing significance of the CDM-eligible developing countries in advancing RE, while the JI-eligible Eastern European countries play a less important role in RE deployment5 Collectively, developing countries have more than half of global RE power capacity. China now leads in several indicators of market growth. India is fifth worldwide in total existing wind power capacity and is rapidly expanding many forms of rural RE such as biogas and solar PV. Brazil produces virtually all of the world’s sugar-derived ethanol and has been adding new biomass and wind power plants. RE markets are growing at rapid rates in countries such as Argentina, Costa Rica, Egypt, Indonesia, Kenya, Tanzania, Thailand, Tunisia, and Uruguay, to name a few.
Developing countries now make up over half of all countries that have set RE targets for themselves (45 out of 85 countries) as well as half of all countries with some type of renewable energy promotion policy (42 out of 83 countries). Among developing countries with RE targets, examples include Brazil (75 percent of electricity by 2030), China (15 percent of final energy by 2020), India (20 GW solar by 2022), and Kenya (4 GW of geothermal by 2030). The most common RE promotion policy instrument is a feed-in tariff (FIT), which has been enacted in many new countries and regions in recent years. By early 2010, at least 50 countries and 25 states/provinces had FITs, more than half of these adopted only since 2005.
5 EU countries are also JI-eligible but most electricity-generating and industry-based RE projects are excluded from JI as their reductions are already covered by the European Emission Trading Systems (EU ETS).

University of Zurich, perspectives GmbH, Point Carbon Scoping Study “Linking RE Promotion Policies with International Carbon Trade” for IEA RETD
Page 12
Table 1: RE deployment indicators
Top Five Countries #1 #2 #3 #4 #5
Annual amounts for 2009
New capacity investments Germany China United States Italy SpainWind Power added China United States Spain Germany IndiaSolar PV added Germany Italy Japan United States Czech RepublicSolar Hot Water added China Germany Turkey Brazil IndiaEthanol production Unted States Brazil China Canada FranceBiodiesel production France/ Germany United States Brazil Argentina
Existing capacity end 2009
Renewables China United States Canada Brazil JapanWind United States China Germany Spain IndiaBiomass United States Brazil Germany China SwedenGeothermal United States Phillippines Indonesia Mexico ItalySolar PV Germany Spain Japan United States ItalySolar Hot Water China Turkey Germany Japan Greece
CDM Host Countries
Source: Adapted from REN21 (2010)
2.1.2 Status of RE projects under the CDM/JI
For the rest of this analysis we will be studying developing and emerging economies that have been prominent hosts of Clean Development Mechanism (CDM) and Joint Implementation (JI) projects. By the end of 2010, the CDM and JI had generated emissions reductions leading to an issuance of 543 million tons of carbon credits6 of which RE projects represented 74 million tons or less than 14 percent of the credits generated. In terms of number of projects, RE posted a much larger share with 560 or 58.5% of the total number of projects with credit issuance (965). Electricity generation projects account for the largest share of the CDM RE project group with over 90% of both issued credits and the number of projects. In terms of installed power capacity, as of end of 2010, all active CDM/JI projects amounted to about 120 GW of electricity, while the projects that had already started to generate credits represented about 18 GW.
6 Carbon credits from CDM projects are called certified emission reductions (CERs), and those from JI projects emission reduction units (ERUs).

University of Zurich, perspectives GmbH, Point Carbon Scoping Study “Linking RE Promotion Policies with International Carbon Trade” for IEA RETD
Page 13
0
50
100
150
200
250
300
350
400
450
Mt
LULUCF
Waste
Renewables
Other
Fugitive emissions
Fuel switching
ENEF
Industrial processes
Figure 1: Distribution of issued CERs/ERUs on abatement technologies Note: Status as of end of 2010. Source: Thomson Reuters Point Carbon (2011)
The strong move towards RE technologies under CDM is caused by a combination of factors including the exhaustion of the low cost potential of industrial gases and investors increasing attention to new mitigation options and jurisdictions where national (RE) policies prove facilitative in combination with carbon finance. While the first years of the CDM/JI have been marked by the exploitation of the low-cost industrial gas emissions reductions, RE projects now dominate the pipeline of new projects and are projected to become the dominant source of reductions going forward. In Thomson Reuters Point Carbon’s latest issuance forecast up to 2020, RE projects are expected to deliver almost 1,400 million tons of CO2 reductions out of a total of approximately 3,500 million tons, i.e. 40 percent – a tripling from today’s level. While up to date CERs and ERUs from renewable energy have been issued from around 650 projects, another 1,200 projects have been formally registered by the UN bodies while 2,700 plans for renewable energy projects have been developed to the stage of a Project Design Document (PDD).
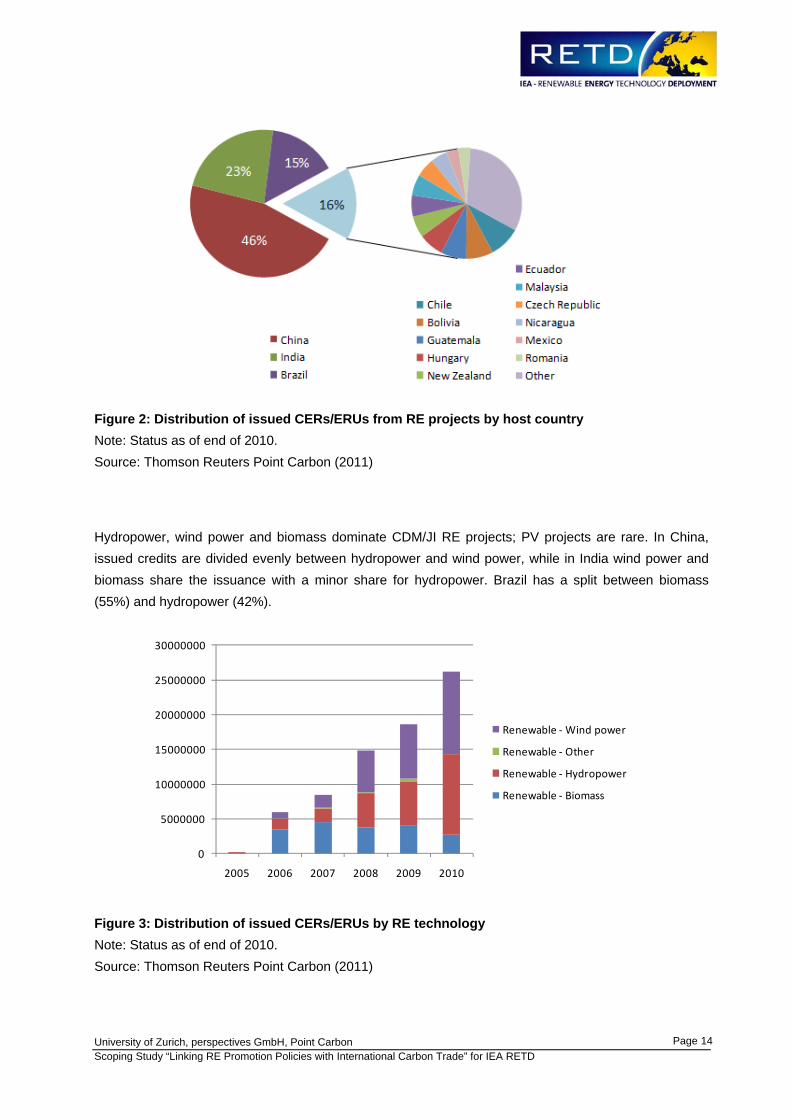
In terms of geographical distribution, China is by far the most important host country of projects and delivered close to 50 percent of issued credits from over 320 RE projects by end of 2010. Another 665 Chinese RE projects have been registered by the CDM Executive Board and a further 1,000 projects exist at the PDD level7. In addition to China, RE projects have predominantly been developed in India and Brazil. The remaining 16 percent is split among 34 countries of which the top ten are Chile, Bolivia, Guatemala, Ecuador, Malaysia, Nicaragua, Mexico (CDM); Hungary, New Zealand, Czech Republic and Romania (JI).
7 Thomson Reuters Point Carbon 2011
University of Zurich, perspectives GmbH, Point Carbon Scoping Study “Linking RE Promotion Policies with International Carbon Trade” for IEA RETD
Page 14
Figure 2: Distribution of issued CERs/ERUs from RE projects by host country Note: Status as of end of 2010. Source: Thomson Reuters Point Carbon (2011)
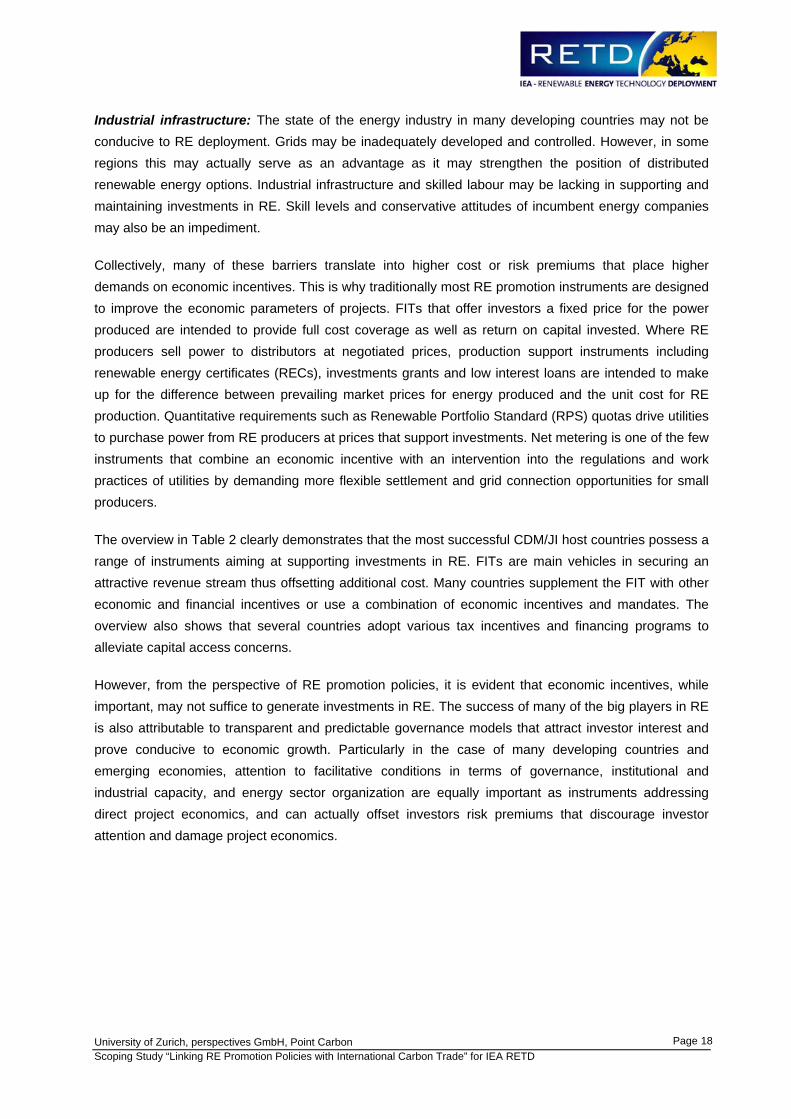
Hydropower, wind power and biomass dominate CDM/JI RE projects; PV projects are rare. In China, issued credits are divided evenly between hydropower and wind power, while in India wind power and biomass share the issuance with a minor share for hydropower. Brazil has a split between biomass (55%) and hydropower (42%).
0
5000000
10000000
15000000
20000000
25000000
30000000
2005 2006 2007 2008 2009 2010
Renewable ‐Wind power
Renewable ‐ Other
Renewable ‐ Hydropower
Renewable ‐ Biomass
Figure 3: Distribution of issued CERs/ERUs by RE technology Note: Status as of end of 2010. Source: Thomson Reuters Point Carbon (2011)

University of Zurich, perspectives GmbH, Point Carbon Scoping Study “Linking RE Promotion Policies with International Carbon Trade” for IEA RETD
Page 15
In developing countries with strong expansion of wind power, the lion’s share of wind power capacity additions is currently developed under the CDM, showing that project developers are fully aware of the CDM revenue and try to access it. By the end of 2010, submitted CDM wind projects and installed capacity were comparable in many countries. In some countries the CDM was even larger due to future planned additions as CDM projects (Figure 4).
0
5000
10000
15000
20000
25000
30000
35000
40000
45000
China India Mexico
Total 2010CDM 2010
0
100
200
300
400
500
600
700
800
900
1000
Brazil
Morocc
o
Egypt
KoreaChile
Cyprus
Philipp
ines
Urugua
y
Costa R
ica
Mongoli
a
Tunisi
a
Vietnam
Jamaic
a
Colombia
Argenti
na
Sri Lan
ka
Ecuado
r
Total 2010CDM 2010
Figure 4: Total installed wind power capacity and capacity of all CDM wind power projects per host country (MW)
Explanatory note: For China, total wind capacity at the end of 2010 reached 42.3 GW, whereas all Chinese CDM wind projects add up to 34.9 GW. Total wind capacity in CDM host countries reached 58.9 GW, whereas CDM total reached 47.0 GW. Status as of end of 2010.
Source: GWEC (2011), URC (2011)
These observations seem to support the idea that the carbon market is contributing to the deployment of RE in its host countries. To what extent this is true will be analysed in the next paragraphs.
2.1.3 RE promotion policies in developing countries
We now combine observations from the CDM/JI with information about national RE promotion schemes in host countries. We classify countries into two tier groups of host countries based on their prominence within the CDM/ JI. Incidentally, there is a noticeable correlation between the first tier group of countries and the list of countries that rate among the most important countries for deployment of renewable energy globally (Table 2).

University of Zurich, perspectives GmbH, Point Carbon Scoping Study “Linking RE Promotion Policies with International Carbon Trade” for IEA RETD
Page 16
Table 2: National RE incentive mechanisms in prominent CDM/JI host countries
Renewable Energy Incentive Mechanisms
Feed
‐in tariff
RPS Quo
ta obligation
Capital sub
sidies, grants,
supp
ort
Investmen
t or o
ther tax
cred
its
Sales tax , ene
rgy tax ,
excise tax , V
AT redu
ctions
Tradable RECs
Energy produ
ction supp
ort
or tax cred
its
Net metering
Public investmets, loans or
financing
Public com
petitive
bidding
CDM Eligible host countries
1st Tier host countriesChina
India
Brasil2nd Tier host countries
Mexico
Chile
Bolivia
Guatemala
Hungary
New Zealand
Ecuador
Malaysia
Czech Republic
Nicaragua
Romania
Provincial/regional application In use
Source: REN21 (2010)
The first important observation that can be derived from the information in Table 2 is that most countries that figure prominently in the CDM/JI have national policies and incentive programs aimed at aiding the deployment of RE. In most cases promotion policies consist of a suite of different incentives that often can be combined by project developers. The importance of carbon finance (CER/ERU revenues) in aiding deployment of RE in these countries depends on the collective effect of the financial and regulatory incentives that have been put in place in the host countries. An analysis of successful combinations of RE promotion policies and carbon finance can aid the discussion of barriers and failures

University of Zurich, perspectives GmbH, Point Carbon Scoping Study “Linking RE Promotion Policies with International Carbon Trade” for IEA RETD
Page 17
of the CDM/JI to promote RE in other jurisdictions. Clearly, in the case of the most expensive technologies and applications of RE, national promotion programs and regulations have been indispensable in driving the RE development whereas the financial incentive provided by carbon finance mainly has acted only as a supplement8. It should also be recognized that the strength of the carbon finance incentive is related to the baseline emissions. In countries with a high level of energy sector emissions, RE deployment will lead to higher emissions reductions and hence a stronger contribution from carbon credits.
2.1.4 General barriers to RE promotion in developing countries
Additional cost of RE compared to conventional energy options: This is recognized as the main obstacle to RE deployment. This general observation does not preclude the fact that RE in some locations and applications may constitute a competitive alternative to conventional sources, e.g., in remote locations lacking grid connectivity or in case of favorable hydro and on-shore wind locations. Barriers to RE extend beyond high technology cost – e.g. regarding intermittency of key RE sources -, but typically other barriers translate into additional project costs and increased risks which weigh on overall project economics. For the purpose of this study we will confine the discussion to issues characteristic for developing and emerging economies; CDM and JI host countries typically belong to these groups, though one should keep in mind that several CDM host countries are OECD countries, and JI projects, while mostly located in the Former Soviet Union and Eastern Europe, also exist in Western Europe. It is important to recognize that while RE may face various barriers in the OECD countries, additional hurdles may exist in the less developed part of the world.
Energy regulations and governance issues: Many countries do not possess the institutional framework required to enhance the role of RE. This covers a range of issues from grid access rules, tariff regulations, licensing regulations, speed and ease of regulatory and licensing processes, state of energy market competition, control of large energy incumbents, etc. Some developing countries also maintain substantial fossil fuel subsidies with the aim of offsetting the social effects of high fuel costs and thereby distort the true costs of power generation. Such obstacles may prevent, delay or increase transaction costs of RE projects.
Sovereign risk and access to capital: Many developing countries struggle with general foreign direct investment challenges involving risk factors such as legal security, policy predictability, tariff non-payment, counterparty risk, corruption and fraud, high risk premiums on third party finance and constrained access to capital etc. This generally increases financing costs as well as the risk weighted rate of return on capital investments.
8 See e.g. Hamilton 2009, Schneider et al. 2010.
University of Zurich, perspectives GmbH, Point Carbon Scoping Study “Linking RE Promotion Policies with International Carbon Trade” for IEA RETD
Page 18
Industrial infrastructure: The state of the energy industry in many developing countries may not be conducive to RE deployment. Grids may be inadequately developed and controlled. However, in some regions this may actually serve as an advantage as it may strengthen the position of distributed renewable energy options. Industrial infrastructure and skilled labour may be lacking in supporting and maintaining investments in RE. Skill levels and conservative attitudes of incumbent energy companies may also be an impediment.
Collectively, many of these barriers translate into higher cost or risk premiums that place higher demands on economic incentives. This is why traditionally most RE promotion instruments are designed to improve the economic parameters of projects. FITs that offer investors a fixed price for the power produced are intended to provide full cost coverage as well as return on capital invested. Where RE producers sell power to distributors at negotiated prices, production support instruments including renewable energy certificates (RECs), investments grants and low interest loans are intended to make up for the difference between prevailing market prices for energy produced and the unit cost for RE production. Quantitative requirements such as Renewable Portfolio Standard (RPS) quotas drive utilities to purchase power from RE producers at prices that support investments. Net metering is one of the few instruments that combine an economic incentive with an intervention into the regulations and work practices of utilities by demanding more flexible settlement and grid connection opportunities for small producers.
The overview in Table 2 clearly demonstrates that the most successful CDM/JI host countries possess a range of instruments aiming at supporting investments in RE. FITs are main vehicles in securing an attractive revenue stream thus offsetting additional cost. Many countries supplement the FIT with other economic and financial incentives or use a combination of economic incentives and mandates. The overview also shows that several countries adopt various tax incentives and financing programs to alleviate capital access concerns.
However, from the perspective of RE promotion policies, it is evident that economic incentives, while important, may not suffice to generate investments in RE. The success of many of the big players in RE is also attributable to transparent and predictable governance models that attract investor interest and prove conducive to economic growth. Particularly in the case of many developing countries and emerging economies, attention to facilitative conditions in terms of governance, institutional and industrial capacity, and energy sector organization are equally important as instruments addressing direct project economics, and can actually offset investors risk premiums that discourage investor attention and damage project economics.

University of Zurich, perspectives GmbH, Point Carbon Scoping Study “Linking RE Promotion Policies with International Carbon Trade” for IEA RETD
Page 19
The main role of CDM/JI in promoting RE in their host countries needs to be understood in terms of just providing an additional economic incentive on top of the incentives and investment conditions offered by the host country.9
2.2 Barriers to RE promotion under the CDM/JI After having looked at RE policies and general barriers to RE promotion in developing countries this section aims to provide an overview of key barriers to RE promotion in the CDM/JI context. These are categorized below into financial, technical and regulatory barriers.
2.2.1 Financial barriers
Insufficient carbon finance leverage
In general, carbon revenues for RE projects are seen as “icing on the cake” by mainstream financiers, particularly in contrast to the central importance of national policies and other regulatory aspects10. Take an example of RE power projects, which account for over 90% of the CDM RE projects. Schneider et al. (2010) conducted a detailed analysis on CDM’s contribution to profitability of six types of projects for RE power generation: photovoltaic (PV), wind, hydro, biomass, wastewater and landfill. As shown in Figure 5, they found a limited role of carbon finance for PV, wind, hydro and biomass projects. Interestingly, CDM participation can have a negative impact on PV project’s profitability due to relatively large transaction costs associated with the CDM. Other analyses also emphasized the transaction costs as an important financial barrier to CDM projects, especially for small-scale projects 11 . The marginal contribution of carbon revenues makes it difficult for these projects to prove financial additionality. In order to alleviate the additionality barrier, particularly for micro-scale projects, the CDM Executive Board in May 2010 agreed to grant automatic additionality to RE projects with installed capacity less than 5 MW, upon satisfaction of certain conditions pre-defined in its guidance12. Another way of solving the additionality barrier for RE projects with the help of positive lists is detailed in section 3.3.2.
On the contrary, wastewater and landfill projects were found to benefit greatly from carbon revenues as they exhibit very large emission reductions per monetary unit invested. This is mainly due to the fact that these projects reduce methane, CH4, which is a much more potent GHG than CO2 and gives more credits per tonne of emission reductions. Although there is no similar study conducted for JI projects for RE power generation, it is expected that these conclusions hold for JI projects because Schneider et al.
9 There are other contributions that the CDM/JI could make to RE promotion, e.g., reputational benefit. But they are considered minor compared to the economic incentive. 10 Hamilton, 2010 11 e.g., Flamos, 2009; Krey, 2005; Michaelowa and Jotzo, 2005; World Bank, 2009 12 UNFCCC, 2010

University of Zurich, perspectives GmbH, Point Carbon Scoping Study “Linking RE Promotion Policies with International Carbon Trade” for IEA RETD
Page 20
(2010) assumed a sensitivity range for each input parameter that is wide enough to capture JI host countries, and the transaction costs of the CDM are not very different from the ones of JI.
Figure 5: CDM impact on profitability of RE power generation projects Note: Profitability index is the ratio between a project’s net present value (NPV) and the invested capital (IC). Source: Schneider et al. (2010)
High upfront costs
Another key financial barrier is the high specific upfront costs of RE technologies in general13. This barrier is more significant for small-scale projects than large ones, as the former are commonly owned by those with limited capital available who tend to apply a high discount rate in their investment decision making. If carbon credit buyers were willing to provide upfront payment in return for future delivery of the carbon credits, the CDM/JI would directly help the project developers to overcome the high upfront cost barrier. However, while there are some purchasing programmes where this is possible, such a transaction structure is not common. By far the most common transaction structure is a forward
13 BMU, 2007; Flamos, 2009; Hamilton, 2010.

University of Zurich, perspectives GmbH, Point Carbon Scoping Study “Linking RE Promotion Policies with International Carbon Trade” for IEA RETD
Page 21
purchase agreement, which requires the seller to deliver a specific number of carbon credits to receive payment from the buyer14. Thus, in most cases, CDM/JI can at best indirectly help address this barrier by enabling project developers to use a forward contract as collateral in the structuring of the project finance.
The upfront cost barrier is more significant for projects without equity investment from investor countries. Originally, it was assumed that industrialized country companies would actually invest equity in setting up a project and would receive CERs and other project revenues in turn. However, such investment has proven to be rare and most CDM project developers mobilize the investment themselves, selling CERs once they accrue as they would with any other commodity. Lütken and Michaelowa (2009) analyzed the share of CDM projects without foreign equity investment and found that such projects were a prevailing practice under the CDM as they dominated China and India, the two largest CDM markets. Due to the investment reluctance of Annex I countries, it is likely that projects without foreign equity investment continue to dominate the CDM market in the future15.
Given above, the high upfront costs of RE technologies are and will likely remain an important barrier to promotion of RE technologies in general for projects without foreign equity investment.
2.2.2 Technical barriers
Baseline data collection
A baseline constitutes a counterfactual reference scenario, against which a CDM/JI project’s emission reductions are evaluated. Baseline determination commonly requires a large amount of data; hence it is considered one of the main barriers to project development under CDM/JI. This section summarizes the key difficulty in the baseline data collection for grid-based RE power generation projects and other RE projects.
For grid-based RE power generation projects, the most important baseline data is an electricity grid emission factor. This parameter essentially shows how carbon-intensive the grid electricity is (e.g., tCO2/MWh). As RE power sources are mostly carbon-neutral, the grid emission factor directly determines the volume of carbon credits from on-grid RE power generation projects. This also means that countries with a large RE portion already cannot benefit from the CDM to the same extent as those with a predominantly fossil baseline. The calculation of grid emission factor requires extensive data on power plants connected to the grid, which is perceived as a major barrier to the development of grid-based RE power generation projects.
14 UNDP, 2003; BMU, 2007 15 Lütken and Michaelowa, 2009

University of Zurich, perspectives GmbH, Point Carbon Scoping Study “Linking RE Promotion Policies with International Carbon Trade” for IEA RETD
Page 22
Some CDM/JI host country authorities, often with donor support, have made a concerted effort for determining grid emission factors in order to facilitate project development in their countries. As of February 2011, 20 CDM host countries have published grid emission factors, 13 of which with donor support16. There is no comprehensive study on grid emission factors published for JI host countries. But a few major JI host countries are known to be working on the grid emission factor calculation.17 The limited coverage of published grid emission factors clearly shows a significant barrier to these projects.
Other types of RE projects include projects for off-grid RE power generation, renewable thermal energy applications (e.g., solar water heaters, solar cookers), biofuel use in transportation, etc. The technical barrier that is common to these projects is monitoring of emission reductions. As they typically involve a large number of small, dispersed sources of emissions (e.g., households, cars), monitoring of these sources is often very cumbersome. Sampling-based monitoring is allowed under the CDM/JI, but often requires very stringent, conservative approaches. As a consequence, projects addressing small end-users face a significant methodological barrier at the monitoring stage18. Large-scale methodologies commonly have much more complex monitoring requirements than small-scale ones. Small-scale PoAs has become a popular vehicle for wide deployment of small RE technologies because they benefit from simpler monitoring and can aggregate an unlimited number of projects. In the pursuit of streamlined monitoring, there is recently a momentum towards greater use of default factors for key monitoring parameters. There has been a success of such an approach for energy-efficient lighting projects and the approach could also be expanded to other types of technologies. Thus, there is a strong need for expanding the coverage of standardized methodologies for CDM/JI projects to RE technologies.
Suppressed demand and electricity grid structure
In poor countries and communities, households demand a low amount of energy services – which is one to two orders of magnitude lower than in industrialized countries - because they cannot afford to spend a higher share of their low income on energy. Thus, their energy demand is suppressed. This means that sustainable development is not being achieved, in that basic human needs are not being met. The question for CDM/JI projects is whether the existing low level of consumption, or the future expected level of consumption including “development” advances is the baseline19. This is particularly relevant for rural applications of RE technology, especially in CDM host countries, as they are sometimes confronted with the suppressed demand problem.
The CDM rules explicitly allow for baselines that account for emissions “above current levels due to specific circumstances of host countries”20. However, the practice for on-grid RE power projects so far is that the baseline emissions factor is derived from the current practice of energy production in the grid. In
16 Michaelowa, 2011 17 For example, the European Bank for Reconstruction and Development has supported the grid EF calculation for Russia and Ukraine, see http://www.lahmeyer.de/de/projekte/detailansicht/browse/5/project/603/mode/1/. 18 Michaelowa et al., 2009 19 Winkler and Thorne, 2002 20 UNFCCC, 2001

University of Zurich, perspectives GmbH, Point Carbon Scoping Study “Linking RE Promotion Policies with International Carbon Trade” for IEA RETD
Page 23
less developed countries, electricity grids often lack of advanced power supply infrastructure and they are sometimes dominated by a few large hydro plants (e.g., eastern African countries). In such a suppressed demand case, a grid emissions factor is much lower than it would be for an electricity grid that would have to cater for unsuppressed demand for electricity. If the electricity demand was higher (or unsuppressed) the grid would have to expand its power supply capacity to meet the higher electricity demand. If thermal power plants would be added, the grid emission factor for the baseline would become higher. Thus, in case of satisfied demand for electricity, the baseline grid emission factor may become higher. The suppressed demand leads to such low baseline levels that projects do not generate sufficient emission reductions for carbon finance to have an impact21
2.2.3 Regulatory barriers
Inconsistent application of the E+/E- rule
Policies that promote low-carbon technologies result in lower baseline emissions and/or weaker additionality of emission reduction projects. This could potentially give perverse incentives to the host country not to implement such policies in order not to jeopardize generation of emission reduction projects in the country in the future. This issue had been intensively discussed in the early years of the CDM, and the CDM Executive Board agreed on the so-called E+/E- rule in 2005. For policies that give comparative advantages to more emissions-intensive technologies or fuels over less emissions-intensive ones (E+ policies) implemented after the adoption of the Kyoto Protocol on 11 December 1997, the baseline scenario should refer to a hypothetical situation without the policy. The same applies to policies giving comparative advantages to less emissions-intensive technologies or fuels over more emissions-intensive ones (E- policies) implemented since the adoption of the Marrakech Accords on 11 November 2001.
Notwithstanding this rule, several baseline methodologies stipulate that mandatory E- policies, regardless of their date of introduction, shall lead to an immediate reduction of baseline emissions. Furthermore, the CDM Executive Board has never clarified whether this rule also applies to additionality demonstration, e.g., whether a subsidy for RE should be disregarded in the investment analysis22. The controversy about the E+/E- rule reached a climax when the CDM Executive Board rejected several wind power projects in China as they suspected the country was intentionally lowering power tariffs in order to artificially decrease the financial attractiveness of wind projects, thereby enhancing the projects’ additionality claim23. As it will be detailed in Section 2.3, the application of the E+/E- rule has been inconsistent, posing a considerable regulatory barrier to RE promotion under the CDM. On the side of JI,
21 World Bank, 2009 22 Lütken and Michaelowa, 2009 23 He and Morse 2010

University of Zurich, perspectives GmbH, Point Carbon Scoping Study “Linking RE Promotion Policies with International Carbon Trade” for IEA RETD
Page 24
this issue has not yet been discussed widely. However, as the JI rules also require additionality demonstration, the same barrier applies in principle.
Cumbersome rules for PoAs
A programme of activities (PoA) is a new form of CDM/JI, in which an unlimited number projects can be implemented at any time over the programme duration. The projects under a PoA can avoid some of the lengthy, costly CDM/JI processes. For instance, after the PoA registration, projects under a PoA do not need to go through the project registration process supervised by the CDM Executive Board or the JI Supervisory Committee. Instead, a validator, independent assessor of CDM/JI projects, can check the project and decide whether it qualifies to be included in the PoA. With these streamlined processes, PoAs are expected to contribute to a reduction of transaction costs and scaling up of small, dispersed mitigation activities such as RE projects targeting end-users.
However, the uptake of PoAs under the CDM has been slow mainly due to its cumbersome PoA rules. The most important bottleneck is that validators are liable for returning carbon credits issued by projects erroneously included into a PoA. There is no insurance solution offered to cover all or a significant part of the DOE liability24. Therefore, validators are generally very reluctant to validate projects under a CDM PoA. On the other hand, JI PoA rule does not require validators to be liable for erroneous inclusion of projects into a PoA.
As the natural niche of PoA is small, dispersed mitigation activities, its regulatory barriers hinder development of this market segment. However, this should not be taken as a barrier to RE promotion in general because there are many RE projects that do not fall in this category (e.g., large-scale RE power projects).
Interaction between JI and EU ETS / RE policies
Emission reduction projects within installations covered by the European Union Emission Trading Scheme (EU ETS) cannot be implemented as CDM/JI projects, unless an equal number of European Union Allowances (EUAs) allocated to the installations is cancelled25. This is because allocation of EUAs and generation of CERs/ERUs in the same installation would lead to double counting of the same emission reductions26. As there are only two CDM host countries in the EU (Cyprus and Malta) and they have a limited number of installations, this provision has so far concerned only JI projects.
There are two types of double counting of emission reductions. First, double counting occurs if an emission reduction project is implemented directly in an installation covered by the EU ETS (e.g., captive RE power generation). This double counting is addressed by cancelling the equal number of EUAs allocated to the installation operator. Second, double counting also takes place if projects have an
24 Beaurain & Schmidt-Traub, 2010 25 European Union, 2004 26 Thomson Reuters Point Carbon, 2008

University of Zurich, perspectives GmbH, Point Carbon Scoping Study “Linking RE Promotion Policies with International Carbon Trade” for IEA RETD
Page 25
indirect effect on emissions in an installation covered by the EU ETS (e.g., on-grid RE power supply to installations covered by the EU ETS). In order to address this double counting, some EU Member States have created a JI reserve, a set-aside of EUAs to be cancelled when issuing ERUs to JI projects. However, the amount of JI reserves varies considerably and they are too tight in some countries27. As large-scale energy sectors are covered by the EU ETS, it has largely crowded out JI projects for RE promotion, especially on-grid RE power projects.
Referring to the interaction of RE policies and JI, some EU member states did not allow JI projects at all, others excluded activities eligible for Feed-In Tariffs or receiving other forms of public subsidies from JI due to assumptions of already adequately set Feed-In Tariffs and EU state aid considerations.
2.3 Current practices at the UNFCCC in the treatment of RE promotion policies
2.3.1 The E+/E- rule
The analysis below draws lessons for implementation of RE promotion policies based on case studies on the E+/E- rule application by RE power projects in South Korea and China.
A wind project in South Korea, which requested registration to the UNFCCC in 2007, excluded the government subsidy for wind power generation in its additionality demonstration.28 In South Korea, differential subsidy levels have been set for different RE technologies. The preferential tariff rates are guaranteed for 15 years for wind and PV projects29. As the FIT policy had been adopted in March 2002, the exclusion of the FIT policy effect was in line with the E+/E- rule, and this approach was validated by the project validator. Although the CDM Executive Board requested a review of the project and it was eventually rejected due to the lack of serious consideration of the CDM at the initial stage of the project development, no request for review was made on the application of the E+/E- rule itself. Since then, 18 PV, 11 small hydro and 8 wind projects have been registered in South Korea ignoring the impact of the same FIT policy in their additionality demonstration following the E+/E- rule.
However, the CDM Executive Board’s rejection of wind projects in China showed a different interpretation of the E+/E- rule. Wind projects in China receive a preferential power tariff, whose rate is deliberately determined by the National Development and Reform Commission (NDRC). The wind tariffs have historically fluctuated largely and very frequently30. At the end of 2009, the CDM Executive Board rejected 10 Chinese wind projects because they were concerned that the power tariffs granted to these
27 Stockmayer, 2007 28 CDM project no. 1377: Bundled wind power project of Jeju special self-governing province in Korea, download at: http://cdm.unfccc.int/Projects/DB/KFQ1191913605.18/view. 29 IEA, 2011 30 He and Morse, 2010

University of Zurich, perspectives GmbH, Point Carbon Scoping Study “Linking RE Promotion Policies with International Carbon Trade” for IEA RETD
Page 26
wind projects were lower than those for similar projects in the past, a shift that decreased the projects’ financial viability and thus bolstered their additionality claims31. This decision has created a major regulatory uncertainty in the market, and led to the Chinese delegation’s public criticism of the CDM Executive Board at COP15 in December 2009.
The 15-year guaranteed preferential tariffs for wind and PV projects in South Korea did not raise any issue with the E+/E- rule, while the frequently changed tariffs for wind projects in China faced a serious problem. This hints that predictability in tariff levels is an important element for CDM/JI-compatible FIT. It is also important to note that the CDM usually does not require consideration of impacts of voluntary policies or mandatory ones that are not enforced widely. To our knowledge, FIT is the only RE promotion policy that has been targeted by the policy debate under the CDM.32 In general, it has so far not concerned technology-push policies, e.g., research and development support, certification and labeling. The focus of debate has rather been market-pull policies such as FIT. Another prominent type of market-pull policy is RPS or quota obligations. As several CDM methodologies require consideration of immediate impacts of mandatory policies for direct emission controls (e.g., regulations on emissions levels of HFC23, N2O, and landfill gas), it is conceivable that an RPS would get a similar treatment as it directly regulates the quantity of RE power supply, and hence the amount of emissions. However, such quota obligations are normally set at the utility level, but not at the project level. Therefore, it is difficult to establish clear causality between the RPS and the utility’s investment into a specific project. 33 Consequently, it is rather unlikely that this policy instrument will negatively interact with the E+/E- rule.
In summary, only enforced, mandatory policies can be a concern to baseline emissions and additionality of CDM/JI projects. The experience so far indicates that technology-push policies are unlikely to become a risk factor. Among the market-pull policies, FIT is the only policy that has triggered the E+/E- debate so far. However, the South Korean cases show that predictability in tariff levels could avoid the risk.
Policy-based mitigation actions
The CDM/JI currently does not allow carbon crediting of policies per se. But concrete mitigation actions implemented to achieve policy goals can be eligible for crediting. This rule was established after a long-standing debate on a CDM methodology for implementation of a mandatory energy-efficiency standard for room air conditioning in Ghana34. The methodology had the intent of implementing an efficiency testing, consumer labeling and quality-assurance program for air conditioners. It was eventually rejected because the calculated emission reductions could hardly be clearly attributed to the proposed “soft” measures, as efficiency of appliances was also affected by many other factors. According to the CDM
31 He and Morse, 2010 32 For a typology of technology-push and market-pull policies, see REN21 (2007). 33 Another possible impact of RPS is that the quota obligation increases the demand for RE power, which consequently increases RE power prices. The higher RE prices could make RE projects more profitable, and hence weaken their additionality claim. However, in the absence of long-term historical evidence of RPS implementation on RE prices in developing countries, we do not expect this would have serious negative impacts on CDM/JI projects in the foreseeable future. 34 Hayashi and Michaelowa, 2007

University of Zurich, perspectives GmbH, Point Carbon Scoping Study “Linking RE Promotion Policies with International Carbon Trade” for IEA RETD
Page 27
Executive Board’s interpretation, the soft measures included efficiency information labels, building of a testing lab, training of personnel, and incentive schemes35. From this discussion, it is evident that the CDM Executive Board considers mere implementation of policies lacking a clear causality between the policy and achieved emission reductions. In order to make the emission reductions attributable to the policy, concrete emission reduction activities incentivized by the policy framework need to be shown.
Consequently, the PoA rules were established to fill the gap between the project and policy approaches to the CDM, and later to JI. Compared to stand-alone projects, PoAs are in a far better position to accelerate market transformation towards low-carbon technologies, and support national/regional climate policy implementation 36 . Governments can also become a PoA coordinator and directly coordinate mitigation activities under their policy framework. A good example of a government-led PoA is a CDM PoA on distribution of compact fluorescent lamps (CFLs) in India. The PoA is coordinated by the Bureau of Energy Efficiency (BEE), India, which is tasked to accelerate market transformation towards energy-efficient appliances. In order to achieve this policy goal, the PoA, through collaboration with state utilities, coordinates nationwide distribution of CFLs to households at subsidized prices comparable to prices of incandescent light bulbs37.
2.4 Implications of new developments in the carbon markets
2.4.1 Nationally appropriate mitigation actions
Nationally appropriate mitigation actions (NAMA) are a concept agreed upon at COP13 in 2007, which encompasses mitigation actions that developing countries consider appropriate for sustainable development of their countries. A key advantage of NAMA is that it can potentially become a vehicle for supporting policy implementation. As opposed to projects or programmes that the existing carbon market mechanisms support, policy-driven mitigation actions could significantly expand the scope of the carbon markets. Furthermore, NAMA is built on a concept of “nationally appropriate” mitigation actions and would likely provide large discretion to host countries in deciding what mitigation actions should be pursued. These are instrumental to RE promotion as it requires a suit of policy incentives considering country-specific situations.
There is yet no clear definition of what constitutes NAMA. However, broadly speaking, three types of NAMA are being considered: (i) unilateral NAMA, financed and implemented solely by developing country; (ii) supported NAMA, through which developing countries receive international financial and/or technical support, and; (iii) credited NAMAs, which generate carbon credits that can be sold on the
35 Figueres and Philips, 2007 36 Hayashi et al., 2010 37 Michaelowa et al., 2009

University of Zurich, perspectives GmbH, Point Carbon Scoping Study “Linking RE Promotion Policies with International Carbon Trade” for IEA RETD
Page 28
carbon market38. Furthermore, the detailed rules on how NAMAs will be utilized, eligibility requirements, under what conditions international financing (or crediting) will be provided, etc. are still not there, so it is likely that a few years will be needed to agree on such detailed rules.
Still, interest in the concept of NAMAs is high, and proposals for potential NAMAs exist already. One of the most advanced examples of NAMA is a residential building energy-efficiency programme in Mexico. It aims to enhance the implementation of the existing subsidy and green mortgage programmes for energy-efficiency improvement in new residential buildings by providing additional financial resources to these programmes and requiring compliance with a building code for energy efficiency and sustainability39. As is the case with the Mexican example, the main focus of NAMA is policy-based mitigation actions. The credited NAMA could provide direct carbon financing opportunities to mitigation policies and enhance the scope of crediting mechanisms. On the other hand, coexistence of NAMAs and CDM projects could raise a double-counting issue. For instance, if a FIT is implemented as a credited NAMA and the resulting emission reductions are credited, CDM projects for RE power generation would generate carbon credits for the same emission reductions. Thus, there needs to be a clear rule for avoiding double-counting in order for NAMAs and the CDM to coexist.
2.4.2 Sectoral crediting mechanism
A sectoral crediting mechanism is a mechanism that would credit emission reductions in a sector against a baseline40 defined for the whole sector. The sectoral baseline is commonly considered to be a “no lose” nature; over-achievement of the baseline results in generation of carbon credits, but there is no penalty for non-achievement. It is an idea for a new market mechanism that has been strongly pushed by some industrialized countries at the international climate negotiations. But it is yet to be agreed upon due to stark opposition from major emerging economies that see the mechanism as a stepping stone to mandatory sectoral emission targets. Butzengeiger-Geyer et al.41 proposed a likely timeline until a sectoral crediting mechanism becomes operational, and estimated that, once the mechanism is agreed upon at the negotiations in the framework of a new climate agreement and detailed rules are devised (likely to take 3-4 years time), efforts required for collecting data for baselines, agreeing on the baseline, and setting up a monitoring, reporting and verification system would require at least other 4 years.
The sector-wide crediting mechanism would enable crediting of any type of mitigation activities implemented in the sector. The challenge for the sectoral crediting mechanism is that an entity’s good performance can be offset by the lack of progress of other entities in the sector. Furthermore, as the
38 Okubo et al., 2011 39 Wehner et al., 2010 40 In the CDM/JI, the baseline represents the projected CO2 emissions in the business-as-usual scenario without the CDM/JI projects. In case of sectoral crediting, the crediting baseline is often defined below the business-as-usual scenario, as it is expected that the host country (with support of international finance) reduces its emissions to a certain level, before it can access the carbon market (see e.g. Schmidt et al. 2008) 41 Butzengeiger-Geyer et al., 2010

University of Zurich, perspectives GmbH, Point Carbon Scoping Study “Linking RE Promotion Policies with International Carbon Trade” for IEA RETD
Page 29
carbon credit revenues would first accrue to a sectoral crediting mechanism coordinator (e.g., government, industrial association), entities in the sector would receive less direct carbon price signals. Therefore, it is necessary for the sectoral crediting mechanism coordinator to implement a policy framework that is compatible with the performance of individual entities and that passes carbon price signals from the sectoral crediting mechanism coordinator level to the entity level42.
In addition, introduction of the sectoral crediting mechanism would likely displace all CDM/JI projects in the sector, with a possible exception of CDM/JI projects that already exist. This is because possible double-counting of emission reductions achieved by the CDM/JI projects and the ones by the sector as a whole complicates the baseline setting of the sectoral crediting mechanism (for analogy, see section 2.2.3 for the interaction between JI and EU ETS). While the sectoral crediting mechanism could help scale up mitigation efforts, sectoral no-lose baselines, which should for the sake of environmental integrity have to be set at a stringent level, might as well decrease the amount of carbon revenues given to RE promotion activities. In addition, the baseline setting may not be easy since there will always be an element of negotiation when a country considers taking on a target.
2.4.3 Emissions trading schemes in emerging economies
Several emerging economies are contemplating introduction of domestic ETS (e.g., China, Mexico, South Korea). As the EU ETS largely crowded out JI RE projects due to the double-counting concern, ETS in the emerging economies could threaten CDM projects for RE promotion. Furthermore, free allocation of emission allowances can be a barrier to RE promotion. In the EU ETS, for example, RE power producers do not receive allowances while fossil-fuel power producers get them largely for free, with only a trivial amount of allowances sold through an auction. This weakens incentives to invest in RE power generation technologies43. A level-playing field for RE power producers can be established only if all allowances are allocated through auction, or through benchmarking that is neutral to technology and fuel used for power production. However, such allocation methods are not likely to gain political acceptance at least at the early stage of ETS. Therefore, the establishment of ETS in emerging economies will tend to negatively interact with RE projects under the CDM/JI.
2.4.4 Other issues influencing demand for carbon credits from RE projects
Firstly, the phase III (2013-2020) of the EU ETS will put restrictions to the import of CERs/ERUs. Only the following kind of credits can be exchanged in the phase III if no international agreement is reached: (i) CERs/ERUs from projects where the reduction takes place in 2008-2012 period (exchange must take place before 31 March 2015), (ii) CERs/ERUs from projects registered before 2012, but issued from
42 Baron et al., 2009 43 Carbon Trust, 2007

University of Zurich, perspectives GmbH, Point Carbon Scoping Study “Linking RE Promotion Policies with International Carbon Trade” for IEA RETD
Page 30
2013 onwards, (iii) CERs from projects started after 2013 in least developed countries (LDCs), and (iv) credits from countries that have concluded a bilateral agreement with the EU44. As Europe is by far the biggest buyer of carbon credits having bought 87% of primary CDM/JI credits in 200945, the post-2012 limit to credits from projects in LDCs will be a major barrier to RE projects hosted in non-LDC countries.
Secondly, with deforestation emissions representing up to 20% of anthropogenic emissions46, potential integration of some future type of carbon credits from avoided deforestation into the carbon market would likely depress carbon credit prices. While it would have the advantage of reducing compliance costs, the lower carbon prices would reduce incentives to invest in more costly low-carbon technologies such as RE. Existing modelling analyses show a different degree of such impacts, ranging from 50 to 60% reduction in global carbon prices in 202047.
Thirdly, as the international climate negotiations currently stand, there is a real risk of fragmentation of the post-2012 climate regime. This could potentially result in fragmented carbon markets operating with different governance structures, which would likely decrease efficiency and effectiveness of the carbon market mechanisms48.
3 The way forward: Approaches for removing barriers to RE promotion in the international carbon market
As most of the barriers described in section 2 above have been identified quite some time ago, reforms of the CDM have been started that could scrap some of the barriers; reforms of JI along the same lines will be easier as it is a mechanism under a cap and eventual additionality problems would be restricted to inter-sectoral free-riding, invalidating results of already existing climate protection instruments and policies. Moreover, new market mechanisms could be designed in a way that prevents emergence of barriers linked to the cumbersome CDM/JI project cycle, while stronger emission commitments could drive up demand for carbon credits and their prices to a level where they could really make a difference for RE projects. Of course, removal of these barriers will not be sufficient to mobilize RE, as generic energy policy frameworks may not be conducive to RE49.
44 Point Carbon Thomson Reuters, 2010 45 World Bank, 2010 46 Schlamadinger and Bird, 2007 47 Angar and Sathaye, 2008; Livengood and Dixon, 2009 48 Metcalf and Weisbach, 2010 49 GTZ,2010; Ölz and Beerepoot, 2010; Brunnschweiler, 2010; Hamilton, 2010

University of Zurich, perspectives GmbH, Point Carbon Scoping Study “Linking RE Promotion Policies with International Carbon Trade” for IEA RETD
Page 31
3.1 Approaches to address financial barriers Financial barriers can be addressed by reducing CDM/JI transaction costs, ensuring the possibility to combine CDM and other financing as well as by increasing the trust in a reliable long-term flow of revenues from carbon finance. We discuss the contribution of CDM PoAs in reducing transaction costs and supporting technology-specific roll-out plans, the possibility of supported NAMAs to be added to CDM financing if the CDM is unable to close the cost gap between fossil and renewable energy technologies and the possibility of an enhanced carbon price in closing a larger part of the cost gap between RE and fossil energy technologies.
3.1.1 Reducing costs of the CDM project cycle through CDM Programmes of Activity (PoAs)
When in the first years of CDM implementation it was realized that transaction costs are a key obstacle to the replication of small greenhouse gas (GHG) emission technologies, the idea of Programme of Activities (PoA) was born50. This led to the decision of the first Meeting of the Parties to the Kyoto Protocol in Montreal in 2005 to generally allow the concept of a PoA. However, it took another two years before the CDM Executive Board specified detailed PoA rules. A PoA allows combining a number of project activities (called CDM Programme Activities, CPAs) under a joint “umbrella”.
A PoA has duration of up to 28 years and can use any approved baseline and monitoring methodology as well as combinations thereof. The key difference from the possibility of “bundling” projects, which had existed for several years, is that the number and timing of projects developed under the PoA is completely flexible; CPAs can be added at any time and need not be validated.
An important advantage of PoAs compared to the bundling option is the fact that small-scale methodologies can be applied without any limit on the size of the PoA; the thresholds of 15 MW for RE projects only apply to each single CPA. Therefore, a PoA can include several small hydro plants, a dozen wind turbines, or thousands of PV systems. Since small-scale methodologies are much simpler and more standardised, this reduces transaction costs considerably. A PoA needs a private or public entity for coordination that organizes PoA documentation, selection of CPAs according to a set of eligibility criteria and monitoring. Hayashi et al. 51 discuss the requirements for a successful PoA coordinator and business models appropriate for different types of technology. While all CPAs need to be monitored, only a statistically significant sample needs to be verified. Box 1 illustrates the potential cost savings of a PoA for RE projects by means of an example.
Another advantage of PoAs in the context of RE projects consists of diminished registration risks: once a PoA is registered, investors have higher certainty that their planned renewable projects can be added as CPAs. This is also relevant from a post-2012 perspective as projects situated outside Least Developed
50 Figueres and Philips, 2007 51 Hayashi et al., 2010a

University of Zurich, perspectives GmbH, Point Carbon Scoping Study “Linking RE Promotion Policies with International Carbon Trade” for IEA RETD
Page 32
Countries (LDCs) may only be eligible for imports of CERs in the EU ETS post 2012 if they are registered before 2012 or if they can be added as CPAs to a registered PoA.
Box 1: Example of a PoA in the wind energy sector and resulting cost reductions
Compare 100 wind power CDM projects of 15 MW each with one PoA covering 1,500 MW and having 100 CPAs. Whereas each of the projects requires its own PDD and validation report, has to pay a specific registration fee and get its monitoring reports verified, the PoA just needs one PoA Design Document (PoA-DD), one CPA Design Document (CPA-DD) for a real project, and one CPA-DD as a model template to be used by CPAs to be added to the PoA in the future. The PoA has to pay the registration fee only for the initial CPA and can restrict verification to a sample of the CPAs. The resulting cost differential is shown in
Table 3Fehler! Verweisquelle konnte nicht gefunden werden.: the PoA reduces upfront costs by over 90% and verification costs by over 50%.
Cost savings in the verification phase will increase exponentially with a growing number of CPAs, as the required sample size approaches a maximum at a certain number of CPAs. For a normal distribution, an error margin of 10% and 90% confidence interval, the share of CPAs to be verified falls from 41% for 100 CPAs to 12% for 500 CPAs and 6% for 1000 CPAs; a cost reduction of 94%. Although the sampling approach requires conservative adjustment of emission reductions for a sampling error, these cost savings would most likely outweigh this drawback.
Table 3: Theoretical transaction cost differences between a PoA for 1,500 MW wind and a series of 100 single 15 MW CDM wind projects

University of Zurich, perspectives GmbH, Point Carbon Scoping Study “Linking RE Promotion Policies with International Carbon Trade” for IEA RETD
Page 33
Item Cost for 100 projects (€) Cost for PoA (€)
Up-front costs
Project documentation 2.0 million 0.1 million
Validation 3.0 million 0.1 million
Registration fee 0.4 million 0.0 million
Total 5.4 million (100%) 0.2 million (4%)
Post-registration cost
Verification (7 year crediting period) 14.0 million (100%) 5.7 million (41%)
Source: Cost data from market experience of Perspectives. Registration fees are calculated according to CDM rules as per March 2011 and assume a 25% plant load factor as well as a baseline grid emission factor of 850 g CO2/kWh. Verification costs are based on an annual frequency and a sample size of 41 for the PoA as discussed above.
Despite PoAs being available for over three years, they have not yet achieved the breakthrough that was hoped for. 80 PoAs have been submitted for public comments, of which just 8 were registered by March 2011. This is mainly due to the unresolved question of liability for emission credits from CPAs that are found ex post to be inconsistent with CDM rules. Auditors of PoAs have to restitute wrongly issued CERs and thus only are willing to validate PoAs if the project developers contractually guarantee to cover that liability. When validating a PoA, auditors currently require site visits of each CPA. This has led to validation costs for PoAs that can easily be three times higher than for normal CDM projects and erodes the cost advantage shown in
Table 3Fehler! Verweisquelle konnte nicht gefunden werden.. Moreover, the additionality determination for PoAs is currently not straightforward, as eligibility criteria need to be defined that lead to the exclusion of non-additional CPAs right from the outset and the Executive Board has not defined which type of criteria will be acceptable. Once there is an understanding about acceptable criteria, the costs for additionality determination will fall considerably. Currently, the CDM Executive Board is contemplating another reform of PoA rules. Nevertheless, PoAs have mobilized certain RE technologies that could not make an inroad under the project-based CDM. 11% of all PoAs involve biogas, 10% solar water heaters, and 4% PV. Hydropower covers 6% and biomass energy. The total capacity of CPAs submitted to date does however only cover 58 MW not counting landfill gas power. This is due to the verifiers requiring a visit to all CPA sites which keeps transaction costs high. The technical potential for renewable energy PoAs is several orders of magnitude higher. Moreover, most PoAs are mobilized by

University of Zurich, perspectives GmbH, Point Carbon Scoping Study “Linking RE Promotion Policies with International Carbon Trade” for IEA RETD
Page 34
development banks and not the private sector, who shuns the approach due to the perceived high risks, especially with regards to the post-2012 regime.
Past experience with project-specific CDM shows that certain technologies were able to achieve a rapid penetration in the CDM market in some host countries. This was due to an increased familiarity with the technology in a certain economic sector coupled with a high financial attractiveness. For example, bagasse cogeneration plants in the Brazilian sugar sector were decisive in achieving Brazil’s early lead in the CDM market. 24 projects totalling 775 MW were registered successfully. Nevertheless, 27 projects with 870 MW failed for various reasons, mainly due to a stricter interpretation of additionality from 2006 onwards. India managed to roll out rice husk power plants rapidly, with 54 projects registered covering 340 MW. But even here 25 projects with 130 MW failed. Restuti and Michaelowa52 show how a bagasse cogeneration roll-out could mobilize 260 GWh p.a. in Indonesia while Purohit and Michaelowa53 found a potential of 34 TWh in India. However, currently a repetition of the early successes seems unlikely due to the stringent interpretation of the additionality and E+/E- rule.
A dedicated technology-specific roll-out programme may be most promising in the form of a PoA. The solar water heater PoAs might be a blueprint for this. If PoAs can build on earlier dissemination successes like the biogas dissemination through Dutch development assistance in Vietnam, they might be able to mobilize substantial numbers of RE applications. But all this requires a close interaction between national policymakers, potential PoA coordinators and CDM consultants. Unfortunately, so far, no CDM host country has developed a PoA in conjunction with a RE support policy. The PoA could be coordinated by the national RE agency that would provide incentives for RE project developers whose projects then are automatically added as CPAs. The closest we get to this approach is the Grameen Bank’s PV and biogas PoA in Bangladesh, where the coordinator itself is strongly involved in a nationwide up-scaling of household-level RE.
3.1.2 Combining the CDM with NAMAs
While regulatory reforms and PoAs may facilitate small-scale projects under CDM, it is still recognized that CDM revenues may often be insufficient to remove financial barriers preventing the proliferation of many RE technologies. In the context of post-2012 climate policy, developing country governments are allowed to introduce NAMAs, i.e. policies to reduce national GHG emissions and receive international financial and/or technical support, or even generate credits in the form of a market mechanism (see section 2.4 above). While the detailed rules for NAMA design and support as well as the available financing remain unclear for the time being, the high level of financing pledged by industrialized countries at the Copenhagen and Cancun conferences for mitigation and adaptation activities in developing countries – 30 billion $ between 2010 and 2012 with a view to increase that to 100 billion
52 Restuti and Michaelowa, 2007 53 Purohit and Michaelowa, 2007

University of Zurich, perspectives GmbH, Point Carbon Scoping Study “Linking RE Promotion Policies with International Carbon Trade” for IEA RETD
Page 35
$ per year by 2020 - makes it likely that a few billion $ could be mobilized for well-designed RE support programmes. Wehner et al.54 provide a detailed blueprint for a supported NAMA in the Mexican housing sector with a strong RE component (solar water heaters, roof-top PV). It should however be noted that industrialized countries have no commitment to finance NAMAs.
A viable and promising strategy could, hence, be to combine a NAMA that would receive support by industrialized country governments with a dedicated strategy to harness market mechanisms, be it the CDM or a new market mechanism. The combination of project based carbon finance (CDM) and supported NAMAs could take many shapes. Analysis of conditions in many developing economies will uncover that there are many complex and interrelated conditions that constitute barriers to RE development. While CDM is designed to provide a financial incentive through project economics, NAMAs would need to be used not only to improve the project economics, but even more to address a range of other barriers such as legislation, regulation, licensing, institutional capacity, technical capacity building (training), infrastructure in terms of power transmission, heat grids, supply chains for renewable fuels and many other pressing issues in developing economies. Facilitative measures in these areas may reduce overall perceived investor risk, and improve lead times. In sum, such measures may reduce the required financial incentive to project developers and investors.
3.1.3 Optimizing the mix of unilateral, supported and credited NAMAs
NAMAs need to be carefully designed so that they complement carbon finance and address the barriers that most effectively prevent RE deployment. Of particular interest is how financial NAMA instruments can supplement CDM and hence bring project economics to a level that will aid a rapid expansion of RE. An important aspect is outlined in Figure 6. We assume that the cost gap between RE and fossil electricity technology goes down over time. At current prices for CDM credits, only a small part of the gap is closed; the closure of the gap would happen far in the future, when carbon credit prices have increased sufficiently (point C). The introduction of a supported NAMA would introduce a subsidy; the sum of the subsidy and the carbon credit revenue closes the cost gap much earlier, at point B.
The challenge is of course to design the NAMA in a way that the sum of the subsidy and the carbon price revenue just close the cost gap. This would avoid overly attractive conditions for RE and maximize effectiveness of public spending for mitigation. This interaction between national incentives and carbon finance is an equally important challenge in a large number of Non-Annex 1 countries that currently have domestic RE programmes while they simultaneously are eligible to receive carbon finance through the CDM. At point C, the subsidy could be completely abolished, as the carbon price is attractive enough to drive investment in RE technologies. If the NAMA was designed in a way that it generates carbon credits, the challenge comes up again that the cost gap is only closed at point C. However, the negotiations are still unclear about the conditions a NAMA needs to fulfil to become a market mechanism. Other challenges of such an approach are the decision about the volume of credits generated and the
54 Wehner et al., 2010

University of Zurich, perspectives GmbH, Point Carbon Scoping Study “Linking RE Promotion Policies with International Carbon Trade” for IEA RETD
Page 36
allocation of the emission reductions between the host country and the investor, especially under supported (rather than credited) NAMAs, where the host country has an interest to show own contributions to mitigation.
Figure 6: Combination of supported NAMA and credits to close the cost gap for RE power generation projects
Of course, reality is more complex than shown in Figure 6. Policymakers cannot foresee the development of the cost gap, so they may be inclined to provide subsidies that are too high. Investors might not trust the long-term development of the carbon price so require a subsidy that closes the entire cost gap and see the carbon credit revenue just as “icing on the cake”. Industrialized countries might not be willing to commit to support a NAMA for decades and may want to increase the own contribution of developing countries to global emission reductions. From an investor point of view, it is important to have as much predictability on major economic parameters as possible. While flexible incentives may be desirable from a political point of view, such systems that change or subject players to discretionary adjustments deter investments. This is why FITs for renewable electricity that provide long term certainty on project revenue are well received in the investment community.
3.1.4 Electricity feed-in tariffs as supported and credited NAMAs
Measurement, reporting and verification (MRV) are critical, both to generate sufficient trust for donors to finance RE NAMAs as well as to generate tradable credits. Okubo et al.55 discuss the requirements to
55 Okubo et al., 2011
A B C Time
€/kWh
Carbon creditrevenue
Cost gap between RE and fossil electricity
technologiesSubsidythroughNAMA

University of Zurich, perspectives GmbH, Point Carbon Scoping Study “Linking RE Promotion Policies with International Carbon Trade” for IEA RETD
Page 37
measure, report and verify a FIT for renewable electricity designed as supported or credited NAMA. The difficulty in the measurement of policy effects in terms of GHG reductions is that a FIT is often not the only policy for RE promotion. Except for Costa Rica and Sri Lanka, all developing countries with a FIT have introduced additional policies, such as capital subsidies, grants, or rebates56. So the question comes up whether the country supporting the FIT-related NAMA thinks that the level of the other instruments is appropriate or whether the FIT should be lowered. Another problem with subsidizing or crediting a FIT is that its additionality may cease once the supported technology becomes economically viable. To address this problem, an investment analysis of the technologies benefiting from the FIT would have to be regularly repeated to prevent an over-subsidization.
Overall, a FIT seems to be highly suitable for stacking of a supported NAMA and credits from a market mechanism, be it the CDM or sectoral crediting. A baseline emissions factor can be calculated, the overall production level of RE power after introduction of the FIT can be monitored, and additionality of the FIT can be assessed using both an investment and a barrier test. From an efficiency perspective, the FIT should decrease over time if the cost gap between RE and fossil-fuel-based electricity declines. The FIT would stop once the investment test cannot show any more that the development of RE projects requires continued subsidization, which would be the case after point C in Figure 6.
3.1.5 Other policy instruments as supported and credited NAMAs
Alternatives to FIT as a supplement to CDM incentives could be a NAMA involving investment grants or rebates, which could also cover non-electricity applications. For small scale installations with RE and energy efficiency, good results have been seen with standardized rebate schemes to offset upfront investment cost. This would be particularly useful in developing countries where higher upfront costs of RE and energy efficient solutions and lack of finance for home owners and small businesses constitute an additional barrier.
For larger scale installations, subsidies could be offered in the form of investment grants or a long-term power purchase agreement (PPA) distributed through competitive bidding (e.g. auctions). This would be a market-based approach to establish the required financial supplement to the CDM revenues as the competition would tend to minimize the subsidy element and adapt it to project specificities, choice of technology, locational issues and level of carbon finance.
3.1.6 High long-term carbon price as sole driver of RE projects
Another approach to improve project economics of RE projects would be a carbon credit price that increases to a level sufficiently high to close the cost gap on its own by having an underlying
56 REN21, 2007
University of Zurich, perspectives GmbH, Point Carbon Scoping Study “Linking RE Promotion Policies with International Carbon Trade” for IEA RETD
Page 38
international climate policy regime that is stringent enough to make it unlikely that the price collapses. If governments would take the reductions needed to reach the 2°C target with a sufficient level of probability, emissions would have to be reduced globally by 2050 by 50-60%. Given the lifetime of RE projects that frequently reaches 20 years, or – in the case of hydropower – even up to a century, this would require emission targets with timeframes of several decades, underpinned by shorter commitment periods to prevent business-as-usual for a prolonged period. In an efficient carbon market, instruments would be available that enable the investor to hedge the carbon price risk hence offering long term certainty of the carbon revenue. However, in this case the investor would be exposed to the uncertainty of changing power prices and transmission tariffs. Given current cost gaps, the carbon price would have to exceed 50 €/t CO2 to fully close the cost gaps for wind and biomass power; for solar power it would need to reach more than 100 €/t CO2. Such a price could only be achieved if the current industrialized countries as well as advanced developing countries would take up mandatory emission targets at the tougher end of the corridor aiming for a stabilization of the global temperature increase below 2°C. In the situation after the Copenhagen and Cancun conferences, such a scenario is remote; most relevant countries prefer a “pledge and review” process where emission targets mainly are voluntary, and not sufficient to drive carbon prices above single-digit levels. One might also envisage policy options where industrialized countries buy reduction credits in developing countries and then cancel the credits without using them as an offset for their own commitments, or where developing countries themselves cancel a fraction of their credits to use this as own contribution to climate change mitigation. Both these options would also drive carbon prices up, but in the face of competitiveness concerns, the incentives for countries to voluntarily cancel credits instead of selling or using them are currently quite low. Stricter rules on the eligibility of carbon credits (such as the EU’s unilateral decision only to accept high quality CERs in its ETS after 2012, which may rule out credits from industrial gas projects from the EU ETS market), will also drive carbon prices up, but only to the extent that there are no other potential buyers in the market. Thus it is unlikely that carbon credit prices will rise high enough to mobilize RE projects on their own.
3.2 Approaches to address technical barriers
3.2.1 Default grid emission factors
More than two thirds of CDM host countries have not published their grid emission factor. The obstacle of lack of data for calculating the grid emission factors for RE projects could be overcome by using default parameters for the grid-connected power plants determining the baseline. Already today, the tool to calculate emissions from electricity grids contains an appendix with default efficiencies for power plants of different types. But application of these default values still requires knowledge of the share of each power plant in electricity production for the grid into which the RE plant feeds. Therefore, a more

University of Zurich, perspectives GmbH, Point Carbon Scoping Study “Linking RE Promotion Policies with International Carbon Trade” for IEA RETD
Page 39
far-reaching approach would be the use of a benchmark57. Such a benchmark would be available for all RE projects and not require any data collection if specified as a default value. It thus would substantially reduce costs for project developers trying to find the data and for validators to check whether the data are conforming with the rules. For example, Hoch58 proposes a benchmark set just below the emission factor of the most-efficient gas power generation technology. While Hoch does not provide a value, a gas power plant of an efficiency of 58% would have an emission factor of around 350 g CO2/kWh. Applying a default benchmark of this level would provide a revenue of 0.4 ct/kWh RE at current carbon prices. The benchmark solution thus has the trade-off of on the one hand opening up new countries for RE CDM projects, while on the other hand only providing a limited level of carbon credit revenue.
Nevertheless, this benchmark approach may be beneficial in case of low-income countries with hydro-dominated electricity production. In such cases, the benchmark approach would lead to higher baseline emissions than under the current CDM baseline rule. For example, several African countries have calculated grid emissions factors reaching as low as 60 g CO2/kWh (Ethiopia). To prevent a non-conservative application of the benchmark, which is necessary for the sake of environmental integrity as long as the credits are used for offsetting, its use could be limited to a situation where the per capita electricity use is below a threshold deemed as unsustainable. In countries with a low per capita electricity use, suppressed demand exists (see discussion in section 2.2.2) and an expansion of electricity production by thermal power would be likely, as thermal power can be installed rapidly and requires less upfront financing than hydropower. Such a suppressed demand per capita electricity use threshold could be situated at the level of 1,000 kWh per person and year, which is currently not reached by about 50 countries worldwide; African countries currently reach values of a few hundred kWh.
3.2.2 Default emission factors per installation
Default emissions reduction per installed and functional installation could be applied for RE projects outside the electricity sector, especially micro-scale installations like biogas plants, biomass-based stoves, solar home systems, solar water heaters or solar cookers. This default would be based on assumptions regarding utilization intensity, baseline technology and baseline fuel used, with a substantial discount to ensure conservativeness. Such a default emissions reduction has for the first time been applied in the small-scale methodology AMS III.AR for light emitting diode (LED) lighting and set at 0.08 t CO2 eq. per LED and year. For utilization intensity, there is a precedent in the CDM regulation with average daily household lighting use set at 3.5 hours in small-scale baseline methodology AMS II.J. Baseline technology standardization exists for small-scale off-grid electrification (AMS I.F), where diesel generators are seen as default technology. A baseline fuel default is used in the form of kerosene in AMS III.AR. A default approach for solar water heaters was approved by the CDM
57 for a generic discussion on benchmarks see Hayashi et al., 2010b 58 Hoch, 2011
University of Zurich, perspectives GmbH, Point Carbon Scoping Study “Linking RE Promotion Policies with International Carbon Trade” for IEA RETD
Page 40
Executive Board in April 2011. . Also for other factors than emissions, the use of defaults values could reduce project costs. The advantage of such an approach would be that transaction-cost intensive monitoring of each installation’s energy production could be eliminated. However, to avoid the proliferation of projects that just set up installations and do not care about their actual use, the functioning of at least a statistically significant sample of installations would have to be monitored.
3.3 Approaches to address regulatory barriers and threats/opportunities emerging from new market mechanisms
3.3.1 Clarification of the E+/E- rule
The E+/E- rule would need to be applied in a way that as long as RE projects pass the additionality test in the absence of a RE promotion policy introduced after November 2001, any such policy can be introduced as well as modified. This would lead to the following specific guidance for RE electricity projects:
- The current, actually applied wholesale power tariff59 should be used as input for the investment analysis used to demonstrate additionality for any RE electricity generation project. For projects that relate to the provision of non-electricity-related RE, the revenues would be the avoided cost of alternative service provision, e.g. of heat generated by using fossil fuel. Following the E+/E- rule, no policy support elements such as FIT, investment subsidies, revenues from green quotas etc. should be included in the calculation of project revenues, as long as they have not been introduced before November 2001. Thus changes in these policy support elements are not looked at by the CDM regulators and we would not run into a problem akin to the one facing wind and hydropower developers in China.
- For RE support policies introduced before November 2001 the policies that were clearly limited to a small number of installations and not meant to be universally applicable to any upcoming RE project should be excluded from the additionality determination. In some countries, the granting of a FIT for one or two plants - which was clearly seen as a measure to develop “lighthouse projects” and did not envisage to offer similar tariffs to any other project developer - has jeopardized the chances of participating in the CDM.
It would be politically easier to get agreement on such guidance if developing country governments would realize that an “over-subsidization” of RE is a bad policy, and that a FIT or other support always should be set at a level where the revenue from CDM is required to make RE projects commercially
59 In case there is no wholesale market but only a regulated power tariff, use the lowest tariff approved by the regulator.

University of Zurich, perspectives GmbH, Point Carbon Scoping Study “Linking RE Promotion Policies with International Carbon Trade” for IEA RETD
Page 41
attractive. Then, it would no longer be possible to reproach the CDM that it only provides an “icing on the cake” for projects that – thanks to strong domestic subsidies – are already highly attractive without the CER revenue. To this aim, information is needed about what is the real cost gap to reach financial feasibility of different RE technologies, and what is the contribution of the carbon market to close this cost gap at different carbon prices.
3.3.2 Country- or region-specific positive lists for additionality determination
A bolder solution to the additionality concern in relation to domestic-level RE support policies would be to establish country- or region-specific positive lists of RE technologies that would be considered automatically additional. A rule similar to positive list was introduced in 2010 (and updated in 2011, see UNFCCC 2011), as all RE projects below 5 MW are automatically additionally if they are either located in Least Developed Countries or if they provide electricity to household and communities. . We propose positive lists that are not restricted to micro scale projects but would have to be established on the basis of an objective indicator of additionality. We would propose a demonstration that the RE technology has generation costs that cannot be covered with the current wholesale power tariff in the country, excluding the effect of RE power tariff subsidies (e.g., FITs). Such a cost gap thus needs to be covered by additional financial support, through domestic support policies and/or CDM. Once the cost gap has been established for a specific RE technology, then subsequent projects using the same technology in the same country are deemed automatically additional. For example, a country X could demonstrate that all solar plants and hydro plants smaller than 10 MW have higher costs than the wholesale power tariff (excluding any RE subsidies), and thus proposes these technologies for its additionality positive lists. Then, all projects falling into these categories would be automatically seen as additional, without any need for further proof. To account for technological developments that reduce costs over time, or for changes in power tariffs, such positive lists would need to be dynamic and thus updated periodically. The frequency of updating depends primarily on trends of the technology cost; the more rapidly changes the technology cost over time (e.g., due to learning curve effects), the more frequently should the positive list be updated. Such positive lists would be country- or, for large countries, region-specific: this would account for the different circumstances in each host country, such as technology costs, availability of RE resources, power tariffs, etc. By excluding the effect of RE power tariff subsidies in the wholesale power tariff indicator, it gives a clear signal to host countries that introduction of RE promotion policies will not negatively affect additionality of CDM/JI projects. This is in line with the principle of the E+/E- rule and can help improve consistency in the application of the E+/E- rule (see section 2.2.3 for more details on the inconsistent application of the E+/E-rule in the past). Furthermore, the positive list approach helps streamline the CDM/JI process by shifting the burden of additionality demonstration from an individual project to country- or regional coordinator level.

University of Zurich, perspectives GmbH, Point Carbon Scoping Study “Linking RE Promotion Policies with International Carbon Trade” for IEA RETD
Page 42
3.3.3 Reformed rules for PoAs
As described in Section 2, PoAs are a potential solution for broadening the deployment of small-scale, dispersed RE technologies such as domestic solar water heaters, solar cook stoves, or biofuels. However, before being able to support this potential, regulatory barriers preventing PoA take-off need to be addressed. The liability of PoA validators should be reformed in a way that the validator is only liable for the CER volume of the latest issuance request for any CPA, and that this liability lapses if within three months from the submission of the issuance request no formal check regarding a potential erroneous inclusion of that CPA has been requested by the Executive Board. Moreover, the liability would not extend to other CPAs; for each CPA liability could only be triggered by a specific request to check whether it was erroneously included. This rule would remove the risk of being liable for a multi-year stream of CERs from an unlimited number of CPAs called into doubt.
An alternative to that proposal would be to make project developers liable for CERs issued erroneously, but this would require a wholesale change in CDM procedure as to date it has been impossible to revoke CERs issued.
Moreover, clear formulae for sample sizes to be verified should be provided and all kinds of combination of RE-related baseline methodologies allowed with those that involve reduction of GHG due to utilization of renewable fuels that decay in the baseline situation and emit methane.
3.3.4 Use of new market mechanisms instead of CDM
In order to combat climate change emission reductions have to be both broader and deeper. In an effort to scale up mitigation efforts across the world sectoral approaches have been proposed. The hope is to include mitigation actions in developing countries in more areas and on a broader scale than what has been possible by the somewhat piecemeal project by project approach of the CDM. Moreover, in the international climate negotiation several countries have started to object that advanced developing countries get full carbon credits for emission reductions achieved by CDM projects. Sectoral mechanisms could be based on non-binding sectoral targets that are hopefully more stringent than business-as-usual development60, although it remains to be seen if this is possible in reality. If the sectoral target is more stringent than the current CDM baseline, the credit level per unit of RE produced would be lower than under the current CDM. Butzengeiger-Geyer et al.61 discuss the pros and cons of different types of sectoral mechanisms. They conclude that to make such a system at least reasonably attractive to RE project developers, the sectoral mechanism would have to be linked to a domestic ETS for the power sector where companies that do not achieve the target would have to buy credits. This enables over-performing companies to receive full credit for their over-performance. Such a system would require the willingness of the developing country government to enforce penalties on the under-
60Baron et al., 2009; IETA, 2010; see section 2.4 above 61Butzengeiger-Geyer et al., 2010

University of Zurich, perspectives GmbH, Point Carbon Scoping Study “Linking RE Promotion Policies with International Carbon Trade” for IEA RETD
Page 43
performers. Any other system would suffer from the incentive for some companies to free-ride on the reductions achieved by others62. Given that already the CDM, which issues credits for a conservative estimate of all the emission reductions achieved, is seen as insufficiently attractive to many RE developers, it is hard to see how a sectoral mechanism could become attractive to private RE developers. Moreover, the sectoral mechanism would have a strong involvement of the host country that might be seen as risky, whereas the CDM minimizes government interference.
3.3.5 Use of subsidized NAMAs instead of CDM
Public RE support policies such as improvements in electricity market access, siting and planning support whose individual GHG impacts are difficult to quantify would best lend themselves to the concept of NAMAs63. However it is highly unlikely that NAMAs with non-quantified results would be allowed to generate emissions credits. If one can provide a clear indication that the long-term impact of these policies will be substantial, such NAMAs might harness subsidies from industrialized countries. However, to date the willingness of industrialized countries to provide NAMA subsidies has been limited. Apparently, no country is willing to shell out billions to pay for FITs in developing countries.
3.3.6 Use of credited NAMAs instead of CDM
As discussed above, FIT or a RPS might be able to qualify as a credited NAMA64. While so far, no rules on the design of credited NAMAs have been agreed, consistency with the other market mechanisms would probably require to calculate the production volume of RE mobilized by the policy instrument and then multiply it by the grid emissions factor calculated as per CDM baseline methodology.
3.3.7 Global emissions trading instead of CDM
In the long run over several decades, an important climate policy incentive for RE would be a full integration of the power sector in advanced developing countries in the international carbon market through linking of ETS65. This would require that each country enforces penalties on entities that do not surrender enough allowances, and that allowances are allocated through auction or technology-neutral benchmarking, as otherwise ETS can become a barrier to RE promotion66. Of course, the introduction of an ETS would make the project-specific approaches CDM and JI, to cover only those sectors that are impossible to integrate in a trading scheme. Moreover, to drive a large-scale penetration of RE, the
62see also criticism of sectoral mechanisms by IETA, 2010 63Lewis and Diringer, 2007; see section 2.4 above 64 Okubo et al., 2011 65 Mace and Anderson, 2009 66 See section 2.4 above

University of Zurich, perspectives GmbH, Point Carbon Scoping Study “Linking RE Promotion Policies with International Carbon Trade” for IEA RETD
Page 44
stringency of the underlying emission commitments would have to be high enough to harness a level of demand for allowances which would lead to a global carbon price that is able to close the cost gap for widely applicable RE technologies. Still, the ETS approach would leave countries freedom to implement additional domestic-level RE support policies, which could contribute to closing this cost gap in the short term and help to drive innovation that will reduce the costs in the long-term67.
Obviously, the potential future generation of new large carbon credit supply categories such as from Reducing Emissions from Deforestation and Degradation (REDD) would drive down prices and reduce the attractiveness of RE solutions. Thus, advocates of RE should look carefully at what technologies are proposed to be integrated into the market mechanisms. One solution would be to separate the market for REDD credits from the other markets; from the perspective of efficient mitigation, such a separation would drive up mitigation costs.
4 Conclusions and recommendations for future action
4.1 Key challenges Beyond the general barriers existing for a faster deployment of RE in the world, and in particular in developing countries, there are several specific barriers that prevent a more successful interaction between domestic RE promotion policies and the international carbon market in the form of CDM/JI: financial, technical and regulatory barriers.
In terms of finance, with current carbon prices the flexibility mechanisms CDM and JI only achieve a marginal contribution towards the financial attractiveness of most RE projects, and are not capable of tackling the high upfront costs that many RE investments entail, because the carbon finance is usually accrued after the emission reductions are achieved. The high transaction costs of CDM/JI, especially relevant for small projects, and the uncertainties about future demand post 2012, exacerbate these challenges. Specifically in the CDM, this limited financial contribution of the carbon market also entails a regulatory barrier, as it results in a weak financial additionality of the projects.
Technically, it is costly to collect data for establishing the baselines against which the emission reductions from CDM/JI RE projects are measured. Such high transaction costs are particularly important in the case of grid-connected electricity, especially in less developed countries where data is less available. Dispersed energy applications suffer from cumbersome monitoring of emission reductions. Rural on-grid RE applications, also especially in the poor CDM host countries, have baselines that generally do not reflect the fact that demand for energy is suppressed because households cannot afford a higher expenditure on energy.
67 Policies to promote RE can not only be justified by the market failure of climate change but also the market failure of innovation: firms may underestimate the long-term benefits of investing in RE (and the subsequent learning) or they do not expect to harness all the benefits (e.g. due to uncertain property rights), which leads to sub-optimal investments. (see Edenhofer et al. 2011)

University of Zurich, perspectives GmbH, Point Carbon Scoping Study “Linking RE Promotion Policies with International Carbon Trade” for IEA RETD
Page 45
On the regulatory side, a key barrier within the CDM is the regulators’ concern about the additionality of RE projects when support policies – specifically feed-in tariffs – are in place. The concern is to some extent justified, as RE support policies may have several goals, not just climate change mitigation. But its management has so far not been ideal, with inconsistent application of the E+/E- rule on the existence of FITs across different countries. Two other regulatory barriers are, first, the exclusion of grid-connected RE projects from JI in countries included in the EU ETS, and second, the unresolved liability issue for Programmes of Activities, which are mostly relevant for small-scale and decentralized applications in the CDM.
4.2 Solutions To respond to these barriers, several immediate and more long-term solutions have been proposed in the report. Figure 5 shows the main measures we propose to promote RE but still preserve the environmental integrity of the climate regime. Each measure will be described in the following.
Figure 7: Overview of proposed solutions to fruitfully combine national RE policies in developing countries with the international carbon market
4.2.1 Short-term measures
Among the immediate solutions, which can already implemented in the next 2-3 years, we find further standardization of baseline and monitoring methodologies, promotion of Programmes of Activities, and
2012 2015 2020

University of Zurich, perspectives GmbH, Point Carbon Scoping Study “Linking RE Promotion Policies with International Carbon Trade” for IEA RETD
Page 46
the reform of the E+/E- rule with a view to clarify the consideration of domestic RE support policies in the demonstration of additionality of CDM projects.
a) Standardization of baseline and monitoring methodologies for RE projects is a good way of addressing some of the technical barriers and at the same time reducing transaction costs of market mechanisms in the short term. Benchmarks could be utilized for the calculation of grid emissions factors, and default values for the monitoring of off-grid energy applications, in order to simplify data collection efforts. At the same time, it is necessary to ensure that the choice of benchmarks and default values ensures conservativeness and safeguards environmental integrity, which is crucial as long as the credits are used for offsetting.
b) Programmes of Activities (PoAs) are another option to reduce costs in the project cycle, especially for small-scale and dispersed RE applications such as household thermal energy and biofuels. To promote PoAs, the regulatory barrier of too strong liability for verifiers in case of mistakes in the selection of programme components needs to be addressed, as well as the definition of acceptable criteria for determining additionality of these components. Options to limit the liability would be to come up with a COP/MOP decision that would reduce this liability to a specific period of time, or to shift liability from verifiers to PoA owners.
c) A more fruitful interaction between market mechanisms and domestic RE promotion policies requires a clarification of the E+/E- rule that regulates the role of domestic policies for establishing project baselines under the CDM. Clarification is especially needed in terms of whether this rule also applies to additionality determination. In case it does, this means that FITs (or other alternative market-pull policies introduced after November 2001) should not be included in the financial analysis step of additionality determination, as has been done in several projects in South Korea. It also means that host country governments should be free to change policy support mechanisms according to how energy markets evolve. Thus, the recently established rule that the highest feed-in tariff needs to be used for the determination of commercial attractiveness of CDM projects should be scraped.
A take-off of renewable energies in the CDM/JI requires more awareness of country governments that too strong national incentives for RE may be risky in terms of additionality of potential CDM/JI projects. National policy makers should be made aware that it is better to set the FIT (or other alternative support instrument) at a level that makes the CDM/JI necessary for achieving financial feasibility, so that additionality concerns are not raised in the first place. To this aim, information is needed about what is the real cost gap to reach financial feasibility of different RE technologies, and what is the contribution of the carbon market to close this cost gap at different carbon prices.
A more radical solution would be to establish country-specific positive lists of RE technologies that are to be considered automatically additional, on the basis of a comparison of generation

University of Zurich, perspectives GmbH, Point Carbon Scoping Study “Linking RE Promotion Policies with International Carbon Trade” for IEA RETD
Page 47
costs and revenues achieved with existing power tariffs but excluding the effect of RE power tariff subsidies (such as FITs). These positive lists would be country-or region-specific and would have to be updated regularly to account for technology developments and changes in electricity markets. By excluding the effect of RE power tariff subsidies, this option gives a clear signal to host countries that introduction of RE promotion policies will not negatively affect additionality of CDM/JI projects. Furthermore, the positive list approach helps streamline the CDM/JI process by shifting the burden of additionality demonstration from an individual project to a country or regional coordinator.
4.2.2 Longer-term opportunities
Longer-term opportunities and threats are mainly related to increased use of new and reformed market mechanisms and the future development of the climate regime and the carbon market post 2012 (up to 2020, and sometimes even beyond).
a) If the regulatory barriers are overcome, an increased use of PoAs to establish roll-out plans for specific RE technologies, such as solar water heaters, possibly accompanied by certain governmental support, is an opportunity.
b) Provided the concept of NAMAs is further defined, NAMAs could be used as a framework to combine CDM with domestic policies and international support or risk reduction options. For example, FITs or other RE promotion policies and facilitative measures (even non-financial ones, such as capacity building, regulatory improvements, infrastructure development, etc.) could be proposed as domestic or supported NAMAs, in a way that their combination with the carbon market makes RE just competitive. This option needs to be analyzed further in terms of concrete design, detailed rules, political acceptability (support for NAMAs to be counted towards financial commitments, but also leading (at least indirectly) to credited reductions), attribution of emission reductions and double counting, additionality, and MRV.
c) Sectoral crediting mechanisms, which aim at generating credits for emission reductions in a whole economic sector within a country against a no-lose baseline, are an opportunity to broaden the deployment of RE technologies in the mid-term (before ETS are installed, see below). For instance, a sectoral no-lose baseline for electricity production (e.g. 200 tCO2 per GWh of electricity) could be set in a specific country. The country could implement renewable policies then to lower the average amount of CO2 per unit of electricity, and would be rewarded with credits for emissions below the no-lose baseline. However, sectoral crediting still has important challenges. To start with, there is no decision to introduce a sectoral crediting mechanism yet. Furthermore, sectoral crediting would require a close coordination by the government of the entities throughout the sector to avoid free-riding of individual installations in detriment of those that do engage in emission reductions, and to ensure that the carbon price

University of Zurich, perspectives GmbH, Point Carbon Scoping Study “Linking RE Promotion Policies with International Carbon Trade” for IEA RETD
Page 48
signal is transferred to the private actors in the sector. Also, a transition from the project-based CDM/JI would need to be regulated in a way that does not discourage investors.
d) The establishment of national (or regional) emissions trading systems similar to the EU ETS entails both opportunities and challenges for renewable energy, as those witnessed in the interaction between JI and the EU ETS. ETSs are better suited than project-based mechanisms to accommodate domestic RE policies, because additionality would no longer be an issue; a price on carbon is more certain under an ETS because project approval and credit issuance is no longer a risk. But under an ETS with a cap the RE support policies would promote RE deployment only until the emissions cap is reached, which would be problematic if the cap is not ambitious enough68, Further, the design of the ETS is critical in shaping incentives: while grandfathering is more likely to favor high emitters, auctioning is better suited to promote RE installations69.
e) Finally, the carbon market cannot function without demand, and carbon prices cannot provide sufficient support for costly RE technologies if prices are low. This is a political issue that depends critically on the type and level of emission reduction targets countries are willing to commit to (or pledge); on the possible quality restrictions that may be imposed on demand; on competition from other potential sources of cheaper credits, such as potentially some type of REDD credits; on the willingness of countries (or other actors) to voluntarily buy and cancel carbon credits instead of using them for offsetting; and on the level of consolidation and integration of the climate regime and the carbon market. If a fragmented regime with independent carbon markets and different rules emerges, which is very likely at the moment, this would decrease efficiency and effectiveness of the market and also trust from investors.
4.3 Need for further analysis Further analysis is needed on some of the approaches proposed above to remove barriers for future RE deployment within the carbon market, and to prepare for future dilemmas between national policies and RE in the carbon market.
A critical issue we found throughout the study is the role of additionality in preventing the take off of RE electricity projects in the carbon market, especially in combination with national RE support policies. We thus propose to look into the contribution of the market mechanisms to closing the cost gap of RE electricity technologies (between generation costs and power sale revenues) in detail. This would require an analysis of the cost gap for different RE technologies, and an assessment of the contribution of the carbon market under different carbon prices. This information would be the basis for new
68 Philibert 2011 69 Carbon Trust, 2007.

University of Zurich, perspectives GmbH, Point Carbon Scoping Study “Linking RE Promotion Policies with International Carbon Trade” for IEA RETD
Page 49
proposals on how to look at the additionality of RE projects, such as the one presented in Section 3.3.2 of this report.
Furthermore, we found that PoAs are still not fulfilling their envisaged role as an instrument that would facilitate the access of small-scale, dispersed projects to the carbon market. Thus, we suggest looking into the possibility to expand PoAs, under the coordination of governments and in combination with suitable RE support policies, as a means to achieve wide dissemination of specific RE technologies within countries. Issues that would need to be considered in such a study are the domestic institutional framework to coordinate the PoA, the role of RE support policies and their effects on the additionality of the PoA, awareness raising among potential project developers, ownership of the CERs, the possibility to use the CER income to directly finance the support policies, and possibly the identification of potential candidates for a pilot program.
In the third place, and looking at more long-term solutions, we propose a study and pilot about the possibility of using the framework of NAMAs to directly support with international funds or generate credits for RE support policies without requiring a project-by-project assessment. As explained above, such an option requires first a concrete design that takes into account political acceptability among developed and developing countries, the avoidance of double counting of emission reductions, attribution of emission reduction between investors and host country, additionality considerations, MRV and also the evolution of the RE support policies over time, so that potential cost reductions in the technology are taken into account and financial additionality is guaranteed.
While sectoral crediting and ETS in developing countries are interesting options for the longer-term (see above), enough studies have been undertaken and the main barrier is political willingness to move in this direction. Therefore, we suggest to rather analyzing existing but improvable institutions (CDM PoAs) and NAMAs, which are close to implementation. Technical details of sectoral crediting / ETS in developing countries and their interaction with RE policies may be further explored once political willingness is given.

University of Zurich, perspectives GmbH, Point Carbon Scoping Study “Linking RE Promotion Policies with International Carbon Trade” for IEA RETD
Page 50
References Anger, N., and Sathaye, J. 2008. Reducing deforestation and trading emissions: Economic implications for the post-Kyoto carbon market. ZEW Discussion Paper No. 08-016. ZEW, Mannheim.
Baron, R., Buchner, B., and Ellis, J. 2009. Sectoral approaches and the carbon market. OECD/IEA, Paris.
Beaurain, F., and Schmidt-Traub, G. 2010. Developing CDM programmes of activities: A guidebook. South Pole Carbon Asset Management, Zurich.
Beck, F., and Martinot, E. 2004. Renewable energy policies and barriers. Encyclopedia of Energy 5: 365-383.
BMU. 2007. Renewable energy and the Clean Development Mechanism: Potential, barriers and ways forward - A guide for policy-makers. BMU, Berlin.
Brunnschweiler, C. 2010. Finance for renewable energy: an empirical analysis of developing and transition economies. Environment and Development Economics 15(3): 241-274.
Butzengeiger-Geyer, S., Castro, P., Dransfeld, B., Michaelowa, A., Okubo, Y., Skogen, A. and Tangen, K. 2010. New market mechanisms in a post 2012 climate regime – Challenges and opportunities. Report to the German Federal Environment Agency. University of Zurich, Perspectives Climate Change and Point Carbon, Zurich/Hamburg/Oslo.
Carbon Trust. 2007. EU ETS Phase II allocation: Implications and lessons. Carbon Trust, London.
Edenhofer, O., R. Pichs-Madruga, Y. Sokona, K. Seyboth, D. Arvizu, T. Bruckner, J. Christensen, J.-M. Devernay, A. Faaij, M. Fischedick, B. Goldstein, G. Hansen, J. Huckerby, A. Jäger-Waldau, S. Kadner, D. Kammen, V. Krey, A. Kumar, A. Lewis, O. Lucon, P. Matschoss, L. Maurice, C. Mitchell, W. Moomaw, J. Moreira, A. Nadai, L.J. Nilsson, J. Nyboer, A. Rahman, J. Sathaye, J. Sawin, R. Schaeffer, T. Schei, S. Schlömer, R. Sims, A. Verbruggen, C. von Stechow, K. Urama, R. Wiser, F. Yamba, T. Zwickel, 2011. Summary for Policy Makers. In IPCC Special Report on Renewable Energy Sources and Climate Change Mitigation [O. Edenhofer, R. Pichs-Madruga, Y. Sokona, K. Seyboth, P. Matschoss, S. Kadner, T. Zwickel, P. Eickemeier, G. Hansen, S. Schlömer, C. v. Stechow (eds)], Cambridge University Press, Cambridge, United Kingdom and New York, NY.
European Union. 2004. Directive 2004/101/EC of the European Parliament and of the Council of 27 October 2004 amending Directive 2003/87/EC Establishing a Scheme for Greenhouse Gas Emission Allowance Trading within the Community, in Respect of the Kyoto Protocol’s Project Mechanism. European Commission/ European Parliament, Brussels.

University of Zurich, perspectives GmbH, Point Carbon Scoping Study “Linking RE Promotion Policies with International Carbon Trade” for IEA RETD
Page 51
Figueres, C., and Philips, M. 2007. Scaling up demand-side energy efficiency improvements through programmatic CDM. ESMAP technical paper 120/07. World Bank, Washington, D.C.
Flamos, A. 2009. The Clean Development Mechanism—catalyst for wide spread deployment of renewable energy technologies? or misnomer? Environment, Development and Sustainability 12: 89-102.
Global Wind Energy Council. 2011. Global wind statistics 2010, Brussels
GTZ. 2009. Energy-policy framework conditions for electricity markets and renewable energies. 16 Country Analyses. GTZ, Eschborn.
Hamilton, K. 2010. Scaling up renewable energy in developing countries: Finance and investment perspectives. Energy, Environment & Resource Governance Programme Paper 02/10, Chatham House, London.
Hayashi, D., and Michaelowa, A. 2007. Lessons from submission and approval process of large-scale energy efficiency CDM methodologies. HWWI Research Paper 4-11. HWWI, Hamburg.
He, G. and Morse, R. 2010. Making carbon offsets work in the developing world: Lessons from the Chinese wind controversy. Program on Energy and Sustainable Development Working Paper #90. Stanford University, Stanford.
Hoch, Stephan (2011): Response to the Call for Public Inputs on “Draft Tool for Baseline Emissions Calculation” and “Draft Tool for Baseline Identification, mimeo
IEA. 2011. Global renewable energy policies and measures database, download at: http://www.iea.org/textbase/pm/?mode=re.
IETA. 2010. Thinking through the design possibilities for a sectoral crediting mechanism. Three options to encourage discussion. International Emissions Trading Association, Washington, D.C.
Krey, M. 2005. Transaction costs of unilateral CDM projects in India: Results from empirical survey. Energy Policy 33: 2385-2397.
Lewis, J. and Diringer, E. 2007. Policy-based commitments in a post-2012 climate framework, a working paper. Pew Center on Global Climate Change, Arlington, USA.
Livengood, E., and Dixon, A. 2009. REDD and the effort to limit global warming to 2°C: Implications for including REDD credits in the international carbon market. KEA 3, Wellington.
University of Zurich, perspectives GmbH, Point Carbon Scoping Study “Linking RE Promotion Policies with International Carbon Trade” for IEA RETD
Page 52
Lütken, S.-E. and Michaelowa, A., (2009). Corporate strategies and the Clean Development Mechanism: Developing country financing for developed country commitments?. Edward Elgar Publishing, Cheltenham.
Mace, M.; Anderson, J. 2009. Legal and design issues arising in linking the EU ETS with existing and emerging emissions trading schemes. Journal for European Environmental & Planning Law 6: 197-232.
Martinot, E. 2002. Grid-based renewable energy in developing countries: Policies, Strategies, and Lessons from the GEF. World Renewable Energy Policy and Strategy Forum, 13-15 June 2002, Berlin.
Martinot, E., Chaurey, A., Lew, D., Moreira, J.-R., and Wamukonya, N. 2002. Renewable energy markets in developing countries. Annual Review of Energy and the Environment 27: 309-348.
Metcalf, G., Weisbach, D. 2010. Linking policies when tastes differ: Global climate policy in a heterogeneous world, Discussion Paper 10-38, The Harvard Project on International Climate Agreements, Harvard, MA.
Michaelowa, A. 2011. Rule consistency of grid emission factors published by CDM host country authorities, download at http://www.cdm-watch.org/wordpress/wp-content/uploads/2011/02/rule_consistency_of_grid_emission_factors_published_by_CDM_host_country_authorities_14_Feb_2011-.pdf.
Michaelowa, A., Hayashi, D., and Marr, M. 2009. Challenges for energy efficiency improvement under the CDM: The case of energy-efficient lighting. Energy Efficiency 2: 353-367.
Michaelowa, A.; Jotzo, F. 2005. Transaction costs, institutional rigidities and the size of the clean development mechanism. Energy Policy 33: 511-523.
Okubo, Y., Hayashi, D., and Michaelowa A. 2011. NAMA crediting: How to assess offsets from and additionality of policy-based mitigation actions in developing countries. Greenhouse Gas Measurement & Management 1: 37-46.
Ölz, S. and Beerepoot, M. 2010. Deploying renewables in South East Asia: Trends and potentials. OECD/IEA, Paris.
Philibert, C. 2011. Interactions of policies for renewable energy and climate. Working Paper, OECD/IEA, Paris.
Purohit, P., Michaelowa, A. 2007. CDM potential of bagasse cogeneration in India. Energy Policy 35: 4779-4798.
REN21. 2007. Renewable energy promotion policies: Opportunities for the rapid deployment of renewable energy in large energy economies. REN21 Secretariat, Paris.

University of Zurich, perspectives GmbH, Point Carbon Scoping Study “Linking RE Promotion Policies with International Carbon Trade” for IEA RETD
Page 53
REN21. 2010. Renewables 2010: Global status report. REN21 Secretariat, Paris.
Restuti, D., Michaelowa, A. 2007. The economic potential of bagasse cogeneration as CDM projects in Indonesia. Energy Policy 35: 3952-3966.
Schlamadinger, B., and Bird, D.N. 2007. Options for Including Agriculture and Forestry Activities in a Post-2012 International Climate Agreement. Environmental Science and Policy Special Issue 10 (4): 269-394.
Schneider, M., Schmidt, T., and Hoffmann, V.H. 2010. Performance of Renewable Energy Technologies under the CDM. Climate Policy 10(1): 17-37.
Schmidt, J., Helme, N., Lee, J. and Houdashelt, M. 2007. Sector-based approach to the post-2012 climate. Climate Policy 8(5): 494-515.
Schneider, M., Schmidt, T., and Hoffmann, V.H. 2010. Performance of Renewable Energy Technologies under the CDM. Climate Policy 10(1): 17-37.
Stockmayer, M. 2007. Implications of the EU ETS on JI, download at: http://ji.unfccc.int/UserManagement/FileStorage/3D91UTJCERCWNH06P7YI5V1TWZS35B
Thomson Reuters Point Carbon. 2008. Carbon Project Manager: Carbon glossary. Thomson Reuters Point Carbon, Oslo.
Thomson Reuters Point Carbon. 2010. The EU ETS: Third time lucky?. Thomson Reuters Point Carbon, Oslo.
Thomson Reuters Point Carbon. 2011. Carbon Project Manager Database of CDM/JI Projects. Thomson Reuters Point Carbon, Oslo.
UNDP. 2003. The Clean Development Mechanism: A user’s guide. UNDP, Nairobi.
UNEP Riso Centre (URC). 2011. CDM pipeline. Edition 31 December 2010, Roskilde
UNFCCC. 2001. The Marrakesh Accords & the Marrakesh Declaration. UNFCCC, Bonn.
UNFCCC. 2010. Guidelines for demonstrating additionality of renewable energy projects =< 5 MW and energy efficiency projects with energy savings <= 20 GWh per year. UNFCCC, Bonn.
UNFCCC, 2011. Guidelines for demonstrating additionality of microscale project activities (version 02) . EB 60 Report . Annex 25. UNFCCC, Bonn.

University of Zurich, perspectives GmbH, Point Carbon Scoping Study “Linking RE Promotion Policies with International Carbon Trade” for IEA RETD
Page 54
Wehner, S., Krey, M., Gusmao, F., Hayashi, D., Michaelowa, A., and Sam, N. 2010. Supported NAMA design concept for energy-efficiency measures in the Mexican residential building sector. German Federal Ministry for the Environment, Nature Conservation and Nuclear Safety, Berlin.
Winkler, H.; Thorne, S. 2002. Baselines for suppressed demand: CDM projects contribution to poverty alleviation. South African Journal of Economic and Management Sciences 5: 413-429.
World Bank. 2009. 10 years of experience in carbon finance: Insights from working with carbon markets for development & global greenhouse gas mitigation. World Bank, Washington, D.C.
World Bank. 2010. State and trend of the carbon market 2010. World Bank, Washington, D.C.