Embed Size (px)
Citation preview
EXAMININGTHE IMPACT OF
FOODDESERTSON PUBLIC HEALTH
IN CHICAGO
FINDINGS
EXAMINING THE IMPACT OF FOOD DESERTS ON PUBLIC HEALTH IN CHICAGO
LaSalle Bank Corporation
135 South LaSalle Street
Suite 2325
Chicago, Illinois 60603
Robert S. Grossinger
Senior Vice President
Community & Sustainable Development
Dear Colleague:
LaSalle Bank is committed to building sustainable communities by providing
residents, small businesses and non-profit organizations with the resources and
assistance necessary to be healthy and vibrant members of the community.
With deep roots in the Chicago community, LaSalle Bank understands that many
of the city’s neighborhoods are challenged by limited access to healthy food. It has
been established that numerous areas of Chicago are considered “food deserts,”
neighborhoods with no or distant grocery stores but an abundance of fast food
restaurants and other retail outlets offering little or no nutritious food. Similarly,
public health officials and community advocates have been alarmed by statistics that
reflect the growing prevalence of obesity, diabetes, cancer, cardiovascular disease and
hypertension, particularly in these disadvantaged communities.
As rates of these and other chronic health problems continue to rise, researcher Mari
Gallagher proposed, and LaSalle Bank commissioned, a report to explore the health
consequences of food deserts. And, indeed, it appears that residents of food deserts
experience higher rates of certain diet-related health conditions.
We hope that the findings herein and discussion at the Stranded in the Food Desert
forum will reveal both the challenges and opportunities involved in providing equal
access to healthy food to affected neighborhoods – and that it will inspire new
understanding of this important community health issue, and action that begins to
bring solutions. Thank you to Mari Gallagher, Local Initiative Support Corporation
and the many organizations and individuals who contributed to this report.
Sincerely,
EXAMINING THE IMPACT OF FOOD DESERTS ON PUBLIC HEALTH IN CHICAGO
3
TABLE OF CONTENTSForeword 4
ExecutiveSummary 6
Methodology 11andDataDevelopment
Findings
QuantifyingFood 16 AccessPatterns
TheFoodBalanceScore 22
FoodBalanceand 23 CommunityHealth
SummaryofFindings 32
Author’sComments, 33ConclusionsandAcknowledgements
Bibliography 39
EXAMINING THE IMPACT OF FOOD DESERTS ON PUBLIC HEALTH IN CHICAGO
4
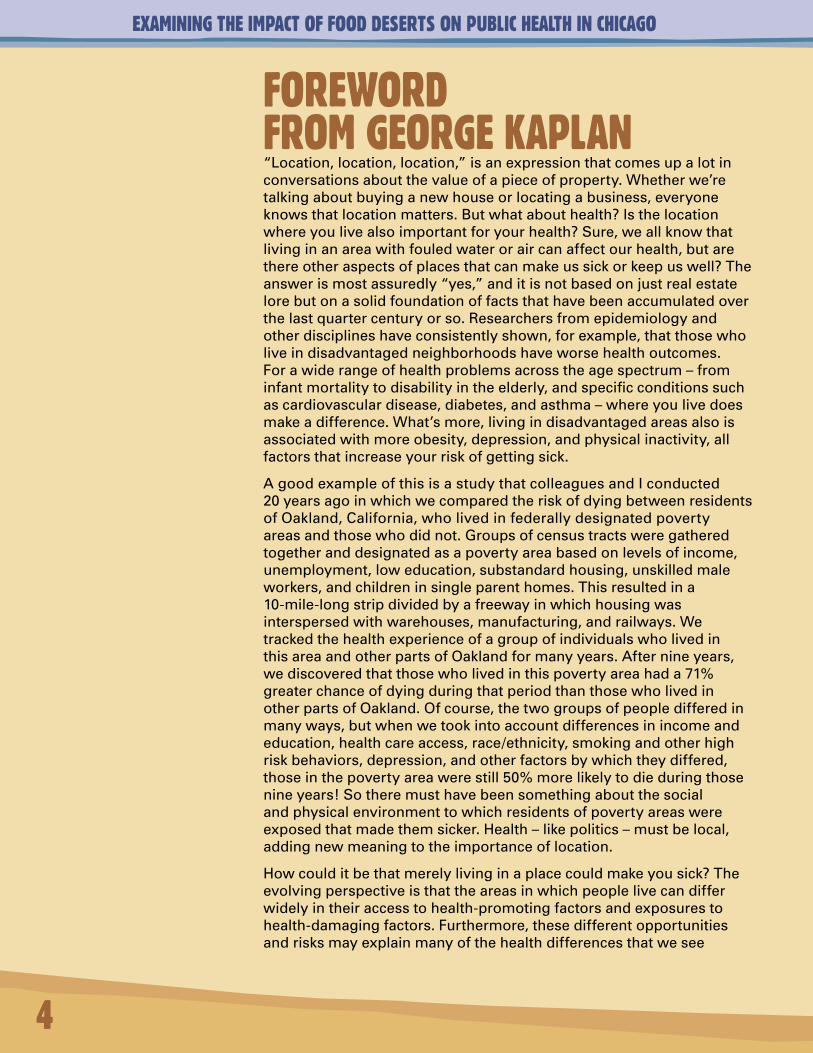
“Location,location,location,”isanexpressionthatcomesupalotinconversationsaboutthevalueofapieceofproperty.Whetherwe’retalkingaboutbuyinganewhouseorlocatingabusiness,everyoneknowsthatlocationmatters.Butwhatabouthealth?Isthelocationwhereyoulivealsoimportantforyourhealth?Sure,weallknowthatlivinginanareawithfouledwateroraircanaffectourhealth,butarethereotheraspectsofplacesthatcanmakeussickorkeepuswell?Theanswerismostassuredly“yes,”anditisnotbasedonjustrealestatelorebutonasolidfoundationoffactsthathavebeenaccumulatedoverthelastquartercenturyorso.Researchersfromepidemiologyandotherdisciplineshaveconsistentlyshown,forexample,thatthosewholiveindisadvantagedneighborhoodshaveworsehealthoutcomes.Forawiderangeofhealthproblemsacrosstheagespectrum–frominfantmortalitytodisabilityintheelderly,andspecificconditionssuchascardiovasculardisease,diabetes,andasthma–whereyoulivedoesmakeadifference.What’smore,livingindisadvantagedareasalsoisassociatedwithmoreobesity,depression,andphysicalinactivity,allfactorsthatincreaseyourriskofgettingsick.
AgoodexampleofthisisastudythatcolleaguesandIconducted20yearsagoinwhichwecomparedtheriskofdyingbetweenresidentsofOakland,California,wholivedinfederallydesignatedpovertyareasandthosewhodidnot.Groupsofcensustractsweregatheredtogetheranddesignatedasapovertyareabasedonlevelsofincome,unemployment,loweducation,substandardhousing,unskilledmaleworkers,andchildreninsingleparenthomes.Thisresultedina10-mile-longstripdividedbyafreewayinwhichhousingwasinterspersedwithwarehouses,manufacturing,andrailways.WetrackedthehealthexperienceofagroupofindividualswholivedinthisareaandotherpartsofOaklandformanyyears.Afternineyears,wediscoveredthatthosewholivedinthispovertyareahada71%greaterchanceofdyingduringthatperiodthanthosewholivedinotherpartsofOakland.Ofcourse,thetwogroupsofpeopledifferedinmanyways,butwhenwetookintoaccountdifferencesinincomeandeducation,healthcareaccess,race/ethnicity,smokingandotherhighriskbehaviors,depression,andotherfactorsbywhichtheydiffered,thoseinthepovertyareawerestill50%morelikelytodieduringthosenineyears!Sotheremusthavebeensomethingaboutthesocialandphysicalenvironmenttowhichresidentsofpovertyareaswereexposedthatmadethemsicker.Health–likepolitics–mustbelocal,addingnewmeaningtotheimportanceoflocation.
Howcoulditbethatmerelylivinginaplacecouldmakeyousick?Theevolvingperspectiveisthattheareasinwhichpeoplelivecandifferwidelyintheiraccesstohealth-promotingfactorsandexposurestohealth-damagingfactors.Furthermore,thesedifferentopportunitiesandrisksmayexplainmanyofthehealthdifferencesthatwesee
FOREWORD FROM GEORGE KAPLAN
EXAMINING THE IMPACT OF FOOD DESERTS ON PUBLIC HEALTH IN CHICAGO
5
betweenresidentsofdifferentplaces,aswellashealthdisparitiesbetweenracial,ethnicandsocioeconomicgroups.
Thisiswherethepresentreport,Examining the Impact of Food Deserts on Public Health in Chicago,makesarealcontribution.Bydemonstratingthatwhereyoulivemakesarealdifferencetowhereyoucanbuyfoodand,indirectly,thequalityofthatfood,thereportbeginstoexplainexactlyhowopportunitiesandrisksvarybyneighborhood.Butitdoesn’tstopthere.Italsoshowsimportantdifferencesbetweenneighborhoodsinthe“balance”ofgrocerystorestofastfoodoutlets.Thattherearelargedifferencesinthenutritionalchoicesavailablebetweengrocerystoresandfastfoodoutletsiswellknown,butwhatwasnotknownbeforethisreportisthatforsomeneighborhoodsthebalanceswingsfartothefastfoodside.Atfirstglance,wemightonlyguessthatthesedifferencesinfluencethehealthofthosewholiveintheneighborhoods.Thereportprovidesevidencethatsuggestsourguessesarecorrect.CleverlycombininginformationfromtheCityhealthdepartment,researchstudies,anddriver’slicenserecords,thereportillustratesthatbothaccesstomarketsandthebalanceofmarketstofastfoodoutletsareassociatedwithimportanthealthoutcomes.Thisconclusionappliesgenerallytoabroadswathofhealthoutcomes,rangingfrom“prematuremortality,”tocardiovasculardisease,diabetes,andcancerdeathstoobesityandhypertension,lendingsupporttotheoverallimportanceoftheargument.
Finally,awordonlanguageinthereport.Ifindtheuseoftheterm“fooddesert”particularlyinteresting.Adesertis,ofcourse,aplacedistinguishedbytheabsenceofvegetation,rain,etc.,whichisthesenseinwhichthewordisusedinthisreport.Fooddesertsaredefinedas“areaswithnoordistantgrocerystores.”Buttheword“desert”isalsoaverb–“toleavesomeonewithouthelporinadifficultsituationandnotcomeback.”Thisseemstometocaptureanimportantdimensionoffooddesertsnotconveyedbythenoun.Theverb“desert”focusesonactionandagency,emphasizingthatthelackofaccesstogoodfoodinsomeareasisnotanatural,accidentalphenomenonbutisinsteadtheresultofdecisionsmadeatmultiplelevelsbymultipleactors.Byfocusingonthislattermeaning,wecanfindroomforchangestobeeffected,fordifferentdecisionstobemadeinthefuture,formovementtowardactionsthatcanimproveaccesstohealthyfoodforthosewhohavebeendeserted.Indoingso,wecanhelpinatleastonewaytoimproveunevenopportunities,andperhapsprovidebetterhealthaswell.
GeorgeA.Kaplan,Ph.D.ThomasFrancisCollegiateProfessorofPublicHealthDepartmentofEpidemiologyUniversityofMichiganSchoolofPublicHealthandResearchProfessor,InstituteforSocialResearchDirector,CenterforSocialEpidemiologyandPopulationHealth
EXAMINING THE IMPACT OF FOOD DESERTS ON PUBLIC HEALTH IN CHICAGO
6
EXECUTIVE SUMMARYIn1923,longbeforetheriseofMcDonald’sgoldenarches,anadvertisementforbeefmadethisproclamationintheBridgeport Telegraph:
“Ninety percent of the diseases known to man are caused by cheap foodstuffs. You are what you eat.”
Thephrase“youarewhatyoueat”actuallydatesbacktothe17thCentury.Overtime,sciencehasrepeatedlydemonstratedthatnutritionalintakedirectlyaffectshealthoutcomes.Thatwearewhatweeatisamedicalfact.Buttowhatdegreedoeswhatweeatand,thus,ourhealth,dependonwhereweliveandthetypesoffoodwehaveaccessto?
Examining the Impact of Food Deserts on Public Health in Chicagoprobesthisveryquestion.Givenourfoundationalpremisethatthehealthandvitalityofurbancommunitiesisablock-by-blockphenomenon,ourfirsttaskistomeasurethedistancefromeveryCityofChicagoblocktothenearestgrocerystoreandfastfoodrestaurant.Next,wedevelopanempiricalscoretoquantifythebalanceoffoodchoiceavailabletoresidents.Finally,wecomparefoodaccessandfoodbalancedirectlytohealthoutcomes,holdingconstanteducation,income,andrace.Hereiswhatwefound:
• Residentsoffooddeserts–largegeographicareaswithnoordistantgrocerystores–facenutritionalchallengesevidentindiet-relatedcommunityhealthoutcomes.Thoseoutcomesworsenwhenthefooddeserthashighconcentrationsofnearbyfastfoodalternatives.WecallthistheFoodBalanceEffect.
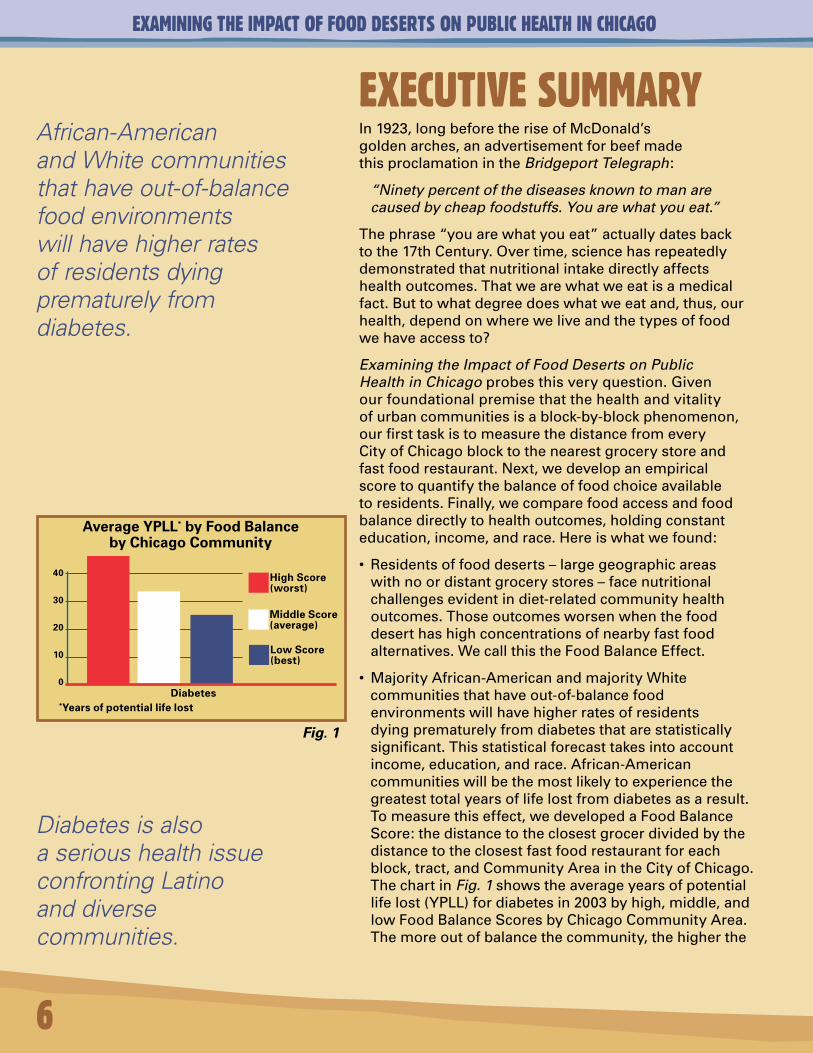
• MajorityAfrican-AmericanandmajorityWhitecommunitiesthathaveout-of-balancefoodenvironmentswillhavehigherratesofresidentsdyingprematurelyfromdiabetesthatarestatisticallysignificant.Thisstatisticalforecasttakesintoaccountincome,education,andrace.African-Americancommunitieswillbethemostlikelytoexperiencethegreatesttotalyearsoflifelostfromdiabetesasaresult.Tomeasurethiseffect,wedevelopedaFoodBalanceScore:thedistancetotheclosestgrocerdividedbythedistancetotheclosestfastfoodrestaurantforeachblock,tract,andCommunityAreaintheCityofChicago.ThechartinFig. 1showstheaverageyearsofpotentiallifelost(YPLL)fordiabetesin2003byhigh,middle,andlowFoodBalanceScoresbyChicagoCommunityArea.Themoreoutofbalancethecommunity,thehigherthe
African-American and White communities that have out-of-balance food environments will have higher rates of residents dying prematurely from diabetes.
Diabetes is also a serious health issue confronting Latino and diverse communities.
Average YPLL* by Food Balance by Chicago Community
Diabetes *Years of potential life lost
40
30
20
10
0
High Score (worst)
Middle Score (average)
Low Score (best)
Fig. 1
EXAMINING THE IMPACT OF FOOD DESERTS ON PUBLIC HEALTH IN CHICAGO
lifelosttodiabetes.DiabetesisalsoaserioushealthissueconfrontingLatinoanddiversecommunities.Ourstudysuggeststhatfoodaccessandgeographicfoodbalance,however,arenotthekeycontributorstothosepoorhealthoutcomes.
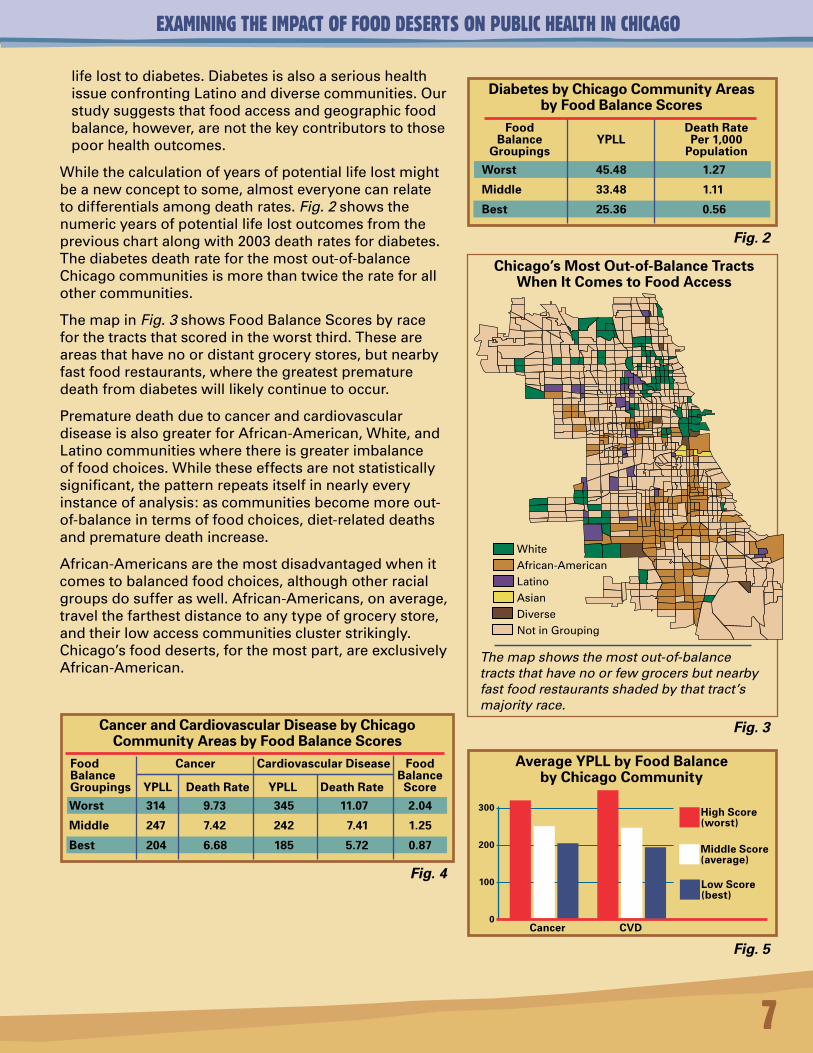
Whilethecalculationofyearsofpotentiallifelostmightbeanewconcepttosome,almosteveryonecanrelatetodifferentialsamongdeathrates. Fig. 2showsthenumericyearsofpotentiallifelostoutcomesfromthepreviouschartalongwith2003deathratesfordiabetes.Thediabetesdeathrateforthemostout-of-balanceChicagocommunitiesismorethantwicetherateforallothercommunities.
ThemapinFig. 3showsFoodBalanceScoresbyraceforthetractsthatscoredintheworstthird.Theseareareasthathavenoordistantgrocerystores,butnearbyfastfoodrestaurants,wherethegreatestprematuredeathfromdiabeteswilllikelycontinuetooccur.
PrematuredeathduetocancerandcardiovasculardiseaseisalsogreaterforAfrican-American,White,andLatinocommunitieswherethereisgreaterimbalanceoffoodchoices.Whiletheseeffectsarenotstatisticallysignificant,thepatternrepeatsitselfinnearlyeveryinstanceofanalysis:ascommunitiesbecomemoreout-of-balanceintermsoffoodchoices,diet-relateddeathsandprematuredeathincrease.
African-Americansarethemostdisadvantagedwhenitcomestobalancedfoodchoices,althoughotherracialgroupsdosufferaswell.African-Americans,onaverage,travelthefarthestdistancetoanytypeofgrocerystore,andtheirlowaccesscommunitiesclusterstrikingly.Chicago’sfooddeserts,forthemostpart,areexclusivelyAfrican-American.
Chicago’s Most Out-of-Balance Tracts When It Comes to Food Access
WhiteAfrican-AmericanLatinoAsianDiverse
NotinGrouping
The map shows the most out-of-balance tracts that have no or few grocers but nearby fast food restaurants shaded by that tract’s majority race.
Average YPLL by Food Balance by Chicago Community
Cancer CVD
300
200
100
0
High Score (worst)
Middle Score (average)
Low Score (best)
Cancer and Cardiovascular Disease by Chicago Community Areas by Food Balance Scores
Food Cancer Cardiovascular Disease FoodBalance BalanceGroupings YPLL Death Rate YPLL Death Rate Score
Worst 314 9.73 345 11.07 2.04
Middle 247 7.42 242 7.41 1.25
Best 204 6.68 185 5.72 0.87
Diabetes by Chicago Community Areas by Food Balance Scores
Food Death Rate Balance YPLL Per 1,000 Groupings Population
Worst 45.48 1.27
Middle 33.48 1.11
Best 25.36 0.56
Fig. 2
Fig. 3
Fig. 4
Fig. 5
7
EXAMINING THE IMPACT OF FOOD DESERTS ON PUBLIC HEALTH IN CHICAGO
8
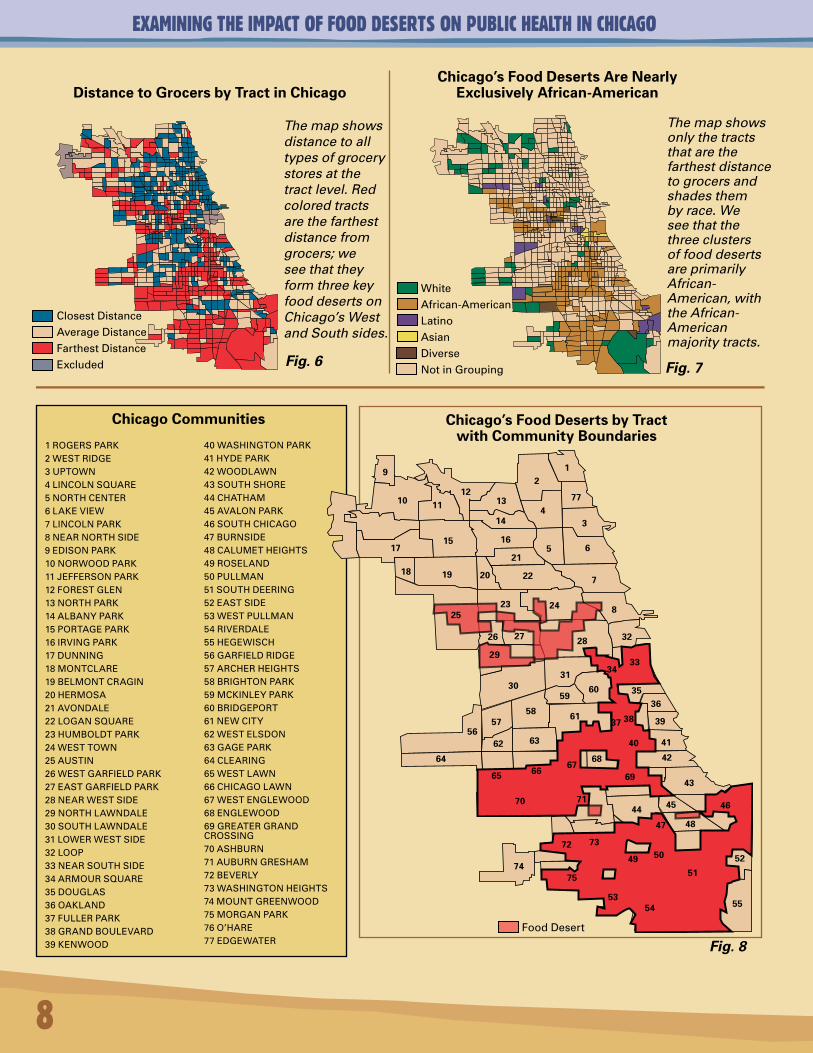
Distance to Grocers by Tract in Chicago
The map shows distance to all types of grocery stores at the tract level. Red colored tracts are the farthest distance from grocers; we see that they form three key food deserts on Chicago’s West and South sides.
Chicago’s Food Deserts Are Nearly Exclusively African-American
The map shows only the tracts that are the farthest distance to grocers and shades them by race. We see that the three clusters of food deserts are primarily African-American, with the African-American majority tracts.
1ROGERSPARK2WESTRIDGE3UPTOWN4LINCOLNSQUARE5NORTHCENTER6LAKEVIEW7LINCOLNPARK8NEARNORTHSIDE9EDISONPARK10NORWOODPARK11JEFFERSONPARK12FORESTGLEN13NORTHPARK14ALBANYPARK15PORTAGEPARK16IRVINGPARK17DUNNING18MONTCLARE19BELMONTCRAGIN20HERMOSA21AVONDALE22LOGANSQUARE23HUMBOLDTPARK24WESTTOWN25AUSTIN26WESTGARFIELDPARK27EASTGARFIELDPARK28NEARWESTSIDE29NORTHLAWNDALE30SOUTHLAWNDALE31LOWERWESTSIDE32LOOP33NEARSOUTHSIDE34ARMOURSQUARE35DOUGLAS36OAKLAND37FULLERPARK38GRANDBOULEVARD39KENWOOD
40WASHINGTONPARK41HYDEPARK42WOODLAWN43SOUTHSHORE44CHATHAM45AVALONPARK46SOUTHCHICAGO47BURNSIDE48CALUMETHEIGHTS49ROSELAND50PULLMAN51SOUTHDEERING52EASTSIDE53WESTPULLMAN54RIVERDALE55HEGEWISCH56GARFIELDRIDGE57ARCHERHEIGHTS58BRIGHTONPARK59MCKINLEYPARK60BRIDGEPORT61NEWCITY62WESTELSDON63GAGEPARK64CLEARING65WESTLAWN66CHICAGOLAWN67WESTENGLEWOOD68ENGLEWOOD69GREATERGRANDCROSSING70ASHBURN71AUBURNGRESHAM72BEVERLY73WASHINGTONHEIGHTS74MOUNTGREENWOOD75MORGANPARK76O’HARE77EDGEWATER
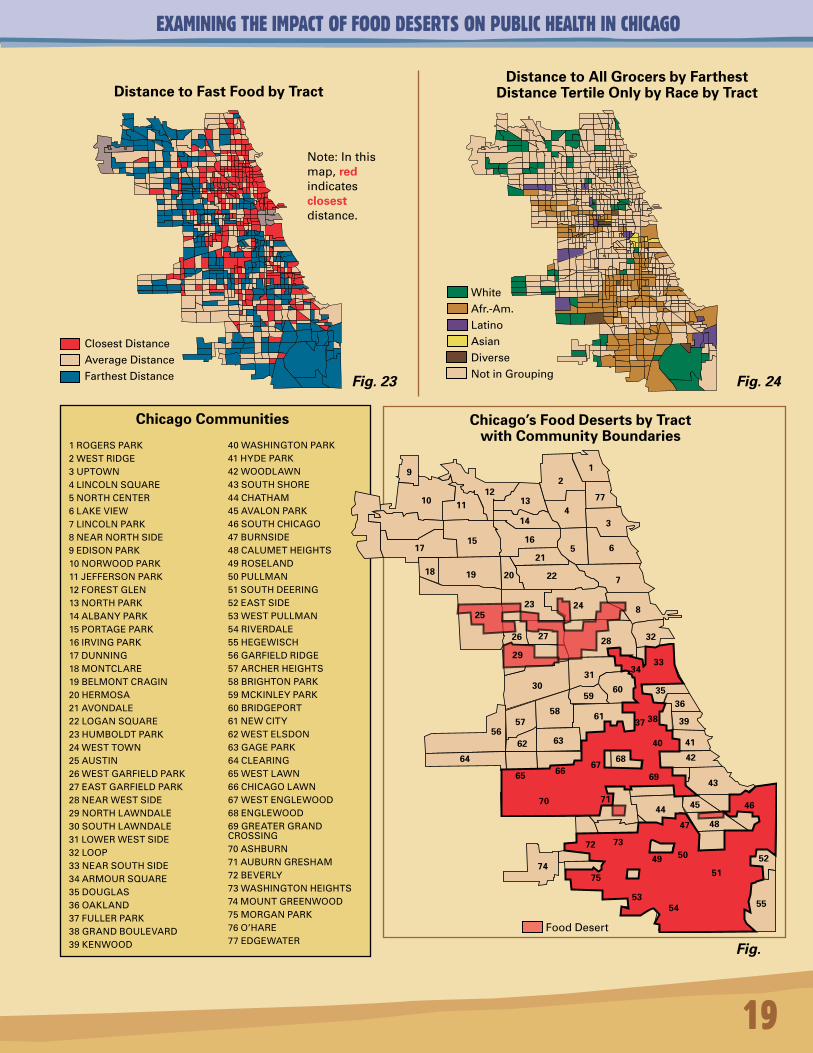
Chicago Communities Chicago’s Food Deserts by Tract with Community Boundaries
9
10 1112
13
21
477
314
1715 16
5 6
18 19 20
21
22 7
2523 24 8
26 27 28 32
3334
3031
56
64
57
62
65
63
58
5960 35
36
37 38 39
40 41
4266
67
61
68
6943
44 45 46
47 48
70 71
72 73
7475
49 50
51
53
52
54 55
WhiteAfrican-AmericanLatinoAsianDiverse
NotinGrouping
ClosestDistance
AverageDistance
FarthestDistanceExcluded
FoodDesert
Fig. 6 Fig. 7
Fig. 8
29
EXAMINING THE IMPACT OF FOOD DESERTS ON PUBLIC HEALTH IN CHICAGO
9
InatypicalAfrican-Americanblock,thenearestgrocerystoreisroughlytwiceasdistantasthenearestfastfoodrestaurant.Thismeansthat,forAfrican-Americans,itismucheasiertoaccessfastfoodthanothertypesoffood.Followingadoctor’sdietaryrecommendationislikelyverydifficultforthehalfmillionplusAfrican-Americanswholiveinthe287worstgrocery-store-accesstracts.
Foodbalanceisastatisticallysignificantcontributortoincreasedratesofbodymassindex(obesity),butwhenweconducttheanalysisseparatelybydistinctfoodvenues,weseethatdistancetoagrocerystorehasanevengreaterimpactonbodymassindex.Asgrocerystoreaccessdecreases,obesityincreases,holdingeducationandincomeconstant.Sinceobesitycanfueltheonsetofotherdiseasesandchronichealthconditions,thedevelopmentofgrocerystoresinunderservedareaslikelywouldcontributepositivelytocommunityhealthandwellnessofAfrican-Americansandothergroups.Conversely,livinginafooddesertcanmeangreaterratesofobesity,prematuredeath,andlowerqualityoflife,especiallyformothersandchildren.
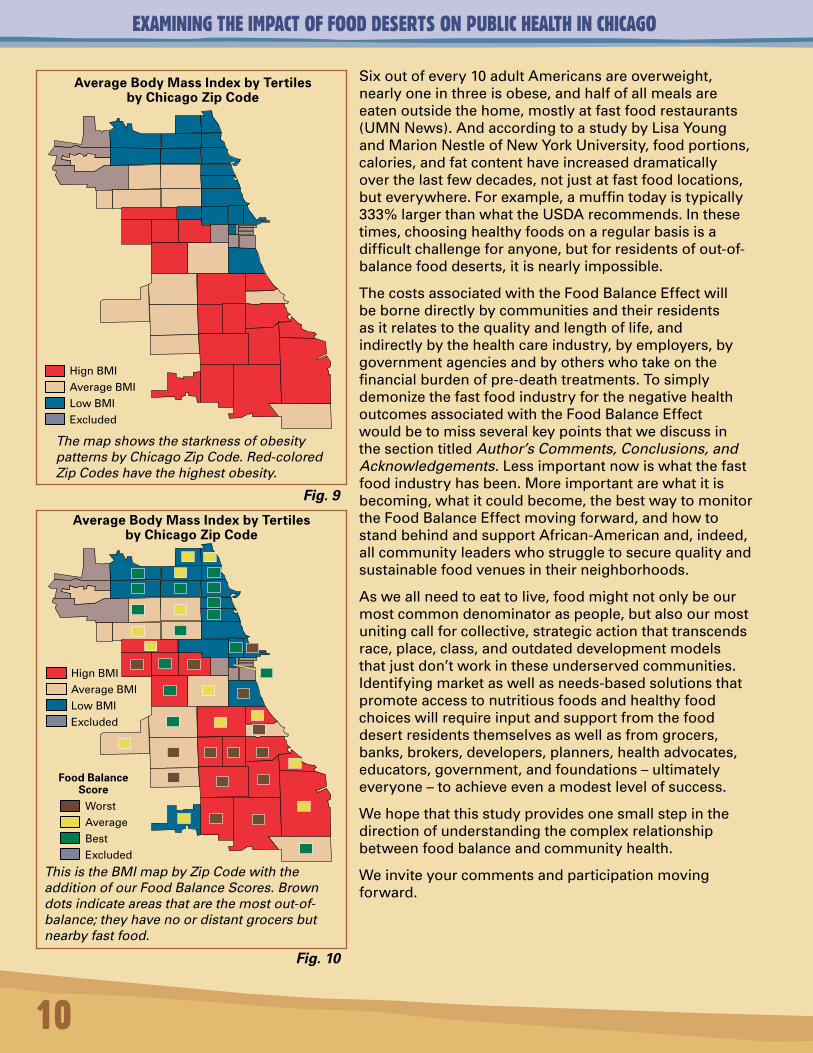
InChicago,bodymassindexpatternsclusterdramaticallybyraceandbyplace:theNorthandNorthwestsideshavethelowestratesofobesity,whiletheWestandSouthsideshavethehighestratesofobesity.Thedataisgroupedintoequaltertiles,notbyempiricaldefinitionsofobesityascalculatedbyBMI.
Allofthesefindingspointtooneconclusion:communitiesthathavenoordistantgrocerystores,orhaveanimbalanceofhealthyfoodoptions,willlikelyhaveincreasedprematuredeathandchronichealthconditions,holdingotherinfluencesconstant.Althoughwemustsetourfindingsinthecontextofthechallengesandlimitationsoflinkingcauseandeffectandofpredicting,withcertainty,theexactstatisticalmagnitudeoftherelationshipbetweenfoodaccessandhealth,itisclearthatfooddeserts,especiallythosewithanabundanceoffastfoodoptions,poseserioushealthandwellnesschallengestotheresidentswholivewithinthemandtotheCityofChicagoasawhole.
Thediet-relatedhealthoutcomesthatwefocuson–cancer,cardiovasculardisease,diabetes,obesity,andhypertension–stealtime,resources,vitality,andproductivity,andtheyreinforceeachother.AccordingtoarecentreportreleasedbytheCentersforDiseaseControlandPrevention,“obesitycanincreasetheriskof(adultonset)type2diabetesbyasmuchas34fold,anddiabetesisamajorriskfactorforamputations,blindness,kidneyfailure,andheartdisease.”ObesityaloneisestimatedtocosttheUnitedStateshealthcaresystem$100billionperyear(KoplanandFleming,2000).
Communities that have no or distant grocery stores, or have an imbalance of healthy food options, will likely have increased premature death and chronic health conditions.
EXAMINING THE IMPACT OF FOOD DESERTS ON PUBLIC HEALTH IN CHICAGO
10
Sixoutofevery10adultAmericansareoverweight,nearlyoneinthreeisobese,andhalfofallmealsareeatenoutsidethehome,mostlyatfastfoodrestaurants(UMNNews).AndaccordingtoastudybyLisaYoungandMarionNestleofNewYorkUniversity,foodportions,calories,andfatcontenthaveincreaseddramaticallyoverthelastfewdecades,notjustatfastfoodlocations,buteverywhere.Forexample,amuffintodayistypically333%largerthanwhattheUSDArecommends.Inthesetimes,choosinghealthyfoodsonaregularbasisisadifficultchallengeforanyone,butforresidentsofout-of-balancefooddeserts,itisnearlyimpossible.
ThecostsassociatedwiththeFoodBalanceEffectwillbebornedirectlybycommunitiesandtheirresidentsasitrelatestothequalityandlengthoflife,andindirectlybythehealthcareindustry,byemployers,bygovernmentagenciesandbyotherswhotakeonthefinancialburdenofpre-deathtreatments.TosimplydemonizethefastfoodindustryforthenegativehealthoutcomesassociatedwiththeFoodBalanceEffectwouldbetomissseveralkeypointsthatwediscussinthesectiontitledAuthor’s Comments, Conclusions, and Acknowledgements.Lessimportantnowiswhatthefastfoodindustryhasbeen.Moreimportantarewhatitisbecoming,whatitcouldbecome,thebestwaytomonitortheFoodBalanceEffectmovingforward,andhowtostandbehindandsupportAfrican-Americanand,indeed,allcommunityleaderswhostruggletosecurequalityandsustainablefoodvenuesintheirneighborhoods.
Asweallneedtoeattolive,foodmightnotonlybeourmostcommondenominatoraspeople,butalsoourmostunitingcallforcollective,strategicactionthattranscendsrace,place,class,andoutdateddevelopmentmodelsthatjustdon’tworkintheseunderservedcommunities.Identifyingmarketaswellasneeds-basedsolutionsthatpromoteaccesstonutritiousfoodsandhealthyfoodchoiceswillrequireinputandsupportfromthefooddesertresidentsthemselvesaswellasfromgrocers,banks,brokers,developers,planners,healthadvocates,educators,government,andfoundations–ultimatelyeveryone–toachieveevenamodestlevelofsuccess.
Wehopethatthisstudyprovidesonesmallstepinthedirectionofunderstandingthecomplexrelationshipbetweenfoodbalanceandcommunityhealth.
Weinviteyourcommentsandparticipationmovingforward.
Average Body Mass Index by Tertiles by Chicago Zip Code
The map shows the starkness of obesity patterns by Chicago Zip Code. Red-colored Zip Codes have the highest obesity.
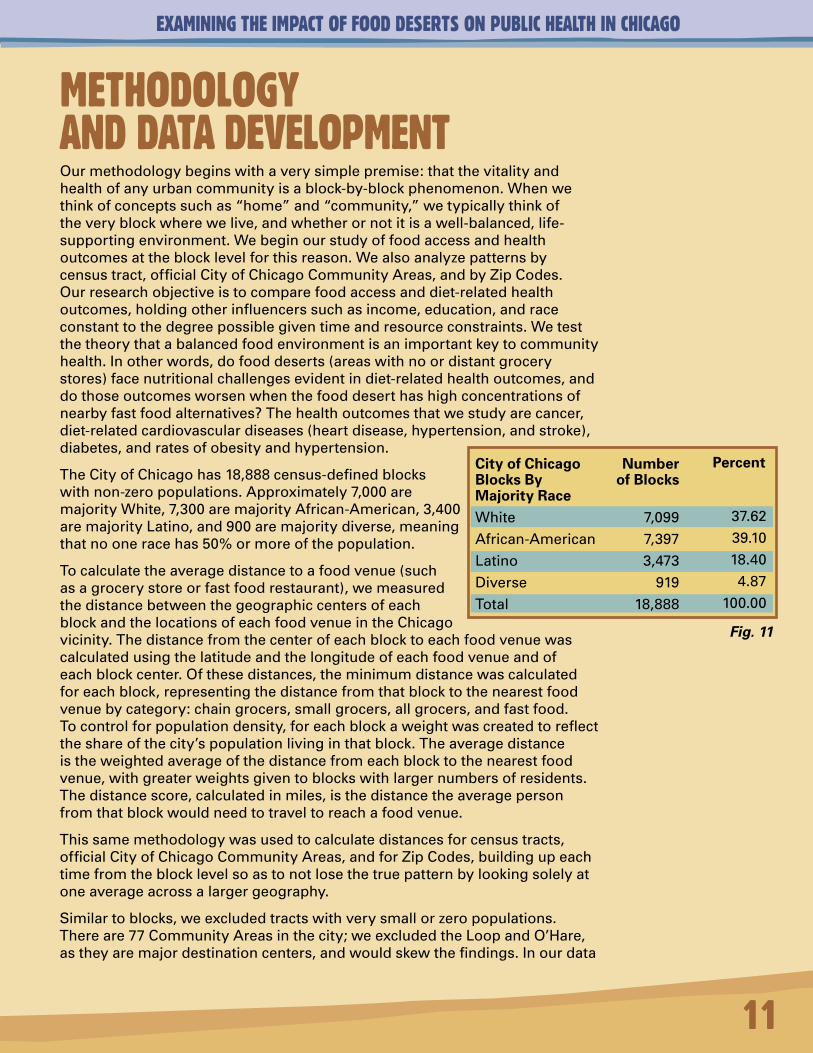
Average Body Mass Index by Tertiles by Chicago Zip Code
This is the BMI map by Zip Code with the addition of our Food Balance Scores. Brown dots indicate areas that are the most out-of-balance; they have no or distant grocers but nearby fast food.
HignBMI
AverageBMI
LowBMIExcluded
WorstAverageBestExcluded
Food Balance Score
HignBMI
AverageBMI
LowBMIExcluded
Fig. 9
Fig. 10
EXAMINING THE IMPACT OF FOOD DESERTS ON PUBLIC HEALTH IN CHICAGO
11
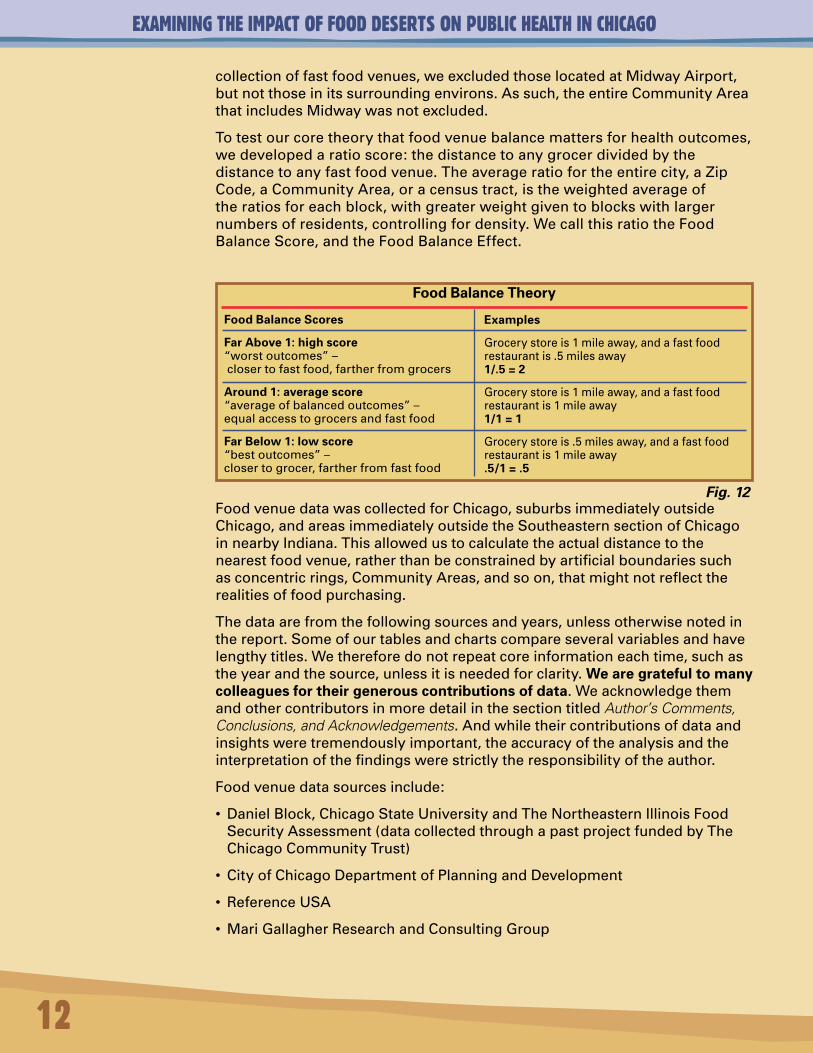
METHODOLOGY AND DATA DEVELOPMENTOurmethodologybeginswithaverysimplepremise:thatthevitalityandhealthofanyurbancommunityisablock-by-blockphenomenon.Whenwethinkofconceptssuchas“home”and“community,”wetypicallythinkoftheveryblockwherewelive,andwhetherornotitisawell-balanced,life-supportingenvironment.Webeginourstudyoffoodaccessandhealthoutcomesattheblocklevelforthisreason.Wealsoanalyzepatternsbycensustract,officialCityofChicagoCommunityAreas,andbyZipCodes.Ourresearchobjectiveistocomparefoodaccessanddiet-relatedhealthoutcomes,holdingotherinfluencerssuchasincome,education,andraceconstanttothedegreepossiblegiventimeandresourceconstraints.Wetestthetheorythatabalancedfoodenvironmentisanimportantkeytocommunityhealth.Inotherwords,dofooddeserts(areaswithnoordistantgrocerystores)facenutritionalchallengesevidentindiet-relatedhealthoutcomes,anddothoseoutcomesworsenwhenthefooddeserthashighconcentrationsofnearbyfastfoodalternatives?Thehealthoutcomesthatwestudyarecancer,diet-relatedcardiovasculardiseases(heartdisease,hypertension,andstroke),diabetes,andratesofobesityandhypertension.
TheCityofChicagohas18,888census-definedblockswithnon-zeropopulations.Approximately7,000aremajorityWhite,7,300aremajorityAfrican-American,3,400aremajorityLatino,and900aremajoritydiverse,meaningthatnooneracehas50%ormoreofthepopulation.
Tocalculatetheaveragedistancetoafoodvenue(suchasagrocerystoreorfastfoodrestaurant),wemeasuredthedistancebetweenthegeographiccentersofeachblockandthelocationsofeachfoodvenueintheChicagovicinity.Thedistancefromthecenterofeachblocktoeachfoodvenuewascalculatedusingthelatitudeandthelongitudeofeachfoodvenueandofeachblockcenter.Ofthesedistances,theminimumdistancewascalculatedforeachblock,representingthedistancefromthatblocktothenearestfoodvenuebycategory:chaingrocers,smallgrocers,allgrocers,andfastfood.Tocontrolforpopulationdensity,foreachblockaweightwascreatedtoreflecttheshareofthecity’spopulationlivinginthatblock.Theaveragedistanceistheweightedaverageofthedistancefromeachblocktothenearestfoodvenue,withgreaterweightsgiventoblockswithlargernumbersofresidents.Thedistancescore,calculatedinmiles,isthedistancetheaveragepersonfromthatblockwouldneedtotraveltoreachafoodvenue.
Thissamemethodologywasusedtocalculatedistancesforcensustracts,officialCityofChicagoCommunityAreas,andforZipCodes,buildingupeachtimefromtheblocklevelsoastonotlosethetruepatternbylookingsolelyatoneaverageacrossalargergeography.
Similartoblocks,weexcludedtractswithverysmallorzeropopulations.Thereare77CommunityAreasinthecity;weexcludedtheLoopandO’Hare,astheyaremajordestinationcenters,andwouldskewthefindings.Inourdata
City of Chicago Blocks By Majority RaceWhiteAfrican-AmericanLatinoDiverseTotal
Number of Blocks
7,0997,3973,473
91918,888
Percent
37.6239.1018.404.87
100.00
Fig. 11
EXAMINING THE IMPACT OF FOOD DESERTS ON PUBLIC HEALTH IN CHICAGO
12
collectionoffastfoodvenues,weexcludedthoselocatedatMidwayAirport,butnotthoseinitssurroundingenvirons.Assuch,theentireCommunityAreathatincludesMidwaywasnotexcluded.
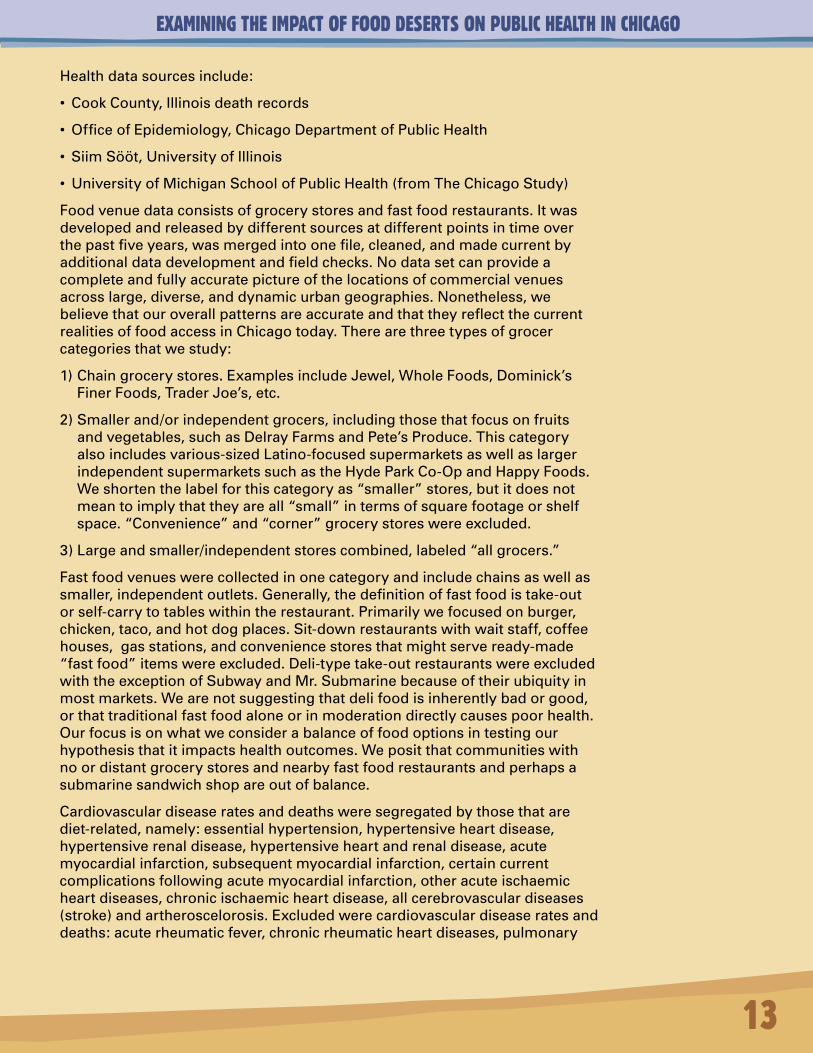
Totestourcoretheorythatfoodvenuebalancemattersforhealthoutcomes,wedevelopedaratioscore:thedistancetoanygrocerdividedbythedistancetoanyfastfoodvenue.Theaverageratiofortheentirecity,aZipCode,aCommunityArea,oracensustract,istheweightedaverageoftheratiosforeachblock,withgreaterweightgiventoblockswithlargernumbersofresidents,controllingfordensity.WecallthisratiotheFoodBalanceScore,andtheFoodBalanceEffect.
FoodvenuedatawascollectedforChicago,suburbsimmediatelyoutsideChicago,andareasimmediatelyoutsidetheSoutheasternsectionofChicagoinnearbyIndiana.Thisallowedustocalculatetheactualdistancetothenearestfoodvenue,ratherthanbeconstrainedbyartificialboundariessuchasconcentricrings,CommunityAreas,andsoon,thatmightnotreflecttherealitiesoffoodpurchasing.
Thedataarefromthefollowingsourcesandyears,unlessotherwisenotedinthereport.Someofourtablesandchartscompareseveralvariablesandhavelengthytitles.Wethereforedonotrepeatcoreinformationeachtime,suchastheyearandthesource,unlessitisneededforclarity.We are grateful to many colleagues for their generous contributions of data.WeacknowledgethemandothercontributorsinmoredetailinthesectiontitledAuthor’s Comments, Conclusions, and Acknowledgements.Andwhiletheircontributionsofdataandinsightsweretremendouslyimportant,theaccuracyoftheanalysisandtheinterpretationofthefindingswerestrictlytheresponsibilityoftheauthor.
Foodvenuedatasourcesinclude:
• DanielBlock,ChicagoStateUniversityandTheNortheasternIllinoisFoodSecurityAssessment(datacollectedthroughapastprojectfundedbyTheChicagoCommunityTrust)
• CityofChicagoDepartmentofPlanningandDevelopment
• ReferenceUSA
• MariGallagherResearchandConsultingGroup
Food Balance Theory
Food Balance Scores
Far Above 1: high score “worstoutcomes”–closertofastfood,fartherfromgrocers
Around 1: average score “averageofbalancedoutcomes”–equalaccesstogrocersandfastfood
Far Below 1: low score“bestoutcomes”–closertogrocer,fartherfromfastfood
Examples
Grocerystoreis1mileaway,andafastfoodrestaurantis.5milesaway1/.5 = 2
Grocerystoreis1mileaway,andafastfoodrestaurantis1mileaway1/1 = 1
Grocerystoreis.5milesaway,andafastfoodrestaurantis1mileaway.5/1 = .5
Fig. 12
EXAMINING THE IMPACT OF FOOD DESERTS ON PUBLIC HEALTH IN CHICAGO
13
Healthdatasourcesinclude:
• CookCounty,Illinoisdeathrecords
• OfficeofEpidemiology,ChicagoDepartmentofPublicHealth
• SiimSööt,UniversityofIllinois
• UniversityofMichiganSchoolofPublicHealth(fromTheChicagoStudy)
Foodvenuedataconsistsofgrocerystoresandfastfoodrestaurants.Itwasdevelopedandreleasedbydifferentsourcesatdifferentpointsintimeoverthepastfiveyears,wasmergedintoonefile,cleaned,andmadecurrentbyadditionaldatadevelopmentandfieldchecks.Nodatasetcanprovideacompleteandfullyaccuratepictureofthelocationsofcommercialvenuesacrosslarge,diverse,anddynamicurbangeographies.Nonetheless,webelievethatouroverallpatternsareaccurateandthattheyreflectthecurrentrealitiesoffoodaccessinChicagotoday.Therearethreetypesofgrocercategoriesthatwestudy:
1)Chaingrocerystores.ExamplesincludeJewel,WholeFoods,Dominick’sFinerFoods,TraderJoe’s,etc.
2)Smallerand/orindependentgrocers,includingthosethatfocusonfruitsandvegetables,suchasDelrayFarmsandPete’sProduce.Thiscategoryalsoincludesvarious-sizedLatino-focusedsupermarketsaswellaslargerindependentsupermarketssuchastheHydeParkCo-OpandHappyFoods.Weshortenthelabelforthiscategoryas“smaller”stores,butitdoesnotmeantoimplythattheyareall“small”intermsofsquarefootageorshelfspace.“Convenience”and“corner”grocerystoreswereexcluded.
3)Largeandsmaller/independentstorescombined,labeled“allgrocers.”
Fastfoodvenueswerecollectedinonecategoryandincludechainsaswellassmaller,independentoutlets.Generally,thedefinitionoffastfoodistake-outorself-carrytotableswithintherestaurant.Primarilywefocusedonburger,chicken,taco,andhotdogplaces.Sit-downrestaurantswithwaitstaff,coffeehouses,gasstations,andconveniencestoresthatmightserveready-made“fastfood”itemswereexcluded.Deli-typetake-outrestaurantswereexcludedwiththeexceptionofSubwayandMr.Submarinebecauseoftheirubiquityinmostmarkets.Wearenotsuggestingthatdelifoodisinherentlybadorgood,orthattraditionalfastfoodaloneorinmoderationdirectlycausespoorhealth.Ourfocusisonwhatweconsiderabalanceoffoodoptionsintestingourhypothesisthatitimpactshealthoutcomes.Wepositthatcommunitieswithnoordistantgrocerystoresandnearbyfastfoodrestaurantsandperhapsasubmarinesandwichshopareoutofbalance.
Cardiovasculardiseaseratesanddeathsweresegregatedbythosethatarediet-related,namely:essentialhypertension,hypertensiveheartdisease,hypertensiverenaldisease,hypertensiveheartandrenaldisease,acutemyocardialinfarction,subsequentmyocardialinfarction,certaincurrentcomplicationsfollowingacutemyocardialinfarction,otheracuteischaemicheartdiseases,chronicischaemicheartdisease,allcerebrovasculardiseases(stroke)andartheroscelorosis.Excludedwerecardiovasculardiseaseratesanddeaths:acuterheumaticfever,chronicrheumaticheartdiseases,pulmonary
EXAMINING THE IMPACT OF FOOD DESERTS ON PUBLIC HEALTH IN CHICAGO
14
heartdiseaseanddiseasesofpulmonarycirculationandotherformsofheartdiseasenotlinkedtodiet-relateddeaths,suchasonescausedbyviruses.
Wecalculateyearsofpotentiallifelost(YPLL)for2003forcancer,cardiovasculardisease,diabetes,andchronicliverdiseaseandcirrhosis,andfortotaldiet-relateddiseasesexcludingchronicliverdiseaseandcirrhosisforYPLLaggregationsbyCommunityArea.Forchronicliverdiseaseandcirrhosisweanalyzedfoodaccessimpactusinggrocer-to-fast-fooddistanceratioscoresthrougharegressionanalysis.Accesstoalcoholwouldalsobeausefulmeasure.Webeganthatanalysisthroughthelensofliquorlicensedata,butmoreworkneedstobedonetoisolateandunderstandpotentialimpactsfromthetypesofalcoholaccess.Alcoholispurchasedandconsumedinmanyvenues,includingsmallliquorstores,chaingrocerystores,pharmacies,andsit-downrestaurants.Ourfocusonalcoholaccesswasnotdeepenoughtodrawanyconclusions.
YPLLisastatisticthatmeasuresthetotalnumberoflifeyearslostduetoprematuredeathinapopulationfromacertaincause.Prematuredeathisusuallydefinedasdeathattheageoflessthan65or75years,orlessthantheaveragelifeexpectancy(McDonnell,1998,andwww.musc.edu/bmt737/Spr_1999/pj/ypll.html).
Inourcalculations,theYPLLrateisthetotalyearsoflifelostduetoaspecificdiseaseinpersonsunder65dividedbythepersonsinthatCommunityAreawhoareunder65.Eachdeathisweightedbasedonitsdistancefromage65.
2005driver’slicensedata,whichreportsheightandweight,wasusedtoconstructmeasuresofbodymassindex,whichisanacceptedmeasureforobesity.BMIcalculationswereattheZipCodelevel.ZipCodesinhighdestinationareas,namelytheLoopandO’Hare,wereexcludedsoasnottoskewthefindings.
WeuseregressionanalysistocomparefoodratioscoresandtheirimpactonYPLLandBMIoutcomes,holdingeducation,income,andraceconstant.
Werecognizethe“timefactor”challengeinstudyingfoodaccesstohealthoutcomes.Howmuchtimeneedstopassforthelackofnutritiousfoodaccesstohaveaneffectoncommunityhealth?Forexample,lackofadequatenutritioninchildhoodmightnotbeevidentuntillaterinlife.Oritcouldbeevidentinchildhoodobesitypatterns.Thisisnotachallengewecancontrolforinthisstudy,nordowespeculateonthetheoreticalpossibilitiesoftimefactorsonhealthimpacts.Weprimarilycompare2006foodaccesspatternsto2003CityofChicagodeathdata,2005ChicagoStudybytheUniversityofMichiganobesityandhypertensiondata,and2005driver’slicensesdatatoconstructbodymassindexscores,astheyarethemostcurrentdataavailabletous.Webelievethesearevalidcomparisons.Healthconditionsdonotdevelopovernight,nordonewgrocerystoresorfastfoodrestaurants.
Abiggerchallengeincorrelatingneighborhoodcharacteristicsandhealthisthatneighborhoodeffectsare,bydefinition,endogenoustothecompositionalcharacteristicsofneighborhoods.Theprojectrecognizesthemanycomplexmethodologicalchallengesinisolatingcauseandeffectandholdingconstantpotentialstatisticalconfounders,suchasincome,race,genetics,culture,foodpreferences,andself-selectionintospecifictypesofcommunities.Weutilize
EXAMINING THE IMPACT OF FOOD DESERTS ON PUBLIC HEALTH IN CHICAGO
15
nationalandlocalbestmethodologicalpractices,takingdeliberatemeasurestomaximizetherobustnessandaccuracyofourdataandmodels,andexercisecautionandcareinstatingourfindings.Weareparticularlymindfulofwhathasbeencalledthe“EcologicalFallacy.”
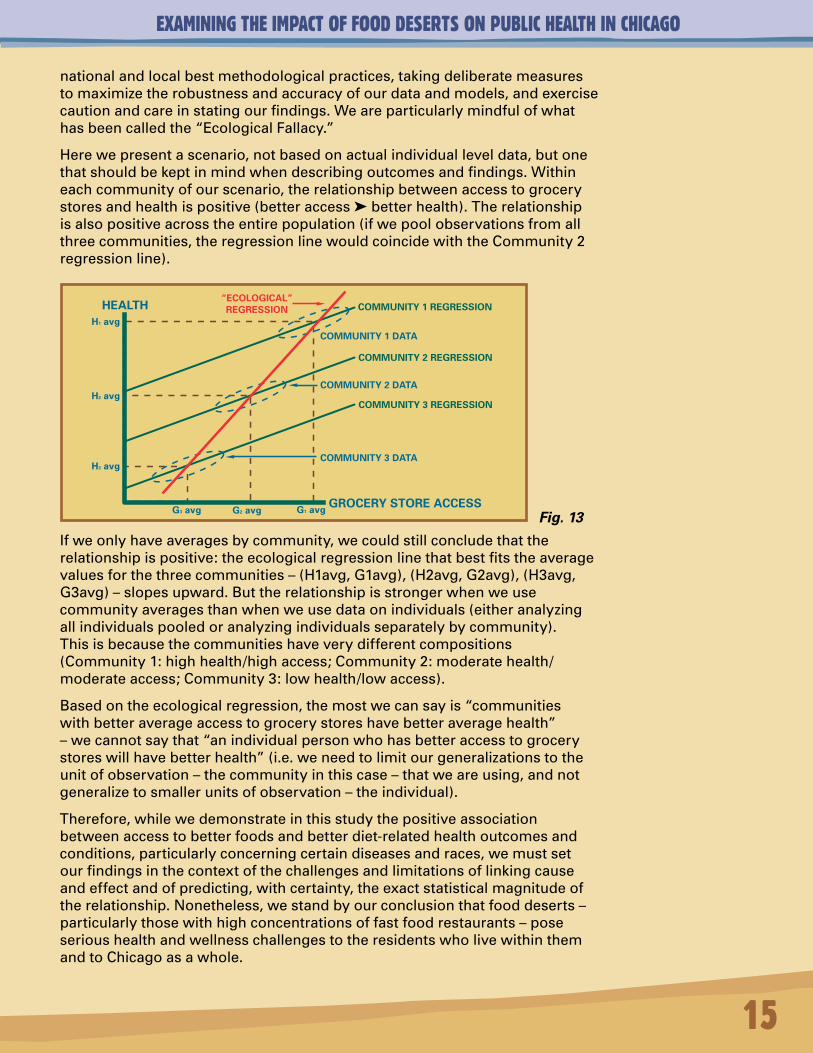
Herewepresentascenario,notbasedonactualindividualleveldata,butonethatshouldbekeptinmindwhendescribingoutcomesandfindings.Withineachcommunityofourscenario,therelationshipbetweenaccesstogrocerystoresandhealthispositive(betteraccessbetterhealth).Therelationshipisalsopositiveacrosstheentirepopulation(ifwepoolobservationsfromallthreecommunities,theregressionlinewouldcoincidewiththeCommunity2regressionline).
Ifweonlyhaveaveragesbycommunity,wecouldstillconcludethattherelationshipispositive:theecologicalregressionlinethatbestfitstheaveragevaluesforthethreecommunities–(H1avg,G1avg),(H2avg,G2avg),(H3avg,G3avg)–slopesupward.Buttherelationshipisstrongerwhenweusecommunityaveragesthanwhenweusedataonindividuals(eitheranalyzingallindividualspooledoranalyzingindividualsseparatelybycommunity).Thisisbecausethecommunitieshaveverydifferentcompositions(Community1:highhealth/highaccess;Community2:moderatehealth/moderateaccess;Community3:lowhealth/lowaccess).
Basedontheecologicalregression,themostwecansayis“communitieswithbetteraverageaccesstogrocerystoreshavebetteraveragehealth”–wecannotsaythat“anindividualpersonwhohasbetteraccesstogrocerystoreswillhavebetterhealth”(i.e.weneedtolimitourgeneralizationstotheunitofobservation–thecommunityinthiscase–thatweareusing,andnotgeneralizetosmallerunitsofobservation–theindividual).
Therefore,whilewedemonstrateinthisstudythepositiveassociationbetweenaccesstobetterfoodsandbetterdiet-relatedhealthoutcomesandconditions,particularlyconcerningcertaindiseasesandraces,wemustsetourfindingsinthecontextofthechallengesandlimitationsoflinkingcauseandeffectandofpredicting,withcertainty,theexactstatisticalmagnitudeoftherelationship.Nonetheless,westandbyourconclusionthatfooddeserts–particularlythosewithhighconcentrationsoffastfoodrestaurants–poseserioushealthandwellnesschallengestotheresidentswholivewithinthemandtoChicagoasawhole.
COMMUNITY 1 REGRESSION
COMMUNITY 2 REGRESSION
COMMUNITY 3 REGRESSION
H3 avg
H2 avg
H1 avg
HEALTH
GROCERY STORE ACCESSG3 avg G2 avg G1 avg
COMMUNITY 1 DATA
COMMUNITY 2 DATA
COMMUNITY 3 DATA
“ECOLOGICAL”REGRESSION
Fig. 13
EXAMINING THE IMPACT OF FOOD DESERTS ON PUBLIC HEALTH IN CHICAGO
16
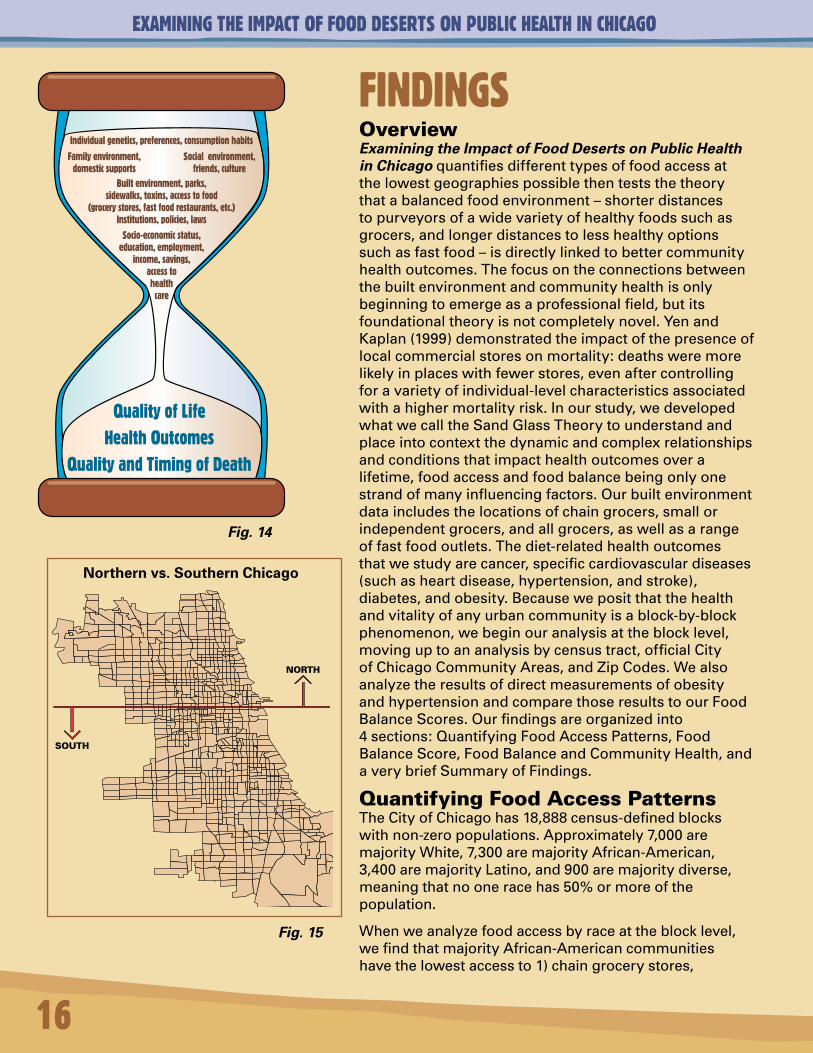
FINDINGSOverviewExamining the Impact of Food Deserts on Public Health in Chicago quantifiesdifferenttypesoffoodaccessatthelowestgeographiespossiblethenteststhetheorythatabalancedfoodenvironment–shorterdistancestopurveyorsofawidevarietyofhealthyfoodssuchasgrocers,andlongerdistancestolesshealthyoptionssuchasfastfood–isdirectlylinkedtobettercommunityhealthoutcomes.Thefocusontheconnectionsbetweenthebuiltenvironmentandcommunityhealthisonlybeginningtoemergeasaprofessionalfield,butitsfoundationaltheoryisnotcompletelynovel.YenandKaplan(1999)demonstratedtheimpactofthepresenceoflocalcommercialstoresonmortality:deathsweremorelikelyinplaceswithfewerstores,evenaftercontrollingforavarietyofindividual-levelcharacteristicsassociatedwithahighermortalityrisk.Inourstudy,wedevelopedwhatwecalltheSandGlassTheorytounderstandandplaceintocontextthedynamicandcomplexrelationshipsandconditionsthatimpacthealthoutcomesoveralifetime,foodaccessandfoodbalancebeingonlyonestrandofmanyinfluencingfactors.Ourbuiltenvironmentdataincludesthelocationsofchaingrocers,smallorindependentgrocers,andallgrocers,aswellasarangeoffastfoodoutlets.Thediet-relatedhealthoutcomesthatwestudyarecancer,specificcardiovasculardiseases(suchasheartdisease,hypertension,andstroke),diabetes,andobesity.Becausewepositthatthehealthandvitalityofanyurbancommunityisablock-by-blockphenomenon,webeginouranalysisattheblocklevel,movinguptoananalysisbycensustract,officialCityofChicagoCommunityAreas,andZipCodes.WealsoanalyzetheresultsofdirectmeasurementsofobesityandhypertensionandcomparethoseresultstoourFoodBalanceScores.Ourfindingsareorganizedinto4sections:QuantifyingFoodAccessPatterns,FoodBalanceScore,FoodBalanceandCommunityHealth,andaverybriefSummaryofFindings.
QuantifyingFoodAccessPatternsTheCityofChicagohas18,888census-definedblockswithnon-zeropopulations.Approximately7,000aremajorityWhite,7,300aremajorityAfrican-American,3,400aremajorityLatino,and900aremajoritydiverse,meaningthatnooneracehas50%ormoreofthepopulation.
Whenweanalyzefoodaccessbyraceattheblocklevel,wefindthatmajorityAfrican-Americancommunitieshavethelowestaccessto1)chaingrocerystores,
Fig. 14
Fig. 15
Northern vs. Southern Chicago
EXAMINING THE IMPACT OF FOOD DESERTS ON PUBLIC HEALTH IN CHICAGO
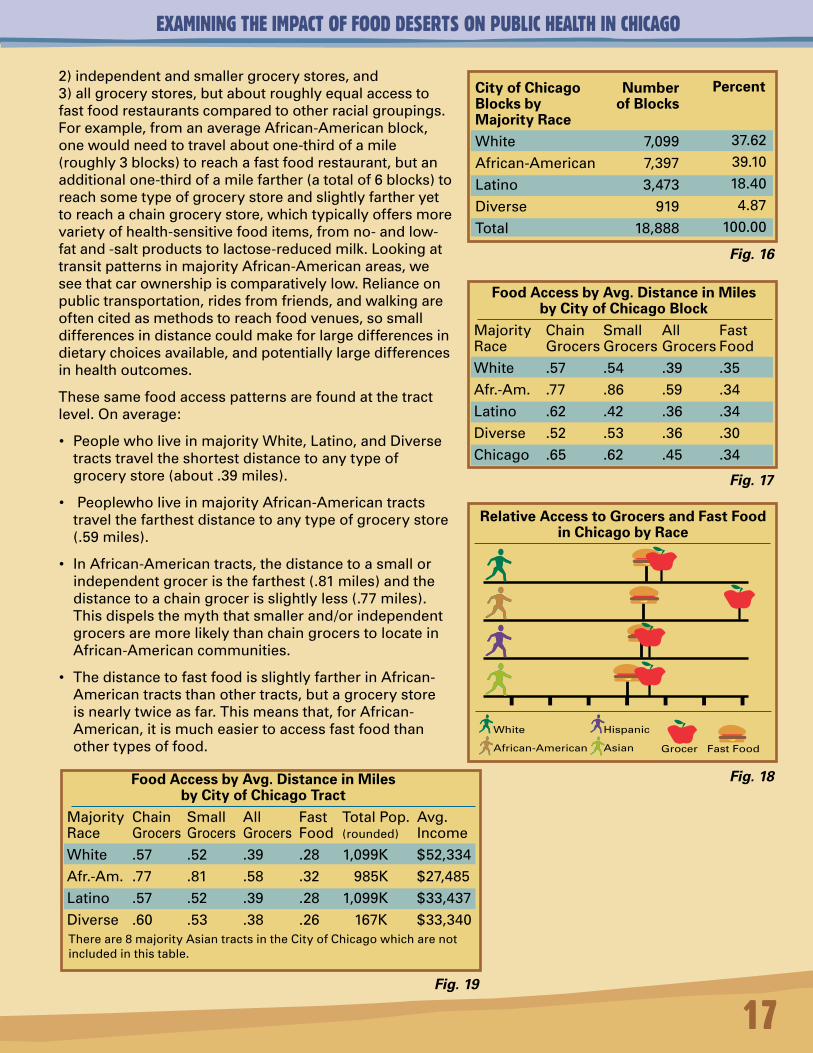
2)independentandsmallergrocerystores,and3)allgrocerystores,butaboutroughlyequalaccesstofastfoodrestaurantscomparedtootherracialgroupings.Forexample,fromanaverageAfrican-Americanblock,onewouldneedtotravelaboutone-thirdofamile(roughly3blocks)toreachafastfoodrestaurant,butanadditionalone-thirdofamilefarther(atotalof6blocks)toreachsometypeofgrocerystoreandslightlyfartheryettoreachachaingrocerystore,whichtypicallyoffersmorevarietyofhealth-sensitivefooditems,fromno-andlow-fatand-saltproductstolactose-reducedmilk.LookingattransitpatternsinmajorityAfrican-Americanareas,weseethatcarownershipiscomparativelylow.Relianceonpublictransportation,ridesfromfriends,andwalkingareoftencitedasmethodstoreachfoodvenues,sosmalldifferencesindistancecouldmakeforlargedifferencesindietarychoicesavailable,andpotentiallylargedifferencesinhealthoutcomes.
Thesesamefoodaccesspatternsarefoundatthetractlevel.Onaverage:
• PeoplewholiveinmajorityWhite,Latino,andDiversetractstraveltheshortestdistancetoanytypeofgrocerystore(about.39miles).
• PeoplewholiveinmajorityAfrican-Americantractstravelthefarthestdistancetoanytypeofgrocerystore(.59miles).
• InAfrican-Americantracts,thedistancetoasmallorindependentgroceristhefarthest(.81miles)andthedistancetoachaingrocerisslightlyless(.77miles).Thisdispelsthemyththatsmallerand/orindependentgrocersaremorelikelythanchaingrocerstolocateinAfrican-Americancommunities.
• ThedistancetofastfoodisslightlyfartherinAfrican-Americantractsthanothertracts,butagrocerystoreisnearlytwiceasfar.Thismeansthat,forAfrican-American,itismucheasiertoaccessfastfoodthanothertypesoffood.
White
African-American
Hispanic
Asian Grocer Fast Food
17
City of Chicago Blocks by Majority RaceWhiteAfrican-AmericanLatinoDiverseTotal
Number of Blocks
7,0997,3973,473
91918,888
Percent
37.6239.1018.404.87
100.00
MajorityRaceWhiteAfr.-Am.LatinoDiverseChicago
ChainGrocers.57.77.62.52.65
SmallGrocers.54.86.42.53.62
AllGrocers.39.59.36.36.45
FastFood.35.34.34.30.34
Food Access by Avg. Distance in Miles by City of Chicago Block
Fig. 16
Fig. 17
Fig. 18
MajorityRaceWhiteAfr.-Am.LatinoDiverse
ChainGrocers.57.77.57.60
SmallGrocers.52.81.52.53
AllGrocers.39.58.39.38
FastFood.28.32.28.26
Food Access by Avg. Distance in Miles by City of Chicago Tract
TotalPop.(rounded)
1,099K
985K1,099K
167K
Avg.Income$52,334$27,485$33,437
$33,340
Fig. 19
Relative Access to Grocers and Fast Food in Chicago by Race
Thereare8majorityAsiantractsintheCityofChicagowhicharenotincludedinthistable.
EXAMINING THE IMPACT OF FOOD DESERTS ON PUBLIC HEALTH IN CHICAGO
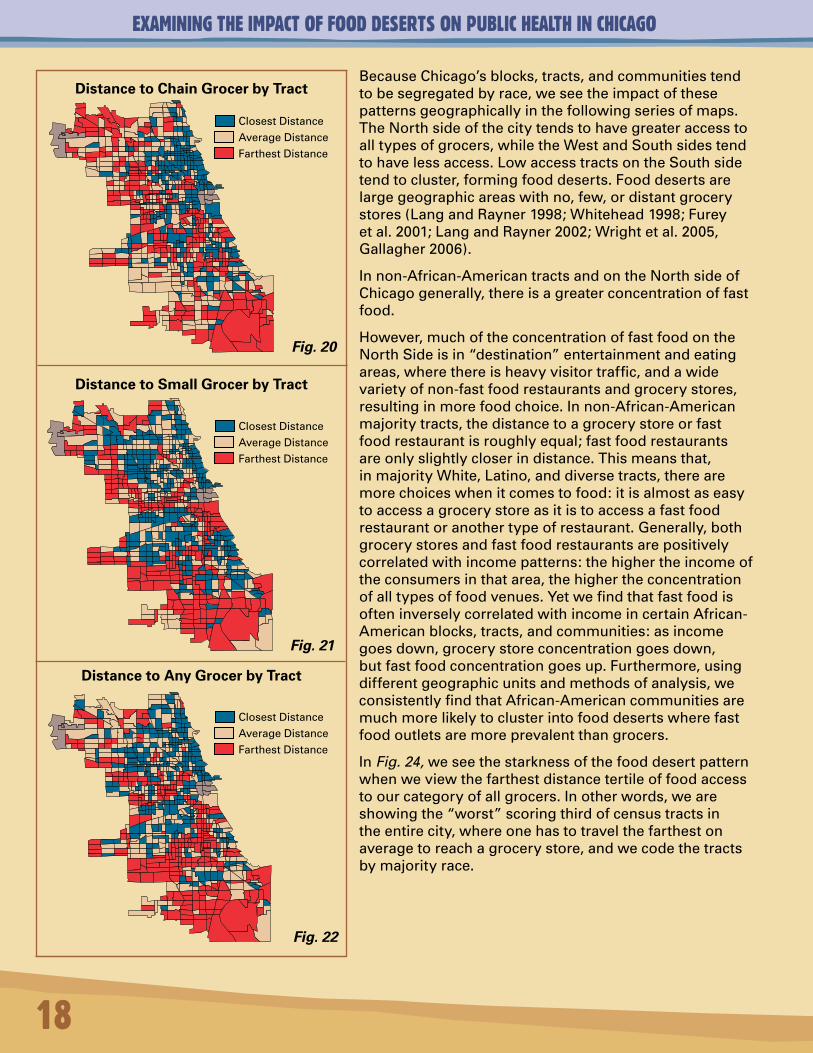
BecauseChicago’sblocks,tracts,andcommunitiestendtobesegregatedbyrace,weseetheimpactofthesepatternsgeographicallyinthefollowingseriesofmaps.TheNorthsideofthecitytendstohavegreateraccesstoalltypesofgrocers,whiletheWestandSouthsidestendtohavelessaccess.LowaccesstractsontheSouthsidetendtocluster,formingfooddeserts.Fooddesertsarelargegeographicareaswithno,few,ordistantgrocerystores(LangandRayner1998;Whitehead1998;Fureyetal.2001;LangandRayner2002;Wrightetal.2005,Gallagher2006).
Innon-African-AmericantractsandontheNorthsideofChicagogenerally,thereisagreaterconcentrationoffastfood.
However,muchoftheconcentrationoffastfoodontheNorthSideisin“destination”entertainmentandeatingareas,wherethereisheavyvisitortraffic,andawidevarietyofnon-fastfoodrestaurantsandgrocerystores,resultinginmorefoodchoice.Innon-African-Americanmajoritytracts,thedistancetoagrocerystoreorfastfoodrestaurantisroughlyequal;fastfoodrestaurantsareonlyslightlycloserindistance.Thismeansthat,inmajorityWhite,Latino,anddiversetracts,therearemorechoiceswhenitcomestofood:itisalmostaseasytoaccessagrocerystoreasitistoaccessafastfoodrestaurantoranothertypeofrestaurant.Generally,bothgrocerystoresandfastfoodrestaurantsarepositivelycorrelatedwithincomepatterns:thehighertheincomeoftheconsumersinthatarea,thehighertheconcentrationofalltypesoffoodvenues.YetwefindthatfastfoodisofteninverselycorrelatedwithincomeincertainAfrican-Americanblocks,tracts,andcommunities:asincomegoesdown,grocerystoreconcentrationgoesdown,butfastfoodconcentrationgoesup.Furthermore,usingdifferentgeographicunitsandmethodsofanalysis,weconsistentlyfindthatAfrican-Americancommunitiesaremuchmorelikelytoclusterintofooddesertswherefastfoodoutletsaremoreprevalentthangrocers.
InFig. 24, weseethestarknessofthefooddesertpatternwhenweviewthefarthestdistancetertileoffoodaccesstoourcategoryofallgrocers.Inotherwords,weareshowingthe“worst”scoringthirdofcensustractsintheentirecity,whereonehastotravelthefarthestonaveragetoreachagrocerystore,andwecodethetractsbymajorityrace.
Distance to Chain Grocer by Tract
Distance to Small Grocer by Tract
Distance to Any Grocer by Tract
18
Fig. 20
Fig. 21
Fig. 22
ClosestDistance
AverageDistance
FarthestDistance
ClosestDistance
AverageDistance
FarthestDistance
ClosestDistance
AverageDistance
FarthestDistance
EXAMINING THE IMPACT OF FOOD DESERTS ON PUBLIC HEALTH IN CHICAGO
Distance to All Grocers by Farthest Distance Tertile Only by Race by Tract
1ROGERSPARK2WESTRIDGE3UPTOWN4LINCOLNSQUARE5NORTHCENTER6LAKEVIEW7LINCOLNPARK8NEARNORTHSIDE9EDISONPARK10NORWOODPARK11JEFFERSONPARK12FORESTGLEN13NORTHPARK14ALBANYPARK15PORTAGEPARK16IRVINGPARK17DUNNING18MONTCLARE19BELMONTCRAGIN20HERMOSA21AVONDALE22LOGANSQUARE23HUMBOLDTPARK24WESTTOWN25AUSTIN26WESTGARFIELDPARK27EASTGARFIELDPARK28NEARWESTSIDE29NORTHLAWNDALE30SOUTHLAWNDALE31LOWERWESTSIDE32LOOP33NEARSOUTHSIDE34ARMOURSQUARE35DOUGLAS36OAKLAND37FULLERPARK38GRANDBOULEVARD39KENWOOD
40WASHINGTONPARK41HYDEPARK42WOODLAWN43SOUTHSHORE44CHATHAM45AVALONPARK46SOUTHCHICAGO47BURNSIDE48CALUMETHEIGHTS49ROSELAND50PULLMAN51SOUTHDEERING52EASTSIDE53WESTPULLMAN54RIVERDALE55HEGEWISCH56GARFIELDRIDGE57ARCHERHEIGHTS58BRIGHTONPARK59MCKINLEYPARK60BRIDGEPORT61NEWCITY62WESTELSDON63GAGEPARK64CLEARING65WESTLAWN66CHICAGOLAWN67WESTENGLEWOOD68ENGLEWOOD69GREATERGRANDCROSSING70ASHBURN71AUBURNGRESHAM72BEVERLY73WASHINGTONHEIGHTS74MOUNTGREENWOOD75MORGANPARK76O’HARE77EDGEWATER
Chicago Communities Chicago’s Food Deserts by Tract with Community Boundaries
9
10 1112
13
21
477
314
1715 16
5 6
18 19 20
21
22 7
2523 24 8
26 27 28 32
3334
3031
56
64
57
62
65
63
58
5960 35
36
37 38 39
40 41
4266
67
61
68
6943
44 45 46
47 48
70 71
72 73
7475
49 50
51
53
52
54 55
FoodDesert
Fig.
19
Distance to Fast Food by Tract
Fig. 23 Fig. 24
ClosestDistance
AverageDistance
FarthestDistance
WhiteAfr.-Am.LatinoAsianDiverse
NotinGrouping
29
Note: In this map, red indicates closest distance.
EXAMINING THE IMPACT OF FOOD DESERTS ON PUBLIC HEALTH IN CHICAGO
20
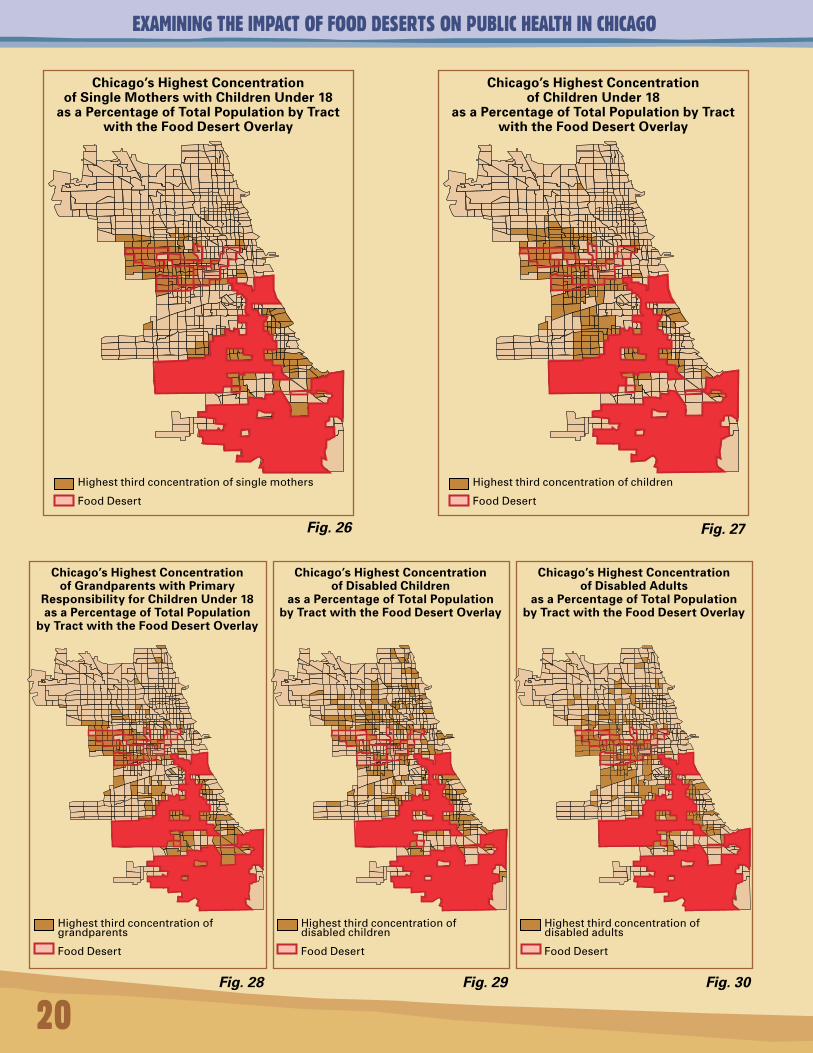
Chicago’s Highest Concentration of Single Mothers with Children Under 18
as a Percentage of Total Population by Tractwith the Food Desert Overlay
Highestthirdconcentrationofsinglemothers
FoodDesert
Chicago’s Highest Concentration of Grandparents with Primary
Responsibility for Children Under 18 as a Percentage of Total Population
by Tract with the Food Desert Overlay
Highestthirdconcentrationofgrandparents
FoodDesert
Chicago’s Highest Concentration of Children Under 18
as a Percentage of Total Population by Tractwith the Food Desert Overlay
Highestthirdconcentrationofchildren
FoodDesert
Chicago’s Highest Concentration of Disabled Adults
as a Percentage of Total Population by Tract with the Food Desert Overlay
Highestthirdconcentrationofdisabledadults
FoodDesert
Chicago’s Highest Concentration of Disabled Children
as a Percentage of Total Population by Tract with the Food Desert Overlay
Highestthirdconcentrationofdisabledchildren
FoodDesert
Fig. 26 Fig. 27
Fig. 28 Fig. 29 Fig. 30
EXAMINING THE IMPACT OF FOOD DESERTS ON PUBLIC HEALTH IN CHICAGO
WecaneasilyseethatAfrican-Americantractsdominatethefooddesertmapandthattheyclusterdramatically.Themostvulnerablepopulationsaresinglemothersandchildren.Wealsoseeconcentrationsofgrandparentswithprimaryresponsibilityforgrandchildrenunder18yearsofage,andfordisabledpopulations.WhiledisabledchildrenaremoredisbursedthroughoutChicago,asthosechildrenage,andasadultsbecomedisabled,weseeagreaterconcentrationofthatpopulationinthefooddesert.
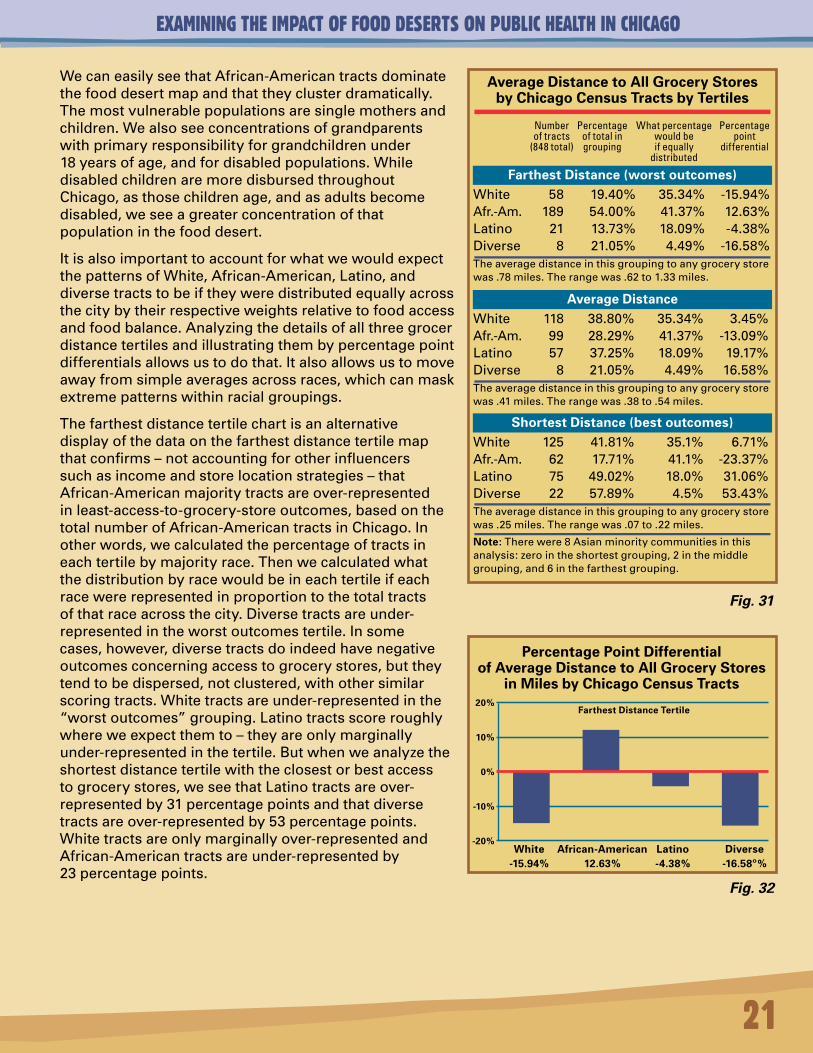
ItisalsoimportanttoaccountforwhatwewouldexpectthepatternsofWhite,African-American,Latino,anddiversetractstobeiftheyweredistributedequallyacrossthecitybytheirrespectiveweightsrelativetofoodaccessandfoodbalance.Analyzingthedetailsofallthreegrocerdistancetertilesandillustratingthembypercentagepointdifferentialsallowsustodothat.Italsoallowsustomoveawayfromsimpleaveragesacrossraces,whichcanmaskextremepatternswithinracialgroupings.
Thefarthestdistancetertilechartisanalternativedisplayofthedataonthefarthestdistancetertilemapthatconfirms–notaccountingforotherinfluencerssuchasincomeandstorelocationstrategies–thatAfrican-Americanmajoritytractsareover-representedinleast-access-to-grocery-storeoutcomes,basedonthetotalnumberofAfrican-AmericantractsinChicago.Inotherwords,wecalculatedthepercentageoftractsineachtertilebymajorityrace.Thenwecalculatedwhatthedistributionbyracewouldbeineachtertileifeachracewererepresentedinproportiontothetotaltractsofthatraceacrossthecity.Diversetractsareunder-representedintheworstoutcomestertile.Insomecases,however,diversetractsdoindeedhavenegativeoutcomesconcerningaccesstogrocerystores,buttheytendtobedispersed,notclustered,withothersimilarscoringtracts.Whitetractsareunder-representedinthe“worstoutcomes”grouping.Latinotractsscoreroughlywhereweexpectthemto–theyareonlymarginallyunder-representedinthetertile.Butwhenweanalyzetheshortestdistancetertilewiththeclosestorbestaccesstogrocerystores,weseethatLatinotractsareover-representedby31percentagepointsandthatdiversetractsareover-representedby53percentagepoints.Whitetractsareonlymarginallyover-representedandAfrican-Americantractsareunder-representedby23percentagepoints.
21
White 58 19.40% 35.34% -15.94%Afr.-Am. 189 54.00% 41.37% 12.63%Latino 21 13.73% 18.09% -4.38%Diverse 8 21.05% 4.49% -16.58%Theaveragedistanceinthisgroupingtoanygrocerystorewas.78miles.Therangewas.62to1.33miles.
Average Distance to All Grocery Stores by Chicago Census Tracts by Tertiles
Farthest Distance (worst outcomes)
White 118 38.80% 35.34% 3.45%Afr.-Am. 99 28.29% 41.37% -13.09%Latino 57 37.25% 18.09% 19.17%Diverse 8 21.05% 4.49% 16.58%Theaveragedistanceinthisgroupingtoanygrocerystorewas.41miles.Therangewas.38to.54miles.
Average Distance
White 125 41.81% 35.1% 6.71%Afr.-Am. 62 17.71% 41.1% -23.37%Latino 75 49.02% 18.0% 31.06%Diverse 22 57.89% 4.5% 53.43%Theaveragedistanceinthisgroupingtoanygrocerystorewas.25miles.Therangewas.07to.22miles.
Note: Therewere8Asianminoritycommunitiesinthisanalysis:zerointheshortestgrouping,2inthemiddlegrouping,and6inthefarthestgrouping.
Shortest Distance (best outcomes)
Number Percentage Whatpercentage Percentage oftracts oftotalin wouldbe point (848total) grouping ifequally differential distributed
Percentage Point Differential of Average Distance to All Grocery Stores
in Miles by Chicago Census Tracts
White African-American Latino Diverse -15.94% 12.63% -4.38% -16.58º%
20%
10%
0%
-10%
-20%
Farthest Distance Tertile
Fig. 31
Fig. 32
EXAMINING THE IMPACT OF FOOD DESERTS ON PUBLIC HEALTH IN CHICAGO
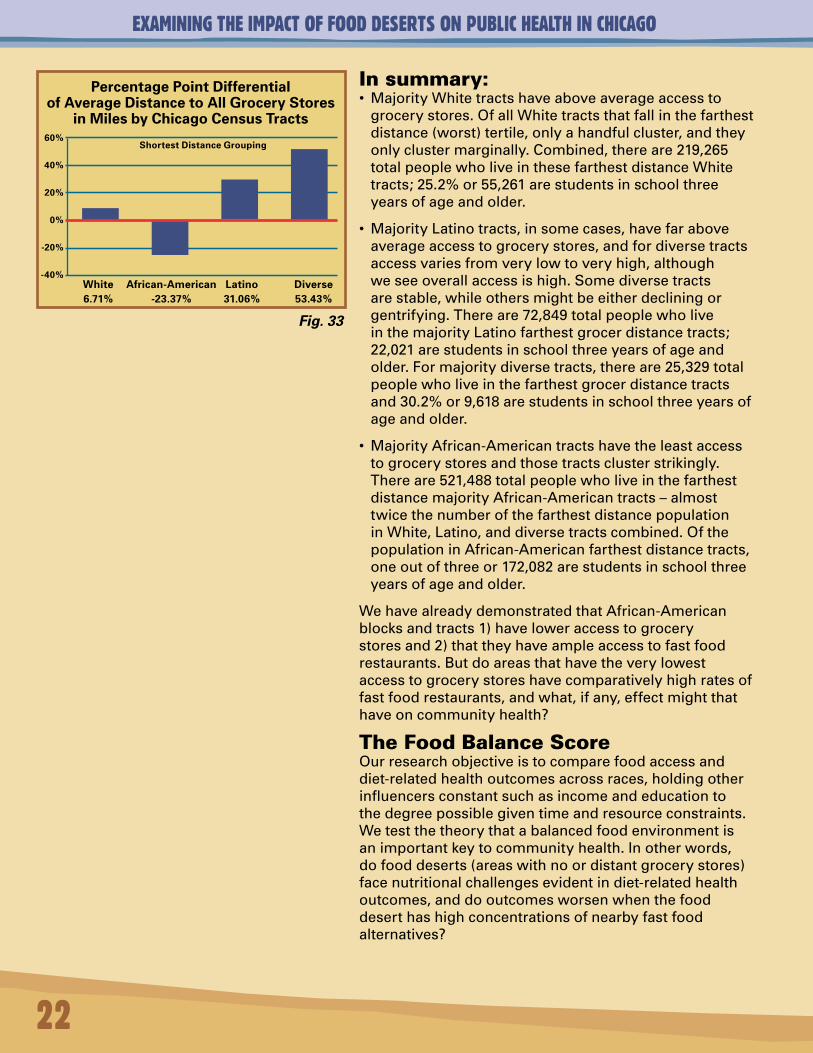
Insummary:• MajorityWhitetractshaveaboveaverageaccessto
grocerystores.OfallWhitetractsthatfallinthefarthestdistance(worst)tertile,onlyahandfulcluster,andtheyonlyclustermarginally.Combined,thereare219,265totalpeoplewholiveinthesefarthestdistanceWhitetracts;25.2%or55,261arestudentsinschoolthreeyearsofageandolder.
• MajorityLatinotracts,insomecases,havefaraboveaverageaccesstogrocerystores,andfordiversetractsaccessvariesfromverylowtoveryhigh,althoughweseeoverallaccessishigh.Somediversetractsarestable,whileothersmightbeeitherdecliningorgentrifying.Thereare72,849totalpeoplewholiveinthemajorityLatinofarthestgrocerdistancetracts;22,021arestudentsinschoolthreeyearsofageandolder.Formajoritydiversetracts,thereare25,329totalpeoplewholiveinthefarthestgrocerdistancetractsand30.2%or9,618arestudentsinschoolthreeyearsofageandolder.
• MajorityAfrican-Americantractshavetheleastaccesstogrocerystoresandthosetractsclusterstrikingly.Thereare521,488totalpeoplewholiveinthefarthestdistancemajorityAfrican-Americantracts–almosttwicethenumberofthefarthestdistancepopulationinWhite,Latino,anddiversetractscombined.OfthepopulationinAfrican-Americanfarthestdistancetracts,oneoutofthreeor172,082arestudentsinschoolthreeyearsofageandolder.
WehavealreadydemonstratedthatAfrican-Americanblocksandtracts1)haveloweraccesstogrocerystoresand2)thattheyhaveampleaccesstofastfoodrestaurants.Butdoareasthathavetheverylowestaccesstogrocerystoreshavecomparativelyhighratesoffastfoodrestaurants,andwhat,ifany,effectmightthathaveoncommunityhealth?
TheFoodBalanceScoreOurresearchobjectiveistocomparefoodaccessanddiet-relatedhealthoutcomesacrossraces,holdingotherinfluencersconstantsuchasincomeandeducationtothedegreepossiblegiventimeandresourceconstraints.Wetestthetheorythatabalancedfoodenvironmentisanimportantkeytocommunityhealth.Inotherwords,dofooddeserts(areaswithnoordistantgrocerystores)facenutritionalchallengesevidentindiet-relatedhealthoutcomes,anddooutcomesworsenwhenthefooddeserthashighconcentrationsofnearbyfastfoodalternatives?
22
Percentage Point Differential of Average Distance to All Grocery Stores
in Miles by Chicago Census Tracts
White African-American Latino Diverse 6.71% -23.37% 31.06% 53.43%
60%
40%
20%
0%
-20%
-40%
Shortest Distance Grouping
Fig. 33
EXAMINING THE IMPACT OF FOOD DESERTS ON PUBLIC HEALTH IN CHICAGO
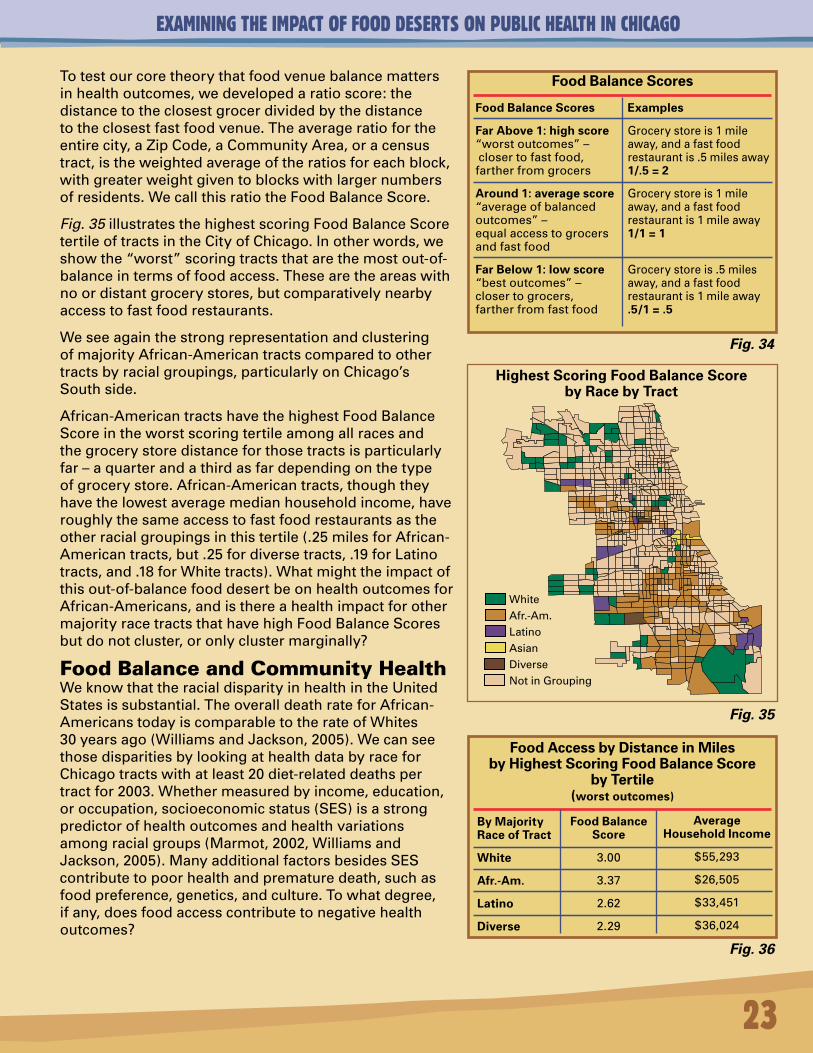
Totestourcoretheorythatfoodvenuebalancemattersinhealthoutcomes,wedevelopedaratioscore:thedistancetotheclosestgrocerdividedbythedistancetotheclosestfastfoodvenue.Theaverageratiofortheentirecity,aZipCode,aCommunityArea,oracensustract,istheweightedaverageoftheratiosforeachblock,withgreaterweightgiventoblockswithlargernumbersofresidents.WecallthisratiotheFoodBalanceScore.
Fig. 35illustratesthehighestscoringFoodBalanceScoretertileoftractsintheCityofChicago.Inotherwords,weshowthe“worst”scoringtractsthatarethemostout-of-balanceintermsoffoodaccess.Thesearetheareaswithnoordistantgrocerystores,butcomparativelynearbyaccesstofastfoodrestaurants.
WeseeagainthestrongrepresentationandclusteringofmajorityAfrican-Americantractscomparedtoothertractsbyracialgroupings,particularlyonChicago’sSouthside.
African-AmericantractshavethehighestFoodBalanceScoreintheworstscoringtertileamongallracesandthegrocerystoredistanceforthosetractsisparticularlyfar–aquarterandathirdasfardependingonthetypeofgrocerystore.African-Americantracts,thoughtheyhavethelowestaveragemedianhouseholdincome,haveroughlythesameaccesstofastfoodrestaurantsastheotherracialgroupingsinthistertile(.25milesforAfrican-Americantracts,but.25fordiversetracts,.19forLatinotracts,and.18forWhitetracts).Whatmighttheimpactofthisout-of-balancefooddesertbeonhealthoutcomesforAfrican-Americans,andisthereahealthimpactforothermajorityracetractsthathavehighFoodBalanceScoresbutdonotcluster,oronlyclustermarginally?
FoodBalanceandCommunityHealthWeknowthattheracialdisparityinhealthintheUnitedStatesissubstantial.TheoveralldeathrateforAfrican-AmericanstodayiscomparabletotherateofWhites30yearsago(WilliamsandJackson,2005).WecanseethosedisparitiesbylookingathealthdatabyraceforChicagotractswithatleast20diet-relateddeathspertractfor2003.Whethermeasuredbyincome,education,oroccupation,socioeconomicstatus(SES)isastrongpredictorofhealthoutcomesandhealthvariationsamongracialgroups(Marmot,2002,WilliamsandJackson,2005).ManyadditionalfactorsbesidesSEScontributetopoorhealthandprematuredeath,suchasfoodpreference,genetics,andculture.Towhatdegree,ifany,doesfoodaccesscontributetonegativehealthoutcomes?
23
Highest Scoring Food Balance Score by Race by Tract
Food Balance Scores
Food Balance Scores
Far Above 1: high score “worstoutcomes”–closertofastfood,fartherfromgrocers
Around 1: average score “averageofbalancedoutcomes”–equalaccesstogrocersandfastfood
Far Below 1: low score“bestoutcomes”–closertogrocers,fartherfromfastfood
Examples
Grocerystoreis1mileaway,andafastfoodrestaurantis.5milesaway1/.5 = 2
Grocerystoreis1mileaway,andafastfoodrestaurantis1mileaway1/1 = 1
Grocerystoreis.5milesaway,andafastfoodrestaurantis1mileaway.5/1 = .5
Food Access by Distance in Miles by Highest Scoring Food Balance Score
by Tertile (worst outcomes)
By Majority Race of Tract
White
Afr.-Am.
Latino
Diverse
Food Balance Score
3.00
3.37
2.62
2.29
Average Household Income
$55,293
$26,505
$33,451
$36,024
Fig. 34
Fig. 35
Fig. 36
WhiteAfr.-Am.LatinoAsianDiverse
NotinGrouping
EXAMINING THE IMPACT OF FOOD DESERTS ON PUBLIC HEALTH IN CHICAGO
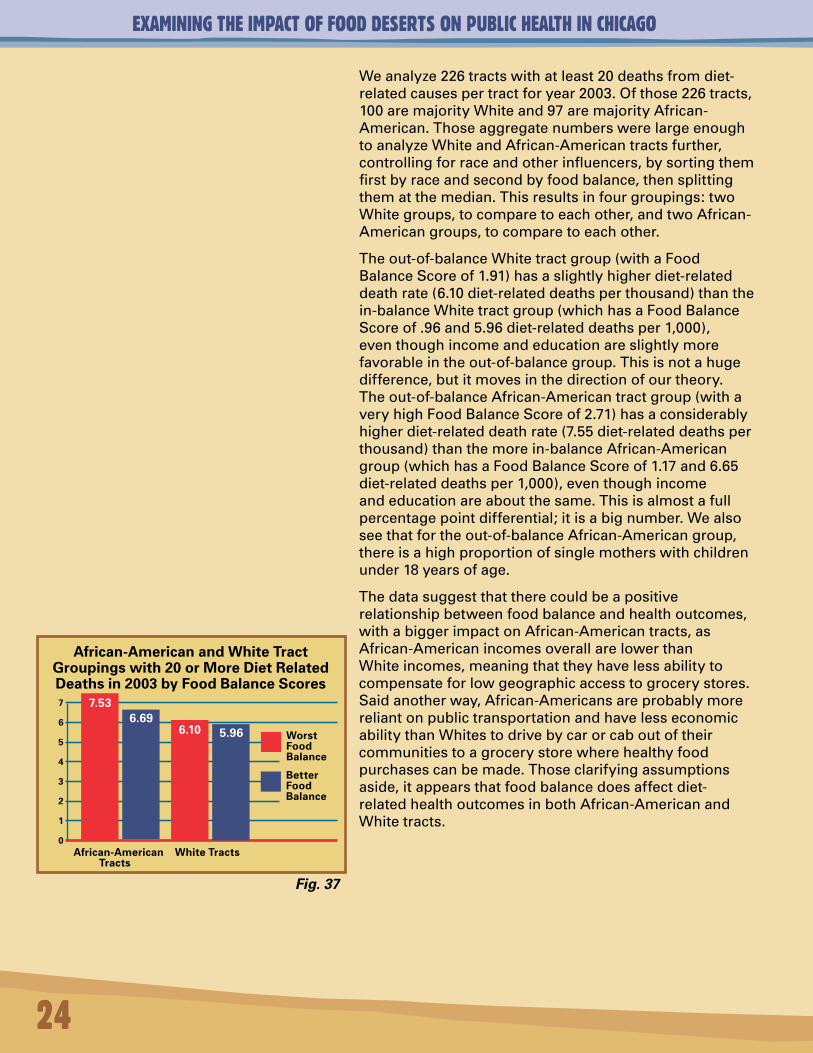
Weanalyze226tractswithatleast20deathsfromdiet-relatedcausespertractforyear2003.Ofthose226tracts,100aremajorityWhiteand97aremajorityAfrican-American.ThoseaggregatenumberswerelargeenoughtoanalyzeWhiteandAfrican-Americantractsfurther,controllingforraceandotherinfluencers,bysortingthemfirstbyraceandsecondbyfoodbalance,thensplittingthematthemedian.Thisresultsinfourgroupings:twoWhitegroups,tocomparetoeachother,andtwoAfrican-Americangroups,tocomparetoeachother.
Theout-of-balanceWhitetractgroup(withaFoodBalanceScoreof1.91)hasaslightlyhigherdiet-relateddeathrate(6.10diet-relateddeathsperthousand)thanthein-balanceWhitetractgroup(whichhasaFoodBalanceScoreof.96and5.96diet-relateddeathsper1,000),eventhoughincomeandeducationareslightlymorefavorableintheout-of-balancegroup.Thisisnotahugedifference,butitmovesinthedirectionofourtheory.Theout-of-balanceAfrican-Americantractgroup(withaveryhighFoodBalanceScoreof2.71)hasaconsiderablyhigherdiet-relateddeathrate(7.55diet-relateddeathsperthousand)thanthemorein-balanceAfrican-Americangroup(whichhasaFoodBalanceScoreof1.17and6.65diet-relateddeathsper1,000),eventhoughincomeandeducationareaboutthesame.Thisisalmostafullpercentagepointdifferential;itisabignumber.Wealsoseethatfortheout-of-balanceAfrican-Americangroup,thereisahighproportionofsinglemotherswithchildrenunder18yearsofage.
Thedatasuggestthattherecouldbeapositiverelationshipbetweenfoodbalanceandhealthoutcomes,withabiggerimpactonAfrican-Americantracts,asAfrican-AmericanincomesoverallarelowerthanWhiteincomes,meaningthattheyhavelessabilitytocompensateforlowgeographicaccesstogrocerystores.Saidanotherway,African-AmericansareprobablymorereliantonpublictransportationandhavelesseconomicabilitythanWhitestodrivebycarorcaboutoftheircommunitiestoagrocerystorewherehealthyfoodpurchasescanbemade.Thoseclarifyingassumptionsaside,itappearsthatfoodbalancedoesaffectdiet-relatedhealthoutcomesinbothAfrican-AmericanandWhitetracts.
24
Fig. 37
African-American and White Tract Groupings with 20 or More Diet Related Deaths in 2003 by Food Balance Scores
African-American White Tracts Tracts
7
6
5
4
3
2
1
0
Worst Food Balance
Better Food Balance
7.536.69
6.10 5.96
EXAMINING THE IMPACT OF FOOD DESERTS ON PUBLIC HEALTH IN CHICAGO
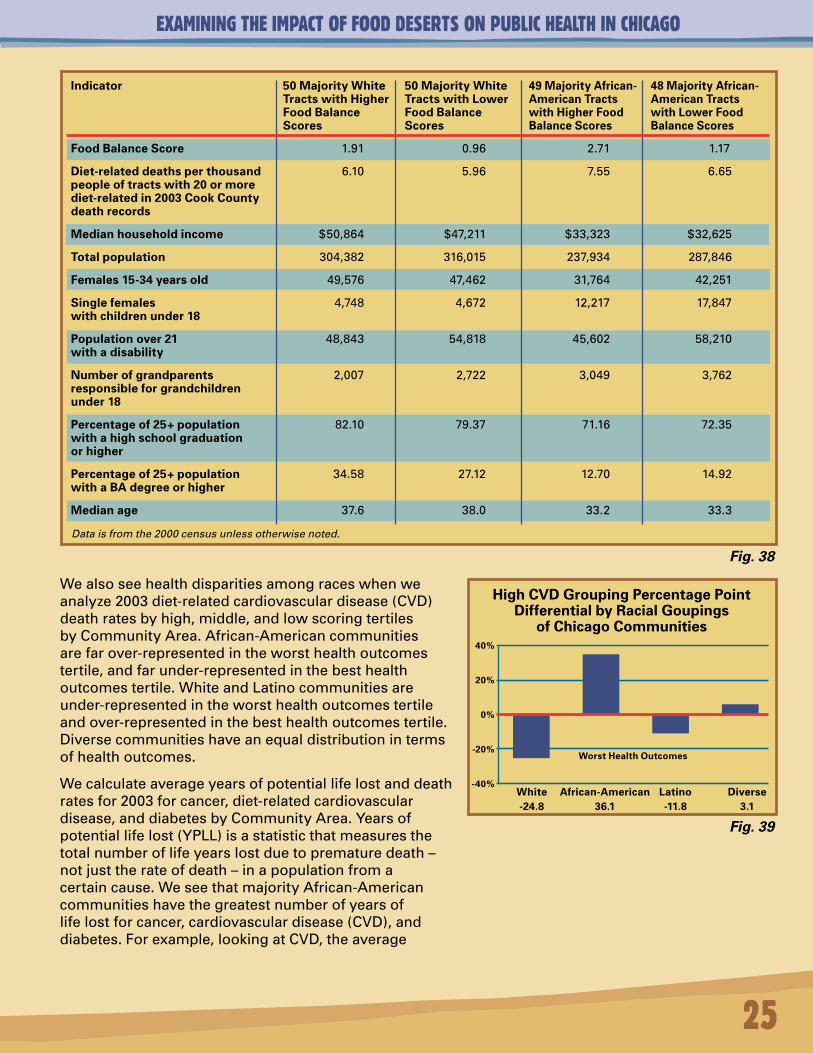
Wealsoseehealthdisparitiesamongraceswhenweanalyze2003diet-relatedcardiovasculardisease(CVD)deathratesbyhigh,middle,andlowscoringtertilesbyCommunityArea.African-Americancommunitiesarefarover-representedintheworsthealthoutcomestertile,andfarunder-representedinthebesthealthoutcomestertile.WhiteandLatinocommunitiesareunder-representedintheworsthealthoutcomestertileandover-representedinthebesthealthoutcomestertile.Diversecommunitieshaveanequaldistributionintermsofhealthoutcomes.
Wecalculateaverageyearsofpotentiallifelostanddeathratesfor2003forcancer,diet-relatedcardiovasculardisease,anddiabetesbyCommunityArea.Yearsofpotentiallifelost(YPLL)isastatisticthatmeasuresthetotalnumberoflifeyearslostduetoprematuredeath–notjusttherateofdeath–inapopulationfromacertaincause.WeseethatmajorityAfrican-Americancommunitieshavethegreatestnumberofyearsoflifelostforcancer,cardiovasculardisease(CVD),anddiabetes.Forexample,lookingatCVD,theaverage
25
Data is from the 2000 census unless otherwise noted.
Indicator
Food Balance Score
Diet-related deaths per thousand people of tracts with 20 or more diet-related in 2003 Cook County death records
Median household income
Total population
Females 15-34 years old
Single females with children under 18
Population over 21 with a disability
Number of grandparents responsible for grandchildren under 18
Percentage of 25+ population with a high school graduation or higher
Percentage of 25+ population with a BA degree or higher
Median age
50 Majority White Tracts with Higher Food Balance Scores
1.91
6.10
$50,864
304,382
49,576
4,748
48,843
2,007
82.10
34.58
37.6
50 Majority White Tracts with Lower Food Balance Scores
0.96
5.96
$47,211
316,015
47,462
4,672
54,818
2,722
79.37
27.12
38.0
49 Majority African-American Tracts with Higher Food Balance Scores
2.71
7.55
$33,323
237,934
31,764
12,217
45,602
3,049
71.16
12.70
33.2
48 Majority African-American Tracts with Lower Food Balance Scores
1.17
6.65
$32,625
287,846
42,251
17,847
58,210
3,762
72.35
14.92
33.3
High CVD Grouping Percentage Point Differential by Racial Goupings
of Chicago Communities
White African-American Latino Diverse -24.8 36.1 -11.8 3.1
40%
20%
0%
-20%
-40%
Worst Health Outcomes
Fig. 38
Fig. 39
EXAMINING THE IMPACT OF FOOD DESERTS ON PUBLIC HEALTH IN CHICAGO
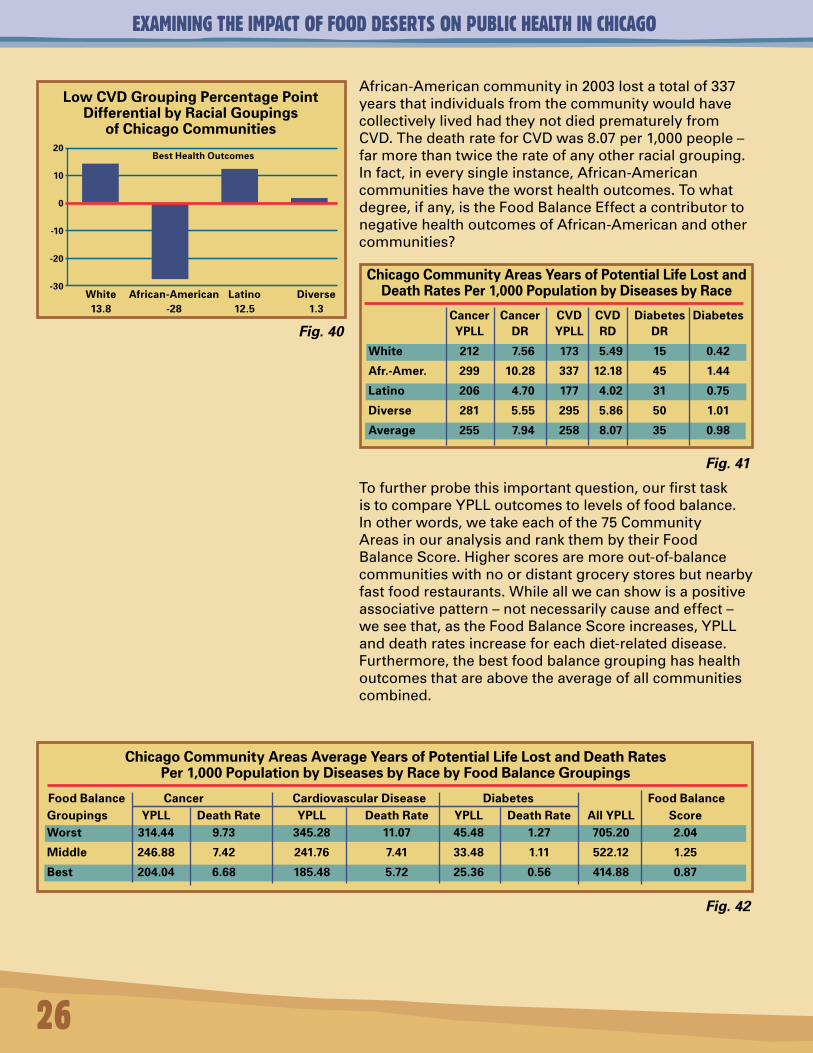
African-Americancommunityin2003lostatotalof337yearsthatindividualsfromthecommunitywouldhavecollectivelylivedhadtheynotdiedprematurelyfromCVD.ThedeathrateforCVDwas8.07per1,000people–farmorethantwicetherateofanyotherracialgrouping.Infact,ineverysingleinstance,African-Americancommunitieshavetheworsthealthoutcomes.Towhatdegree,ifany,istheFoodBalanceEffectacontributortonegativehealthoutcomesofAfrican-Americanandothercommunities?
26
Low CVD Grouping Percentage Point Differential by Racial Goupings
of Chicago Communities
White African-American Latino Diverse 13.8 -28 12.5 1.3
20
10
0
-10
-20
-30
Best Health Outcomes
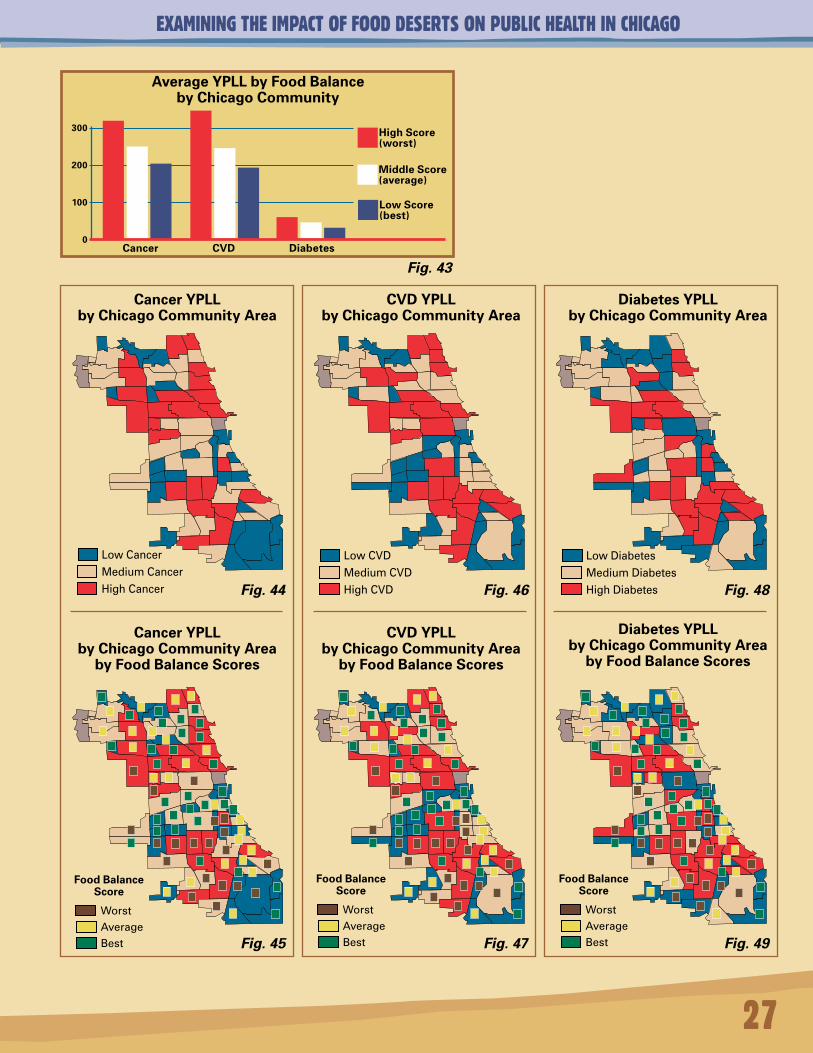
Tofurtherprobethisimportantquestion,ourfirsttaskistocompareYPLLoutcomestolevelsoffoodbalance.Inotherwords,wetakeeachofthe75CommunityAreasinouranalysisandrankthembytheirFoodBalanceScore.Higherscoresaremoreout-of-balancecommunitieswithnoordistantgrocerystoresbutnearbyfastfoodrestaurants.Whileallwecanshowisapositiveassociativepattern–notnecessarilycauseandeffect–weseethat,astheFoodBalanceScoreincreases,YPLLanddeathratesincreaseforeachdiet-relateddisease.Furthermore,thebestfoodbalancegroupinghashealthoutcomesthatareabovetheaverageofallcommunitiescombined.
Chicago Community Areas Years of Potential Life Lost and Death Rates Per 1,000 Population by Diseases by Race
Cancer Cancer CVD CVD Diabetes Diabetes YPLL DR YPLL RD DR
White 212 7.56 173 5.49 15 0.42
Afr.-Amer. 299 10.28 337 12.18 45 1.44
Latino 206 4.70 177 4.02 31 0.75
Diverse 281 5.55 295 5.86 50 1.01
Average 255 7.94 258 8.07 35 0.98
Chicago Community Areas Average Years of Potential Life Lost and Death Rates Per 1,000 Population by Diseases by Race by Food Balance Groupings
Food Balance Cancer Cardiovascular Disease Diabetes Food BalanceGroupings YPLL Death Rate YPLL Death Rate YPLL Death Rate All YPLL ScoreWorst 314.44 9.73 345.28 11.07 45.48 1.27 705.20 2.04
Middle 246.88 7.42 241.76 7.41 33.48 1.11 522.12 1.25
Best 204.04 6.68 185.48 5.72 25.36 0.56 414.88 0.87
Fig. 40
Fig. 41
Fig. 42
EXAMINING THE IMPACT OF FOOD DESERTS ON PUBLIC HEALTH IN CHICAGO
27
Average YPLL by Food Balance by Chicago Community
Cancer CVD Diabetes
300
200
100
0
High Score (worst)
Middle Score (average)
Low Score (best)
Cancer YPLL by Chicago Community Area
CVD YPLL by Chicago Community Area
Diabetes YPLL by Chicago Community Area
Cancer YPLL by Chicago Community Area
by Food Balance Scores
CVD YPLL by Chicago Community Area
by Food Balance Scores
Diabetes YPLL by Chicago Community Area
by Food Balance Scores
Fig. 43
Fig. 44
Fig. 45
Fig. 46
Fig. 47
Fig. 48
Fig. 49
LowCancer
MediumCancer
HighCancer
LowCVD
MediumCVD
HighCVD
LowDiabetes
MediumDiabetes
HighDiabetes
WorstAverageBest
Food Balance Score
WorstAverageBest
Food Balance Score
WorstAverageBest
Food Balance Score
EXAMINING THE IMPACT OF FOOD DESERTS ON PUBLIC HEALTH IN CHICAGO
28
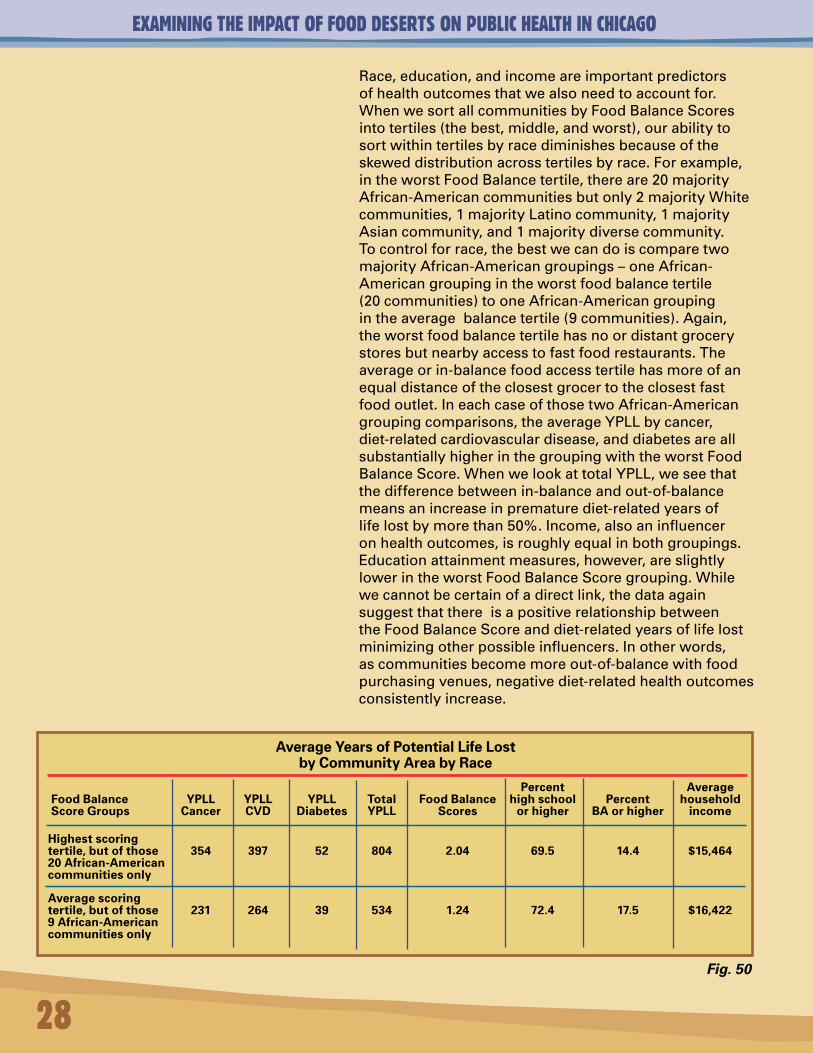
Percent Average Food Balance YPLL YPLL YPLL Total Food Balance high school Percent household Score Groups Cancer CVD Diabetes YPLL Scores or higher BA or higher income Highest scoring tertile, but of those 354 397 52 804 2.04 69.5 14.4 $15,464 20 African-American communities only
Average scoring tertile, but of those 231 264 39 534 1.24 72.4 17.5 $16,422 9 African-American communities only
Average Years of Potential Life Lost by Community Area by Race
Race,education,andincomeareimportantpredictorsofhealthoutcomesthatwealsoneedtoaccountfor.WhenwesortallcommunitiesbyFoodBalanceScoresintotertiles(thebest,middle,andworst),ourabilitytosortwithintertilesbyracediminishesbecauseoftheskeweddistributionacrosstertilesbyrace.Forexample,intheworstFoodBalancetertile,thereare20majorityAfrican-Americancommunitiesbutonly2majorityWhitecommunities,1majorityLatinocommunity,1majorityAsiancommunity,and1majoritydiversecommunity.Tocontrolforrace,thebestwecandoiscomparetwomajorityAfrican-Americangroupings–oneAfrican-Americangroupingintheworstfoodbalancetertile(20communities)tooneAfrican-Americangroupingintheaveragebalancetertile(9communities).Again,theworstfoodbalancetertilehasnoordistantgrocerystoresbutnearbyaccesstofastfoodrestaurants.Theaverageorin-balancefoodaccesstertilehasmoreofanequaldistanceoftheclosestgrocertotheclosestfastfoodoutlet.IneachcaseofthosetwoAfrican-Americangroupingcomparisons,theaverageYPLLbycancer,diet-relatedcardiovasculardisease,anddiabetesareallsubstantiallyhigherinthegroupingwiththeworstFoodBalanceScore.WhenwelookattotalYPLL,weseethatthedifferencebetweenin-balanceandout-of-balancemeansanincreaseinprematurediet-relatedyearsoflifelostbymorethan50%.Income,alsoaninfluenceronhealthoutcomes,isroughlyequalinbothgroupings.Educationattainmentmeasures,however,areslightlylowerintheworstFoodBalanceScoregrouping.Whilewecannotbecertainofadirectlink,thedataagainsuggestthatthereisapositiverelationshipbetweentheFoodBalanceScoreanddiet-relatedyearsoflifelostminimizingotherpossibleinfluencers.Inotherwords,ascommunitiesbecomemoreout-of-balancewithfoodpurchasingvenues,negativediet-relatedhealthoutcomesconsistentlyincrease.
Fig. 50
EXAMINING THE IMPACT OF FOOD DESERTS ON PUBLIC HEALTH IN CHICAGO
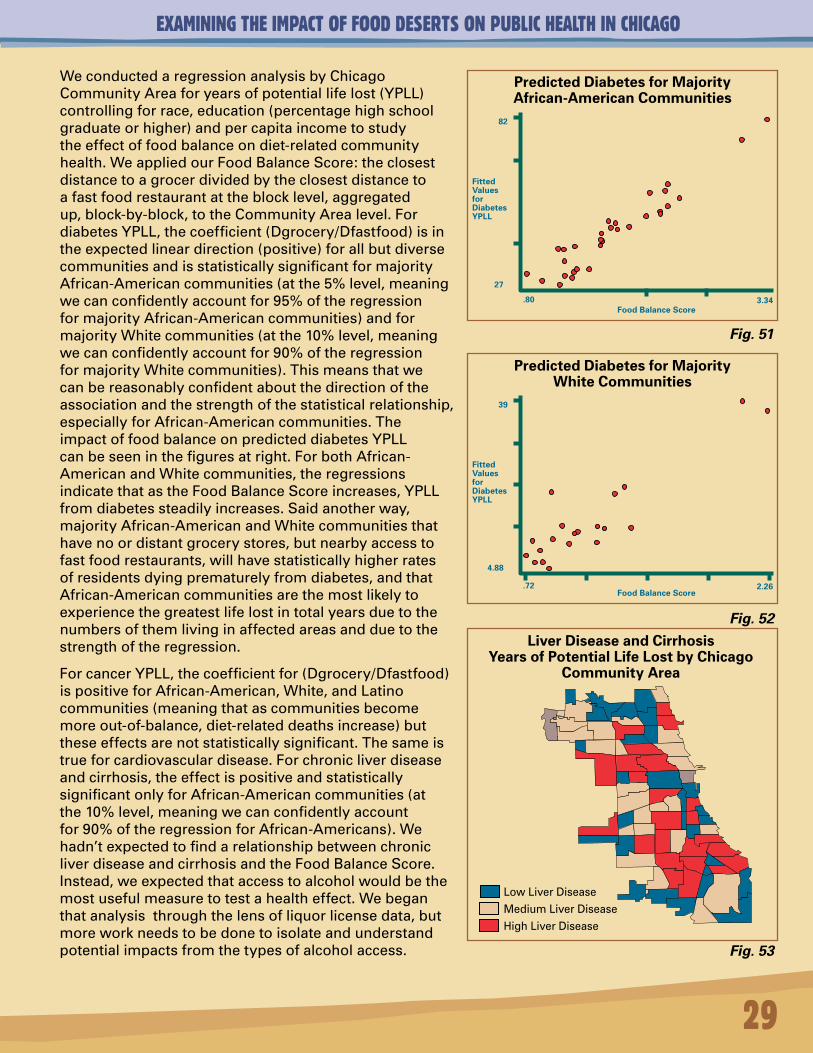
WeconductedaregressionanalysisbyChicagoCommunityAreaforyearsofpotentiallifelost(YPLL)controllingforrace,education(percentagehighschoolgraduateorhigher)andpercapitaincometostudytheeffectoffoodbalanceondiet-relatedcommunityhealth.WeappliedourFoodBalanceScore:theclosestdistancetoagrocerdividedbytheclosestdistancetoafastfoodrestaurantattheblocklevel,aggregatedup,block-by-block,totheCommunityArealevel.FordiabetesYPLL,thecoefficient(Dgrocery/Dfastfood)isintheexpectedlineardirection(positive)forallbutdiversecommunitiesandisstatisticallysignificantformajorityAfrican-Americancommunities(atthe5%level,meaningwecanconfidentlyaccountfor95%oftheregressionformajorityAfrican-Americancommunities)andformajorityWhitecommunities(atthe10%level,meaningwecanconfidentlyaccountfor90%oftheregressionformajorityWhitecommunities).Thismeansthatwecanbereasonablyconfidentaboutthedirectionoftheassociationandthestrengthofthestatisticalrelationship,especiallyforAfrican-Americancommunities.TheimpactoffoodbalanceonpredicteddiabetesYPLLcanbeseeninthefiguresatright.ForbothAfrican-AmericanandWhitecommunities,theregressionsindicatethatastheFoodBalanceScoreincreases,YPLLfromdiabetessteadilyincreases.Saidanotherway,majorityAfrican-AmericanandWhitecommunitiesthathavenoordistantgrocerystores,butnearbyaccesstofastfoodrestaurants,willhavestatisticallyhigherratesofresidentsdyingprematurelyfromdiabetes,andthatAfrican-Americancommunitiesarethemostlikelytoexperiencethegreatestlifelostintotalyearsduetothenumbersofthemlivinginaffectedareasandduetothestrengthoftheregression.
ForcancerYPLL,thecoefficientfor(Dgrocery/Dfastfood)ispositiveforAfrican-American,White,andLatinocommunities(meaningthatascommunitiesbecomemoreout-of-balance,diet-relateddeathsincrease)buttheseeffectsarenotstatisticallysignificant.Thesameistrueforcardiovasculardisease.Forchronicliverdiseaseandcirrhosis,theeffectispositiveandstatisticallysignificantonlyforAfrican-Americancommunities(atthe10%level,meaningwecanconfidentlyaccountfor90%oftheregressionforAfrican-Americans).Wehadn’texpectedtofindarelationshipbetweenchronicliverdiseaseandcirrhosisandtheFoodBalanceScore.Instead,weexpectedthataccesstoalcoholwouldbethemostusefulmeasuretotestahealtheffect.Webeganthatanalysisthroughthelensofliquorlicensedata,butmoreworkneedstobedonetoisolateandunderstandpotentialimpactsfromthetypesofalcoholaccess.
29
3.34.80
82
27
Food Balance Score
FittedValuesforDiabetesYPLL
Predicted Diabetes for Majority African-American Communities
Predicted Diabetes for Majority White Communities
Liver Disease and Cirrhosis Years of Potential Life Lost by Chicago
Community Area
Fig. 51
Fig. 52
Fig. 53
LowLiverDisease
MediumLiverDisease
HighLiverDisease
2.26.72
39
4.88
Food Balance Score
FittedValuesforDiabetesYPLL
EXAMINING THE IMPACT OF FOOD DESERTS ON PUBLIC HEALTH IN CHICAGO
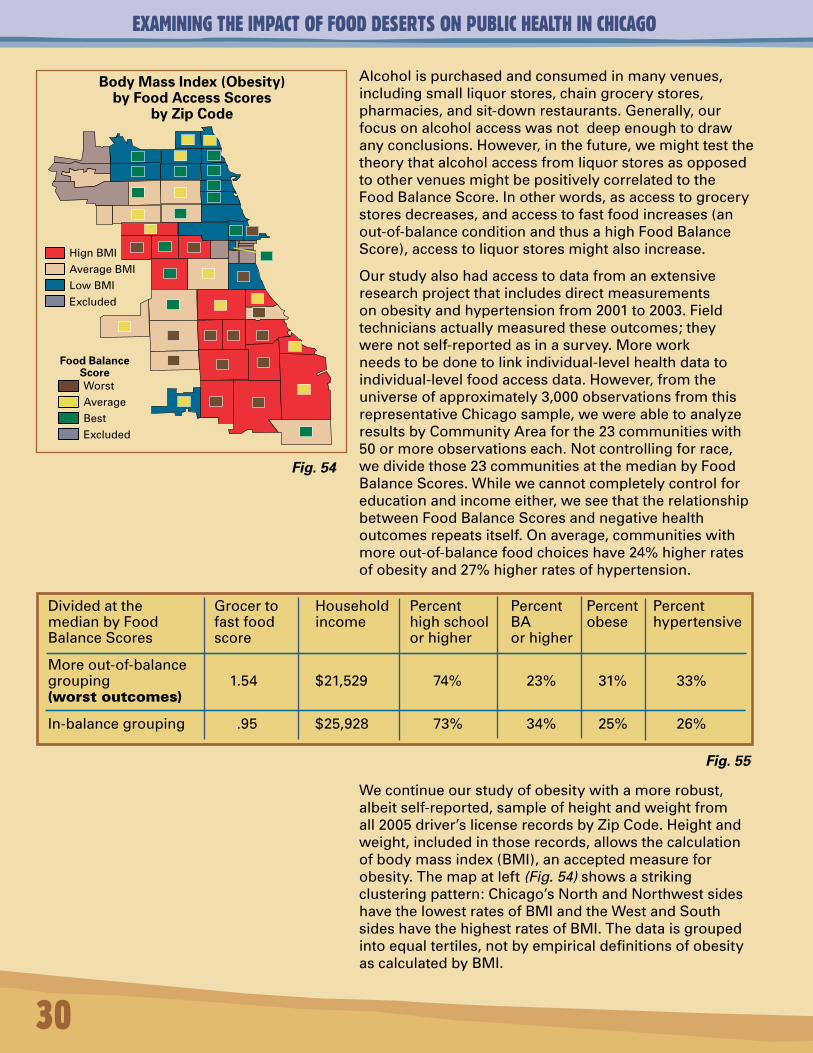
Alcoholispurchasedandconsumedinmanyvenues,includingsmallliquorstores,chaingrocerystores,pharmacies,andsit-downrestaurants.Generally,ourfocusonalcoholaccesswasnotdeepenoughtodrawanyconclusions.However,inthefuture,wemighttestthetheorythatalcoholaccessfromliquorstoresasopposedtoothervenuesmightbepositivelycorrelatedtotheFoodBalanceScore.Inotherwords,asaccesstogrocerystoresdecreases,andaccesstofastfoodincreases(anout-of-balanceconditionandthusahighFoodBalanceScore),accesstoliquorstoresmightalsoincrease.
Ourstudyalsohadaccesstodatafromanextensiveresearchprojectthatincludesdirectmeasurementsonobesityandhypertensionfrom2001to2003.Fieldtechniciansactuallymeasuredtheseoutcomes;theywerenotself-reportedasinasurvey.Moreworkneedstobedonetolinkindividual-levelhealthdatatoindividual-levelfoodaccessdata.However,fromtheuniverseofapproximately3,000observationsfromthisrepresentativeChicagosample,wewereabletoanalyzeresultsbyCommunityAreaforthe23communitieswith50ormoreobservationseach.Notcontrollingforrace,wedividethose23communitiesatthemedianbyFoodBalanceScores.Whilewecannotcompletelycontrolforeducationandincomeeither,weseethattherelationshipbetweenFoodBalanceScoresandnegativehealthoutcomesrepeatsitself.Onaverage,communitieswithmoreout-of-balancefoodchoiceshave24%higherratesofobesityand27%higherratesofhypertension.
30
Wecontinueourstudyofobesitywithamorerobust,albeitself-reported,sampleofheightandweightfromall2005driver’slicenserecordsbyZipCode.Heightandweight,includedinthoserecords,allowsthecalculationofbodymassindex(BMI),anacceptedmeasureforobesity.Themapatleft(Fig. 54)showsastrikingclusteringpattern:Chicago’sNorthandNorthwestsideshavethelowestratesofBMIandtheWestandSouthsideshavethehighestratesofBMI.Thedataisgroupedintoequaltertiles,notbyempiricaldefinitionsofobesityascalculatedbyBMI.
Body Mass Index (Obesity) by Food Access Scores
by Zip Code
Dividedatthe Grocerto Household Percent Percent Percent PercentmedianbyFood fastfood income highschool BA obese hypertensiveBalanceScores score orhigher orhigher
Moreout-of-balancegrouping 1.54 $21,529 74% 23% 31% 33%(worstoutcomes)
In-balancegrouping .95 $25,928 73% 34% 25% 26%
Fig. 54
Fig. 55
Food Balance ScoreWorstAverageBestExcluded
HignBMI
AverageBMI
LowBMIExcluded
EXAMINING THE IMPACT OF FOOD DESERTS ON PUBLIC HEALTH IN CHICAGO
31
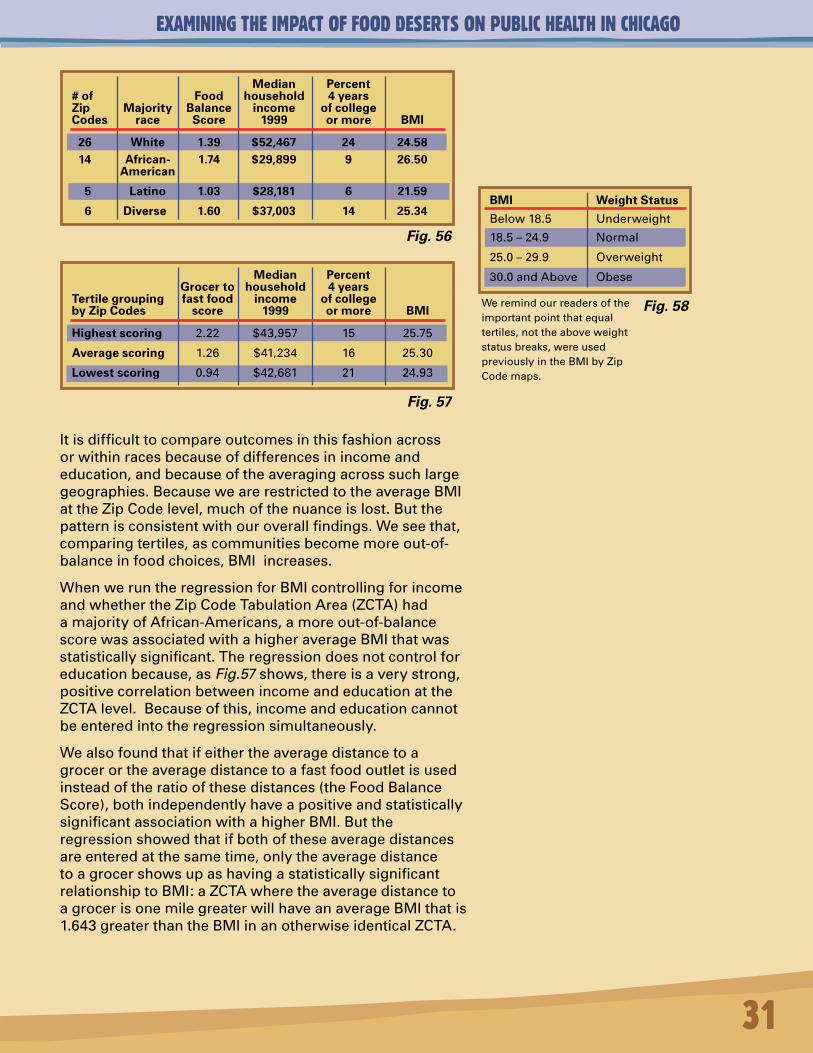
Itisdifficulttocompareoutcomesinthisfashionacrossorwithinracesbecauseofdifferencesinincomeandeducation,andbecauseoftheaveragingacrosssuchlargegeographies.BecausewearerestrictedtotheaverageBMIattheZipCodelevel,muchofthenuanceislost.Butthepatternisconsistentwithouroverallfindings.Weseethat,comparingtertiles,ascommunitiesbecomemoreout-of-balanceinfoodchoices,BMIincreases.
WhenweruntheregressionforBMIcontrollingforincomeandwhethertheZipCodeTabulationArea(ZCTA)hadamajorityofAfrican-Americans,amoreout-of-balancescorewasassociatedwithahigheraverageBMIthatwasstatisticallysignificant.Theregressiondoesnotcontrolforeducationbecause,asFig.57shows,thereisaverystrong,positivecorrelationbetweenincomeandeducationattheZCTAlevel.Becauseofthis,incomeandeducationcannotbeenteredintotheregressionsimultaneously.
Wealsofoundthatifeithertheaveragedistancetoagrocerortheaveragedistancetoafastfoodoutletisusedinsteadoftheratioofthesedistances(theFoodBalanceScore),bothindependentlyhaveapositiveandstatisticallysignificantassociationwithahigherBMI.Buttheregressionshowedthatifbothoftheseaveragedistancesareenteredatthesametime,onlytheaveragedistancetoagrocershowsupashavingastatisticallysignificantrelationshiptoBMI:aZCTAwheretheaveragedistancetoagrocerisonemilegreaterwillhaveanaverageBMIthatis1.643greaterthantheBMIinanotherwiseidenticalZCTA.
Median Percent Grocer to household 4 years Tertile grouping fast food income of college by Zip Codes score 1999 or more BMI
Highest scoring 2.22 $43,957 15 25.75
Average scoring 1.26 $41,234 16 25.30
Lowest scoring 0.94 $42,681 21 24.93
Median Percent # of Food household 4 years Zip Majority Balance income of college Codes race Score 1999 or more BMI
26 White 1.39 $52,467 24 24.58 14 African- 1.74 $29,899 9 26.50 American
5 Latino 1.03 $28,181 6 21.59
6 Diverse 1.60 $37,003 14 25.34
Fig. 56
Fig. 57
BMI Weight Status
Below18.5 Underweight
18.5–24.9 Normal
25.0–29.9 Overweight
30.0andAbove Obese
We remind our readers of the important point that equal tertiles, not the above weight status breaks, were used previously in the BMI by Zip Code maps.
Fig. 58
EXAMINING THE IMPACT OF FOOD DESERTS ON PUBLIC HEALTH IN CHICAGO
32
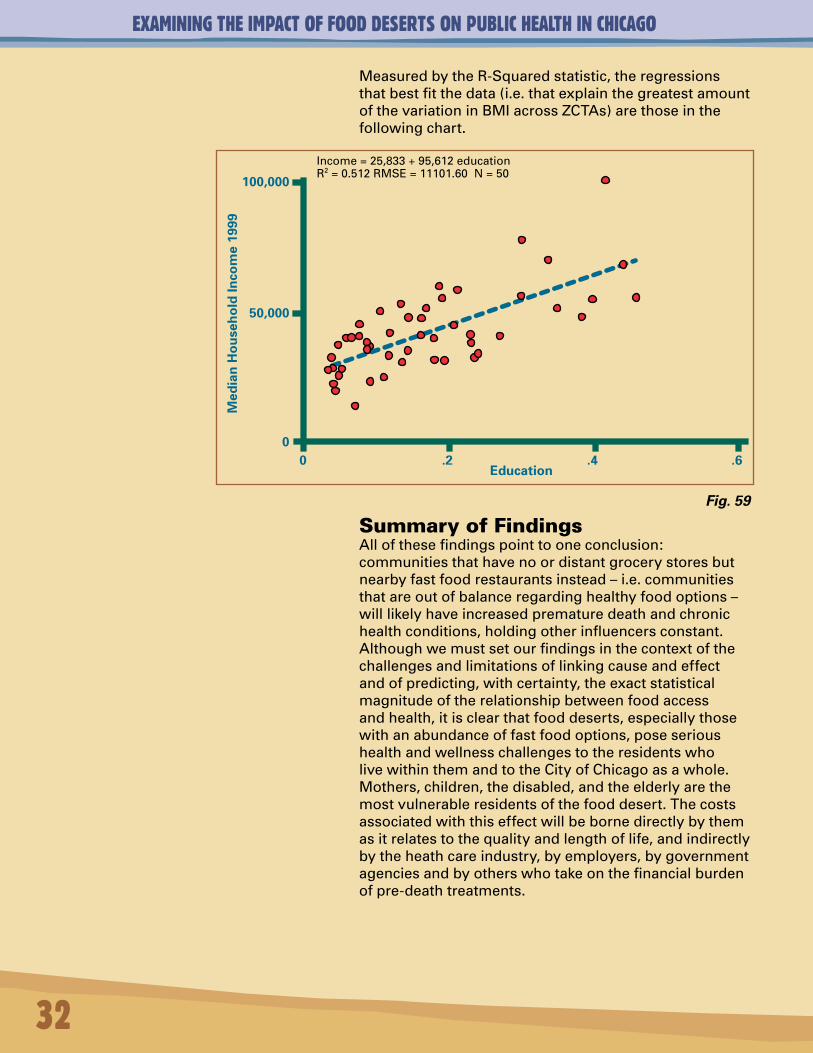
MeasuredbytheR-Squaredstatistic,theregressionsthatbestfitthedata(i.e.thatexplainthegreatestamountofthevariationinBMIacrossZCTAs)arethoseinthefollowingchart.
.60Education
.2 .40
50,000
100,000
Med
ian
Ho
use
ho
ldIn
com
e19
99
Income = 25,833 + 95,612 educationR2 = 0.512 RMSE = 11101.60 N = 50
SummaryofFindingsAllofthesefindingspointtooneconclusion:communitiesthathavenoordistantgrocerystoresbutnearbyfastfoodrestaurantsinstead–i.e.communitiesthatareoutofbalanceregardinghealthyfoodoptions–willlikelyhaveincreasedprematuredeathandchronichealthconditions,holdingotherinfluencersconstant.Althoughwemustsetourfindingsinthecontextofthechallengesandlimitationsoflinkingcauseandeffectandofpredicting,withcertainty,theexactstatisticalmagnitudeoftherelationshipbetweenfoodaccessandhealth,itisclearthatfooddeserts,especiallythosewithanabundanceoffastfoodoptions,poseserioushealthandwellnesschallengestotheresidentswholivewithinthemandtotheCityofChicagoasawhole.Mothers,children,thedisabled,andtheelderlyarethemostvulnerableresidentsofthefooddesert.Thecostsassociatedwiththiseffectwillbebornedirectlybythemasitrelatestothequalityandlengthoflife,andindirectlybytheheathcareindustry,byemployers,bygovernmentagenciesandbyotherswhotakeonthefinancialburdenofpre-deathtreatments.
Fig. 59
EXAMINING THE IMPACT OF FOOD DESERTS ON PUBLIC HEALTH IN CHICAGO
33
Author’s Comments, Conclusions and AcknowledgementsForsomeonewithastrongbackgroundinmarketdynamics,thestudyoffoodaccessasapathwaytocommunityhealthmightseematfirstglancelikeaprofessionalshift.Whatdrivesrealestatedevelopmentdecisions?Whatmakesagrocerystoreprojectcreditworthyintheeyesofitsfinanciers?Wherearetheuntappedbusinessopportunitiesinunderservedmarkets?Andhowdoesfoodavailabilitystealorextendproductivity,time,resources,andvitality?Inmanyminds,itisthislastquestionthatisoutofplaceintheset.YetasGeorgeKaplanpointsoutinhiseloquentForewordtothisreport,thelifeanddeathofanyrealestatedeal–andthelifeanddeathofmankind–arehighlyimpactedbythreethings:location,location,location.
Throughoutmyentirefirstcareerasacommunitydevelopmentpractitioner,Ilearnedhardlessonsaboutlocation.Infact,thereissomethingaboutlocationitselfthatbeckonscommunitydeveloperstobeginwith.LongagoImanagedacommercialstriponthefarSoutheastSideofChicagothathadanunsightly,sloping,vacantlotintheheartofthedistrict,strewnwithlitterandtires.Amanwaschaseddownandbeatentodeaththere.Apoliceman,thinkingbackontheincident,shookhisheadandsaidmatter-of-factly:“Thisisaprettybadlocation.”Itwas.Gangs.Drugs.Violence.Commercialdecay.Somethinghadtobedone.Workingwiththecommunity,weturnedthevacantlotintoagarden.Itsproutedflowers,vegetables,anartshow,andevenawedding.Forlotsofreasons,iteventuallyimprovedonthelocationradar,totheextentthatthelandbecamemorevaluableanddemandforitincreased.Theprivatesectorbuiltastorefrontonthesiteseveralyearslater,andthegardenwasnomore.Thelandreturnedtoitsintendedfunction.Incommunitydevelopment,andinneighborhoodmarkets,too,thecycleofboom,bustandrevivalisalwaysalocalcondition.
Itisthesamewithpublichealth.Locallandusedecisionsare,inmanyrespects,publichealthdecisions.Andwhileoneplotoflanddoesnotdirectlycauseeitherlifeordeath,orcommunityrevitalizationordecline,itcertainlycaninfluencethoseoutcomes.Asfarbackas1926,theSupremeCourtrenderedanopinionthatgovernmenthasaresponsibilitytopromoteandprotectpublichealth,andthatgovernmentcan,therefore,controllandusetothatend,whichtypicallyhappensthroughzoninglaws.Sotobeacommunityplannerandnotcareabouthealth,ortobeahealthofficialandnotcareaboutthebuiltenvironment,meansopportunitiesarelost.Butthereisanotherdimensionoflostopportunities:themarket.
Canthemarketdowellbydoingsomegood?Whynot?Ourstudyidentifiesahalfmillionpluspeoplewholiveinafooddesertwithnoordistantgrocerystoresbutnearbyaccesstofastfood.Asubstantialnumberofthemaresinglemothersandchildren.Myguessisthatwomen,morethananyoneelse,knowtheimportanceoffoodtostitchingtogetherthedelicatecontinuumoflife.Itisironicthatthesewomenarethemostdisenfranchisedfromthefoodmarketgiventhattheyprobablyvalueandunderstanditmorethananyotherconsumergroup.Foodisindeedourmostbasiccommondenominator,arguablymorethanhousingoranyothergood.Weallneedfoodregularlytolive,butourresponsetofoodasacommoditydiffers.Thecommunityhealthadvocatemightstresslocalneedsanddeficiencies,andnutritiousfoodasahumanright,whilemarketproponentsfocusonunitprices,salesvolume,profitmargins,andthecreditworthinessofthegrocerleaseholder.
EXAMINING THE IMPACT OF FOOD DESERTS ON PUBLIC HEALTH IN CHICAGO
Wearelivinginaworldofbiological,socialandeconomiccomplexity.RobertWright,inhisfascinatingbook,Nonzero: The Logic Of Human Destiny,talksabouthowthebestofthebest,evencompetitors,havecollaboratedovertimeinpursuitofmutualself-interestandbiological,socialandeconomicevolution–progress,assomewouldcallit.Inthisdayofinformation,technology,andmassproduction,afooddesertistheantithesisofprogress,andthecostsassociatedwithlivingwithinonewillbebornedirectlybythoseresidentsthroughtheirqualityandlengthoflife,andindirectlybythehealthcareindustry,byemployers,bygovernmentagencies,andbyotherswhotakeonthefinancialburdenofpre-deathtreatments.Therefore,wemightlookatfoodmarketsinunderservedareasthroughWright’sgametheorylenstoseehowamyriadgroupofactorsmightbandtogetherwithdistinctagendastomakethewheelturninanewway.Thiswouldbeprogressive,aswellassmart.
Grocerystorelocationsprovedinourstudytobeasignificantfactorinobesityoutcomes;thefartherthegrocerystore,thehighertheobesityrate.Thatpoorhealthoutcomescanbemoderatedbyaccesstofoodandtofoodbalanceisanimportantfinding.Translation:somethingcanbedoneaboutit.Thebuiltenvironmentconstitutesasetofdeliberatechoices:todevelop,subsidizeorfinanceagrocerystore–ornotto–happensbychoice,notbychance.
Onehundredbilliondollarsisasubstantialsumofmoneytospendeachyearonobesity.If5percentofthatwereinvestedingrocerystoredevelopmentpairedwithlocalcampaignsforhealthyeatingasananti-obesitysavingsmeasure,thatwouldgenerate$100millionperstatetoenhancethesustainabilityofnewbusinessopportunities.Small,mid-sizeandindependentgrocers–notjustchains–couldbethepointoffocus.
Cost-benefitscenariossuchastheseareworthyofexamination.Soisthefastfoodindustryintermsofitspotentialcontributionstoimprovedfoodaccess,foodchoiceandcommunityhealth.TosimplydemonizethefastfoodindustryforthenegativehealthoutcomesassociatedwiththeFoodBalanceEffectwouldbetomissseveralkeypoints.
First,thefastfoodindustryhasinvestedinareasotherwisedevoidoffoodoptions,whereasmanygrocersoverthelastfewdecadeshave,bycontrast,desertedtheseareas.Thefastfoodindustrydeliversahighlyconvenientandfillingjust-in-timefoodproductatalowpriceandisasourceofcommunityjobs.Itscompetitiveadvantageisimportantconsideringthatthefooddesertprimarilyconsistsofworkingfamiliesand,specificallyworkingmothers,whostrugglewiththepressureofmultiplechildren,multiplejobs,multiplebillsandmultiplelifestresses.Onlywithgreatnaivetécouldweassumethattheywouldspendalltheirtimecookingelaboratehealthymealsifonlygivenaccesstoagrocerystore.Furthermore,fastfoodoutletshaveflourishedinmarketsthatotherfoodvenuesandretailershavedesertedoravoided.Theyhaveachievedsustainabilityinthepuremarketsenseoftheword.Finally,thefastfoodindustryisevolving,albeitunderpressurefrombookslikeFast Food Nation,butevolvingnonethelessintoanewdimensionoffoodlinesthatincludehealthieroptionsandreducedsaturatedfatcontent.Thissuggeststhepotentialforforwardmovement,somethingbetter,progress.Lessimportantnowiswhatthefastfoodindustryhasbeen.Moreimportantarewhatitisbecoming,whatitcouldbecome,andhowtoimprovedatasystemstobettergaugemarketopportunitiesandcommunityhealthmovingforward.Asaformerpractitionerandnowaresearcherwhostillspendsconsiderabletimeconductingmarketanalysesandcommercialsiteassessments,Irepeatedlyseetheneedforimproveddatasystemsandbettermarketsizingmethods.Inurbanmicro-marketsespecially,“baddata”isakeyobstacletogrocerystoredevelopment.Withtherightskills,mindsetandresources,thiscanberemediedonamarket-by-marketbasis,butwhatcanbedonetomakeimproveddatasystemsmorewidelyavailableacrossmarketstoactorswhomakedevelopmentdecisionsandtocommunityleaderswhomonitorchange?
34
EXAMINING THE IMPACT OF FOOD DESERTS ON PUBLIC HEALTH IN CHICAGO
Thereareotherstrategicquestionsthatcanbeexploredaswell:
1) Whatcanthegroceryindustrylearnfromthefastfoodindustryinordertobettercompeteinunderservedmarkets?
2) Wouldfoundationsorothersprovidecreditenhancementtomakemid-sizeandindependentgrocersmoreviableinareasthatneedthem?
3)Canafranchiseofmicro-entrepreneursmimicsuccessfulcompaniessuchasPeaPodintheto-the-doordistributionofhealthyfooditems?Whatistheviabilityofmobilegrocerystores,suchasfruitandvegetabletrucksandevenbicyclecartsthatsellfreshsnacksandproduce?
4)Whatdoestheubiquitousvendingmachineindustryhavetoofferareasthatsufferfromfoodimbalance?Canpubliclyavailablevendingmachinesdispenseapples,low-fatyogurt,bagsofcarrotsandmultigrainbread,insteadofsodaandcandybars,andturnaprofit?Thisisafocusnowincertainpublicschoolsystemsacrossthecountry,butitcouldbeanopportunityeverywhere.
5) Individualswhoworkoftenspendmorethanhalfoftheirtimeawakeeachdayintheiremployers’environs.Byencouraginghealthyeatingandexerciseintheworkplace,canemployersincreaseemployeeproductivityandreducethecostsofemployer-supportedhealthcarecoverage?
6) Isa“foodliteracy”educationcampaignneeded?Doweallknowhowtoreadrecipesandfoodlabels,measureingredients,sizefoodportionsappropriately,cook,andmaintainhealthyfoodchoices?Foodliteracymightbeasimportantinsomecommunitiesasfinancialliteracy.Thetwocouldalsocomplementeachother.
7) Whatwouldshiftourcultureawayfromthetelevisionintothekitchen?Wouldbusyparents,particularlytime-pressuredsinglemothers,formcookingclubswherehealthyfoodispreparedinbulkandeaten,exchanged,orfrozenforlaterconsumption?Whatcancommunityorganizationsdotosupportandencouragehealthycookingandeatinghabits?
8)Last,whileeducationcampaignsarelaudable,isitdishonesttotellpeopletoeathealthyfoodsifthereisnorealisticplacenearbytoacquirethem?Thisbringsusfullcircletothecorechallengeathand:tobeabletochoosehealthyfoodsyoumustfirsthaveaccesstothem.Itallboilsdowntolocation.
Earlierinthisnarrative,Itoldthestoryoftheunsightlyvacantlotthatharboreddrugsandgangmembersanddiscouragedcommercialinvestment.Itwasaprettybadlocation.Thecommunitywasgalvanizedtoaction,andimprovementsweremade,butnotuntilamanwasbeatentodeaththere.
Knowingthatfoodimbalancestealslifeandvitalityfromcommunitiesandtheirresidentscanprovidethissameurgentcallforaction.Afirstbreath,thefinalone,andthedailyfoodthatsustainslifein-between,isacontinuumthateverymortalshares.Asweallneedtoeattolive,foodmightbetheunifyingthreadthattranscendsrace,place,class,andoutdateddevelopmentmodelsthatjustdon’tworkintheseunderservedcommunities.Identifyingmarketaswellasneeds-basedsolutionsthatpromoteaccesstonutritiousfoodsandhealthyfoodchoiceswillrequireinputandsupportfromthefooddesertresidentsthemselvesaswellasfromgrocers,banks,brokers,developers,planners,healthadvocates,educators,government,foundations–ultimatelyeveryone–toachieveevenamodestlevelofsuccess.
35
EXAMINING THE IMPACT OF FOOD DESERTS ON PUBLIC HEALTH IN CHICAGO
36
Examining the Impact of Food Deserts on Public Health in Chicagoassessesthelinkbetweenfoodimbalanceandthequalityandlengthoflife,andthequalityandcauseofdeath.Thisbodyofwork,anditscallforcollectiveactionandcommunitypartnership,wouldnothavebeenpossiblewithoutthegeneroussupportofLaSalleBank.I’mdeeplygratefultoLaSalleforunderwritingtheresearch,thereport,andtheforum,fortheirgracefulmannerofopeningnewdoorsinsupportoftheresearchwhilenotinterferingwithit,forconveningtheRoundtable,andfortheircouragetoexploreandhelpresolveasensitivecommunityhealthissuethathasrelevanceacrossurbanAmerica.LaSalle’sleadershiponthisprojectinChicagowillsetanewexamplenationwideforhowanontraditionalsetofactors–banks,theprivatesector,communitydevelopmentleaders,andothers–canaddressneighborhoodsustainabilitythroughthelensofcommunityhealthandwellness.Thiswillstrengthenbridgesacrossdiversedisciplinesand,moreimportantly,improveandextendlives.IamespeciallythankfulforthecontributionsandteamspiritprovidedbythefollowingLaSalleBankcolleagues:
RobertGrossinger,forchampioningtheprojectandprovidingitsvision.
LydiaMorken,forherday-to-dayprojectmanagementskills,hergentlenessandherstrengthtomakeitallhappen.
MaryLaraia,forhersupport,graceandinsights.
IlsaFlanagan,forhelpingusunderstandtheconnectionbetweencommunityhealthandsustainability.
DirkDonnel,forprovidingongoingsupportandenthusiasmthroughouttheproject.
MariaGuzman,forpleasantlydealingwithallmyphonecallsandemailsearlyintheprojectandforsoefficientlyhandlingmypaperwork.
AndreaLewis,forhermediasavvy,freshideasandsageadvice.
JaneBroski,MeganMeierandLaurenVidovich,fortheircapableworkonpublicrelations.
SharonMaddexforhermarketingandcommunicationsexpertiseandforhelpingdevelopattractiveandon-pointoutreachmaterials,includingthebeautifulforuminvitations,andPaulRohrforhissupportinmakingthathappen
CourtneyPakisandTracyCarlson,fororchestratinganoutstandingforumeventthatwillcatalyzenewfoodaccessopportunitiesinunderservedcommunities.
JamesMalone,forspearheadingtheFood DesertpagesonLaSalleBank’sWebsite,theWebcast,andothergreatideas.
JackieGieri,forherimportantworktodisseminatetheresearchfocusandfindingsinternallytoLaSalle’semployeecommunity.
OscarAndersonandNancyNord,fortheirwonderfuldesigncontributionsandforalwayslendingsupportwheneverneeded.
Andlast,butnotleast,NormanBobins,forputtingtogetherateamthatiscommittedtocommunity,communitysustainability,andprojectssuchasthisone.
IamalsogratefultotheentireteamattheLocalInitiativeSupportCorporation,forhostingtheForum,andfortheirsupportatthebeginningofmycareer,whentheyandtheSoutheastChicagoDevelopmentCommissionsponsoredmeinacommunity-focusedrealestatedevelopmenttrainingprogram,andyearslaterwhenLISCmadearecoverablepredevelopmentgrantwhichresultedinafull-servicegrocerystorein
EXAMINING THE IMPACT OF FOOD DESERTS ON PUBLIC HEALTH IN CHICAGO
anunderservedcommunityduringmytenureasexecutivedirectorforDevcorpNorth.TheexperienceandskillsthatIgainedthroughthesethreeorganizationsgreatlyimpactedmyorientationtocommunitydevelopment.
Regardingresearchcollaborators,notasinglepersonwasmoresupportivethanJosephFerrie,aneconomistatNorthwesternUniversity.Hisideas,expertisewithlargedatasets,statisticalmodels,andmappingsystems,andhands-oncontributionswereinstrumentaltotherigorofthemethodologyandthedeliverables,andtoourabilitytofinishtheprojectaheadofschedule.
IalsooweaworldofgratitudetoGeorgeKaplanoftheDepartmentofEpidemiologyattheUniversityofMichigan,forlendinghisworldclassreputationtotheproject,writingtheForewordtothereport,providingmentorship,andsufferingthroughreportdraftsandprovidingconstructivecomments.
JeffreyMorenoff,asociologistfromtheUniversityofMichigan,wastremendouslysupportiveinhiscontributionofdataofdirectobservationsofhealthstatisticsofarepresentativesampleofChicagoresidents.
KirstiBocskay,oftheChicagoDepartmentofPublicHealth,laboriouslyhelpedcalculatetheyearsofpotentiallifeloststatisticsaswellastabulateotherdatacriticaltotheproject’ssuccess.
DanielBlock,ofChicagoStateUniversityandtheNortheasternIllinoisFoodSecurityAssessment(fundedbytheChicagoCommunityTrust),wasakeycontributorofgrocerystoredata,andgenerouslyhelpedinformtheprojectthroughhisownresearch.MythanksalsotoLaDonnaRedmond,oftheInstituteforCommunityResourceDevelopment,who,alongwithmanyothersbeforeme,cutapathintounderstandingtheissuesoffoodinsecurityandnewopportunitiesforindependentgrocers.
SiimSööt,oftheUniversityofIllinoisatChicago,wasmostgraciousinsharingdriver’slicensedatafromwhichbodymassindex,ameasureofobesity,wascalculated.
TheCityofChicagosupportedthiseffortinnumerousways.LoriHealey,GinaCaruso,andFranSpencerfromtheChicagoDepartmentofPlanning&Developmentwereallextremelyhelpful,aswereTerryMason,JoeHarrington,andEricaSalemfromtheChicagoDepartmentofPublicHealth.IamespeciallyappreciativeofEricaformakingstacksofcommunityhealthfilesavailabletomeandforkindlyansweringmyendlessstreamofquestionsandrequestswhenshewasknee-deepinherownwork.AldermenMargaretLaurinoandMannyFloresalsoconvenedtheGrocerAccessTaskForcethatsetmanywheelsinmotion.
IamgratefultoMariaHibbs,ofthePartnershipforNewCommunities,andPeterSkosey,oftheMetropolitanPlanningCouncil,fortheirfriendshipandsupportofmyresearchonfoodaccess,andfortheirmanygooddeedstohelpChicagocommunities.
WilliamKling,ofAncelGlinkDiamondBush,hasbeenahelpfulandregularsupporterofmyresearchandhasconnectedmetonumerousresourcesandnewideas.
IamalsogratefultoSustainforitsworkaroundorganicandlocallygrownfood,andtoLynnPeemoellerforhercreativeideasaroundmobilegrocerystores.
WandaWhite-Gills,ofTeamworkEnglewood,generouslymadeherselfavailableasasoundingboard,bringinganimportantcommunityvoicetothediscussion.
PeterTatian,oftheUrbanInstitute,NationalNeighborhoodIndicatorsPartnership,generouslyhelpedconnecttheprojecttoanationalaudiencethatispassionateaboutthe“democratizationofdata”andwaystouseimproveddatasystemstohelpsupportunderservedneighborhoodsandtheirresidents.
37
EXAMINING THE IMPACT OF FOOD DESERTS ON PUBLIC HEALTH IN CHICAGO
38
JohnBeskeofJohnBeskeCommunicationswasresponsibleforabeyondimpressivereportillustration,whichhecompletedinrecordtime,andwhichbringsotherwisecomplicatedinformationtolife.I’malsothankfultoMarilynMarkleforhercreativecontributionstothereport’scover.
ThisreportwasalsoimprovedbycontributionsfromG.LamontBlackstone,ofG.L.Blackstone&Associates,LindaGoodman,ofGoodmanWilliams,LeonardHarris,ofChathamFoods,MattLongjohn,LaraJones,andChristyKeirig,oftheConsortiumtoLowerObesityinChicagoChildren,MaryLudgin,headofHeitman’sU.S.PrivateRealEstateGroup,LarryLund,ofRealEstatePlanningGroup,RuthRothstein,ofRosalindFranklinUniversityofMedicineandScience,MargieSchaps,ofHealth&MedicinePolicyResearchGroup,CynthiaStewart,oftheInternationalCouncilofShoppingCenters,andJohnSweeney,ofJPSInterests.
Finally,anacknowledgementofourForumFriends,whoprovidedinvitationlists,advice,andotherassistanceinthedevelopmentoftheforum.
•ChicagoDepartmentofPlanning&Development
•ChicagoDepartmentofPublicHealth
•ChicagoFoodSystemsCollaborative
•ConsortiumtoLowerObesityinChicagoChildren
•TheFoodTrust
•Health&MedicinePolicyResearchGroup
•InternationalCouncilonShoppingCenters
•InstituteforCommunityResourceDevelopment
•MetropolitanPlanningCouncil
•NortheasternIllinoisCommunityFoodSecurityAssessment
•UrbanInstitute,NationalNeighborhoodIndicatorsPartnership
MygratitudeagaintoLaSalleBankformakingthisteameffortpossible.WehopethisstudycontributestothehealthofallChicagoans.
Weinviteyourfeedbackandparticipationmovingforward.
MariGallagher,PrincipalMariGallagherResearch&ConsultingGroup1929WestPattersonChicago,IL60613(312)[email protected]
EXAMINING THE IMPACT OF FOOD DESERTS ON PUBLIC HEALTH IN CHICAGO
39
1. Department of Health and Human Services (U.S.) Healthy People 2010. Volume I. Washington: DHHS. November 2000.
2. Village of Euclid v. Ambler Realty Co., 272 U.S. 365 (1926) (USSC+).
3. Creating a Healthy Environment: The Impact of the Built Environment on Public Health. Richard Jackson, MD, MPH, Chris Kochtitzky.
4. American Dietetic Association Final Report of Findings. Prepared by Wirthlin Worldwide. 2002.
5. Child Trends DataBank: Overweight Children and Youth. March 10, 2006. Online.
6. The Influence of Community Factors on Health. A Policy Link Report. Fall, 2004.
7. “Supersizing America: Obesity Becomes an Epidemic.” Martha Coventry. UMNews. Winter, 2004.
8. “Solving the Problems of the Iowa Food Deserts: Food Insecurity and Civic Structure.” Lois Wright Morton, Ella Annette Bitto, Mary Jane Oakland, Mary Sand. Rural Sociology. 2005.
9. “Survey tracks trends in children’s dietary habits.” USDA/ARS Children’s Nutrition Research Center at Baylor College of Medicine. March, 2006.
10. “Obesity in the US.” American Obesity Association. AOA Fact Sheets. March, 2006.
11. U.S. Department of Labor Grocery Store Fact Sheet. April, 2006.
12. “Food Companies Criticized Over Health Commitments.” Kate Holton. Reuters. April, 2006.
13. “The Availability and Cost of Healthier Food Alternatives.” Karen Jetter and Diana Cassady. American Journal of Preventative Medicine. 2006; 30 (1)
14. Community Food Systems. MSU Urban and Regional Planning. Winter, 2004.
15. “ Neighborhood Health and Self-Reported Health Status: A Multilevel Analysis.” American Journal of Public Health. August, 1999.
16. Food Redlining: A Hidden Cause of Hunger. Tolerance in the News. March, 2006.
17. Neighborhoods and Health. American Medical Association. 2003.
18. “Is Economic Policy Health Policy?” American Journal of Epidemiology. 91, 351-3. Kaplan, G.A., Lynch, J.W. (2001).
19. “Land Use Planning and the Control of Alcohol, Tobacco, Firearms, and Fast Food Restaurants.” American Journal of Public Health. September, 2003.
20. The Need for More Supermarkets in Philadelphia: Food for Every Child.
21. “Local Services and Amenities, Neighborhood Social Capital, and Health.” Andrea Altschuler, Carole Somkin, and Nancy Adler. Social Science and Medicine. 2004.
22. “How Neighborhoods and Physical Functioning Are Related: The Roles of Neighborhood Socioeconomic Status, Perceived Neighborhood Strain, and Individual Health Risk Factors.” The Society of Behavioral Medicine. 2004.
23. “Social Sources of Racial Disparities in Health.” David Williams and Pamela Braboy Jackson. Health Affairs. 2005.
24. “Neighborhood Physical Conditions and Health.” American Journal of Public Health. March, 2003.
25. “Investigating Neighborhood and Area Effects on Health.” American Journal of Public Health. November, 2001.
26. “Maximum or Minimum Differentiation? Location Patterns of Retail Outlets.” The Review of Economics and Statistics. February, 2002.
27. “Fat land: Supersizing America.” The New York Times. January 12, 2003.
28. “Fast Food Linked to Child Obesity.” CBS News. January 5, 2003.
29. “Just Enough for You: About Food Portions.” U.S. Department of Health and Human Services and National Institutes of Health. No date.
30. “Prevalence of Overweight Among Children and Adolescents: United States, 1999-2002.” National Center for Health Statistics. March, 2006.
31. “Childhood Obesity in the United States: Facts and Figures.” Institute of Medicine. September, 2004.
32. “ Neighborhood Effects on Health: Exploring the Links and Assessing the Evidence.” Journal of Urban Affairs. Vol. 23. 2001.
33. “The Impact of the Built Environment On Health: An Emerging Field.” American Journal of Public Health. September, 2003.
34. “Racial Disparities in Self-Reported Health at Older Ages: What Difference Does The Neighborhood Make?” Journal of Gerontology. 2005.
35. “Built Environment: Healthy Communities, Healthy Homes, Healthy People.” Research Triangle Park. 2002.
36. “Developing Successful Retail in Underserved Urban Markets.” International Council of Shopping Centers. 2004.
37. “Food, Markets, and Healthy Communities: How Food Stores Accelerate Local Development and Enrich Residents’ Lives.” Local Initiatives Support Corporation (national), Tony Proscio, and MetLife Foundation, 2006.
38. “Healthy Food, Healthy Communities: Improving Access and Opportunities Through Food Retailing.” Policy Link and California Endowment. 2005.
39. “Obesity Epidemic Continues to Worsen in the United States.” Healthcare News. HarrisInteractive. March, 2006.
40. “Childhood Obesity: Costs, Treatment Patterns, Disparities in Care, and Prevalent Medical Conditions.” Thomson Medstat Research Brief.
41. “Prevalence of Overweight and Risk of Overweight Children Among 3-to-5-Year-Old Chicago Children, 2002-2003.” Journal of School Health. March, 2006.
42. “Childhood Obesity: Examining the Evidence.” ACOFP. March, 2006.
43. “Childhood Obesity on the Rise.” World on Health. June, 2002.
44. “Obesity in Youth.” American Obesity Association. March, 2006.
45. “Life After Webvan.” RED Herring. The Business of Technology. May, 2006.
46. “The Demand for Food Away From Home: Full Service or Fast Food.” ERS Research Brief. January, 2004.
47. “Patterns and Trends in Food Portion Sizes, 1977-1998.” JAMA. March, 2006.
48. “Neighborhood Racial Composition, Neighborhood Poverty, and the Spatial Accessibility of Supermarkets in Metropolitan Detroit.” Research and Practice. April, 2005.
49. “Life in the Fast Food Lane.” Chicago Tribune Magazine. March 5, 2006.
Bibliography
ReportauthoredbyMariGallagherResearch&ConsultingGroup1929WestPattersonChicago,IL60613(312)339-0640www.marigallagher.com©copyright2006MariGallagher
SponsoredbyLaSalleBanklasallebank.com(312)904-2866
Printed on 100% PC Recycled Paper
Paper Manufactured Using Wind Power