Embed Size (px)
Citation preview

The Newark Public Schools
Scope and Sequence: Grade 7 Mathematics Units 1-9
2012-2013
Office of Mathematics

Grade 7 Common Core State Standards Scope and Sequence…Page 1
OFFICE OF MATHEMATICS
Tina Powell – Mathematics Director Paul Oliveira – Mathematics Supervisor
WRITING COMMITTEE
Tina Powell ............................................................................................................................................................................................ Director of Mathematics
Paul Oliveira ................................................................................................................................................................................................................ Supervisor
Michele Albruzzese .......................................................................................................................................................................................................... Teacher
Tracy Blazquez ................................................................................................................................................................................................................ Teacher
Chiffon Brown ................................................................................................................................................................................................................. Teacher
Thalia Brownridge-Smith ................................................................................................................................................................................................. Teacher
John Capparelli ............................................................................................................................................................................................................... Teacher
Ivone Cardoso .................................................................................................................................................................................................................. Teacher
Darlene DeVries ............................................................................................................................................................................................................... Teacher
Whitney Farrand .............................................................................................................................................................................................................. Teacher
Correl Heron .................................................................................................................................................................................................................... Teacher
Joseph Hrdina .................................................................................................................................................................................................................. Teacher
Genell Jackson ................................................................................................................................................................................................................. Teacher
Sheyla Jannah.................................................................................................................................................................................................................. Teacher

Grade 7 Common Core State Standards Scope and Sequence…Page 2
Writing Committee continued:
Chanda Jones-Williams .................................................................................................................................................................................................... Teacher
Melissa Lisanti ................................................................................................................................................................................................................. Teacher
Susette Martins ............................................................................................................................................................................................................... Teacher
Jennifer Padilla ................................................................................................................................................................................................................ Teacher
Amy Panitch .................................................................................................................................................................................................................... Teacher
Coralie Peary ................................................................................................................................................................................................................... Teacher
Tracey Pereda.................................................................................................................................................................................................................. Teacher
Daniel Ramirez ................................................................................................................................................................................................................ Teacher
Deborah Richardson ........................................................................................................................................................................................................ Teacher
Yolanda Smith ................................................................................................................................................................................................................. Teacher
Doreen Williams-Brown ................................................................................................................................................................................................... Teacher

Grade 7 Common Core State Standards Scope and Sequence…Page 3
SEMESTER ONE
UNIT VOCABULARY
IN-DEPTH OPPORTUNITIES
7.NS.3 7.RP.2 7.EE.3 7.EE.4 7.G.6
UNIT 1:
RATIONAL NUMBERS
Addition and Subtraction of
negative and positive numbers
Horizontal Articulation
Suggested Support/Review
Standards
6.NS.5 [rational numbers]
6.NS.6a [opposites]
6.NS.7c [absolute value]
Standards Description Days Resources
7.NS.1 Apply and extend previous understandings of addition and subtraction
to add and subtract rational numbers; represent addition and
subtraction on a horizontal or vertical number line diagram.
a. Describe situations in which opposite quantities combine to
make 0. For example, a hydrogen atom has 0 charge because
its two constituents are oppositely charged.
b. Understand p + q as the number located a distance |q| from
p, in the positive or negative direction depending on
whether q is positive or negative. Show that a number and
its opposite have a sum of 0 (are additive inverses).
Interpret sums of rational numbers by describing real-world
contexts.
c. Understand subtraction of rational numbers as adding the
additive inverse, p – q = p + (–q). Show that the distance
between two rational numbers on the number line is the
absolute value of their difference, and apply this principle in
real-world contexts.
d. Apply properties of operations as strategies to add and
subtract rational numbers.
Module 7.NS.1
opposite
positive
negative
additive inverse
absolute value
rational number
Properties of Operations
Pac
ing
to b
e d
eter
min
ed a
t th
e sc
ho
ol l
eve
l
Grade 7 Common Core State Standards Scope and Sequence…Page 4
LESSON PLANNING
UNIT 1:
RATIONAL NUMBERS
Addition and Subtraction of
negative and positive
numbers
Recommended
Technologies:
Course Proficiencies Textbook Alignment Multiple
Representations
Comments
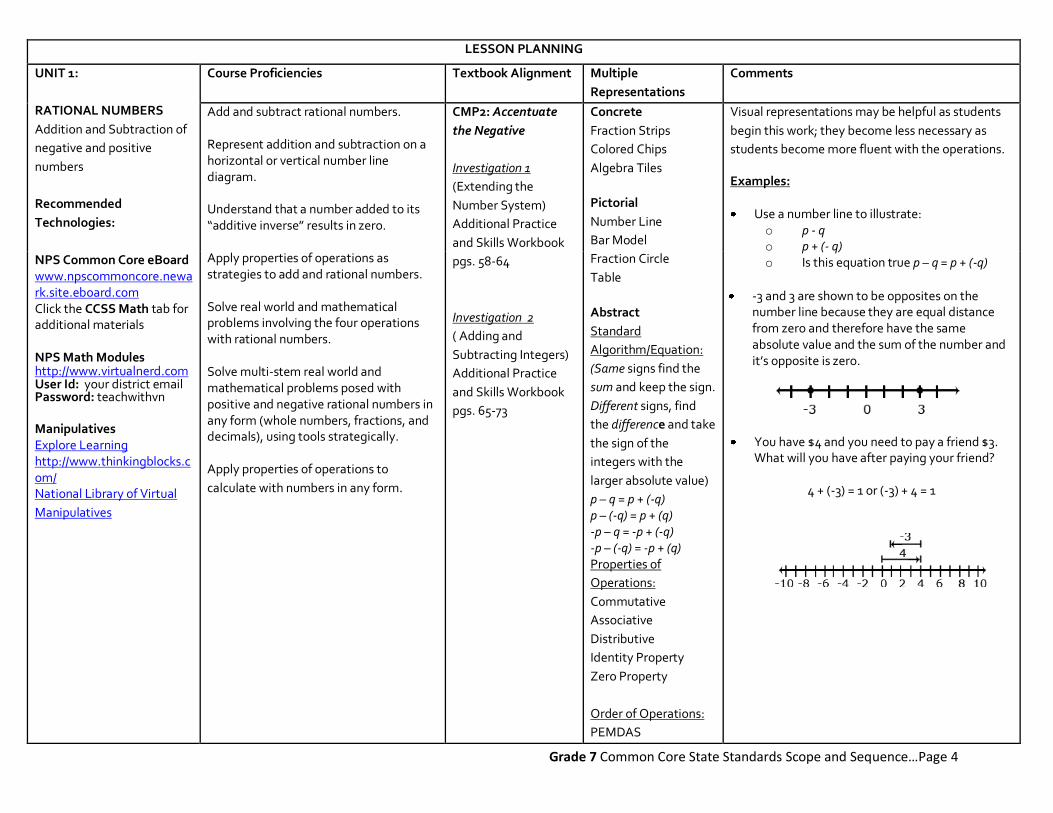
Add and subtract rational numbers. Represent addition and subtraction on a horizontal or vertical number line diagram. Understand that a number added to its “additive inverse” results in zero. Apply properties of operations as strategies to add and rational numbers. Solve real world and mathematical problems involving the four operations with rational numbers. Solve multi-stem real world and mathematical problems posed with positive and negative rational numbers in any form (whole numbers, fractions, and decimals), using tools strategically. Apply properties of operations to
calculate with numbers in any form.
CMP2: Accentuate
the Negative
Investigation 1
(Extending the
Number System)
Additional Practice
and Skills Workbook
pgs. 58-64
Investigation 2
( Adding and
Subtracting Integers)
Additional Practice
and Skills Workbook
pgs. 65-73
Concrete
Fraction Strips
Colored Chips
Algebra Tiles
Pictorial
Number Line
Bar Model
Fraction Circle
Table
Abstract
Standard
Algorithm/Equation:
(Same signs find the
sum and keep the sign.
Different signs, find
the difference and take
the sign of the
integers with the
larger absolute value)
p – q = p + (-q) p – (-q) = p + (q) -p – q = -p + (-q) -p – (-q) = -p + (q) Properties of
Operations:
Commutative
Associative
Distributive
Identity Property
Zero Property
Order of Operations:
PEMDAS
Visual representations may be helpful as students
begin this work; they become less necessary as
students become more fluent with the operations.
Examples:
Use a number line to illustrate: o p - q o p + (- q) o Is this equation true p – q = p + (-q)
-3 and 3 are shown to be opposites on the number line because they are equal distance from zero and therefore have the same absolute value and the sum of the number and it’s opposite is zero.
You have $4 and you need to pay a friend $3. What will you have after paying your friend?
4 + (-3) = 1 or (-3) + 4 = 1
NPS Common Core eBoard www.npscommoncore.newark.site.eboard.com Click the CCSS Math tab for additional materials NPS Math Modules http://www.virtualnerd.com User Id: your district email Password: teachwithvn Manipulatives Explore Learning http://www.thinkingblocks.com/ National Library of Virtual
Manipulatives
To be
determined at
the school
level

Grade 7 Common Core State Standards Scope and Sequence…Page 5
SAMPLE DEMONSTRATIONS OF LEARNING (DOLS)
Conceptual Understanding
How do the properties of whole numbers extend to the addition and subtraction of rational numbers?
Procedural Fluency
Solve: 2/5 – 5/7 + 4/7 =
Application
Louis was doing a science experiment about temperature. He first measured the temperature of some water and found it was 17°C. Then he put the water in the freezer and recorded the temperature two hours later. It had fallen to -11°C. What was the change in temperature in two hours? What was the average rate of temperature change per hour? Show your work.
Connected Mathematics Program 2 Correlated Assessments Additional Assessments Resources
Accentuate The Negative Partner Quiz
Accentuate The Negative Question Bank
Formative Assessments: http://njctl.org/courses/math/7th-grade/number-system/number-system-7th-grade/
Summative Assessments: http://www.state.nj.us/education/modelcurriculum/math/7u1.shtml

Grade 7 Common Core State Standards Scope and Sequence…Page 6
UNIT VOCABULARY
IN-DEPTH OPPORTUNITIES
7.NS.3 7.RP.2 7.EE.3 7.EE.4 7.G.6
UNIT 2:
RATIONAL NUMBERS
Multiplication and Division of negative and
positive numbers; Solving real-world
mathematical problems.
Horizontal Articulation
Suggested Support/Review Standards
5.NF.3 [fractions]
5.NF.4a [multiplication]
6.NS.1 [division of fractions]
UNIT 1 AND 2 ASSESSMENT
AVAILABLE
Standards Description Days Resources
7.NS.2 Apply and extend previous understandings of multiplication and
division and of fractions to multiply and divide rational numbers.
a. Understand that multiplication is extended from fractions
to rational numbers by requiring that operations continue
to satisfy the properties of operations, particularly the
distributive property, leading to products such as (–1)(–1) =
1 and the rules for multiplying signed numbers. Interpret
products of rational numbers by describing real-world
contexts.
b. Understand that integers can be divided, provided that the
divisor is not zero, and every quotient of integers (with non-
zero divisor) is a rational number. If p and q are integers,
then –(p/q) = (–p)/q = p/(–q). Interpret quotients of rational
numbers by describing real-world contexts.
c. Apply properties of operations as strategies to multiply and
divide rational numbers.
d. Convert a rational number to a decimal using long division;
know that the decimal form of a rational number
terminates in 0s or eventually repeats.
7.NS.3
Solve real-world and mathematical problems involving the four
operations with rational numbers. (NOTE: Computations with rational
numbers extend the rules for manipulating fractions to complex
fractions.)
operations properties rational numbers
Pac
ing
to b
e d
eter
min
ed a
t th
e sc
ho
ol l
eve
l
Grade 7 Common Core State Standards Scope and Sequence…Page 7
LESSON PLANNING
UNIT 2:
RATIONAL NUMBERS
Multiplication and Division of
negative and positive numbers;
Solving real-world mathematical
problems
Course Proficiencies Textbook Alignment Multiple
Representations
Comments
Multiply and divide rational numbers. Explain products of rational numbers by describing real world situations. Understand that all integers can be divided provided the divisor is not zero, and that the quotient will be a rational number. Convert a rational number to a decimal by using long division. Solve real world and mathematical problems involving the four operations with rational numbers. Solve multi-stem real world and mathematical problems posed with positive and negative rational numbers in any form (whole numbers, fractions, and decimals), using tools strategically. Apply properties of operations to calculate with numbers in any form. Convert between forms as
appropriate, and assess the
reasonableness of answers using
mental computations and
estimation strategies.
CMP2: Accentuate the
Negative
Investigation 3
(Multiplying and
Dividing Integers)
Additional Practice and
Skills Workbook
pgs.74-78
Investigation 4
(Properties of
Operations)
Additional Practice and
Skills Workbook
pgs.79-82
Concrete
Fraction Strips
Colored Chips
Algebra Tiles
Pictorial
Number Line
Bar Model
Fraction Circle
Tabular Representation
Abstract
Algorithm:
(Same signs will give you
a positive product or
quotient. Different signs
will give you a negative
product or quotient)
-(p/q) = (-p)/q = p/(-q)
When “p” is not equal to
zero
Properties of Operation:
Commutative
Associative
Distributive
Identity Property
Zero Property
Order of Operations:
PEMDAS
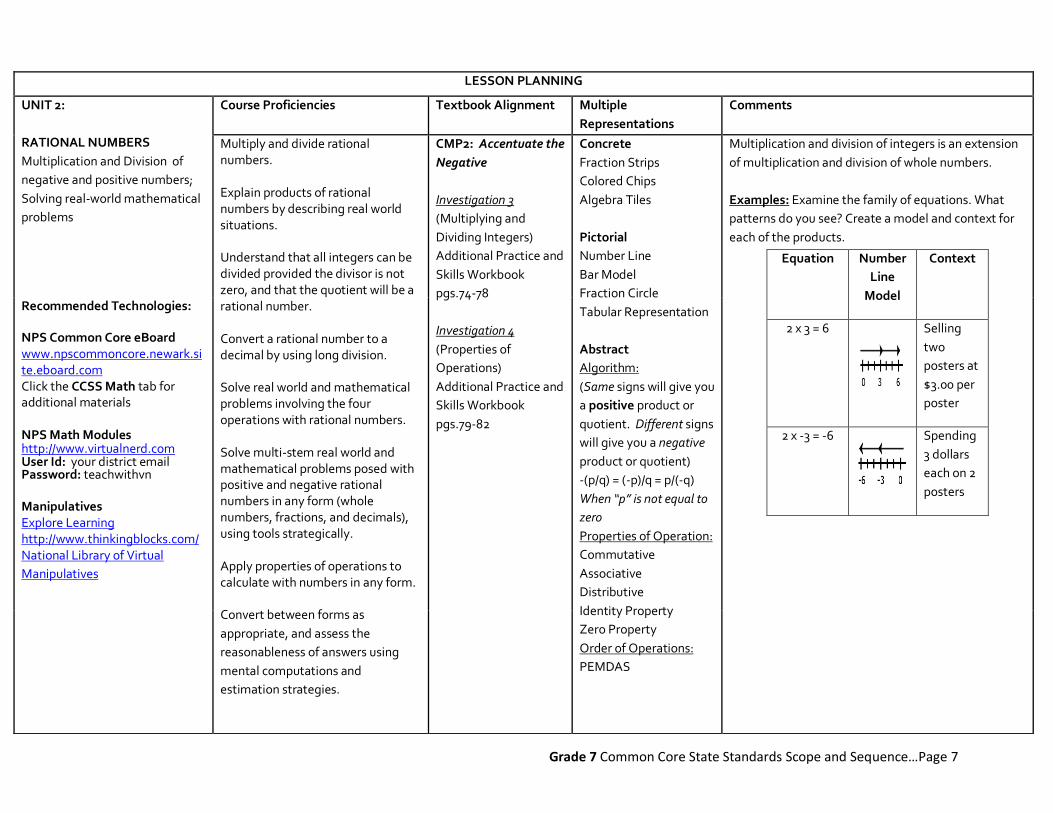
Multiplication and division of integers is an extension
of multiplication and division of whole numbers.
Equation Number
Line
Model
Context
2 x 3 = 6
Selling
two
posters at
$3.00 per
poster
2 x -3 = -6
Spending
3 dollars
each on 2
posters
Examples: Examine the family of equations. What
patterns do you see? Create a model and context for
each of the products.
Recommended Technologies: NPS Common Core eBoard www.npscommoncore.newark.site.eboard.com Click the CCSS Math tab for additional materials NPS Math Modules http://www.virtualnerd.com User Id: your district email Password: teachwithvn Manipulatives Explore Learning http://www.thinkingblocks.com/ National Library of Virtual
Manipulatives
To be
determined at
the school
level

Grade 7 Common Core State Standards Scope and Sequence…Page 8
SAMPLE DEMONSTRATIONS OF LEARNING (DOLS)
Conceptual Understanding
Using only one cut, how would you divide 7 pieces of licorice among 5 people so that each person gets the exact same amount of licorice without bending the licorice without bending the licorice?
Show your work using drawings, numbers and words.
Explain your strategy for solving the problem.
Verify your answer another way.
Procedural Fluency
Solve:
a. 161.18 7.8 = b. 2 ½ x 7 ½ =
Application
The Herms family takes their sailboat to an island in a nearby lake for a picnic. The island is 6 miles from shore. It takes the family 3/4 hour to sail to the island and only 2/5 of an hour to sail back to shore with a stronger wind. What was the family’s average rate of sailing speed (miles per hour) for the entire trip?
Connected Mathematics Program 2 Correlated Assessments Additional Assessments Resources
Accentuate The Negative Partner Quiz
Accentuate The Negative Multiple Choice Items
Accentuate The Negative Question Bank
Accentuate The Negative Unit Test
Formative Assessments: http://njctl.org/courses/math/7th-grade/number-system/number-system-7th-grade/
Summative Assessments: http://www.state.nj.us/education/modelcurriculum/math/7u1.shtml

Grade 7 Common Core State Standards Scope and Sequence…Page 9
UNIT VOCABULARY
IN-DEPTH OPPORTUNITIES
7.NS.3 7.RP.2 7.EE.3 7.EE.4 7.G.6
UNIT 3: UNIT RATES Understanding and Applying Unit Rates. Horizontal Articulation Suggested Support/Review Standards Standards6.RP.2 [ratios]
Standards Description Days Resources
7.RP.1
Compute unit rates associated with ratios of fractions, including ratios
of lengths, areas and other quantities measured in like or different
units. For example, if a person walks 1/2 mile in each 1/4 hour, compute
the unit rate as the complex fraction (1/2)/(1/4) miles per hour,
equivalently 2miles per hour.
common denominator
equation
equivalent
equivalent ratios
proportion
ratio
unit rate
Pac
ing
to b
e d
eter
min
ed a
t th
e sc
ho
ol l
eve
l

Grade 7 Common Core State Standards Scope and Sequence…Page 10
LESSON PLANNING
UNIT 3 UNIT RATES Understanding and Applying Unit Rates Horizontal Articulation Suggested Support/Review Standards Standards6.RP.2 [ratios] Recommended Technologies: NPS Common Core eBoard www.npscommoncore.newark.site.eboard.com Click the CCSS Math tab for additional materials NPS Math Modules http://www.virtualnerd.com User Id: your district email Password: teachwithvn Manipulatives Explore Learning http://www.thinkingblocks.com/ National Library of Virtual Manipulatives
Course Proficiencies Textbook
Alignment
Multiple
Representations
Comments
Use ratios of lengths, areas and other quantities to compute unit rates associated with ratios of fractions. Convert between forms as appropriate, and assess the reasonableness of answers using mental computations and estimation strategies. Compute actual
lengths and areas of a
geometric figure from
scale drawings and
reproductions of the
figure.
CMP2: Comparing
and Scaling
Investigation 1
(Strategies for
Representing
Quantitative
Comparisons)
Additional Practice
and Skills
Workbook pgs. 39-
43
Investigation 2
(Comparing Ratios,
Percents, and
Fraction)
Additional Practice
and Skills
Workbook pgs. 44-
47
Investigation 3
(Comparing and
Scaling Rates)
Additional Practice
and Skills
Workbook pgs. 48-
53
Concrete
Partitioning with
manipulatives
Pictorial
Fraction Strips
(Tape Diagrams)
Double Line
Diagrams
Tabular
Representation
Graphing
Abstract
Scale Factor
(within and
between)
Iteration
Algorithm
Part/Whole
Relationship
Part/Part
Relationship
Connected Mathematics Programs 2 does not address unit rates in the 6
th grade CMP2 books.
Therefore, visit the sites below for horizontal articulation tasks. http://illustrativemathematics.org/standards/k8 http://insidemathematics.org/common-core-math-tasks/6thgrade/6-2007%20Candies.pdf http://insidemathematics.org/commmon-core-math-tasks/6th-grade/6-2009%20Truffles.pdf Ratios arise in situations in which two (or more) quantities are related. Sometimes the quantities have the same units (e.g., 3 cups of apple juice and 2 cups of grape juice), other times they do not (e.g., 3 meters and 2 seconds). To distinguish ratios and rates, using the term “ratio” when units are the same and “rate” when units are different. Rates arise in situations in which two (or more) different quantities are related. Examples: “3 cups of flour for every 2 eggs” or “3 meters in 2 seconds”
To be
determined at
the school
level

Grade 7 Common Core State Standards Scope and Sequence…Page 11
SAMPLE DEMONSTRATIONS OF LEARNING (DOLS)
Conceptual Understanding Create a table of values for the following scenarios. Ryan is making a fruit drink. The directions say to mix 5 cups of water with 2 scoops of powdered fruit mix. How many cups of water should he use with 9 scoops of fruit mix?
Teaching Tips:
Procedural Fluency
Solve: a. A 2.6 kg bag of carrots for $7.05= ____ per kg b. $17.40 for 12 hours = _____ per hour c. 70 chairs in 5 rows = _____ in each row
Teaching Tips:
Application
Kell works at an after-school program at an elementary school. The table below shows how much money he earned every day last week.
Monday Wednesday Friday
Time Worked
1.5 hours 2.5 hours 4 hours
Money Earned
$12.60 $21.00 $33.60
Mariko has a job mowing lawns that pays $7 per hour.
a. Create a similar table of values for Mariko. Who would make more money for working 10 hours? Explain or show work.
b. Graph of the proportional relationship between the two quantities.
c. Generate the equation that represents the two quantities.
d. How does the constant of proportionality (-ies) help you understand who has the better paying job?
Connected Mathematics Program 2 Assessments Additional Assessment Resources
Comparing and Scaling Check Up
Comparing and Scaling Partner Quiz
Comparing and Scaling Multiple Choice Items
Comparing and Scaling Question Bank
Comparing and Scaling Unit Test
Formative Assessments: http://njctl.org/courses/math/7th-grade/ratios-proportions/ratios-proportions-7th-grade-2/

Grade 7 Common Core State Standards Scope and Sequence…Page 12
UNIT VOCABULARY
IN-DEPTH OPPORTUNITIES
7.NS.3 7.RP.2 7.EE.3 7.EE.4 7.G.6
UNIT 4:
PROPORTIONAL REASONING AND
RELATIONSHIPS
Rates, Ratios, and Percents, and
Estimating
Horizontal Articulation
Suggested Support/Review Standards
6.RP.2 [ratios]
6.RP.3 [application of rates]
7.NS.1 [+/- rational numbers]
7.NS.2 [x/ rational numbers]
7.NS.3 [application of rational #s]
UNIT 3 AND 4 ASSESSMENT
AVAILABLE
Standards Description Days Resources
7.RP.2 Recognize and represent proportional relationships between quantities. a. Decide whether two quantities are in a proportional
relationship, e.g., by testing for equivalent ratios in a table or graphing on a coordinate plane and observing whether the graph is a straight line through the origin.
b. Identify the constant of proportionality (unit rate) in tables, graphs, equations, diagrams, and verbal descriptions of proportional relationships.
c. Represent proportional relationships by equations. For example, if total cost t is proportional to the number n of items purchased at a constant price p, the relationship between the total cost and the number of items can be expressed as t = pn.
d. Explain what a point (x, y) on the graph of a proportional relationship means in terms of the situation, with special attention to the points (0, 0) and (1, r) where r is the unit rate.
Module
7.RP.1-2
7.RP.3 Use proportional relationships to solve multistep ratio and percent
problems. Examples: simple interest, tax, markups and
markdowns, gratuities and commissions, fees, percent increase and
decrease, percent error.
Module
7.NS.2-3;
RP.3
7.EE.3
Solve multi-step real-life and mathematical problems posed with
positive and negative rational numbers in any form (whole numbers,
fractions, and decimals), using tools strategically. Apply properties of
operations to calculate with numbers in any form; convert between
forms as appropriate; and assess the reasonableness of answers using
mental computation and estimation strategies.
equivalent ratio
proportion
ratio commission
fee
gratuity (tax)
percent of change
percent of decrease
percent of increase
principal
sales tax
scale drawing
simple interest
Pac
ing
to b
e d
eter
min
ed a
t th
e sc
ho
ol l
eve
l

Grade 7 Common Core State Standards Scope and Sequence…Page 13
LESSON PLANNING
UNIT 4:
PROPORTIONAL REASONING AND
RELATIONSHIPS
Rates, Ratios, and Percents, and Estimating
Horizontal Alignment
Suggested Support/Review Standards
6.RP.2 [ratios]
6.RP.3 [application of rates]
7.NS.1 [+/- rational numbers]
7.NS.2 [x/ rational numbers]
7.NS.3 [application of rational #s]
Vertical Alignment
8.EE.5 [graphing relationships]
8.EE.7 [Linear Equations]
8.EE.8 [Simultaneous Linear Equations]
Recommended Technologies: NPS Common Core eBoard www.npscommoncore.newark.site.eboard.com Click the CCSS Math tab for additional materials NPS Math Modules http://www.virtualnerd.com User Id: your district email Password: teachwithvn Manipulatives Explore Learning http://www.thinkingblocks.com/ National Library of Virtual Manipulatives
Course Proficiencies Use ratios of lengths, areas and other quantities to compute unit rates associated with ratios of fractions. Recognize and represent proportional relationships between quantities. Identify a constant of proportionality. Represent proportional relationships by equations. Solve multi-step ratio and percent problems.
Textbook
Alignment
Comparing and Scaling Investigation 1 Making Comparison Investigation 2 Comparing Ratios, Percent, and Fractions Investigation 3 Comparing and Scaling Rates Investigation 4 Making Sense of Proportions Moving Straight Ahead Investigation 1 Walking rates Investigation 2 Exploring Linear Functions with graphs and Tables Investigation 3
Solving Equation
Investigation 4
Exploring Slope
Variables and Patterns Investigation 1
Variables, Tables,
and Coordinate
Graphs
Investigation 2 Analyzing Graphs and Tables
Multiple
Representations
Concrete
Bar Models
Paper Strips
Number Lines
Pictorial
Table
representation
Graphical
representation
Abstract
Finding the
Unit
Rate/Constant
of
Proportionality
Simplifying
Rates
Setting up a
Proportion
Creating an
Equation
Comments
The constant of proportionality is
shown in the first column of the table
and by the slope of the line on the
graph.
A common error is to reverse the position of the variables when writing equations. Students may find it useful to use variables specifically related to the quantities rather than using x and y. Constructing verbal models can also be helpful. A student might describe the situation as “the number of packs of gum times the cost for each pack is the total cost in dollars”. They can use this verbal model to construct the equation. Students can check their equation by substituting values and comparing their results to the table. The checking process helps student revise and recheck their model as necessary. X axis is the independent variable Y axis is the dependent variable
Students should be able to explain or
show their work using a
representation (numbers, words,
pictures, physical objects, or
equations)
To be
determined
at the school
level
Grade 7 Common Core State Standards Scope and Sequence…Page 14
LESSON PLANNING (CONTINUED)
Recommended Technologies: NPS Common Core eBoard www.npscommoncore.newark.site.eboard.com Click the CCSS Math tab for additional materials NPS Math Modules http://www.virtualnerd.com User Id: your district email Password: teachwithvn Manipulatives Explore Learning http://www.thinkingblocks.com/ National Library of Virtual Manipulatives
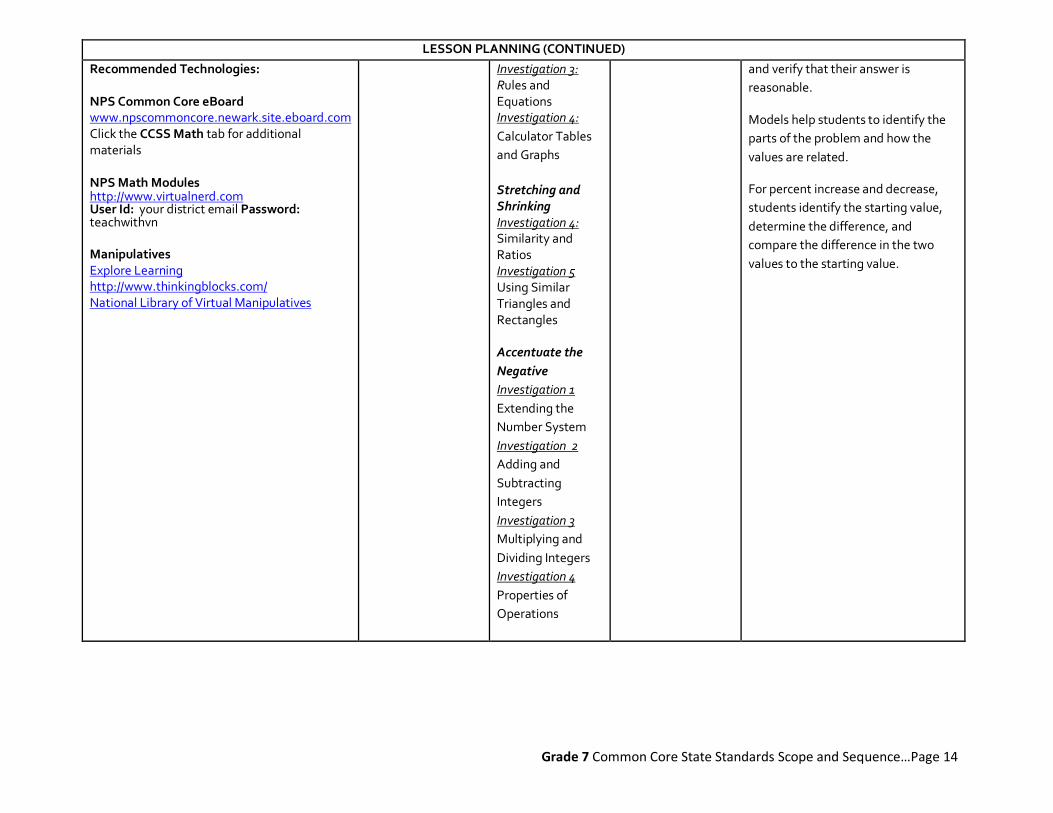
Investigation 3: Rules and Equations Investigation 4:
Calculator Tables
and Graphs
Stretching and Shrinking Investigation 4: Similarity and Ratios Investigation 5 Using Similar Triangles and Rectangles Accentuate the
Negative
Investigation 1
Extending the
Number System
Investigation 2
Adding and
Subtracting
Integers
Investigation 3
Multiplying and
Dividing Integers
Investigation 4
Properties of
Operations
and verify that their answer is
reasonable.
Models help students to identify the
parts of the problem and how the
values are related.
For percent increase and decrease,
students identify the starting value,
determine the difference, and
compare the difference in the two
values to the starting value.

Grade 7 Common Core State Standards Scope and Sequence…Page 15
SAMPLE DEMONSTRATIONS OF LEARNING (DOLS)
Conceptual Understanding
If a glider has a glide ratio of 1/10 , it goes down 1 foot for
every 10 fee it travels horizontally.
a) Suppose two gliders start at the same height, one with a
glide ration 2/7 and one with a glide ratio of 0.3. If they glide
until they hit the ground, which one will have glided the
farther horizontal distance? For this problem, try using a
diagram of the two planes in action to help explain your
response.
b) If both planes are dropped from a height of 70 feel, how
far will each have to travel before they hit the ground?
Procedural Fluency
Find the unit rate for each situation:
a) driving 180 km in 3 hours
b) 54 hot dogs for 18 people
c) 160 words typed in 4 minutes
d) $27.40 for 4 hours of work
e) $12.64 for 8 pack of juice boxes
Application
At Whole Foods Market, the gourmet coffee costs $18.96 for
3 pounds.
a) What is the cost per pound of coffee?
b) Represent the relationship between the cost of the coffee
and the number of pounds in a table of values.
c) Let x be the number of pounds of coffee and y be the total
cost of x pounds. Draw a graph o the proportional
relationship between the number of pound of coffee and the
total cost.
d) How can you see the cost per pound of coffee in the
graph?
e) Write an equation that relates y, the cost of the coffee,
and x, the number of pounds.
Connected Mathematics Program 2 Assessments Additional Assessment Resources
Stretching and Shrinking Check Up 1 (Inv 2)
Variables and Patterns Check Up 1, Check Up 2, Partner Quiz, Multiple Choice Items, Question Bank, and Unit Test
Moving Straight Ahead Check Up 1, Check Up 2,
Comparing and Scaling Check Up, Partner Quiz, Multiple Choice Items, Question Bank, and Unit Test
Formative Assessments: http://njctl.org/courses/math/7th-grade/ratios-proportions/ratios-
proportions-7th-grade-2/
Summative Assessments: http://www.state.nj.us/education/modelcurriculum/math/7u2.shtml

Grade 7 Common Core State Standards Scope and Sequence…Page 16
UNIT VOCABULARY
IN-DEPTH OPPORTUNITIES
7.NS.3 7.RP.2 7.EE.3 7.EE.4 7.G.6
UNIT 5:
PROPORTIONAL REASONING
Scale Drawing
Horizontal Articulation
Suggested Support/Review Standards
6.G.1 [area]
7.RP.2 [proportions]
UNIT 5 ASSESSMENT
AVAILABLE (2 items)
Standards Description Days Resources
7.G.1 Solve problems involving scale drawings of geometric figures, including
computing actual lengths and areas from a scale drawing and
reproducing a scale drawing at a different scale.
proportion
ratio
scale
scale drawing
scale factor
scale model
similar figures
Pac
ing
to b
e d
eter
min
ed a
t th
e sc
ho
ol l
eve
l

Grade 7 Common Core State Standards Scope and Sequence…Page 17
LESSON PLANNING
UNIT 5:
PROPORTIONAL REASONING
Scale Drawing
Horizontal Alignment
Suggested Support/Review Standards
6.G.1 [area]
7.RP.2 [proportions]
Vertical Alignment
8.G.4 [Sequences that exhibit similarity]
Recommended Technologies:
NPS Common Core eBoard www.npscommoncore.newark.site.eboard.com Click the CCSS Math tab for additional materials NPS Math Modules http://www.virtualnerd.com User Id: your district email Password: teachwithvn Manipulatives Explore Learning http://www.thinkingblocks.com/ National Library of Virtual Manipulatives
Course Proficiencies Textbook
Alignment
Multiple
Representations
Comments
Compute actual lengths and areas of a geometric figure from scale drawings and reproductions of the figure.
Stretching and Shrinking
Investigation 2
Similar Figures
Investigation 3
Similar Polygons
Investigation 4
Similarity and Ratios
Investigation 5
Using Similar
Triangles and
Rectangles
Comparing and Scaling
Investigation 4
Making Sense of
Proportions
Concrete
Bar model
Paper strips
Number line
Pictorial
Table representation
Graphs
Equivalent ratios
Abstract
Finding the constant of
proportionality
Algorithm for scale factor:
Image/actual figure
or
Actual figure/image
EX: a/b = c/d
Students should build a good working definition of similar in mathematical terms. Students will begin to see connections between geometry and algebra. Using the coordinate system, they draw several geometric figures. Some of the figures are similar to one another and others are not.
Students explore algebraic rules that cause images to change size and to move about the coordinate plane. Compare angle measures and lengths of corresponding sides informally as they investigate transformations. Find that for two figures to be similar corresponding angles must be congruent and corresponding sides must grow or shrink by the same factor.
To be
determined
at the school
level

Grade 7 Common Core State Standards Scope and Sequence…Page 18
SAMPLE DEMONSTRATIONS OF LEARNING (DOLS)
Conceptual Understanding
While shopping for sneakers, Juan finds two pairs he
likes. One pair costs $55 and the other costs $165. He
makes the following statements about the prices.
“The expensive sneakers cost $110 more than the
cheaper sneakers.” “The expensive sneakers cost
three times as much as the cheaper sneakers.”
a. Are both of his statements accurate?
b. How are the comparison methods Juan uses similar
to the methods you use to compare the sizes and
shapes of similar figures?
c. Which method is more appropriate for comparing
the size and shape of an enlarged or reduced figure to
the original? Explain.
Procedural Fluency
1. The scale on a map suggests that 1 centimeter represents an actual distance of 5 kilometers. The map distance between two towns is 8 centimeters. What is the actual distance? 2. Find the missing value in the pair of similar
polygons. Round to the nearest tenth if necessary.
Application
On grid paper, draw a rectangle with an area of 14
square centimeters. Label it ABCD.
a. Write and use a coordinate rule that will make a
rectangle similar
to rectangle ABCD that is three times as long and
three times as wide. Label it EFGH
b..How does the perimeter of rectangle EFGH
compare to the perimeter of rectangle ABCD?
c. How does the area of rectangle EFGH compare to
the area of rectangle ABCD?
d. How do your answers to parts (b) and (c) relate to
the scale factor from rectangle ABCD to rectangle
EFGH?
Connected Mathematics Program 2 Assessments Additional Assessment Resources
Stretching and Shrinking Check Up 2, Partner Quiz, Multiple Choice Items, Question Bank, and Unit Test
Formative Assessments: http://njctl.org/courses/math/7th-grade/ratios-proportions/ratios-proportions-7th-
grade-2/
Summative Assessments: http://njctl.org/courses/math/7th-grade/ratios-proportions/ratios-proportions-7th-
grade-2/
(registration is required to access assessments-registration is free of charge)

Grade 7 Common Core State Standards Scope and Sequence…Page 19
UNIT VOCABULARY
IN-DEPTH OPPORTUNITIES
7.NS.3 7.RP.2 7.EE.3 7.EE.4 7.G.6
UNIT 6:
LINEAR EXPRESSIONS
Adding, Subtracting, Factoring,
Expanding, and Rewriting
Horizontal Articulation
Suggested Support/Review Standards
6.EE.3 [mathematical expressions]
6.EE.4 [equivalent expressions]
UNIT 6 ASSESSMENT AVAILABLE
Standards Description Days Resources
7.EE.1 Apply properties of operations as strategies to add, subtract, factor, and
expand linear expressions with rational coefficients.
7.EE.2 Understand that rewriting an expression in different forms in a problem
context can shed light on the problem and how the quantities in it are
related. For example, a + 0.05a = 1.05a means that “increase by5%” is the
same as “multiply by 1.05.”
Module
7.EE.1-2
properties of operations
coefficient
factor
expand
equivalent expression
Pac
ing
to b
e d
eter
min
ed a
t th
e sc
ho
ol l
eve
l

Grade 7 Common Core State Standards Scope and Sequence…Page 20
LESSON PLANNING
UNIT 6:
LINEAR EXPRESSIONS
Adding, Subtracting, Factoring, Expanding, and
Rewriting
Horizontal Alignment
Suggested Support/Review Standards
6.EE.3 [mathematical expressions]
6.EE.4 [equivalent expressions]
Vertical Alignment
8.NS.1 [Decimal Expansion]
8.EE.7b [Expanding Expressions]
8.EE.8a [Parts of Intersection]
8.EE.8b [Estimating Solutions by Graphing]
Recommended Technologies:
NPS Common Core eBoard www.npscommoncore.newark.site.eboard.com Click the CCSS Math tab for additional materials NPS Math Modules http://www.virtualnerd.com User Id: your district email Password: teachwithvn Manipulatives Explore Learning http://www.thinkingblocks.com/ National Library of Virtual Manipulatives
Course
Proficiencies
Textbook
Alignment
Multiple
Representations
Comments
Add, subtract, factor, and expand liner expressions with rational coefficients.
Apply properties of operations to calculate with numbers in any form.
Moving
straight
Ahead
Investigation
3
Solving
Equations
Investigation
4
Exploring
Slope
Common
Core
Transition
Kit
Investigation
2 Equivalent
Expressions
Concrete
Bar Models
Algebra Tiles
Pictorial
Tabular
Representation
Graphing
Abstract
Simplifying
Expressions/Combining
Like Terms
Generating an
equation
a+.05a=1.05a
Properties of
Operations:
Commutative
Associative
Distributive
Additive and
Multiplicative Identity
Like terms: terms in an expression that have the same variable raised to the same power
If two or more like terms are being added or subtracted, they can be combined.
To combine like terms add/subtract the coefficient but leave the variable alone.
When we factor an expression, we find all numbers or variables that divide into all of the parts of an expression.
We can check our work by using the distributive property to see that the two expressions are equal.
When using the distributive property, be careful with your signs.
To be
determined
at the school
level

Grade 7 Common Core State Standards Scope and Sequence…Page 21
SAMPLE DEMONSTRATIONS OF LEARNING (DOLS)
Conceptual Understanding
1) Sean is buying a new DVD player and speakers for
$315.The store offers him an interest-free payment
plan that allows him to pay in monthly installments
of $25.
a. How much will Sean still owe after one payment?
After two payments? After three payments?
b. Use n to stand for the number of payments and a
for the amount still owed. Write an equation for
calculating a for any value of n.
c. Use your equation to make a table and a graph
showing the relationship between n and a.
d. As n increases by 1, how does a change? How is
this change shown in the table? How is it shown on
the graph?
e. How many payments will Sean have to make in all?
How is this shown in the table? How is this shown on
the graph?
2) Describe the relationship between the variables
in words and with an equation.
x 1 2 5 10 20
y 4 8 20 40 80
x 1 2 3 4 5
y 6 11 16 21 26
Procedural Fluency
Use the equation to complete the table:
1. y = 4x + 3
x 1 2 5 10 20
y
2. m = 100 – k
k 1 2 5 10 20
m
3. d = 3.5t
t 1 2 5 10 20
d
Application
Bicycles that were popular in the 1890s were called
“penny farthing” bicycles. These bikes had front
wheels with diameters as great as
5 feet! Suppose the front wheel of these bicycles
have a diameter of 5 feet.
a. What is the radius of the front wheel?
b. How far will one bike travel in 100 turns of the
front wheel?
c. How many times will the front wheel turn in a 3-
mile trip?
d. Compare the number of times the wheels of
Masako’s bike turn in a 1-mile trip [see part (f) of
Exercise 28] with the number of times the
front wheel of this penny-farthing bike turns in a 3-
mile trip. Why are the numbers related this way?

Grade 7 Common Core State Standards Scope and Sequence…Page 22
Connected Mathematics Program 2 Assessments Additional Assessment Resources
Variables and Patterns Check Up 1, Check Up 2, Partner Quiz, Multiple Choice Items, Question Bank, and Unit Test
Moving Straight Ahead Check Up 1, Check Up 2, Partner Quiz, Multiple Choice Items, Question Bank, and Unit Test
Formative Assessments: http://njctl.org/courses/math/7th-grade/expressions-equations/
Summative Assessments: http://njctl.org/courses/math/7th-grade/expressions-equations/
(registration is required to access assessments-registration is free of charge)

Grade 7 Common Core State Standards Scope and Sequence…Page 23
SEMESTER TWO
UNIT VOCABULARY
IN-DEPTH OPPORTUNITIES
7.NS.3 7.RP.2 7.EE.3 7.EE.4 7.G.6
UNIT 7:
LINEAR EQUATIONS AND INEQUALITIES
Horizontal Articulation
Suggested Support/Review Standards
6.EE.6 [variables]
6.EE.7 [practical]
6.EE.8 [inequalities]
7.NS.3 [division]
UNIT 7 ASSESSMENT AVAILABLE
Standards Description Days Resources
7.EE.4
Use variables to represent quantities in a real-world or mathematical
problem, and construct simple equations and inequalities to solve
problems by reasoning about the quantities.
a. Solve word problems leading to equations of the form px + q
= r and p(x + q) = r, where p, q, and r are specific rational
numbers. Solve equations of these forms fluently. Compare
an algebraic solution to an arithmetic solution, identifying
the sequence of the operations used in each approach. For
example, the perimeter of a rectangle is 54 cm. Its length is
6 cm. What is its width?
b. Solve word problems leading to inequalities of the form px +
q > r or px + q < r, where p, q, and r are specific rational
numbers. Graph the solution set of the inequality and
interpret it in the context of the problem. For example: As a
salesperson, you are paid $50 per week plus $3 per sale. This
week you want your pay to be at least $100. Write an
inequality for the number of sales you need to make, and
describe the solutions.
Module
7.EE.3-4
equation inequality variable(s)
Pac
ing
to b
e d
eter
min
ed a
t th
e sc
ho
ol l
eve
l

Grade 7 Common Core State Standards Scope and Sequence…Page 24
LESSON PLANNING
UNIT 7:
LINEAR EQUATIONS AND INEQUALITIES
Horizontal Articulation
Suggested Support/Review Standards
6.EE.6 [variables]
6.EE.7 [practical]
6.EE.8 [inequalities]
7.NS.3 [division]
Vertical Alignment
8.EE.5 [graphing proportional relationships]
8.EE.6 [similar triangle to explain slope]
8.EE.7 [solve linear equations in one
variable]
8.EE.8 [system of equations]
8.F.4 [function model between two
quantities]
8.F.5 [describe functions qualitatively by
analyzing graphs]
Course
Proficiencies
Textbook Alignment Multiple Representations Comments
Use variables to represent quantities and construct equations and inequalities to solve problems about quantities.
Variables and Patterns
Investigation 1:
Variables Tables and Coordinate
Graphs
(Additional Practice Pg. 58-64)
Investigation 2:
Analyzing Graphs and Tables
(Additional Practice Pg. 65-73)
Investigation 3:
Rules and Equations (Additional
Practice Pg. 74-78)
Moving
Straight Ahead
Investigation 1: Walking rates (Additional Practice and Skills
Workbook pgs. 83- 86)
Investigation 2: Exploring Linear Functions with graphs and Tables (Additional Practice and Skills
Workbook pgs. 87- 92)
Investigation 3
Solving Equations
(Additional Practice and Skills
Workbook pages 93-98)
Investigation 4
Exploring Slope
(Additional Practice and Skills
Workbook pages103-112)
Concrete
Bar Models
Algebra Tiles
Pictorial
Tabular Representation
Graphing
Abstract
Simplifying
Expressions/Combining
Like Terms
Create an Equation:
Y=mx + b
Create an Equivalent
Equation:
a+.05a=1.05a
Properties of Operations:
Commutative
Associative
Distributive
Identity
Zero
A relationship is linear if there is
a constant rate of change
between the two variables
(Slope of a Line).
Students should be comfortable
representing linear relationships
using graphs, tables, equations,
and stories.
Develop the concept of constant
rate or slope
y (Change in y) (y2-y1)
x , (Change in x), (x2-x1),
rise
run
(graphs)
Connect ratio and rate concepts
in linear functions
Attend to precision when
graphing
Be sure to use the linear
function, y=mx+b, and ensure
that the students understand
the meaning of each variable
Often problems call for the form
c≤ mx+b or c≥mx+b. Inequalities
have infinitely many solutions.
The algebraic, numerical and
To be
determined
at the school
level

Grade 7 Common Core State Standards Scope and Sequence…Page 25
Common Core Transition Kit
Investigation 3
(Inequalities)
graphic strategies that lead to
solutions of linear inequalities
are related to those of
equations. The key difference is
that when you multiply or divide
both sides of an inequality by a
negative number, the directions
of the inequality is reversed.

Grade 7 Common Core State Standards Scope and Sequence…Page 26
UNIT 8:
POPULATIONS
Sampling, Inferences, and Comparing
Horizontal Articulation
Suggested Support/Review Standards
6.SP.1 [stats]
6.SP.2 [data]
Recommended Technologies:
NPS Common Core eBoard http://www.npscommoncore.newark.site.eboard.com Click the CCSS Math Tab for additional materials NPS Math Modules http://www.virtualnerd.com – click Log In; password protected User Id: your district email Password: teachwithvn
Progressive Math Initiative:
http://njctl.org/courses/math/7th-grade-
math/
Manipulatives: http://nlvm.usu.edu/en/nav/vlibrary.html http://www.explorelearning.com/index.cfm?method=cResource.dspBrowseCorrelations&v=s&id=USA-000 http://www.thinkingblocks.com/
UNIT 8 ASSESSMENT AVAILABLE
Standards Description Days Resources
7.SP.1, 2
Understand that statistics can be used to gain information about a
population by examining a sample of the population; generalizations
about a population from a sample are valid only if the sample is
representative of that population. Understand that random sampling
tends to produce representative samples and support valid inferences.
Use data from a random sample to draw inferences about a population
with an unknown characteristic of interest. Generate multiple samples
(or simulated samples) of the same size to gauge the variation in
estimates or predictions. For example, estimate the mean word length in
a book by randomly sampling words from the book; predict the winner
of a school election based on randomly sampled survey data. Gauge how
far-off the estimate or prediction might be.
7.SP.3 Informally assess the degree of visual overlap of two numerical data
distributions with similar variability, measuring the difference between
the centers by expressing it as a multiple of a measure of variability. For
example, the mean height of players on the basketball team is 10 cm
greater than the mean height of players on the soccer team, about twice
the variability (mean absolute deviation) on either team; on a dot plot,
the separation between the two distributions of heights is noticeable.
7.SP.4 Use measures of center and measures of variability for numerical data
from random samples to draw informal comparative inferences about
two populations. For example, decide whether the words in a chapter of
a seventh-grade science book are generally longer than the words in a
chapter of a fourth-grade science book.
7.SP.5 Understand that the probability of a chance event is a number between
0 and 1 that expresses the likelihood of the event occurring. Larger
numbers indicate greater likelihood. A probability near 0 indicates an
unlikely event, a probability around 1/2 indicates an event that is
neither unlikely nor likely, and a probability near 1 indicates a likely
event.
7.SP.6 Approximate the probability of a chance event by collecting data on the chance process that produces it and observing its long-run relative frequency, and predict the approximate relative frequency given the probability. For example, when rolling a number cube 600 times, predict that a 3 or 6 would be rolled roughly 200 times, but probably not exactly200 times.
Pac
ing
to b
e d
eter
min
ed a
t th
e sc
ho
ol l
eve
l

Grade 7 Common Core State Standards Scope and Sequence…Page 27
UNIT VOCABULARY
IN-DEPTH OPPORTUNITIES
7.NS.3 7.RP.2 7.EE.3 7.EE.4 7.G.6
SAMPLE DEMONSTRATIONS OF LEARNING (DOLS)
SAMPLING, INFERENCES, AND
COMPARING POPULATIONS
Understanding and Applying
Horizontal Articulation
Suggested Support/Review Standards
7.SP.7 Develop a probability model and use it to find probabilities of events. Compare probabilities from a model to observed frequencies; if the agreement is not good, explain possible sources of the discrepancy.
a. Develop a uniform probability model by assigning equal probability to all outcomes, and use the model to determine probabilities of events. For example, if a student is selected at random from a class, find the probability that Jane will be selected and the probability that a girl will be selected.
b. Develop a probability model (which may not be uniform) by observing frequencies in data generated from a chance process. For example, find the approximate probability that a spinning penny will land heads up or that a tossed paper cup will land open-end down. Do the outcomes for the spinning penny appear to be equally likely based on the observed frequencies?
7.SP.8 Find probabilities of compound events using organized lists, tables, tree diagrams, and simulation.
a. Understand that, just as with simple events, the probability of a compound event is the fraction of outcomes in the sample space for which the compound event occurs.
b. Represent sample spaces for compound events using methods such as organized lists, tables and tree diagrams. For an event described in everyday language (e.g., “rolling double sixes”), identify the outcomes in the sample space which compose the event.
c. Design and use a simulation to generate frequencies for compound events. For example, use random digits as a simulation tool to approximate the answer to the question: If 40% of donors have type A blood, what is the probability that it will take at least 4donors to find one with type A blood?
probability model
frequencies
random
chance outcome
compound event
organized list
simulation
likely/unlikely
variability/measure of variability
measure of center
comparative inference
Pac
ing
to b
e d
eter
min
ed a
t th
e sc
ho
ol l
eve
l

Grade 7 Common Core State Standards Scope and Sequence…Page 28
Conceptual Understanding
The two data sets below depict random samples of
the housing prices sold in the King River and Toby
Ranch areas of Arizona. Based on the prices below,
which measure of center will provide the most
accurate estimation of housing prices in Arizona?
Explain your reasoning.
o King River area {1.2 million, 242000, 265500, 140000, 281000, 265000, 211000}
Toby Ranch homes {5million, 154000, 250000, 250000, 200000, 160000, 190000}
Procedural Fluency
If you choose a point in the square, what is the
probability that it is not in the circle?
Application
Show all possible arrangements of the letters in the
word FRED using a tree diagram. If each of the letters
is on a tile and drawn at random, what is the
probability that you will draw the letters F-R-E-D in
that order? What is the probability that your “word”
will have an F as the first letter?
Connected Mathematics Program 2 Assessments Additional Assessment Resources
Data Distributions Check Up 1, Check Up 2, Partner Quiz, Multiple Choice Items, Question Bank, and Unit Test
What Do You Expect Partner Quiz, Multiple Choice Items, Question Bank, and Unit Test
Formative Assessments: http://njctl.org/courses/math/7th-grade/2d-geometry/
http://njctl.org/courses/math/7th-grade/geometry/
Summative Assessments: http://njctl.org/courses/math/7th-grade/2d-geometry/
http://njctl.org/courses/math/7th-grade/geometry/
(registration is required to access assessments-registration is free of charge)
Grade 7 Common Core State Standards Scope and Sequence…Page 29
LESSON PLANNING
Unit 8:
POPULATIONS
Sampling, Inferences, and Comparing
Horizontal Alignment
Suggested Support/Review Standards
6.SP.1 [stats]
6.SP.2 [data]
Vertical Alignment
8.SP.1 [bivariate measurement]
8.SP.2 [line of best fit]
Recommended Technologies:
NPS Common Core eBoard http://www.npscommoncore.newark.site.eboard.com Click the CCSS Math Tab for additional materials NPS Math Modules http://www.virtualnerd.com – click Log In; password protected User Id: your district email Password: teachwithvn
Progressive Math Initiative
http://njctl.org/courses/math/7th-grade-math/
Manipulatives http://nlvm.usu.edu/en/nav/vlibrary.html http://www.explorelearning.com/index.cfm?method=cResource.dspBrowseCorrelations&v=s&id=USA-000 http://www.thinkingblocks.com/
Course Proficiencies Textbook Alignment Multiple
Representations
Comments
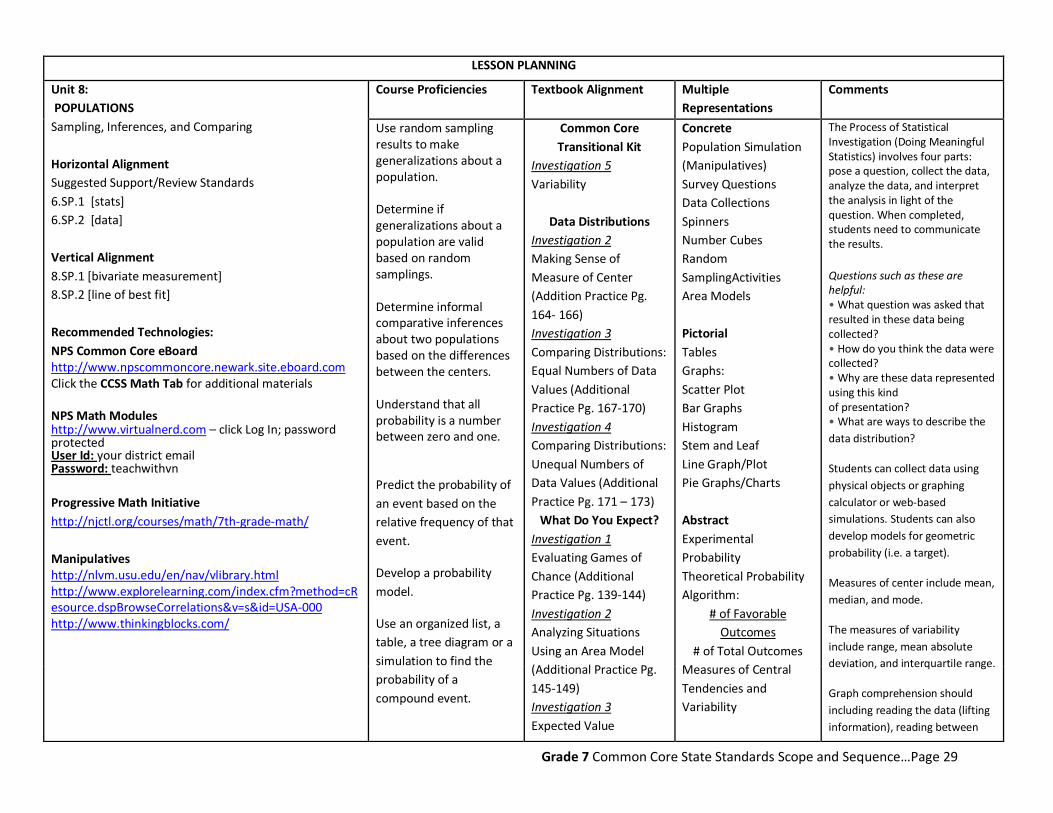
Use random sampling results to make generalizations about a population. Determine if generalizations about a population are valid based on random samplings. Determine informal comparative inferences about two populations based on the differences between the centers. Understand that all probability is a number between zero and one.
Predict the probability of
an event based on the
relative frequency of that
event.
Develop a probability
model.
Use an organized list, a
table, a tree diagram or a
simulation to find the
probability of a
compound event.
Common Core
Transitional Kit
Investigation 5
Variability
Data Distributions
Investigation 2
Making Sense of
Measure of Center
(Addition Practice Pg.
164- 166)
Investigation 3
Comparing Distributions:
Equal Numbers of Data
Values (Additional
Practice Pg. 167-170)
Investigation 4
Comparing Distributions:
Unequal Numbers of
Data Values (Additional
Practice Pg. 171 – 173)
What Do You Expect?
Investigation 1
Evaluating Games of
Chance (Additional
Practice Pg. 139-144)
Investigation 2
Analyzing Situations
Using an Area Model
(Additional Practice Pg.
145-149)
Investigation 3
Expected Value
Concrete
Population Simulation
(Manipulatives)
Survey Questions
Data Collections
Spinners
Number Cubes
Random
SamplingActivities
Area Models
Pictorial
Tables
Graphs:
Scatter Plot
Bar Graphs
Histogram
Stem and Leaf
Line Graph/Plot
Pie Graphs/Charts
Abstract
Experimental
Probability
Theoretical Probability
Algorithm:
# of Favorable
Outcomes
# of Total Outcomes
Measures of Central
Tendencies and
Variability
The Process of Statistical Investigation (Doing Meaningful Statistics) involves four parts: pose a question, collect the data, analyze the data, and interpret the analysis in light of the question. When completed, students need to communicate the results.
Questions such as these are helpful: • What question was asked that resulted in these data being collected? • How do you think the data were collected? • Why are these data represented using this kind of presentation? • What are ways to describe the
data distribution?
Students can collect data using
physical objects or graphing
calculator or web-based
simulations. Students can also
develop models for geometric
probability (i.e. a target).
Measures of center include mean,
median, and mode.
The measures of variability
include range, mean absolute
deviation, and interquartile range.
Graph comprehension should
including reading the data (lifting
information), reading between

Grade 7 Common Core State Standards Scope and Sequence…Page 30
(Additional Practice 150-
152)
Investigation 4
Binomial Outcomes
(Additional Practice Pg.
153-155)
the data (interpretation and
integration of the data), reading
beyond the data (extending,
predicting, and inferring the data)
Students need multiple
opportunities to perform
probability experiments and
compare these results to
theoretical probabilities.
Critical components of the
experiment process are making
predictions about the outcomes
by applying the principles of
theoretical probability, comparing
the predictions to the outcomes
of the experiments, and
replicating the experiment to
compare results.
Experiments can be replicated by
the same group or by compiling
class data.
Experiments can be conducted
using various random generation
devices including, but not limited
to, bag pulls, spinners, number
cubes, coin toss, and colored
chips.

Grade 7 Common Core State Standards Scope and Sequence…Page 31
UNIT VOCABULARY
IN-DEPTH OPPORTUNITIES
7.NS.3 7.RP.2 7.EE.3 7.EE.4 7.G.6
UNIT 9:
2-D and 3-D FIGURES
Angles, Planes, (Surface) Area,
Circumference, Volume
Horizontal Articulation
Suggested Support/Review Standards
6.G.1 [area]
6.G.3 [polygons]
6.G.4 [3 dimensions]
Standards Description Days Resources
7.G.2 Draw (freehand, with ruler and protractor, and with technology)
geometric shapes with given conditions. Focus on constructing triangles
from three measures of angles or sides, noticing when the conditions
determine a unique triangle, more than one triangle, or no triangle.
7.G.3 Describe the two-dimensional figures that result from slicing three-
dimensional figures, as in plane sections of right rectangular prisms and
right rectangular pyramids.
7.G.4 Know the formulas for the area and circumference of a circle and use
them to solve problems; give an informal derivation of the relationship
between the circumference and area of a circle.
7.G.5 Use facts about supplementary, complementary, vertical, and adjacent
angles in a multi-step problem to write and solve simple equations for
an unknown angle in a figure.
7.G.6 Solve real-world and mathematical problems involving area, volume and
surface area of two- and three-dimensional objects composed of
triangles, quadrilaterals, polygons, cubes, and right prisms.
proportion
ratio
scale
scale drawing
scale factor
scale model
similar figures
construction
included angle
non-included angle
unique triangle
cross section
cylinder
edge
face
net
prism
pyramid
rectangular prism
rectangular pyramid
solid
surface area
vertex
adjacent angles
angle pairs
complementary angles
congruent angles
corresponding angles
supplementary angles
transversal
vertical angles
Pac
ing
to b
e d
eter
min
ed a
t th
e sc
ho
ol l
eve
l

Grade 7 Common Core State Standards Scope and Sequence…Page 32
UNIT 9:
2-D and 3-D FIGURES
Angles, Planes, (Surface) Area,
Circumference, Volume
Horizontal Articulation
Suggested Support/Review Standards
6.G.1 [area]
6.G.3 [polygons]
6.G.4 [3 dimensions]
Vertical Alignment
8.G.1-5 [congruency and similarity]
8.G.6 -8 [Pythagorean theorem]
8.G.9 [volume of cylinders, cones, spheres]
Recommended Technologies:
Course Proficiencies Textbook Alignment Multiple Representations Comments
Draw geometric shapes with specific given conditions. Describe the two-dimensional figures that result from slicking three-dimensional figures, as in a plane section of the three-dimensional figure. Solve problems using the formulas for area and circumference of a circle. Use knowledge of supplementary, complementary, vertical, and adjacent angles in a multi-step problem to write and solve simple equations for an unknown angle in a figure. Solve real world problems involving area, volume and surface area.
CC Transitional Kits
Investigation 4
Geometry Topics
Filling and Wrapping
Investigation 1
Building Boxes
(Additional Practice
Pg. 114-117)
Investigation 2
Designing
Rectangular Boxes
Additional Practice
Pg. 118-124)
Investigation 3
Prisms and Cylinders
(Additional Practice
Pg. 125-131)
Investigation 4
Cones, Spheres and
Pyramids
(Additional Practice
Pg.132-135)
Stretching and
Shrinking
Investigation 2
Similar Figures
(Additional Practice
Pg. 24-26)
Investigation 3
Similar Polygons
(Additional Practice
Pg. 27-30)
Concrete
Solids
Boxes
Wedges
Real life representations
(eg: doors, windows, steps,
corners)
Angle ruler
Nets
Projections and views
Pictorial
3-Dimensional scale
drawings of polygons
Angles drawn to
Measure
Coordinate graphs
Abstract
Refer to the 7th grade
reference sheet for
formulas for surface area
and volume
Supplementary angles:
pairs of angles that add up
to 180 degrees.
Complementary angles:
angles whose measures
sum to 90°
Conditions may involve points,
line segments, angles,
parallelism, congruence, angles,
and perpendicularity.
Angle relationships that can be
explored include but are not
limited to:
***Same-side (consecutive) interior and same-side (consecutive) exterior angles are supplementary.
Using a clay model of a rectangular prism, describe the shapes that are created when planar cuts are made diagonally, perpendicularly, and parallel to the base. Students understanding of
volume can be supported by
focusing on the area of base
times the height to calculate
volume.
Students understanding of
surface area can be supported
by focusing on the sum of the
area of the faces.
Nets can be used to evaluate
surface area calculations.
NPS Common Core eBoard http://www.npscommoncore.newark.site.eboard.com Click the CCSS Math Tab for additional materials NPS Math Modules http://www.virtualnerd.com – click Log In; password protected User Id: your district email Password: teachwithvn
Progressive Math Initiative
http://njctl.org/courses/math/7th-grade-
math/
Manipulatives http://nlvm.usu.edu/en/nav/vlibrary.html http://www.explorelearning.com/index.cfm?method=cResource.dspBrowseCorrelations&v=s&id=USA-000 http://www.thinkingblocks.com/
To be
determined
at the school
level

Grade 7 Common Core State Standards Scope and Sequence…Page 33
SAMPLE DEMONSTRATIONS OF LEARNING (DOLS)
Conceptual Understanding
Mr.Turner’s classroom is 20 feet wide, 30 feet long,
and 10 feet high.
a. Label the dimensions of the classroom on your
sketch.
b. Find the volume of the classroom. Why might this
information be useful?
c. Find the total area of the walls, the floor, and the
ceiling. Why might this information be useful?
Procedural Fluency
Find the Area:
Application
The city of Centerville plans to dig a rectangular
landfill. The landfill will have a base with dimensions
700 ft by 200 ft and a depth of 85 ft.
a. How many cubic feet of garbage will the landfill
hold?
b. What information do you need to determine how
long the landfill can be used until it is full?
c. Centerville hires an excavator to dig the hole for
the landfill. How many cubic yards of dirt will he have
to haul away?
Connected Mathematics Program 2 Assessments Additional Assessment Resources
Filling and Wrapping Check Up 1, Check Up 2, Partner Quiz, Multiple Choice Items, Question Bank, and Unit Test
Stretching and Shrinking Partner Quiz, Multiple Choice Items, Question Bank, and Unit Test
Formative Assessments: http://njctl.org/courses/math/7th-grade/2d-geometry/ http://njctl.org/courses/math/7th-grade/geometry/
Summative Assessments: http://njctl.org/courses/math/7th-grade/2d-geometry/ http://njctl.org/courses/math/7th-grade/geometry/ (registration is required to access assessments-registration is free of charge)
Grade 7 Common Core State Standards Scope and Sequence…Page 34
APPENDIX NPS Common Core eBoard http://www.npscommoncore.newark.site.eboard.com Click the CCSS Math tab for additional materials NPS Math Modules http://www.virtualnerd.com – click Log In; password protected User Id: your district email Password: teachwithvn Manipulatives http://nlvm.usu.edu/en/nav/vlibrary.html http://www.explorelearning.com/index.cfm?method=cResource.dspBrowseCorrelations&v=s&id=USA-000 http://www.thinkingblocks.com/
UNIT 1
http://www.explorelearning.com/index.cfm?method=cResource.dspBrowseCorrelations&v=s&id=USA-000 http://www.thinkingblocks.com/
http://illustrativemathematics.org/illustrations/314
http://illustrativemathematics.org/illustrations/310
http://illustrativemathematics.org/illustrations/46
UNIT 2 http://www.explorelearning.com/index.cfm?method=cResource.dspBrowseCorrelations&v=s&id=USA-000 http://www.thinkingblocks.com/
http://illustrativemathematics.org/illustrations/298
http://map.mathshell.org.uk/materials/tasks.php?taskid=387#task387
UNIT 3 Direct link to Problems http://illustrativemathematics.org/illustrations/828 http://illustrativemathematics.org/illustrations/470 http://illustrativemathematics.org/illustrations/82

Grade 7 Common Core State Standards Scope and Sequence…Page 35
http://map.mathshell.org.uk/materials/tasks.php?taskid=271#task271 Exemplars: http://www.nps.k12.nj.us/newarkpublicschools/lib/newarkpublicschools/MathDepartment/DIFF%20MATH%20I/html/task124.html http://www.nps.k12.nj.us/newarkpublicschools/lib/newarkpublicschools/MathDepartment/DIFF%20MATH%20II/html/task400.html
UNIT 4 NPS Common Core eBoard http://www.npscommoncore.newark.site.eboard.com Click the CCSS Math Tab for additional materials NPS Math Modules
http://www.virtualnerd.com – click Log In; password protected
User Id: your district email
Password: teachwithvn
Manipulatives
http://nlvm.usu.edu/en/nav/vlibrary.html
http://www.explorelearning.com/index.cfm?method=cResource.dspBrowseCorrelations&v=s&id=USA-000
http://www.thinkingblocks.com/
Direct link to Problems
7.RP2
http://illustrativemathematics.org/illustrations/100
http://illustrativemathematics.org/illustrations/104
http://map.mathshell.org.uk/materials/tasks.php?taskid=389&subpage=expert
http://map.mathshell.org.uk/materials/tasks.php?subpage=apprentice&taskid=358
7.RP3
http://illustrativemathematics.org/illustrations/130
http://illustrativemathematics.org/illustrations/117
http://illustrativemathematics.org/illustrations/106
7.EE3
Grade 7 Common Core State Standards Scope and Sequence…Page 36
http://illustrativemathematics.org/illustrations/478
http://illustrativemathematics.org/illustrations/108
UNIT 5
NPS Common Core eBoard
http://www.npscommoncore.newark.site.eboard.com
Click the CCSS Math Tab for additional materials
NPS Math Modules
http://www.virtualnerd.com – click Log In; password protected
User Id: your district email
Password: teachwithvn
Manipulatives
http://nlvm.usu.edu/en/nav/vlibrary.html
http://www.explorelearning.com/index.cfm?method=cResource.dspBrowseCorrelations&v=s&id=USA-000
http://www.thinkingblocks.com/
Direct link to Problems
7.RP2
http://illustrativemathematics.org/illustrations/100
http://illustrativemathematics.org/illustrations/104
http://map.mathshell.org.uk/materials/tasks.php?taskid=389&subpage=expert
http://map.mathshell.org.uk/materials/tasks.php?subpage=apprentice&taskid=358
7.RP3
http://illustrativemathematics.org/illustrations/130
http://illustrativemathematics.org/illustrations/117
http://illustrativemathematics.org/illustrations/106
7.EE3
http://illustrativemathematics.org/illustrations/478

Grade 7 Common Core State Standards Scope and Sequence…Page 37
http://illustrativemathematics.org/illustrations/108
UNIT 6
NPS Common Core eBoard
http://www.npscommoncore.newark.site.eboard.com
Click the CCSS Math Tab for additional materials
NPS Math Modules
http://www.virtualnerd.com – click Log In; password protected
User Id:your district email
Password:teachwithvn
Manipulatives
http://nlvm.usu.edu/en/nav/vlibrary.html
http://www.explorelearning.com/index.cfm?method=cResource.dspBrowseCorrelations&v=s&id=USA-000
http://www.thinkingblocks.com/
Direct link to Problems
http://www.illustrativemathematics.org/illustrations/542
http://www.illustrativemathematics.org/illustrations/461
http://map.mathshell.org.uk/materials/tasks.php?taskid=399#task399
http://map.mathshell.org.uk/materials/tasks.php?taskid=369#task369
https://njctl.org/courses/math/7th-grade/expressions-equations/
Exemplars:
http://www.nps.k12.nj.us/newarkpublicschools/lib/newarkpublicschools/MathDepartment/DIFF%20MATH%20III/html/task498.html

Grade 7 Common Core State Standards Scope and Sequence…Page 38
UNIT 7
http://www.nps.k12.nj.us/newarkpublicschools/lib/newarkpublicschools/MathDepartment/DIFF%20MATH%20III/html/task772.html
UNIT 8
Direct link to Problems
http://www.illustrativemathematics.org/illustrations/559
http://www.illustrativemathematics.org/illustrations/260
http://www.illustrativemathematics.org/illustrations/1216
http://www.illustrativemathematics.org/illustrations/1047
http://www.illustrativemathematics.org/illustrations/343
Exemplars:
http://www.nps.k12.nj.us/newarkpublicschools/lib/newarkpublicschools/MathDepartment/DIFF%20MATH%20III/html/nctm3_9.html
UNIT 9
Direct link to Problems
http://www.illustrativemathematics.org/illustrations/107
http://www.illustrativemathematics.org/illustrations/34
Direct link to Problems:
http://www.illustrativemathematics.org/illustrations/673
http://www.illustrativemathematics.org/illustrations/643
Exemplars:

Grade 7 Common Core State Standards Scope and Sequence…Page 39
http://www.illustrativemathematics.org/illustrations/765
http://www.illustrativemathematics.org/illustrations/266
Exemplars:
http://www.nps.k12.nj.us/newarkpublicschools/lib/newarkpublicschools/MathDepartment/DIFF%20MATH%20III/html/task490.html
http://www.nps.k12.nj.us/newarkpublicschools/lib/newarkpublicschools/MathDepartment/DIFF%20MATH%20III/html/task492.html
http://www.nps.k12.nj.us/newarkpublicschools/lib/newarkpublicschools/MathDepartment/DIFF%20MATH%20III/html/task581.html
http://www.nps.k12.nj.us/newarkpublicschools/lib/newarkpublicschools/MathDepartment/DIFF%20MATH%20III/html/task651.html