Embed Size (px)
Citation preview
Scope 1 amp 2 GHG Inventory Guidance Use to prepare a GHG inventory and quantify emissions
This US dairy-specific guidance document has been reviewed by the GHG Protocol and is in conformance with the requirements set forth in the Corporate Accounting and Reporting Standard
November 2019
Table of Contents
Introduction 2Greenhouse Gas Emissions Inventory Overview
Inventory Management Plan 5Developing an Inventory Management PlanImplementing an Inventory Management Plan
Greenhouse Gas Accounting Terminology 7Overview of Commonly Used Terms in GHG Emissions Accounting
Establishing GHG Inventory Boundaries 11Steps to Establish Organizational BoundariesSteps to Establish Operational Boundaries
Scope 1 Stationary Combustion Emissions 14Accounting for Emissions Associated with Stationary Combustion
Scope 1 Fugitive Emissions 18Steps for Collecting and QuantifyingSteps to Ensure and Document Quality Control
Scope 1 Mobile Combustion 21Steps for Collecting and QuantifyingSteps to Ensure and Document Quality Control
Scope 2 Emissions from Purchased Energy 24Steps to Calculate Scope 2 Emissions with the Location-Based Method and Market-Based Approach
Measurement and Estimation Uncertainty of Greenhouse Gas Emissions 26Guidance and Tools to Assess Emissions Uncertainty
Target Setting 27Establishing Greenhouse Gas Emissions Reduction TargetsOverview of Science-Based Targets
Resources 29Tools to Support Greenhouse Gas Emissions Measurement Reporting and Reduction Strategies
1
copy 20
19 Innovation C
enter for US D
airy All rights reserved Tab
le o
f Co
nte
nts
NOTE This document contains numerous hyperlinked tools and resources It is therefore best viewed and used in PDF rather than print format
This resource was developed by Abby Snyder Environmental Defense Fund (EDF) Climate Corps fellow and Sustainability Consultant with the Innovation Center for US Dairy with special thanks to the dairy processor community for their insights and support
Introduction to this Tool Increased requests to report greenhouse gas emissions (GHGs) and the establishment of industry-wide GHG reduction targets in the dairy sector have underscored the need for sector-specific guidance on GHG inventory development for the dairy processing industry This document is a dairy-specific interpretation of recognized GHG accounting standards It is intended to drive credible and consistent GHG emissions accounting across the dairy processing industry
The GHG Protocol Corporate Accounting and Reporting Standard serves as the foundation of this document The Corporate Standard is the most widely accepted and adopted GHG accounting standard
This guidance also draws on existing accounting programs and protocols that are consistent with the GHG Protocol including
y US Environmental Protection Agency Center for Corporate Climate Leadership Greenhouse Gas Inventory Guidance1
y The Climate Registry General Reporting Protocol for the Voluntary Reporting Program Version 212
In addition this guidance recommends using the US Environmental Protection Agency Simplified GHG Emissions Calculator3 to estimate and inventory greenhouse gas emissions This tool is specific to US-based operations and uses the same emission factors as the Intelex software within the Aggregate Reporting Tool Therefore processors who do not opt into reporting into the Tool may still voluntarily calculate their own Scope 1 and 2 GHG footprint using the same methodologies as those who do report through the Tool This ensures consistency and credibility of measurement and reporting to quantify the most accurate estimate of industry-wide processing emissions
It is important to note that processors who opt into using the Aggregate Reporting Tool (Intelex) will have their Scope 1 and 2 GHG calculations completed for them Users will still need to establish an inventory management plan set operational boundaries collect activity data and enter activity data into the Aggregate Reporting Tool The Tool will then calculate all GHG emissions and energy use based on the most up-to-date emission factors and best practices from the EPA Center for Corporate Climate Leadership This ensures consistency across reporting facilities Processors not using the Aggregate Reporting Tool will need to perform calculations independently following the guidance in this document
Lastly this document is intended to be used in conjunction with other Innovation Center for US Dairy resources including
y Scope 3 GHG Inventory Guidance for US Dairy Cooperatives and Processors
y Dairy Processor Handbook
How to Use This Document
Each chapter provides an overview of the steps that a company can take to develop a Scope 1 and Scope 2 GHG emissions inventory Chapters are also devoted to distilling the most important aspects of developing a rigorous standard-based GHG inventory and provide links to external resources that support the user in further exploring outlined concepts External resources are hyperlinked into the text and outlined at the end of each chapter
Purpose and Principles
The GHG emissions associated with dairy processing are dependent upon the nature of a companyrsquos
operations and activities Given the variability in processing operations and the associated GHG emissions this document can be used to develop a robust GHG inventory that is unique to each companyrsquos inherent characteristics business goals and reporting requirements The methodology outlined in this document is based on the GHG Protocol and is therefore compatible with most voluntary sustainability reporting frameworks4
Additionally this document provides a framework for dairy processors to measure and report their GHG emissions in ways that are consistent with the dairy processor GHG emissions intensity metric defined in the US Dairy Stewardship Commitment as ldquoTotal GHG
2
copy 20
19 Innovation C
enter for US D
airy All rights reserved G
HG
Inven
tory
Gu
idan
ce
GHG Inventory Guidance
emissions (tonnes CO2e Scope 1 and 2) per lb of
production outputrdquo More specifically the guidance seeks to
1 Assist in preparing a GHG inventory that represents a true and fair account of the companyrsquos emissions
2 Simplify and reduce the costs of compiling a GHG inventory
3 Support reporting companies in meeting established business goals through the implementation of a credible accounting program
4 Outline and reference resources that support consistent and transparent GHG accounting methodologies
Greenhouse Gas Inventory
A GHG inventory provides a high-level perspective of a companyrsquos total emissions A well-designed and maintained inventory can be used as a management tool upon which a variety of business goals can be achieved such as increased brand recognition participation in a voluntary reporting program or setting and achieving GHG emissions reduction targets
It is important to note that while an inventory can support a companyrsquos reporting goals it is not to be
confused with GHG emissions reporting which is the presentation of emission data in formats tailored to the needs of various reporting requirements Figure 1 outlines the steps taken to develop an inventory Figure 2 Page 4 outlines the key principles of a GHG inventory to ensure that the reporting information is industry-aligned through consistent reporting in the US Dairy Stewardship Commitment
3
copy 20
19 Innovation C
enter for US D
airy All rights reserved G
HG
Inven
tory
Gu
idan
ce
GHG Inventory Guidance
Design Processbull Develop an Inventory Management Planbull Establish organizational and operational
boundaries
GHG Emissions Management bull Establish a reduction target bull Track emissions and trends bull Manage inventory quality
GHG Emissions Accountingbull Identify GHG emission sources bull Collect activity data bull Calculate GHG emissions
(Figure 1) Key steps in
designing a GHG inventory
NOTE The Greenhouse Gas Reporting Program is an EPA emissions reporting program for large facilities that emit more than 25000 metric tons of carbon dioxide equivalent Companies that report to the GHGRP should follow the EPArsquos prescribed methodologies when reporting GHG emissions from sources identified on the GHGRP annual report (typically stationary combustion sources) Companies must also include GHG emissions from other sources (refrigerant leaks transportation emissions purchased energy etc) when calculating their GHG intensity for the Stewardship Commitmentrsquos GHG Intensity metric
4
copy 20
19 Innovation C
enter for US D
airy All rights reserved G
HG
Inven
tory
Gu
idan
ce
GHG Inventory Guidance
Works Cited
Additional Resources
1 EPACenterforCorporateClimateLeadershipJanuary2016GreenhouseGasInventoryGuidancehttpbitly2xNA2Fw
2 ClimateRegistryJanuary2016GeneralReportingProtocolfortheVoluntaryReportingProgramVersion21httpbitly2rpZAXn
3EPACenterforCorporateClimateLeadershipMarch2018SimplifiedGHGEmissionsCalculatorhttpsbitly2Kh0T5r
4ArnaudBThe Handbook of Carbon AccountingRoutledge2016Online
yy ClimateyRegistryy2016yChaptery19yThird-PartyyVerificationyGeneralyReportingyProtocolyforytheyVoluntaryyReportingyProgramyVersiony21y(ppy158)yhttpbitly2rpZAXn
yy WorldyResourcesyInstitutey2015yChaptery10yVerificationyofyGHGyEmissionsyThe GHG Protocol Corporate Accounting and Reporting Standard (pp 68) httpbitly2yhHn0z
Principles FunctionRelevance bull The boundaries of GHG emissions accounting and reporting should
appropriately reflect the companyrsquos emissions and serve the business goals and decision-making needs of the company both internally and externally
Completeness bull The emissions sources within the specified organizational and operational boundaries should be reported
Consistency bull To ensure that emission data can be tracked and compared within the reporting company over time consistent application of accounting practices and quantification methodologies is essential
Transparency bull All information regarding the processes assumptions and limitations of the inventory should be transparent and disclosed
Accuracy bull Data collection should be as accurate as possible and uncertainties should be avoided as far as practical
NOTE The GHG Protocol mandates that a company accounts for all its Scope 1 and 2 emissions within its organizational and operational boundaries However sources that are believed to be relatively small andor insignificant may be calculated using ldquosimplifiedrdquo emissions calculation methods These calculation methods are described in more detail in Chapter 11 of The Climate Registryrsquos General Reporting Protocol
(Figure 2) Principles and function of a GHG inventory from the GHG Protocol
5
copy 20
19 Innovation C
enter for US D
airy All rights reserved G
HG
Inven
tory
Gu
idan
ce
GHG Inventory Guidance
Inventory Management Plan This chapter describes the development of an inventory management plan (IMP) the systematic process of outlining the steps to create a credible and verifiable corporate-wide GHG inventory
Chapter at a Glance
Developing a Plan
Implementing a Plan
Overcoming Barriers
Developing an Inventory Management Plan
An Inventory Management Plan (IMP) should include the description of the managerial and technical responsibilities and arrangements made for collecting calculating and maintaining GHG emission data1 Establishing and maintaining an accurate IMP allows for tracking decisions and changes over time creates institutional knowledge of accounting procedures and allows for more efficient and effective emissions accounting and reporting To assist with the development or improvement of an IMP companies can refer to the templates listed in the Additional Resources section at the end of the chapter
The first step in developing an IMP is to consider how a GHG inventory will meet the companyrsquos goals Dairy processing companies frequently cite the following GHG inventory goals
y Identify GHG risks and reduction opportunities in the value chain
y Identify cost effective reduction opportunities
y Participate in voluntary mandatory andor customer reporting programs
y Acquire eco-labeling or certification
y Set GHG emission reduction targets measure progress toward targets and report outcomes to stakeholders
Every reporting company will have a unique IMP that should incorporate the foundational components outlined in the previous section
Implementing an Inventory Management Plan
Once the company objectives are established and the IMP is outlined the reporting company can take steps to implement the IMP which is further defined in Figure 3 The integration of an IMP into a companyrsquos operations can often be met with internal organizational barriers To address this issue see Additional Resources at the end of the chapter
Steps for Implementing an Inventory Management Plan
1 Establish an Inventory Quality Team This team is responsible for maintaining the GHG inventory program and coordinating interactions necessary for data collection and data validation
2 Outline IMP Procedures The plan should include procedures from initial data collection to final reporting To ensure accuracy the IMP should include practical measures for quality checks and documentation
3 Perform Quality Checks Internal quality checks should focus on data handling documentation and emission calculations (eg ensuring that correct unit conversions are used consistently) Find guidance on quality assurance in the EPA Inventory Management Plan (IMP) Checklist
4 Perform Source-Category Specific Quality Checks This includes a more rigorous investigation of the application of boundaries adjustment procedures and the quality of data used This information can be used to support an uncertainty assessment Find guidance in the Climate Registry General Reporting Protocol (Page 188)
5 Establish Reporting Documentation and Archiving Procedures Establish record keeping procedures that specify what and how information will be documented and archived
(Figure 3) Steps for implementing an Inventory Management Plan based on guidance from The Climate Registry General Reporting Protocol
6
copy 20
19 Innovation C
enter for US D
airy All rights reserved G
HG
Inven
tory
Gu
idan
ce
GHG Inventory Guidance
Works Cited
Additional Resources
1 ClimateRegistryJanuary2016GeneralReportingProtocolfortheVoluntaryReportingProgramVersion21httpbitly2rpZAXn
yy GHGyProtocolyCorporateyAccountingyandyReportingyStandardyChaptery2yBusinessyGoalsyandyInventoryyDesignyhttpbitly2yhHn0z
yy TheyClimateyRegistryyGeneralyReportingyProtocolyVersiony21yAppendixyAyManagingyInventoryyQualityyhttpbitly2rpZAXn
Resources for Developing an Inventory Management Plan
yy TheyEPAyInventoryyManagementyPlany(IMP)yChecklistyOutlinesytheynecessaryycomponentsythatyshouldybeyincludedyinyanyIMPyhttpbitly2HWMfgo
yy TheyClimateyLeadersySimplifiedyInventoryyManagementyPlanyAysampleytemplateymeantytoyhelpyoutlineytheyreportingyrequirementsyofytheyGHGyProtocolyCorporateyStandardybutyprovidesyaygoodyoverviewyofywhatycanybeyincludedyinyanyinventoryyhttpbitly2IsiIyt
yy TheyGHGyProtocolyReportingyTemplateyAysampleytemplateymeantytoyhelpyoutlineytheyreportingyrequirementsyofytheyGHGyProtocolyCorporateyStandardybutyprovidesyaygoodyoverviewyofywhatycanybeyincludedyinyanyinventoryyhttpbitly2IdTDaH
Overcoming Internal Organizational Barriers
yy TheyVirtuousyCycleyofyStrategicyEnergyyManagementyTheyEnvironmentalyDefenseyFundy(EDF)yinycollaborationywithyMITySloanySchoolyofyManagementyhasycreatedyayframeworkyforyunderstandingyhowyanyorganizationycanyovercomeyinternalybarriersyandydriveycorporateyenergyymanagementyinitiativesyyhttpbitly2whDbkN
yy SmartyEnergyyBestyPracticesySurveyyDevelopedybyyEDFytheysurveyyidentifiesybottlenecksyandytargetsykeyyopportunitiesytoyimproveyenergyyperformanceyandycutyemissionsyhttpbitly2jykKyY
yy SmartyEnergyyBestyPracticesyRubricyUsedyalongywithytheySmartyEnergyyBestyPracticesySurveyythisytoolyhelpsymanagersyassessytoyhelpymanagersyassessytheyoverallyhealthyandyprogressyofytheiryGHGyinventoryyprogramyhttpbitly2wgRqGH
yy PeopleyPoweredyLeveragingyEmployeeyEngagementytoyAccelerateySustainabilityyEffortsyAywebinaryhostedybyyEDFythatydiscussesybestypracticesyinyengagingyemployeesyaroundysustainabilityyinitiativesyhttpbitly2In7prC
yy EnergyyManagementySelf-AssessmentyToolyCarbonyTrustytoolythatyassessesyyouryorganizationsycurrentypositionyinyrespectytoyenergyymanagementywithyanyenergyymanagementymatrixyandyassessmentyworkbookyhttpbitly2whnWrY
yy CarbonyTrustySMEyNetworkyAnyonlineycommunityyaimsytoyincreaseytheysharingyofybestypracticeyandystimulateyideasybetweenySMEsylookingytoyreduceycarbonyemissionsyhttpbitly2FNmahL
yy CarbonyTrustyDownloadableypostersyandystickersyforyincreasedyemployeeyawarenessyyhttpbitly2JWZcY1
yy CarbonyTrustyMakingytheybusinessycaseyforyaycarbonyreductionyprojectyhttpbitly36bXcqP
yy EmployeeyAwarenessyandyOfficeyEnergyyEfficiencyyGuideyforyemployeeyengagementyinyofficeybuildingsyincludingyenergy-savingyguidesyemployeeyengagementymaterialsypostersyandystickersyyhttpbitly2NlxpUn
Greenhouse Gases GHGs trap heat radiated from the sun in the atmosphere warming the planetrsquos surface Many GHGs occur naturally in the atmosphere but their increase in concentration from human activities has altered the earthrsquos radiative balance For more information on GHGs and their interaction with Earthrsquos atmosphere refer to
y EPArsquos overview of Greenhouse Gases1
y NASA How Global Warming Stacks Up2
y NASA Temperature Puzzle3
The GHG Protocol Corporate Accounting and Reporting Standard covers the accounting and reporting of seven GHGs covered by the Kyoto Protocol
y Carbon dioxide (CO2)
y Methane (CH4)
y Nitrous oxide (N2O)
y Hydrofluorocarbons (HFCs)
y Perfluorocarbons (PFCs)
y Sulphur hexafluoride (SF6)
y Nitrogen trifluoride (NF3)
Global Warming Potential
GHGs released into the atmosphere have different radiative effects depending on the unique qualities of the gas The factor describing the radiative forcing impact of one unit of a given GHG relative to one unit of CO
2 is known as the
Global Warming Potential (GWP)
Since the amount of warming a gas causes over a given period (normally 100 years) varies GHG emission calculations must account for the GWP of each gas GWP is an index with CO
2 having an index value of 1 The GWP for all other GHGs refers to the
amount of warming they cause compared to CO2 For instance the radiative forcing
impact of one unit of methane (CH4) is 28 times more powerful than one unit of CO
2
(Figure 4 page 8)
The GHG Protocol and the majority of accounting standards use GWP values established by the Intergovernmental Panel on Climate Change (IPCC) The IPCC updates GWP values as scientific understanding develops and the fifth assessment report AR5 contains the most recent values The IPCC is currently in its sixth assessment cycle and AR6 will be finalized in 2022 The complete list of GWP values relative to CO
2 is provided by the GHG Protocol
7
copy 20
19 Innovation C
enter for US D
airy All rights reserved G
HG
Inven
tory
Gu
idan
ce
GHG Inventory Guidance
continued on next page
Greenhouse Gas Accounting Terminology Greenhouse gas (GHG) emissions are estimated through the application of defined accounting principles This chapter intends to provide an overview of commonly used terminology and concepts that are the foundation of GHG accounting
Chapter at a Glance
Greenhouse Gases
Global Warming Potential
Carbon Dioxide Equivalent
Emission Factors
Activity Data
Global Warming Potential
By default the GHG Protocol calculation tools are set to calculate emissions using AR5 The following guidelines can assist reporting companies in using GWP values and are drawn from the GHG Protocol February 2013 Accounting and Reporting Standard Amendment The reporting company should
y Use 100-year GWP values from the IPCC
y Use GWP values from the most recent IPCC assessment report (currently the Fifth Assessment Report) unless requirements of a specific reporting program differ
y Use the same GWPs for the current inventory period and the base year as well as for inventories prepared according to the Scope 3 Standard to maintain consistency across time and scopes
y Report the source of the GWP values and indicate if multiple IPCC assessment reports have been used
Carbon Dioxide Equivalent
Carbon dioxide equivalent (CO2e) is the standard unit used to compare and
account for emissions from various GHGs based on their global warming potential For instance Figure 4 illustrates that CO
2 has a GWP of 1 and CH
4
(methane) has a GWP of approximately 28 (on a 100-year time horizon) Therefore for every tonne of CH
4 emitted an equivalent of 28 tonnes of CO
2
would be emitted Since one tonne of a particular GHG is not the same GWP as one tonne of another this standard unit is a simple way to normalize and express GHGs as an equivalent of CO
2
Emission Factors An emission factor is used to calculate the GHG emissions for a given source relative to units of activity Emission factors reflect average values by sector technology type andor fuel type For example eGRID emission factors for electricity use in the NPCC New England sub region indicate that for every MWh of electricity consumed 5637 lbs of CO
2e are emitted This emission factor can
be used to determine the total CO2e emissions resulting from the companyrsquos
purchased electricity in that region To maximize accuracy it is important to select emission factors that are appropriate for the relevant context
The default emission factors embedded in the referenced calculators are updated and relevant to the calculation context of the tool A full list of the emission factors can be found in the US EPA Center for Corporate Climate Leadership Emission Factors for Greenhouse Gas Inventories
8
copy 20
19 Innovation C
enter for US D
airy All rights reserved G
HG
Inven
tory
Gu
idan
ce
(Figure 4) The Global Warming Potential of IPCC recognized GHGs AR5
GHG Inventory Guidance
continued on next page
PFCs6630 - 11100
HFCs4 - 12400
N2O
265CH
4
28C0
2
1
SF6
23500 NF3
16100
9
copy 20
19 Innovation C
enter for US D
airy All rights reserved G
HG
Inven
tory
Gu
idan
ce
GHG Inventory Guidance
Activity Data Activity data is a key input for the calculation of GHG emissions and refers to the data associated with an activity that generates GHG emissions such as gallons of gasoline consumed from company cars This activity data is collected in physical units (gallons) or energy units (therms) and then combined with an emissions factor and the relevant greenhouse gas GWP value to calculate C0
2e
The collection of activity data is the primary responsibility of the reporting company and will often be the most significant challenge when developing a GHG inventory Therefore establishing robust activity data collection procedures is essential The following measures are useful for ensuring the collection of quality activity data
Steps for Gathering Activity Data
1 Convert fuel consumption data from physical to energy units
y The Energy Information Administration has a conversion tool to easily convert different fuels to energy contents
2 Develop data collection procedures in the IMP to standardize collection practices
3 Compare current year data with historical trends to identify inconsistent changes that are over 10 percent Inconsistencies should be investigated
4 Compare activity data from multiple reference sources (eg government survey data or data compiled by other dairy processing companies) with company data when possible
Works Cited
1 EPA2017UnderstandingGlobalWarmingPotentialshttpbitly2gXtxJF
2 WorldResourcesInstituteThe GHG Protocol Corporate Accounting and Reporting Standard2013RequiredGreenhouseGasesinInventoriesaccountingandreportingstandardamendmenthttpbitly2yhHn0z
3 TheClimateRegistry2016GeneralReportingProtocolfortheVoluntaryReportingProgramVersion21httpbitly2pIjLTj
NOTE If reporting into the Aggregate Reporting Tool energy data should be reported in volumemass units (ie gallons of fuel therms of gas) The conversion from volumemass to energy is done automatically using a predetermined energy factor
10
copy 20
19 Innovation C
enter for US D
airy All rights reserved G
HG
Inven
tory
Gu
idan
ce
GHG Inventory Guidance
Additional Resources
Greenhouse Gases
yy EPAyOverviewyofyGreenhouseyGases httpbitly2ro6IU4
yy NASAyGlobalyClimateyChangeyHowyGlobalyWarmingyStacksyUpyAythree-minuteyvideoythatyexplainsyhowydifferentyfactorsycontributeytoyglobalywarmingyhttpsgonasagov2JXkvsp
yy NASAyGlobalyClimateyChangeyTemperatureyPuzzleyAyfiveyminuteyvideoythatyexplainsytheyimpactsyofytheysunrsquosyenergyyEarthrsquosyreflectanceyandygreenhouseygassesyonyglobalywarming httpsgonasagov2rpUt9T
Global Warming Potential
yy yEPAyUnderstandingyGlobalyWarmingyPotentials httpbitly2gXtxJF
yy yIntergovernmentalyPanelyonyClimateyChange httpswwwipccch
yy GHGyProtocolyGlobalyWarmingyPotentialyValuesyTableyofyGWPsyfromytheySARyAR4yandyAR5yreportyhttpbitly2z6chdf
Emission Factors
yy GHGyProtocolyEmissionyFactorsyfromyCrossySectoryToolsy2017yhttpbitly2q3eZzN
11
copy 20
19 Innovation C
enter for US D
airy All rights reserved G
HG
Inven
tory
Gu
idan
ce
Supporting Resources
This section of the document draws on guidance from the following resources
Organizational Boundaries
y GHG Protocol Corporate Accounting and Reporting Standard Revised Edition Chapter 3 Setting Organizational Boundaries1
y General Reporting Protocol Version 21 Chapter 4 Identifying the Organizational Boundary2
Operational Boundaries
y GHG Protocol Corporate Accounting and Reporting Standard Revised Edition Chapter 4 Setting Operational Boundaries3
y General Reporting Protocol Version 21 Chapter 5 Emissions to Include in the Inventory4
Organizational Boundaries
Organizational boundaries are generally high-level boundaries that determine which business operations and facilities are part of the GHG inventory Due to differences in legal and organizational structures each companyrsquos organizational boundary will vary The GHG Protocol outlines three approaches for developing organizational boundaries mdash the Equity Share the Operational Control and the Financial Control Approach (Figure 6) It is important to note that these different boundary approaches need to be applied independently Furthermore a reporting company should use the same approach for all Scope 1 and 2 emissions categories when compiling a GHG emissions inventory and use this same approach for subsequent reporting periods to ensure consistency when tracking emissions over time
Equity Share Approach
The reporting company accounts for GHG emissions that are wholly- or partially-owned according to its share of equity in that operation regardless of whether operational or financial control is exerted
Operational Control Approach
The reporting company accounts for 100 percent of emissions from operations over which it or one of its subsidiaries has operational control However it should be emphasized that having operational control does not mean that a company necessarily has the authority to make all decisions concerning an operation Therefore a company may report emissions from a leased asset as Scope 3 if the company can demonstrate and state clearly the reasons that it does not have operational control (GHG Protocol Appendix F 2006)
Financial Control Approach
The reporting company accounts for 100 percent of emissions from operations over which it or one of its subsidiaries has financial control
If a reporting company is applying the Operational or Financial Control approach it does not need to account for emissions arising from operations over which it does not control
GHG Inventory Guidance
Establishing Inventory Boundaries This chapter describes the role of and process for developing GHG inventory boundaries Inventory boundaries determine which business operations and emissions will be accounted for in a companyrsquos GHG inventory Organizational boundaries define the operations and facilities
included in the inventory while the operational boundaries categorize the emissions resulting either directly or indirectly from the organizationrsquos operations and facilities
Chapter at a Glance
Organizational Boundaries
Operational Boundaries
NOTE A reporting company that wholly-owns and controls its operations is responsible for all associated emissions In this case the outcome will be the same whichever approach is used5
LesseersquosTenantrsquos PerspectiveCapital Lease Operating Lease
Operational Control Approach
Lessee has controlownership (S1 or 2)
Financial Control or Equity Share Approach
Lessee has controlownership (S1 or 2)
Lessee does NOT have controlownership (S3)
(Figure 6) Categorizing emissions from leased assets by scope based on lease type and organizational boundary approach used Note ldquoSrdquo refers to the Scope
Categorizing GHG Emissions with Leased Assets
Many companies lease assets from other companies The accounting for leased assets (whether the emissions are Scope 1 2 or 3) depends on two factors the organizational boundary approach used and the type of leased asset The GHG Protocolrsquos Appendix ldquoCategorizing Emissions from Leased Assetsrdquo details the correct accounting methodology based on type of leased asset and organizational boundary approach used
Operational Boundaries
Operational boundaries are defined by ldquoscopesrdquo which categorize the emissions resulting either directly or indirectly from the companyrsquos operations and activities Figure 7 describes the most common sources of emissions in dairy processing
Scope 1
Scope 1 direct emissions occur from sources owned or controlled by the company In dairy processing most Scope 1 emissions are from stationary combustion However mobile emissions process emissions and fugitive emissions are also counted as Scope 1 if the
company owns or controls the activities or equipment associated with the emissions
Scope 2
Scope 2 indirect emissions are from the generation of purchased energy The emissions resulting from the production of grid electricity are accounted for under Scope 2 One of the primary uses of purchased electricity in dairy processing is for process cooling freezing and cold storage Electricity is also used to drive process motors fans pumps compressed air systems facility lighting and facility HVAC6
Scope 3
Scope 3 indirect emissions are a result of an organizationrsquos operations but are not owned or controlled by the company
Biogenic Methane and Nitrous Oxide Emissions
Sources of biogenic methane (CH4) and biogenic nitrous
oxide (N20) should be accounted for as Scope 1 process
emissions A common yet relatively minimal source of biogenic nitrous oxide emissions in dairy processing arises from land spreading a process in which nitrogen-rich wastewater is recycled to be used as fertilizer on local farms Nitrous oxide (N
2O) is naturally produced in
soils through the microbial processes of nitrification and denitrification The nitrogen in the wastewater increases mineral nitrogen availability resulting in both indirect and direct N
2O emissions at the site
12
copy 20
19 Innovation C
enter for US D
airy All rights reserved G
HG
Inven
tory
Gu
idan
ce
GHG Inventory Guidance
NOTE Reviewing a companyrsquos statement of values can be a good place to start when identifying company-owned assets Once the assets within the defined boundary are identified maintain an up to date list of company-owned facilities as part of the IMP
(Figure 7) Common Scope 1 2 and 3 emission sources in the dairy processing industry
Lighting HVAC
Machine drive topower pumpsmotors fans
and compressors
Processcooling
freezing andcold storage
Transportation (mobile emissions) and temperature
control (fugitive emissions)
Feed production and processing Milk production Waste disposal
On-site stationary combustion for industrial applications and other
emissions (mobile fugitive) from owned sources
Scope 2 Indirect emisions from purchased electricity
Scope 1Direct emissions from sources owned or controlled by the company
Scope 3
Indirect downstreamsources not owned or controlled by the company
Scope 3Indirect upstream sources not owned or controlled by the company
CO2 CH4 N2O HFCs PFCs SF6 NF3
13
copy 20
19 Innovation C
enter for US D
airy All rights reserved G
HG
Inven
tory
Gu
idan
ce
GHG Inventory GuidanceCalculating the N
20 emissions from land spreading
requires two sources of processor input data annual gallons of wastewater and the average wastewater Average wastewater is measured by Total Kjehldahl Nitrogen content (TKN) which is calculated as mg NL wastewater The input data can be applied to an equation outlined in the 2016 Field to Market Environmental and Socioeconomic Indicators for Measuring Outcomes of On-Farm Agricultural Production in the United States7 This is consistent with a Tier 1 approach as recommended by the Intergovernmental Panel on Climate Change (IPCC) The IPCC default value for total direct and indirect nitrous oxide emissions represents about 14 percent of the applied nitrogen from fertilizer To convert emissions from applied nitrogen to CO
2e apply the molecular
weight of nitrous oxide (4428) and the N2O Global
Warming Potential (GWP further described on page 8) value of 265 The equation for estimating Scope 1 process emissions from land spreading is detailed in the
box denoted Field to Market Equation for Estimating Land Spreading Emissions
While CH4 and N
2O biogenic emissions are reported
within Scope 1 CO2 emissions arising from biogenic
sources (ie biomass combustion) are reported independently from the ldquoscopesrdquo More specifically a reporting company (to the extent allowed by available data) should account for biogenic CO
2 emissions in a
separate memo item appended to the rest of the GHG inventory
Works Cited
1 WorldResourcesInstituteChapter3SettingOrganizationalBoundariesGHG Protocol Corporate Accounting and Reporting Standard Revised Edition(pp16-23)httpbitly2yhHn0z
2 TheClimateRegistryChapter4IdentifyingtheOrganizationalBoundaryGeneral Reporting Protocol Version 21(pp13-22)httpbitly36gHX03
3 WorldResourcesInstituteChapter4SettingOperationalBoundariesGHG Protocol Corporate Accounting and Reporting Standard Revised Edition(pp24-33)httpbitly2yhHn0z
4 TheClimateRegistryChapter5EmissionstoIncludeintheInventoryGeneral Reporting Protocol Version 21(pp32-38)httpbitly2rpZAXn
5 WorldResourcesInstituteGHGProtocolCorporateAccountingandReportingStandardRevisedEditionhttpbitly2yhHn0z
6 EPAEnergyStar2011EnergyEfficiencyImprovementandCostSavingOpportunitiesfortheDairyProcessingIndustryhttpbitly2jzJZkH
7 FieldtoMarketPartOneEnvironmentalIndicatorsEnvironmentalandSocioeconomicIndicatorsforMeasuringOutcomesofOn-FarmAgriculturalProductionintheUnitedStates(pp22)httpbitly2MTkw5h
Field to Market Equation for Estimating Land Spreading Emissions
Lbs N applied = (Total gallons of wastewater applied) X (3785 Lgal) X (0002 lbsg) X (0001 gmg) X Total Kjehldahl Nitrogen content (mg NL wastewater) Lbs CO
2e = (lbs N applied 100) X 14 percent X
(4428) X 265
Supporting Resources
In addition to the GHG Protocol Corporate Accounting and Reporting Standard this section of the document includes guidance from the following resources
y EPA GHG Inventory Guidance Direct Emissions from Stationary Combustion Sources1
y Environmental Protection Agency General Stationary Combustion Source (Subpart C) Calculating CO2
Emissions from Combustion EPA Greenhouse Gas Reporting Program2
y US EPA Center for Corporate Climate Leadership Emission Factors for Greenhouse Gas Inventories3
14
copy 20
19 Innovation C
enter for US D
airy All rights reserved G
HG
Inven
tory
Gu
idan
ce
GHG Inventory Guidance
Scope 1 Stationary Combustion This section provides guidance on calculating Scope 1 direct GHG emissions from stationary combustion Stationary fuel combustion emission sources are typically devices that combust solid liquid or gaseous fuel generally for the purposes of producing electricity generating steam or heat for dairy processing purposes
Chapter at a Glance
Identify Sources
Collect Activity Data
Quantify Emissions
Ensure Quality Control
Identify Sources Most emission sources from stationary combustion in dairy processing include mdash but are not limited to mdash boilers combustion turbine process heaters and generators Emission sources can be identified by creating a questionnaire requesting information about the types of fuels used for on-site stationary combustion at the facility how fuel consumption is tracked and the name and contact information of the energy providers Figure 8 summarizes the most common stationary combustion sources and fuels
(Figure 8) Common stationary combustion sources and fuels in dairy processing
1Stationary Combustion Sources and Fuels
Stationary Combustion Sources
Common Fuels Used
Boiler Natural gas Fuel oil Propane Diesel
Combustion Turbines Fuel oil Coal Propane Kerosene
Process Heaters Natural gas Propane
Incinerators Natural gas Propane
Collect Activity Data The activity data required for this calculation includes the amount of fuel consumed for each of the stationary combustion sources and the fuel characteristics of each type of fuel used
Fuel Consumption Collect data on the quantity of fuel consumed for combustion purposes Two calculation methods are outlined below The most common method for dairy processing facilities is the use of purchase records
y On-site metering The mass or volume flow of fuel at the input point to one or more combustion units These data can be gathered using measurement equipment such as scales or flow meters
y Purchase records The mass or volume of fuel entering the facility These data can be based on fuel receipts purchase records or data provided directly from the energy vendor and or customer online portal
Fuel Characteristics Determine the emission factor data based on the characteristics of the fuel combusted at each identified source Three methods are outlined below and on page 17 with the most common approach for dairy processing facilities being the use of actual fuel heating values or default heating values
2
continued on next page
NOTE Aggregate Reporting Tool users only need to enter fuel consumption volume The subsequent steps are automatically performed by the Tool
15
copy 20
19 Innovation C
enter for US D
airy All rights reserved G
HG
Inven
tory
Gu
idan
ce
Scope 1 Stationary Combustion
continued on next page
GHG Inventory Guidance
y Measured carbon content This is a measure of the total carbon in the fuel and can be determined through chemical analysis This is the most accurate emission factor data but it is often not practical for dairy processors to conduct a fuel analysis
y Actual fuel heating value A fuelrsquos heating value is a measure of the quantity of heat liberated during combustion of the fuel This information can often be found on utility bills which will list the amount of fuel purchased in terms of energy For instance most natural gas consumption data is detailed in thermal units and volumetric units To ensure consistent reporting all energy values should be reported in Gross Calorific Value (GCV) where the high heat value (HHV) is reported
y Default heating values If it is not practical to obtain data specific to fuel used then default heating values embedded in the Aggregate Reporting Tool will be applied to calculate emissions
Tip Emission factors and default high heating values are representative averages based on multiple fuel samples taken across the country For homogeneous fuels such as pipeline-quality natural gas
default heating values often provide a very accurate emissions estimate
2
QuickTip
NOTE Fuel metering equipment and readings are subject to error Therefore if this method is chosen calibration and testing should be performed to ensure accuracy
NOTE Aggregate Reporting Tool users should not follow this step A default heat value for each fuel type is embedded in Intelex Certain energy types such as natural gas solar and wind can be reported directly in energy units
Quantify Emissions Calculate Scope 1 stationary combustion emissions using the EPA Simplified GHG Emissions Calculator Use the EPA GHG Inventory Guidance Direct Emissions from Stationary Combustion Sources1 In conjunction with the calculator
The tool is effective in calculating CO2e emissions resulting from the combustion of fuels in stationary
combustion equipment (Figure 9 highlights the key features of the tool Figure 10 page 18 offers additional guidance on using the tool)
Additional Guidance for use of the Calculation Tool
y If fuel consumption data is recorded in physical units and the heat value is known convert fuel consumption data to energy units
y Under the Introduction tab supply information on the type of fuel consumed and select the industry sector ndash Manufacturing
3
(Figure 9) Stationary combustion emissions calculator tool highlights
Overview of Stationary Combustion Emissions CalculatorFeature Description
Emission Calculations Calculates CO2 CH
4 and N
2O emissions resulting from the combustion of
fuels in stationary combustion equipment Totals emissions in tons of CO2e
Unit Conversion Automatically converts data to common measurement units If certain units are available use the EIA Energy Conversion Calculator3 to first convert the units
16
copy 20
19 Innovation C
enter for US D
airy All rights reserved G
HG
Inven
tory
Gu
idan
ce
Scope 1 Stationary Combustion
GHG Inventory Guidance
y If using energy units the user is required to select high heating value HHV or low heating value LHV To maintain consistency with the Processor Handbook processors should try to use HHVs
ordm High Heating Value (HHV) is defined as the amount of heat released by a specified quantity (initially at 25degC) once it is combusted and the products have returned to a temperature of 25degC which takes into account the latent heat of vaporization of water in the combustion products
ordm Low Heating Value (LHV) is defined as the amount of heat released by combusting a specified quantity (initially at 25degC) and returning the temperature of the combustion products to 150degC which assumes the latent heat of vaporization of water in the reaction products is not recovered
y For additional information on heating values and guidance on calculating the emissions of biomass fuels emergency generators waste-derived fuels CO
2 capture and storage and non-combustion sources refer
to the EPArsquos GHG Inventory Guidance Direct Emissions from Stationary Combustion Sources
3
Ensure Quality Control The accuracy and transparency of an emissions calculation depends on the quality of the data collected the rigor of quality control measures and proper documentation Figure 10 highlights a few key quality control measures Figure 11 provides documentation guidelines Additional documentation information can be found in Chapter 7 of the GHG Protocol Corporate Accounting and Reporting Standard
4
Quality Control Guidelines Step 1 bull If using meters to collect activity data compare fuel-metered data with purchase records
to ensure accuracy of metering equipment
Step 2 bull Ensure consistent emission factors and GWPs are used across facilities
Step 3 bull Conduct an internal review to ensure units were converted correctly and emissions were accurately quantified
Step 4 bull If not using default emissions factors compare actual heating values to available default values
Step 5 bull Update the IMP to reflect any changes in monitoring equipment or procedures that could potentially affect the quality of emissions data
(Figure 10) Key quality control guidelines for stationary combustion emissions calculations
Documentation Guidelinesbull Description of facilities and stationary combustion sources and fuels
bull Description of methods applied to estimate emissions for each activity facility and combustion unit
bull List of metering or monitoring devices used (if applicable)
bull Information on the source(s) used to calculate the activity data This could include purchase receipts utility bills delivery receipts contract purchase on-site metered fuel documentation stock inventory documentation and heat content documentation from suppliers
bull Description of quality management procedures implemented
bull Summary of any changes that may have affected the accuracy consistency or completeness of calculations
(Figure 11) Scope 1 Stationary Combustion emissions documentation guidelines
17
copy 20
19 Innovation C
enter for US D
airy All rights reserved G
HG
Inven
tory
Gu
idan
ce
Scope 1 Stationary Combustion
GHG Inventory Guidance
Works Cited
Additional Resources
1 EPACenterforCorporateClimateLeadershipGreenhouseGasInventoryGuidanceDirectEmissionsfromStationaryCombustionSourcesVersion30httpbitly2KJrg2a
2 WorldResourcesInstituteMay2015GHGProtocolGuidanceDirectEmissionsfromStationaryCombustionVersion30httpbitly2gX1WbG
3 EnvironmentalProtectionAgencyGeneralStationaryCombustionSource(SubpartC)CalculatingCO2
EmissionsfromCombustionEPAGreenhouseGasReportingProgramhttpbitly2FPuNso
4 EPACenterforCorporateClimateLeadershipEmissionFactorsforGreenhouseGasInventoriesMarch92018httpswwwepagovclimateleadership
5 EnvironmentalProtectionAgencyDirect Emissions from Stationary Combustion Sources Greenhouse Gas Inventory GuidanceJanuary2016httpbitly2KJrg2a
yy WorldyResourcesyInstituteyGHGyProtocolyToolyforyGHGyEmissionsyfromyStationaryyCombustion httpbitly36c227z
yy WorldyResourcesyInstituteyGHGyProtocolyStationaryyCombustionyGuidanceyVersiony30yyhttpbitly2gX1WbG
yy EnergyyConversionyCalculatorsyUsedytoyconvertyphysicalyunitsytoyenergyyunitsyhttpsbitly33M6f04
yy EPAyCenteryforyCorporateyClimateyLeadershipyGreenhouseyGasyInventoryyGuidanceyDirectyEmissionsyfromyStationaryyCombustionySourcesyVersiony30yhttpbitly2KJrg2a
18
copy 20
19 Innovation C
enter for US D
airy All rights reserved G
HG
Inven
tory
Gu
idan
ce
GHG Inventory Guidance
Scope 1 Fugitive Emissions Fugitive emissions from refrigeration and air conditioning result from leakage and service over the operational life of the equipment and from disposal at the end of the useful life of the equipment The leakage of refrigerant gas is a small but significant source of GHG emissions because of a high GWP associated with these GHGs
Chapter at a Glance
Identify Sources
Collect Activity Data
Select Approach
Ensure Quality Control
NOTE HFCs and PFCs are a class of powerful greenhouse gases with GWP values that are typically 1000 times greater than CO
2 Since these GHGs have a significant warming ability careful attention should be
given to thoroughly account for and quantify fugitive emissions The significance of an emissions source in a companyrsquos IMP can only be established after it has been appropriately assessed and quantified
Supporting Resources
In addition to the GHG Protocol Corporate Accounting and Reporting Standard this section of the document draws on guidance from the following resources
y EPA GHG Inventory Guidance Direct Fugitive Emissions from Refrigeration Air Conditioning Fire Suppression and Industrial Gases1
y Climate Registry General Reporting Protocol Version 21 Chapter 16 Direct Fugitive Emissions from the Use of Refrigeration and Air Conditioning Equipment2
Collect Activity Data The activity data required to calculate fugitive emissions depends upon the calculation approach selected in Step 3
2
Identify Sources Most dairy processing facilities use non-halogenated refrigerants such as ammonia propane and isobutane for refrigeration These refrigerants are not GHGs and therefore are not reported in the inventory However HFC and PFC refrigerants used in refrigerated trailers and air conditioning units are common and the associated GHG emissions should be accounted for in company-owned and -controlled equipment Figure 12 lists fugitive emission sources that are common in dairy processing
1Common Fugitive Emission SourcesRefrigerated transport
Industrial process refrigeration
Cold storage warehouses
Mobile air conditioning
(Figure 12) Common sources of fugitive emissions in dairy processing
Quantify Emissions Calculate fugitive emissions by using the lsquoRefrigeration and ACrsquo tab on the EPA Simplified GHG Emissions Calculator The Aggregate Reporting Tool quantifies fugitive emissions according to the Mass Balance method (Option 1) in the Calculator Use this calculator in conjunction with the EPA Fugitive Emissions Guidance
3
continued on next page
Scope 1 Fugitive Emissions
19
copy 20
19 Innovation C
enter for US D
airy All rights reserved G
HG
Inven
tory
Gu
idan
ce
GHG Inventory Guidance
3Overview of Fugitive Emission Calculation Methods
Method Description Best Use
Screening Method A preliminary method to estimate emissions
Use only if fugitive emissions are relatively small If emissions are estimated or believed to be relatively large the company should use a more accurate and robust method as the emissions factors used in this method are highly uncertain
Sales-Based Method
Activity data based on purchase records and service records
For companies that maintain their own refrigerant equipment emissions are based on the amount of refrigerant purchased and used by the facility
Lifecycle Stage Method (Mass Balance Method)
Activity data based on total inventory of refrigerants
For companies that have contractors maintain equipment tracks emissions from installation servicing and disposal
(Figure 13) Calculation methods for quantifying fugitive emissions from refrigeration and air-conditioning equipment
Ensure Quality Control Implementing quality control measures and documentation measures are important for fugitive emissions calculations as failure to account for small releases of fluorinated compounds can lead to significant errors in a companyrsquos GHG inventory Additional information can be found in Chapter 7 of the GHG Protocol Corporate Accounting and Reporting Standard and Section 7 of the EPA Fugitive Emissions Guidance
4
Quality Control and Documentation for Fugitive Emission Calculationsbull Account for each GHG emissions source separately because of the differing GWPs
bull Provide information on the approach used to quantify direct fugitive emissions
bull Identify calculation errors and omissions by comparing facility emissions data against previous year calculations
bull Document activity data mdash stock inventory documentation purchase receipts delivery receipts contract purchases delivery receipts of equipment shipping or disposal records of equipment
bull Identify areas of uncertainty in emission calculations and use the most accurate data or conservative values
(Figure 14) Quality control and documentation guidelines for fugitive emissions calculations
20
copy 20
19 Innovation C
enter for US D
airy All rights reserved G
HG
Inven
tory
Gu
idan
ce
GHG Inventory Guidance
Scope 1 Fugitive Emissions
Works Cited
Additional Resources
1 EPACenterforCorporateClimateLeadershipGreenhouseGasInventoryGuidanceDirectFugitiveEmissionsfromRefrigerationAirConditioningFireSuppressionandIndustrialGaseshttpbitly2KHZgMn
2 ClimateRegistryJanuary2016Chapter16DirectFugitiveEmissionsfromtheUseofRefrigerationandAirConditioningEquipmentGeneral Reporting Protocol for the Voluntary Reporting Program Version 21(pp134)httpbitly2rpZAXn
yy WorldyResourcesyInstituteyGHGyProtocolyToolyforyRefrigerationyandyAir-ConditioningyEquipment httpwwwghgprotocolorgsitesdefaultfilesghgphfc-pfc_0xls
yy WorldyResourcesyInstituteyJanuaryy2005yGHGyProtocolyHFCyGuideytoyCalculationyWorksheetsyyVersiony10yhttpbitly2jCgwXg
yy WorldyResourcesyInstituteyGHGyProtocolyCorporateyAccountingyandyReportingyStandardyChaptery7yManagingyInventoryyQualityyhttpbitly2yhHn0z
21
copy 20
19 Innovation C
enter for US D
airy All rights reserved G
HG
Inven
tory
Gu
idan
ce
GHG Inventory Guidance
Scope 1 Mobile Combustion Emissions This section provides guidance on accounting for and calculating Scope 1 direct GHG emissions from owned or leased mobile sources (both on-road and non-road vehicles) that are within the companyrsquos inventory boundaries
Chapter at a Glance
Identify Sources
Collect Activity Data
Select Approach
Ensure Quality Control
Supporting Resources
This section of the document includes guidance the following resources
y EPA Center for Corporate Climate Leadership Greenhouse Gas Inventory Guidance Direct Emissions from Mobile Combustion Sources1
y The Climate Registry General Reporting Protocol Version 21 Chapter 13 Direct Emissions from Mobile Combustion2
Collect Activity Data GHG emissions from mobile combustion are most easily estimated by collecting data on the amount of fuel consumed distance traveled and vehicle and fuel characteristics for each identified source Figure 16 page 22 outlines the necessary activity data to perform this calculation
TIP If all the preferred activity data is not available the company should at a minimum provide fuel consumption data The referenced calculation tool will auto populate default emission factors for missing data
Identify Sources Scope 1 mobile emissions refer to a wide variety of company-owned or operated vehicles engines and equipment that generate GHG emissions through the combustion of various fuels while moving from one location to another They include vehicles used on roads for transportation of employees or distribution trucks as well as off-road vehicles engines and equipment used for many other purposes Equipment that can not move under its own power but can be transported site-to-site (eg an emergency generator) is defined as a stationary (not mobile) combustion source1 Owned company product distribution trucks are most likely the greatest sources of mobile emissions for dairy processors However if the processing company does not own or have direct operational control of vehicles or equipment these sources will be reported as Scope 3 not Scope 1 emissions A list of common mobile combustion emission sources can be found in Figure 15
1
Mobile Emission SourcesCommon Mobile Combustion Sources Common Fuels Used
On-Road Vehicles Company vehicles Gasoline
Combination trucks and fluid milk trucks
Diesel fuel gasoline bio-diesel
Non-Road Vehicles (Mobile Machinery)
Forklifts and non-road equipment Gasoline diesel fuel propane
Construction equipment Diesel fuel
(Figure 15) Common mobile emission sources and fuels used in dairy processing
2
QuickTip
continued on next page
22
copy 20
19 Innovation C
enter for US D
airy All rights reserved G
HG
Inven
tory
Gu
idan
ce
Scope 1 Mobile Combustion Emissions
GHG Inventory Guidance
Quantify Emissions Use the EPA Simplified GHG Emissions Calculator lsquoMobile Sourcesrsquo tab to quantify emissions from mobile combustion Refer to the EPA Direct Emissions from Mobile Combustion Sources for guidance on this category
This tool calculates the CO2 CH
4 and N
2O emissions of
y Vehicles that are ownedcontrolled by the company
y Transport by road rail air and water
y Mobile machinery such as agricultural and construction equipment
3
Ensure Quality Control The quality control and documentation guidelines outlined in Figure 17 can help to ensure data accuracy and transparency For more information about reducing uncertainty when calculating emissions from mobile sources refer to Section 6 of the EPA Direct Emissions from Mobile Combustion Sources
4
Quality Control and Documentation for Mobile Emission Calculationsbull Compare emission factors provided by fuel supplier or collected on-site with the EPA Center for
Corporate Climate Leadership Emission Factors for Greenhouse Gas Inventories
bull Document fuel consumption data with official logs of vehicle gauges fuel purchase receipts and storage tank records
bull Document distance traveled with odometer logs and calculated miles to destination
bull Document vehicle fuel economy with company records manufacturer records or with information from the EPA fuel economy website
2Activity Data for Mobile Emission Calculations
Type Data Needed
Fuel Consumption Number of gallons barrels cubic meters etc
Distance Traveled Number of miles kilometers
Vehicle Characteristics Vehicle type and model year
Fuel Characteristics Type of fuel and heating value
(Figure 16) Activity data that should be collected for each source of mobile combustion emissions
(Figure 17) Quality control and documentation for mobile emission calculations
23
copy 20
19 Innovation C
enter for US D
airy All rights reserved G
HG
Inven
tory
Gu
idan
ce
GHG Inventory Guidance
Scope 1 Mobile Combustion Emissions
Works Cited
Additional Resources
1 TheClimateRegistryJanuary2016GlossaryoftermsGeneral Reporting Protocol Version 21 (pp181)httpbitly2rpZAXn
2 EPACenterforCorporateClimateLeadershipJanuary2016GreenhouseGasInventoryGuidanceDirectEmissionsfromMobileCombustionSourceshttpbitly2JZ4lip
3 TheClimateRegistryJanuary2016Chapter13DirectEmissionsfromMobileCombustionGeneral Reporting Protocol Version 21httpbitly2rpZAXn
4 WorldResourcesInstitute2015SettingOperationalBoundariesThe GHG Protocol Corporate Accounting and Reporting Standard(pp25)httpbitly2yhHn0z
yy WorldyResourcesyInstituteyGHGyProtocolyToolyforyMobileyCombustionyVersiony26yhttpbitly2qSGWuV
yy EPAyCenteryforyCorporateyClimateyLeadershipyGreenhouseyGasyInventoryyGuidanceyDirectyEmissionsyfromyMobileyCombustionySourcesyhttpbitly2JZ4lip
yy WRIyGHGyEmissionyFactorsyCompilationyAyspreadsheetyofyemissionyfactorsyusedyinytheyGHGyProtocolyCalculatorsyhttpsbitly2NFLq0M
yy EPAyandyUSyDepartmentyofyEnergyyOfficialyUSygovernmentysourceyforyfuelyeconomyyinformationyhttpswwwfueleconomygovfegfindacarshtml
yy EPAyCenteryforyCorporateyClimateyLeadershipyChaptery6yUncertaintyyAssessmentyGreenhouseyGasyInventoryyGuidanceyDirectyEmissionsyfromyMobileyCombustionySourcesyhttpbitly2JZ4lip
yy EnvironmentalyDefenseyFundyClimateyCorpsyHandbook Chaptery15yEnergyyConsumptionyofycompanyyvehiclesyhttpbitly2MTc9GB
24
copy 20
19 Innovation C
enter for US D
airy All rights reserved G
HG
Inven
tory
Gu
idan
ce
GHG Inventory Guidance
Scope 2 Emissions from Purchased Energy This section presents methods used to calculate Scope 2 GHG emissions which are indirect emissions from the generation of purchased energy These are considered an indirect emissions source because they are a consequence of activities of the reporting organization but occur at sources owned and controlled by an outside entity (ie an electricity utility)
Chapter at a Glance
Identify Sources
Collect Activity Data
Quantify Emissions
Ensure Quality Control
Supporting Resources
In addition to the GHG Protocol this chapter draws on guidance from the following resources
y EPA Center for Corporate Climate Leadership Indirect Emissions from Purchased Electricity1
y The GHG Protocol Scope 2 Guidance An amendment to the GHG Protocol Corporate Standard2
y The Climate Registry General Reporting Protocol Chapter 5 Page 343
Defining Scope 2 Emissions
The GHG Protocol Scope 2 Guidance Amendment to the Corporate Standard which went into effect in January 2015 provides updated requirements and best practices for Scope 2 emissions accounting The updates were made to reflect changes in electricity markets and the growing choices companies have regarding the type of electricity purchased The most significant Scope 2 accounting change introduced is that companies are to account for and report Market-Based and Location-Based Scope 2 emissions Previously the protocol only required the Location-Based method
Market-Based Emissions
The Market-Based method reflects the GHG emissions associated with the specific choices a consumer (a dairy processor) makes regarding its electricity supplier or product as conveyed through contractual agreements between the processor and the provider The emission factors are supplier-specific emission factors or the emissions profiles associated with renewable energy credits (RECs) and power purchase agreements (PPAs)
Location-Based Emissions
The Location-Based method uses average emission factors for the electricity grids that are providing electricity to the facility4 That is the Location-Based approach considers average emissions intensities in the locations of electricity use while the Market-Based approach considers the emissions intensities of electricity products that the processor has specifically chosen
Calculating Scope 2 Emissions
When calculating Scope 2 emissions companies should do the following
y Companies should report both Market-Based and Location-Based Scope 2 emissions totals
y When a company enters into a supplier-specific contract (or other contract) in which a credible emission factor is unidentifiable the reporting company should simply use the grid-average emission factor as a proxy for that specific amount of contracted energy
y All instruments must meet certain quality criteria before they can be applied to the Market-Based emissions total These criteria are listed on page 60 of the GHG Protocolrsquos Scope 2 Guidance
A reporting company should select either the Location-Based approach or Market-Based approach when setting a Scope 2 target and tracking its performance
Since the predominant Scope 2 calculation method currently used across the dairy processing sector is the Location-Based method this document describes steps to calculate Location-Based emissions outlined in Figure 18 page 25
25
copy 20
19 Innovation C
enter for US D
airy All rights reserved G
HG
Inven
tory
Gu
idan
ce
GHG Inventory Guidance
Scope 2 Steps to Calculate Location-Based GuidelinesStep 1 Determine the amount of electricity purchased
bull The total electricity purchased and consumed during the reporting period in energy units MWh or kWh provide the most precise activity data For guidance on how to interpret utility bills see Chapter 7 of the EDF Climate Corps Handbook
Step 2 Select emission factors
bull Emission factors Companies that purchase electricity from the electric grid should use regional or sub-regional emission factors provided by the EPArsquos Emissions and Generation Resource Integrated Database eGRID Electricity is generated in varying ways across the US and eGRID emission factors help capture the GHG emissions associated with the forms of energy generation unique to the facilities region The EPArsquos eGRID sub-region map can be used to determine the appropriate sub-region for each facility
Step 3 Quantify emissions bull The EPA Simplified GHG Emissions Calculator which uses 2018 emission factors from eGRID Companies calculate emissions by inputting the amount of electricity purchased and selecting the eGRID sub- region in which the processing facility is located
(Figure 18) Steps to calculate Location-Based guidelines
Scope 2 Emissions from Purchased Energy
Works Cited
Additional Resources
1 EnvironmentalProtectionAgency2016IndirectEmissionsfromPurchasedElectricityGuidanceCenter for Corporate Climate Leadershiphttpbitly2HUTgCz
2 WorldResourcesInstitute2015GHGProtocolScope2GuidanceAn Amendment to The GHG Protocol Corporate Accounting and Reporting Standardhttpbitly2jzMLpZ
3 TheClimateRegistryGeneralReportingProtocolVersion212016Chapter5Emissions to Include in the Inventoryhttpsbitly2CFOB2d
4 TheGHGProtocolCorporateAccountingandReportingStandardWorldResourcesInstituteWorldBusinessCouncilforSustainableDevelopment2015httpbitly2yhHn0z
yy EDFyClimateyCorpsyHandbookyChaptery7 Benchmarkingyenergyyusageyandyinterpretingyutilityybills
yy EDFyClimateyCorpsyHandbookyChaptery16 Demandyresponseyandysmartygrid
GHG Inventory Guidance
Measurement and Estimation Uncertainty of GHG EmissionsGHG emissions uncertainty is dependent upon the quality of data collected and methods used to calculate emissions Several types of uncertainties associated with GHG inventories range from natural
variations such as human error to statistical uncertainty related to the indirect measurement of emissions (eg activity data and an emission factor) A well-designed IMP that follows the quality and documentation guidelines outlined in each section of this document can help reduce uncertainty
Chapter at a Glance
Emissions Uncertainty
Calculating Uncertainty
26
copy 20
19 Innovation C
enter for US D
airy All rights reserved G
HG
Inven
tory
Gu
idan
ce
Guidance on Uncertainty Assessment
The GHG Protocol Guidance on Uncertainty Assessment in GHG Inventories and Calculating Statistical Parameter Uncertainty describes the functionality of the tool and provides users with information on how to prepare interpret and utilize inventory uncertainty assessments The guidance is based on the IPCC Guidelines for National GHG Inventories
Uncertainty Assessment Calculator
The GHG Protocol Cross Sector Calculation Tool Measurement and Estimation Uncertainty of GHG Emissions is applicable to many industries and businesses regardless of sector The calculation tool aggregates parameter uncertainties across source categories and the entire inventory
Works Cited
Additional Resources
1 WorldResourcesInstitute2003GHGProtocolguidanceonuncertaintyassessmentinGHGinventoriesandcalculatingstatisticalparameteruncertaintyhttpbitly2KFbCVO
yy TheyGHGyProtocolyCrossySectoryCalculationyToolyMeasurementyandyEstimationyUncertaintyyofyGHGyEmissionsyhttpbitly2Pp8oKU
yy TheyGHGyProtocolyGuidanceyonyUncertaintyyAssessmentyinyGHGyInventoriesyandyCalculatingyStatisticalyParameteryUncertaintyyGuidanceyonyhowytoyuseytheyMeasurementyandyEstimationyUncertaintyyofyGHGyEmissionsycalculationytoolyhttpbitly2KFbCVO
yy TheyGHGyProtocolyCorporateyAccountingyandyReportingyStandardyChaptery7yManagingyInventoryyQualityyhttpbitly2yhHn0z
27
copy 20
19 Innovation C
enter for US D
airy All rights reserved G
HG
Inven
tory
Gu
idan
ce
GHG Inventory Guidance
Target SettingGHG emissions reduction target setting and mitigation strategies have become a priority issue across company supply chains The increasing number of public GHG emission reduction commitments are strategic decisions grounded in opportunities to capture business value and reduce company risk
Chapter at a Glance
Target Setting
Science-Based Targets
Target Setting Resources
Companies can set two broad types of GHG reduction target metrics mdash an absolute emissions target or an intensity emissions target Intensity targets specify emissions reductions relative to productivity or economic output such as tons of CO
2elbs of product
produced Both intensity and absolute targets specify a reduction in emissions relative to a historical baseline year They ensure that emissions reductions are maintained with company growth Companies should carefully evaluate both types before choosing a target metric and consider seeking outside support to determine the target type and actual target Several organizations can assist in establishing targets
y WWF Climate Savers
y Climate Registry
y Pew Business Environmental Leadership Council
y Carbon Trust
Once an emissions target is defined it is crucial to consistently track performance over time Specifically a company may be required to recalculate its baseline year inventory whenever the following happens
y Significant changes in the structure of the reporting company
y Significant changes in the calculation methodology
ordm Improved emission factors
ordm Improved activity data
y Discovery of significant errors or smaller errors that are collectively significant
The GHG Protocol Corporate Standard does not have a set definition for ldquosignificantrdquo however a company should determine its own significance threshold (ie 2 percent) to define when changes in aggregate should trigger recalculation of the baseline year inventory
Structural changes are defined as the transfer of ownership or control of emitting activities from one company to another
They can occur via
y Mergers acquisitions and divestments
y Outsourcing or in-sourcing of emitting activities
For more information on emissions tracking over time companies may reference the GHG Protocol Corporate Standard
Science-Based Targets
The Science-Based Target Initiative is a collaboration between the Carbon Disclosure Project (CDP) UN Global Compact World Resources Institute and World Wildlife Fund to assist corporations in establishing GHG targets that are in line with climate science The initiative defines Science-Based Targets as ldquoTargets in line with the level of decarbonization required to keep global temperature increase below 2deg C compared to pre-industrial temperatures as described in the Assessment Report of the Intergovernmental Panel on Climate Change (IPCC)rdquo As of October 2019 the Science-Based Targets Initiative requires Scope 1 and 2 targets to be more ambitious and in line with ldquowell below 2deg Crdquo pathways
Aligning targets with climate science is becoming the business norm It is widely accepted that global action must be taken to avoid some of the most disastrous and irreversible impacts of climate change The following resources provide the causes and predicted impacts of climate change
y NASA Global Climate Change2
y NOAA National Centers for Environmental Information3
y The Global Carbon Project4
y The visualization of temperature change from 1880 to 2016 as analyzed by NASArsquos Goddard Institute for Space Studies
NOTE Recalculation is not needed if out- or in-sourced activities were previously included in a different scope
28
copy 20
19 Innovation C
enter for US D
airy All rights reserved G
HG
Inven
tory
Gu
idan
ce
By adopting Science-Based Targets dairy processing companies take a leadership role in addressing climate change by connecting corporate sustainability goals to scientifically established thresholds Case studies featuring companies with Science-Based Targets demonstrate the benefits and reasons for setting reduction goals that are in line with climate science
Examples of benefits derived from Science-Based Targets are
y Cut costs and reduce risk Companies with ambitious targets can ensure durability and efficiency in a future where fossil fuels are increasingly more expensive
y Build credibility and reputation Sustainability has become a lens through which a company is evaluated Taking leadership action on climate change can build a companyrsquos reputation among key stakeholders
y Drive innovation Adopting Science-Based Targets can drive company and industry-wide innovation and help to turn climate risk into a business opportunity
GHG Inventory Guidance
Works Cited
Additional Resources
1 CitationWorldEconomicForumTheGlobalRisksReport2017httpbitly2roi5LW
2 NASAGlobalClimateChangehttpsclimatenasagov
3 NOAANationalCentersforEnvironmentalInformationhttpswwwngdcnoaagov
4 TheGlobalCarbonProjecthttpwwwglobalcarbonprojectorg
yy WWFyClimateySavers httpclimatesaversorg
yy ClimateyRegistry httpswwwtheclimateregistryorg
yy PewyBusinessyEnvironmentalyLeadershipyCouncilyhttpswwwc2esorgour-workbelc
yy CarbonyTrust httpswwwcarbontrustcomhome
yy NASArsquosyGoddardyInstituteyforySpaceyStudies httpssvsgsfcnasagov4546
yy CarbonyBudgetyhttpbitly2WifVwi
yy 2016yCarbonyBudgetyReportyhttpglobalcarbonbudget2016org
yy TheyUSyDepartmentyofyEnergyyMapyhttpbitly2rpEt8p
yy ClimateyChangeyandyResourceyScarcity httpspwcto2wiXKx7
yy TheyImpactyofyCorporateySustainabilityyonyOrganizationalyProcessyandyPerformance TheyHarvardyBusinessyJournalyRobertyGyEcclesyIoannisyIoannouyampyGeorgeySerafeim httpshbsme2FP1eqW
Resources for Setting Science-Based Targets
yy IntroductionytoyScience-BasedyTargetsyhttpbitly2rpLt4m
yy CallytoyAction DetailedyGuidelinesyforySettingyScience-BasedyTargetsyhttpsbitly33Okx0o
yy Science-BasedyTargetsyandyCDPyScoringyhttpbitly2KFhnmg
yy BestyPracticesyforySettingyandyAchievingyScience-BasedyTargets PresentationyatytheyClimateyLeadersyConferenceyMarchy2017yhttpbitly2jBMuTF
yy MindytheyScienceyhttpbitly2IfBqJE
yy Science-BasedyTargets Targetysettingypitfallsyandylessonsylearnedy(pdf)yhttpbitly2FPus8Q
yy Science-BasedyTargets Targetysettingypitfallsyandylessonsylearnedy(webinar)yhttpsvimeocom233570395
GHG Inventory Guidance
29
copy 20
19 Innovation C
enter for US D
airy All rights reserved G
HG
Inven
tory
Gu
idan
ce
Resources for Reducing GHG EmissionsOnce a GHG emissions inventory has been developed and a reduction target has been adopted a company should identify the main sources of GHGs and evaluate the cost-effectiveness of emission reduction measures Below are resources tools and webinars to assist companies in reducing GHG emissions
Energy Efficiency
yy EPAyEnergyyStary2011yEnergyyEfficiencyyImprovementyandyCostySavingyOpportunitiesyforytheyDairyyProcessingyIndustryyAymanualycreatedybyyEnergyyStarytoyassistydairyyprocessorsyinyidentifyingyenergyyefficiencyyimprovementsyasyanyimportantywayytoyreduceycostsyandytoyincreaseypredictableyearningsyhttpbitly345L8Wi
yy EPAyEnergyyStaryPortfolioyManageryAnyonlineytoolythatycanybeyusedytoymeasureyandytrackyenergyyandywateryconsumptionyasywellyasygreenhouseygasyemissionsyassociatedywithycommercialybuildingsyyhttpbitly2FP3Epu
yy HVACy(heatingyventilationyandyairyconditioning)yClimateyCorpsyHandbookyChaptery9yOverviewyofyhowytoysurveyycurrentyHVACysystemyanalyzeyresultsyofyanyenergyyaudityforyHVACysystemyandyperformyayfinancialyanalysesyonyrecommendationsyofyenergyyauditorsyhttpbitly2rod1qI
yy CarbonyTrustyHeatingyventilationyandyairyconditioningy(HVAC)yenergyyefficiencyyguideyAyguideytoyimproveyenergyyefficiencyyofyheatingyventilationyandyairyconditioningyhotywateryandyboilers httpbitly2jAHmiE
yy LightingyinycommercialybuildingsyClimateyCorpsyHandbookyChaptery10yDescribesyhowytoyidentifyylightingyopportunitiesyforyenergyysavingsyinycommercialybuildingsyandyhowytoydevelopyestimatesyofyenergyyusageyandycalculateytheyestimatedysavingsypotentialyhttpbitly2rod1qI
yy DemandyResponseyandySmartyGridyClimateyCorpsyHandbookyChaptery16yOverviewyofydemandyresponsey(DR)yandypossibleyenergyysavingsyandyrevenueyopportunitiesyhttpbitly2rod1qI
yy DemandyandyResponseyResearchyCenteryPublicationsyandyinformationyonydemandyresponseyandysmartygridyinfrastructureytoybestyinformyendyusersyhowytoytemporarilyyreduceyenergyyusageyinyresponseytoyeitherypriceyorysystemyreliabilityytriggersyhttpsdrrclblgov
yy CarbonyTrustyEnergyyManagementySelf-AssessmentyToolyAnyExcelyworkbookyandyguidanceydocumentythatyassessyayorganizationrsquosyenergyymanagementyhttpbitly2whnWrY
yy CarbonyValueyAnalysisyToolyTheyCarbonyValueyAnalysisyTooly(CVAT)ywasycreatedybyytheyWorldyResourcesyInstituteytoyassistyprojectymanagersywithyfactoringytheypriceyofycarbonywhenyevaluatingyreductionyprojectsyhttpbitly2jB0pt6
yy CarbonyTrustyBuildingyEnergyyEfficiencyyGuideytoyimprovingybuildingyfabricyandyinsulationyandyinstallingyappropriateycontrolsytoysaveymoneyyandycutycarbonyemissionsyhttpbitly2rmNI9C
yy CarbonyTrustyRefrigerationyImproveyenergyyefficiencyyofyyourychillersyandyrefrigerationysystemsywithyouryenergy-savingyguidanceyhttpbitly2JUV62Q
yy EPAyCenteryforyCorporateyClimateyLeadershipyAylistyofyfreeyGHGyinventoryyrelatedywebinarsyandyeventsyhttpbitly2FOcALR
Renewable Energy
yy TheyDepartmentyofyEnergyrsquosyOfficeyofyEnergyyEfficiencyyandyRenewableyEnergyy(EERE)yProvidesyinformationyonyindustrialyenergy-consumingysystemsyboileryandysteamysystemycompressedyairymotorsyfansypumpsyandyprocessyheatingyhttpbitly2K0x0nb
yy PropertyyAssessedyCleanyEnergyy(PACE)yEnergyyefficiencyyfinancingyopportunitiesyhttpbitly2FPWGjX
yy DatabaseyofyStateyIncentivesyforyRenewablesyandyEfficiencyyOverviewyofystateyandyfederalyincentivesyandypoliciesydesignedytoyhelpycompaniesyadoptyrenewableyenergyyprogramsyhttpwwwdsireusaorg
continued on next page
GHG Inventory Guidance
30
copy 20
19 Innovation C
enter for US D
airy All rights reserved G
HG
Inven
tory
Gu
idan
ce
Additional Resources
yy GuideytoyPurchasingyGreenyPoweryAycooperativeyeffortybetweenytheyEPAytheyUSyDepartmentyofyEnergyytheyWorldyResourcesyInstituteyandytheyCenteryforyResourceySolutionsythatyprovidesycurrentyandypotentialybuyersyofygreenypowerywithyinformationyaboutygreenypowerypurchasingyhttpbitly2JU8WlK
yy InnovationsyinyVoluntaryyRenewableyEnergyyProcurementyAyguideyfromyNationalyRenewableyEnergyyLaboratoryrsquosy(NREL)ythatyoutlinesymethodsyforyexpandingyaccessyandyloweringycostyforycommunitiesygovernmentsyandybusinessesyhttpswwwnrelgovdocsfy12osti54991pdf
Mobile Emissions
yy ReduceyMobileyEmissionsyVehicleyselectionyACEEEyGreeneryCarsyIdentifyyvehiclesythatyareymostyfuelyefficientyandylearnyaboutymarketytrendsyinyautomotiveytechnologyyhttpsgreenercarsorg
yy EPAyGreenyVehicleyGuideyOverviewyofyvehiclesyfuelyuseyandytheyimpactyonybothytheyenvironmentyandybottomylineyhttpswwwepagovgreenvehicles
yy FuelyEconomyyGuideyTheyUSyEnvironmentalyProtectionyAgencyy(EPA)yandyUSyDepartmentyofyEnergyy(DOE)yAyguideytoyhelpybuyersyidentifyytheymostyfuel-efficientyvehiclesyhttpbitly2FPkVP6
copy2019 Innovation Center for US Dairy All rights reserved
About the Innovation Center for US Dairyreg
The Innovation Center for US Dairyreg is a forum that
brings together the dairy community to address the
changing needs and expectations of consumers through
a framework of shared best practices and accountability
Initiated in 2008 by dairy farmers through the dairy
checkoff we collaborate on efforts that are important
both to us and our valued customers ndash priorities like
animal care environmental stewardship food safety and
traceability and community contributions The Innovation
Center is committed to continuous improvement from
farm to table striving to ensure a socially responsible
and economically viable dairy community
Visit USDairycom for more information about the
Innovation Center for US Dairy
wwwUSDairycom bull InnovationCenterUSDairycom
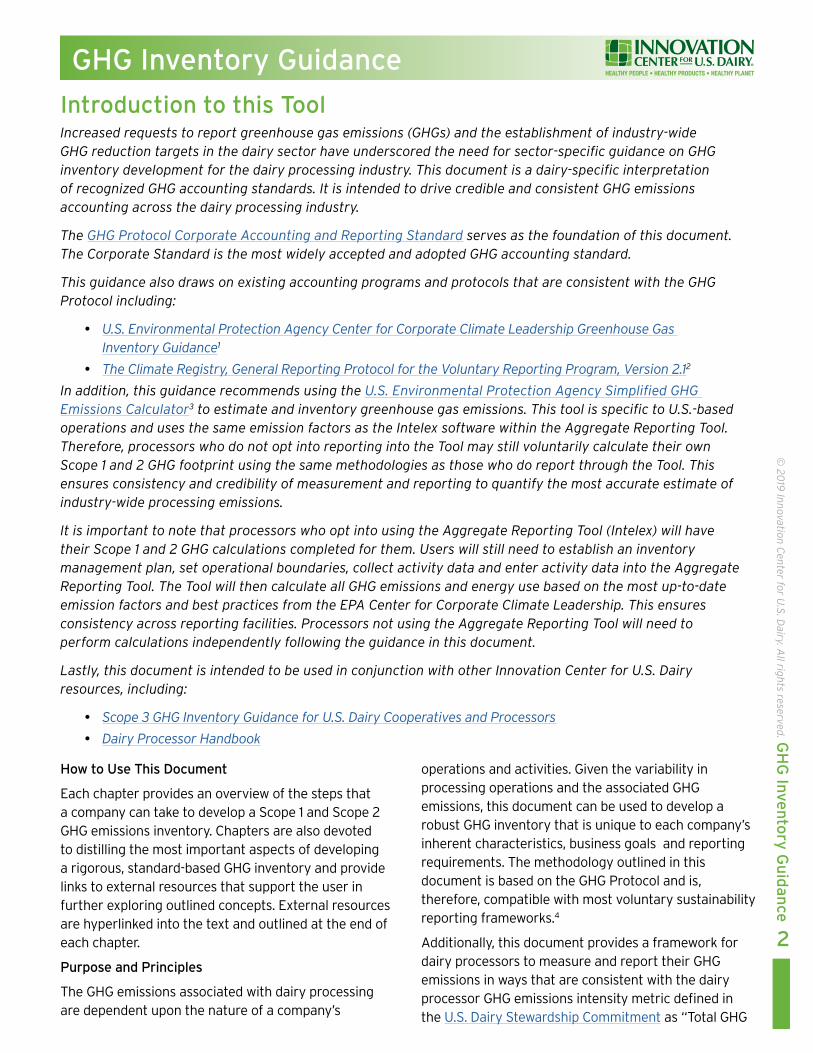
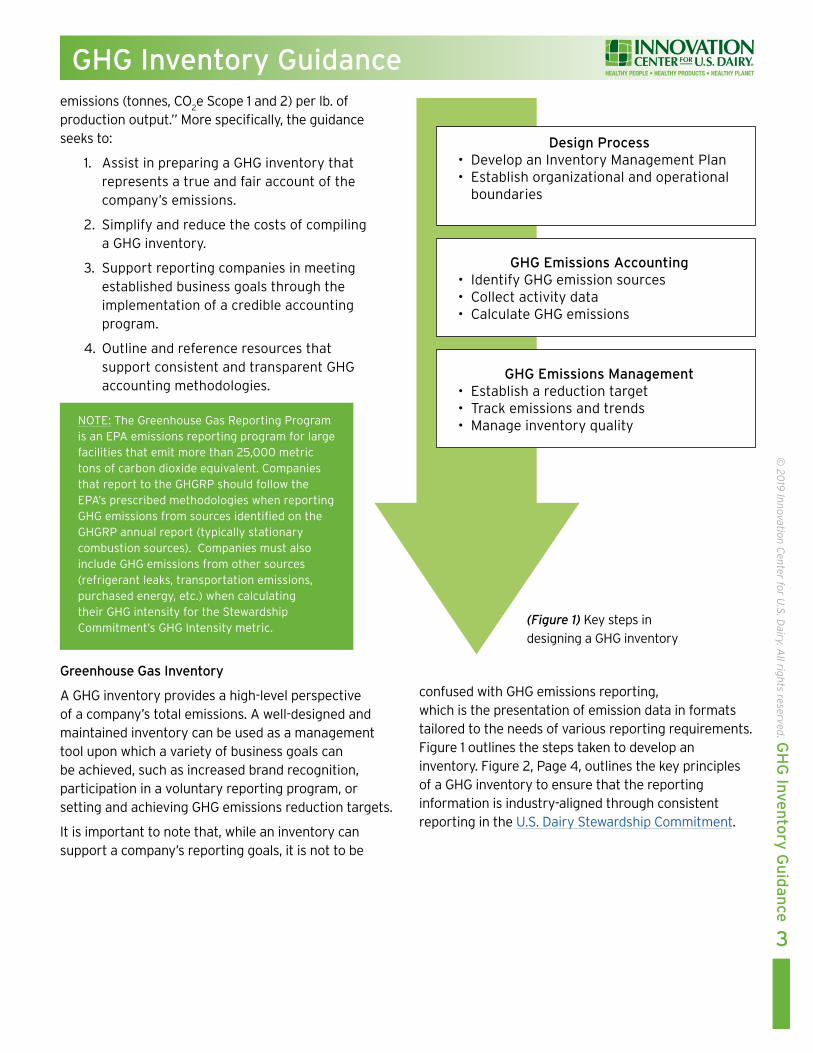
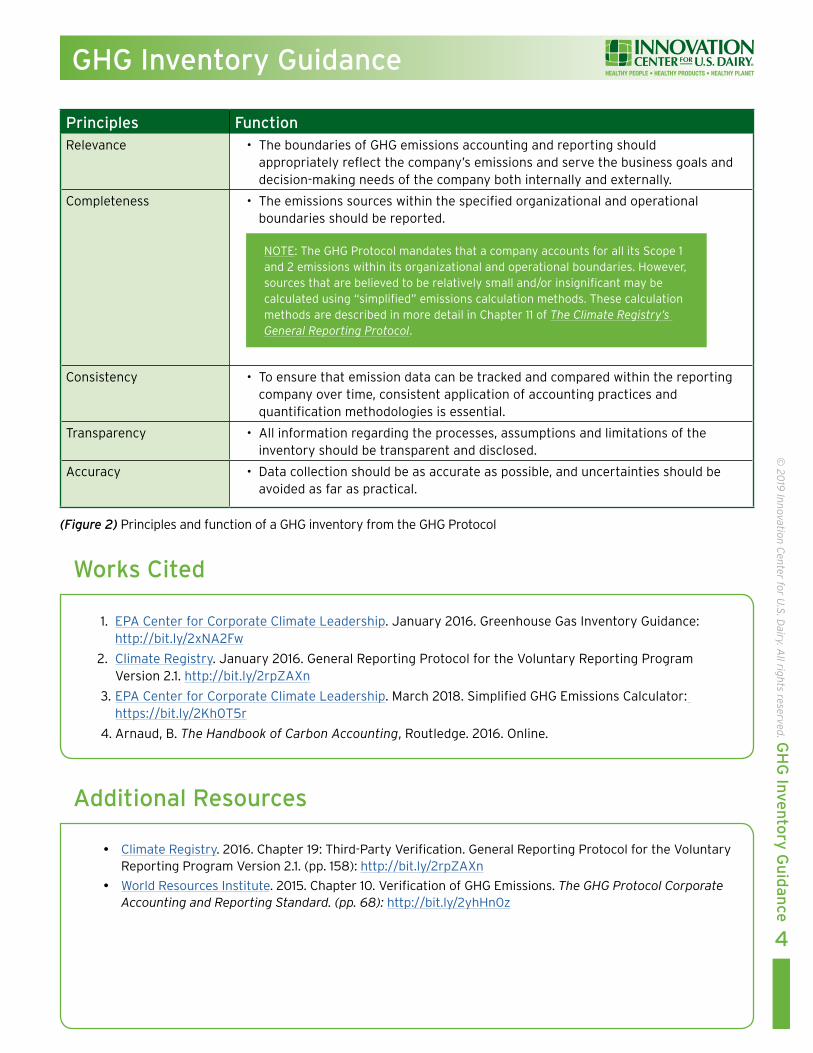
4
copy 20
19 Innovation C
enter for US D
airy All rights reserved G
HG
Inven
tory
Gu
idan
ce
GHG Inventory Guidance
Works Cited
Additional Resources
1 EPACenterforCorporateClimateLeadershipJanuary2016GreenhouseGasInventoryGuidancehttpbitly2xNA2Fw
2 ClimateRegistryJanuary2016GeneralReportingProtocolfortheVoluntaryReportingProgramVersion21httpbitly2rpZAXn
3EPACenterforCorporateClimateLeadershipMarch2018SimplifiedGHGEmissionsCalculatorhttpsbitly2Kh0T5r
4ArnaudBThe Handbook of Carbon AccountingRoutledge2016Online
yy ClimateyRegistryy2016yChaptery19yThird-PartyyVerificationyGeneralyReportingyProtocolyforytheyVoluntaryyReportingyProgramyVersiony21y(ppy158)yhttpbitly2rpZAXn
yy WorldyResourcesyInstitutey2015yChaptery10yVerificationyofyGHGyEmissionsyThe GHG Protocol Corporate Accounting and Reporting Standard (pp 68) httpbitly2yhHn0z
Principles FunctionRelevance bull The boundaries of GHG emissions accounting and reporting should
appropriately reflect the companyrsquos emissions and serve the business goals and decision-making needs of the company both internally and externally
Completeness bull The emissions sources within the specified organizational and operational boundaries should be reported
Consistency bull To ensure that emission data can be tracked and compared within the reporting company over time consistent application of accounting practices and quantification methodologies is essential
Transparency bull All information regarding the processes assumptions and limitations of the inventory should be transparent and disclosed
Accuracy bull Data collection should be as accurate as possible and uncertainties should be avoided as far as practical
NOTE The GHG Protocol mandates that a company accounts for all its Scope 1 and 2 emissions within its organizational and operational boundaries However sources that are believed to be relatively small andor insignificant may be calculated using ldquosimplifiedrdquo emissions calculation methods These calculation methods are described in more detail in Chapter 11 of The Climate Registryrsquos General Reporting Protocol
(Figure 2) Principles and function of a GHG inventory from the GHG Protocol
5
copy 20
19 Innovation C
enter for US D
airy All rights reserved G
HG
Inven
tory
Gu
idan
ce
GHG Inventory Guidance
Inventory Management Plan This chapter describes the development of an inventory management plan (IMP) the systematic process of outlining the steps to create a credible and verifiable corporate-wide GHG inventory
Chapter at a Glance
Developing a Plan
Implementing a Plan
Overcoming Barriers
Developing an Inventory Management Plan
An Inventory Management Plan (IMP) should include the description of the managerial and technical responsibilities and arrangements made for collecting calculating and maintaining GHG emission data1 Establishing and maintaining an accurate IMP allows for tracking decisions and changes over time creates institutional knowledge of accounting procedures and allows for more efficient and effective emissions accounting and reporting To assist with the development or improvement of an IMP companies can refer to the templates listed in the Additional Resources section at the end of the chapter
The first step in developing an IMP is to consider how a GHG inventory will meet the companyrsquos goals Dairy processing companies frequently cite the following GHG inventory goals
y Identify GHG risks and reduction opportunities in the value chain
y Identify cost effective reduction opportunities
y Participate in voluntary mandatory andor customer reporting programs
y Acquire eco-labeling or certification
y Set GHG emission reduction targets measure progress toward targets and report outcomes to stakeholders
Every reporting company will have a unique IMP that should incorporate the foundational components outlined in the previous section
Implementing an Inventory Management Plan
Once the company objectives are established and the IMP is outlined the reporting company can take steps to implement the IMP which is further defined in Figure 3 The integration of an IMP into a companyrsquos operations can often be met with internal organizational barriers To address this issue see Additional Resources at the end of the chapter
Steps for Implementing an Inventory Management Plan
1 Establish an Inventory Quality Team This team is responsible for maintaining the GHG inventory program and coordinating interactions necessary for data collection and data validation
2 Outline IMP Procedures The plan should include procedures from initial data collection to final reporting To ensure accuracy the IMP should include practical measures for quality checks and documentation
3 Perform Quality Checks Internal quality checks should focus on data handling documentation and emission calculations (eg ensuring that correct unit conversions are used consistently) Find guidance on quality assurance in the EPA Inventory Management Plan (IMP) Checklist
4 Perform Source-Category Specific Quality Checks This includes a more rigorous investigation of the application of boundaries adjustment procedures and the quality of data used This information can be used to support an uncertainty assessment Find guidance in the Climate Registry General Reporting Protocol (Page 188)
5 Establish Reporting Documentation and Archiving Procedures Establish record keeping procedures that specify what and how information will be documented and archived
(Figure 3) Steps for implementing an Inventory Management Plan based on guidance from The Climate Registry General Reporting Protocol
6
copy 20
19 Innovation C
enter for US D
airy All rights reserved G
HG
Inven
tory
Gu
idan
ce
GHG Inventory Guidance
Works Cited
Additional Resources
1 ClimateRegistryJanuary2016GeneralReportingProtocolfortheVoluntaryReportingProgramVersion21httpbitly2rpZAXn
yy GHGyProtocolyCorporateyAccountingyandyReportingyStandardyChaptery2yBusinessyGoalsyandyInventoryyDesignyhttpbitly2yhHn0z
yy TheyClimateyRegistryyGeneralyReportingyProtocolyVersiony21yAppendixyAyManagingyInventoryyQualityyhttpbitly2rpZAXn
Resources for Developing an Inventory Management Plan
yy TheyEPAyInventoryyManagementyPlany(IMP)yChecklistyOutlinesytheynecessaryycomponentsythatyshouldybeyincludedyinyanyIMPyhttpbitly2HWMfgo
yy TheyClimateyLeadersySimplifiedyInventoryyManagementyPlanyAysampleytemplateymeantytoyhelpyoutlineytheyreportingyrequirementsyofytheyGHGyProtocolyCorporateyStandardybutyprovidesyaygoodyoverviewyofywhatycanybeyincludedyinyanyinventoryyhttpbitly2IsiIyt
yy TheyGHGyProtocolyReportingyTemplateyAysampleytemplateymeantytoyhelpyoutlineytheyreportingyrequirementsyofytheyGHGyProtocolyCorporateyStandardybutyprovidesyaygoodyoverviewyofywhatycanybeyincludedyinyanyinventoryyhttpbitly2IdTDaH
Overcoming Internal Organizational Barriers
yy TheyVirtuousyCycleyofyStrategicyEnergyyManagementyTheyEnvironmentalyDefenseyFundy(EDF)yinycollaborationywithyMITySloanySchoolyofyManagementyhasycreatedyayframeworkyforyunderstandingyhowyanyorganizationycanyovercomeyinternalybarriersyandydriveycorporateyenergyymanagementyinitiativesyyhttpbitly2whDbkN
yy SmartyEnergyyBestyPracticesySurveyyDevelopedybyyEDFytheysurveyyidentifiesybottlenecksyandytargetsykeyyopportunitiesytoyimproveyenergyyperformanceyandycutyemissionsyhttpbitly2jykKyY
yy SmartyEnergyyBestyPracticesyRubricyUsedyalongywithytheySmartyEnergyyBestyPracticesySurveyythisytoolyhelpsymanagersyassessytoyhelpymanagersyassessytheyoverallyhealthyandyprogressyofytheiryGHGyinventoryyprogramyhttpbitly2wgRqGH
yy PeopleyPoweredyLeveragingyEmployeeyEngagementytoyAccelerateySustainabilityyEffortsyAywebinaryhostedybyyEDFythatydiscussesybestypracticesyinyengagingyemployeesyaroundysustainabilityyinitiativesyhttpbitly2In7prC
yy EnergyyManagementySelf-AssessmentyToolyCarbonyTrustytoolythatyassessesyyouryorganizationsycurrentypositionyinyrespectytoyenergyymanagementywithyanyenergyymanagementymatrixyandyassessmentyworkbookyhttpbitly2whnWrY
yy CarbonyTrustySMEyNetworkyAnyonlineycommunityyaimsytoyincreaseytheysharingyofybestypracticeyandystimulateyideasybetweenySMEsylookingytoyreduceycarbonyemissionsyhttpbitly2FNmahL
yy CarbonyTrustyDownloadableypostersyandystickersyforyincreasedyemployeeyawarenessyyhttpbitly2JWZcY1
yy CarbonyTrustyMakingytheybusinessycaseyforyaycarbonyreductionyprojectyhttpbitly36bXcqP
yy EmployeeyAwarenessyandyOfficeyEnergyyEfficiencyyGuideyforyemployeeyengagementyinyofficeybuildingsyincludingyenergy-savingyguidesyemployeeyengagementymaterialsypostersyandystickersyyhttpbitly2NlxpUn
Greenhouse Gases GHGs trap heat radiated from the sun in the atmosphere warming the planetrsquos surface Many GHGs occur naturally in the atmosphere but their increase in concentration from human activities has altered the earthrsquos radiative balance For more information on GHGs and their interaction with Earthrsquos atmosphere refer to
y EPArsquos overview of Greenhouse Gases1
y NASA How Global Warming Stacks Up2
y NASA Temperature Puzzle3
The GHG Protocol Corporate Accounting and Reporting Standard covers the accounting and reporting of seven GHGs covered by the Kyoto Protocol
y Carbon dioxide (CO2)
y Methane (CH4)
y Nitrous oxide (N2O)
y Hydrofluorocarbons (HFCs)
y Perfluorocarbons (PFCs)
y Sulphur hexafluoride (SF6)
y Nitrogen trifluoride (NF3)
Global Warming Potential
GHGs released into the atmosphere have different radiative effects depending on the unique qualities of the gas The factor describing the radiative forcing impact of one unit of a given GHG relative to one unit of CO
2 is known as the
Global Warming Potential (GWP)
Since the amount of warming a gas causes over a given period (normally 100 years) varies GHG emission calculations must account for the GWP of each gas GWP is an index with CO
2 having an index value of 1 The GWP for all other GHGs refers to the
amount of warming they cause compared to CO2 For instance the radiative forcing
impact of one unit of methane (CH4) is 28 times more powerful than one unit of CO
2
(Figure 4 page 8)
The GHG Protocol and the majority of accounting standards use GWP values established by the Intergovernmental Panel on Climate Change (IPCC) The IPCC updates GWP values as scientific understanding develops and the fifth assessment report AR5 contains the most recent values The IPCC is currently in its sixth assessment cycle and AR6 will be finalized in 2022 The complete list of GWP values relative to CO
2 is provided by the GHG Protocol
7
copy 20
19 Innovation C
enter for US D
airy All rights reserved G
HG
Inven
tory
Gu
idan
ce
GHG Inventory Guidance
continued on next page
Greenhouse Gas Accounting Terminology Greenhouse gas (GHG) emissions are estimated through the application of defined accounting principles This chapter intends to provide an overview of commonly used terminology and concepts that are the foundation of GHG accounting
Chapter at a Glance
Greenhouse Gases
Global Warming Potential
Carbon Dioxide Equivalent
Emission Factors
Activity Data
Global Warming Potential
By default the GHG Protocol calculation tools are set to calculate emissions using AR5 The following guidelines can assist reporting companies in using GWP values and are drawn from the GHG Protocol February 2013 Accounting and Reporting Standard Amendment The reporting company should
y Use 100-year GWP values from the IPCC
y Use GWP values from the most recent IPCC assessment report (currently the Fifth Assessment Report) unless requirements of a specific reporting program differ
y Use the same GWPs for the current inventory period and the base year as well as for inventories prepared according to the Scope 3 Standard to maintain consistency across time and scopes
y Report the source of the GWP values and indicate if multiple IPCC assessment reports have been used
Carbon Dioxide Equivalent
Carbon dioxide equivalent (CO2e) is the standard unit used to compare and
account for emissions from various GHGs based on their global warming potential For instance Figure 4 illustrates that CO
2 has a GWP of 1 and CH
4
(methane) has a GWP of approximately 28 (on a 100-year time horizon) Therefore for every tonne of CH
4 emitted an equivalent of 28 tonnes of CO
2
would be emitted Since one tonne of a particular GHG is not the same GWP as one tonne of another this standard unit is a simple way to normalize and express GHGs as an equivalent of CO
2
Emission Factors An emission factor is used to calculate the GHG emissions for a given source relative to units of activity Emission factors reflect average values by sector technology type andor fuel type For example eGRID emission factors for electricity use in the NPCC New England sub region indicate that for every MWh of electricity consumed 5637 lbs of CO
2e are emitted This emission factor can
be used to determine the total CO2e emissions resulting from the companyrsquos
purchased electricity in that region To maximize accuracy it is important to select emission factors that are appropriate for the relevant context
The default emission factors embedded in the referenced calculators are updated and relevant to the calculation context of the tool A full list of the emission factors can be found in the US EPA Center for Corporate Climate Leadership Emission Factors for Greenhouse Gas Inventories
8
copy 20
19 Innovation C
enter for US D
airy All rights reserved G
HG
Inven
tory
Gu
idan
ce
(Figure 4) The Global Warming Potential of IPCC recognized GHGs AR5
GHG Inventory Guidance
continued on next page
PFCs6630 - 11100
HFCs4 - 12400
N2O
265CH
4
28C0
2
1
SF6
23500 NF3
16100
9
copy 20
19 Innovation C
enter for US D
airy All rights reserved G
HG
Inven
tory
Gu
idan
ce
GHG Inventory Guidance
Activity Data Activity data is a key input for the calculation of GHG emissions and refers to the data associated with an activity that generates GHG emissions such as gallons of gasoline consumed from company cars This activity data is collected in physical units (gallons) or energy units (therms) and then combined with an emissions factor and the relevant greenhouse gas GWP value to calculate C0
2e
The collection of activity data is the primary responsibility of the reporting company and will often be the most significant challenge when developing a GHG inventory Therefore establishing robust activity data collection procedures is essential The following measures are useful for ensuring the collection of quality activity data
Steps for Gathering Activity Data
1 Convert fuel consumption data from physical to energy units
y The Energy Information Administration has a conversion tool to easily convert different fuels to energy contents
2 Develop data collection procedures in the IMP to standardize collection practices
3 Compare current year data with historical trends to identify inconsistent changes that are over 10 percent Inconsistencies should be investigated
4 Compare activity data from multiple reference sources (eg government survey data or data compiled by other dairy processing companies) with company data when possible
Works Cited
1 EPA2017UnderstandingGlobalWarmingPotentialshttpbitly2gXtxJF
2 WorldResourcesInstituteThe GHG Protocol Corporate Accounting and Reporting Standard2013RequiredGreenhouseGasesinInventoriesaccountingandreportingstandardamendmenthttpbitly2yhHn0z
3 TheClimateRegistry2016GeneralReportingProtocolfortheVoluntaryReportingProgramVersion21httpbitly2pIjLTj
NOTE If reporting into the Aggregate Reporting Tool energy data should be reported in volumemass units (ie gallons of fuel therms of gas) The conversion from volumemass to energy is done automatically using a predetermined energy factor
10
copy 20
19 Innovation C
enter for US D
airy All rights reserved G
HG
Inven
tory
Gu
idan
ce
GHG Inventory Guidance
Additional Resources
Greenhouse Gases
yy EPAyOverviewyofyGreenhouseyGases httpbitly2ro6IU4
yy NASAyGlobalyClimateyChangeyHowyGlobalyWarmingyStacksyUpyAythree-minuteyvideoythatyexplainsyhowydifferentyfactorsycontributeytoyglobalywarmingyhttpsgonasagov2JXkvsp
yy NASAyGlobalyClimateyChangeyTemperatureyPuzzleyAyfiveyminuteyvideoythatyexplainsytheyimpactsyofytheysunrsquosyenergyyEarthrsquosyreflectanceyandygreenhouseygassesyonyglobalywarming httpsgonasagov2rpUt9T
Global Warming Potential
yy yEPAyUnderstandingyGlobalyWarmingyPotentials httpbitly2gXtxJF
yy yIntergovernmentalyPanelyonyClimateyChange httpswwwipccch
yy GHGyProtocolyGlobalyWarmingyPotentialyValuesyTableyofyGWPsyfromytheySARyAR4yandyAR5yreportyhttpbitly2z6chdf
Emission Factors
yy GHGyProtocolyEmissionyFactorsyfromyCrossySectoryToolsy2017yhttpbitly2q3eZzN
11
copy 20
19 Innovation C
enter for US D
airy All rights reserved G
HG
Inven
tory
Gu
idan
ce
Supporting Resources
This section of the document draws on guidance from the following resources
Organizational Boundaries
y GHG Protocol Corporate Accounting and Reporting Standard Revised Edition Chapter 3 Setting Organizational Boundaries1
y General Reporting Protocol Version 21 Chapter 4 Identifying the Organizational Boundary2
Operational Boundaries
y GHG Protocol Corporate Accounting and Reporting Standard Revised Edition Chapter 4 Setting Operational Boundaries3
y General Reporting Protocol Version 21 Chapter 5 Emissions to Include in the Inventory4
Organizational Boundaries
Organizational boundaries are generally high-level boundaries that determine which business operations and facilities are part of the GHG inventory Due to differences in legal and organizational structures each companyrsquos organizational boundary will vary The GHG Protocol outlines three approaches for developing organizational boundaries mdash the Equity Share the Operational Control and the Financial Control Approach (Figure 6) It is important to note that these different boundary approaches need to be applied independently Furthermore a reporting company should use the same approach for all Scope 1 and 2 emissions categories when compiling a GHG emissions inventory and use this same approach for subsequent reporting periods to ensure consistency when tracking emissions over time
Equity Share Approach
The reporting company accounts for GHG emissions that are wholly- or partially-owned according to its share of equity in that operation regardless of whether operational or financial control is exerted
Operational Control Approach
The reporting company accounts for 100 percent of emissions from operations over which it or one of its subsidiaries has operational control However it should be emphasized that having operational control does not mean that a company necessarily has the authority to make all decisions concerning an operation Therefore a company may report emissions from a leased asset as Scope 3 if the company can demonstrate and state clearly the reasons that it does not have operational control (GHG Protocol Appendix F 2006)
Financial Control Approach
The reporting company accounts for 100 percent of emissions from operations over which it or one of its subsidiaries has financial control
If a reporting company is applying the Operational or Financial Control approach it does not need to account for emissions arising from operations over which it does not control
GHG Inventory Guidance
Establishing Inventory Boundaries This chapter describes the role of and process for developing GHG inventory boundaries Inventory boundaries determine which business operations and emissions will be accounted for in a companyrsquos GHG inventory Organizational boundaries define the operations and facilities
included in the inventory while the operational boundaries categorize the emissions resulting either directly or indirectly from the organizationrsquos operations and facilities
Chapter at a Glance
Organizational Boundaries
Operational Boundaries
NOTE A reporting company that wholly-owns and controls its operations is responsible for all associated emissions In this case the outcome will be the same whichever approach is used5
LesseersquosTenantrsquos PerspectiveCapital Lease Operating Lease
Operational Control Approach
Lessee has controlownership (S1 or 2)
Financial Control or Equity Share Approach
Lessee has controlownership (S1 or 2)
Lessee does NOT have controlownership (S3)
(Figure 6) Categorizing emissions from leased assets by scope based on lease type and organizational boundary approach used Note ldquoSrdquo refers to the Scope
Categorizing GHG Emissions with Leased Assets
Many companies lease assets from other companies The accounting for leased assets (whether the emissions are Scope 1 2 or 3) depends on two factors the organizational boundary approach used and the type of leased asset The GHG Protocolrsquos Appendix ldquoCategorizing Emissions from Leased Assetsrdquo details the correct accounting methodology based on type of leased asset and organizational boundary approach used
Operational Boundaries
Operational boundaries are defined by ldquoscopesrdquo which categorize the emissions resulting either directly or indirectly from the companyrsquos operations and activities Figure 7 describes the most common sources of emissions in dairy processing
Scope 1
Scope 1 direct emissions occur from sources owned or controlled by the company In dairy processing most Scope 1 emissions are from stationary combustion However mobile emissions process emissions and fugitive emissions are also counted as Scope 1 if the
company owns or controls the activities or equipment associated with the emissions
Scope 2
Scope 2 indirect emissions are from the generation of purchased energy The emissions resulting from the production of grid electricity are accounted for under Scope 2 One of the primary uses of purchased electricity in dairy processing is for process cooling freezing and cold storage Electricity is also used to drive process motors fans pumps compressed air systems facility lighting and facility HVAC6
Scope 3
Scope 3 indirect emissions are a result of an organizationrsquos operations but are not owned or controlled by the company
Biogenic Methane and Nitrous Oxide Emissions
Sources of biogenic methane (CH4) and biogenic nitrous
oxide (N20) should be accounted for as Scope 1 process
emissions A common yet relatively minimal source of biogenic nitrous oxide emissions in dairy processing arises from land spreading a process in which nitrogen-rich wastewater is recycled to be used as fertilizer on local farms Nitrous oxide (N
2O) is naturally produced in
soils through the microbial processes of nitrification and denitrification The nitrogen in the wastewater increases mineral nitrogen availability resulting in both indirect and direct N
2O emissions at the site
12
copy 20
19 Innovation C
enter for US D
airy All rights reserved G
HG
Inven
tory
Gu
idan
ce
GHG Inventory Guidance
NOTE Reviewing a companyrsquos statement of values can be a good place to start when identifying company-owned assets Once the assets within the defined boundary are identified maintain an up to date list of company-owned facilities as part of the IMP
(Figure 7) Common Scope 1 2 and 3 emission sources in the dairy processing industry
Lighting HVAC
Machine drive topower pumpsmotors fans
and compressors
Processcooling
freezing andcold storage
Transportation (mobile emissions) and temperature
control (fugitive emissions)
Feed production and processing Milk production Waste disposal
On-site stationary combustion for industrial applications and other
emissions (mobile fugitive) from owned sources
Scope 2 Indirect emisions from purchased electricity
Scope 1Direct emissions from sources owned or controlled by the company
Scope 3
Indirect downstreamsources not owned or controlled by the company
Scope 3Indirect upstream sources not owned or controlled by the company
CO2 CH4 N2O HFCs PFCs SF6 NF3
13
copy 20
19 Innovation C
enter for US D
airy All rights reserved G
HG
Inven
tory
Gu
idan
ce
GHG Inventory GuidanceCalculating the N
20 emissions from land spreading
requires two sources of processor input data annual gallons of wastewater and the average wastewater Average wastewater is measured by Total Kjehldahl Nitrogen content (TKN) which is calculated as mg NL wastewater The input data can be applied to an equation outlined in the 2016 Field to Market Environmental and Socioeconomic Indicators for Measuring Outcomes of On-Farm Agricultural Production in the United States7 This is consistent with a Tier 1 approach as recommended by the Intergovernmental Panel on Climate Change (IPCC) The IPCC default value for total direct and indirect nitrous oxide emissions represents about 14 percent of the applied nitrogen from fertilizer To convert emissions from applied nitrogen to CO
2e apply the molecular
weight of nitrous oxide (4428) and the N2O Global
Warming Potential (GWP further described on page 8) value of 265 The equation for estimating Scope 1 process emissions from land spreading is detailed in the
box denoted Field to Market Equation for Estimating Land Spreading Emissions
While CH4 and N
2O biogenic emissions are reported
within Scope 1 CO2 emissions arising from biogenic
sources (ie biomass combustion) are reported independently from the ldquoscopesrdquo More specifically a reporting company (to the extent allowed by available data) should account for biogenic CO
2 emissions in a
separate memo item appended to the rest of the GHG inventory
Works Cited
1 WorldResourcesInstituteChapter3SettingOrganizationalBoundariesGHG Protocol Corporate Accounting and Reporting Standard Revised Edition(pp16-23)httpbitly2yhHn0z
2 TheClimateRegistryChapter4IdentifyingtheOrganizationalBoundaryGeneral Reporting Protocol Version 21(pp13-22)httpbitly36gHX03
3 WorldResourcesInstituteChapter4SettingOperationalBoundariesGHG Protocol Corporate Accounting and Reporting Standard Revised Edition(pp24-33)httpbitly2yhHn0z
4 TheClimateRegistryChapter5EmissionstoIncludeintheInventoryGeneral Reporting Protocol Version 21(pp32-38)httpbitly2rpZAXn
5 WorldResourcesInstituteGHGProtocolCorporateAccountingandReportingStandardRevisedEditionhttpbitly2yhHn0z
6 EPAEnergyStar2011EnergyEfficiencyImprovementandCostSavingOpportunitiesfortheDairyProcessingIndustryhttpbitly2jzJZkH
7 FieldtoMarketPartOneEnvironmentalIndicatorsEnvironmentalandSocioeconomicIndicatorsforMeasuringOutcomesofOn-FarmAgriculturalProductionintheUnitedStates(pp22)httpbitly2MTkw5h
Field to Market Equation for Estimating Land Spreading Emissions
Lbs N applied = (Total gallons of wastewater applied) X (3785 Lgal) X (0002 lbsg) X (0001 gmg) X Total Kjehldahl Nitrogen content (mg NL wastewater) Lbs CO
2e = (lbs N applied 100) X 14 percent X
(4428) X 265
Supporting Resources
In addition to the GHG Protocol Corporate Accounting and Reporting Standard this section of the document includes guidance from the following resources
y EPA GHG Inventory Guidance Direct Emissions from Stationary Combustion Sources1
y Environmental Protection Agency General Stationary Combustion Source (Subpart C) Calculating CO2
Emissions from Combustion EPA Greenhouse Gas Reporting Program2
y US EPA Center for Corporate Climate Leadership Emission Factors for Greenhouse Gas Inventories3
14
copy 20
19 Innovation C
enter for US D
airy All rights reserved G
HG
Inven
tory
Gu
idan
ce
GHG Inventory Guidance
Scope 1 Stationary Combustion This section provides guidance on calculating Scope 1 direct GHG emissions from stationary combustion Stationary fuel combustion emission sources are typically devices that combust solid liquid or gaseous fuel generally for the purposes of producing electricity generating steam or heat for dairy processing purposes
Chapter at a Glance
Identify Sources
Collect Activity Data
Quantify Emissions
Ensure Quality Control
Identify Sources Most emission sources from stationary combustion in dairy processing include mdash but are not limited to mdash boilers combustion turbine process heaters and generators Emission sources can be identified by creating a questionnaire requesting information about the types of fuels used for on-site stationary combustion at the facility how fuel consumption is tracked and the name and contact information of the energy providers Figure 8 summarizes the most common stationary combustion sources and fuels
(Figure 8) Common stationary combustion sources and fuels in dairy processing
1Stationary Combustion Sources and Fuels
Stationary Combustion Sources
Common Fuels Used
Boiler Natural gas Fuel oil Propane Diesel
Combustion Turbines Fuel oil Coal Propane Kerosene
Process Heaters Natural gas Propane
Incinerators Natural gas Propane
Collect Activity Data The activity data required for this calculation includes the amount of fuel consumed for each of the stationary combustion sources and the fuel characteristics of each type of fuel used
Fuel Consumption Collect data on the quantity of fuel consumed for combustion purposes Two calculation methods are outlined below The most common method for dairy processing facilities is the use of purchase records
y On-site metering The mass or volume flow of fuel at the input point to one or more combustion units These data can be gathered using measurement equipment such as scales or flow meters
y Purchase records The mass or volume of fuel entering the facility These data can be based on fuel receipts purchase records or data provided directly from the energy vendor and or customer online portal
Fuel Characteristics Determine the emission factor data based on the characteristics of the fuel combusted at each identified source Three methods are outlined below and on page 17 with the most common approach for dairy processing facilities being the use of actual fuel heating values or default heating values
2
continued on next page
NOTE Aggregate Reporting Tool users only need to enter fuel consumption volume The subsequent steps are automatically performed by the Tool
15
copy 20
19 Innovation C
enter for US D
airy All rights reserved G
HG
Inven
tory
Gu
idan
ce
Scope 1 Stationary Combustion
continued on next page
GHG Inventory Guidance
y Measured carbon content This is a measure of the total carbon in the fuel and can be determined through chemical analysis This is the most accurate emission factor data but it is often not practical for dairy processors to conduct a fuel analysis
y Actual fuel heating value A fuelrsquos heating value is a measure of the quantity of heat liberated during combustion of the fuel This information can often be found on utility bills which will list the amount of fuel purchased in terms of energy For instance most natural gas consumption data is detailed in thermal units and volumetric units To ensure consistent reporting all energy values should be reported in Gross Calorific Value (GCV) where the high heat value (HHV) is reported
y Default heating values If it is not practical to obtain data specific to fuel used then default heating values embedded in the Aggregate Reporting Tool will be applied to calculate emissions
Tip Emission factors and default high heating values are representative averages based on multiple fuel samples taken across the country For homogeneous fuels such as pipeline-quality natural gas
default heating values often provide a very accurate emissions estimate
2
QuickTip
NOTE Fuel metering equipment and readings are subject to error Therefore if this method is chosen calibration and testing should be performed to ensure accuracy
NOTE Aggregate Reporting Tool users should not follow this step A default heat value for each fuel type is embedded in Intelex Certain energy types such as natural gas solar and wind can be reported directly in energy units
Quantify Emissions Calculate Scope 1 stationary combustion emissions using the EPA Simplified GHG Emissions Calculator Use the EPA GHG Inventory Guidance Direct Emissions from Stationary Combustion Sources1 In conjunction with the calculator
The tool is effective in calculating CO2e emissions resulting from the combustion of fuels in stationary
combustion equipment (Figure 9 highlights the key features of the tool Figure 10 page 18 offers additional guidance on using the tool)
Additional Guidance for use of the Calculation Tool
y If fuel consumption data is recorded in physical units and the heat value is known convert fuel consumption data to energy units
y Under the Introduction tab supply information on the type of fuel consumed and select the industry sector ndash Manufacturing
3
(Figure 9) Stationary combustion emissions calculator tool highlights
Overview of Stationary Combustion Emissions CalculatorFeature Description
Emission Calculations Calculates CO2 CH
4 and N
2O emissions resulting from the combustion of
fuels in stationary combustion equipment Totals emissions in tons of CO2e
Unit Conversion Automatically converts data to common measurement units If certain units are available use the EIA Energy Conversion Calculator3 to first convert the units
16
copy 20
19 Innovation C
enter for US D
airy All rights reserved G
HG
Inven
tory
Gu
idan
ce
Scope 1 Stationary Combustion
GHG Inventory Guidance
y If using energy units the user is required to select high heating value HHV or low heating value LHV To maintain consistency with the Processor Handbook processors should try to use HHVs
ordm High Heating Value (HHV) is defined as the amount of heat released by a specified quantity (initially at 25degC) once it is combusted and the products have returned to a temperature of 25degC which takes into account the latent heat of vaporization of water in the combustion products
ordm Low Heating Value (LHV) is defined as the amount of heat released by combusting a specified quantity (initially at 25degC) and returning the temperature of the combustion products to 150degC which assumes the latent heat of vaporization of water in the reaction products is not recovered
y For additional information on heating values and guidance on calculating the emissions of biomass fuels emergency generators waste-derived fuels CO
2 capture and storage and non-combustion sources refer
to the EPArsquos GHG Inventory Guidance Direct Emissions from Stationary Combustion Sources
3
Ensure Quality Control The accuracy and transparency of an emissions calculation depends on the quality of the data collected the rigor of quality control measures and proper documentation Figure 10 highlights a few key quality control measures Figure 11 provides documentation guidelines Additional documentation information can be found in Chapter 7 of the GHG Protocol Corporate Accounting and Reporting Standard
4
Quality Control Guidelines Step 1 bull If using meters to collect activity data compare fuel-metered data with purchase records
to ensure accuracy of metering equipment
Step 2 bull Ensure consistent emission factors and GWPs are used across facilities
Step 3 bull Conduct an internal review to ensure units were converted correctly and emissions were accurately quantified
Step 4 bull If not using default emissions factors compare actual heating values to available default values
Step 5 bull Update the IMP to reflect any changes in monitoring equipment or procedures that could potentially affect the quality of emissions data
(Figure 10) Key quality control guidelines for stationary combustion emissions calculations
Documentation Guidelinesbull Description of facilities and stationary combustion sources and fuels
bull Description of methods applied to estimate emissions for each activity facility and combustion unit
bull List of metering or monitoring devices used (if applicable)
bull Information on the source(s) used to calculate the activity data This could include purchase receipts utility bills delivery receipts contract purchase on-site metered fuel documentation stock inventory documentation and heat content documentation from suppliers
bull Description of quality management procedures implemented
bull Summary of any changes that may have affected the accuracy consistency or completeness of calculations
(Figure 11) Scope 1 Stationary Combustion emissions documentation guidelines
17
copy 20
19 Innovation C
enter for US D
airy All rights reserved G
HG
Inven
tory
Gu
idan
ce
Scope 1 Stationary Combustion
GHG Inventory Guidance
Works Cited
Additional Resources
1 EPACenterforCorporateClimateLeadershipGreenhouseGasInventoryGuidanceDirectEmissionsfromStationaryCombustionSourcesVersion30httpbitly2KJrg2a
2 WorldResourcesInstituteMay2015GHGProtocolGuidanceDirectEmissionsfromStationaryCombustionVersion30httpbitly2gX1WbG
3 EnvironmentalProtectionAgencyGeneralStationaryCombustionSource(SubpartC)CalculatingCO2
EmissionsfromCombustionEPAGreenhouseGasReportingProgramhttpbitly2FPuNso
4 EPACenterforCorporateClimateLeadershipEmissionFactorsforGreenhouseGasInventoriesMarch92018httpswwwepagovclimateleadership
5 EnvironmentalProtectionAgencyDirect Emissions from Stationary Combustion Sources Greenhouse Gas Inventory GuidanceJanuary2016httpbitly2KJrg2a
yy WorldyResourcesyInstituteyGHGyProtocolyToolyforyGHGyEmissionsyfromyStationaryyCombustion httpbitly36c227z
yy WorldyResourcesyInstituteyGHGyProtocolyStationaryyCombustionyGuidanceyVersiony30yyhttpbitly2gX1WbG
yy EnergyyConversionyCalculatorsyUsedytoyconvertyphysicalyunitsytoyenergyyunitsyhttpsbitly33M6f04
yy EPAyCenteryforyCorporateyClimateyLeadershipyGreenhouseyGasyInventoryyGuidanceyDirectyEmissionsyfromyStationaryyCombustionySourcesyVersiony30yhttpbitly2KJrg2a
18
copy 20
19 Innovation C
enter for US D
airy All rights reserved G
HG
Inven
tory
Gu
idan
ce
GHG Inventory Guidance
Scope 1 Fugitive Emissions Fugitive emissions from refrigeration and air conditioning result from leakage and service over the operational life of the equipment and from disposal at the end of the useful life of the equipment The leakage of refrigerant gas is a small but significant source of GHG emissions because of a high GWP associated with these GHGs
Chapter at a Glance
Identify Sources
Collect Activity Data
Select Approach
Ensure Quality Control
NOTE HFCs and PFCs are a class of powerful greenhouse gases with GWP values that are typically 1000 times greater than CO
2 Since these GHGs have a significant warming ability careful attention should be
given to thoroughly account for and quantify fugitive emissions The significance of an emissions source in a companyrsquos IMP can only be established after it has been appropriately assessed and quantified
Supporting Resources
In addition to the GHG Protocol Corporate Accounting and Reporting Standard this section of the document draws on guidance from the following resources
y EPA GHG Inventory Guidance Direct Fugitive Emissions from Refrigeration Air Conditioning Fire Suppression and Industrial Gases1
y Climate Registry General Reporting Protocol Version 21 Chapter 16 Direct Fugitive Emissions from the Use of Refrigeration and Air Conditioning Equipment2
Collect Activity Data The activity data required to calculate fugitive emissions depends upon the calculation approach selected in Step 3
2
Identify Sources Most dairy processing facilities use non-halogenated refrigerants such as ammonia propane and isobutane for refrigeration These refrigerants are not GHGs and therefore are not reported in the inventory However HFC and PFC refrigerants used in refrigerated trailers and air conditioning units are common and the associated GHG emissions should be accounted for in company-owned and -controlled equipment Figure 12 lists fugitive emission sources that are common in dairy processing
1Common Fugitive Emission SourcesRefrigerated transport
Industrial process refrigeration
Cold storage warehouses
Mobile air conditioning
(Figure 12) Common sources of fugitive emissions in dairy processing
Quantify Emissions Calculate fugitive emissions by using the lsquoRefrigeration and ACrsquo tab on the EPA Simplified GHG Emissions Calculator The Aggregate Reporting Tool quantifies fugitive emissions according to the Mass Balance method (Option 1) in the Calculator Use this calculator in conjunction with the EPA Fugitive Emissions Guidance
3
continued on next page
Scope 1 Fugitive Emissions
19
copy 20
19 Innovation C
enter for US D
airy All rights reserved G
HG
Inven
tory
Gu
idan
ce
GHG Inventory Guidance
3Overview of Fugitive Emission Calculation Methods
Method Description Best Use
Screening Method A preliminary method to estimate emissions
Use only if fugitive emissions are relatively small If emissions are estimated or believed to be relatively large the company should use a more accurate and robust method as the emissions factors used in this method are highly uncertain
Sales-Based Method
Activity data based on purchase records and service records
For companies that maintain their own refrigerant equipment emissions are based on the amount of refrigerant purchased and used by the facility
Lifecycle Stage Method (Mass Balance Method)
Activity data based on total inventory of refrigerants
For companies that have contractors maintain equipment tracks emissions from installation servicing and disposal
(Figure 13) Calculation methods for quantifying fugitive emissions from refrigeration and air-conditioning equipment
Ensure Quality Control Implementing quality control measures and documentation measures are important for fugitive emissions calculations as failure to account for small releases of fluorinated compounds can lead to significant errors in a companyrsquos GHG inventory Additional information can be found in Chapter 7 of the GHG Protocol Corporate Accounting and Reporting Standard and Section 7 of the EPA Fugitive Emissions Guidance
4
Quality Control and Documentation for Fugitive Emission Calculationsbull Account for each GHG emissions source separately because of the differing GWPs
bull Provide information on the approach used to quantify direct fugitive emissions
bull Identify calculation errors and omissions by comparing facility emissions data against previous year calculations
bull Document activity data mdash stock inventory documentation purchase receipts delivery receipts contract purchases delivery receipts of equipment shipping or disposal records of equipment
bull Identify areas of uncertainty in emission calculations and use the most accurate data or conservative values
(Figure 14) Quality control and documentation guidelines for fugitive emissions calculations
20
copy 20
19 Innovation C
enter for US D
airy All rights reserved G
HG
Inven
tory
Gu
idan
ce
GHG Inventory Guidance
Scope 1 Fugitive Emissions
Works Cited
Additional Resources
1 EPACenterforCorporateClimateLeadershipGreenhouseGasInventoryGuidanceDirectFugitiveEmissionsfromRefrigerationAirConditioningFireSuppressionandIndustrialGaseshttpbitly2KHZgMn
2 ClimateRegistryJanuary2016Chapter16DirectFugitiveEmissionsfromtheUseofRefrigerationandAirConditioningEquipmentGeneral Reporting Protocol for the Voluntary Reporting Program Version 21(pp134)httpbitly2rpZAXn
yy WorldyResourcesyInstituteyGHGyProtocolyToolyforyRefrigerationyandyAir-ConditioningyEquipment httpwwwghgprotocolorgsitesdefaultfilesghgphfc-pfc_0xls
yy WorldyResourcesyInstituteyJanuaryy2005yGHGyProtocolyHFCyGuideytoyCalculationyWorksheetsyyVersiony10yhttpbitly2jCgwXg
yy WorldyResourcesyInstituteyGHGyProtocolyCorporateyAccountingyandyReportingyStandardyChaptery7yManagingyInventoryyQualityyhttpbitly2yhHn0z
21
copy 20
19 Innovation C
enter for US D
airy All rights reserved G
HG
Inven
tory
Gu
idan
ce
GHG Inventory Guidance
Scope 1 Mobile Combustion Emissions This section provides guidance on accounting for and calculating Scope 1 direct GHG emissions from owned or leased mobile sources (both on-road and non-road vehicles) that are within the companyrsquos inventory boundaries
Chapter at a Glance
Identify Sources
Collect Activity Data
Select Approach
Ensure Quality Control
Supporting Resources
This section of the document includes guidance the following resources
y EPA Center for Corporate Climate Leadership Greenhouse Gas Inventory Guidance Direct Emissions from Mobile Combustion Sources1
y The Climate Registry General Reporting Protocol Version 21 Chapter 13 Direct Emissions from Mobile Combustion2
Collect Activity Data GHG emissions from mobile combustion are most easily estimated by collecting data on the amount of fuel consumed distance traveled and vehicle and fuel characteristics for each identified source Figure 16 page 22 outlines the necessary activity data to perform this calculation
TIP If all the preferred activity data is not available the company should at a minimum provide fuel consumption data The referenced calculation tool will auto populate default emission factors for missing data
Identify Sources Scope 1 mobile emissions refer to a wide variety of company-owned or operated vehicles engines and equipment that generate GHG emissions through the combustion of various fuels while moving from one location to another They include vehicles used on roads for transportation of employees or distribution trucks as well as off-road vehicles engines and equipment used for many other purposes Equipment that can not move under its own power but can be transported site-to-site (eg an emergency generator) is defined as a stationary (not mobile) combustion source1 Owned company product distribution trucks are most likely the greatest sources of mobile emissions for dairy processors However if the processing company does not own or have direct operational control of vehicles or equipment these sources will be reported as Scope 3 not Scope 1 emissions A list of common mobile combustion emission sources can be found in Figure 15
1
Mobile Emission SourcesCommon Mobile Combustion Sources Common Fuels Used
On-Road Vehicles Company vehicles Gasoline
Combination trucks and fluid milk trucks
Diesel fuel gasoline bio-diesel
Non-Road Vehicles (Mobile Machinery)
Forklifts and non-road equipment Gasoline diesel fuel propane
Construction equipment Diesel fuel
(Figure 15) Common mobile emission sources and fuels used in dairy processing
2
QuickTip
continued on next page
22
copy 20
19 Innovation C
enter for US D
airy All rights reserved G
HG
Inven
tory
Gu
idan
ce
Scope 1 Mobile Combustion Emissions
GHG Inventory Guidance
Quantify Emissions Use the EPA Simplified GHG Emissions Calculator lsquoMobile Sourcesrsquo tab to quantify emissions from mobile combustion Refer to the EPA Direct Emissions from Mobile Combustion Sources for guidance on this category
This tool calculates the CO2 CH
4 and N
2O emissions of
y Vehicles that are ownedcontrolled by the company
y Transport by road rail air and water
y Mobile machinery such as agricultural and construction equipment
3
Ensure Quality Control The quality control and documentation guidelines outlined in Figure 17 can help to ensure data accuracy and transparency For more information about reducing uncertainty when calculating emissions from mobile sources refer to Section 6 of the EPA Direct Emissions from Mobile Combustion Sources
4
Quality Control and Documentation for Mobile Emission Calculationsbull Compare emission factors provided by fuel supplier or collected on-site with the EPA Center for
Corporate Climate Leadership Emission Factors for Greenhouse Gas Inventories
bull Document fuel consumption data with official logs of vehicle gauges fuel purchase receipts and storage tank records
bull Document distance traveled with odometer logs and calculated miles to destination
bull Document vehicle fuel economy with company records manufacturer records or with information from the EPA fuel economy website
2Activity Data for Mobile Emission Calculations
Type Data Needed
Fuel Consumption Number of gallons barrels cubic meters etc
Distance Traveled Number of miles kilometers
Vehicle Characteristics Vehicle type and model year
Fuel Characteristics Type of fuel and heating value
(Figure 16) Activity data that should be collected for each source of mobile combustion emissions
(Figure 17) Quality control and documentation for mobile emission calculations
23
copy 20
19 Innovation C
enter for US D
airy All rights reserved G
HG
Inven
tory
Gu
idan
ce
GHG Inventory Guidance
Scope 1 Mobile Combustion Emissions
Works Cited
Additional Resources
1 TheClimateRegistryJanuary2016GlossaryoftermsGeneral Reporting Protocol Version 21 (pp181)httpbitly2rpZAXn
2 EPACenterforCorporateClimateLeadershipJanuary2016GreenhouseGasInventoryGuidanceDirectEmissionsfromMobileCombustionSourceshttpbitly2JZ4lip
3 TheClimateRegistryJanuary2016Chapter13DirectEmissionsfromMobileCombustionGeneral Reporting Protocol Version 21httpbitly2rpZAXn
4 WorldResourcesInstitute2015SettingOperationalBoundariesThe GHG Protocol Corporate Accounting and Reporting Standard(pp25)httpbitly2yhHn0z
yy WorldyResourcesyInstituteyGHGyProtocolyToolyforyMobileyCombustionyVersiony26yhttpbitly2qSGWuV
yy EPAyCenteryforyCorporateyClimateyLeadershipyGreenhouseyGasyInventoryyGuidanceyDirectyEmissionsyfromyMobileyCombustionySourcesyhttpbitly2JZ4lip
yy WRIyGHGyEmissionyFactorsyCompilationyAyspreadsheetyofyemissionyfactorsyusedyinytheyGHGyProtocolyCalculatorsyhttpsbitly2NFLq0M
yy EPAyandyUSyDepartmentyofyEnergyyOfficialyUSygovernmentysourceyforyfuelyeconomyyinformationyhttpswwwfueleconomygovfegfindacarshtml
yy EPAyCenteryforyCorporateyClimateyLeadershipyChaptery6yUncertaintyyAssessmentyGreenhouseyGasyInventoryyGuidanceyDirectyEmissionsyfromyMobileyCombustionySourcesyhttpbitly2JZ4lip
yy EnvironmentalyDefenseyFundyClimateyCorpsyHandbook Chaptery15yEnergyyConsumptionyofycompanyyvehiclesyhttpbitly2MTc9GB
24
copy 20
19 Innovation C
enter for US D
airy All rights reserved G
HG
Inven
tory
Gu
idan
ce
GHG Inventory Guidance
Scope 2 Emissions from Purchased Energy This section presents methods used to calculate Scope 2 GHG emissions which are indirect emissions from the generation of purchased energy These are considered an indirect emissions source because they are a consequence of activities of the reporting organization but occur at sources owned and controlled by an outside entity (ie an electricity utility)
Chapter at a Glance
Identify Sources
Collect Activity Data
Quantify Emissions
Ensure Quality Control
Supporting Resources
In addition to the GHG Protocol this chapter draws on guidance from the following resources
y EPA Center for Corporate Climate Leadership Indirect Emissions from Purchased Electricity1
y The GHG Protocol Scope 2 Guidance An amendment to the GHG Protocol Corporate Standard2
y The Climate Registry General Reporting Protocol Chapter 5 Page 343
Defining Scope 2 Emissions
The GHG Protocol Scope 2 Guidance Amendment to the Corporate Standard which went into effect in January 2015 provides updated requirements and best practices for Scope 2 emissions accounting The updates were made to reflect changes in electricity markets and the growing choices companies have regarding the type of electricity purchased The most significant Scope 2 accounting change introduced is that companies are to account for and report Market-Based and Location-Based Scope 2 emissions Previously the protocol only required the Location-Based method
Market-Based Emissions
The Market-Based method reflects the GHG emissions associated with the specific choices a consumer (a dairy processor) makes regarding its electricity supplier or product as conveyed through contractual agreements between the processor and the provider The emission factors are supplier-specific emission factors or the emissions profiles associated with renewable energy credits (RECs) and power purchase agreements (PPAs)
Location-Based Emissions
The Location-Based method uses average emission factors for the electricity grids that are providing electricity to the facility4 That is the Location-Based approach considers average emissions intensities in the locations of electricity use while the Market-Based approach considers the emissions intensities of electricity products that the processor has specifically chosen
Calculating Scope 2 Emissions
When calculating Scope 2 emissions companies should do the following
y Companies should report both Market-Based and Location-Based Scope 2 emissions totals
y When a company enters into a supplier-specific contract (or other contract) in which a credible emission factor is unidentifiable the reporting company should simply use the grid-average emission factor as a proxy for that specific amount of contracted energy
y All instruments must meet certain quality criteria before they can be applied to the Market-Based emissions total These criteria are listed on page 60 of the GHG Protocolrsquos Scope 2 Guidance
A reporting company should select either the Location-Based approach or Market-Based approach when setting a Scope 2 target and tracking its performance
Since the predominant Scope 2 calculation method currently used across the dairy processing sector is the Location-Based method this document describes steps to calculate Location-Based emissions outlined in Figure 18 page 25
25
copy 20
19 Innovation C
enter for US D
airy All rights reserved G
HG
Inven
tory
Gu
idan
ce
GHG Inventory Guidance
Scope 2 Steps to Calculate Location-Based GuidelinesStep 1 Determine the amount of electricity purchased
bull The total electricity purchased and consumed during the reporting period in energy units MWh or kWh provide the most precise activity data For guidance on how to interpret utility bills see Chapter 7 of the EDF Climate Corps Handbook
Step 2 Select emission factors
bull Emission factors Companies that purchase electricity from the electric grid should use regional or sub-regional emission factors provided by the EPArsquos Emissions and Generation Resource Integrated Database eGRID Electricity is generated in varying ways across the US and eGRID emission factors help capture the GHG emissions associated with the forms of energy generation unique to the facilities region The EPArsquos eGRID sub-region map can be used to determine the appropriate sub-region for each facility
Step 3 Quantify emissions bull The EPA Simplified GHG Emissions Calculator which uses 2018 emission factors from eGRID Companies calculate emissions by inputting the amount of electricity purchased and selecting the eGRID sub- region in which the processing facility is located
(Figure 18) Steps to calculate Location-Based guidelines
Scope 2 Emissions from Purchased Energy
Works Cited
Additional Resources
1 EnvironmentalProtectionAgency2016IndirectEmissionsfromPurchasedElectricityGuidanceCenter for Corporate Climate Leadershiphttpbitly2HUTgCz
2 WorldResourcesInstitute2015GHGProtocolScope2GuidanceAn Amendment to The GHG Protocol Corporate Accounting and Reporting Standardhttpbitly2jzMLpZ
3 TheClimateRegistryGeneralReportingProtocolVersion212016Chapter5Emissions to Include in the Inventoryhttpsbitly2CFOB2d
4 TheGHGProtocolCorporateAccountingandReportingStandardWorldResourcesInstituteWorldBusinessCouncilforSustainableDevelopment2015httpbitly2yhHn0z
yy EDFyClimateyCorpsyHandbookyChaptery7 Benchmarkingyenergyyusageyandyinterpretingyutilityybills
yy EDFyClimateyCorpsyHandbookyChaptery16 Demandyresponseyandysmartygrid
GHG Inventory Guidance
Measurement and Estimation Uncertainty of GHG EmissionsGHG emissions uncertainty is dependent upon the quality of data collected and methods used to calculate emissions Several types of uncertainties associated with GHG inventories range from natural
variations such as human error to statistical uncertainty related to the indirect measurement of emissions (eg activity data and an emission factor) A well-designed IMP that follows the quality and documentation guidelines outlined in each section of this document can help reduce uncertainty
Chapter at a Glance
Emissions Uncertainty
Calculating Uncertainty
26
copy 20
19 Innovation C
enter for US D
airy All rights reserved G
HG
Inven
tory
Gu
idan
ce
Guidance on Uncertainty Assessment
The GHG Protocol Guidance on Uncertainty Assessment in GHG Inventories and Calculating Statistical Parameter Uncertainty describes the functionality of the tool and provides users with information on how to prepare interpret and utilize inventory uncertainty assessments The guidance is based on the IPCC Guidelines for National GHG Inventories
Uncertainty Assessment Calculator
The GHG Protocol Cross Sector Calculation Tool Measurement and Estimation Uncertainty of GHG Emissions is applicable to many industries and businesses regardless of sector The calculation tool aggregates parameter uncertainties across source categories and the entire inventory
Works Cited
Additional Resources
1 WorldResourcesInstitute2003GHGProtocolguidanceonuncertaintyassessmentinGHGinventoriesandcalculatingstatisticalparameteruncertaintyhttpbitly2KFbCVO
yy TheyGHGyProtocolyCrossySectoryCalculationyToolyMeasurementyandyEstimationyUncertaintyyofyGHGyEmissionsyhttpbitly2Pp8oKU
yy TheyGHGyProtocolyGuidanceyonyUncertaintyyAssessmentyinyGHGyInventoriesyandyCalculatingyStatisticalyParameteryUncertaintyyGuidanceyonyhowytoyuseytheyMeasurementyandyEstimationyUncertaintyyofyGHGyEmissionsycalculationytoolyhttpbitly2KFbCVO
yy TheyGHGyProtocolyCorporateyAccountingyandyReportingyStandardyChaptery7yManagingyInventoryyQualityyhttpbitly2yhHn0z
27
copy 20
19 Innovation C
enter for US D
airy All rights reserved G
HG
Inven
tory
Gu
idan
ce
GHG Inventory Guidance
Target SettingGHG emissions reduction target setting and mitigation strategies have become a priority issue across company supply chains The increasing number of public GHG emission reduction commitments are strategic decisions grounded in opportunities to capture business value and reduce company risk
Chapter at a Glance
Target Setting
Science-Based Targets
Target Setting Resources
Companies can set two broad types of GHG reduction target metrics mdash an absolute emissions target or an intensity emissions target Intensity targets specify emissions reductions relative to productivity or economic output such as tons of CO
2elbs of product
produced Both intensity and absolute targets specify a reduction in emissions relative to a historical baseline year They ensure that emissions reductions are maintained with company growth Companies should carefully evaluate both types before choosing a target metric and consider seeking outside support to determine the target type and actual target Several organizations can assist in establishing targets
y WWF Climate Savers
y Climate Registry
y Pew Business Environmental Leadership Council
y Carbon Trust
Once an emissions target is defined it is crucial to consistently track performance over time Specifically a company may be required to recalculate its baseline year inventory whenever the following happens
y Significant changes in the structure of the reporting company
y Significant changes in the calculation methodology
ordm Improved emission factors
ordm Improved activity data
y Discovery of significant errors or smaller errors that are collectively significant
The GHG Protocol Corporate Standard does not have a set definition for ldquosignificantrdquo however a company should determine its own significance threshold (ie 2 percent) to define when changes in aggregate should trigger recalculation of the baseline year inventory
Structural changes are defined as the transfer of ownership or control of emitting activities from one company to another
They can occur via
y Mergers acquisitions and divestments
y Outsourcing or in-sourcing of emitting activities
For more information on emissions tracking over time companies may reference the GHG Protocol Corporate Standard
Science-Based Targets
The Science-Based Target Initiative is a collaboration between the Carbon Disclosure Project (CDP) UN Global Compact World Resources Institute and World Wildlife Fund to assist corporations in establishing GHG targets that are in line with climate science The initiative defines Science-Based Targets as ldquoTargets in line with the level of decarbonization required to keep global temperature increase below 2deg C compared to pre-industrial temperatures as described in the Assessment Report of the Intergovernmental Panel on Climate Change (IPCC)rdquo As of October 2019 the Science-Based Targets Initiative requires Scope 1 and 2 targets to be more ambitious and in line with ldquowell below 2deg Crdquo pathways
Aligning targets with climate science is becoming the business norm It is widely accepted that global action must be taken to avoid some of the most disastrous and irreversible impacts of climate change The following resources provide the causes and predicted impacts of climate change
y NASA Global Climate Change2
y NOAA National Centers for Environmental Information3
y The Global Carbon Project4
y The visualization of temperature change from 1880 to 2016 as analyzed by NASArsquos Goddard Institute for Space Studies
NOTE Recalculation is not needed if out- or in-sourced activities were previously included in a different scope
28
copy 20
19 Innovation C
enter for US D
airy All rights reserved G
HG
Inven
tory
Gu
idan
ce
By adopting Science-Based Targets dairy processing companies take a leadership role in addressing climate change by connecting corporate sustainability goals to scientifically established thresholds Case studies featuring companies with Science-Based Targets demonstrate the benefits and reasons for setting reduction goals that are in line with climate science
Examples of benefits derived from Science-Based Targets are
y Cut costs and reduce risk Companies with ambitious targets can ensure durability and efficiency in a future where fossil fuels are increasingly more expensive
y Build credibility and reputation Sustainability has become a lens through which a company is evaluated Taking leadership action on climate change can build a companyrsquos reputation among key stakeholders
y Drive innovation Adopting Science-Based Targets can drive company and industry-wide innovation and help to turn climate risk into a business opportunity
GHG Inventory Guidance
Works Cited
Additional Resources
1 CitationWorldEconomicForumTheGlobalRisksReport2017httpbitly2roi5LW
2 NASAGlobalClimateChangehttpsclimatenasagov
3 NOAANationalCentersforEnvironmentalInformationhttpswwwngdcnoaagov
4 TheGlobalCarbonProjecthttpwwwglobalcarbonprojectorg
yy WWFyClimateySavers httpclimatesaversorg
yy ClimateyRegistry httpswwwtheclimateregistryorg
yy PewyBusinessyEnvironmentalyLeadershipyCouncilyhttpswwwc2esorgour-workbelc
yy CarbonyTrust httpswwwcarbontrustcomhome
yy NASArsquosyGoddardyInstituteyforySpaceyStudies httpssvsgsfcnasagov4546
yy CarbonyBudgetyhttpbitly2WifVwi
yy 2016yCarbonyBudgetyReportyhttpglobalcarbonbudget2016org
yy TheyUSyDepartmentyofyEnergyyMapyhttpbitly2rpEt8p
yy ClimateyChangeyandyResourceyScarcity httpspwcto2wiXKx7
yy TheyImpactyofyCorporateySustainabilityyonyOrganizationalyProcessyandyPerformance TheyHarvardyBusinessyJournalyRobertyGyEcclesyIoannisyIoannouyampyGeorgeySerafeim httpshbsme2FP1eqW
Resources for Setting Science-Based Targets
yy IntroductionytoyScience-BasedyTargetsyhttpbitly2rpLt4m
yy CallytoyAction DetailedyGuidelinesyforySettingyScience-BasedyTargetsyhttpsbitly33Okx0o
yy Science-BasedyTargetsyandyCDPyScoringyhttpbitly2KFhnmg
yy BestyPracticesyforySettingyandyAchievingyScience-BasedyTargets PresentationyatytheyClimateyLeadersyConferenceyMarchy2017yhttpbitly2jBMuTF
yy MindytheyScienceyhttpbitly2IfBqJE
yy Science-BasedyTargets Targetysettingypitfallsyandylessonsylearnedy(pdf)yhttpbitly2FPus8Q
yy Science-BasedyTargets Targetysettingypitfallsyandylessonsylearnedy(webinar)yhttpsvimeocom233570395
GHG Inventory Guidance
29
copy 20
19 Innovation C
enter for US D
airy All rights reserved G
HG
Inven
tory
Gu
idan
ce
Resources for Reducing GHG EmissionsOnce a GHG emissions inventory has been developed and a reduction target has been adopted a company should identify the main sources of GHGs and evaluate the cost-effectiveness of emission reduction measures Below are resources tools and webinars to assist companies in reducing GHG emissions
Energy Efficiency
yy EPAyEnergyyStary2011yEnergyyEfficiencyyImprovementyandyCostySavingyOpportunitiesyforytheyDairyyProcessingyIndustryyAymanualycreatedybyyEnergyyStarytoyassistydairyyprocessorsyinyidentifyingyenergyyefficiencyyimprovementsyasyanyimportantywayytoyreduceycostsyandytoyincreaseypredictableyearningsyhttpbitly345L8Wi
yy EPAyEnergyyStaryPortfolioyManageryAnyonlineytoolythatycanybeyusedytoymeasureyandytrackyenergyyandywateryconsumptionyasywellyasygreenhouseygasyemissionsyassociatedywithycommercialybuildingsyyhttpbitly2FP3Epu
yy HVACy(heatingyventilationyandyairyconditioning)yClimateyCorpsyHandbookyChaptery9yOverviewyofyhowytoysurveyycurrentyHVACysystemyanalyzeyresultsyofyanyenergyyaudityforyHVACysystemyandyperformyayfinancialyanalysesyonyrecommendationsyofyenergyyauditorsyhttpbitly2rod1qI
yy CarbonyTrustyHeatingyventilationyandyairyconditioningy(HVAC)yenergyyefficiencyyguideyAyguideytoyimproveyenergyyefficiencyyofyheatingyventilationyandyairyconditioningyhotywateryandyboilers httpbitly2jAHmiE
yy LightingyinycommercialybuildingsyClimateyCorpsyHandbookyChaptery10yDescribesyhowytoyidentifyylightingyopportunitiesyforyenergyysavingsyinycommercialybuildingsyandyhowytoydevelopyestimatesyofyenergyyusageyandycalculateytheyestimatedysavingsypotentialyhttpbitly2rod1qI
yy DemandyResponseyandySmartyGridyClimateyCorpsyHandbookyChaptery16yOverviewyofydemandyresponsey(DR)yandypossibleyenergyysavingsyandyrevenueyopportunitiesyhttpbitly2rod1qI
yy DemandyandyResponseyResearchyCenteryPublicationsyandyinformationyonydemandyresponseyandysmartygridyinfrastructureytoybestyinformyendyusersyhowytoytemporarilyyreduceyenergyyusageyinyresponseytoyeitherypriceyorysystemyreliabilityytriggersyhttpsdrrclblgov
yy CarbonyTrustyEnergyyManagementySelf-AssessmentyToolyAnyExcelyworkbookyandyguidanceydocumentythatyassessyayorganizationrsquosyenergyymanagementyhttpbitly2whnWrY
yy CarbonyValueyAnalysisyToolyTheyCarbonyValueyAnalysisyTooly(CVAT)ywasycreatedybyytheyWorldyResourcesyInstituteytoyassistyprojectymanagersywithyfactoringytheypriceyofycarbonywhenyevaluatingyreductionyprojectsyhttpbitly2jB0pt6
yy CarbonyTrustyBuildingyEnergyyEfficiencyyGuideytoyimprovingybuildingyfabricyandyinsulationyandyinstallingyappropriateycontrolsytoysaveymoneyyandycutycarbonyemissionsyhttpbitly2rmNI9C
yy CarbonyTrustyRefrigerationyImproveyenergyyefficiencyyofyyourychillersyandyrefrigerationysystemsywithyouryenergy-savingyguidanceyhttpbitly2JUV62Q
yy EPAyCenteryforyCorporateyClimateyLeadershipyAylistyofyfreeyGHGyinventoryyrelatedywebinarsyandyeventsyhttpbitly2FOcALR
Renewable Energy
yy TheyDepartmentyofyEnergyrsquosyOfficeyofyEnergyyEfficiencyyandyRenewableyEnergyy(EERE)yProvidesyinformationyonyindustrialyenergy-consumingysystemsyboileryandysteamysystemycompressedyairymotorsyfansypumpsyandyprocessyheatingyhttpbitly2K0x0nb
yy PropertyyAssessedyCleanyEnergyy(PACE)yEnergyyefficiencyyfinancingyopportunitiesyhttpbitly2FPWGjX
yy DatabaseyofyStateyIncentivesyforyRenewablesyandyEfficiencyyOverviewyofystateyandyfederalyincentivesyandypoliciesydesignedytoyhelpycompaniesyadoptyrenewableyenergyyprogramsyhttpwwwdsireusaorg
continued on next page
GHG Inventory Guidance
30
copy 20
19 Innovation C
enter for US D
airy All rights reserved G
HG
Inven
tory
Gu
idan
ce
Additional Resources
yy GuideytoyPurchasingyGreenyPoweryAycooperativeyeffortybetweenytheyEPAytheyUSyDepartmentyofyEnergyytheyWorldyResourcesyInstituteyandytheyCenteryforyResourceySolutionsythatyprovidesycurrentyandypotentialybuyersyofygreenypowerywithyinformationyaboutygreenypowerypurchasingyhttpbitly2JU8WlK
yy InnovationsyinyVoluntaryyRenewableyEnergyyProcurementyAyguideyfromyNationalyRenewableyEnergyyLaboratoryrsquosy(NREL)ythatyoutlinesymethodsyforyexpandingyaccessyandyloweringycostyforycommunitiesygovernmentsyandybusinessesyhttpswwwnrelgovdocsfy12osti54991pdf
Mobile Emissions
yy ReduceyMobileyEmissionsyVehicleyselectionyACEEEyGreeneryCarsyIdentifyyvehiclesythatyareymostyfuelyefficientyandylearnyaboutymarketytrendsyinyautomotiveytechnologyyhttpsgreenercarsorg
yy EPAyGreenyVehicleyGuideyOverviewyofyvehiclesyfuelyuseyandytheyimpactyonybothytheyenvironmentyandybottomylineyhttpswwwepagovgreenvehicles
yy FuelyEconomyyGuideyTheyUSyEnvironmentalyProtectionyAgencyy(EPA)yandyUSyDepartmentyofyEnergyy(DOE)yAyguideytoyhelpybuyersyidentifyytheymostyfuel-efficientyvehiclesyhttpbitly2FPkVP6
copy2019 Innovation Center for US Dairy All rights reserved
About the Innovation Center for US Dairyreg
The Innovation Center for US Dairyreg is a forum that
brings together the dairy community to address the
changing needs and expectations of consumers through
a framework of shared best practices and accountability
Initiated in 2008 by dairy farmers through the dairy
checkoff we collaborate on efforts that are important
both to us and our valued customers ndash priorities like
animal care environmental stewardship food safety and
traceability and community contributions The Innovation
Center is committed to continuous improvement from
farm to table striving to ensure a socially responsible
and economically viable dairy community
Visit USDairycom for more information about the
Innovation Center for US Dairy
wwwUSDairycom bull InnovationCenterUSDairycom
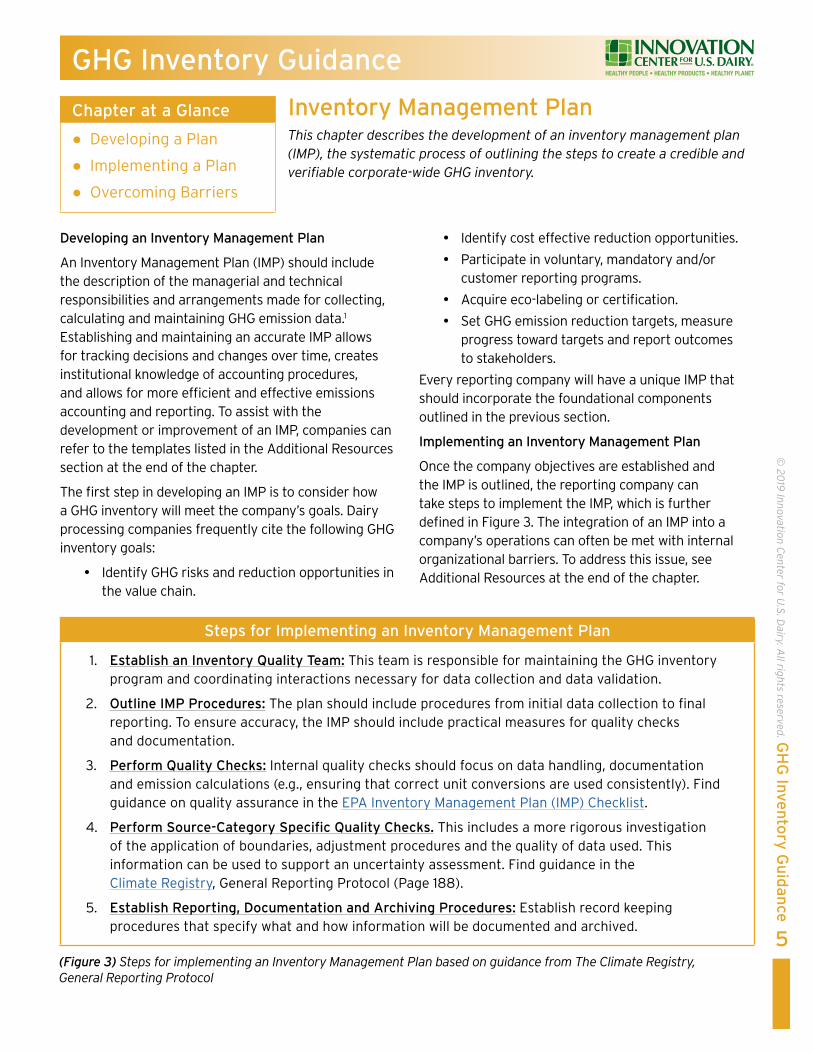
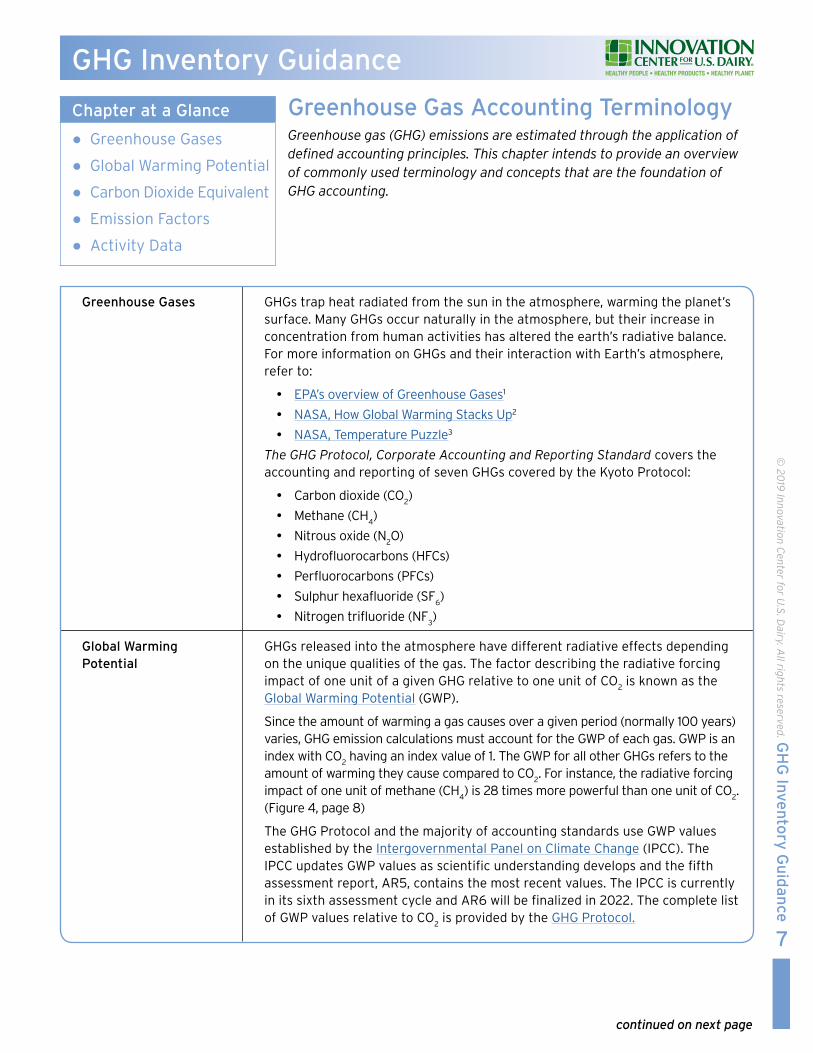
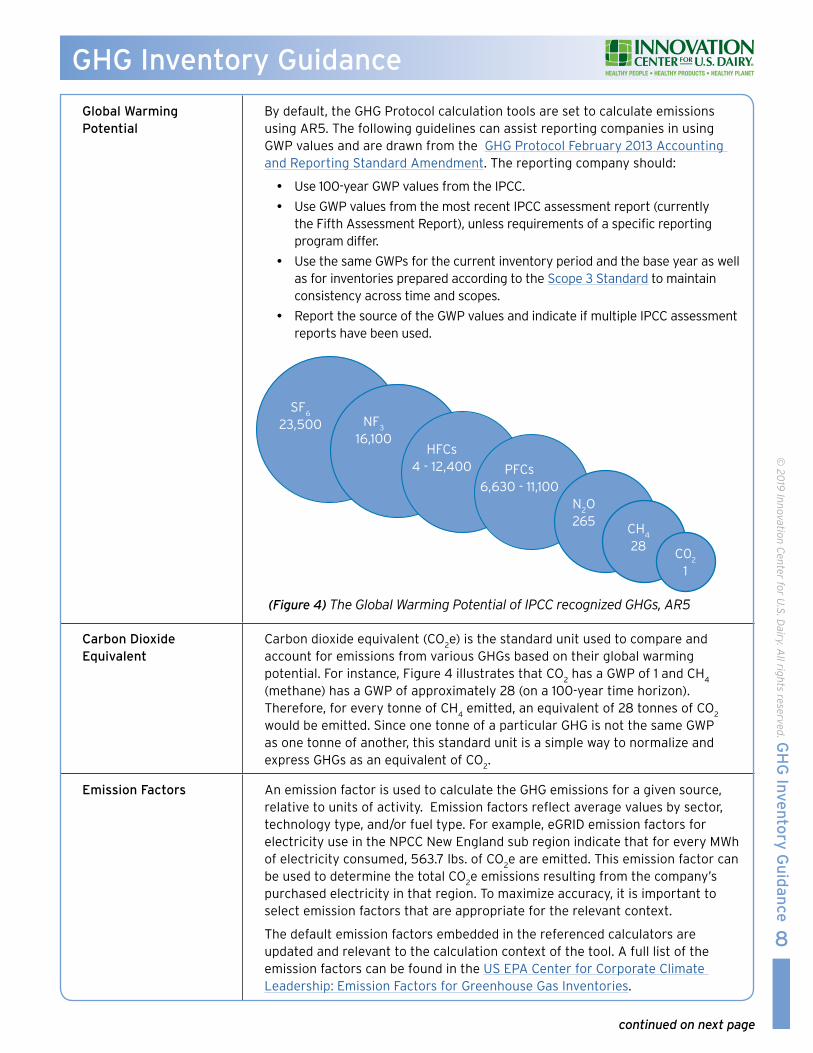
Global Warming Potential
By default the GHG Protocol calculation tools are set to calculate emissions using AR5 The following guidelines can assist reporting companies in using GWP values and are drawn from the GHG Protocol February 2013 Accounting and Reporting Standard Amendment The reporting company should
y Use 100-year GWP values from the IPCC
y Use GWP values from the most recent IPCC assessment report (currently the Fifth Assessment Report) unless requirements of a specific reporting program differ
y Use the same GWPs for the current inventory period and the base year as well as for inventories prepared according to the Scope 3 Standard to maintain consistency across time and scopes
y Report the source of the GWP values and indicate if multiple IPCC assessment reports have been used
Carbon Dioxide Equivalent
Carbon dioxide equivalent (CO2e) is the standard unit used to compare and
account for emissions from various GHGs based on their global warming potential For instance Figure 4 illustrates that CO
2 has a GWP of 1 and CH
4
(methane) has a GWP of approximately 28 (on a 100-year time horizon) Therefore for every tonne of CH
4 emitted an equivalent of 28 tonnes of CO
2
would be emitted Since one tonne of a particular GHG is not the same GWP as one tonne of another this standard unit is a simple way to normalize and express GHGs as an equivalent of CO
2
Emission Factors An emission factor is used to calculate the GHG emissions for a given source relative to units of activity Emission factors reflect average values by sector technology type andor fuel type For example eGRID emission factors for electricity use in the NPCC New England sub region indicate that for every MWh of electricity consumed 5637 lbs of CO
2e are emitted This emission factor can
be used to determine the total CO2e emissions resulting from the companyrsquos
purchased electricity in that region To maximize accuracy it is important to select emission factors that are appropriate for the relevant context
The default emission factors embedded in the referenced calculators are updated and relevant to the calculation context of the tool A full list of the emission factors can be found in the US EPA Center for Corporate Climate Leadership Emission Factors for Greenhouse Gas Inventories
8
copy 20
19 Innovation C
enter for US D
airy All rights reserved G
HG
Inven
tory
Gu
idan
ce
(Figure 4) The Global Warming Potential of IPCC recognized GHGs AR5
GHG Inventory Guidance
continued on next page
PFCs6630 - 11100
HFCs4 - 12400
N2O
265CH
4
28C0
2
1
SF6
23500 NF3
16100
9
copy 20
19 Innovation C
enter for US D
airy All rights reserved G
HG
Inven
tory
Gu
idan
ce
GHG Inventory Guidance
Activity Data Activity data is a key input for the calculation of GHG emissions and refers to the data associated with an activity that generates GHG emissions such as gallons of gasoline consumed from company cars This activity data is collected in physical units (gallons) or energy units (therms) and then combined with an emissions factor and the relevant greenhouse gas GWP value to calculate C0
2e
The collection of activity data is the primary responsibility of the reporting company and will often be the most significant challenge when developing a GHG inventory Therefore establishing robust activity data collection procedures is essential The following measures are useful for ensuring the collection of quality activity data
Steps for Gathering Activity Data
1 Convert fuel consumption data from physical to energy units
y The Energy Information Administration has a conversion tool to easily convert different fuels to energy contents
2 Develop data collection procedures in the IMP to standardize collection practices
3 Compare current year data with historical trends to identify inconsistent changes that are over 10 percent Inconsistencies should be investigated
4 Compare activity data from multiple reference sources (eg government survey data or data compiled by other dairy processing companies) with company data when possible
Works Cited
1 EPA2017UnderstandingGlobalWarmingPotentialshttpbitly2gXtxJF
2 WorldResourcesInstituteThe GHG Protocol Corporate Accounting and Reporting Standard2013RequiredGreenhouseGasesinInventoriesaccountingandreportingstandardamendmenthttpbitly2yhHn0z
3 TheClimateRegistry2016GeneralReportingProtocolfortheVoluntaryReportingProgramVersion21httpbitly2pIjLTj
NOTE If reporting into the Aggregate Reporting Tool energy data should be reported in volumemass units (ie gallons of fuel therms of gas) The conversion from volumemass to energy is done automatically using a predetermined energy factor
10
copy 20
19 Innovation C
enter for US D
airy All rights reserved G
HG
Inven
tory
Gu
idan
ce
GHG Inventory Guidance
Additional Resources
Greenhouse Gases
yy EPAyOverviewyofyGreenhouseyGases httpbitly2ro6IU4
yy NASAyGlobalyClimateyChangeyHowyGlobalyWarmingyStacksyUpyAythree-minuteyvideoythatyexplainsyhowydifferentyfactorsycontributeytoyglobalywarmingyhttpsgonasagov2JXkvsp
yy NASAyGlobalyClimateyChangeyTemperatureyPuzzleyAyfiveyminuteyvideoythatyexplainsytheyimpactsyofytheysunrsquosyenergyyEarthrsquosyreflectanceyandygreenhouseygassesyonyglobalywarming httpsgonasagov2rpUt9T
Global Warming Potential
yy yEPAyUnderstandingyGlobalyWarmingyPotentials httpbitly2gXtxJF
yy yIntergovernmentalyPanelyonyClimateyChange httpswwwipccch
yy GHGyProtocolyGlobalyWarmingyPotentialyValuesyTableyofyGWPsyfromytheySARyAR4yandyAR5yreportyhttpbitly2z6chdf
Emission Factors
yy GHGyProtocolyEmissionyFactorsyfromyCrossySectoryToolsy2017yhttpbitly2q3eZzN
11
copy 20
19 Innovation C
enter for US D
airy All rights reserved G
HG
Inven
tory
Gu
idan
ce
Supporting Resources
This section of the document draws on guidance from the following resources
Organizational Boundaries
y GHG Protocol Corporate Accounting and Reporting Standard Revised Edition Chapter 3 Setting Organizational Boundaries1
y General Reporting Protocol Version 21 Chapter 4 Identifying the Organizational Boundary2
Operational Boundaries
y GHG Protocol Corporate Accounting and Reporting Standard Revised Edition Chapter 4 Setting Operational Boundaries3
y General Reporting Protocol Version 21 Chapter 5 Emissions to Include in the Inventory4
Organizational Boundaries
Organizational boundaries are generally high-level boundaries that determine which business operations and facilities are part of the GHG inventory Due to differences in legal and organizational structures each companyrsquos organizational boundary will vary The GHG Protocol outlines three approaches for developing organizational boundaries mdash the Equity Share the Operational Control and the Financial Control Approach (Figure 6) It is important to note that these different boundary approaches need to be applied independently Furthermore a reporting company should use the same approach for all Scope 1 and 2 emissions categories when compiling a GHG emissions inventory and use this same approach for subsequent reporting periods to ensure consistency when tracking emissions over time
Equity Share Approach
The reporting company accounts for GHG emissions that are wholly- or partially-owned according to its share of equity in that operation regardless of whether operational or financial control is exerted
Operational Control Approach
The reporting company accounts for 100 percent of emissions from operations over which it or one of its subsidiaries has operational control However it should be emphasized that having operational control does not mean that a company necessarily has the authority to make all decisions concerning an operation Therefore a company may report emissions from a leased asset as Scope 3 if the company can demonstrate and state clearly the reasons that it does not have operational control (GHG Protocol Appendix F 2006)
Financial Control Approach
The reporting company accounts for 100 percent of emissions from operations over which it or one of its subsidiaries has financial control
If a reporting company is applying the Operational or Financial Control approach it does not need to account for emissions arising from operations over which it does not control
GHG Inventory Guidance
Establishing Inventory Boundaries This chapter describes the role of and process for developing GHG inventory boundaries Inventory boundaries determine which business operations and emissions will be accounted for in a companyrsquos GHG inventory Organizational boundaries define the operations and facilities
included in the inventory while the operational boundaries categorize the emissions resulting either directly or indirectly from the organizationrsquos operations and facilities
Chapter at a Glance
Organizational Boundaries
Operational Boundaries
NOTE A reporting company that wholly-owns and controls its operations is responsible for all associated emissions In this case the outcome will be the same whichever approach is used5
LesseersquosTenantrsquos PerspectiveCapital Lease Operating Lease
Operational Control Approach
Lessee has controlownership (S1 or 2)
Financial Control or Equity Share Approach
Lessee has controlownership (S1 or 2)
Lessee does NOT have controlownership (S3)
(Figure 6) Categorizing emissions from leased assets by scope based on lease type and organizational boundary approach used Note ldquoSrdquo refers to the Scope
Categorizing GHG Emissions with Leased Assets
Many companies lease assets from other companies The accounting for leased assets (whether the emissions are Scope 1 2 or 3) depends on two factors the organizational boundary approach used and the type of leased asset The GHG Protocolrsquos Appendix ldquoCategorizing Emissions from Leased Assetsrdquo details the correct accounting methodology based on type of leased asset and organizational boundary approach used
Operational Boundaries
Operational boundaries are defined by ldquoscopesrdquo which categorize the emissions resulting either directly or indirectly from the companyrsquos operations and activities Figure 7 describes the most common sources of emissions in dairy processing
Scope 1
Scope 1 direct emissions occur from sources owned or controlled by the company In dairy processing most Scope 1 emissions are from stationary combustion However mobile emissions process emissions and fugitive emissions are also counted as Scope 1 if the
company owns or controls the activities or equipment associated with the emissions
Scope 2
Scope 2 indirect emissions are from the generation of purchased energy The emissions resulting from the production of grid electricity are accounted for under Scope 2 One of the primary uses of purchased electricity in dairy processing is for process cooling freezing and cold storage Electricity is also used to drive process motors fans pumps compressed air systems facility lighting and facility HVAC6
Scope 3
Scope 3 indirect emissions are a result of an organizationrsquos operations but are not owned or controlled by the company
Biogenic Methane and Nitrous Oxide Emissions
Sources of biogenic methane (CH4) and biogenic nitrous
oxide (N20) should be accounted for as Scope 1 process
emissions A common yet relatively minimal source of biogenic nitrous oxide emissions in dairy processing arises from land spreading a process in which nitrogen-rich wastewater is recycled to be used as fertilizer on local farms Nitrous oxide (N
2O) is naturally produced in
soils through the microbial processes of nitrification and denitrification The nitrogen in the wastewater increases mineral nitrogen availability resulting in both indirect and direct N
2O emissions at the site
12
copy 20
19 Innovation C
enter for US D
airy All rights reserved G
HG
Inven
tory
Gu
idan
ce
GHG Inventory Guidance
NOTE Reviewing a companyrsquos statement of values can be a good place to start when identifying company-owned assets Once the assets within the defined boundary are identified maintain an up to date list of company-owned facilities as part of the IMP
(Figure 7) Common Scope 1 2 and 3 emission sources in the dairy processing industry
Lighting HVAC
Machine drive topower pumpsmotors fans
and compressors
Processcooling
freezing andcold storage
Transportation (mobile emissions) and temperature
control (fugitive emissions)
Feed production and processing Milk production Waste disposal
On-site stationary combustion for industrial applications and other
emissions (mobile fugitive) from owned sources
Scope 2 Indirect emisions from purchased electricity
Scope 1Direct emissions from sources owned or controlled by the company
Scope 3
Indirect downstreamsources not owned or controlled by the company
Scope 3Indirect upstream sources not owned or controlled by the company
CO2 CH4 N2O HFCs PFCs SF6 NF3
13
copy 20
19 Innovation C
enter for US D
airy All rights reserved G
HG
Inven
tory
Gu
idan
ce
GHG Inventory GuidanceCalculating the N
20 emissions from land spreading
requires two sources of processor input data annual gallons of wastewater and the average wastewater Average wastewater is measured by Total Kjehldahl Nitrogen content (TKN) which is calculated as mg NL wastewater The input data can be applied to an equation outlined in the 2016 Field to Market Environmental and Socioeconomic Indicators for Measuring Outcomes of On-Farm Agricultural Production in the United States7 This is consistent with a Tier 1 approach as recommended by the Intergovernmental Panel on Climate Change (IPCC) The IPCC default value for total direct and indirect nitrous oxide emissions represents about 14 percent of the applied nitrogen from fertilizer To convert emissions from applied nitrogen to CO
2e apply the molecular
weight of nitrous oxide (4428) and the N2O Global
Warming Potential (GWP further described on page 8) value of 265 The equation for estimating Scope 1 process emissions from land spreading is detailed in the
box denoted Field to Market Equation for Estimating Land Spreading Emissions
While CH4 and N
2O biogenic emissions are reported
within Scope 1 CO2 emissions arising from biogenic
sources (ie biomass combustion) are reported independently from the ldquoscopesrdquo More specifically a reporting company (to the extent allowed by available data) should account for biogenic CO
2 emissions in a
separate memo item appended to the rest of the GHG inventory
Works Cited
1 WorldResourcesInstituteChapter3SettingOrganizationalBoundariesGHG Protocol Corporate Accounting and Reporting Standard Revised Edition(pp16-23)httpbitly2yhHn0z
2 TheClimateRegistryChapter4IdentifyingtheOrganizationalBoundaryGeneral Reporting Protocol Version 21(pp13-22)httpbitly36gHX03
3 WorldResourcesInstituteChapter4SettingOperationalBoundariesGHG Protocol Corporate Accounting and Reporting Standard Revised Edition(pp24-33)httpbitly2yhHn0z
4 TheClimateRegistryChapter5EmissionstoIncludeintheInventoryGeneral Reporting Protocol Version 21(pp32-38)httpbitly2rpZAXn
5 WorldResourcesInstituteGHGProtocolCorporateAccountingandReportingStandardRevisedEditionhttpbitly2yhHn0z
6 EPAEnergyStar2011EnergyEfficiencyImprovementandCostSavingOpportunitiesfortheDairyProcessingIndustryhttpbitly2jzJZkH
7 FieldtoMarketPartOneEnvironmentalIndicatorsEnvironmentalandSocioeconomicIndicatorsforMeasuringOutcomesofOn-FarmAgriculturalProductionintheUnitedStates(pp22)httpbitly2MTkw5h
Field to Market Equation for Estimating Land Spreading Emissions
Lbs N applied = (Total gallons of wastewater applied) X (3785 Lgal) X (0002 lbsg) X (0001 gmg) X Total Kjehldahl Nitrogen content (mg NL wastewater) Lbs CO
2e = (lbs N applied 100) X 14 percent X
(4428) X 265
Supporting Resources
In addition to the GHG Protocol Corporate Accounting and Reporting Standard this section of the document includes guidance from the following resources
y EPA GHG Inventory Guidance Direct Emissions from Stationary Combustion Sources1
y Environmental Protection Agency General Stationary Combustion Source (Subpart C) Calculating CO2
Emissions from Combustion EPA Greenhouse Gas Reporting Program2
y US EPA Center for Corporate Climate Leadership Emission Factors for Greenhouse Gas Inventories3
14
copy 20
19 Innovation C
enter for US D
airy All rights reserved G
HG
Inven
tory
Gu
idan
ce
GHG Inventory Guidance
Scope 1 Stationary Combustion This section provides guidance on calculating Scope 1 direct GHG emissions from stationary combustion Stationary fuel combustion emission sources are typically devices that combust solid liquid or gaseous fuel generally for the purposes of producing electricity generating steam or heat for dairy processing purposes
Chapter at a Glance
Identify Sources
Collect Activity Data
Quantify Emissions
Ensure Quality Control
Identify Sources Most emission sources from stationary combustion in dairy processing include mdash but are not limited to mdash boilers combustion turbine process heaters and generators Emission sources can be identified by creating a questionnaire requesting information about the types of fuels used for on-site stationary combustion at the facility how fuel consumption is tracked and the name and contact information of the energy providers Figure 8 summarizes the most common stationary combustion sources and fuels
(Figure 8) Common stationary combustion sources and fuels in dairy processing
1Stationary Combustion Sources and Fuels
Stationary Combustion Sources
Common Fuels Used
Boiler Natural gas Fuel oil Propane Diesel
Combustion Turbines Fuel oil Coal Propane Kerosene
Process Heaters Natural gas Propane
Incinerators Natural gas Propane
Collect Activity Data The activity data required for this calculation includes the amount of fuel consumed for each of the stationary combustion sources and the fuel characteristics of each type of fuel used
Fuel Consumption Collect data on the quantity of fuel consumed for combustion purposes Two calculation methods are outlined below The most common method for dairy processing facilities is the use of purchase records
y On-site metering The mass or volume flow of fuel at the input point to one or more combustion units These data can be gathered using measurement equipment such as scales or flow meters
y Purchase records The mass or volume of fuel entering the facility These data can be based on fuel receipts purchase records or data provided directly from the energy vendor and or customer online portal
Fuel Characteristics Determine the emission factor data based on the characteristics of the fuel combusted at each identified source Three methods are outlined below and on page 17 with the most common approach for dairy processing facilities being the use of actual fuel heating values or default heating values
2
continued on next page
NOTE Aggregate Reporting Tool users only need to enter fuel consumption volume The subsequent steps are automatically performed by the Tool
15
copy 20
19 Innovation C
enter for US D
airy All rights reserved G
HG
Inven
tory
Gu
idan
ce
Scope 1 Stationary Combustion
continued on next page
GHG Inventory Guidance
y Measured carbon content This is a measure of the total carbon in the fuel and can be determined through chemical analysis This is the most accurate emission factor data but it is often not practical for dairy processors to conduct a fuel analysis
y Actual fuel heating value A fuelrsquos heating value is a measure of the quantity of heat liberated during combustion of the fuel This information can often be found on utility bills which will list the amount of fuel purchased in terms of energy For instance most natural gas consumption data is detailed in thermal units and volumetric units To ensure consistent reporting all energy values should be reported in Gross Calorific Value (GCV) where the high heat value (HHV) is reported
y Default heating values If it is not practical to obtain data specific to fuel used then default heating values embedded in the Aggregate Reporting Tool will be applied to calculate emissions
Tip Emission factors and default high heating values are representative averages based on multiple fuel samples taken across the country For homogeneous fuels such as pipeline-quality natural gas
default heating values often provide a very accurate emissions estimate
2
QuickTip
NOTE Fuel metering equipment and readings are subject to error Therefore if this method is chosen calibration and testing should be performed to ensure accuracy
NOTE Aggregate Reporting Tool users should not follow this step A default heat value for each fuel type is embedded in Intelex Certain energy types such as natural gas solar and wind can be reported directly in energy units
Quantify Emissions Calculate Scope 1 stationary combustion emissions using the EPA Simplified GHG Emissions Calculator Use the EPA GHG Inventory Guidance Direct Emissions from Stationary Combustion Sources1 In conjunction with the calculator
The tool is effective in calculating CO2e emissions resulting from the combustion of fuels in stationary
combustion equipment (Figure 9 highlights the key features of the tool Figure 10 page 18 offers additional guidance on using the tool)
Additional Guidance for use of the Calculation Tool
y If fuel consumption data is recorded in physical units and the heat value is known convert fuel consumption data to energy units
y Under the Introduction tab supply information on the type of fuel consumed and select the industry sector ndash Manufacturing
3
(Figure 9) Stationary combustion emissions calculator tool highlights
Overview of Stationary Combustion Emissions CalculatorFeature Description
Emission Calculations Calculates CO2 CH
4 and N
2O emissions resulting from the combustion of
fuels in stationary combustion equipment Totals emissions in tons of CO2e
Unit Conversion Automatically converts data to common measurement units If certain units are available use the EIA Energy Conversion Calculator3 to first convert the units
16
copy 20
19 Innovation C
enter for US D
airy All rights reserved G
HG
Inven
tory
Gu
idan
ce
Scope 1 Stationary Combustion
GHG Inventory Guidance
y If using energy units the user is required to select high heating value HHV or low heating value LHV To maintain consistency with the Processor Handbook processors should try to use HHVs
ordm High Heating Value (HHV) is defined as the amount of heat released by a specified quantity (initially at 25degC) once it is combusted and the products have returned to a temperature of 25degC which takes into account the latent heat of vaporization of water in the combustion products
ordm Low Heating Value (LHV) is defined as the amount of heat released by combusting a specified quantity (initially at 25degC) and returning the temperature of the combustion products to 150degC which assumes the latent heat of vaporization of water in the reaction products is not recovered
y For additional information on heating values and guidance on calculating the emissions of biomass fuels emergency generators waste-derived fuels CO
2 capture and storage and non-combustion sources refer
to the EPArsquos GHG Inventory Guidance Direct Emissions from Stationary Combustion Sources
3
Ensure Quality Control The accuracy and transparency of an emissions calculation depends on the quality of the data collected the rigor of quality control measures and proper documentation Figure 10 highlights a few key quality control measures Figure 11 provides documentation guidelines Additional documentation information can be found in Chapter 7 of the GHG Protocol Corporate Accounting and Reporting Standard
4
Quality Control Guidelines Step 1 bull If using meters to collect activity data compare fuel-metered data with purchase records
to ensure accuracy of metering equipment
Step 2 bull Ensure consistent emission factors and GWPs are used across facilities
Step 3 bull Conduct an internal review to ensure units were converted correctly and emissions were accurately quantified
Step 4 bull If not using default emissions factors compare actual heating values to available default values
Step 5 bull Update the IMP to reflect any changes in monitoring equipment or procedures that could potentially affect the quality of emissions data
(Figure 10) Key quality control guidelines for stationary combustion emissions calculations
Documentation Guidelinesbull Description of facilities and stationary combustion sources and fuels
bull Description of methods applied to estimate emissions for each activity facility and combustion unit
bull List of metering or monitoring devices used (if applicable)
bull Information on the source(s) used to calculate the activity data This could include purchase receipts utility bills delivery receipts contract purchase on-site metered fuel documentation stock inventory documentation and heat content documentation from suppliers
bull Description of quality management procedures implemented
bull Summary of any changes that may have affected the accuracy consistency or completeness of calculations
(Figure 11) Scope 1 Stationary Combustion emissions documentation guidelines
17
copy 20
19 Innovation C
enter for US D
airy All rights reserved G
HG
Inven
tory
Gu
idan
ce
Scope 1 Stationary Combustion
GHG Inventory Guidance
Works Cited
Additional Resources
1 EPACenterforCorporateClimateLeadershipGreenhouseGasInventoryGuidanceDirectEmissionsfromStationaryCombustionSourcesVersion30httpbitly2KJrg2a
2 WorldResourcesInstituteMay2015GHGProtocolGuidanceDirectEmissionsfromStationaryCombustionVersion30httpbitly2gX1WbG
3 EnvironmentalProtectionAgencyGeneralStationaryCombustionSource(SubpartC)CalculatingCO2
EmissionsfromCombustionEPAGreenhouseGasReportingProgramhttpbitly2FPuNso
4 EPACenterforCorporateClimateLeadershipEmissionFactorsforGreenhouseGasInventoriesMarch92018httpswwwepagovclimateleadership
5 EnvironmentalProtectionAgencyDirect Emissions from Stationary Combustion Sources Greenhouse Gas Inventory GuidanceJanuary2016httpbitly2KJrg2a
yy WorldyResourcesyInstituteyGHGyProtocolyToolyforyGHGyEmissionsyfromyStationaryyCombustion httpbitly36c227z
yy WorldyResourcesyInstituteyGHGyProtocolyStationaryyCombustionyGuidanceyVersiony30yyhttpbitly2gX1WbG
yy EnergyyConversionyCalculatorsyUsedytoyconvertyphysicalyunitsytoyenergyyunitsyhttpsbitly33M6f04
yy EPAyCenteryforyCorporateyClimateyLeadershipyGreenhouseyGasyInventoryyGuidanceyDirectyEmissionsyfromyStationaryyCombustionySourcesyVersiony30yhttpbitly2KJrg2a
18
copy 20
19 Innovation C
enter for US D
airy All rights reserved G
HG
Inven
tory
Gu
idan
ce
GHG Inventory Guidance
Scope 1 Fugitive Emissions Fugitive emissions from refrigeration and air conditioning result from leakage and service over the operational life of the equipment and from disposal at the end of the useful life of the equipment The leakage of refrigerant gas is a small but significant source of GHG emissions because of a high GWP associated with these GHGs
Chapter at a Glance
Identify Sources
Collect Activity Data
Select Approach
Ensure Quality Control
NOTE HFCs and PFCs are a class of powerful greenhouse gases with GWP values that are typically 1000 times greater than CO
2 Since these GHGs have a significant warming ability careful attention should be
given to thoroughly account for and quantify fugitive emissions The significance of an emissions source in a companyrsquos IMP can only be established after it has been appropriately assessed and quantified
Supporting Resources
In addition to the GHG Protocol Corporate Accounting and Reporting Standard this section of the document draws on guidance from the following resources
y EPA GHG Inventory Guidance Direct Fugitive Emissions from Refrigeration Air Conditioning Fire Suppression and Industrial Gases1
y Climate Registry General Reporting Protocol Version 21 Chapter 16 Direct Fugitive Emissions from the Use of Refrigeration and Air Conditioning Equipment2
Collect Activity Data The activity data required to calculate fugitive emissions depends upon the calculation approach selected in Step 3
2
Identify Sources Most dairy processing facilities use non-halogenated refrigerants such as ammonia propane and isobutane for refrigeration These refrigerants are not GHGs and therefore are not reported in the inventory However HFC and PFC refrigerants used in refrigerated trailers and air conditioning units are common and the associated GHG emissions should be accounted for in company-owned and -controlled equipment Figure 12 lists fugitive emission sources that are common in dairy processing
1Common Fugitive Emission SourcesRefrigerated transport
Industrial process refrigeration
Cold storage warehouses
Mobile air conditioning
(Figure 12) Common sources of fugitive emissions in dairy processing
Quantify Emissions Calculate fugitive emissions by using the lsquoRefrigeration and ACrsquo tab on the EPA Simplified GHG Emissions Calculator The Aggregate Reporting Tool quantifies fugitive emissions according to the Mass Balance method (Option 1) in the Calculator Use this calculator in conjunction with the EPA Fugitive Emissions Guidance
3
continued on next page
Scope 1 Fugitive Emissions
19
copy 20
19 Innovation C
enter for US D
airy All rights reserved G
HG
Inven
tory
Gu
idan
ce
GHG Inventory Guidance
3Overview of Fugitive Emission Calculation Methods
Method Description Best Use
Screening Method A preliminary method to estimate emissions
Use only if fugitive emissions are relatively small If emissions are estimated or believed to be relatively large the company should use a more accurate and robust method as the emissions factors used in this method are highly uncertain
Sales-Based Method
Activity data based on purchase records and service records
For companies that maintain their own refrigerant equipment emissions are based on the amount of refrigerant purchased and used by the facility
Lifecycle Stage Method (Mass Balance Method)
Activity data based on total inventory of refrigerants
For companies that have contractors maintain equipment tracks emissions from installation servicing and disposal
(Figure 13) Calculation methods for quantifying fugitive emissions from refrigeration and air-conditioning equipment
Ensure Quality Control Implementing quality control measures and documentation measures are important for fugitive emissions calculations as failure to account for small releases of fluorinated compounds can lead to significant errors in a companyrsquos GHG inventory Additional information can be found in Chapter 7 of the GHG Protocol Corporate Accounting and Reporting Standard and Section 7 of the EPA Fugitive Emissions Guidance
4
Quality Control and Documentation for Fugitive Emission Calculationsbull Account for each GHG emissions source separately because of the differing GWPs
bull Provide information on the approach used to quantify direct fugitive emissions
bull Identify calculation errors and omissions by comparing facility emissions data against previous year calculations
bull Document activity data mdash stock inventory documentation purchase receipts delivery receipts contract purchases delivery receipts of equipment shipping or disposal records of equipment
bull Identify areas of uncertainty in emission calculations and use the most accurate data or conservative values
(Figure 14) Quality control and documentation guidelines for fugitive emissions calculations
20
copy 20
19 Innovation C
enter for US D
airy All rights reserved G
HG
Inven
tory
Gu
idan
ce
GHG Inventory Guidance
Scope 1 Fugitive Emissions
Works Cited
Additional Resources
1 EPACenterforCorporateClimateLeadershipGreenhouseGasInventoryGuidanceDirectFugitiveEmissionsfromRefrigerationAirConditioningFireSuppressionandIndustrialGaseshttpbitly2KHZgMn
2 ClimateRegistryJanuary2016Chapter16DirectFugitiveEmissionsfromtheUseofRefrigerationandAirConditioningEquipmentGeneral Reporting Protocol for the Voluntary Reporting Program Version 21(pp134)httpbitly2rpZAXn
yy WorldyResourcesyInstituteyGHGyProtocolyToolyforyRefrigerationyandyAir-ConditioningyEquipment httpwwwghgprotocolorgsitesdefaultfilesghgphfc-pfc_0xls
yy WorldyResourcesyInstituteyJanuaryy2005yGHGyProtocolyHFCyGuideytoyCalculationyWorksheetsyyVersiony10yhttpbitly2jCgwXg
yy WorldyResourcesyInstituteyGHGyProtocolyCorporateyAccountingyandyReportingyStandardyChaptery7yManagingyInventoryyQualityyhttpbitly2yhHn0z
21
copy 20
19 Innovation C
enter for US D
airy All rights reserved G
HG
Inven
tory
Gu
idan
ce
GHG Inventory Guidance
Scope 1 Mobile Combustion Emissions This section provides guidance on accounting for and calculating Scope 1 direct GHG emissions from owned or leased mobile sources (both on-road and non-road vehicles) that are within the companyrsquos inventory boundaries
Chapter at a Glance
Identify Sources
Collect Activity Data
Select Approach
Ensure Quality Control
Supporting Resources
This section of the document includes guidance the following resources
y EPA Center for Corporate Climate Leadership Greenhouse Gas Inventory Guidance Direct Emissions from Mobile Combustion Sources1
y The Climate Registry General Reporting Protocol Version 21 Chapter 13 Direct Emissions from Mobile Combustion2
Collect Activity Data GHG emissions from mobile combustion are most easily estimated by collecting data on the amount of fuel consumed distance traveled and vehicle and fuel characteristics for each identified source Figure 16 page 22 outlines the necessary activity data to perform this calculation
TIP If all the preferred activity data is not available the company should at a minimum provide fuel consumption data The referenced calculation tool will auto populate default emission factors for missing data
Identify Sources Scope 1 mobile emissions refer to a wide variety of company-owned or operated vehicles engines and equipment that generate GHG emissions through the combustion of various fuels while moving from one location to another They include vehicles used on roads for transportation of employees or distribution trucks as well as off-road vehicles engines and equipment used for many other purposes Equipment that can not move under its own power but can be transported site-to-site (eg an emergency generator) is defined as a stationary (not mobile) combustion source1 Owned company product distribution trucks are most likely the greatest sources of mobile emissions for dairy processors However if the processing company does not own or have direct operational control of vehicles or equipment these sources will be reported as Scope 3 not Scope 1 emissions A list of common mobile combustion emission sources can be found in Figure 15
1
Mobile Emission SourcesCommon Mobile Combustion Sources Common Fuels Used
On-Road Vehicles Company vehicles Gasoline
Combination trucks and fluid milk trucks
Diesel fuel gasoline bio-diesel
Non-Road Vehicles (Mobile Machinery)
Forklifts and non-road equipment Gasoline diesel fuel propane
Construction equipment Diesel fuel
(Figure 15) Common mobile emission sources and fuels used in dairy processing
2
QuickTip
continued on next page
22
copy 20
19 Innovation C
enter for US D
airy All rights reserved G
HG
Inven
tory
Gu
idan
ce
Scope 1 Mobile Combustion Emissions
GHG Inventory Guidance
Quantify Emissions Use the EPA Simplified GHG Emissions Calculator lsquoMobile Sourcesrsquo tab to quantify emissions from mobile combustion Refer to the EPA Direct Emissions from Mobile Combustion Sources for guidance on this category
This tool calculates the CO2 CH
4 and N
2O emissions of
y Vehicles that are ownedcontrolled by the company
y Transport by road rail air and water
y Mobile machinery such as agricultural and construction equipment
3
Ensure Quality Control The quality control and documentation guidelines outlined in Figure 17 can help to ensure data accuracy and transparency For more information about reducing uncertainty when calculating emissions from mobile sources refer to Section 6 of the EPA Direct Emissions from Mobile Combustion Sources
4
Quality Control and Documentation for Mobile Emission Calculationsbull Compare emission factors provided by fuel supplier or collected on-site with the EPA Center for
Corporate Climate Leadership Emission Factors for Greenhouse Gas Inventories
bull Document fuel consumption data with official logs of vehicle gauges fuel purchase receipts and storage tank records
bull Document distance traveled with odometer logs and calculated miles to destination
bull Document vehicle fuel economy with company records manufacturer records or with information from the EPA fuel economy website
2Activity Data for Mobile Emission Calculations
Type Data Needed
Fuel Consumption Number of gallons barrels cubic meters etc
Distance Traveled Number of miles kilometers
Vehicle Characteristics Vehicle type and model year
Fuel Characteristics Type of fuel and heating value
(Figure 16) Activity data that should be collected for each source of mobile combustion emissions
(Figure 17) Quality control and documentation for mobile emission calculations
23
copy 20
19 Innovation C
enter for US D
airy All rights reserved G
HG
Inven
tory
Gu
idan
ce
GHG Inventory Guidance
Scope 1 Mobile Combustion Emissions
Works Cited
Additional Resources
1 TheClimateRegistryJanuary2016GlossaryoftermsGeneral Reporting Protocol Version 21 (pp181)httpbitly2rpZAXn
2 EPACenterforCorporateClimateLeadershipJanuary2016GreenhouseGasInventoryGuidanceDirectEmissionsfromMobileCombustionSourceshttpbitly2JZ4lip
3 TheClimateRegistryJanuary2016Chapter13DirectEmissionsfromMobileCombustionGeneral Reporting Protocol Version 21httpbitly2rpZAXn
4 WorldResourcesInstitute2015SettingOperationalBoundariesThe GHG Protocol Corporate Accounting and Reporting Standard(pp25)httpbitly2yhHn0z
yy WorldyResourcesyInstituteyGHGyProtocolyToolyforyMobileyCombustionyVersiony26yhttpbitly2qSGWuV
yy EPAyCenteryforyCorporateyClimateyLeadershipyGreenhouseyGasyInventoryyGuidanceyDirectyEmissionsyfromyMobileyCombustionySourcesyhttpbitly2JZ4lip
yy WRIyGHGyEmissionyFactorsyCompilationyAyspreadsheetyofyemissionyfactorsyusedyinytheyGHGyProtocolyCalculatorsyhttpsbitly2NFLq0M
yy EPAyandyUSyDepartmentyofyEnergyyOfficialyUSygovernmentysourceyforyfuelyeconomyyinformationyhttpswwwfueleconomygovfegfindacarshtml
yy EPAyCenteryforyCorporateyClimateyLeadershipyChaptery6yUncertaintyyAssessmentyGreenhouseyGasyInventoryyGuidanceyDirectyEmissionsyfromyMobileyCombustionySourcesyhttpbitly2JZ4lip
yy EnvironmentalyDefenseyFundyClimateyCorpsyHandbook Chaptery15yEnergyyConsumptionyofycompanyyvehiclesyhttpbitly2MTc9GB
24
copy 20
19 Innovation C
enter for US D
airy All rights reserved G
HG
Inven
tory
Gu
idan
ce
GHG Inventory Guidance
Scope 2 Emissions from Purchased Energy This section presents methods used to calculate Scope 2 GHG emissions which are indirect emissions from the generation of purchased energy These are considered an indirect emissions source because they are a consequence of activities of the reporting organization but occur at sources owned and controlled by an outside entity (ie an electricity utility)
Chapter at a Glance
Identify Sources
Collect Activity Data
Quantify Emissions
Ensure Quality Control
Supporting Resources
In addition to the GHG Protocol this chapter draws on guidance from the following resources
y EPA Center for Corporate Climate Leadership Indirect Emissions from Purchased Electricity1
y The GHG Protocol Scope 2 Guidance An amendment to the GHG Protocol Corporate Standard2
y The Climate Registry General Reporting Protocol Chapter 5 Page 343
Defining Scope 2 Emissions
The GHG Protocol Scope 2 Guidance Amendment to the Corporate Standard which went into effect in January 2015 provides updated requirements and best practices for Scope 2 emissions accounting The updates were made to reflect changes in electricity markets and the growing choices companies have regarding the type of electricity purchased The most significant Scope 2 accounting change introduced is that companies are to account for and report Market-Based and Location-Based Scope 2 emissions Previously the protocol only required the Location-Based method
Market-Based Emissions
The Market-Based method reflects the GHG emissions associated with the specific choices a consumer (a dairy processor) makes regarding its electricity supplier or product as conveyed through contractual agreements between the processor and the provider The emission factors are supplier-specific emission factors or the emissions profiles associated with renewable energy credits (RECs) and power purchase agreements (PPAs)
Location-Based Emissions
The Location-Based method uses average emission factors for the electricity grids that are providing electricity to the facility4 That is the Location-Based approach considers average emissions intensities in the locations of electricity use while the Market-Based approach considers the emissions intensities of electricity products that the processor has specifically chosen
Calculating Scope 2 Emissions
When calculating Scope 2 emissions companies should do the following
y Companies should report both Market-Based and Location-Based Scope 2 emissions totals
y When a company enters into a supplier-specific contract (or other contract) in which a credible emission factor is unidentifiable the reporting company should simply use the grid-average emission factor as a proxy for that specific amount of contracted energy
y All instruments must meet certain quality criteria before they can be applied to the Market-Based emissions total These criteria are listed on page 60 of the GHG Protocolrsquos Scope 2 Guidance
A reporting company should select either the Location-Based approach or Market-Based approach when setting a Scope 2 target and tracking its performance
Since the predominant Scope 2 calculation method currently used across the dairy processing sector is the Location-Based method this document describes steps to calculate Location-Based emissions outlined in Figure 18 page 25
25
copy 20
19 Innovation C
enter for US D
airy All rights reserved G
HG
Inven
tory
Gu
idan
ce
GHG Inventory Guidance
Scope 2 Steps to Calculate Location-Based GuidelinesStep 1 Determine the amount of electricity purchased
bull The total electricity purchased and consumed during the reporting period in energy units MWh or kWh provide the most precise activity data For guidance on how to interpret utility bills see Chapter 7 of the EDF Climate Corps Handbook
Step 2 Select emission factors
bull Emission factors Companies that purchase electricity from the electric grid should use regional or sub-regional emission factors provided by the EPArsquos Emissions and Generation Resource Integrated Database eGRID Electricity is generated in varying ways across the US and eGRID emission factors help capture the GHG emissions associated with the forms of energy generation unique to the facilities region The EPArsquos eGRID sub-region map can be used to determine the appropriate sub-region for each facility
Step 3 Quantify emissions bull The EPA Simplified GHG Emissions Calculator which uses 2018 emission factors from eGRID Companies calculate emissions by inputting the amount of electricity purchased and selecting the eGRID sub- region in which the processing facility is located
(Figure 18) Steps to calculate Location-Based guidelines
Scope 2 Emissions from Purchased Energy
Works Cited
Additional Resources
1 EnvironmentalProtectionAgency2016IndirectEmissionsfromPurchasedElectricityGuidanceCenter for Corporate Climate Leadershiphttpbitly2HUTgCz
2 WorldResourcesInstitute2015GHGProtocolScope2GuidanceAn Amendment to The GHG Protocol Corporate Accounting and Reporting Standardhttpbitly2jzMLpZ
3 TheClimateRegistryGeneralReportingProtocolVersion212016Chapter5Emissions to Include in the Inventoryhttpsbitly2CFOB2d
4 TheGHGProtocolCorporateAccountingandReportingStandardWorldResourcesInstituteWorldBusinessCouncilforSustainableDevelopment2015httpbitly2yhHn0z
yy EDFyClimateyCorpsyHandbookyChaptery7 Benchmarkingyenergyyusageyandyinterpretingyutilityybills
yy EDFyClimateyCorpsyHandbookyChaptery16 Demandyresponseyandysmartygrid
GHG Inventory Guidance
Measurement and Estimation Uncertainty of GHG EmissionsGHG emissions uncertainty is dependent upon the quality of data collected and methods used to calculate emissions Several types of uncertainties associated with GHG inventories range from natural
variations such as human error to statistical uncertainty related to the indirect measurement of emissions (eg activity data and an emission factor) A well-designed IMP that follows the quality and documentation guidelines outlined in each section of this document can help reduce uncertainty
Chapter at a Glance
Emissions Uncertainty
Calculating Uncertainty
26
copy 20
19 Innovation C
enter for US D
airy All rights reserved G
HG
Inven
tory
Gu
idan
ce
Guidance on Uncertainty Assessment
The GHG Protocol Guidance on Uncertainty Assessment in GHG Inventories and Calculating Statistical Parameter Uncertainty describes the functionality of the tool and provides users with information on how to prepare interpret and utilize inventory uncertainty assessments The guidance is based on the IPCC Guidelines for National GHG Inventories
Uncertainty Assessment Calculator
The GHG Protocol Cross Sector Calculation Tool Measurement and Estimation Uncertainty of GHG Emissions is applicable to many industries and businesses regardless of sector The calculation tool aggregates parameter uncertainties across source categories and the entire inventory
Works Cited
Additional Resources
1 WorldResourcesInstitute2003GHGProtocolguidanceonuncertaintyassessmentinGHGinventoriesandcalculatingstatisticalparameteruncertaintyhttpbitly2KFbCVO
yy TheyGHGyProtocolyCrossySectoryCalculationyToolyMeasurementyandyEstimationyUncertaintyyofyGHGyEmissionsyhttpbitly2Pp8oKU
yy TheyGHGyProtocolyGuidanceyonyUncertaintyyAssessmentyinyGHGyInventoriesyandyCalculatingyStatisticalyParameteryUncertaintyyGuidanceyonyhowytoyuseytheyMeasurementyandyEstimationyUncertaintyyofyGHGyEmissionsycalculationytoolyhttpbitly2KFbCVO
yy TheyGHGyProtocolyCorporateyAccountingyandyReportingyStandardyChaptery7yManagingyInventoryyQualityyhttpbitly2yhHn0z
27
copy 20
19 Innovation C
enter for US D
airy All rights reserved G
HG
Inven
tory
Gu
idan
ce
GHG Inventory Guidance
Target SettingGHG emissions reduction target setting and mitigation strategies have become a priority issue across company supply chains The increasing number of public GHG emission reduction commitments are strategic decisions grounded in opportunities to capture business value and reduce company risk
Chapter at a Glance
Target Setting
Science-Based Targets
Target Setting Resources
Companies can set two broad types of GHG reduction target metrics mdash an absolute emissions target or an intensity emissions target Intensity targets specify emissions reductions relative to productivity or economic output such as tons of CO
2elbs of product
produced Both intensity and absolute targets specify a reduction in emissions relative to a historical baseline year They ensure that emissions reductions are maintained with company growth Companies should carefully evaluate both types before choosing a target metric and consider seeking outside support to determine the target type and actual target Several organizations can assist in establishing targets
y WWF Climate Savers
y Climate Registry
y Pew Business Environmental Leadership Council
y Carbon Trust
Once an emissions target is defined it is crucial to consistently track performance over time Specifically a company may be required to recalculate its baseline year inventory whenever the following happens
y Significant changes in the structure of the reporting company
y Significant changes in the calculation methodology
ordm Improved emission factors
ordm Improved activity data
y Discovery of significant errors or smaller errors that are collectively significant
The GHG Protocol Corporate Standard does not have a set definition for ldquosignificantrdquo however a company should determine its own significance threshold (ie 2 percent) to define when changes in aggregate should trigger recalculation of the baseline year inventory
Structural changes are defined as the transfer of ownership or control of emitting activities from one company to another
They can occur via
y Mergers acquisitions and divestments
y Outsourcing or in-sourcing of emitting activities
For more information on emissions tracking over time companies may reference the GHG Protocol Corporate Standard
Science-Based Targets
The Science-Based Target Initiative is a collaboration between the Carbon Disclosure Project (CDP) UN Global Compact World Resources Institute and World Wildlife Fund to assist corporations in establishing GHG targets that are in line with climate science The initiative defines Science-Based Targets as ldquoTargets in line with the level of decarbonization required to keep global temperature increase below 2deg C compared to pre-industrial temperatures as described in the Assessment Report of the Intergovernmental Panel on Climate Change (IPCC)rdquo As of October 2019 the Science-Based Targets Initiative requires Scope 1 and 2 targets to be more ambitious and in line with ldquowell below 2deg Crdquo pathways
Aligning targets with climate science is becoming the business norm It is widely accepted that global action must be taken to avoid some of the most disastrous and irreversible impacts of climate change The following resources provide the causes and predicted impacts of climate change
y NASA Global Climate Change2
y NOAA National Centers for Environmental Information3
y The Global Carbon Project4
y The visualization of temperature change from 1880 to 2016 as analyzed by NASArsquos Goddard Institute for Space Studies
NOTE Recalculation is not needed if out- or in-sourced activities were previously included in a different scope
28
copy 20
19 Innovation C
enter for US D
airy All rights reserved G
HG
Inven
tory
Gu
idan
ce
By adopting Science-Based Targets dairy processing companies take a leadership role in addressing climate change by connecting corporate sustainability goals to scientifically established thresholds Case studies featuring companies with Science-Based Targets demonstrate the benefits and reasons for setting reduction goals that are in line with climate science
Examples of benefits derived from Science-Based Targets are
y Cut costs and reduce risk Companies with ambitious targets can ensure durability and efficiency in a future where fossil fuels are increasingly more expensive
y Build credibility and reputation Sustainability has become a lens through which a company is evaluated Taking leadership action on climate change can build a companyrsquos reputation among key stakeholders
y Drive innovation Adopting Science-Based Targets can drive company and industry-wide innovation and help to turn climate risk into a business opportunity
GHG Inventory Guidance
Works Cited
Additional Resources
1 CitationWorldEconomicForumTheGlobalRisksReport2017httpbitly2roi5LW
2 NASAGlobalClimateChangehttpsclimatenasagov
3 NOAANationalCentersforEnvironmentalInformationhttpswwwngdcnoaagov
4 TheGlobalCarbonProjecthttpwwwglobalcarbonprojectorg
yy WWFyClimateySavers httpclimatesaversorg
yy ClimateyRegistry httpswwwtheclimateregistryorg
yy PewyBusinessyEnvironmentalyLeadershipyCouncilyhttpswwwc2esorgour-workbelc
yy CarbonyTrust httpswwwcarbontrustcomhome
yy NASArsquosyGoddardyInstituteyforySpaceyStudies httpssvsgsfcnasagov4546
yy CarbonyBudgetyhttpbitly2WifVwi
yy 2016yCarbonyBudgetyReportyhttpglobalcarbonbudget2016org
yy TheyUSyDepartmentyofyEnergyyMapyhttpbitly2rpEt8p
yy ClimateyChangeyandyResourceyScarcity httpspwcto2wiXKx7
yy TheyImpactyofyCorporateySustainabilityyonyOrganizationalyProcessyandyPerformance TheyHarvardyBusinessyJournalyRobertyGyEcclesyIoannisyIoannouyampyGeorgeySerafeim httpshbsme2FP1eqW
Resources for Setting Science-Based Targets
yy IntroductionytoyScience-BasedyTargetsyhttpbitly2rpLt4m
yy CallytoyAction DetailedyGuidelinesyforySettingyScience-BasedyTargetsyhttpsbitly33Okx0o
yy Science-BasedyTargetsyandyCDPyScoringyhttpbitly2KFhnmg
yy BestyPracticesyforySettingyandyAchievingyScience-BasedyTargets PresentationyatytheyClimateyLeadersyConferenceyMarchy2017yhttpbitly2jBMuTF
yy MindytheyScienceyhttpbitly2IfBqJE
yy Science-BasedyTargets Targetysettingypitfallsyandylessonsylearnedy(pdf)yhttpbitly2FPus8Q
yy Science-BasedyTargets Targetysettingypitfallsyandylessonsylearnedy(webinar)yhttpsvimeocom233570395
GHG Inventory Guidance
29
copy 20
19 Innovation C
enter for US D
airy All rights reserved G
HG
Inven
tory
Gu
idan
ce
Resources for Reducing GHG EmissionsOnce a GHG emissions inventory has been developed and a reduction target has been adopted a company should identify the main sources of GHGs and evaluate the cost-effectiveness of emission reduction measures Below are resources tools and webinars to assist companies in reducing GHG emissions
Energy Efficiency
yy EPAyEnergyyStary2011yEnergyyEfficiencyyImprovementyandyCostySavingyOpportunitiesyforytheyDairyyProcessingyIndustryyAymanualycreatedybyyEnergyyStarytoyassistydairyyprocessorsyinyidentifyingyenergyyefficiencyyimprovementsyasyanyimportantywayytoyreduceycostsyandytoyincreaseypredictableyearningsyhttpbitly345L8Wi
yy EPAyEnergyyStaryPortfolioyManageryAnyonlineytoolythatycanybeyusedytoymeasureyandytrackyenergyyandywateryconsumptionyasywellyasygreenhouseygasyemissionsyassociatedywithycommercialybuildingsyyhttpbitly2FP3Epu
yy HVACy(heatingyventilationyandyairyconditioning)yClimateyCorpsyHandbookyChaptery9yOverviewyofyhowytoysurveyycurrentyHVACysystemyanalyzeyresultsyofyanyenergyyaudityforyHVACysystemyandyperformyayfinancialyanalysesyonyrecommendationsyofyenergyyauditorsyhttpbitly2rod1qI
yy CarbonyTrustyHeatingyventilationyandyairyconditioningy(HVAC)yenergyyefficiencyyguideyAyguideytoyimproveyenergyyefficiencyyofyheatingyventilationyandyairyconditioningyhotywateryandyboilers httpbitly2jAHmiE
yy LightingyinycommercialybuildingsyClimateyCorpsyHandbookyChaptery10yDescribesyhowytoyidentifyylightingyopportunitiesyforyenergyysavingsyinycommercialybuildingsyandyhowytoydevelopyestimatesyofyenergyyusageyandycalculateytheyestimatedysavingsypotentialyhttpbitly2rod1qI
yy DemandyResponseyandySmartyGridyClimateyCorpsyHandbookyChaptery16yOverviewyofydemandyresponsey(DR)yandypossibleyenergyysavingsyandyrevenueyopportunitiesyhttpbitly2rod1qI
yy DemandyandyResponseyResearchyCenteryPublicationsyandyinformationyonydemandyresponseyandysmartygridyinfrastructureytoybestyinformyendyusersyhowytoytemporarilyyreduceyenergyyusageyinyresponseytoyeitherypriceyorysystemyreliabilityytriggersyhttpsdrrclblgov
yy CarbonyTrustyEnergyyManagementySelf-AssessmentyToolyAnyExcelyworkbookyandyguidanceydocumentythatyassessyayorganizationrsquosyenergyymanagementyhttpbitly2whnWrY
yy CarbonyValueyAnalysisyToolyTheyCarbonyValueyAnalysisyTooly(CVAT)ywasycreatedybyytheyWorldyResourcesyInstituteytoyassistyprojectymanagersywithyfactoringytheypriceyofycarbonywhenyevaluatingyreductionyprojectsyhttpbitly2jB0pt6
yy CarbonyTrustyBuildingyEnergyyEfficiencyyGuideytoyimprovingybuildingyfabricyandyinsulationyandyinstallingyappropriateycontrolsytoysaveymoneyyandycutycarbonyemissionsyhttpbitly2rmNI9C
yy CarbonyTrustyRefrigerationyImproveyenergyyefficiencyyofyyourychillersyandyrefrigerationysystemsywithyouryenergy-savingyguidanceyhttpbitly2JUV62Q
yy EPAyCenteryforyCorporateyClimateyLeadershipyAylistyofyfreeyGHGyinventoryyrelatedywebinarsyandyeventsyhttpbitly2FOcALR
Renewable Energy
yy TheyDepartmentyofyEnergyrsquosyOfficeyofyEnergyyEfficiencyyandyRenewableyEnergyy(EERE)yProvidesyinformationyonyindustrialyenergy-consumingysystemsyboileryandysteamysystemycompressedyairymotorsyfansypumpsyandyprocessyheatingyhttpbitly2K0x0nb
yy PropertyyAssessedyCleanyEnergyy(PACE)yEnergyyefficiencyyfinancingyopportunitiesyhttpbitly2FPWGjX
yy DatabaseyofyStateyIncentivesyforyRenewablesyandyEfficiencyyOverviewyofystateyandyfederalyincentivesyandypoliciesydesignedytoyhelpycompaniesyadoptyrenewableyenergyyprogramsyhttpwwwdsireusaorg
continued on next page
GHG Inventory Guidance
30
copy 20
19 Innovation C
enter for US D
airy All rights reserved G
HG
Inven
tory
Gu
idan
ce
Additional Resources
yy GuideytoyPurchasingyGreenyPoweryAycooperativeyeffortybetweenytheyEPAytheyUSyDepartmentyofyEnergyytheyWorldyResourcesyInstituteyandytheyCenteryforyResourceySolutionsythatyprovidesycurrentyandypotentialybuyersyofygreenypowerywithyinformationyaboutygreenypowerypurchasingyhttpbitly2JU8WlK
yy InnovationsyinyVoluntaryyRenewableyEnergyyProcurementyAyguideyfromyNationalyRenewableyEnergyyLaboratoryrsquosy(NREL)ythatyoutlinesymethodsyforyexpandingyaccessyandyloweringycostyforycommunitiesygovernmentsyandybusinessesyhttpswwwnrelgovdocsfy12osti54991pdf
Mobile Emissions
yy ReduceyMobileyEmissionsyVehicleyselectionyACEEEyGreeneryCarsyIdentifyyvehiclesythatyareymostyfuelyefficientyandylearnyaboutymarketytrendsyinyautomotiveytechnologyyhttpsgreenercarsorg
yy EPAyGreenyVehicleyGuideyOverviewyofyvehiclesyfuelyuseyandytheyimpactyonybothytheyenvironmentyandybottomylineyhttpswwwepagovgreenvehicles
yy FuelyEconomyyGuideyTheyUSyEnvironmentalyProtectionyAgencyy(EPA)yandyUSyDepartmentyofyEnergyy(DOE)yAyguideytoyhelpybuyersyidentifyytheymostyfuel-efficientyvehiclesyhttpbitly2FPkVP6
copy2019 Innovation Center for US Dairy All rights reserved
About the Innovation Center for US Dairyreg
The Innovation Center for US Dairyreg is a forum that
brings together the dairy community to address the
changing needs and expectations of consumers through
a framework of shared best practices and accountability
Initiated in 2008 by dairy farmers through the dairy
checkoff we collaborate on efforts that are important
both to us and our valued customers ndash priorities like
animal care environmental stewardship food safety and
traceability and community contributions The Innovation
Center is committed to continuous improvement from
farm to table striving to ensure a socially responsible
and economically viable dairy community
Visit USDairycom for more information about the
Innovation Center for US Dairy
wwwUSDairycom bull InnovationCenterUSDairycom
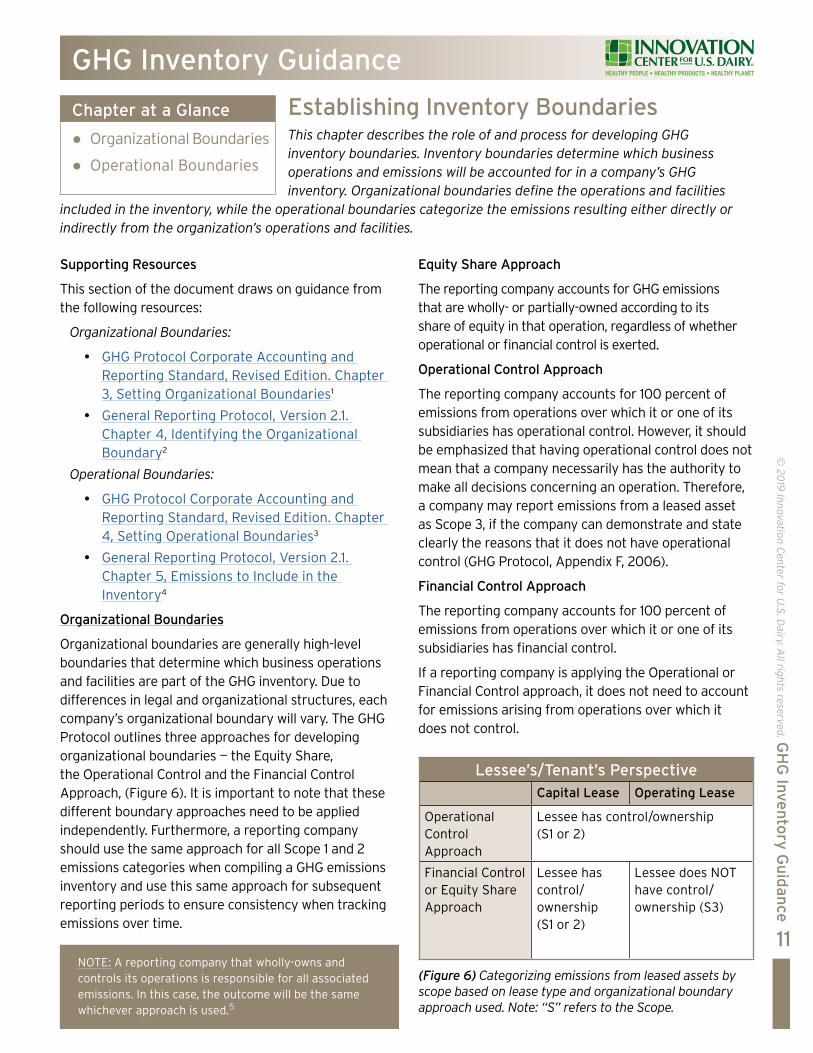
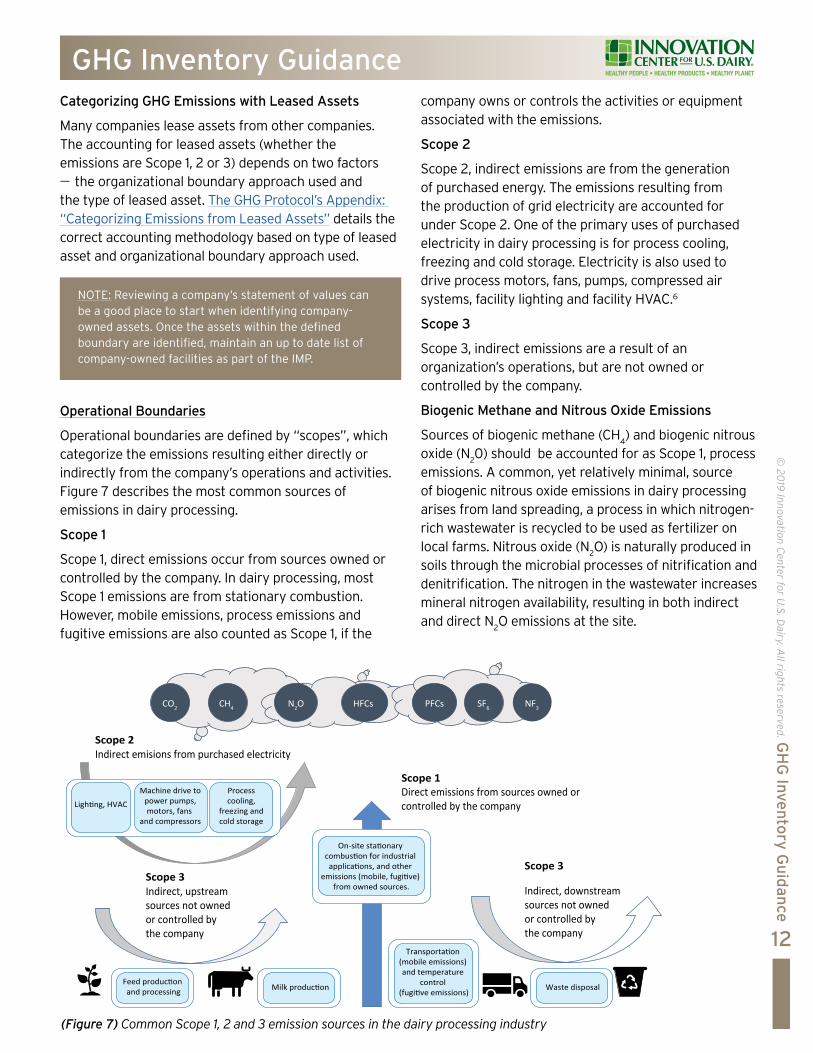
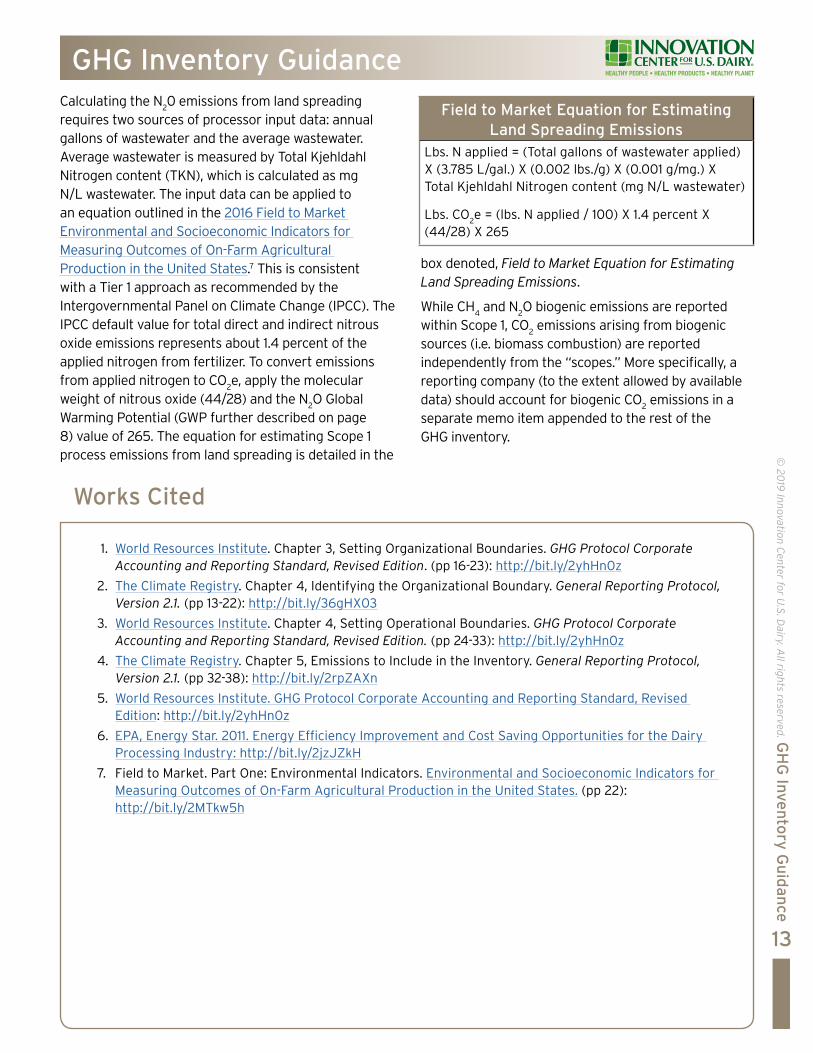
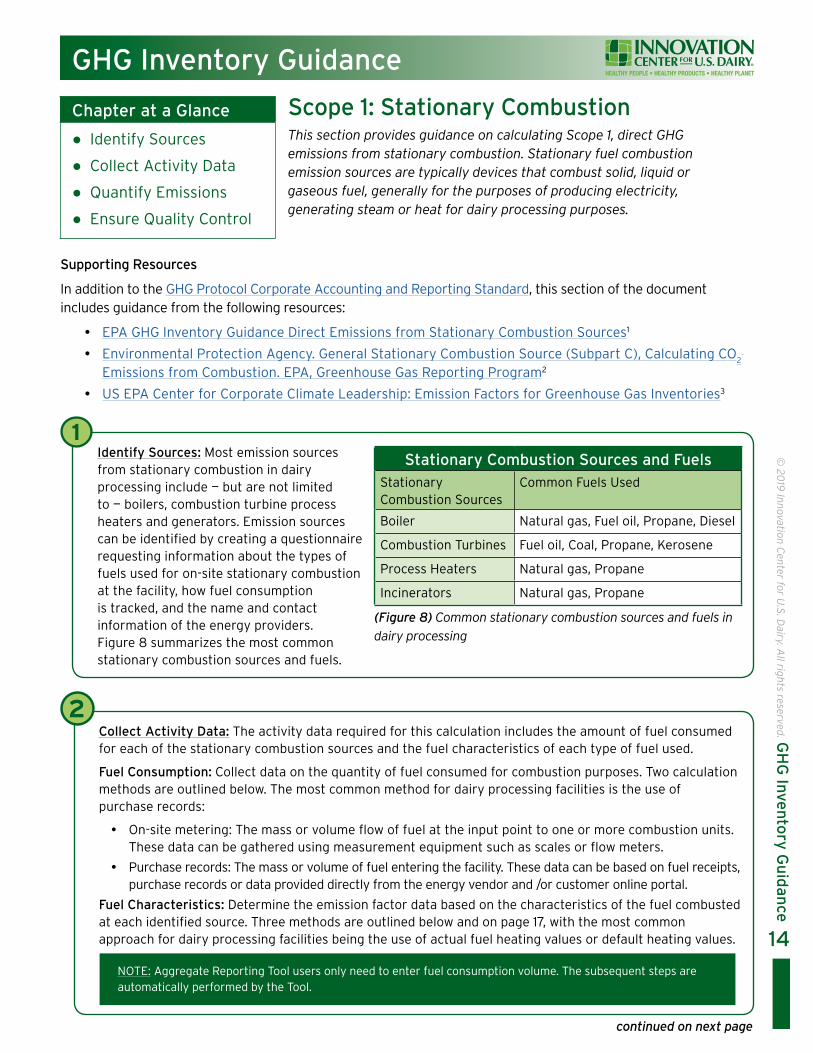
Supporting Resources
In addition to the GHG Protocol Corporate Accounting and Reporting Standard this section of the document includes guidance from the following resources
y EPA GHG Inventory Guidance Direct Emissions from Stationary Combustion Sources1
y Environmental Protection Agency General Stationary Combustion Source (Subpart C) Calculating CO2
Emissions from Combustion EPA Greenhouse Gas Reporting Program2
y US EPA Center for Corporate Climate Leadership Emission Factors for Greenhouse Gas Inventories3
14
copy 20
19 Innovation C
enter for US D
airy All rights reserved G
HG
Inven
tory
Gu
idan
ce
GHG Inventory Guidance
Scope 1 Stationary Combustion This section provides guidance on calculating Scope 1 direct GHG emissions from stationary combustion Stationary fuel combustion emission sources are typically devices that combust solid liquid or gaseous fuel generally for the purposes of producing electricity generating steam or heat for dairy processing purposes
Chapter at a Glance
Identify Sources
Collect Activity Data
Quantify Emissions
Ensure Quality Control
Identify Sources Most emission sources from stationary combustion in dairy processing include mdash but are not limited to mdash boilers combustion turbine process heaters and generators Emission sources can be identified by creating a questionnaire requesting information about the types of fuels used for on-site stationary combustion at the facility how fuel consumption is tracked and the name and contact information of the energy providers Figure 8 summarizes the most common stationary combustion sources and fuels
(Figure 8) Common stationary combustion sources and fuels in dairy processing
1Stationary Combustion Sources and Fuels
Stationary Combustion Sources
Common Fuels Used
Boiler Natural gas Fuel oil Propane Diesel
Combustion Turbines Fuel oil Coal Propane Kerosene
Process Heaters Natural gas Propane
Incinerators Natural gas Propane
Collect Activity Data The activity data required for this calculation includes the amount of fuel consumed for each of the stationary combustion sources and the fuel characteristics of each type of fuel used
Fuel Consumption Collect data on the quantity of fuel consumed for combustion purposes Two calculation methods are outlined below The most common method for dairy processing facilities is the use of purchase records
y On-site metering The mass or volume flow of fuel at the input point to one or more combustion units These data can be gathered using measurement equipment such as scales or flow meters
y Purchase records The mass or volume of fuel entering the facility These data can be based on fuel receipts purchase records or data provided directly from the energy vendor and or customer online portal
Fuel Characteristics Determine the emission factor data based on the characteristics of the fuel combusted at each identified source Three methods are outlined below and on page 17 with the most common approach for dairy processing facilities being the use of actual fuel heating values or default heating values
2
continued on next page
NOTE Aggregate Reporting Tool users only need to enter fuel consumption volume The subsequent steps are automatically performed by the Tool
15
copy 20
19 Innovation C
enter for US D
airy All rights reserved G
HG
Inven
tory
Gu
idan
ce
Scope 1 Stationary Combustion
continued on next page
GHG Inventory Guidance
y Measured carbon content This is a measure of the total carbon in the fuel and can be determined through chemical analysis This is the most accurate emission factor data but it is often not practical for dairy processors to conduct a fuel analysis
y Actual fuel heating value A fuelrsquos heating value is a measure of the quantity of heat liberated during combustion of the fuel This information can often be found on utility bills which will list the amount of fuel purchased in terms of energy For instance most natural gas consumption data is detailed in thermal units and volumetric units To ensure consistent reporting all energy values should be reported in Gross Calorific Value (GCV) where the high heat value (HHV) is reported
y Default heating values If it is not practical to obtain data specific to fuel used then default heating values embedded in the Aggregate Reporting Tool will be applied to calculate emissions
Tip Emission factors and default high heating values are representative averages based on multiple fuel samples taken across the country For homogeneous fuels such as pipeline-quality natural gas
default heating values often provide a very accurate emissions estimate
2
QuickTip
NOTE Fuel metering equipment and readings are subject to error Therefore if this method is chosen calibration and testing should be performed to ensure accuracy
NOTE Aggregate Reporting Tool users should not follow this step A default heat value for each fuel type is embedded in Intelex Certain energy types such as natural gas solar and wind can be reported directly in energy units
Quantify Emissions Calculate Scope 1 stationary combustion emissions using the EPA Simplified GHG Emissions Calculator Use the EPA GHG Inventory Guidance Direct Emissions from Stationary Combustion Sources1 In conjunction with the calculator
The tool is effective in calculating CO2e emissions resulting from the combustion of fuels in stationary
combustion equipment (Figure 9 highlights the key features of the tool Figure 10 page 18 offers additional guidance on using the tool)
Additional Guidance for use of the Calculation Tool
y If fuel consumption data is recorded in physical units and the heat value is known convert fuel consumption data to energy units
y Under the Introduction tab supply information on the type of fuel consumed and select the industry sector ndash Manufacturing
3
(Figure 9) Stationary combustion emissions calculator tool highlights
Overview of Stationary Combustion Emissions CalculatorFeature Description
Emission Calculations Calculates CO2 CH
4 and N
2O emissions resulting from the combustion of
fuels in stationary combustion equipment Totals emissions in tons of CO2e
Unit Conversion Automatically converts data to common measurement units If certain units are available use the EIA Energy Conversion Calculator3 to first convert the units
16
copy 20
19 Innovation C
enter for US D
airy All rights reserved G
HG
Inven
tory
Gu
idan
ce
Scope 1 Stationary Combustion
GHG Inventory Guidance
y If using energy units the user is required to select high heating value HHV or low heating value LHV To maintain consistency with the Processor Handbook processors should try to use HHVs
ordm High Heating Value (HHV) is defined as the amount of heat released by a specified quantity (initially at 25degC) once it is combusted and the products have returned to a temperature of 25degC which takes into account the latent heat of vaporization of water in the combustion products
ordm Low Heating Value (LHV) is defined as the amount of heat released by combusting a specified quantity (initially at 25degC) and returning the temperature of the combustion products to 150degC which assumes the latent heat of vaporization of water in the reaction products is not recovered
y For additional information on heating values and guidance on calculating the emissions of biomass fuels emergency generators waste-derived fuels CO
2 capture and storage and non-combustion sources refer
to the EPArsquos GHG Inventory Guidance Direct Emissions from Stationary Combustion Sources
3
Ensure Quality Control The accuracy and transparency of an emissions calculation depends on the quality of the data collected the rigor of quality control measures and proper documentation Figure 10 highlights a few key quality control measures Figure 11 provides documentation guidelines Additional documentation information can be found in Chapter 7 of the GHG Protocol Corporate Accounting and Reporting Standard
4
Quality Control Guidelines Step 1 bull If using meters to collect activity data compare fuel-metered data with purchase records
to ensure accuracy of metering equipment
Step 2 bull Ensure consistent emission factors and GWPs are used across facilities
Step 3 bull Conduct an internal review to ensure units were converted correctly and emissions were accurately quantified
Step 4 bull If not using default emissions factors compare actual heating values to available default values
Step 5 bull Update the IMP to reflect any changes in monitoring equipment or procedures that could potentially affect the quality of emissions data
(Figure 10) Key quality control guidelines for stationary combustion emissions calculations
Documentation Guidelinesbull Description of facilities and stationary combustion sources and fuels
bull Description of methods applied to estimate emissions for each activity facility and combustion unit
bull List of metering or monitoring devices used (if applicable)
bull Information on the source(s) used to calculate the activity data This could include purchase receipts utility bills delivery receipts contract purchase on-site metered fuel documentation stock inventory documentation and heat content documentation from suppliers
bull Description of quality management procedures implemented
bull Summary of any changes that may have affected the accuracy consistency or completeness of calculations
(Figure 11) Scope 1 Stationary Combustion emissions documentation guidelines
17
copy 20
19 Innovation C
enter for US D
airy All rights reserved G
HG
Inven
tory
Gu
idan
ce
Scope 1 Stationary Combustion
GHG Inventory Guidance
Works Cited
Additional Resources
1 EPACenterforCorporateClimateLeadershipGreenhouseGasInventoryGuidanceDirectEmissionsfromStationaryCombustionSourcesVersion30httpbitly2KJrg2a
2 WorldResourcesInstituteMay2015GHGProtocolGuidanceDirectEmissionsfromStationaryCombustionVersion30httpbitly2gX1WbG
3 EnvironmentalProtectionAgencyGeneralStationaryCombustionSource(SubpartC)CalculatingCO2
EmissionsfromCombustionEPAGreenhouseGasReportingProgramhttpbitly2FPuNso
4 EPACenterforCorporateClimateLeadershipEmissionFactorsforGreenhouseGasInventoriesMarch92018httpswwwepagovclimateleadership
5 EnvironmentalProtectionAgencyDirect Emissions from Stationary Combustion Sources Greenhouse Gas Inventory GuidanceJanuary2016httpbitly2KJrg2a
yy WorldyResourcesyInstituteyGHGyProtocolyToolyforyGHGyEmissionsyfromyStationaryyCombustion httpbitly36c227z
yy WorldyResourcesyInstituteyGHGyProtocolyStationaryyCombustionyGuidanceyVersiony30yyhttpbitly2gX1WbG
yy EnergyyConversionyCalculatorsyUsedytoyconvertyphysicalyunitsytoyenergyyunitsyhttpsbitly33M6f04
yy EPAyCenteryforyCorporateyClimateyLeadershipyGreenhouseyGasyInventoryyGuidanceyDirectyEmissionsyfromyStationaryyCombustionySourcesyVersiony30yhttpbitly2KJrg2a
18
copy 20
19 Innovation C
enter for US D
airy All rights reserved G
HG
Inven
tory
Gu
idan
ce
GHG Inventory Guidance
Scope 1 Fugitive Emissions Fugitive emissions from refrigeration and air conditioning result from leakage and service over the operational life of the equipment and from disposal at the end of the useful life of the equipment The leakage of refrigerant gas is a small but significant source of GHG emissions because of a high GWP associated with these GHGs
Chapter at a Glance
Identify Sources
Collect Activity Data
Select Approach
Ensure Quality Control
NOTE HFCs and PFCs are a class of powerful greenhouse gases with GWP values that are typically 1000 times greater than CO
2 Since these GHGs have a significant warming ability careful attention should be
given to thoroughly account for and quantify fugitive emissions The significance of an emissions source in a companyrsquos IMP can only be established after it has been appropriately assessed and quantified
Supporting Resources
In addition to the GHG Protocol Corporate Accounting and Reporting Standard this section of the document draws on guidance from the following resources
y EPA GHG Inventory Guidance Direct Fugitive Emissions from Refrigeration Air Conditioning Fire Suppression and Industrial Gases1
y Climate Registry General Reporting Protocol Version 21 Chapter 16 Direct Fugitive Emissions from the Use of Refrigeration and Air Conditioning Equipment2
Collect Activity Data The activity data required to calculate fugitive emissions depends upon the calculation approach selected in Step 3
2
Identify Sources Most dairy processing facilities use non-halogenated refrigerants such as ammonia propane and isobutane for refrigeration These refrigerants are not GHGs and therefore are not reported in the inventory However HFC and PFC refrigerants used in refrigerated trailers and air conditioning units are common and the associated GHG emissions should be accounted for in company-owned and -controlled equipment Figure 12 lists fugitive emission sources that are common in dairy processing
1Common Fugitive Emission SourcesRefrigerated transport
Industrial process refrigeration
Cold storage warehouses
Mobile air conditioning
(Figure 12) Common sources of fugitive emissions in dairy processing
Quantify Emissions Calculate fugitive emissions by using the lsquoRefrigeration and ACrsquo tab on the EPA Simplified GHG Emissions Calculator The Aggregate Reporting Tool quantifies fugitive emissions according to the Mass Balance method (Option 1) in the Calculator Use this calculator in conjunction with the EPA Fugitive Emissions Guidance
3
continued on next page
Scope 1 Fugitive Emissions
19
copy 20
19 Innovation C
enter for US D
airy All rights reserved G
HG
Inven
tory
Gu
idan
ce
GHG Inventory Guidance
3Overview of Fugitive Emission Calculation Methods
Method Description Best Use
Screening Method A preliminary method to estimate emissions
Use only if fugitive emissions are relatively small If emissions are estimated or believed to be relatively large the company should use a more accurate and robust method as the emissions factors used in this method are highly uncertain
Sales-Based Method
Activity data based on purchase records and service records
For companies that maintain their own refrigerant equipment emissions are based on the amount of refrigerant purchased and used by the facility
Lifecycle Stage Method (Mass Balance Method)
Activity data based on total inventory of refrigerants
For companies that have contractors maintain equipment tracks emissions from installation servicing and disposal
(Figure 13) Calculation methods for quantifying fugitive emissions from refrigeration and air-conditioning equipment
Ensure Quality Control Implementing quality control measures and documentation measures are important for fugitive emissions calculations as failure to account for small releases of fluorinated compounds can lead to significant errors in a companyrsquos GHG inventory Additional information can be found in Chapter 7 of the GHG Protocol Corporate Accounting and Reporting Standard and Section 7 of the EPA Fugitive Emissions Guidance
4
Quality Control and Documentation for Fugitive Emission Calculationsbull Account for each GHG emissions source separately because of the differing GWPs
bull Provide information on the approach used to quantify direct fugitive emissions
bull Identify calculation errors and omissions by comparing facility emissions data against previous year calculations
bull Document activity data mdash stock inventory documentation purchase receipts delivery receipts contract purchases delivery receipts of equipment shipping or disposal records of equipment
bull Identify areas of uncertainty in emission calculations and use the most accurate data or conservative values
(Figure 14) Quality control and documentation guidelines for fugitive emissions calculations
20
copy 20
19 Innovation C
enter for US D
airy All rights reserved G
HG
Inven
tory
Gu
idan
ce
GHG Inventory Guidance
Scope 1 Fugitive Emissions
Works Cited
Additional Resources
1 EPACenterforCorporateClimateLeadershipGreenhouseGasInventoryGuidanceDirectFugitiveEmissionsfromRefrigerationAirConditioningFireSuppressionandIndustrialGaseshttpbitly2KHZgMn
2 ClimateRegistryJanuary2016Chapter16DirectFugitiveEmissionsfromtheUseofRefrigerationandAirConditioningEquipmentGeneral Reporting Protocol for the Voluntary Reporting Program Version 21(pp134)httpbitly2rpZAXn
yy WorldyResourcesyInstituteyGHGyProtocolyToolyforyRefrigerationyandyAir-ConditioningyEquipment httpwwwghgprotocolorgsitesdefaultfilesghgphfc-pfc_0xls
yy WorldyResourcesyInstituteyJanuaryy2005yGHGyProtocolyHFCyGuideytoyCalculationyWorksheetsyyVersiony10yhttpbitly2jCgwXg
yy WorldyResourcesyInstituteyGHGyProtocolyCorporateyAccountingyandyReportingyStandardyChaptery7yManagingyInventoryyQualityyhttpbitly2yhHn0z
21
copy 20
19 Innovation C
enter for US D
airy All rights reserved G
HG
Inven
tory
Gu
idan
ce
GHG Inventory Guidance
Scope 1 Mobile Combustion Emissions This section provides guidance on accounting for and calculating Scope 1 direct GHG emissions from owned or leased mobile sources (both on-road and non-road vehicles) that are within the companyrsquos inventory boundaries
Chapter at a Glance
Identify Sources
Collect Activity Data
Select Approach
Ensure Quality Control
Supporting Resources
This section of the document includes guidance the following resources
y EPA Center for Corporate Climate Leadership Greenhouse Gas Inventory Guidance Direct Emissions from Mobile Combustion Sources1
y The Climate Registry General Reporting Protocol Version 21 Chapter 13 Direct Emissions from Mobile Combustion2
Collect Activity Data GHG emissions from mobile combustion are most easily estimated by collecting data on the amount of fuel consumed distance traveled and vehicle and fuel characteristics for each identified source Figure 16 page 22 outlines the necessary activity data to perform this calculation
TIP If all the preferred activity data is not available the company should at a minimum provide fuel consumption data The referenced calculation tool will auto populate default emission factors for missing data
Identify Sources Scope 1 mobile emissions refer to a wide variety of company-owned or operated vehicles engines and equipment that generate GHG emissions through the combustion of various fuels while moving from one location to another They include vehicles used on roads for transportation of employees or distribution trucks as well as off-road vehicles engines and equipment used for many other purposes Equipment that can not move under its own power but can be transported site-to-site (eg an emergency generator) is defined as a stationary (not mobile) combustion source1 Owned company product distribution trucks are most likely the greatest sources of mobile emissions for dairy processors However if the processing company does not own or have direct operational control of vehicles or equipment these sources will be reported as Scope 3 not Scope 1 emissions A list of common mobile combustion emission sources can be found in Figure 15
1
Mobile Emission SourcesCommon Mobile Combustion Sources Common Fuels Used
On-Road Vehicles Company vehicles Gasoline
Combination trucks and fluid milk trucks
Diesel fuel gasoline bio-diesel
Non-Road Vehicles (Mobile Machinery)
Forklifts and non-road equipment Gasoline diesel fuel propane
Construction equipment Diesel fuel
(Figure 15) Common mobile emission sources and fuels used in dairy processing
2
QuickTip
continued on next page
22
copy 20
19 Innovation C
enter for US D
airy All rights reserved G
HG
Inven
tory
Gu
idan
ce
Scope 1 Mobile Combustion Emissions
GHG Inventory Guidance
Quantify Emissions Use the EPA Simplified GHG Emissions Calculator lsquoMobile Sourcesrsquo tab to quantify emissions from mobile combustion Refer to the EPA Direct Emissions from Mobile Combustion Sources for guidance on this category
This tool calculates the CO2 CH
4 and N
2O emissions of
y Vehicles that are ownedcontrolled by the company
y Transport by road rail air and water
y Mobile machinery such as agricultural and construction equipment
3
Ensure Quality Control The quality control and documentation guidelines outlined in Figure 17 can help to ensure data accuracy and transparency For more information about reducing uncertainty when calculating emissions from mobile sources refer to Section 6 of the EPA Direct Emissions from Mobile Combustion Sources
4
Quality Control and Documentation for Mobile Emission Calculationsbull Compare emission factors provided by fuel supplier or collected on-site with the EPA Center for
Corporate Climate Leadership Emission Factors for Greenhouse Gas Inventories
bull Document fuel consumption data with official logs of vehicle gauges fuel purchase receipts and storage tank records
bull Document distance traveled with odometer logs and calculated miles to destination
bull Document vehicle fuel economy with company records manufacturer records or with information from the EPA fuel economy website
2Activity Data for Mobile Emission Calculations
Type Data Needed
Fuel Consumption Number of gallons barrels cubic meters etc
Distance Traveled Number of miles kilometers
Vehicle Characteristics Vehicle type and model year
Fuel Characteristics Type of fuel and heating value
(Figure 16) Activity data that should be collected for each source of mobile combustion emissions
(Figure 17) Quality control and documentation for mobile emission calculations
23
copy 20
19 Innovation C
enter for US D
airy All rights reserved G
HG
Inven
tory
Gu
idan
ce
GHG Inventory Guidance
Scope 1 Mobile Combustion Emissions
Works Cited
Additional Resources
1 TheClimateRegistryJanuary2016GlossaryoftermsGeneral Reporting Protocol Version 21 (pp181)httpbitly2rpZAXn
2 EPACenterforCorporateClimateLeadershipJanuary2016GreenhouseGasInventoryGuidanceDirectEmissionsfromMobileCombustionSourceshttpbitly2JZ4lip
3 TheClimateRegistryJanuary2016Chapter13DirectEmissionsfromMobileCombustionGeneral Reporting Protocol Version 21httpbitly2rpZAXn
4 WorldResourcesInstitute2015SettingOperationalBoundariesThe GHG Protocol Corporate Accounting and Reporting Standard(pp25)httpbitly2yhHn0z
yy WorldyResourcesyInstituteyGHGyProtocolyToolyforyMobileyCombustionyVersiony26yhttpbitly2qSGWuV
yy EPAyCenteryforyCorporateyClimateyLeadershipyGreenhouseyGasyInventoryyGuidanceyDirectyEmissionsyfromyMobileyCombustionySourcesyhttpbitly2JZ4lip
yy WRIyGHGyEmissionyFactorsyCompilationyAyspreadsheetyofyemissionyfactorsyusedyinytheyGHGyProtocolyCalculatorsyhttpsbitly2NFLq0M
yy EPAyandyUSyDepartmentyofyEnergyyOfficialyUSygovernmentysourceyforyfuelyeconomyyinformationyhttpswwwfueleconomygovfegfindacarshtml
yy EPAyCenteryforyCorporateyClimateyLeadershipyChaptery6yUncertaintyyAssessmentyGreenhouseyGasyInventoryyGuidanceyDirectyEmissionsyfromyMobileyCombustionySourcesyhttpbitly2JZ4lip
yy EnvironmentalyDefenseyFundyClimateyCorpsyHandbook Chaptery15yEnergyyConsumptionyofycompanyyvehiclesyhttpbitly2MTc9GB
24
copy 20
19 Innovation C
enter for US D
airy All rights reserved G
HG
Inven
tory
Gu
idan
ce
GHG Inventory Guidance
Scope 2 Emissions from Purchased Energy This section presents methods used to calculate Scope 2 GHG emissions which are indirect emissions from the generation of purchased energy These are considered an indirect emissions source because they are a consequence of activities of the reporting organization but occur at sources owned and controlled by an outside entity (ie an electricity utility)
Chapter at a Glance
Identify Sources
Collect Activity Data
Quantify Emissions
Ensure Quality Control
Supporting Resources
In addition to the GHG Protocol this chapter draws on guidance from the following resources
y EPA Center for Corporate Climate Leadership Indirect Emissions from Purchased Electricity1
y The GHG Protocol Scope 2 Guidance An amendment to the GHG Protocol Corporate Standard2
y The Climate Registry General Reporting Protocol Chapter 5 Page 343
Defining Scope 2 Emissions
The GHG Protocol Scope 2 Guidance Amendment to the Corporate Standard which went into effect in January 2015 provides updated requirements and best practices for Scope 2 emissions accounting The updates were made to reflect changes in electricity markets and the growing choices companies have regarding the type of electricity purchased The most significant Scope 2 accounting change introduced is that companies are to account for and report Market-Based and Location-Based Scope 2 emissions Previously the protocol only required the Location-Based method
Market-Based Emissions
The Market-Based method reflects the GHG emissions associated with the specific choices a consumer (a dairy processor) makes regarding its electricity supplier or product as conveyed through contractual agreements between the processor and the provider The emission factors are supplier-specific emission factors or the emissions profiles associated with renewable energy credits (RECs) and power purchase agreements (PPAs)
Location-Based Emissions
The Location-Based method uses average emission factors for the electricity grids that are providing electricity to the facility4 That is the Location-Based approach considers average emissions intensities in the locations of electricity use while the Market-Based approach considers the emissions intensities of electricity products that the processor has specifically chosen
Calculating Scope 2 Emissions
When calculating Scope 2 emissions companies should do the following
y Companies should report both Market-Based and Location-Based Scope 2 emissions totals
y When a company enters into a supplier-specific contract (or other contract) in which a credible emission factor is unidentifiable the reporting company should simply use the grid-average emission factor as a proxy for that specific amount of contracted energy
y All instruments must meet certain quality criteria before they can be applied to the Market-Based emissions total These criteria are listed on page 60 of the GHG Protocolrsquos Scope 2 Guidance
A reporting company should select either the Location-Based approach or Market-Based approach when setting a Scope 2 target and tracking its performance
Since the predominant Scope 2 calculation method currently used across the dairy processing sector is the Location-Based method this document describes steps to calculate Location-Based emissions outlined in Figure 18 page 25
25
copy 20
19 Innovation C
enter for US D
airy All rights reserved G
HG
Inven
tory
Gu
idan
ce
GHG Inventory Guidance
Scope 2 Steps to Calculate Location-Based GuidelinesStep 1 Determine the amount of electricity purchased
bull The total electricity purchased and consumed during the reporting period in energy units MWh or kWh provide the most precise activity data For guidance on how to interpret utility bills see Chapter 7 of the EDF Climate Corps Handbook
Step 2 Select emission factors
bull Emission factors Companies that purchase electricity from the electric grid should use regional or sub-regional emission factors provided by the EPArsquos Emissions and Generation Resource Integrated Database eGRID Electricity is generated in varying ways across the US and eGRID emission factors help capture the GHG emissions associated with the forms of energy generation unique to the facilities region The EPArsquos eGRID sub-region map can be used to determine the appropriate sub-region for each facility
Step 3 Quantify emissions bull The EPA Simplified GHG Emissions Calculator which uses 2018 emission factors from eGRID Companies calculate emissions by inputting the amount of electricity purchased and selecting the eGRID sub- region in which the processing facility is located
(Figure 18) Steps to calculate Location-Based guidelines
Scope 2 Emissions from Purchased Energy
Works Cited
Additional Resources
1 EnvironmentalProtectionAgency2016IndirectEmissionsfromPurchasedElectricityGuidanceCenter for Corporate Climate Leadershiphttpbitly2HUTgCz
2 WorldResourcesInstitute2015GHGProtocolScope2GuidanceAn Amendment to The GHG Protocol Corporate Accounting and Reporting Standardhttpbitly2jzMLpZ
3 TheClimateRegistryGeneralReportingProtocolVersion212016Chapter5Emissions to Include in the Inventoryhttpsbitly2CFOB2d
4 TheGHGProtocolCorporateAccountingandReportingStandardWorldResourcesInstituteWorldBusinessCouncilforSustainableDevelopment2015httpbitly2yhHn0z
yy EDFyClimateyCorpsyHandbookyChaptery7 Benchmarkingyenergyyusageyandyinterpretingyutilityybills
yy EDFyClimateyCorpsyHandbookyChaptery16 Demandyresponseyandysmartygrid
GHG Inventory Guidance
Measurement and Estimation Uncertainty of GHG EmissionsGHG emissions uncertainty is dependent upon the quality of data collected and methods used to calculate emissions Several types of uncertainties associated with GHG inventories range from natural
variations such as human error to statistical uncertainty related to the indirect measurement of emissions (eg activity data and an emission factor) A well-designed IMP that follows the quality and documentation guidelines outlined in each section of this document can help reduce uncertainty
Chapter at a Glance
Emissions Uncertainty
Calculating Uncertainty
26
copy 20
19 Innovation C
enter for US D
airy All rights reserved G
HG
Inven
tory
Gu
idan
ce
Guidance on Uncertainty Assessment
The GHG Protocol Guidance on Uncertainty Assessment in GHG Inventories and Calculating Statistical Parameter Uncertainty describes the functionality of the tool and provides users with information on how to prepare interpret and utilize inventory uncertainty assessments The guidance is based on the IPCC Guidelines for National GHG Inventories
Uncertainty Assessment Calculator
The GHG Protocol Cross Sector Calculation Tool Measurement and Estimation Uncertainty of GHG Emissions is applicable to many industries and businesses regardless of sector The calculation tool aggregates parameter uncertainties across source categories and the entire inventory
Works Cited
Additional Resources
1 WorldResourcesInstitute2003GHGProtocolguidanceonuncertaintyassessmentinGHGinventoriesandcalculatingstatisticalparameteruncertaintyhttpbitly2KFbCVO
yy TheyGHGyProtocolyCrossySectoryCalculationyToolyMeasurementyandyEstimationyUncertaintyyofyGHGyEmissionsyhttpbitly2Pp8oKU
yy TheyGHGyProtocolyGuidanceyonyUncertaintyyAssessmentyinyGHGyInventoriesyandyCalculatingyStatisticalyParameteryUncertaintyyGuidanceyonyhowytoyuseytheyMeasurementyandyEstimationyUncertaintyyofyGHGyEmissionsycalculationytoolyhttpbitly2KFbCVO
yy TheyGHGyProtocolyCorporateyAccountingyandyReportingyStandardyChaptery7yManagingyInventoryyQualityyhttpbitly2yhHn0z
27
copy 20
19 Innovation C
enter for US D
airy All rights reserved G
HG
Inven
tory
Gu
idan
ce
GHG Inventory Guidance
Target SettingGHG emissions reduction target setting and mitigation strategies have become a priority issue across company supply chains The increasing number of public GHG emission reduction commitments are strategic decisions grounded in opportunities to capture business value and reduce company risk
Chapter at a Glance
Target Setting
Science-Based Targets
Target Setting Resources
Companies can set two broad types of GHG reduction target metrics mdash an absolute emissions target or an intensity emissions target Intensity targets specify emissions reductions relative to productivity or economic output such as tons of CO
2elbs of product
produced Both intensity and absolute targets specify a reduction in emissions relative to a historical baseline year They ensure that emissions reductions are maintained with company growth Companies should carefully evaluate both types before choosing a target metric and consider seeking outside support to determine the target type and actual target Several organizations can assist in establishing targets
y WWF Climate Savers
y Climate Registry
y Pew Business Environmental Leadership Council
y Carbon Trust
Once an emissions target is defined it is crucial to consistently track performance over time Specifically a company may be required to recalculate its baseline year inventory whenever the following happens
y Significant changes in the structure of the reporting company
y Significant changes in the calculation methodology
ordm Improved emission factors
ordm Improved activity data
y Discovery of significant errors or smaller errors that are collectively significant
The GHG Protocol Corporate Standard does not have a set definition for ldquosignificantrdquo however a company should determine its own significance threshold (ie 2 percent) to define when changes in aggregate should trigger recalculation of the baseline year inventory
Structural changes are defined as the transfer of ownership or control of emitting activities from one company to another
They can occur via
y Mergers acquisitions and divestments
y Outsourcing or in-sourcing of emitting activities
For more information on emissions tracking over time companies may reference the GHG Protocol Corporate Standard
Science-Based Targets
The Science-Based Target Initiative is a collaboration between the Carbon Disclosure Project (CDP) UN Global Compact World Resources Institute and World Wildlife Fund to assist corporations in establishing GHG targets that are in line with climate science The initiative defines Science-Based Targets as ldquoTargets in line with the level of decarbonization required to keep global temperature increase below 2deg C compared to pre-industrial temperatures as described in the Assessment Report of the Intergovernmental Panel on Climate Change (IPCC)rdquo As of October 2019 the Science-Based Targets Initiative requires Scope 1 and 2 targets to be more ambitious and in line with ldquowell below 2deg Crdquo pathways
Aligning targets with climate science is becoming the business norm It is widely accepted that global action must be taken to avoid some of the most disastrous and irreversible impacts of climate change The following resources provide the causes and predicted impacts of climate change
y NASA Global Climate Change2
y NOAA National Centers for Environmental Information3
y The Global Carbon Project4
y The visualization of temperature change from 1880 to 2016 as analyzed by NASArsquos Goddard Institute for Space Studies
NOTE Recalculation is not needed if out- or in-sourced activities were previously included in a different scope
28
copy 20
19 Innovation C
enter for US D
airy All rights reserved G
HG
Inven
tory
Gu
idan
ce
By adopting Science-Based Targets dairy processing companies take a leadership role in addressing climate change by connecting corporate sustainability goals to scientifically established thresholds Case studies featuring companies with Science-Based Targets demonstrate the benefits and reasons for setting reduction goals that are in line with climate science
Examples of benefits derived from Science-Based Targets are
y Cut costs and reduce risk Companies with ambitious targets can ensure durability and efficiency in a future where fossil fuels are increasingly more expensive
y Build credibility and reputation Sustainability has become a lens through which a company is evaluated Taking leadership action on climate change can build a companyrsquos reputation among key stakeholders
y Drive innovation Adopting Science-Based Targets can drive company and industry-wide innovation and help to turn climate risk into a business opportunity
GHG Inventory Guidance
Works Cited
Additional Resources
1 CitationWorldEconomicForumTheGlobalRisksReport2017httpbitly2roi5LW
2 NASAGlobalClimateChangehttpsclimatenasagov
3 NOAANationalCentersforEnvironmentalInformationhttpswwwngdcnoaagov
4 TheGlobalCarbonProjecthttpwwwglobalcarbonprojectorg
yy WWFyClimateySavers httpclimatesaversorg
yy ClimateyRegistry httpswwwtheclimateregistryorg
yy PewyBusinessyEnvironmentalyLeadershipyCouncilyhttpswwwc2esorgour-workbelc
yy CarbonyTrust httpswwwcarbontrustcomhome
yy NASArsquosyGoddardyInstituteyforySpaceyStudies httpssvsgsfcnasagov4546
yy CarbonyBudgetyhttpbitly2WifVwi
yy 2016yCarbonyBudgetyReportyhttpglobalcarbonbudget2016org
yy TheyUSyDepartmentyofyEnergyyMapyhttpbitly2rpEt8p
yy ClimateyChangeyandyResourceyScarcity httpspwcto2wiXKx7
yy TheyImpactyofyCorporateySustainabilityyonyOrganizationalyProcessyandyPerformance TheyHarvardyBusinessyJournalyRobertyGyEcclesyIoannisyIoannouyampyGeorgeySerafeim httpshbsme2FP1eqW
Resources for Setting Science-Based Targets
yy IntroductionytoyScience-BasedyTargetsyhttpbitly2rpLt4m
yy CallytoyAction DetailedyGuidelinesyforySettingyScience-BasedyTargetsyhttpsbitly33Okx0o
yy Science-BasedyTargetsyandyCDPyScoringyhttpbitly2KFhnmg
yy BestyPracticesyforySettingyandyAchievingyScience-BasedyTargets PresentationyatytheyClimateyLeadersyConferenceyMarchy2017yhttpbitly2jBMuTF
yy MindytheyScienceyhttpbitly2IfBqJE
yy Science-BasedyTargets Targetysettingypitfallsyandylessonsylearnedy(pdf)yhttpbitly2FPus8Q
yy Science-BasedyTargets Targetysettingypitfallsyandylessonsylearnedy(webinar)yhttpsvimeocom233570395
GHG Inventory Guidance
29
copy 20
19 Innovation C
enter for US D
airy All rights reserved G
HG
Inven
tory
Gu
idan
ce
Resources for Reducing GHG EmissionsOnce a GHG emissions inventory has been developed and a reduction target has been adopted a company should identify the main sources of GHGs and evaluate the cost-effectiveness of emission reduction measures Below are resources tools and webinars to assist companies in reducing GHG emissions
Energy Efficiency
yy EPAyEnergyyStary2011yEnergyyEfficiencyyImprovementyandyCostySavingyOpportunitiesyforytheyDairyyProcessingyIndustryyAymanualycreatedybyyEnergyyStarytoyassistydairyyprocessorsyinyidentifyingyenergyyefficiencyyimprovementsyasyanyimportantywayytoyreduceycostsyandytoyincreaseypredictableyearningsyhttpbitly345L8Wi
yy EPAyEnergyyStaryPortfolioyManageryAnyonlineytoolythatycanybeyusedytoymeasureyandytrackyenergyyandywateryconsumptionyasywellyasygreenhouseygasyemissionsyassociatedywithycommercialybuildingsyyhttpbitly2FP3Epu
yy HVACy(heatingyventilationyandyairyconditioning)yClimateyCorpsyHandbookyChaptery9yOverviewyofyhowytoysurveyycurrentyHVACysystemyanalyzeyresultsyofyanyenergyyaudityforyHVACysystemyandyperformyayfinancialyanalysesyonyrecommendationsyofyenergyyauditorsyhttpbitly2rod1qI
yy CarbonyTrustyHeatingyventilationyandyairyconditioningy(HVAC)yenergyyefficiencyyguideyAyguideytoyimproveyenergyyefficiencyyofyheatingyventilationyandyairyconditioningyhotywateryandyboilers httpbitly2jAHmiE
yy LightingyinycommercialybuildingsyClimateyCorpsyHandbookyChaptery10yDescribesyhowytoyidentifyylightingyopportunitiesyforyenergyysavingsyinycommercialybuildingsyandyhowytoydevelopyestimatesyofyenergyyusageyandycalculateytheyestimatedysavingsypotentialyhttpbitly2rod1qI
yy DemandyResponseyandySmartyGridyClimateyCorpsyHandbookyChaptery16yOverviewyofydemandyresponsey(DR)yandypossibleyenergyysavingsyandyrevenueyopportunitiesyhttpbitly2rod1qI
yy DemandyandyResponseyResearchyCenteryPublicationsyandyinformationyonydemandyresponseyandysmartygridyinfrastructureytoybestyinformyendyusersyhowytoytemporarilyyreduceyenergyyusageyinyresponseytoyeitherypriceyorysystemyreliabilityytriggersyhttpsdrrclblgov
yy CarbonyTrustyEnergyyManagementySelf-AssessmentyToolyAnyExcelyworkbookyandyguidanceydocumentythatyassessyayorganizationrsquosyenergyymanagementyhttpbitly2whnWrY
yy CarbonyValueyAnalysisyToolyTheyCarbonyValueyAnalysisyTooly(CVAT)ywasycreatedybyytheyWorldyResourcesyInstituteytoyassistyprojectymanagersywithyfactoringytheypriceyofycarbonywhenyevaluatingyreductionyprojectsyhttpbitly2jB0pt6
yy CarbonyTrustyBuildingyEnergyyEfficiencyyGuideytoyimprovingybuildingyfabricyandyinsulationyandyinstallingyappropriateycontrolsytoysaveymoneyyandycutycarbonyemissionsyhttpbitly2rmNI9C
yy CarbonyTrustyRefrigerationyImproveyenergyyefficiencyyofyyourychillersyandyrefrigerationysystemsywithyouryenergy-savingyguidanceyhttpbitly2JUV62Q
yy EPAyCenteryforyCorporateyClimateyLeadershipyAylistyofyfreeyGHGyinventoryyrelatedywebinarsyandyeventsyhttpbitly2FOcALR
Renewable Energy
yy TheyDepartmentyofyEnergyrsquosyOfficeyofyEnergyyEfficiencyyandyRenewableyEnergyy(EERE)yProvidesyinformationyonyindustrialyenergy-consumingysystemsyboileryandysteamysystemycompressedyairymotorsyfansypumpsyandyprocessyheatingyhttpbitly2K0x0nb
yy PropertyyAssessedyCleanyEnergyy(PACE)yEnergyyefficiencyyfinancingyopportunitiesyhttpbitly2FPWGjX
yy DatabaseyofyStateyIncentivesyforyRenewablesyandyEfficiencyyOverviewyofystateyandyfederalyincentivesyandypoliciesydesignedytoyhelpycompaniesyadoptyrenewableyenergyyprogramsyhttpwwwdsireusaorg
continued on next page
GHG Inventory Guidance
30
copy 20
19 Innovation C
enter for US D
airy All rights reserved G
HG
Inven
tory
Gu
idan
ce
Additional Resources
yy GuideytoyPurchasingyGreenyPoweryAycooperativeyeffortybetweenytheyEPAytheyUSyDepartmentyofyEnergyytheyWorldyResourcesyInstituteyandytheyCenteryforyResourceySolutionsythatyprovidesycurrentyandypotentialybuyersyofygreenypowerywithyinformationyaboutygreenypowerypurchasingyhttpbitly2JU8WlK
yy InnovationsyinyVoluntaryyRenewableyEnergyyProcurementyAyguideyfromyNationalyRenewableyEnergyyLaboratoryrsquosy(NREL)ythatyoutlinesymethodsyforyexpandingyaccessyandyloweringycostyforycommunitiesygovernmentsyandybusinessesyhttpswwwnrelgovdocsfy12osti54991pdf
Mobile Emissions
yy ReduceyMobileyEmissionsyVehicleyselectionyACEEEyGreeneryCarsyIdentifyyvehiclesythatyareymostyfuelyefficientyandylearnyaboutymarketytrendsyinyautomotiveytechnologyyhttpsgreenercarsorg
yy EPAyGreenyVehicleyGuideyOverviewyofyvehiclesyfuelyuseyandytheyimpactyonybothytheyenvironmentyandybottomylineyhttpswwwepagovgreenvehicles
yy FuelyEconomyyGuideyTheyUSyEnvironmentalyProtectionyAgencyy(EPA)yandyUSyDepartmentyofyEnergyy(DOE)yAyguideytoyhelpybuyersyidentifyytheymostyfuel-efficientyvehiclesyhttpbitly2FPkVP6
copy2019 Innovation Center for US Dairy All rights reserved
About the Innovation Center for US Dairyreg
The Innovation Center for US Dairyreg is a forum that
brings together the dairy community to address the
changing needs and expectations of consumers through
a framework of shared best practices and accountability
Initiated in 2008 by dairy farmers through the dairy
checkoff we collaborate on efforts that are important
both to us and our valued customers ndash priorities like
animal care environmental stewardship food safety and
traceability and community contributions The Innovation
Center is committed to continuous improvement from
farm to table striving to ensure a socially responsible
and economically viable dairy community
Visit USDairycom for more information about the
Innovation Center for US Dairy
wwwUSDairycom bull InnovationCenterUSDairycom
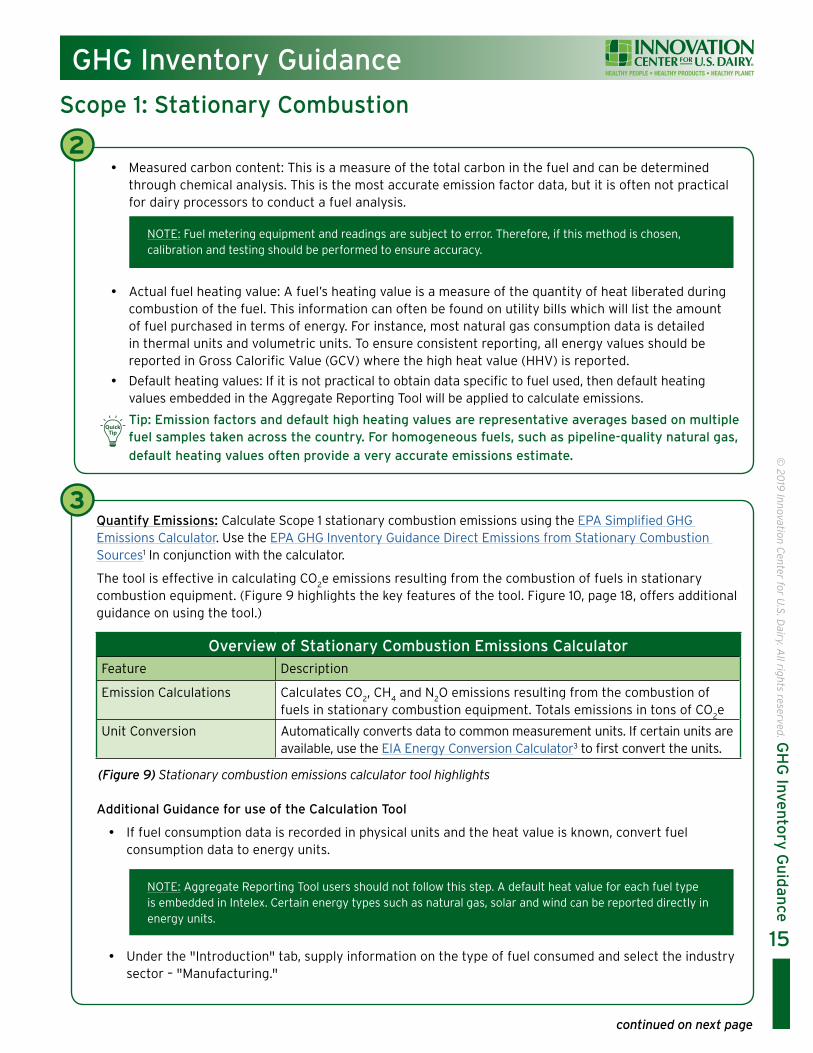
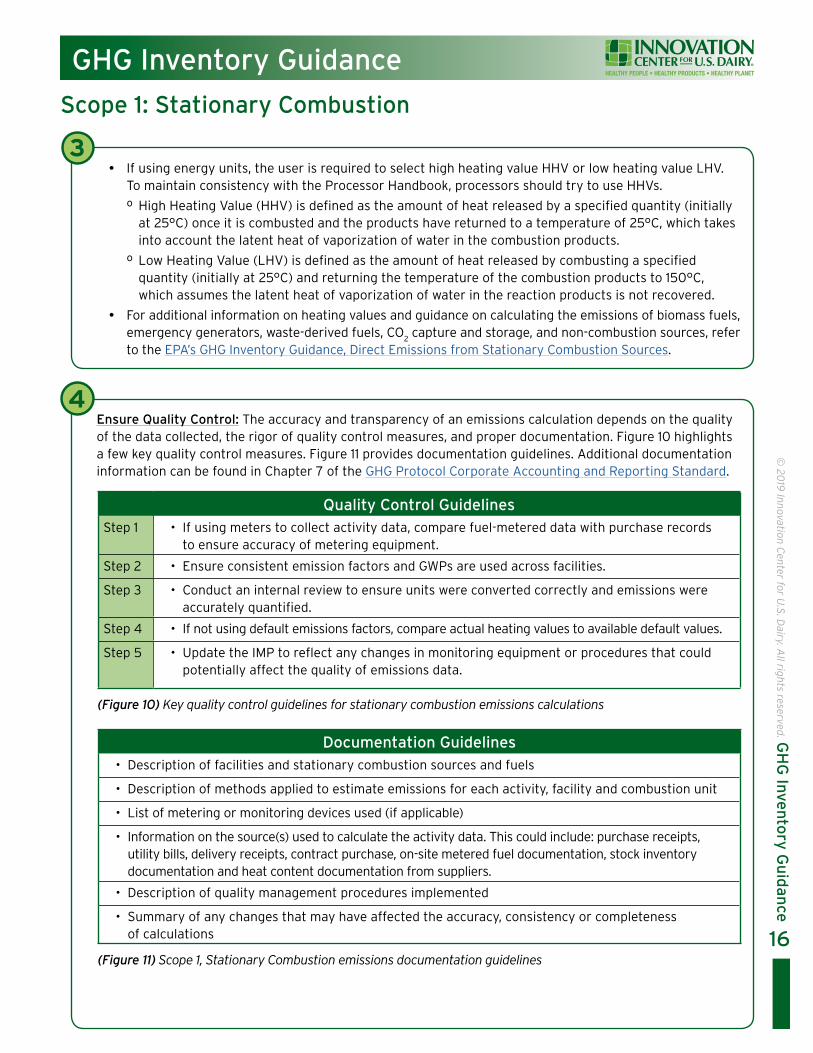
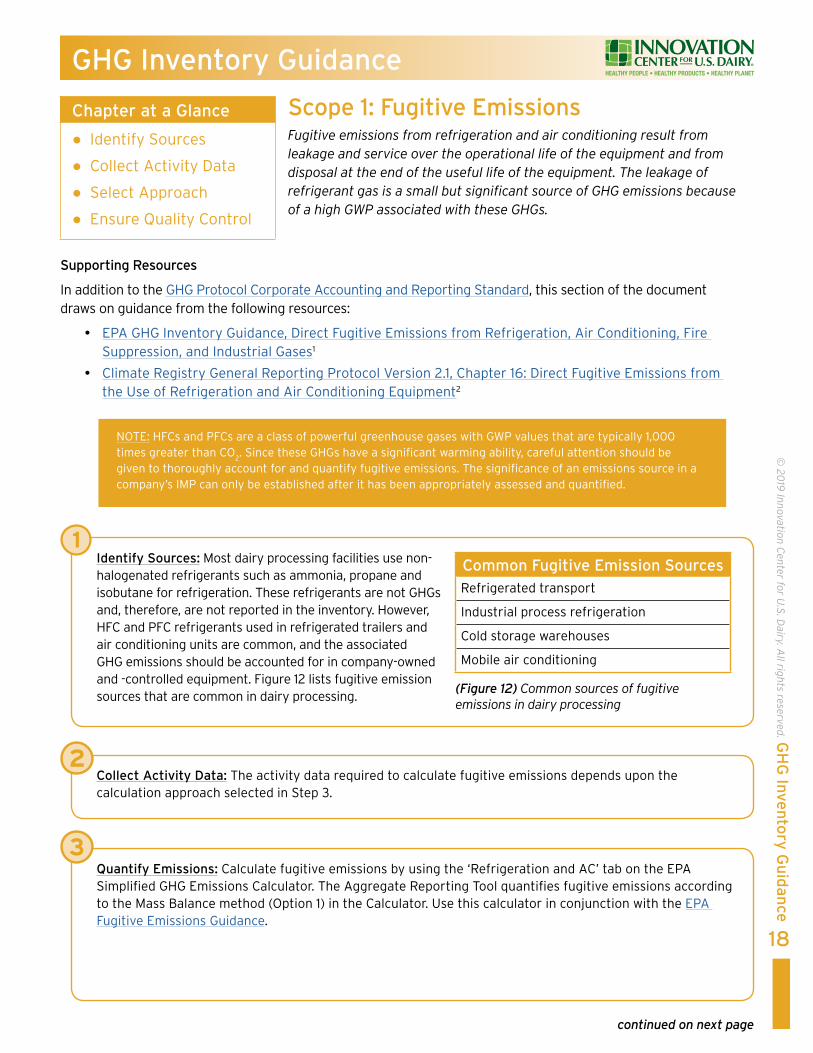
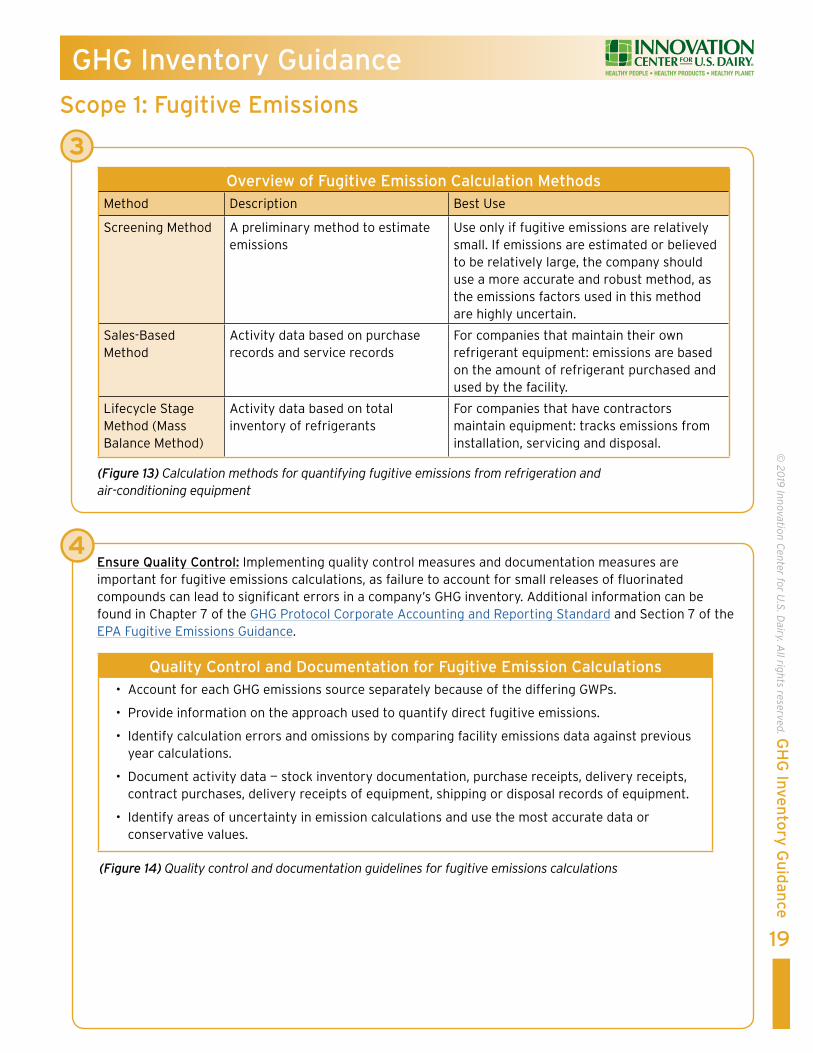
Scope 1 Fugitive Emissions
19
copy 20
19 Innovation C
enter for US D
airy All rights reserved G
HG
Inven
tory
Gu
idan
ce
GHG Inventory Guidance
3Overview of Fugitive Emission Calculation Methods
Method Description Best Use
Screening Method A preliminary method to estimate emissions
Use only if fugitive emissions are relatively small If emissions are estimated or believed to be relatively large the company should use a more accurate and robust method as the emissions factors used in this method are highly uncertain
Sales-Based Method
Activity data based on purchase records and service records
For companies that maintain their own refrigerant equipment emissions are based on the amount of refrigerant purchased and used by the facility
Lifecycle Stage Method (Mass Balance Method)
Activity data based on total inventory of refrigerants
For companies that have contractors maintain equipment tracks emissions from installation servicing and disposal
(Figure 13) Calculation methods for quantifying fugitive emissions from refrigeration and air-conditioning equipment
Ensure Quality Control Implementing quality control measures and documentation measures are important for fugitive emissions calculations as failure to account for small releases of fluorinated compounds can lead to significant errors in a companyrsquos GHG inventory Additional information can be found in Chapter 7 of the GHG Protocol Corporate Accounting and Reporting Standard and Section 7 of the EPA Fugitive Emissions Guidance
4
Quality Control and Documentation for Fugitive Emission Calculationsbull Account for each GHG emissions source separately because of the differing GWPs
bull Provide information on the approach used to quantify direct fugitive emissions
bull Identify calculation errors and omissions by comparing facility emissions data against previous year calculations
bull Document activity data mdash stock inventory documentation purchase receipts delivery receipts contract purchases delivery receipts of equipment shipping or disposal records of equipment
bull Identify areas of uncertainty in emission calculations and use the most accurate data or conservative values
(Figure 14) Quality control and documentation guidelines for fugitive emissions calculations
20
copy 20
19 Innovation C
enter for US D
airy All rights reserved G
HG
Inven
tory
Gu
idan
ce
GHG Inventory Guidance
Scope 1 Fugitive Emissions
Works Cited
Additional Resources
1 EPACenterforCorporateClimateLeadershipGreenhouseGasInventoryGuidanceDirectFugitiveEmissionsfromRefrigerationAirConditioningFireSuppressionandIndustrialGaseshttpbitly2KHZgMn
2 ClimateRegistryJanuary2016Chapter16DirectFugitiveEmissionsfromtheUseofRefrigerationandAirConditioningEquipmentGeneral Reporting Protocol for the Voluntary Reporting Program Version 21(pp134)httpbitly2rpZAXn
yy WorldyResourcesyInstituteyGHGyProtocolyToolyforyRefrigerationyandyAir-ConditioningyEquipment httpwwwghgprotocolorgsitesdefaultfilesghgphfc-pfc_0xls
yy WorldyResourcesyInstituteyJanuaryy2005yGHGyProtocolyHFCyGuideytoyCalculationyWorksheetsyyVersiony10yhttpbitly2jCgwXg
yy WorldyResourcesyInstituteyGHGyProtocolyCorporateyAccountingyandyReportingyStandardyChaptery7yManagingyInventoryyQualityyhttpbitly2yhHn0z
21
copy 20
19 Innovation C
enter for US D
airy All rights reserved G
HG
Inven
tory
Gu
idan
ce
GHG Inventory Guidance
Scope 1 Mobile Combustion Emissions This section provides guidance on accounting for and calculating Scope 1 direct GHG emissions from owned or leased mobile sources (both on-road and non-road vehicles) that are within the companyrsquos inventory boundaries
Chapter at a Glance
Identify Sources
Collect Activity Data
Select Approach
Ensure Quality Control
Supporting Resources
This section of the document includes guidance the following resources
y EPA Center for Corporate Climate Leadership Greenhouse Gas Inventory Guidance Direct Emissions from Mobile Combustion Sources1
y The Climate Registry General Reporting Protocol Version 21 Chapter 13 Direct Emissions from Mobile Combustion2
Collect Activity Data GHG emissions from mobile combustion are most easily estimated by collecting data on the amount of fuel consumed distance traveled and vehicle and fuel characteristics for each identified source Figure 16 page 22 outlines the necessary activity data to perform this calculation
TIP If all the preferred activity data is not available the company should at a minimum provide fuel consumption data The referenced calculation tool will auto populate default emission factors for missing data
Identify Sources Scope 1 mobile emissions refer to a wide variety of company-owned or operated vehicles engines and equipment that generate GHG emissions through the combustion of various fuels while moving from one location to another They include vehicles used on roads for transportation of employees or distribution trucks as well as off-road vehicles engines and equipment used for many other purposes Equipment that can not move under its own power but can be transported site-to-site (eg an emergency generator) is defined as a stationary (not mobile) combustion source1 Owned company product distribution trucks are most likely the greatest sources of mobile emissions for dairy processors However if the processing company does not own or have direct operational control of vehicles or equipment these sources will be reported as Scope 3 not Scope 1 emissions A list of common mobile combustion emission sources can be found in Figure 15
1
Mobile Emission SourcesCommon Mobile Combustion Sources Common Fuels Used
On-Road Vehicles Company vehicles Gasoline
Combination trucks and fluid milk trucks
Diesel fuel gasoline bio-diesel
Non-Road Vehicles (Mobile Machinery)
Forklifts and non-road equipment Gasoline diesel fuel propane
Construction equipment Diesel fuel
(Figure 15) Common mobile emission sources and fuels used in dairy processing
2
QuickTip
continued on next page
22
copy 20
19 Innovation C
enter for US D
airy All rights reserved G
HG
Inven
tory
Gu
idan
ce
Scope 1 Mobile Combustion Emissions
GHG Inventory Guidance
Quantify Emissions Use the EPA Simplified GHG Emissions Calculator lsquoMobile Sourcesrsquo tab to quantify emissions from mobile combustion Refer to the EPA Direct Emissions from Mobile Combustion Sources for guidance on this category
This tool calculates the CO2 CH
4 and N
2O emissions of
y Vehicles that are ownedcontrolled by the company
y Transport by road rail air and water
y Mobile machinery such as agricultural and construction equipment
3
Ensure Quality Control The quality control and documentation guidelines outlined in Figure 17 can help to ensure data accuracy and transparency For more information about reducing uncertainty when calculating emissions from mobile sources refer to Section 6 of the EPA Direct Emissions from Mobile Combustion Sources
4
Quality Control and Documentation for Mobile Emission Calculationsbull Compare emission factors provided by fuel supplier or collected on-site with the EPA Center for
Corporate Climate Leadership Emission Factors for Greenhouse Gas Inventories
bull Document fuel consumption data with official logs of vehicle gauges fuel purchase receipts and storage tank records
bull Document distance traveled with odometer logs and calculated miles to destination
bull Document vehicle fuel economy with company records manufacturer records or with information from the EPA fuel economy website
2Activity Data for Mobile Emission Calculations
Type Data Needed
Fuel Consumption Number of gallons barrels cubic meters etc
Distance Traveled Number of miles kilometers
Vehicle Characteristics Vehicle type and model year
Fuel Characteristics Type of fuel and heating value
(Figure 16) Activity data that should be collected for each source of mobile combustion emissions
(Figure 17) Quality control and documentation for mobile emission calculations
23
copy 20
19 Innovation C
enter for US D
airy All rights reserved G
HG
Inven
tory
Gu
idan
ce
GHG Inventory Guidance
Scope 1 Mobile Combustion Emissions
Works Cited
Additional Resources
1 TheClimateRegistryJanuary2016GlossaryoftermsGeneral Reporting Protocol Version 21 (pp181)httpbitly2rpZAXn
2 EPACenterforCorporateClimateLeadershipJanuary2016GreenhouseGasInventoryGuidanceDirectEmissionsfromMobileCombustionSourceshttpbitly2JZ4lip
3 TheClimateRegistryJanuary2016Chapter13DirectEmissionsfromMobileCombustionGeneral Reporting Protocol Version 21httpbitly2rpZAXn
4 WorldResourcesInstitute2015SettingOperationalBoundariesThe GHG Protocol Corporate Accounting and Reporting Standard(pp25)httpbitly2yhHn0z
yy WorldyResourcesyInstituteyGHGyProtocolyToolyforyMobileyCombustionyVersiony26yhttpbitly2qSGWuV
yy EPAyCenteryforyCorporateyClimateyLeadershipyGreenhouseyGasyInventoryyGuidanceyDirectyEmissionsyfromyMobileyCombustionySourcesyhttpbitly2JZ4lip
yy WRIyGHGyEmissionyFactorsyCompilationyAyspreadsheetyofyemissionyfactorsyusedyinytheyGHGyProtocolyCalculatorsyhttpsbitly2NFLq0M
yy EPAyandyUSyDepartmentyofyEnergyyOfficialyUSygovernmentysourceyforyfuelyeconomyyinformationyhttpswwwfueleconomygovfegfindacarshtml
yy EPAyCenteryforyCorporateyClimateyLeadershipyChaptery6yUncertaintyyAssessmentyGreenhouseyGasyInventoryyGuidanceyDirectyEmissionsyfromyMobileyCombustionySourcesyhttpbitly2JZ4lip
yy EnvironmentalyDefenseyFundyClimateyCorpsyHandbook Chaptery15yEnergyyConsumptionyofycompanyyvehiclesyhttpbitly2MTc9GB
24
copy 20
19 Innovation C
enter for US D
airy All rights reserved G
HG
Inven
tory
Gu
idan
ce
GHG Inventory Guidance
Scope 2 Emissions from Purchased Energy This section presents methods used to calculate Scope 2 GHG emissions which are indirect emissions from the generation of purchased energy These are considered an indirect emissions source because they are a consequence of activities of the reporting organization but occur at sources owned and controlled by an outside entity (ie an electricity utility)
Chapter at a Glance
Identify Sources
Collect Activity Data
Quantify Emissions
Ensure Quality Control
Supporting Resources
In addition to the GHG Protocol this chapter draws on guidance from the following resources
y EPA Center for Corporate Climate Leadership Indirect Emissions from Purchased Electricity1
y The GHG Protocol Scope 2 Guidance An amendment to the GHG Protocol Corporate Standard2
y The Climate Registry General Reporting Protocol Chapter 5 Page 343
Defining Scope 2 Emissions
The GHG Protocol Scope 2 Guidance Amendment to the Corporate Standard which went into effect in January 2015 provides updated requirements and best practices for Scope 2 emissions accounting The updates were made to reflect changes in electricity markets and the growing choices companies have regarding the type of electricity purchased The most significant Scope 2 accounting change introduced is that companies are to account for and report Market-Based and Location-Based Scope 2 emissions Previously the protocol only required the Location-Based method
Market-Based Emissions
The Market-Based method reflects the GHG emissions associated with the specific choices a consumer (a dairy processor) makes regarding its electricity supplier or product as conveyed through contractual agreements between the processor and the provider The emission factors are supplier-specific emission factors or the emissions profiles associated with renewable energy credits (RECs) and power purchase agreements (PPAs)
Location-Based Emissions
The Location-Based method uses average emission factors for the electricity grids that are providing electricity to the facility4 That is the Location-Based approach considers average emissions intensities in the locations of electricity use while the Market-Based approach considers the emissions intensities of electricity products that the processor has specifically chosen
Calculating Scope 2 Emissions
When calculating Scope 2 emissions companies should do the following
y Companies should report both Market-Based and Location-Based Scope 2 emissions totals
y When a company enters into a supplier-specific contract (or other contract) in which a credible emission factor is unidentifiable the reporting company should simply use the grid-average emission factor as a proxy for that specific amount of contracted energy
y All instruments must meet certain quality criteria before they can be applied to the Market-Based emissions total These criteria are listed on page 60 of the GHG Protocolrsquos Scope 2 Guidance
A reporting company should select either the Location-Based approach or Market-Based approach when setting a Scope 2 target and tracking its performance
Since the predominant Scope 2 calculation method currently used across the dairy processing sector is the Location-Based method this document describes steps to calculate Location-Based emissions outlined in Figure 18 page 25
25
copy 20
19 Innovation C
enter for US D
airy All rights reserved G
HG
Inven
tory
Gu
idan
ce
GHG Inventory Guidance
Scope 2 Steps to Calculate Location-Based GuidelinesStep 1 Determine the amount of electricity purchased
bull The total electricity purchased and consumed during the reporting period in energy units MWh or kWh provide the most precise activity data For guidance on how to interpret utility bills see Chapter 7 of the EDF Climate Corps Handbook
Step 2 Select emission factors
bull Emission factors Companies that purchase electricity from the electric grid should use regional or sub-regional emission factors provided by the EPArsquos Emissions and Generation Resource Integrated Database eGRID Electricity is generated in varying ways across the US and eGRID emission factors help capture the GHG emissions associated with the forms of energy generation unique to the facilities region The EPArsquos eGRID sub-region map can be used to determine the appropriate sub-region for each facility
Step 3 Quantify emissions bull The EPA Simplified GHG Emissions Calculator which uses 2018 emission factors from eGRID Companies calculate emissions by inputting the amount of electricity purchased and selecting the eGRID sub- region in which the processing facility is located
(Figure 18) Steps to calculate Location-Based guidelines
Scope 2 Emissions from Purchased Energy
Works Cited
Additional Resources
1 EnvironmentalProtectionAgency2016IndirectEmissionsfromPurchasedElectricityGuidanceCenter for Corporate Climate Leadershiphttpbitly2HUTgCz
2 WorldResourcesInstitute2015GHGProtocolScope2GuidanceAn Amendment to The GHG Protocol Corporate Accounting and Reporting Standardhttpbitly2jzMLpZ
3 TheClimateRegistryGeneralReportingProtocolVersion212016Chapter5Emissions to Include in the Inventoryhttpsbitly2CFOB2d
4 TheGHGProtocolCorporateAccountingandReportingStandardWorldResourcesInstituteWorldBusinessCouncilforSustainableDevelopment2015httpbitly2yhHn0z
yy EDFyClimateyCorpsyHandbookyChaptery7 Benchmarkingyenergyyusageyandyinterpretingyutilityybills
yy EDFyClimateyCorpsyHandbookyChaptery16 Demandyresponseyandysmartygrid
GHG Inventory Guidance
Measurement and Estimation Uncertainty of GHG EmissionsGHG emissions uncertainty is dependent upon the quality of data collected and methods used to calculate emissions Several types of uncertainties associated with GHG inventories range from natural
variations such as human error to statistical uncertainty related to the indirect measurement of emissions (eg activity data and an emission factor) A well-designed IMP that follows the quality and documentation guidelines outlined in each section of this document can help reduce uncertainty
Chapter at a Glance
Emissions Uncertainty
Calculating Uncertainty
26
copy 20
19 Innovation C
enter for US D
airy All rights reserved G
HG
Inven
tory
Gu
idan
ce
Guidance on Uncertainty Assessment
The GHG Protocol Guidance on Uncertainty Assessment in GHG Inventories and Calculating Statistical Parameter Uncertainty describes the functionality of the tool and provides users with information on how to prepare interpret and utilize inventory uncertainty assessments The guidance is based on the IPCC Guidelines for National GHG Inventories
Uncertainty Assessment Calculator
The GHG Protocol Cross Sector Calculation Tool Measurement and Estimation Uncertainty of GHG Emissions is applicable to many industries and businesses regardless of sector The calculation tool aggregates parameter uncertainties across source categories and the entire inventory
Works Cited
Additional Resources
1 WorldResourcesInstitute2003GHGProtocolguidanceonuncertaintyassessmentinGHGinventoriesandcalculatingstatisticalparameteruncertaintyhttpbitly2KFbCVO
yy TheyGHGyProtocolyCrossySectoryCalculationyToolyMeasurementyandyEstimationyUncertaintyyofyGHGyEmissionsyhttpbitly2Pp8oKU
yy TheyGHGyProtocolyGuidanceyonyUncertaintyyAssessmentyinyGHGyInventoriesyandyCalculatingyStatisticalyParameteryUncertaintyyGuidanceyonyhowytoyuseytheyMeasurementyandyEstimationyUncertaintyyofyGHGyEmissionsycalculationytoolyhttpbitly2KFbCVO
yy TheyGHGyProtocolyCorporateyAccountingyandyReportingyStandardyChaptery7yManagingyInventoryyQualityyhttpbitly2yhHn0z
27
copy 20
19 Innovation C
enter for US D
airy All rights reserved G
HG
Inven
tory
Gu
idan
ce
GHG Inventory Guidance
Target SettingGHG emissions reduction target setting and mitigation strategies have become a priority issue across company supply chains The increasing number of public GHG emission reduction commitments are strategic decisions grounded in opportunities to capture business value and reduce company risk
Chapter at a Glance
Target Setting
Science-Based Targets
Target Setting Resources
Companies can set two broad types of GHG reduction target metrics mdash an absolute emissions target or an intensity emissions target Intensity targets specify emissions reductions relative to productivity or economic output such as tons of CO
2elbs of product
produced Both intensity and absolute targets specify a reduction in emissions relative to a historical baseline year They ensure that emissions reductions are maintained with company growth Companies should carefully evaluate both types before choosing a target metric and consider seeking outside support to determine the target type and actual target Several organizations can assist in establishing targets
y WWF Climate Savers
y Climate Registry
y Pew Business Environmental Leadership Council
y Carbon Trust
Once an emissions target is defined it is crucial to consistently track performance over time Specifically a company may be required to recalculate its baseline year inventory whenever the following happens
y Significant changes in the structure of the reporting company
y Significant changes in the calculation methodology
ordm Improved emission factors
ordm Improved activity data
y Discovery of significant errors or smaller errors that are collectively significant
The GHG Protocol Corporate Standard does not have a set definition for ldquosignificantrdquo however a company should determine its own significance threshold (ie 2 percent) to define when changes in aggregate should trigger recalculation of the baseline year inventory
Structural changes are defined as the transfer of ownership or control of emitting activities from one company to another
They can occur via
y Mergers acquisitions and divestments
y Outsourcing or in-sourcing of emitting activities
For more information on emissions tracking over time companies may reference the GHG Protocol Corporate Standard
Science-Based Targets
The Science-Based Target Initiative is a collaboration between the Carbon Disclosure Project (CDP) UN Global Compact World Resources Institute and World Wildlife Fund to assist corporations in establishing GHG targets that are in line with climate science The initiative defines Science-Based Targets as ldquoTargets in line with the level of decarbonization required to keep global temperature increase below 2deg C compared to pre-industrial temperatures as described in the Assessment Report of the Intergovernmental Panel on Climate Change (IPCC)rdquo As of October 2019 the Science-Based Targets Initiative requires Scope 1 and 2 targets to be more ambitious and in line with ldquowell below 2deg Crdquo pathways
Aligning targets with climate science is becoming the business norm It is widely accepted that global action must be taken to avoid some of the most disastrous and irreversible impacts of climate change The following resources provide the causes and predicted impacts of climate change
y NASA Global Climate Change2
y NOAA National Centers for Environmental Information3
y The Global Carbon Project4
y The visualization of temperature change from 1880 to 2016 as analyzed by NASArsquos Goddard Institute for Space Studies
NOTE Recalculation is not needed if out- or in-sourced activities were previously included in a different scope
28
copy 20
19 Innovation C
enter for US D
airy All rights reserved G
HG
Inven
tory
Gu
idan
ce
By adopting Science-Based Targets dairy processing companies take a leadership role in addressing climate change by connecting corporate sustainability goals to scientifically established thresholds Case studies featuring companies with Science-Based Targets demonstrate the benefits and reasons for setting reduction goals that are in line with climate science
Examples of benefits derived from Science-Based Targets are
y Cut costs and reduce risk Companies with ambitious targets can ensure durability and efficiency in a future where fossil fuels are increasingly more expensive
y Build credibility and reputation Sustainability has become a lens through which a company is evaluated Taking leadership action on climate change can build a companyrsquos reputation among key stakeholders
y Drive innovation Adopting Science-Based Targets can drive company and industry-wide innovation and help to turn climate risk into a business opportunity
GHG Inventory Guidance
Works Cited
Additional Resources
1 CitationWorldEconomicForumTheGlobalRisksReport2017httpbitly2roi5LW
2 NASAGlobalClimateChangehttpsclimatenasagov
3 NOAANationalCentersforEnvironmentalInformationhttpswwwngdcnoaagov
4 TheGlobalCarbonProjecthttpwwwglobalcarbonprojectorg
yy WWFyClimateySavers httpclimatesaversorg
yy ClimateyRegistry httpswwwtheclimateregistryorg
yy PewyBusinessyEnvironmentalyLeadershipyCouncilyhttpswwwc2esorgour-workbelc
yy CarbonyTrust httpswwwcarbontrustcomhome
yy NASArsquosyGoddardyInstituteyforySpaceyStudies httpssvsgsfcnasagov4546
yy CarbonyBudgetyhttpbitly2WifVwi
yy 2016yCarbonyBudgetyReportyhttpglobalcarbonbudget2016org
yy TheyUSyDepartmentyofyEnergyyMapyhttpbitly2rpEt8p
yy ClimateyChangeyandyResourceyScarcity httpspwcto2wiXKx7
yy TheyImpactyofyCorporateySustainabilityyonyOrganizationalyProcessyandyPerformance TheyHarvardyBusinessyJournalyRobertyGyEcclesyIoannisyIoannouyampyGeorgeySerafeim httpshbsme2FP1eqW
Resources for Setting Science-Based Targets
yy IntroductionytoyScience-BasedyTargetsyhttpbitly2rpLt4m
yy CallytoyAction DetailedyGuidelinesyforySettingyScience-BasedyTargetsyhttpsbitly33Okx0o
yy Science-BasedyTargetsyandyCDPyScoringyhttpbitly2KFhnmg
yy BestyPracticesyforySettingyandyAchievingyScience-BasedyTargets PresentationyatytheyClimateyLeadersyConferenceyMarchy2017yhttpbitly2jBMuTF
yy MindytheyScienceyhttpbitly2IfBqJE
yy Science-BasedyTargets Targetysettingypitfallsyandylessonsylearnedy(pdf)yhttpbitly2FPus8Q
yy Science-BasedyTargets Targetysettingypitfallsyandylessonsylearnedy(webinar)yhttpsvimeocom233570395
GHG Inventory Guidance
29
copy 20
19 Innovation C
enter for US D
airy All rights reserved G
HG
Inven
tory
Gu
idan
ce
Resources for Reducing GHG EmissionsOnce a GHG emissions inventory has been developed and a reduction target has been adopted a company should identify the main sources of GHGs and evaluate the cost-effectiveness of emission reduction measures Below are resources tools and webinars to assist companies in reducing GHG emissions
Energy Efficiency
yy EPAyEnergyyStary2011yEnergyyEfficiencyyImprovementyandyCostySavingyOpportunitiesyforytheyDairyyProcessingyIndustryyAymanualycreatedybyyEnergyyStarytoyassistydairyyprocessorsyinyidentifyingyenergyyefficiencyyimprovementsyasyanyimportantywayytoyreduceycostsyandytoyincreaseypredictableyearningsyhttpbitly345L8Wi
yy EPAyEnergyyStaryPortfolioyManageryAnyonlineytoolythatycanybeyusedytoymeasureyandytrackyenergyyandywateryconsumptionyasywellyasygreenhouseygasyemissionsyassociatedywithycommercialybuildingsyyhttpbitly2FP3Epu
yy HVACy(heatingyventilationyandyairyconditioning)yClimateyCorpsyHandbookyChaptery9yOverviewyofyhowytoysurveyycurrentyHVACysystemyanalyzeyresultsyofyanyenergyyaudityforyHVACysystemyandyperformyayfinancialyanalysesyonyrecommendationsyofyenergyyauditorsyhttpbitly2rod1qI
yy CarbonyTrustyHeatingyventilationyandyairyconditioningy(HVAC)yenergyyefficiencyyguideyAyguideytoyimproveyenergyyefficiencyyofyheatingyventilationyandyairyconditioningyhotywateryandyboilers httpbitly2jAHmiE
yy LightingyinycommercialybuildingsyClimateyCorpsyHandbookyChaptery10yDescribesyhowytoyidentifyylightingyopportunitiesyforyenergyysavingsyinycommercialybuildingsyandyhowytoydevelopyestimatesyofyenergyyusageyandycalculateytheyestimatedysavingsypotentialyhttpbitly2rod1qI
yy DemandyResponseyandySmartyGridyClimateyCorpsyHandbookyChaptery16yOverviewyofydemandyresponsey(DR)yandypossibleyenergyysavingsyandyrevenueyopportunitiesyhttpbitly2rod1qI
yy DemandyandyResponseyResearchyCenteryPublicationsyandyinformationyonydemandyresponseyandysmartygridyinfrastructureytoybestyinformyendyusersyhowytoytemporarilyyreduceyenergyyusageyinyresponseytoyeitherypriceyorysystemyreliabilityytriggersyhttpsdrrclblgov
yy CarbonyTrustyEnergyyManagementySelf-AssessmentyToolyAnyExcelyworkbookyandyguidanceydocumentythatyassessyayorganizationrsquosyenergyymanagementyhttpbitly2whnWrY
yy CarbonyValueyAnalysisyToolyTheyCarbonyValueyAnalysisyTooly(CVAT)ywasycreatedybyytheyWorldyResourcesyInstituteytoyassistyprojectymanagersywithyfactoringytheypriceyofycarbonywhenyevaluatingyreductionyprojectsyhttpbitly2jB0pt6
yy CarbonyTrustyBuildingyEnergyyEfficiencyyGuideytoyimprovingybuildingyfabricyandyinsulationyandyinstallingyappropriateycontrolsytoysaveymoneyyandycutycarbonyemissionsyhttpbitly2rmNI9C
yy CarbonyTrustyRefrigerationyImproveyenergyyefficiencyyofyyourychillersyandyrefrigerationysystemsywithyouryenergy-savingyguidanceyhttpbitly2JUV62Q
yy EPAyCenteryforyCorporateyClimateyLeadershipyAylistyofyfreeyGHGyinventoryyrelatedywebinarsyandyeventsyhttpbitly2FOcALR
Renewable Energy
yy TheyDepartmentyofyEnergyrsquosyOfficeyofyEnergyyEfficiencyyandyRenewableyEnergyy(EERE)yProvidesyinformationyonyindustrialyenergy-consumingysystemsyboileryandysteamysystemycompressedyairymotorsyfansypumpsyandyprocessyheatingyhttpbitly2K0x0nb
yy PropertyyAssessedyCleanyEnergyy(PACE)yEnergyyefficiencyyfinancingyopportunitiesyhttpbitly2FPWGjX
yy DatabaseyofyStateyIncentivesyforyRenewablesyandyEfficiencyyOverviewyofystateyandyfederalyincentivesyandypoliciesydesignedytoyhelpycompaniesyadoptyrenewableyenergyyprogramsyhttpwwwdsireusaorg
continued on next page
GHG Inventory Guidance
30
copy 20
19 Innovation C
enter for US D
airy All rights reserved G
HG
Inven
tory
Gu
idan
ce
Additional Resources
yy GuideytoyPurchasingyGreenyPoweryAycooperativeyeffortybetweenytheyEPAytheyUSyDepartmentyofyEnergyytheyWorldyResourcesyInstituteyandytheyCenteryforyResourceySolutionsythatyprovidesycurrentyandypotentialybuyersyofygreenypowerywithyinformationyaboutygreenypowerypurchasingyhttpbitly2JU8WlK
yy InnovationsyinyVoluntaryyRenewableyEnergyyProcurementyAyguideyfromyNationalyRenewableyEnergyyLaboratoryrsquosy(NREL)ythatyoutlinesymethodsyforyexpandingyaccessyandyloweringycostyforycommunitiesygovernmentsyandybusinessesyhttpswwwnrelgovdocsfy12osti54991pdf
Mobile Emissions
yy ReduceyMobileyEmissionsyVehicleyselectionyACEEEyGreeneryCarsyIdentifyyvehiclesythatyareymostyfuelyefficientyandylearnyaboutymarketytrendsyinyautomotiveytechnologyyhttpsgreenercarsorg
yy EPAyGreenyVehicleyGuideyOverviewyofyvehiclesyfuelyuseyandytheyimpactyonybothytheyenvironmentyandybottomylineyhttpswwwepagovgreenvehicles
yy FuelyEconomyyGuideyTheyUSyEnvironmentalyProtectionyAgencyy(EPA)yandyUSyDepartmentyofyEnergyy(DOE)yAyguideytoyhelpybuyersyidentifyytheymostyfuel-efficientyvehiclesyhttpbitly2FPkVP6
copy2019 Innovation Center for US Dairy All rights reserved
About the Innovation Center for US Dairyreg
The Innovation Center for US Dairyreg is a forum that
brings together the dairy community to address the
changing needs and expectations of consumers through
a framework of shared best practices and accountability
Initiated in 2008 by dairy farmers through the dairy
checkoff we collaborate on efforts that are important
both to us and our valued customers ndash priorities like
animal care environmental stewardship food safety and
traceability and community contributions The Innovation
Center is committed to continuous improvement from
farm to table striving to ensure a socially responsible
and economically viable dairy community
Visit USDairycom for more information about the
Innovation Center for US Dairy
wwwUSDairycom bull InnovationCenterUSDairycom
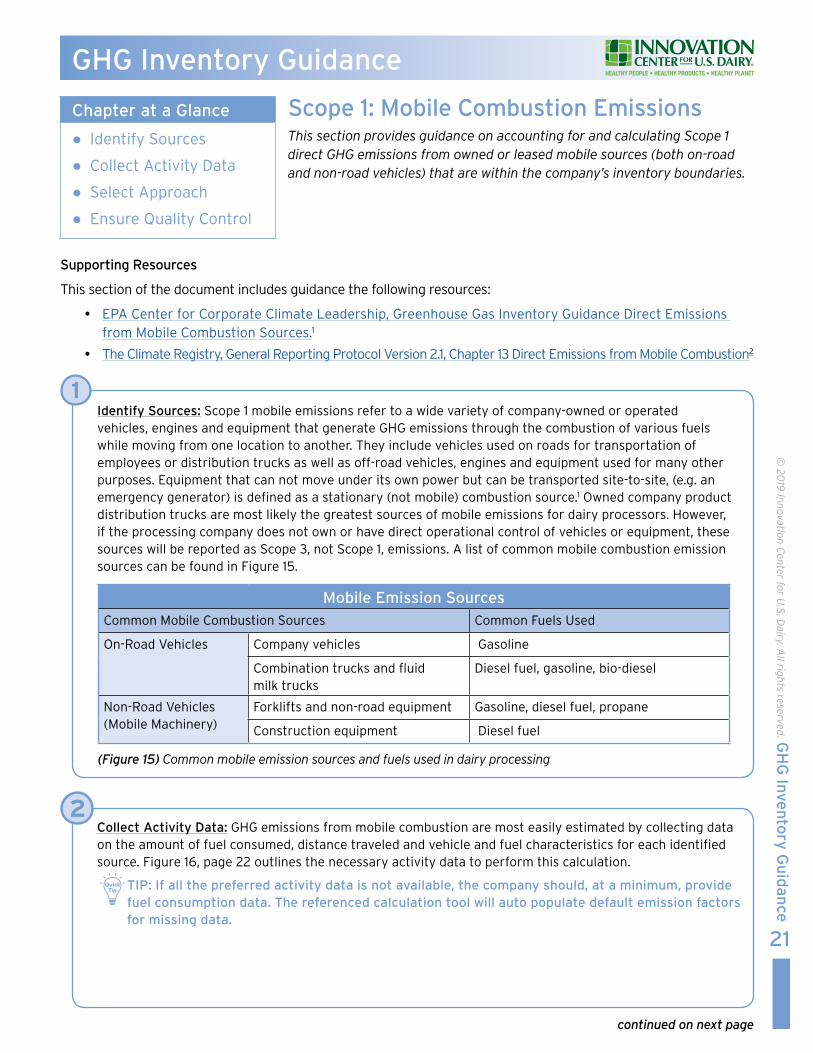
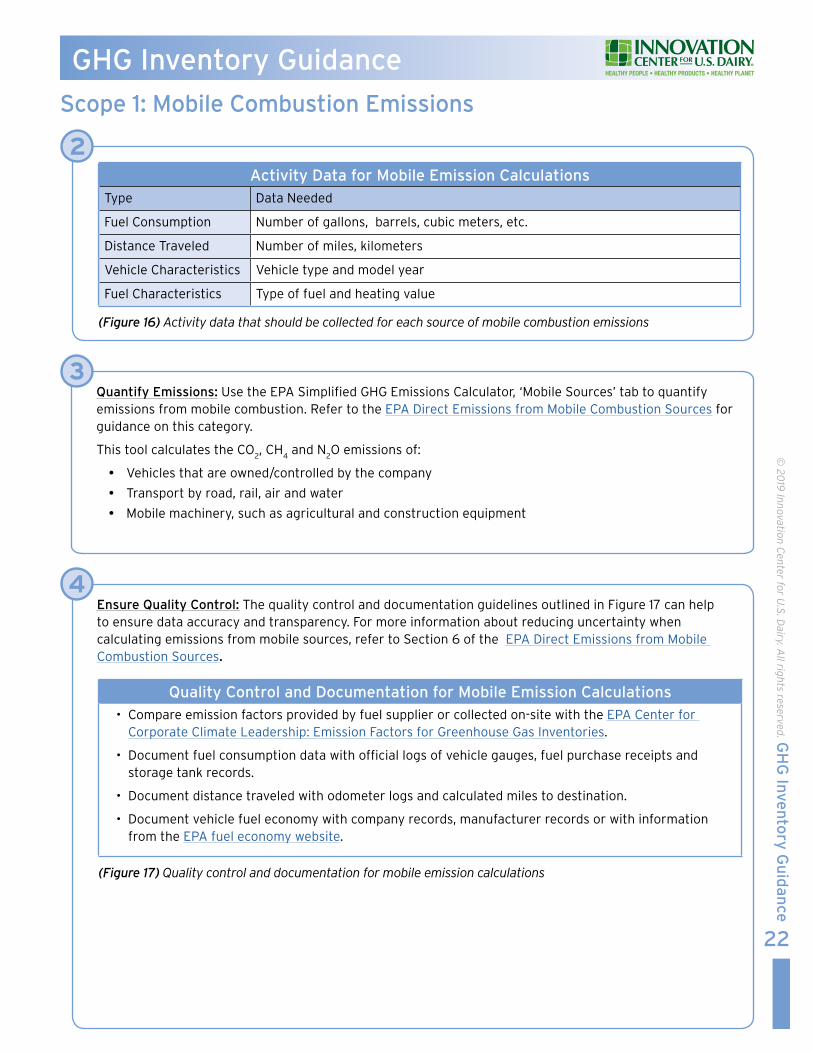
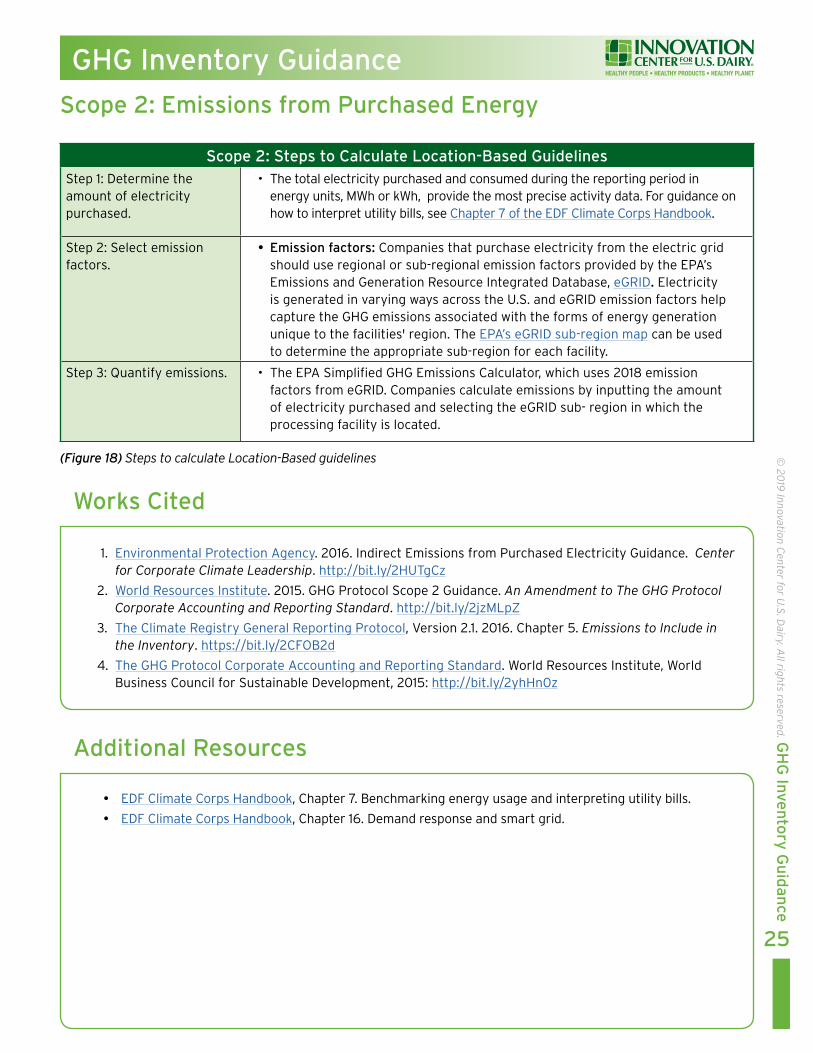
GHG Inventory Guidance
Measurement and Estimation Uncertainty of GHG EmissionsGHG emissions uncertainty is dependent upon the quality of data collected and methods used to calculate emissions Several types of uncertainties associated with GHG inventories range from natural
variations such as human error to statistical uncertainty related to the indirect measurement of emissions (eg activity data and an emission factor) A well-designed IMP that follows the quality and documentation guidelines outlined in each section of this document can help reduce uncertainty
Chapter at a Glance
Emissions Uncertainty
Calculating Uncertainty
26
copy 20
19 Innovation C
enter for US D
airy All rights reserved G
HG
Inven
tory
Gu
idan
ce
Guidance on Uncertainty Assessment
The GHG Protocol Guidance on Uncertainty Assessment in GHG Inventories and Calculating Statistical Parameter Uncertainty describes the functionality of the tool and provides users with information on how to prepare interpret and utilize inventory uncertainty assessments The guidance is based on the IPCC Guidelines for National GHG Inventories
Uncertainty Assessment Calculator
The GHG Protocol Cross Sector Calculation Tool Measurement and Estimation Uncertainty of GHG Emissions is applicable to many industries and businesses regardless of sector The calculation tool aggregates parameter uncertainties across source categories and the entire inventory
Works Cited
Additional Resources
1 WorldResourcesInstitute2003GHGProtocolguidanceonuncertaintyassessmentinGHGinventoriesandcalculatingstatisticalparameteruncertaintyhttpbitly2KFbCVO
yy TheyGHGyProtocolyCrossySectoryCalculationyToolyMeasurementyandyEstimationyUncertaintyyofyGHGyEmissionsyhttpbitly2Pp8oKU
yy TheyGHGyProtocolyGuidanceyonyUncertaintyyAssessmentyinyGHGyInventoriesyandyCalculatingyStatisticalyParameteryUncertaintyyGuidanceyonyhowytoyuseytheyMeasurementyandyEstimationyUncertaintyyofyGHGyEmissionsycalculationytoolyhttpbitly2KFbCVO
yy TheyGHGyProtocolyCorporateyAccountingyandyReportingyStandardyChaptery7yManagingyInventoryyQualityyhttpbitly2yhHn0z
27
copy 20
19 Innovation C
enter for US D
airy All rights reserved G
HG
Inven
tory
Gu
idan
ce
GHG Inventory Guidance
Target SettingGHG emissions reduction target setting and mitigation strategies have become a priority issue across company supply chains The increasing number of public GHG emission reduction commitments are strategic decisions grounded in opportunities to capture business value and reduce company risk
Chapter at a Glance
Target Setting
Science-Based Targets
Target Setting Resources
Companies can set two broad types of GHG reduction target metrics mdash an absolute emissions target or an intensity emissions target Intensity targets specify emissions reductions relative to productivity or economic output such as tons of CO
2elbs of product
produced Both intensity and absolute targets specify a reduction in emissions relative to a historical baseline year They ensure that emissions reductions are maintained with company growth Companies should carefully evaluate both types before choosing a target metric and consider seeking outside support to determine the target type and actual target Several organizations can assist in establishing targets
y WWF Climate Savers
y Climate Registry
y Pew Business Environmental Leadership Council
y Carbon Trust
Once an emissions target is defined it is crucial to consistently track performance over time Specifically a company may be required to recalculate its baseline year inventory whenever the following happens
y Significant changes in the structure of the reporting company
y Significant changes in the calculation methodology
ordm Improved emission factors
ordm Improved activity data
y Discovery of significant errors or smaller errors that are collectively significant
The GHG Protocol Corporate Standard does not have a set definition for ldquosignificantrdquo however a company should determine its own significance threshold (ie 2 percent) to define when changes in aggregate should trigger recalculation of the baseline year inventory
Structural changes are defined as the transfer of ownership or control of emitting activities from one company to another
They can occur via
y Mergers acquisitions and divestments
y Outsourcing or in-sourcing of emitting activities
For more information on emissions tracking over time companies may reference the GHG Protocol Corporate Standard
Science-Based Targets
The Science-Based Target Initiative is a collaboration between the Carbon Disclosure Project (CDP) UN Global Compact World Resources Institute and World Wildlife Fund to assist corporations in establishing GHG targets that are in line with climate science The initiative defines Science-Based Targets as ldquoTargets in line with the level of decarbonization required to keep global temperature increase below 2deg C compared to pre-industrial temperatures as described in the Assessment Report of the Intergovernmental Panel on Climate Change (IPCC)rdquo As of October 2019 the Science-Based Targets Initiative requires Scope 1 and 2 targets to be more ambitious and in line with ldquowell below 2deg Crdquo pathways
Aligning targets with climate science is becoming the business norm It is widely accepted that global action must be taken to avoid some of the most disastrous and irreversible impacts of climate change The following resources provide the causes and predicted impacts of climate change
y NASA Global Climate Change2
y NOAA National Centers for Environmental Information3
y The Global Carbon Project4
y The visualization of temperature change from 1880 to 2016 as analyzed by NASArsquos Goddard Institute for Space Studies
NOTE Recalculation is not needed if out- or in-sourced activities were previously included in a different scope
28
copy 20
19 Innovation C
enter for US D
airy All rights reserved G
HG
Inven
tory
Gu
idan
ce
By adopting Science-Based Targets dairy processing companies take a leadership role in addressing climate change by connecting corporate sustainability goals to scientifically established thresholds Case studies featuring companies with Science-Based Targets demonstrate the benefits and reasons for setting reduction goals that are in line with climate science
Examples of benefits derived from Science-Based Targets are
y Cut costs and reduce risk Companies with ambitious targets can ensure durability and efficiency in a future where fossil fuels are increasingly more expensive
y Build credibility and reputation Sustainability has become a lens through which a company is evaluated Taking leadership action on climate change can build a companyrsquos reputation among key stakeholders
y Drive innovation Adopting Science-Based Targets can drive company and industry-wide innovation and help to turn climate risk into a business opportunity
GHG Inventory Guidance
Works Cited
Additional Resources
1 CitationWorldEconomicForumTheGlobalRisksReport2017httpbitly2roi5LW
2 NASAGlobalClimateChangehttpsclimatenasagov
3 NOAANationalCentersforEnvironmentalInformationhttpswwwngdcnoaagov
4 TheGlobalCarbonProjecthttpwwwglobalcarbonprojectorg
yy WWFyClimateySavers httpclimatesaversorg
yy ClimateyRegistry httpswwwtheclimateregistryorg
yy PewyBusinessyEnvironmentalyLeadershipyCouncilyhttpswwwc2esorgour-workbelc
yy CarbonyTrust httpswwwcarbontrustcomhome
yy NASArsquosyGoddardyInstituteyforySpaceyStudies httpssvsgsfcnasagov4546
yy CarbonyBudgetyhttpbitly2WifVwi
yy 2016yCarbonyBudgetyReportyhttpglobalcarbonbudget2016org
yy TheyUSyDepartmentyofyEnergyyMapyhttpbitly2rpEt8p
yy ClimateyChangeyandyResourceyScarcity httpspwcto2wiXKx7
yy TheyImpactyofyCorporateySustainabilityyonyOrganizationalyProcessyandyPerformance TheyHarvardyBusinessyJournalyRobertyGyEcclesyIoannisyIoannouyampyGeorgeySerafeim httpshbsme2FP1eqW
Resources for Setting Science-Based Targets
yy IntroductionytoyScience-BasedyTargetsyhttpbitly2rpLt4m
yy CallytoyAction DetailedyGuidelinesyforySettingyScience-BasedyTargetsyhttpsbitly33Okx0o
yy Science-BasedyTargetsyandyCDPyScoringyhttpbitly2KFhnmg
yy BestyPracticesyforySettingyandyAchievingyScience-BasedyTargets PresentationyatytheyClimateyLeadersyConferenceyMarchy2017yhttpbitly2jBMuTF
yy MindytheyScienceyhttpbitly2IfBqJE
yy Science-BasedyTargets Targetysettingypitfallsyandylessonsylearnedy(pdf)yhttpbitly2FPus8Q
yy Science-BasedyTargets Targetysettingypitfallsyandylessonsylearnedy(webinar)yhttpsvimeocom233570395
GHG Inventory Guidance
29
copy 20
19 Innovation C
enter for US D
airy All rights reserved G
HG
Inven
tory
Gu
idan
ce
Resources for Reducing GHG EmissionsOnce a GHG emissions inventory has been developed and a reduction target has been adopted a company should identify the main sources of GHGs and evaluate the cost-effectiveness of emission reduction measures Below are resources tools and webinars to assist companies in reducing GHG emissions
Energy Efficiency
yy EPAyEnergyyStary2011yEnergyyEfficiencyyImprovementyandyCostySavingyOpportunitiesyforytheyDairyyProcessingyIndustryyAymanualycreatedybyyEnergyyStarytoyassistydairyyprocessorsyinyidentifyingyenergyyefficiencyyimprovementsyasyanyimportantywayytoyreduceycostsyandytoyincreaseypredictableyearningsyhttpbitly345L8Wi
yy EPAyEnergyyStaryPortfolioyManageryAnyonlineytoolythatycanybeyusedytoymeasureyandytrackyenergyyandywateryconsumptionyasywellyasygreenhouseygasyemissionsyassociatedywithycommercialybuildingsyyhttpbitly2FP3Epu
yy HVACy(heatingyventilationyandyairyconditioning)yClimateyCorpsyHandbookyChaptery9yOverviewyofyhowytoysurveyycurrentyHVACysystemyanalyzeyresultsyofyanyenergyyaudityforyHVACysystemyandyperformyayfinancialyanalysesyonyrecommendationsyofyenergyyauditorsyhttpbitly2rod1qI
yy CarbonyTrustyHeatingyventilationyandyairyconditioningy(HVAC)yenergyyefficiencyyguideyAyguideytoyimproveyenergyyefficiencyyofyheatingyventilationyandyairyconditioningyhotywateryandyboilers httpbitly2jAHmiE
yy LightingyinycommercialybuildingsyClimateyCorpsyHandbookyChaptery10yDescribesyhowytoyidentifyylightingyopportunitiesyforyenergyysavingsyinycommercialybuildingsyandyhowytoydevelopyestimatesyofyenergyyusageyandycalculateytheyestimatedysavingsypotentialyhttpbitly2rod1qI
yy DemandyResponseyandySmartyGridyClimateyCorpsyHandbookyChaptery16yOverviewyofydemandyresponsey(DR)yandypossibleyenergyysavingsyandyrevenueyopportunitiesyhttpbitly2rod1qI
yy DemandyandyResponseyResearchyCenteryPublicationsyandyinformationyonydemandyresponseyandysmartygridyinfrastructureytoybestyinformyendyusersyhowytoytemporarilyyreduceyenergyyusageyinyresponseytoyeitherypriceyorysystemyreliabilityytriggersyhttpsdrrclblgov
yy CarbonyTrustyEnergyyManagementySelf-AssessmentyToolyAnyExcelyworkbookyandyguidanceydocumentythatyassessyayorganizationrsquosyenergyymanagementyhttpbitly2whnWrY
yy CarbonyValueyAnalysisyToolyTheyCarbonyValueyAnalysisyTooly(CVAT)ywasycreatedybyytheyWorldyResourcesyInstituteytoyassistyprojectymanagersywithyfactoringytheypriceyofycarbonywhenyevaluatingyreductionyprojectsyhttpbitly2jB0pt6
yy CarbonyTrustyBuildingyEnergyyEfficiencyyGuideytoyimprovingybuildingyfabricyandyinsulationyandyinstallingyappropriateycontrolsytoysaveymoneyyandycutycarbonyemissionsyhttpbitly2rmNI9C
yy CarbonyTrustyRefrigerationyImproveyenergyyefficiencyyofyyourychillersyandyrefrigerationysystemsywithyouryenergy-savingyguidanceyhttpbitly2JUV62Q
yy EPAyCenteryforyCorporateyClimateyLeadershipyAylistyofyfreeyGHGyinventoryyrelatedywebinarsyandyeventsyhttpbitly2FOcALR
Renewable Energy
yy TheyDepartmentyofyEnergyrsquosyOfficeyofyEnergyyEfficiencyyandyRenewableyEnergyy(EERE)yProvidesyinformationyonyindustrialyenergy-consumingysystemsyboileryandysteamysystemycompressedyairymotorsyfansypumpsyandyprocessyheatingyhttpbitly2K0x0nb
yy PropertyyAssessedyCleanyEnergyy(PACE)yEnergyyefficiencyyfinancingyopportunitiesyhttpbitly2FPWGjX
yy DatabaseyofyStateyIncentivesyforyRenewablesyandyEfficiencyyOverviewyofystateyandyfederalyincentivesyandypoliciesydesignedytoyhelpycompaniesyadoptyrenewableyenergyyprogramsyhttpwwwdsireusaorg
continued on next page
GHG Inventory Guidance
30
copy 20
19 Innovation C
enter for US D
airy All rights reserved G
HG
Inven
tory
Gu
idan
ce
Additional Resources
yy GuideytoyPurchasingyGreenyPoweryAycooperativeyeffortybetweenytheyEPAytheyUSyDepartmentyofyEnergyytheyWorldyResourcesyInstituteyandytheyCenteryforyResourceySolutionsythatyprovidesycurrentyandypotentialybuyersyofygreenypowerywithyinformationyaboutygreenypowerypurchasingyhttpbitly2JU8WlK
yy InnovationsyinyVoluntaryyRenewableyEnergyyProcurementyAyguideyfromyNationalyRenewableyEnergyyLaboratoryrsquosy(NREL)ythatyoutlinesymethodsyforyexpandingyaccessyandyloweringycostyforycommunitiesygovernmentsyandybusinessesyhttpswwwnrelgovdocsfy12osti54991pdf
Mobile Emissions
yy ReduceyMobileyEmissionsyVehicleyselectionyACEEEyGreeneryCarsyIdentifyyvehiclesythatyareymostyfuelyefficientyandylearnyaboutymarketytrendsyinyautomotiveytechnologyyhttpsgreenercarsorg
yy EPAyGreenyVehicleyGuideyOverviewyofyvehiclesyfuelyuseyandytheyimpactyonybothytheyenvironmentyandybottomylineyhttpswwwepagovgreenvehicles
yy FuelyEconomyyGuideyTheyUSyEnvironmentalyProtectionyAgencyy(EPA)yandyUSyDepartmentyofyEnergyy(DOE)yAyguideytoyhelpybuyersyidentifyytheymostyfuel-efficientyvehiclesyhttpbitly2FPkVP6
copy2019 Innovation Center for US Dairy All rights reserved
About the Innovation Center for US Dairyreg
The Innovation Center for US Dairyreg is a forum that
brings together the dairy community to address the
changing needs and expectations of consumers through
a framework of shared best practices and accountability
Initiated in 2008 by dairy farmers through the dairy
checkoff we collaborate on efforts that are important
both to us and our valued customers ndash priorities like
animal care environmental stewardship food safety and
traceability and community contributions The Innovation
Center is committed to continuous improvement from
farm to table striving to ensure a socially responsible
and economically viable dairy community
Visit USDairycom for more information about the
Innovation Center for US Dairy
wwwUSDairycom bull InnovationCenterUSDairycom
GHG Inventory Guidance
29
copy 20
19 Innovation C
enter for US D
airy All rights reserved G
HG
Inven
tory
Gu
idan
ce
Resources for Reducing GHG EmissionsOnce a GHG emissions inventory has been developed and a reduction target has been adopted a company should identify the main sources of GHGs and evaluate the cost-effectiveness of emission reduction measures Below are resources tools and webinars to assist companies in reducing GHG emissions
Energy Efficiency
yy EPAyEnergyyStary2011yEnergyyEfficiencyyImprovementyandyCostySavingyOpportunitiesyforytheyDairyyProcessingyIndustryyAymanualycreatedybyyEnergyyStarytoyassistydairyyprocessorsyinyidentifyingyenergyyefficiencyyimprovementsyasyanyimportantywayytoyreduceycostsyandytoyincreaseypredictableyearningsyhttpbitly345L8Wi
yy EPAyEnergyyStaryPortfolioyManageryAnyonlineytoolythatycanybeyusedytoymeasureyandytrackyenergyyandywateryconsumptionyasywellyasygreenhouseygasyemissionsyassociatedywithycommercialybuildingsyyhttpbitly2FP3Epu
yy HVACy(heatingyventilationyandyairyconditioning)yClimateyCorpsyHandbookyChaptery9yOverviewyofyhowytoysurveyycurrentyHVACysystemyanalyzeyresultsyofyanyenergyyaudityforyHVACysystemyandyperformyayfinancialyanalysesyonyrecommendationsyofyenergyyauditorsyhttpbitly2rod1qI
yy CarbonyTrustyHeatingyventilationyandyairyconditioningy(HVAC)yenergyyefficiencyyguideyAyguideytoyimproveyenergyyefficiencyyofyheatingyventilationyandyairyconditioningyhotywateryandyboilers httpbitly2jAHmiE
yy LightingyinycommercialybuildingsyClimateyCorpsyHandbookyChaptery10yDescribesyhowytoyidentifyylightingyopportunitiesyforyenergyysavingsyinycommercialybuildingsyandyhowytoydevelopyestimatesyofyenergyyusageyandycalculateytheyestimatedysavingsypotentialyhttpbitly2rod1qI
yy DemandyResponseyandySmartyGridyClimateyCorpsyHandbookyChaptery16yOverviewyofydemandyresponsey(DR)yandypossibleyenergyysavingsyandyrevenueyopportunitiesyhttpbitly2rod1qI
yy DemandyandyResponseyResearchyCenteryPublicationsyandyinformationyonydemandyresponseyandysmartygridyinfrastructureytoybestyinformyendyusersyhowytoytemporarilyyreduceyenergyyusageyinyresponseytoyeitherypriceyorysystemyreliabilityytriggersyhttpsdrrclblgov
yy CarbonyTrustyEnergyyManagementySelf-AssessmentyToolyAnyExcelyworkbookyandyguidanceydocumentythatyassessyayorganizationrsquosyenergyymanagementyhttpbitly2whnWrY
yy CarbonyValueyAnalysisyToolyTheyCarbonyValueyAnalysisyTooly(CVAT)ywasycreatedybyytheyWorldyResourcesyInstituteytoyassistyprojectymanagersywithyfactoringytheypriceyofycarbonywhenyevaluatingyreductionyprojectsyhttpbitly2jB0pt6
yy CarbonyTrustyBuildingyEnergyyEfficiencyyGuideytoyimprovingybuildingyfabricyandyinsulationyandyinstallingyappropriateycontrolsytoysaveymoneyyandycutycarbonyemissionsyhttpbitly2rmNI9C
yy CarbonyTrustyRefrigerationyImproveyenergyyefficiencyyofyyourychillersyandyrefrigerationysystemsywithyouryenergy-savingyguidanceyhttpbitly2JUV62Q
yy EPAyCenteryforyCorporateyClimateyLeadershipyAylistyofyfreeyGHGyinventoryyrelatedywebinarsyandyeventsyhttpbitly2FOcALR
Renewable Energy
yy TheyDepartmentyofyEnergyrsquosyOfficeyofyEnergyyEfficiencyyandyRenewableyEnergyy(EERE)yProvidesyinformationyonyindustrialyenergy-consumingysystemsyboileryandysteamysystemycompressedyairymotorsyfansypumpsyandyprocessyheatingyhttpbitly2K0x0nb
yy PropertyyAssessedyCleanyEnergyy(PACE)yEnergyyefficiencyyfinancingyopportunitiesyhttpbitly2FPWGjX
yy DatabaseyofyStateyIncentivesyforyRenewablesyandyEfficiencyyOverviewyofystateyandyfederalyincentivesyandypoliciesydesignedytoyhelpycompaniesyadoptyrenewableyenergyyprogramsyhttpwwwdsireusaorg
continued on next page
GHG Inventory Guidance
30
copy 20
19 Innovation C
enter for US D
airy All rights reserved G
HG
Inven
tory
Gu
idan
ce
Additional Resources
yy GuideytoyPurchasingyGreenyPoweryAycooperativeyeffortybetweenytheyEPAytheyUSyDepartmentyofyEnergyytheyWorldyResourcesyInstituteyandytheyCenteryforyResourceySolutionsythatyprovidesycurrentyandypotentialybuyersyofygreenypowerywithyinformationyaboutygreenypowerypurchasingyhttpbitly2JU8WlK
yy InnovationsyinyVoluntaryyRenewableyEnergyyProcurementyAyguideyfromyNationalyRenewableyEnergyyLaboratoryrsquosy(NREL)ythatyoutlinesymethodsyforyexpandingyaccessyandyloweringycostyforycommunitiesygovernmentsyandybusinessesyhttpswwwnrelgovdocsfy12osti54991pdf
Mobile Emissions
yy ReduceyMobileyEmissionsyVehicleyselectionyACEEEyGreeneryCarsyIdentifyyvehiclesythatyareymostyfuelyefficientyandylearnyaboutymarketytrendsyinyautomotiveytechnologyyhttpsgreenercarsorg
yy EPAyGreenyVehicleyGuideyOverviewyofyvehiclesyfuelyuseyandytheyimpactyonybothytheyenvironmentyandybottomylineyhttpswwwepagovgreenvehicles
yy FuelyEconomyyGuideyTheyUSyEnvironmentalyProtectionyAgencyy(EPA)yandyUSyDepartmentyofyEnergyy(DOE)yAyguideytoyhelpybuyersyidentifyytheymostyfuel-efficientyvehiclesyhttpbitly2FPkVP6
copy2019 Innovation Center for US Dairy All rights reserved
About the Innovation Center for US Dairyreg
The Innovation Center for US Dairyreg is a forum that
brings together the dairy community to address the
changing needs and expectations of consumers through
a framework of shared best practices and accountability
Initiated in 2008 by dairy farmers through the dairy
checkoff we collaborate on efforts that are important
both to us and our valued customers ndash priorities like
animal care environmental stewardship food safety and
traceability and community contributions The Innovation
Center is committed to continuous improvement from
farm to table striving to ensure a socially responsible
and economically viable dairy community
Visit USDairycom for more information about the
Innovation Center for US Dairy
wwwUSDairycom bull InnovationCenterUSDairycom