Embed Size (px)
Citation preview

3806 IEEE TRANSACTIONS ON NUCLEAR SCIENCE, VOL. 56, NO. 6, DECEMBER 2009
Scintillation Properties and Time-ResolvedSpectroscopy of a Novel Scintillator Material:
Ce��-Activated Li�Lu(PO�)� CrystalsDariusz Wisniewski and Lynn A. Boatner
Abstract—The scintillation properties and time-resolved spec-troscopy results for Li�Lu(PO�)�:Ce—a new Ce��-activatedcrystalline scintillator have been determined. This materialcontains stoichiometric amounts of Li, and can be synthesizedeither with the use of �Li-enriched or �Li-depleted isotopes, forachieving thermal neutron sensitivity or x-ray/gamma-ray de-tection without neutron sensitivity, respectively. The scintillationof Li�Lu(PO�)�:Ce is based on the Ce��-activator UV (336and 360 nm) emission, and for a 2 wt. % activation level andgamma ray photon excitation, it exhibits a light yield of about5300 photons/MeV and a decay time constant of 24.7 ns—withno longer component observed in the time range up to 2 s. Hostemissions, while present for some specific excitations in the regionof the bandgap energy, do not appear to play a significant role inthe material’s scintillation that is most probably accomplished bythe consecutive capture and recombination of free band holes andelectrons on the activator ions.
Index Terms—Cerium activation, energy transfer, luminescence,neutron detection, scintillation, scintillator materials.
I. INTRODUCTION
A LTHOUGH a number of new scintillators with advan-tageous characteristics have been found in recent years
(e.g., LaBr :Ce, LaCl :Ce, CeCl , and SrI :Eu), the search fornew materials is still ongoing. This continued effort is drivenby the high expectations that are currently placed on scintillatorproperties by modern applications in medicine (PET), highenergy physics, neutron science, etc. and by the fact that, inspite of recent progress, none of the new scintillators exhibitall of the desired characteristics. Since high speed, energyresolution, and light yield (LY) are presently almost universalrequirements, it is not surprising that most of recent scintil-lator-development efforts are concentrated on single-crystalinorganic materials—usually activated with Ce ions wherethe 5d-4f emission is generally both fast and efficient and since
Manuscript received May 22, 2009; revised July 23, 2009 and August 07,2009. Current version published December 09, 2009. Research carried out in theORNL Center for Radiation Detection Materials and Systems was supported bythe U.S. NNSA Office of Nonproliferation Research and Engineering (NA-22).Experiments conducted at Hasylab (DESY) were supported in part by IHP-Con-tract HPRI-CT-1999-00040 of the European Community. Oak Ridge NationalLaboratory is managed and operated by UT-Battelle, LLC under U.S. Depart-ment of Energy Contract DE-AC05-00OR22725.
D. Wisniewski is with the Institute of Physics, Nicolaus Copernicus Univer-sity, Grudziadzka 5/7, 87-100 Torun, Poland (e-mail: [email protected]).
L. A. Boatner is with the Center for Radiation Detection Materials and Sys-tems, Oak Ridge National Laboratory, Oak Ridge, TN 37831 USA (e-mail: [email protected]).
Digital Object Identifier 10.1109/TNS.2009.2032290
the highest scintillator energy resolution obtained thus far hasbeen achieved using trivalent cerium activation.
Individual applications usually extend the set of the most de-sirable scintillator features beyond high speed and LY by addingapplication-specific requirements. For example, a new genera-tion of spallation neutron source facilities (e.g., the SpallationNeutron Source that is operating in Oak Ridge, Tennessee, USA[1] and the European Spallation Source that is currently in apreparatory phase [2]), require position-sensitive neutron de-tectors that can handle high count rates (in some cases evenhigher than neutrons/cm ), and that are not sensitiveto gamma-rays or that, at least, have neutron/gamma discrimi-nation capability. The last of these features also provides an op-portunity to combine neutron and gamma detection into a singledetector—a property that may be of value for a number of ap-plications and for nuclear nonproliferation-related activities inparticular.
While the search for new scintillators for gamma and x-raydetection offers a greater range of potential compounds, the re-quirement of sensitivity to slow neutrons effectively restricts thecandidate materials for this application to those that contain Li,
B, Gd or Gd isotopes. Since the actual scintillation isgenerated by products of a neutron-nuclei reaction in this case,the product types and energies are of great importance, and theleading candidate isotope is generally Li. The reaction of Linuclei with a neutron can be described as follows:
(1)
This reaction produces highly energetic, relatively heavycharged particles that, in a scintillator host material, have arange on the order of tens of m. The reaction of neutronswith B also produces charged particles, but their energiesare lower. On the other hand, Gd isotopes are characterizedby enormous cross-sections for cold and thermal neutronsthat in an actual scintillator lead to neutron absorption lengthsin the m range—while most of the x-ray photons producedin these reactions are sufficiently energetic to escape from athin scintillator without an interaction, and the other products,80–90 keV electrons, do not warrant high light yields. Moredetailed information on the nature of these reactions is given in[3] and references therein. The large energy (4.8 MeV in total)released in reaction (1) described above may initially suggestthat for neutron detection, the LY of the scintillator materialitself is less important, but in fact, this is not the case. Due tolarge differences in the excitation density by heavy particles
0018-9499/$26.00 © 2009 IEEE
WISNIEWSKI AND BOATNER: SCINTILLATION PROPERTIES AND TIME-RESOLVED SPECTROSCOPY 3807
and by the fast electrons that are produced in an interactionwith gamma ray photons, the number of scintillation photonsemitted per unit of deposited energy is usually much lower inthe case of heavy particles. This effect is macroscopically de-scribed by the so-called alpha/electron ratio, that simplycompares the number of photons emitted per MeV for heavycharged particles and electrons. The ratio for individualscintillators often reaches values as low as 0.2 or less. Dueto these limitations, currently available commercial inorganicthermal-neutron scintillators often suffer from relatively low LY(e.g., up to 6000 photons/neutron and 4000–6000 photons/MeVfor gamma photon energy in the case of Li-silicate glassesdoped with Ce). Otherwise, materials of high LY are usuallycharacterized by a long decay (e.g., 1 s or longer for LiI:Eu,LiF/ZnS:Ag). These shortcomings are apparently also shared
by most of the recently developed materials [3], [4]. Thesefactors provide a continuing need for the development of newand better thermal neutron scintillators.
Recently, a few members of the alkali rare-earth double phos-phate family of compounds activated with Ce ions have beenstudied for use as gamma- and x-ray detectors [5]–[8]. Due totheir relatively high LY (up to about 32 000 photons/MeV) andrapid decay times (25–40 ns), these materials are consideredto be promising scintillators. They also offer great flexibilityfor compositional modifications—i.e., various alkali metals(Li, Na, K, Rb, Cs) can be utilized—either mixed or singly incombination with various rare-earth ions (as well as Y and Sc).Consequently, when the Li isotope is used, these materialsshould offer a significant potential for modifications of the neu-tron cross-sections, density, , and the associated neutron andgamma sensitivities. Preliminary results for K LiLu(PO ) :Ceand K Li Lu(PO ) :Ce were presented previously [9],and while some parameter estimations have been made forthe highly Li-enriched material, Li Lu(PO ) :Ce (such asa density of 3.2 g/cm , or an absorption length for 0.18 nmthermal neutrons of 0.7 mm), this specific material was notsynthesized and studied.
In this work we present the scintillation and spectroscopic re-sults for Li Lu(PO ) :Ce single crystals grown with the naturalLi compound. The scintillation results include measurements ofthe radioluminescence, pulse-height spectra for gamma, x-ray,and -particle excitations (and LY determinations when pos-sible), and scintillation pulse shapes. The spectroscopic resultsalso include time-resolved luminescence and luminescence ex-citation spectra and the wavelength-resolved pulse shapes.
II. MATERIALS INVESTIGATED
Lithium lutetium double phosphate [Li Lu(PO ) ] singlecrystals activated with Ce ions were grown by the high tem-perature solution method at the Oak Ridge National Laboratory(ORNL, Oak Ridge, TN, USA) using a lithium pyrophosphate(Li P O ) flux to which the rare earth was added in the form ofLu O . Although the material is intended mainly for thermalneutron (or combined neutron and gamma-ray) detection, atthe present stage of development, a pyrophosphate compoundwith the naturally abundant Li isotopes was used. The ceriumactivator was added in the oxide form in 0.5, 1.0 and 2.0 wt. %quantities. The crystal growth was carried in a manner similar
Fig. 1. Specimens of Li Lu(PO ) crystals activated with Ce at levels of 0.5%(left), and 2% (right).
to that described in [10] for the growth of Rb Lu(PO ) andCs Lu(PO ) . The component mixture was heated to 1235 Cin a platinum crucible, held at this temperature for 4 hours,slowly cooled to 900 C at 1 C/hr, and then rapidly cooled toroom temperature.
The resulting single crystal specimens were colorless, rel-atively transparent, somewhat irregular in shape, and hadindividual volumes starting from a fraction of a mm up toabout 10 mm . Moderately large, clear samples with at leastone fairly flat surface were selected for the studies describedin this work—two of these specimens are presented in Fig. 1.Like most of the other alkali rare-earth double phosphatecompounds, this material is expected to have a somewhathygroscopic nature, however, simple precautions like storagein a container with a drying agent and minimizing the time ofexposure to humid air were sufficient to keep the specimensintact. With the sole exception of the experiments with syn-chrotron radiation excitation that were performed in vacuum,most of measurements were conducted without any isolationof the samples from ambient air, and no noticeable degradationwas observed even after multi-hour-long experiments.
Detailed information on the structural properties and chem-ical characteristics of the alkali rare-earth double phosphatesin general has been given in [10], [11]. The alkali rare-earthdouble phosphates typically crystallize in either a hexagonalform (P-3) that is closely related to the glaserite structure [orin a few cases in the ideal P-3m1 glaserite structure itself—e.g.,Rb Lu(PO ) ] or in a monoclinic form P2 /m that is a distortedglaserite (arcanite-type) structure. Increasing either the alkali orrare earth cation size apparently stabilizes the hexagonal form,so the small ionic size of lithium in the Li Lu(PO ) scintil-lator studied here could, in fact, potentially favor the monoclinicstructural form. Since a single crystal structural refinement hasnot been carried out at this point for Li Lu(PO ) , however, it isnot possible to say with certainty which structural modificationof the glaserite-type structure this compound exhibits.
III. EXPERIMENTAL TECHNIQUES
The scintillation parameters characterization was performedin the Center for Radiation Detection Materials and Systems atORNL. The scintillation LY was determined by a comparisonof the pulse-height spectra (energy spectra) of the subjectmaterials with the spectrum of a reference bismuth germaniumoxide (BGO) sample. Gamma ray photons (662 keV energy)

3808 IEEE TRANSACTIONS ON NUCLEAR SCIENCE, VOL. 56, NO. 6, DECEMBER 2009
produced by a Cs 1 Ci source were used for excitation ofboth the double phosphate and BGO reference materials—eachof which was mounted on a photomultiplier tube window andcovered by 4 layers of Teflon tape to improve the light collec-tion efficiency. No index-matching grease was used to avoidproblems with cleaning the potentially reactive samples of thedouble phosphates. The scintillation pulses were detected bya Hamamatsu R6233-100 photomultiplier (with a borosilicateglass window and super-bi-alkali photocathode), and processedusing a Canberra 2005 preamplifier, Ortec 672 shaping ampli-fier (with a 2 s shaping time setting), and an Ortec PCI-8Kmulti-channel analyzer. For LY computation purposes, thegenerally accepted value of 8200 photons/MeV was assumed asthe LY of BGO. This value for our actual reference sample wasconfirmed (within a few % of the experimental error) by ourown absolute LY measurement. The results have been correctedfor the quantum efficiency of the PMT photocathode. Forthis purpose, weighted average values of the efficiency werecomputed with the use of manufacturer-supplied efficiencyvs. wavelength data and the radioluminescence spectra of thedouble phosphate sample and BGO. Additional energy spectrameasurements were made using sources containing Co (122keV photons) and Am (59.5 keV photons and 5.49 MeVparticles).
For the scintillation pulse-shape measurements, the de-layed-coincidence single-photon-counting (Bolinger-Thomas)method [12] was used, and a more detailed description of theexperimental setup can be found in [13].
The radioluminescence spectra were measured at the Scintil-lation Materials Research Center of the University of Tennessee(Knoxville, TN, USA). The samples were excited by x-ray pho-tons generated by an x-ray CMX001 tube with a tungsten targetoperated at 35 kV/0.3 mA. The emission was collected at anangle from the same sample surface that was excited by the x-rayphotons. The detection path consisted of an Acton Spectra ProSP150i monochromator, with a 600 line/mm diffraction gratingblazed at 300 nm, and a Hamamatsu R928 photomultiplier. Thespectra (PMT’s anode current) were recorded at room tempera-ture (RT) with a 9 nm resolution (1 mm-wide slits).
The luminescence pulse shapes, as well as time-resolved lu-minescence and luminescence excitation spectra were measuredat RT and at 8 K with the use of monochromatic synchrotron-light pulsed excitation at the Superlumi Station of Hasylab inHamburg (Germany). The excitation wavelengths were selectedin the VUV/UV region with a 0.32 nm resolution, while the res-olution of the emission detection path was about 11 nm. Theexcitation pulses of about 200 ps fwhm were arriving at time in-tervals of 192 ns. The spectra were acquired in a single-photoncounting mode with the total and two time-gated emission sig-nals recorded simultaneously. Time windows of 2–42 ns, and140–180 ns (with respect to synchrotron excitation pulses des-ignated as ns) were selected to emphasize the differ-ence between the fast and slow components of the observedemissions. For the purpose of performing some of the calcu-lations, the results of which are presented in the subsequentsections of this work, the total emission can be correspond-ingly represented by a 0–192 ns time window. The emissionpulse shapes were acquired by a modified delayed-coincidence
Fig. 2. Room temperature x-ray-excited luminescence spectra of Li Lu(PO )crystals activated with Ce at levels of 0.5% (a), and 2% (b).
single-photon-counting method. The detailed description of theequipment used at the Superlumi Station can be found in [14],and also on-line [15].
IV. EXPERIMENTAL RESULTS AND DISCUSSION
A. Scintillation Properties
The room-temperature spectra of the x-ray-excited lu-minescence of the Li Lu(PO ) crystals for two differentCe-activation levels are presented in Fig. 2. Both spectra repre-sent a classic case of Ce 5d-4f emission with two distinctivebands separated by about 2000 cm due to spin-orbit splittingof the ground state of the Ce ion ( and ).These bands are positioned at about 336 nm and 360 nm, andtheir relative intensities change with the Ce concentration.While for a 0.5% Ce activation level, both bands show moreor less the same intensity, for a higher activator content, therelative intensity of the shorter-wavelength band is somewhatlower. This effect is related to some overlap of the Ce f-dabsorption and the shorter-wavelength f-d emission band.With an increasing concentration of Ce ions, the probability ofre-absorption of the emitted photons by other, un-excited Ceions increases as the photons travel through the host material.The absorbed photon is usually re-emitted as another Ce d-fphoton. This effect, also known as self-absorption or radiationtrapping, is common among Ce-activated materials (e.g., [16],[17]), and due to the high quantum efficiency of the Ce lu-minescence centers, it usually does not produce any significantscintillation output loss. Instead, it leads to a relative intensityincrease of the longer-wavelength portion of the spectrum andsometimes also to a significant prolongation of the emissiondecay time.
Exclusive of the Ce-emission, no other emissions werepresent in the spectra of the x-ray-excited double phosphatecrystals. While, as will be shown, the phosphate crystals exhibita few other host- or defect-related emissions, the radiolumi-nescence spectra confirm the good efficiency of Ce ions ingathering the excitation energy deposited in the host materialby ionizing radiation in the form of electron-hole (e-h) pairs.

WISNIEWSKI AND BOATNER: SCINTILLATION PROPERTIES AND TIME-RESOLVED SPECTROSCOPY 3809
Fig. 3. Room-temperature scintillation pulse shapes of 0.5% (a) and 2% (b)Ce-activated Li Lu(PO ) crystals excited by 662 keV gamma photons.
Fig. 4. Pulse-height spectra of a 2% Ce-activated Li Lu(PO ) crystal (blackdots or line) and a reference BGO crystal (gray dots) acquired for various typesof excitation: 662 keV photons from Cs source (a), 122.1 keV photons from
Co (b), 5.49 MeV � particles and 59.5 keV photons generated by a Amsource (c). In section (c) results of two measurements are presented—with theuse of the Teflon-tape reflector (x-ray excitation only,� particles blocked—solidline) and without it (both types of radiation—dots).
Fig. 3 shows the RT scintillation pulse shapes for 0.5 and2% Ce—activated materials together with single-exponential( background) fits represented by solid lines. While the scin-tillation pulses were measured in a 2 s time range, no evi-dence of long components was found, and therefore, the resultsare presented in a reduced time scale to emphasize the accu-racy of the single-exponential fits—as well as differences re-lated to the activation levels. The scintillation pulse shape of the1% Ce-activated crystal (not presented in the figure) also exhib-ited a single-exponential decay—with a time constant ofns. The observed increase in the decay time constant with in-creasing Ce content apparently confirms the presence of a radi-ation trapping effect.
In part (a) of Fig. 4, the RT pulse-height spectra (energyspectra) measured with use of 662 keV excitation are comparedfor 2% Ce-activated Li Lu(PO ) (black dots) and the refer-ence BGO crystal (gray dots). Although the spectrum of thephosphate crystal does not exhibit good energy resolution (inpart due to an irregular shape of the sample that makes propercoupling difficult), the photopeak and Compton edge can stillbe clearly recognized. The intensity of the photopeak is rela-tively low due to the lower density and much smaller size of thedouble phosphate specimen as compared to the 1 1 0.5 cmBGO reference crystal. The positions of both photopeaks are al-most the same. This is indicative of comparable total photo-elec-tron responses in all applications that would use photomulti-pliers with similar quantum efficiency and spectral characteris-tics comparable to that of super-bi-alkali photocathodes (for ex-ample popular PMTs with bi-alkali photocathodes). Taking intoaccount the photocathode quantum efficiency of the HamamatsuR6233-100 PMT used here (22.2% for BGO and 33.7% for thedouble phosphate—the method of estimating these values is de-scribed in Section III) leads to a Li Lu(PO ) :2%Ce LY valuethat is reduced to about 65% of the BGO LY (i.e., pho-tons/MeV). It should be noted, however, that being about 12times faster than BGO (which exhibits a ns decay time),the double phosphate material is characterized by an almost 8times higher amplitude (i.e., initial intensity) of the scintillationpulse. This particular parameter, rather than the total number ofemitted photons, is of primary importance for all timing appli-cations of scintillation detectors.
The energy spectrum acquired for the 2% Ce-activated crystalexcited with 122 keV photons is presented in part (b) of Fig. 4. Acomparison of the photopeak positions to the excitation energyfor the 122 and 662 keV excitations leads to about an 18% LYdecrease for the lower energy excitation. An analogous compar-ison conducted for an excitation photon energy of 59.5 keV (i.e.,the energy spectrum in part (c) of Fig. 4) shows an even furtherreduced LY—by about 24%—when compared to the 662 keVexcitation case. Both results indicate a rather strong LY nonlin-earity.
A similar LY study was also performed for samples activatedwith 1% and 0.5% Ce. The measured LY values were respec-tively about 9 and 15% lower than for the 2% Ce-activated ma-terial. However, due to significant size and shape discrepanciesof the phosphate specimens, these results can carry relativelyhigh errors and cannot be used to determine the optimal acti-vator concentration.
An attempt was made to check the response of the doublephosphate crystals to thermal neutrons. A custom-made ameri-cium-lithium source, thermal-neutron-sensitive GS20 glass ref-erence specimen, and the same measurement setup used forgamma excitation (as described in Section III) were employedfor this purpose. Due to the small size of the crystals and theuse of natural Li for their fabrication, even for the largest of thespecimens, the expected neutron count rate was only about 1count per minute—more than 3 orders of magnitude lower thanthat of the GS20 glass reference sample. Consequently, it wasnot possible to separate the neutron-response signal from rela-tively high noise of the background signal (that resulted mainlyfrom relatively high gamma activity of the Am-Li source and

3810 IEEE TRANSACTIONS ON NUCLEAR SCIENCE, VOL. 56, NO. 6, DECEMBER 2009
the decay of the long life and relatively abundant Lu ra-dioisotope present in the Lu compound used for fabrication ofthe phosphate crystals). Since the detection of thermal neutronsby Li-containing materials is, in fact, based on the detection ofheavy charged particles emitted in the Li(n, ) reaction (as de-scried by (1).), as a substitute for neutron excitation, excitationwith particles generated by an Am source was used. Giventhat this source also emits 59.5 keV x-rays, two measurementswere made—one without and one with the use of a Teflon-tapereflector. The first configuration was used to check the responseof the double phosphate to the flux of both types of radiationsimultaneously, while the second, by means of blocking theparticles with Teflon tape, was used to reveal the x-ray responseonly. The corresponding pulse-height spectra are presented inpart (c) of Fig. 4 by dotted and solid line traces, respectively.The photopeak related to x-ray detection is centered at channel46 in the “x-ray” energy spectrum. The “x-ray-plus- -particle”spectrum was acquired with impaired light collection efficiencydue to the lack of a Teflon reflector. Consequently, the x-ray de-tection photopeak is merged with the noise signal (low channelnumbers), and the band peaking at channel 200 is related to thedetection of particles, but its channel-position cannot be usedto determine the -response LY or ratio. An attempt to de-termine the ratio with help of 662 keV pulse-height spec-trum, acquired without Teflon reflector use, also failed due toinability to determine the photopeak position. Nevertheless, theclear response to particles shows, that if made with a Li-en-riched compound, the double phosphate materials should effi-ciently detect thermal neutrons. It is worth noting that in this ma-terial, the only non-negligible competition for neutrons comesfrom Lu. Depending on the isotope type, the Lu cross-sections[18] for thermal neutron capture, are about 23 barns for Lu(97.4% natural abundance) and 2100 barns for Lu (2.6%),as opposed to 941 barns for Li. Simple calculations based onquoted cross-section values and particular elemental concentra-tions show that the probability of thermal neutron capture by Lu(instead of by Li) is only about 2.7% in fully Li-concentratedmaterial, and about 26.7% in material based on natural Li. Inthe later case, the absorption length for thermal neutrons (com-puted using formula presented in [3]) increases to about 8 mm.This is not necessarily a disadvantage if the subject material issupposed to be employed as combined neutron/gamma detector,that to provide sufficient -sensitivity, has to be relatively thickin any case. The use of natural Li instead of enriched Li substan-tially reduces the material cost, unfortunately at the expense ofthe neutron detection efficiency that is reduced from about 97%to 73%.
B. Time-Resolved Luminescence and Luminescence ExcitationSpectra
All of the spectra presented in this section have been acquiredusing the 1 wt. % Ce-activated material. The time-resolved ex-citation spectra of the Ce emission (at 360 nm) measured at RT(set a) and at 8 K (set b) are presented in Fig. 5. For each set ofspectra, a thick black line corresponds to the “total” emissionsignal, while gray and thin black lines represent the “fast” and“slow” emissions acquired in 2–42 ns and 140–180 ns time win-dows, respectively. The spectra have been normalized so that the
Fig. 5. Time-resolved Ce-emission excitation spectra for a 1% Ce-activatedLi Lu(PO ) crystal, measured at RT (a) and 8 K (b). The spectra are shiftedto aid presentation.
maximum intensity of “total” emission in each set is the same,while the “fast” and “slow” emissions are kept in the measure-ment-related proportions to the “total” emission within a partic-ular set. This normalization procedure and line convention willalso be used for all of the other luminescence and luminescenceexcitation spectra presented here. No corrections for the spec-tral characteristics of the excitation path have been made. Thesubject characteristics are, however, fairly smooth (with the ex-ception of the 50–140 nm wavelength range where the measuredspectra resemble the shape of the subject characteristics) with anintensity decreasing gradually at the wavelength range bound-aries.
At RT (a), both the “total” and “fast” luminescence excita-tion spectra consist of bands peaking at about 325, 250, 238,225, 199, 175 and 85 nm, and the only difference is in the rel-ative band intensity. The bands in the wavelength range from325 to 225 nm can be assigned with certainty to transitions fromthe 4f ground level of the Ce ions to their 5d levels split bya low-symmetry crystal field component into two groups thatare separated by a relatively large energy gap (denoted as 10Dqin crystal-field theory). The energy structure with 3 (clearly re-solved) higher energy levels (t2) and 2 (not resolved) lower en-ergy levels (e) suggests a tetrahedral or lower symmetry of thecrystal field at the Lu/Ce sites. While the 199 nm band is mostprobably related to some kind of Ce-bound exciton, the wideband peaking around 175 nm can be tentatively considered to bea “host” excitation (indicating that the bandgap of the material isapproximately 7.1 eV). Consequently, shorter wavelengths cor-respond to above-the-bandgap excitation. The shape of the 85nm band (together with the much less intense 125 nm band sit-uated on its long-wavelength shoulder) is, however, due to thespectral characteristics of the monochromator in the excitationpath at the Superlumi Station. Nevertheless, it indicates the effi-cient energy transfer from e-h pairs created by these excitationenergies to the Ce ions.
WISNIEWSKI AND BOATNER: SCINTILLATION PROPERTIES AND TIME-RESOLVED SPECTROSCOPY 3811
For 225 nm and longer-wavelength excitation bands, the“fast” spectrum shows about a 75% peak-intensity of the“total” spectrum, which looking somewhat ahead, is in goodagreement with the results of the pulse shape measurements(i.e., with a ratio of integrals computed for the emission pulsefit of the decay profile over the intervals corresponding to “fast”and “total” time windows of the spectral measurement). The75% ratio also holds true for the 85 nm excitation band, but notfor a wide 175 nm band that shows a smaller intensity of “fast”emission (and consequently also for the 199 nm f-d peak—dueto an overlap of these bands). In the “slow” emission excitationspectrum, the f-d bands disappear completely, and the 85 nmband disappears almost completely, which implies a fast decayof the Ce emission excited by photons of these wavelengths.Only the 175 nm band remains easily visible in this “slow”spectrum, indicating either a slower decay time constant orthe presence of a significant slow component in the emissionpulses excited by these wavelengths.
The excitation spectra measured at 8 K (Fig. 5, set b), in ad-dition to the typical effects related to lower temperature (i.e.,the disappearance of the thermal broadening that was present atRT) exhibit somewhat changed relative intensities of particularbands. In the f-d transitions wavelength range, the intensitiesof the 238 nm and 225 nm bands are decreased in comparisonto other f-d bands. Similar effects were previously observed inCe-activated Y Al O [19] and LuAlO [20] crystals and havebeen explained in terms of various dipole moments for particularf-d transitions originating from levels of the crystal-field-splitF ground state of Ce ions and the classic temperature
dependence of the population of these levels. However, fromthe scintillation properties point of view, relative changes ofthe short wavelength band intensities are more important—e.g.,there is a general decrease of the 85 nm band contribution and anincrease in the host band contributions. This indicates changesin the energy transfer efficiency to the Ce ions at low temper-atures—i.e., some reduction in transfer from free e-h pairs andan increase in host-related excitations, respectively.
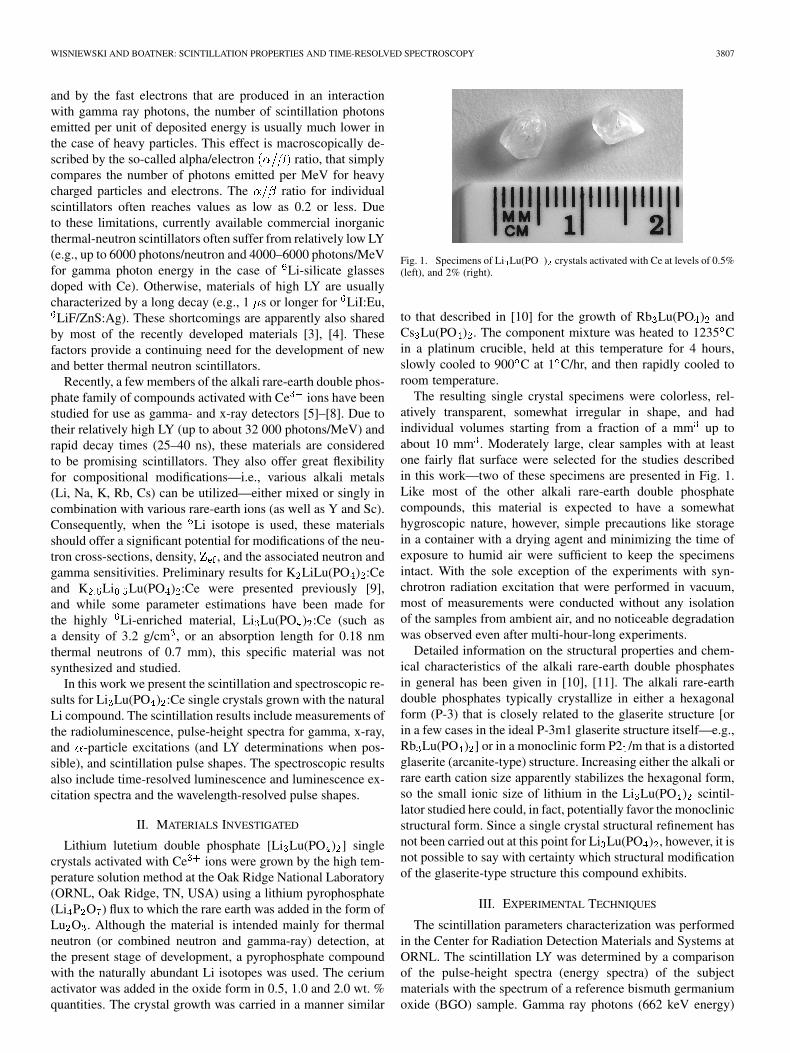
Fig. 6 presents the emission spectra measured for various ex-citation wavelengths. At RT, both f-d (a) and above-the-bandgap(b) excitation produces only Ce d-f emission bands, and theonly difference is in the relative intensity of these bands. Thisdifference can be explained in terms of Ce self-absorption. Inthe wavelength range above the bandgap energy, the absorptionof the material is so large that excitation photons are absorbedin an extremely thin layer of the material. As a consequence, asignificant percentage of Ce emission photons that are emittedin the thin surface layer have very short distances to travel be-fore they leave the host material, and the probability of theirre-absorption by other Ce ions is small. As a result, both Ceemission bands have almost the same intensity. On the contrary,the 250 nm photons used for f-d excitation can travel somewhatdeeper into the material before being absorbed. The average dis-tance that photons emitted by Ce ions have to travel within thehost is then larger, and the consequences of self absorption aremore discernible. The effect is further confirmed by results ob-tained for other excitation wavelengths in the Ce f-d absorptionrange (not presented here) showing changes of the constituent
Fig. 6. Time-resolved emission spectra of a 1% Ce activated Li Lu(PO )crystal, measured for various excitations at RT (a, b, e) and 8 K (c, d). Spec-trum set (a) presents emission following f-d excitation of Ce ions, sets (b)and (c) are recorded for excitation at 85 nm—well above the bandgap energy,and sets (d), and (e) for excitation in close proximity of the bandgap energy. Insome sets, an additional spectrum is shown that was generated by multiplicationof the “slow” emission intensity by a factor of 4.8.
Ce emission bands intensity ratio that coincide with changes ofCe absorption at the wavelengths used for excitation.
Additionally, it should be pointed out that the presentedspectra were recorded without the use of any filters in theemission detection path, and consequently, the second orderof the 250 nm excitation is visible in spectrum set (a). Thehuge differences in the second-order signal intensity in theconstituent spectra are obviously due to the fact that the syn-chrotron radiation pulses only slightly overlap with the “fast”2-42 ns time windows (as the result of the timing signal jitter),and, correspondingly, lie completely inside and outside of the“total” and “slow” emission windows.
At 8 K, the usual decrease in thermal broadening is observed,leading to somewhat better resolved Ce emission bands (i.e., adeeper “valley” in between the bands). At this temperature, con-trary to the RT results, both the f-d (not presented) and 85 nmexcitation (c) lead to the same shape of the Ce emission spec-trum—with the relative intensity of Ce bands being similar to

3812 IEEE TRANSACTIONS ON NUCLEAR SCIENCE, VOL. 56, NO. 6, DECEMBER 2009
that observed at RT for the 85 nm excitation. The intensity de-crease of the shorter-wavelength Ce emission band, observedpreviously at RT for f-d excitation, is not present at 8 K—clearlydue to a low-temperature-reduced overlap of the Ce absorptionand emission bands leading to decreased self-absorption. For the85 nm excitation at 8 K, a new broad emission band (centered atabout 450 nm) appears in the “total” spectrum. This band is notreadily apparent in the “fast” and “slow” spectra, when repro-duced in the measurement-determined proportion to the “total”emission. It is also hard to determine the wavelength range ofthis emission due to the possible overlap with the Ce emissionand the decreasing efficiency of the detection system—corre-spondingly on the short- and long-wavelength side. Spectra ac-quired for the 175 nm excitation (d and e) show that this emis-sion, in fact, may consist of at least two overlapping bands, ofwhich the shorter-wavelength one is excited by both 85 nm and175 nm radiation, while the other (longer-wavelength) emissionis visible only for 85 nm excitation. As noted previously, thisemission is hard to discern in the “fast” and “slow” spectrum.At 8 K, however, “scaling up” these spectra (with use of thesame multiplication coefficient) surprisingly leads to a similarintensity of that emission for both the “fast” and “slow” spec-trum (both for the 85 nm and 175 nm excitation). Addition-ally, when a 4.8 multiplication ratio that corresponds to the ra-tios of the acquisition time window lengths (“total”/“slow” and“total”/“fast”) is used, the resultant spectra have almost the sameintensity as the “total” spectrum. This means that the lumines-cence intensity per unit of time is almost constant in the timerange corresponding to the “fast,” “slow” and “total” time win-dows. This condition can be only fulfilled if the emission pulseis dominated by the component that is long enough to not decaysignificantly during the 192 ns interval between consecutive ex-citation pulses. The “slow” spectra multiplied by a factor of 4.8are presented in Fig. 6 by gray dots.
The spectrum acquired at 8 K for the 175 nm excitation (d)also reveals other emissions. On the shorter-wavelength sideof the Ce bands, we observe an emission extending from 240to about 325–330 nm. One can question the real wavelengthrange of that emission since its sides, both short- and long-wave-length, are flanked by strong f-d absorption of the Ce ions(see the excitation spectra in Fig. 5), that can lead to a distor-tion of the measured band shape. The flattened top of the sub-ject band, and a slight depression at about 290 nm, indicates ei-ther a possibility for distortion caused by another absorption orthe presence of two (or more) overlapping emission bands. Thelack of Ce absorption in the wavelength range corresponding tothe “flat-top” region of the subject spectrum and the disappear-ance of the shorter-wavelength portion of the subject emission athigher temperature (see Fig. 6(e)) suggest the latter case. Con-sequently, this emission should be actually considered as twoseparate bands—denoted in this work as the 270 nm and 310 nmemissions. Both bands show the same level of emission signalacquired in the “fast” and “slow” gates, and when multipliedby the factor of 4.8, almost perfectly overlay the “total” signal.These facts clearly imply a long decay time of the subject emis-sions. Another slow emission that follows the 175 nm excitationcan be identified as a relatively narrow band at 485 nm (and an-other band at 579 nm—not visible in the figure due to the re-
stricted wavelength range of the presented data). This emissionis most probably due to contamination from some rare-earthions other than Ce and Lu.
At RT, the 175 nm excitation (when compared to the 85 nmor 250 nm excitation) also leads to a somewhat decreased inten-sity of the Ce emission in the “fast” spectrum and an increaseof that emission signal in the “slow” spectrum (Fig. 6(e)). At8 K, these effects are even more pronounced (d), indicating theslowdown and/or contribution of a slow component in the Ceemission pulse at both temperatures and a relative intensificationof the processes leading to this effect with decreasing tempera-ture. Such a slow component obviously must be related to thoseenergy transfer mechanisms that are rather slow—both at RTand at low temperature. Assuming that some kind of band, de-fect-, or self-trapped excitons are generated by the 175 nm radi-ation, the observed effects may be related to temperature-linkedchanges in the exciton’s mobility and also to their radiative andnon-radiative decay rates that, in turn, have an influence on theefficiency and speed of the exciton-to-Ce-ion energy transfer.Another possibility involves the effect of Ce-ion photoioniza-tion that, in the subject excitation wavelength range, may co-exist with exciton generation. In this case, if the photo-releasedelectrons at 8 K are trapped by charge traps this may reduce theintensity of the Ce emission fast component—while increasingthe contribution of the slow component.
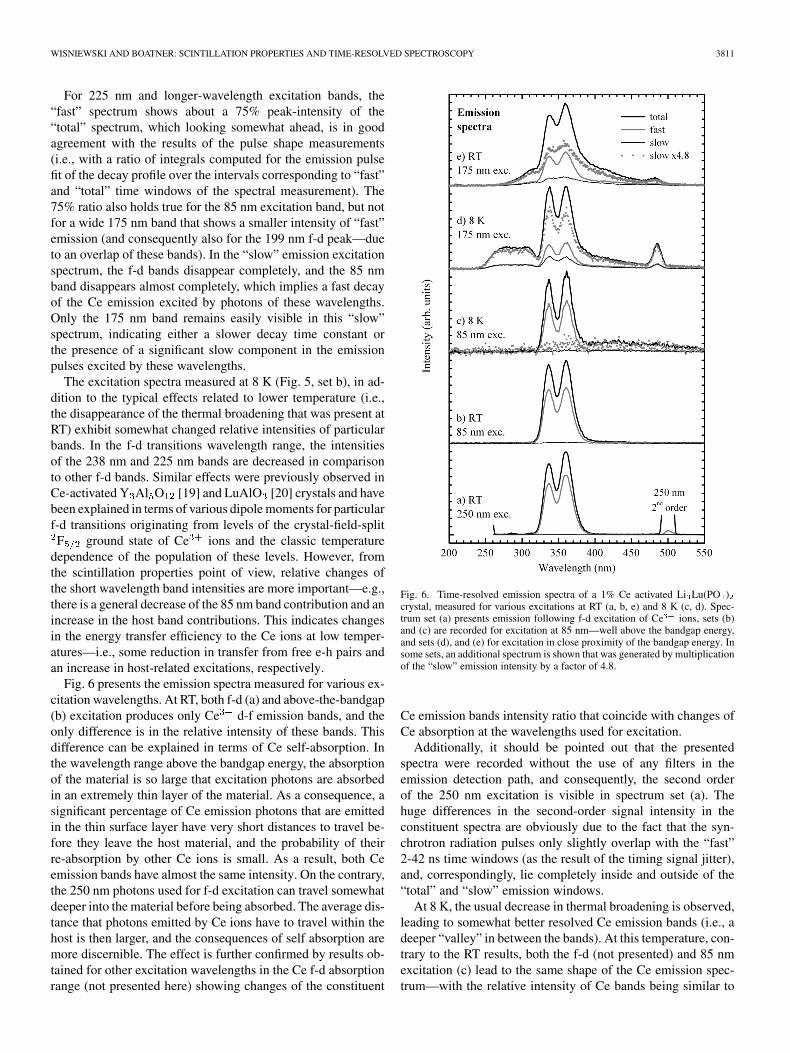
The excitation spectra of the host emissions are presented inFig. 7. At 8 K, excitation spectra of both the 270 nm (set a) andthe 310 nm (set b) host emissions exhibit features (such as prac-tically identical signals in the “fast” and “slow” gates) that con-firm the slow character of these emissions. While both sets, atfirst glance, are similar, there are differences in the band shapesand positions. The excitation spectrum of the 310 nm emission ischaracterized by a more symmetrical and somewhat wider mainband centered at about 175 nm and two rather small satellitebands positioned on its short- and long-wavelength shoulders atabout 155 nm and 200 nm. The excitation spectrum of the 270nm emission peaks at about 185 nm; it has a steeper long-wave-length edge; and while it also contains the 155 nm band, thereis no 200 nm band that is visible. At RT, the 270 nm emissiondisappears, while the excitation spectra of the 310 nm emission(c) shows some significant changes. The 200 nm excitation bandbecomes more intense, and new bands appear at longer wave-lengths up to about 290 nm and also (very weak) at 85 nm. The“fast” and “slow” spectra are no longer identical—a compar-ison indicates a faster decay of the 310 nm emission (in caseit is single-exponential) and/or the presence of a fast compo-nent—especially for the 200 nm and longer wavelength excita-tions.
The excitation spectra of the long-wavelength host emission,measured at 420 nm (sets d and e), to a large extent are reminis-cent of those of the 310 nm emission measured at RT. With theexception of bands at wavelengths longer than 250 nm that areno longer present, the excitation spectra of the 420 nm emissioncontain all of the bands observed in the above-mentioned excita-tion spectrum of the RT 310 nm emission. There is, however, anincreased relative intensity of the 200 nm band—both at 8 K (e)and (even further increased) at RT (d). Interestingly, the inten-sity of the emission signal recorded in the “fast” gate also rises
WISNIEWSKI AND BOATNER: SCINTILLATION PROPERTIES AND TIME-RESOLVED SPECTROSCOPY 3813
Fig. 7. Time-resolved host emissions excitation spectra of a 1% Ce-activatedLi Lu(PO ) crystal. Spectrum set (a) presents the excitation spectra of the 270nm emission at 8 K; sets (b) and (c) present the excitation spectra of 310 nmemission at 8 K and RT; and sets (d) and (e) present the excitation spectra of the420 nm emission at RT and 8 K, respectively.
in comparison to that in the “slow” time gate. At 8 K, there ismainly an increase of the 200 nm band portion of the spectrum,but at RT, the effect increases—and even the 175 nm band in the“fast” spectrum is about 2 times more intense than in the “slow”one. This again indicates a general shortening of the emissiondecay time (that, of course, might be realized by an increasingcontribution of the fast component in a multi-exponential emis-sion pulse). It should also be noted that above-the-bandgap exci-tations contribute to the generation of the 420 nm luminescence,but the intensity of the 85 nm band is rather low, and these ex-citations lead mainly to a slow emission.
In the excitation spectrum of the 420 nm luminescence, a verynarrow line is also present at about 223 nm. The origin of thisline remains unclear—it is probably not related to excitationof the broad 420 nm band, but rather to f-f transitions in someunintentionally introduced rare-earth ions.
C. Luminescence Pulse Shapes
All of the results presented in this section were acquired forthe same 1 wt. % Ce-activated crystal that was used in mea-surements of all of the emission spectra presented in the pre-
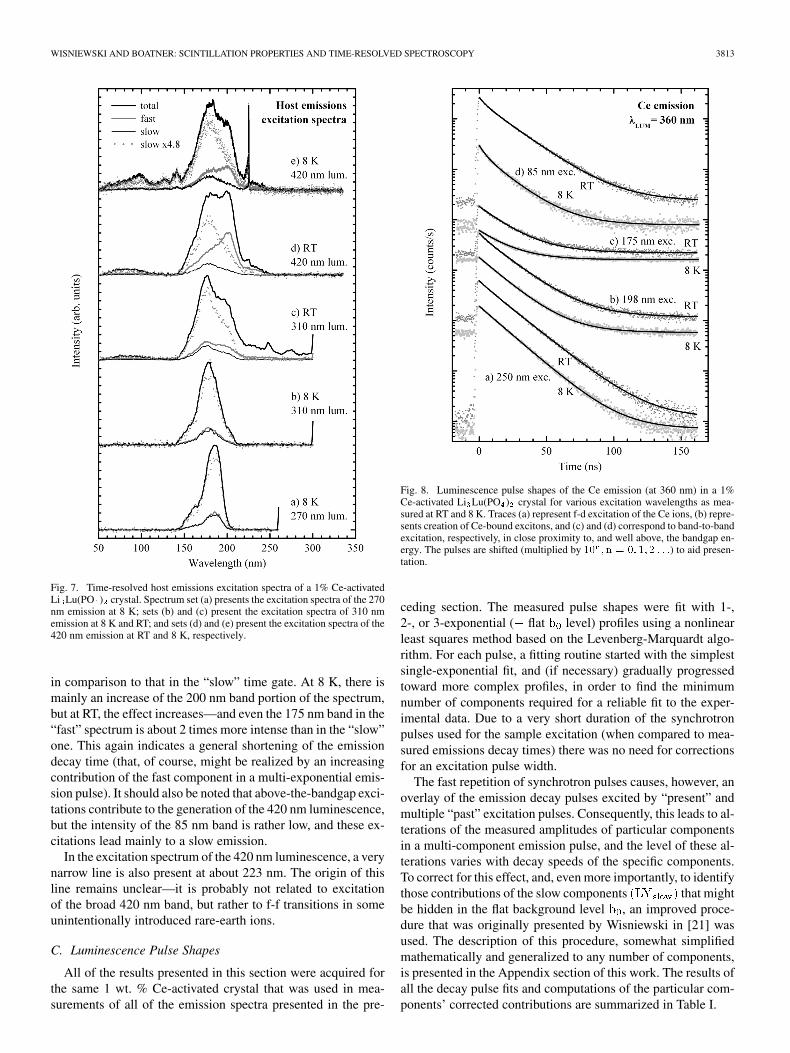
Fig. 8. Luminescence pulse shapes of the Ce emission (at 360 nm) in a 1%Ce-activated Li Lu(PO ) crystal for various excitation wavelengths as mea-sured at RT and 8 K. Traces (a) represent f-d excitation of the Ce ions, (b) repre-sents creation of Ce-bound excitons, and (c) and (d) correspond to band-to-bandexcitation, respectively, in close proximity to, and well above, the bandgap en-ergy. The pulses are shifted (multiplied by �� � � � �� �� � � � �) to aid presen-tation.
ceding section. The measured pulse shapes were fit with 1-,2-, or 3-exponential ( flat level) profiles using a nonlinearleast squares method based on the Levenberg-Marquardt algo-rithm. For each pulse, a fitting routine started with the simplestsingle-exponential fit, and (if necessary) gradually progressedtoward more complex profiles, in order to find the minimumnumber of components required for a reliable fit to the exper-imental data. Due to a very short duration of the synchrotronpulses used for the sample excitation (when compared to mea-sured emissions decay times) there was no need for correctionsfor an excitation pulse width.
The fast repetition of synchrotron pulses causes, however, anoverlay of the emission decay pulses excited by “present” andmultiple “past” excitation pulses. Consequently, this leads to al-terations of the measured amplitudes of particular componentsin a multi-component emission pulse, and the level of these al-terations varies with decay speeds of the specific components.To correct for this effect, and, even more importantly, to identifythose contributions of the slow components that mightbe hidden in the flat background level , an improved proce-dure that was originally presented by Wisniewski in [21] wasused. The description of this procedure, somewhat simplifiedmathematically and generalized to any number of components,is presented in the Appendix section of this work. The results ofall the decay pulse fits and computations of the particular com-ponents’ corrected contributions are summarized in Table I.
3814 IEEE TRANSACTIONS ON NUCLEAR SCIENCE, VOL. 56, NO. 6, DECEMBER 2009
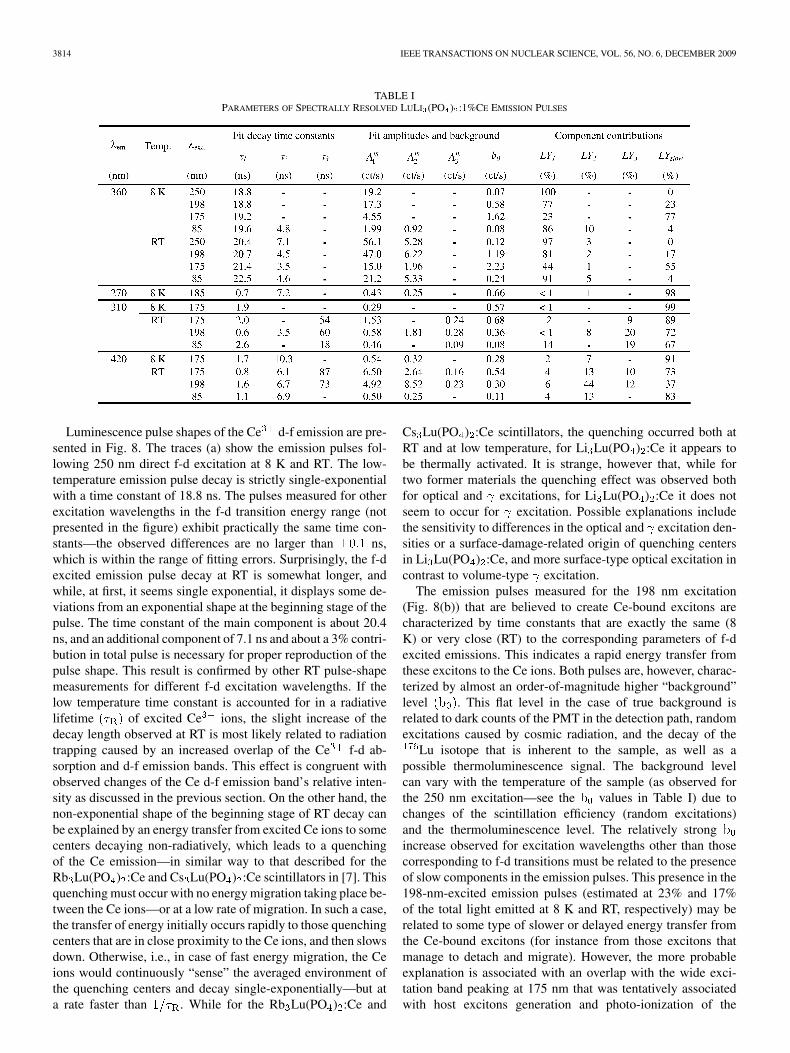
TABLE IPARAMETERS OF SPECTRALLY RESOLVED LULI (PO ) :1%CE EMISSION PULSES
Luminescence pulse shapes of the Ce d-f emission are pre-sented in Fig. 8. The traces (a) show the emission pulses fol-lowing 250 nm direct f-d excitation at 8 K and RT. The low-temperature emission pulse decay is strictly single-exponentialwith a time constant of 18.8 ns. The pulses measured for otherexcitation wavelengths in the f-d transition energy range (notpresented in the figure) exhibit practically the same time con-stants—the observed differences are no larger than ns,which is within the range of fitting errors. Surprisingly, the f-dexcited emission pulse decay at RT is somewhat longer, andwhile, at first, it seems single exponential, it displays some de-viations from an exponential shape at the beginning stage of thepulse. The time constant of the main component is about 20.4ns, and an additional component of 7.1 ns and about a 3% contri-bution in total pulse is necessary for proper reproduction of thepulse shape. This result is confirmed by other RT pulse-shapemeasurements for different f-d excitation wavelengths. If thelow temperature time constant is accounted for in a radiativelifetime of excited Ce ions, the slight increase of thedecay length observed at RT is most likely related to radiationtrapping caused by an increased overlap of the Ce f-d ab-sorption and d-f emission bands. This effect is congruent withobserved changes of the Ce d-f emission band’s relative inten-sity as discussed in the previous section. On the other hand, thenon-exponential shape of the beginning stage of RT decay canbe explained by an energy transfer from excited Ce ions to somecenters decaying non-radiatively, which leads to a quenchingof the Ce emission—in similar way to that described for theRb Lu(PO ) :Ce and Cs Lu(PO ) :Ce scintillators in [7]. Thisquenching must occur with no energy migration taking place be-tween the Ce ions—or at a low rate of migration. In such a case,the transfer of energy initially occurs rapidly to those quenchingcenters that are in close proximity to the Ce ions, and then slowsdown. Otherwise, i.e., in case of fast energy migration, the Ceions would continuously “sense” the averaged environment ofthe quenching centers and decay single-exponentially—but ata rate faster than . While for the Rb Lu(PO ) :Ce and
Cs Lu(PO ) :Ce scintillators, the quenching occurred both atRT and at low temperature, for Li Lu(PO ) :Ce it appears tobe thermally activated. It is strange, however that, while fortwo former materials the quenching effect was observed bothfor optical and excitations, for Li Lu(PO ) :Ce it does notseem to occur for excitation. Possible explanations includethe sensitivity to differences in the optical and excitation den-sities or a surface-damage-related origin of quenching centersin Li Lu(PO ) :Ce, and more surface-type optical excitation incontrast to volume-type excitation.
The emission pulses measured for the 198 nm excitation(Fig. 8(b)) that are believed to create Ce-bound excitons arecharacterized by time constants that are exactly the same (8K) or very close (RT) to the corresponding parameters of f-dexcited emissions. This indicates a rapid energy transfer fromthese excitons to the Ce ions. Both pulses are, however, charac-terized by almost an order-of-magnitude higher “background”level . This flat level in the case of true background isrelated to dark counts of the PMT in the detection path, randomexcitations caused by cosmic radiation, and the decay of the
Lu isotope that is inherent to the sample, as well as apossible thermoluminescence signal. The background levelcan vary with the temperature of the sample (as observed forthe 250 nm excitation—see the values in Table I) due tochanges of the scintillation efficiency (random excitations)and the thermoluminescence level. The relatively strongincrease observed for excitation wavelengths other than thosecorresponding to f-d transitions must be related to the presenceof slow components in the emission pulses. This presence in the198-nm-excited emission pulses (estimated at 23% and 17%of the total light emitted at 8 K and RT, respectively) may berelated to some type of slower or delayed energy transfer fromthe Ce-bound excitons (for instance from those excitons thatmanage to detach and migrate). However, the more probableexplanation is associated with an overlap with the wide exci-tation band peaking at 175 nm that was tentatively associatedwith host excitons generation and photo-ionization of the

WISNIEWSKI AND BOATNER: SCINTILLATION PROPERTIES AND TIME-RESOLVED SPECTROSCOPY 3815
Fig. 9. Luminescence pulse shapes of short wavelength host emissions (270 nmand 310 nm) in a 1% Ce-activated Li Lu(PO ) crystal for various excitationwavelengths.
Ce ions. Traces (c) in Fig. 8 and corresponding data in Table I,show that the 175 nm excitation leads to even further increased(to 77% at 8 K and 55% at RT) contributions of slow compo-nents in the total pulses. Interestingly, for the even higher en-ergy excitations (85 nm) represented by traces (d), these slowcomponents disappear almost completely. This indicates a fastenergy transfer to the Ce activator if the energy is deposited inthe host material in a form of free band carriers (electron-holepairs) generated by 85 nm radiation. Consequently, in this case,the mode of Ce ion excitation must be different than through theformation of host excitons followed by exciton migration andenergy transfer to the Ce ions. It should also be noted that withdecreasing excitation wavelength, both at 8 K and RT, a smallgradual increase in the Ce emission fast component decay timeis observed. The decay time constant of the 85-nm-excited RTemission approaches the value observed for scintillation pulsesof the 1% Ce-activated material. This indicates that the 85 nmexcitation, to a large extent, simulates the excitation by ionizingradiation.
It should be noted that a slight quenching of the Ce emissionat the beginning stage of the pulses is present for all excitationwavelengths at RT. This is consistent with the idea presentedpreviously of a thermally activated energy transfer from excitedCe ions to quenching centers. Surprisingly, a similar emis-sion pulse deformation also appears at 8 K, but only for pulsesexcited by the 85 nm radiation. In this case, there is a potentiallysomewhat different mechanism of quenching that may, for ex-ample, affect the population of electron-hole pairs before theytransfer their energy to the Ce activator.
The pulse shapes of host emissions for various excitationwavelengths are presented in Figs. 9 and 10. At first it may seemthat all of these emissions decay even faster than the Ce lumi-nescence, but in fact, it is the opposite. While they all show fastluminescence components, the relatively high levels concealsignificant, in most cases prevailing, contributions of compo-nents that are to slow to reveal their slope in measured pulses
Fig. 10. Luminescence pulse shapes of the 420 nm host emission in a 1%Ce-activated Li Lu(PO ) crystal for various excitation wavelengths.
(see Table I). The decay time constants and contributions ofparticular components that vary with temperature and excita-tion wavelengths generally confirm conclusions drawn from ananalysis of the spectra presented previously and indicate thecomplexity of those processes that lead to host emissions. Theseprocesses cannot be identified in more detail at present stagewithout some knowledge of the actual defects, the types of exci-tons, and emitting centers that are related to the host emissions.
D. Scintillation Mechanism
At present there are no Li Lu(PO ) crystals available thatare not activated with Ce that could be used to study the intrinsicshape and other properties of the host emission(s) in this mate-rial. However, the observed temperature-related changes in theemission and excitation spectra, as well as the diversity of pulseshapes, prove that there are a few different host emission bandspresent. Those bands that are at longer-wavelengths than theCe emission cannot contribute to excitation of Ce ions throughnon-radiative and radiative energy transfer. Such a transfer isstill possible, however, from centers related to the shorter-wave-length host emissions that most probably partially overlap theCe absorption bands. For the 175 nm excitation, the domina-tion of the slow component, both in pulses of the nmemissions as well as in pulses of the Ce emission, might beconsidered a manifestation of such an energy transfer. On theother hand, slow components of the Ce luminescence may be ex-plained as well by a slow transfer from excitons generated by the175 nm radiation, but at an earlier stage—before they reach thecenters responsible for the host emission. In such a case, thesecenters compete for excitation with the Ce ions instead of medi-ating the energy-transfer process. While the presently availabledata is insufficient to choose one of the above hypotheses, itseems that these processes may only play a minor, if any, rolein the scintillation of the material. The generation of free bandcharge carriers by ionizing radiation or by 85 nm photons leadsto rapid host-to-Ce ions energy transfer. The low level of the

3816 IEEE TRANSACTIONS ON NUCLEAR SCIENCE, VOL. 56, NO. 6, DECEMBER 2009
Ce emission slow component clearly indicates that this transferbypasses a mediation of excitons typical of host emissions, andeven, to a large extent, precludes their formation. Only a lowlevel of host emissions (mainly in the longer-wavelength range)is detected for 85 nm excitation of the 1% Ce activated crystal,and practically no host emission is observed in radiolumines-cence at any of the activation levels. The mechanism of rapid en-ergy transfer most probably, as in the case of many other Ce-ac-tivated crystals [22], [23] or even glasses [24], involves a se-quential trapping of free band charge carriers—usually first theholes and then electrons by Ce ions—followed by their radiativerecombination. This type of energy transfer is often accompa-nied by some lengthening of the scintillation decay (when com-pared to the radiative life-time of the Ce ions) or the occurrenceof additional, longer components if shallow or medium-depthcharge traps are present in the host. While no long componentsare observed in the Li Lu(PO ) :Ce scintillation pulses mea-sured in the 2 s time range, a slight lengthening of the maincomponent has, in fact, been observed. This lengthening can be,as well, related to radiation trapping occurring in the materialand to its strength varying with the average distance of photonsin the sample.
V. CONCLUSION AND FUTURE WORK
This work has established that the scintillation ofLi Lu(PO ) :Ce crystals is based on the fast and efficientd-f emission of the Ce activator. Host emissions, while theymay be stimulated by photons with energies in the vicinity ofthe bandgap energy, are not observed during the scintillationof the material. Analogously, the excitons related to theseemissions, although some of them may transfer energy to theCe ions, do not appear to play any significant role in supportinghost-to-activator energy transfer when energy is deposited inthe host in the form of free e-h pairs. On the contrary, the Ceions seem to successfully compete with the formation of exci-tons, and the most probable mode of energy transfer leadingto the scintillation of the material is Ce -based radiativerecombination of free band holes and electrons.
While the scintillation light yield of Li Lu(PO ) :Ce at thepresent stage (5 300 photons/MeV) is far from being as impres-sive as in the case of current leading Ce-activated scintillators(e.g., LSO:Ce, CeCl or LaBr :Ce), the potential of this mate-rial as a thermal neutron or combined gamma/neutron detectorremains. Additionally, its features include: a good fit to the sen-sitivity characteristic of popular bi-alkali photocathode PMTs, areasonable light output that is comparable to commercial Ce-ac-tivated Li silicate glasses, and unparalleled speed compared toother inorganic state-of-the-art thermal neutron scintillators (as-suming that its response to thermal neutrons is characterized bya similar pulse shape as that observed for gamma photons).
Future work should include a study of a Li Lu(PO ) crystalthat is not Ce-activated to carry out a more detailed investiga-tion of excitonic processes and energy-loss mechanisms in thismaterial. In particular, an identification of non-radiative recom-bination channels may lead to improvement in the scintillationefficiency. A set of uniform-size samples covering a wider range
Fig. 11. An illustration of emission pulse shape measurement with the use ofhigh repetition rate synchrotron pulses as an excitation source. Part (a) showsexcitation pulses. Parts (b) and (c) show emission pulses for fast (� � �� ns),and slowly (� � ��� ns) decaying emissions, correspondingly. Thin, blacklines represent the separate emission pulses; while thick gray lines representaggregates of pulses—the total intensity of emission seen by an MCA. The mea-surement starts no earlier than the moment when the “aggregate” amplitude ofemission pulses is sufficiently close to its perimeter value � .
of Ce activation levels should be studied to determine the op-timal activator concentration. Additionally, a set of analogouscrystals should be grown with Li-enriched and Li-depletedcompounds in order to determine parameters such as the thermalneutron sensitivity and light yield, ratio, etc. A separateinvestigation should be also dedicated to the problem of neu-tron-gamma discrimination in this material.
APPENDIX
The use of synchrotron pulses of high repetition frequency forsample excitation may cause the overlaying of emission decaypulses excited by present and multiple past excitation pulses.This also makes it difficult to extract slowly decaying pulsesfrom a flat background level.
Let us first consider the simplest case of single-exponentialemission pulse characterized by amplitude and decaytime constant :
(2)
Fig. 11 provides an illustration of such pulse-measurement ex-perimental conditions—with the use of synchrotron light exci-tation whose pulses are pictured in part (a) of the figure. If thedecay time of the measured emission is short in comparison totime interval in between excitation pulses, the emissionbasically manages to decay completely before the consecutiveexcitation pulse arrives. Such emission pulses do not overlapeach other (b). However, if the decay of the measured emissionis long enough (c), the emission pulse emitted after the secondexcitation adds to the “tail” portion of the pulse emitted earlier.After a third excitation, “tail” portions of two former emissionpulses add to the pulse currently excited, etc.

WISNIEWSKI AND BOATNER: SCINTILLATION PROPERTIES AND TIME-RESOLVED SPECTROSCOPY 3817
Not surprisingly, the detection system cannot distinguish pho-tons originating in different pulses. As a result, after excita-tion pulses, the detection system in channel “ ” of multi channelanalyzer (MCA) “sees” a pulse given by:
(3)
Consequently, after a high number of excitations, the decaytime constant of the observed pulse does not change, but theamplitude that is measured depends on the ratio of and
:
(4)
This alteration of measured amplitude certainly does not matterif the emission pulse is single-exponential (since, in fact, some-thing proportional to the real amplitude, not the exact value, ismeasured anyway). However, in the case of a multi-componentpulse (with -th component real amplitude and decayconstant ), the measured amplitude of each component scalesindependently, and the measured pulse can then be described asfollows:
(5)
Naturally, one has to delay the start of a measurement to getN high enough to allow the amplitude of the slowest componentto reach its perimeter value. In practice, with ns(at Superlumi, DESY), the above condition is always fulfilled,since even for components decaying in the tens of millisecondsrange, the delay of a fraction of a second is long enough. It iseasy to calculate that for , the measured amplitudeis equal to , for one gets , and
brings , etc.If the results of fitting a multi-exponential curve (i.e., fit
values of and ) are used to compute the individual con-tributions of a particular component in the total emission pulse,a correction has to be made to take into account the describedalteration of each component’s amplitude. A contributionof -th component in the total pulse is then given by:
%
% (6)
If all “measured” amplitudes and time constant values canbe taken from fits, it is easy to compute real amplitudes andcontributions . However, often a long luminescence decaycomponent might be hidden in a flat, background-looking level. In spite of inability to directly fit this componentamplitude and decay time constant, it is still possible to findthis component contribution in the total pulse. If we assume that
, that stands for difference of the fit background-looking leveland real background (e.g., measured with closed excitation
beam), taken at time after the beginning of the emission pulse,is caused by the slow component with “measured” amplitude
, it becomes possible to express that amplitude as:
(7)
Therefore, one can express slow component integraland contribution in total pulse , as follows:
(8)
%
(9)
Both and can be considered as functions thatdepend on only one variable— . All the other parametersare known from fits, chosen arbitrary ( ns) or fixed bythe experimental setup ( ns).
Fig. 12 shows results of simulations based on(9) for selected pulses presented earlier in this work andvarying in the range from 200 ns to 1 s. While only part of theresults is presented in the figure, it should be noted that for allmeasured pulses both and reach their parame-ters very fast. In practice for s, over six orders of
magnitude, changes of are limited to less than 2%.For 200 ns s the value of grows a fewadditional percent with decreasing , but in this rangewould result in visible (and fitable) slope in measured pulses.Interestingly for each measured pulse convergesto a value of its particular multiplied by 192 ns. This result,somewhat surprising at first, becomes clear when more thoughtis devoted to the fact that measured aggregate pulses contain“delayed” parts of all the pulses excited earlier at regular in-tervals. Consequently, each measured sum of pulse fragmentsin practice contains the whole integral of the pulse—no matterwhat the decay time is.

3818 IEEE TRANSACTIONS ON NUCLEAR SCIENCE, VOL. 56, NO. 6, DECEMBER 2009
Fig. 12. Results of �� simulation for varying � for selected emissionpulses.
ACKNOWLEDGMENT
D. Wisniewski would like to thank Prof. G. Zimmerer andhis group for their hospitality and assistance in performing theexperiments at Superlumi Station of Hasylab in Hamburg. Thehelp of Prof. A. J. Wojtowicz, Dr. W. Drozdowski, and S. Janusfrom N. Copernicus University, who took part in the Hasylabexperiments is also gratefully acknowledged. The authors thankProf. Ch. Melcher from University of Tennessee for his hospi-tality and granting access to his radioluminescence measure-ment setup. The authors would also like to acknowledge thework of Dr. J. M. Farmer, who was involved in fabrication ofthe studied materials.
REFERENCES
[1] [Online]. Available: http://neutrons.ornl.gov/aboutsns[2] [Online]. Available: http://neutron.neutron-eu.net/n_ess[3] C. W. E. van Eijk, A. Bessiere, and P. Dorenbos, “Inorganic thermal-
neutron scintillators,” Nucl. Instrum. Methods Phys. Res. A, vol. A529,pp. 260–267, Dec. 2004.
[4] M. D. Birowosuto, P. Dorenbos, J. T. M. de Haas, C. W. E. van Eijk,K. W. Kramer, and H. U. Gudel, “Li-based thermal neutron scintillatorresearch; Rb LiYBr :Ce and other elpasolites,” IEEE Trans. Nucl.Sci., vol. 55, no. 3, pp. 1152–1155, Jun. 2008.
[5] W. W. Moses, M. J. Weber, S. E. Derenzo, D. Perry, P. Berndahl, andL. A. Boatner, Y. Zhiwen, F. Xiqi, L. Peijun, and X. Zhilin, Eds., “Re-cent results in a search for inorganic scintillators for X- and gamma-raydetection,” in Proc. Int. Conf. Inorganic Scintillators and Their Appli-cations, Shanghai, China, 1997, pp. 358–361.
[6] A. J. Wojtowicz, D. Wisniewski, W. Drozdowski, J. M. Farmer, and L.A. Boatner, K. Neyts, P. de Visschere, and D. Poelman, Eds., “Vacuumultraviolet studies of new phosphor material, Rb Lu(PO ) :Ce,” inProc. Int. Conf. Science and Technology of Emissive Displays andLighting, Ghent, Belgium, 2002, pp. 73–76.
[7] D. Wisniewski, A. J. Wojtowicz, W. Drozdowski, J. M. Farmer,and L. A. Boatner, “Rb Lu(PO ) :Ce and Cs Lu(PO ) :Ce—newpromising scintillator materials,” Cryst. Res. Technol., vol. 38, no.3–5, pp. 275–282, Apr. 2003.
[8] D. Wisniewski, A. J. Wojtowicz, W. Drozdowski, J. M. Farmer, and L.A. Boatner, “Scintillation and luminescence properties of Ce-activatedK Lu(PO ) ,” J. Alloys Comp., vol. 380, no. 1–2, pp. 191–195, Oct.2004.
[9] J. S. Neal, L. A. Boatner, M. Spurrier, P. Szupryczunski, and Ch. L.Melcher, “Cerium-doped mixed-alkali rare-earth double phosphatescintillators for thermal neutron detection,” Nucl. Instrum. MethodsPhys. Res. A, vol. A579, no. 1, pp. 19–22, Aug. 2007.
[10] S. V. Ushakov, A. Navrotsky, J. M. Farmer, and L. A. Boatner,“Thermochemistry of the alkali rare-earth double phosphates,A RE(PO ) ,” J. Mater. Res., vol. 19, no. 7, pp. 2165–2175, Jul.2004.
[11] L. A. Boatner, L. A. Keefer, J. M. Farmer, D. Wisniewski, and A. J.Wojtowicz, “Cerium-activated rare-earth orthophosphate and double-phosphate scintillators for x- and gamma-ray detection,” in Proc. SPIE,Aug. 2004, vol. 5540, pp. 73–87.
[12] L. M. Bollinger and G. E. Thomas, “Measurement of the time depen-dence of scintillation intensity by a delayed coincidence method,” Rev.Sci. Instrum., vol. 32, no. 9, pp. 1044–1050, Sept. 1961.
[13] D. Wisniewski, L. A. Boatner, J. O. Ramey, M. Wisniewska, J. S. Neal,and G. E. Jellison, “Exploratory research on the development of novelCe-activated phosphate glass scintillators,” IEEE Trans. Nucl. Sci., vol.55, no. 6, pp. 3692–3702, Dec. 2008.
[14] G. Zimmerer, “Status report on luminescence investigations with syn-chrotron radiation at HASYLAB,” Nucl. Instrum. Methods Phys. Res.A, vol. A308, no. 1–2, pp. 178–186, Oct. 1991.
[15] [Online]. Available: http://hasylab.desy.de/facilities/doris_iii/beam-lines/i_superlumi
[16] A. J. Wojtowicz, E. Berman, and A. Lempicki, “Stoichiometric ceriumcompounds as scintillators, II. CeP O ,” IEEE Trans. Nucl. Sci., vol.39, no. 5, pp. 1542–1548, Oct. 1992.
[17] A. J. Wojtowicz, A. Lempicki, D. Wisniewski, and L. A. Boatner,“Cerium-doped orthophosphate scintillators,” in Proc. MaterialsResearch Society Symp., 1994, vol. 348, pp. 123–129.
[18] National Nuclear Data Center, Evaluated Nuclear Data File [Online].Available: http://www.nndc.bnl.gov
[19] D. J. Robbins, “The effect of crystal field and temperature on the photo-luminescence excitation efficiency of Ce in YAG,” J. Electrochem.Soc.: Solid-State Sci. Technol., vol. 126, no. 9, pp. 1550–1555, Sep.1979.
[20] D. Wisniewski, “Luminescence and Scintillation Properties of LuAlOand LuAlO :Ce Crystals,” Ph.D. disseration, Nicolaus CopernicusUniversity, Torun, Poland, 1998, P. 115 (in Polish).
[21] D. Wisniewski, “VUV excited emission pulse shapes of LuAlO :Ce,”J. Alloys Compounds, vol. 300–301, pp. 483–487, Apr. 2000.
[22] A. J. Wojtowicz, P. Szupryczynski, J. Glodo, W. Drozdowski, andD. Wisniewski, “Radioluminescence and recombination processes inBaF :Ce,” J. Phys.: Condens. Matter, vol. 12, no. 17, pp. 4097–4124,May 2000.
[23] A. J. Wojtowicz, P. Szupryczynski, D. Wisniewski, J. Glodo,and W. Drozdowski, “Electron traps and scintillation mechanismin LuAlO :Ce,” J. Phys. Condens. Matter, vol. 13, no. 42, pp.9599–9619, Oct. 2001.
[24] A. R. Spowart, “Energy transfer in cerium-activated silicate glasses,” J.Phys. C: Solid State Phys., vol. 12, no. 16, pp. 3369–3374, Aug. 1979.


![RPID — A new digital particle identification …...doped cesium iodine (CsI(Tl)) crystals can be used for particle identification [1]. The scintillation process in this scintillator](https://img.pdfslide.us/doc/110x75/5f9695e5dfbf262b4160331a/rpid-a-a-new-digital-particle-identiication-doped-cesium-iodine-csitl.jpg)