Embed Size (px)
Citation preview

SCIENTOMETRIC ANALYSIS OF RESEARCH
COMPETITIVENESS OF COUNTRIES,
INSTITUTIONS AND SUBJECTS
Supervised By
Dr Vivek Kumar Singh
Assistant Professor
Department of Computer Science
South Asian University
Presented By :
Khushboo Singhal Sumit Kumar Banshal
Roll No. SAU/CS(M)/2013/005 Roll No. SAU/CS(M)/2013/018
Department of Computer Science Department of Computer Science
South Asian University South Asian University
5/17/2015

Outline
Introduction
Questions we Aimed to Answer
Country/Region Level Analysis
Institution Level Analysis
Fine Grained Research Theme based Analysis
Scientometric & Indicators
Derived Indicators
Bibliographic Databases
Our Work
Regional Analysis
Institution Level Analysis
Fine Grained Research Theme based Analysis
Challenges
Publication Out of this Work
Selected Bibliography

Introduction
Scientometric Assessment of Research Competitiveness is
distributed in three different aspects:
Country/Region Level Analysis
South Asia
Bangladesh
India
Institution Level Analysis
Top 100 world institutes
Central Universities (CU)
Indian Institute of Technology (IIT)
Fine Grained Research Theme based Analysis
Big Data

Questions we Aimed to Answer
Can IT infrastructure be mapped with CS research output from South Asian countries?
Can we analyze the CS research output stand of Bangladesh?
Can we visualize the CS research output stand of India?
Can we characterize the leading World Institutes ?
Can we map the proportionate contribution of CU in India and rank CU accordingly?
Can we rank IIT based on research output & characterize the research ?
Can this methodology be characterized in narrow research theme?

Country/Region Level Analysis
South Asia (SA)
Mapping IT infrastructure with CS Research Output
Bibliographic data from Web of Science for SA
Countries
Afghanistan, Bangladesh, Bhutan, India, Maldives, Nepal,
Pakistan, Sri Lanka
For the period 1989-2013
Standings of SA Countries in IT
Total 15,841 records (15,810 unique)

Country/Region Level Analysis contd…
Bangladesh
Insight look on Country’s Research Output
Trends, Author Ship Patterns, Top Contributors
Bibliographic data from Scopus
For the period 1989-2013
Total 3200 records (3193 unique)

Country/Region Level Analysis contd…
India Insight look on Country’s Research Output
Trends, Author Ship Patterns, Top Contributors
Bibliographic data from Scopus
For the period 1989-2013
Total 84385 records
100 institutions
61502 records (72% of Total Data)
59682 unique records

Institution Level Analysis
Top 100 CS Research Producing Institutes of the
World (W-100)
Measuring Research Competitiveness of W-100
Characterizing Research Trends
Implementing Composite Rank
Bibliographic data from Web of Science
For the period 1999-2013
Total 261,154 records
251,312 unique records

Institution Level Analysis contd…
Central Universities in India (CU)
39 Central Universities (http://mhrd.gov.in/)
Measuring Contribution to Indian Research
Rank Institute based on Research Strengths
Identifying Trends & Themes in Research
For the period 1990-2014
Total 64302 records
63776 unique records
Each record comprises of 60 attributes

Institution Level Analysis contd…
Indian Institutes of Technology (IIT)
16 IIT (https://www.iitsystem.ac.in/IITCouncil.jsp)
Measuring Contribution to Indian Research
Rank IIT based on Research Strengths
Identifying Trends & Themes in IIT Research
For the period 1990-2014
Total 81588 records
80991 unique records
Each record comprises of 60 attributes

Big Data
Characterizing Research Output from Narrow Discipline
Fine-Grained Research Theme Mapped into Scientometric
Methodology
Emerging Topic since 2005s
Collected Data from Scopus & WOS
For the Period 2010-2014
Total Records
WOS:- 1415 (60 Fields)
Scopus:- 6810 (41 Fields)
Fine Grained Research Theme based Analysis

Scientometric & Indicators
Composition of science and metrics
Study of measuring and analyzing science, technology and innovation
Measure scientific research and impact of the research in scientific communities
Research include qualitative and quantitative approaches
Direct Indicators Derived Indicators
Total Publications Co-authorship Highly Cited Papers (HiCP)
No. of Words No. Of References Average Citation Per Paper (ACPP)
Citation Counts Internationally Collaborated papers (ICP)
H-index G-index Hg-index P-index

Derived Indicators
Highly Cited Papers (HiCP)
HiCP indicator refers to those papers that are among the 10% most cited papers worldwide in a particular year. For this, first find the citation threshold for the top 10% cited papers worldwide in a domain. Obtain the number of HiCP papers for each institute for each year by
here, y: year, p: paper, TPy : total number of papers in the year, Cy,p : number of citations for a paper in the year and Ɵy :citation threshold for HiCP for the year
More HiCP papers indicate that research output with high impact.
Average Citation Per Paper (ACPP)
ACPP is the ratio of Total Publication (TP) to Total Citation (TC) formulated as,
where, Cn is the number of citations for a given paper n. TP is the total number of such publications.
Internationally Collaborated Papers (ICP)
Internationally collaborated paper refers to those papers having at least two authors who are from two different countries. There may be more authors in the author group but at least one author must be from different country to those of others.

Derived Indicators
H-index
The H-index (Hirsch, 2005) is an index that aims to measure both the productivity and citation impact of the published work. The index is based on the set of the scientist's most cited papers and the number of citations that they have received in other publications.
A scientist has index h if h of his/her Np papers have at least h citations each, and the other (Np − h) papers have no more than h citations each.
G-index
The G-index is an index based on publication records for quantifying scientific productivity. G-index (Egghe, 2006) is calculated based on the distribution of citations received by a given researcher's publications:
Given a set of articles ranked in decreasing order of the number of citations that they received, the g-index is the (unique) largest number such that the top g articles received (together) at least g2 citations
HG-index
HG-index is composite of H-index and G-index. To overcome the disadvantages of both indices, HG-index was introduced. The HG-index (Alonso et al., 2010) is computed as:
where, H and G are H-index and G-index.

Derived Indicators
P-index
P-index is well known for giving best balance between the quantity and quality. P-index
(Prathap, 2010) is computed as:
Here, P is total number of papers and C is total citations.
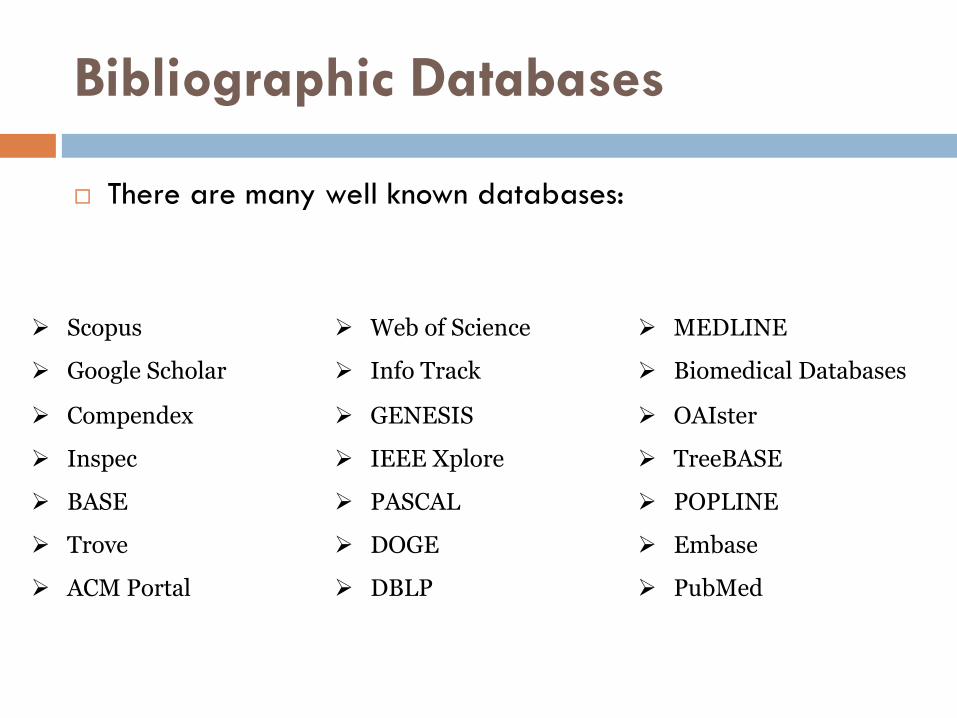
Bibliographic Databases
There are many well known databases:
Scopus Web of Science MEDLINE
Google Scholar Info Track Biomedical Databases
Compendex GENESIS OAIster
Inspec
BASE
IEEE Xplore
PASCAL
TreeBASE
POPLINE
Trove DOGE Embase
ACM Portal DBLP PubMed

Selected Databases
WOS
Depth of Coverage (90 million records of 250+ disciplines)
12,000 journals proceedings
160,000 conference proceedings
Specific Criteria to Select Journal
Indexing Service
Attributes in tag format (all tags)
Sample Data
Scopus
50 million records
Easy to navigate
Widely Acclaimed Indexing Service as well as publishing house
Sample data

Regional Analysis –SA
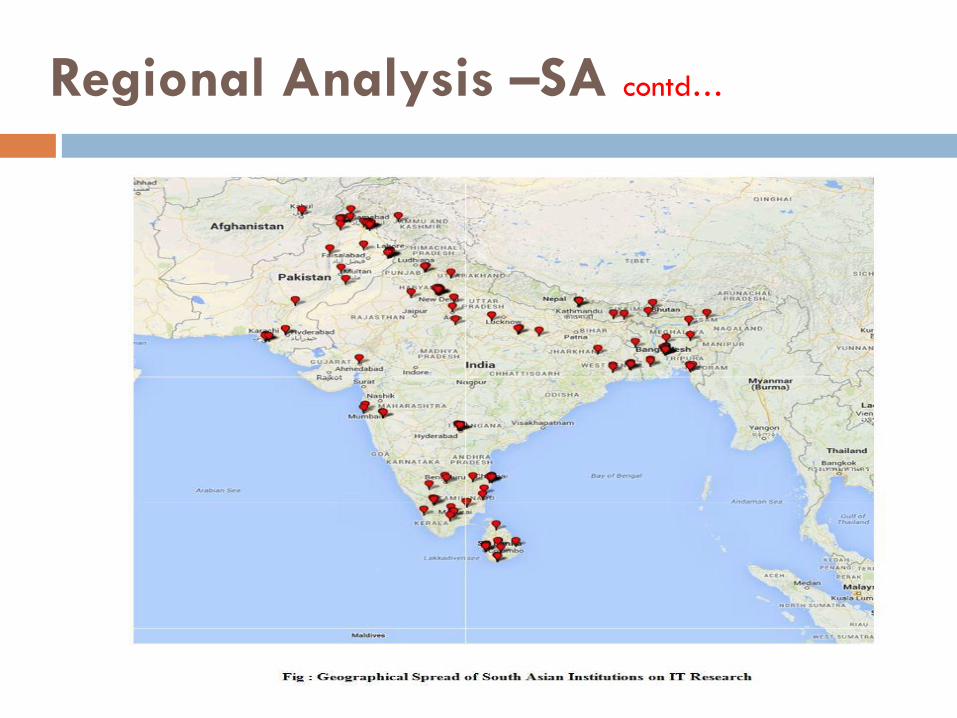
Regional Analysis –SA contd…

Regional Analysis –SA contd…

Regional Analysis –SA contd…

Country Profiling – Bangladesh

Country Profiling – Bangladesh contd…

Country Profiling – Bangladesh contd…

Country Profiling – Bangladesh contd…

Country Profiling – India

Country Profiling – India contd…

Country Profiling – India contd…

Country Profiling – India contd…

Institution Level Analysis- W100
Measuring Research Competitiveness
Identify Thematic Trends
Rank Institution Based on Composite Indicators
Rank Institution Based on Thematic Strength
Based on Research Strength & Trends
Based on both Qualitative & Quantitative Indicators
One part based on Scientometrics
Other part merged Text with Scientometrics
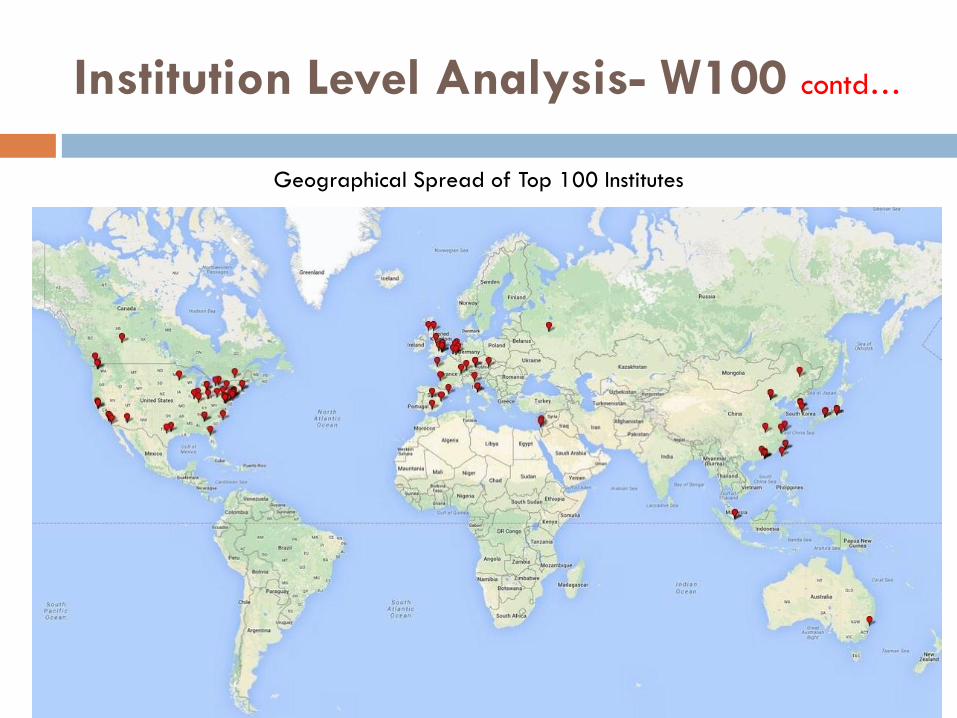
Institution Level Analysis- W100 contd…
Geographical Spread of Top 100 Institutes
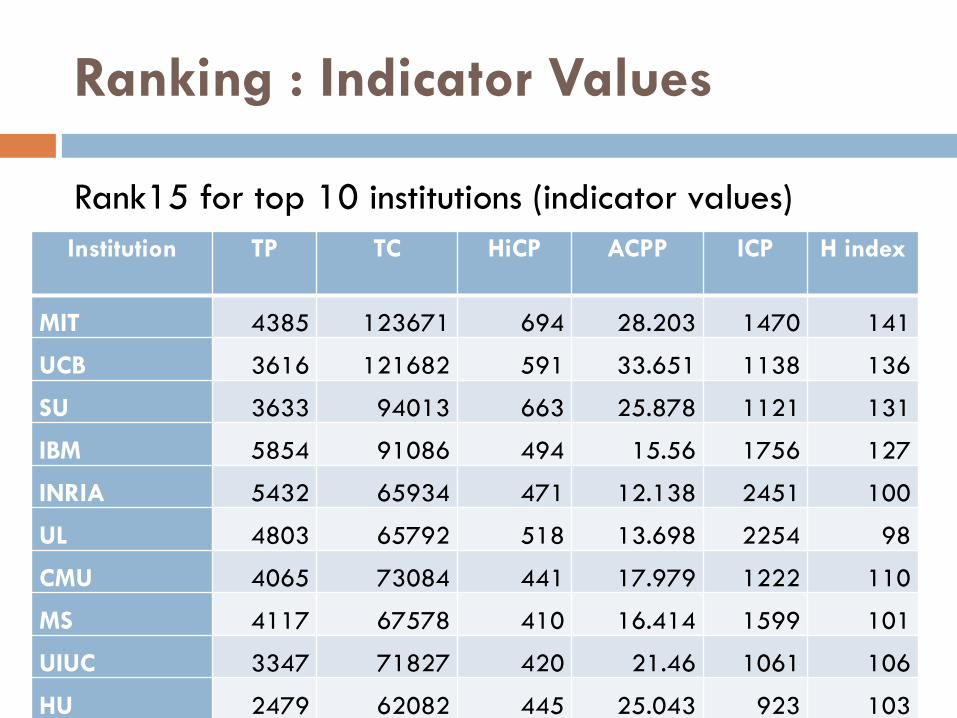
Ranking : Indicator Values
Rank15 for top 10 institutions (indicator values)
Institution TP TC HiCP ACPP ICP H index
MIT 4385 123671 694 28.203 1470 141
UCB 3616 121682 591 33.651 1138 136
SU 3633 94013 663 25.878 1121 131
IBM 5854 91086 494 15.56 1756 127
INRIA 5432 65934 471 12.138 2451 100
UL 4803 65792 518 13.698 2254 98
CMU 4065 73084 441 17.979 1222 110
MS 4117 67578 410 16.414 1599 101
UIUC 3347 71827 420 21.46 1061 106
HU 2479 62082 445 25.043 923 103

Institution Level Analysis- W100 contd…
Normalized Score
Measuring Relative Performance
Range : 0 to 100
Here, : maximum raw value among all the institutions for the indicator, i
Composite Score of All Indicators
Simple Average
Ranking Computed In Three Blocks
15 years (Rank15) : Whole Period i.e. , 1999-2013
10 years (Rank 10 ) : 2004-2013
5 years (Rank5) : 2009-2013

Institution Level Analysis- W100 contd…
Rank15 for top 10 institutions (normalized values and
rank)
Institution TP Score HiCP
Score
ACPP
Score
ICP
Score
H-Index
Score
Avg.
Score
Rank15
MIT 40.2 72.7 83.8 34.4 100 66.22 1
UCB 33.1 61.9 100 26.6 96.5 63.62 2
SU 33.3 69.5 76.9 26.2 92.9 59.76 3
IBM 53.7 51.8 46.2 41.1 90.1 56.58 4
INRIA 49.8 49.4 36.1 57.4 70.9 52.72 5
UL 44 54.3 40.7 52.7 69.5 52.24 6
CMU 37.3 46.2 53.4 28.6 78 48.7 7
MS 37.7 43 48.8 37.4 71.6 47.7 8
UIUC 30.7 44 63.8 24.8 75.2 47.7 9
HU 22.7 46.6 74.4 21.6 73 47.66 10

Institution Level Analysis- W100 contd…
Impact of Indicator on Ranks
Correlation between Rank15 & Individual Indicators i.e., TP, ACCP and So On.
Impact of One Indicator on Other Indicator
Correlation between TP & ACPP, HiCP, H-Index, ICP and vice versa.
Correlation between Ranks
Spearman Rank Correlation
Here,
K :the size of the ranked sets;
s1,j
and s2,j
: Rank positions of institutions in
the two ranking R1 and R2.
R1 as the computed rank
R2 as indicator-based rank

Institution Level Analysis- W100 contd…
Spearman Rank Correlation between Rank15 and
individual indicators

Institution Level Analysis- W100 contd…
Spearman Rank Correlation between five indicator-
ranks for 100 institutions

Institution Level Analysis- W100 contd…
Correlation between ranks

Institution Level Analysis- W100 contd…
Identifying Themes of Research
Rank based on Themes
One Institute may be Better in one Specific Area, not for all.
11 Broader Themes in CS Research
Gives a Fine Grained Ranking

Institution Level Analysis- W100 contd…
Flow Diagram of Text Classification
Acronym Full Name
AI Artificial Intelligence
CT Computation Theory
CHA Computer Hardware & Architecture
CN Computer Networks
CSA Computer Software & Applications
CG Cryptography
DBMS Database Management System
IM Internet & Multimedia
OS Operating System
SIP Signal & Image Processing
SE Software Engineering
Thematic Areas with Full Name
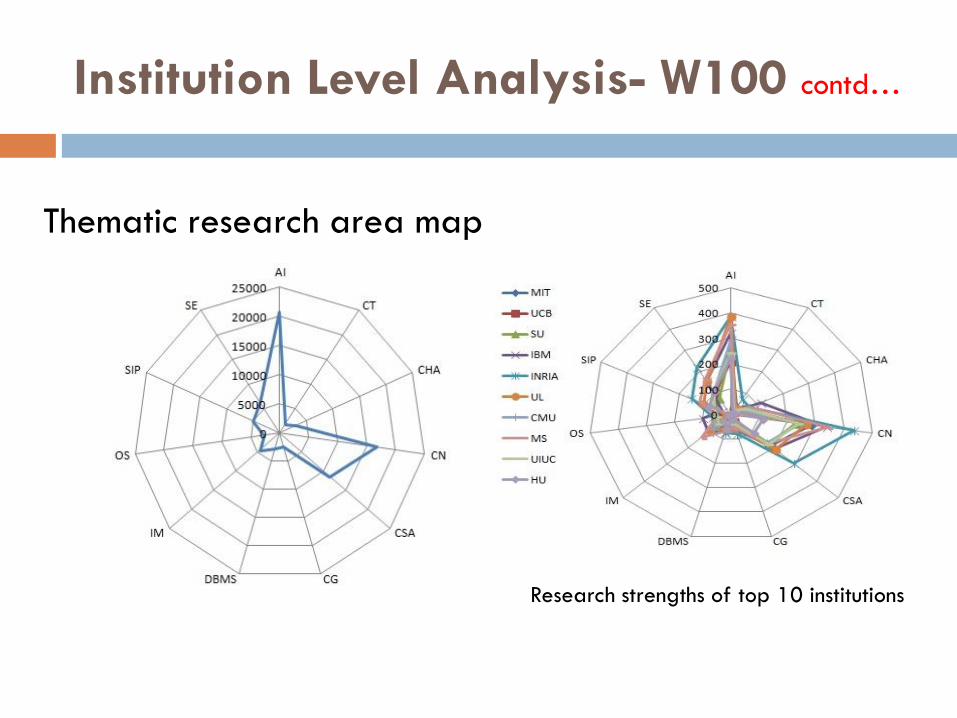
Institution Level Analysis- W100 contd…
Thematic research area map
Research strengths of top 10 institutions

Institution Level Analysis- W100 contd…
Thematic area wise composite Rank15
Institution Rank15
AI CT CHA CN CSA CG DBMS
IM
OS
SIP
SE
MIT 1 15 5 23 26 14 17 6 13 19 25 9
UCB 2 4 16 9 4 4 18 18 25 14 5 3
SU 3 33 14 21 12 16 35 21 10 42 31 19
IBM 4 29 83 4 24 25 14 13 19 9 34 14
INRIA 5 9 6 1 1 5 1 5 4 2 9 2
UL 6 12 7 36 11 9 8 7 12 16 4 6
CMU 7 25 12 13 19 10 20 28 22 15 35 16
MS 8 6 78 11 18 28 21 9 5 21 8 15
UIUC 9 21 52 22 28 19 28 27 26 22 7 26
HU 10 11 61 35 15 17 42 4 7 58 29 5

Identifying Trends in Research
Measuring Contribution to Indian Research
Identifying Authorship Patterns
Institution Level Analysis- CU
39 CU on a Geographical Map Proportionate share of 39 CU to total Research
Output

Institutional Level Analysis- CU contd…
Total Research Output of 39 CU (year-wise)

Institutional Level Analysis- CU contd…
Distribution of Research output among 39 CU
1990-2014 2010-2014

Institutional Level Analysis- CU contd…
Output- Faculty Strength Plot (2010-2014 period)

Institutional Level Analysis- CU contd…
Plot for ACPP and HiCP of 39 CU (year-wise)

Institutional Level Analysis- CU contd…
Multi Authorship Growth ICP Growth
Institutional Level Analysis- CU contd…
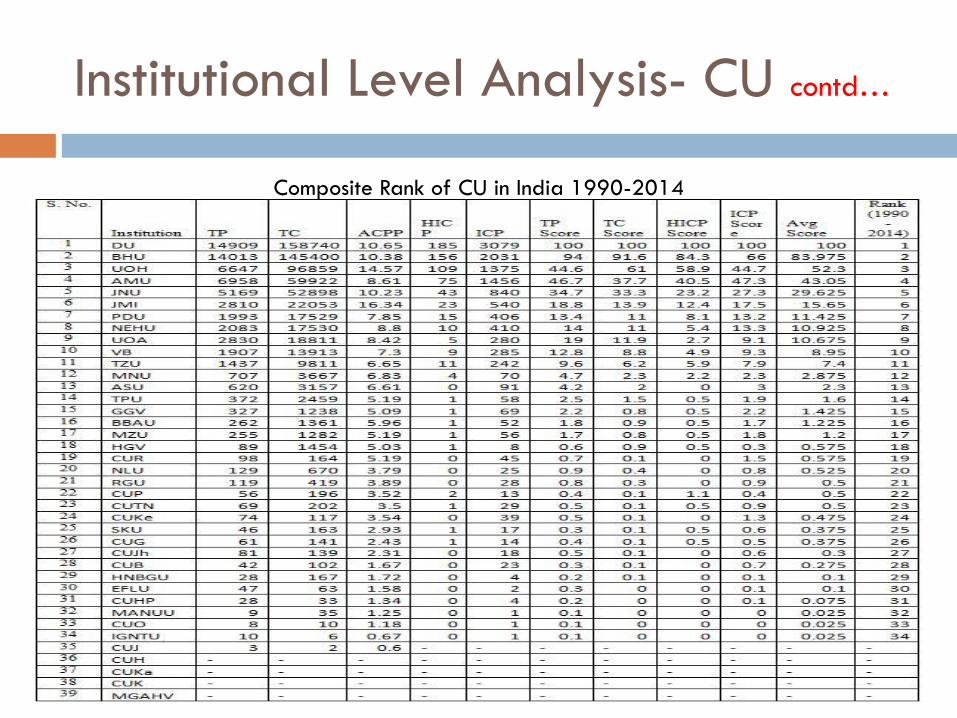
Composite Rank of CU in India 1990-2014

Composite Rank of CU in India 2010-2014
Institutional Level Analysis- CU contd…
All Rank Results

H-Index of Top CU in India Exergy Curve for Selected CU of India
Institutional Level Analysis- CU contd…
Exergy= Pi2 = P* (C/P) 2 = C2/P

Institutional Level Analysis- CU contd…
Discipline-wise Research Output Positions
1990-2014
Discipline-wise Research Output

Institutional Level Analysis- IIT
Rank Institute based on Research Strengths
Identifying Trends in Research
Measuring Contribution to Indian Research
Identifying Authorship Patterns
Identifying Thematic Research Strength
16 IIT on a Geographical Map
Proportionate share of 16 IIT to total Research Output

Institutional Level Analysis- IIT contd…
Total Research Output of 16 IIT
Cited Percentage of Research Output of 16 IIT and India
IITKGP- most prominent over
the years followed by IITM, IITB
& IITD
Citedness (Cited %) of IIT
papers is quite higher than
Indian total research

Institutional Level Analysis- IIT contd…
Research Output- Faculty Strength Plot (2010-2014 period)

Institutional Level Analysis- IIT contd…
Distribution of Research output among 16 IIT
1990-2014 2010-2014

Institutional Level Analysis- IIT contd…
Plot for ACPP and HiCP of 16 IIT Contributes in India

Institutional Level Analysis- IIT contd…
Multi Authorship Growth ICP Growth

Institutional Level Analysis- IIT contd…
Composite Rank of IIT 2010-2014

Institutional Level Analysis- IIT contd…
Composite Rank of IIT 1990-2014
All Rank Results

Institutional Level Analysis- IIT contd…
H-Index of Top IIT Exergy Curve for Selected IIT

Institutional Level Analysis- IIT contd…
Discipline-wise Research Output Positions Discipline-wise Research Output

Fine Grained Research Theme Level
Analysis- Big Data
Research Output, Relative Growth Rate (RGR) and Doubling Time (DT)
Characterizing Research Output from Narrow Discipline
Fine-Grained Research Theme Mapped into Scientometric Methodology
Mapping Research Theme in Scientometric Indicators & Metrics
Research Growth, Trends, Themes etc Plotted

Fine Grained Research Theme Level
Analysis- Big Data contd…
Country-wise Research Output
Fine Grained Research Theme Level
Analysis- Big Data contd…
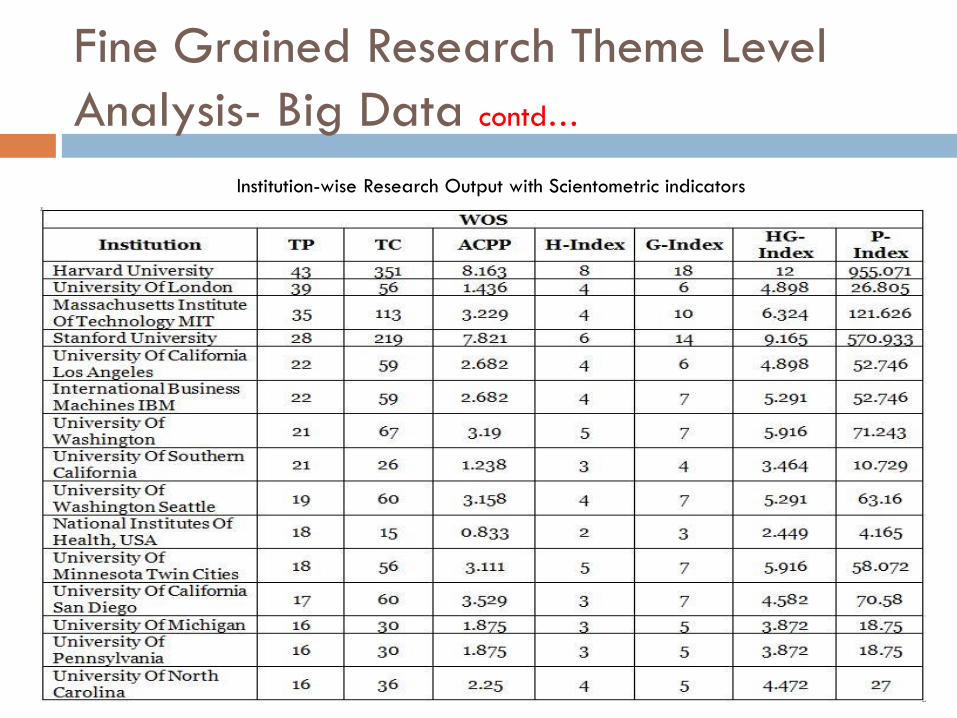
Institution-wise Research Output with Scientometric indicators

Fine Grained Research Theme Level
Analysis- Big Data contd…
Most Productive Authors (WOS data)
Author Cliques for Author Chen JJ
6 Authors from top 25 authors group size of 32

Fine Grained Research Theme Level
Analysis- Big Data contd…
Discipline-wise Distribution of Research Output (WOS data)

Fine Grained Research Theme Level
Analysis- Big Data contd…
Controlled Term Based Output Analysis

Fine Grained Research Theme Level
Analysis- Big Data contd…
Controlled Term Based Theme Density Plot (WOS Data)

Challenges
No Standard Datasets
Semi Structured Data
Regular Updates in Databases
High Subscription Rate of Indexing Services
Switching Affiliations
Affiliations not in Identical Format
Data Format Varies in Databases

Publications Out of this Work
Published:
Singhal, K., Banshal, S. K., Uddin, A., & Singh, V. K. (2014). The information technology knowledge infrastructure and research in South Asia. Journal of Scientometric Research, 3(3), 134. http://www.jscires.org/text.asp?2014/3/3/134/153578
Banshal, S. K., Singhal, K., Uddin, A., & Singh, V. K. (2014). Mapping Computer Science research in Bangladesh. In Proceedings of 8th International Conference on Software, Knowledge, Information Management and Applications (SKIMA), Dhaka, Bangladesh, IEEE XPLORE (pp. 1-7)http://ieeexplore.ieee.org/xpls/abs_all.jsp?arnumber=7083526.
Banshal, S. K, Uddin, A. and Singh, V. K. (2015), Identifying Themes and Trends in CS Research Output from India, In Proceedings of International Conference on Cognitive Computing and Information Processing (CCIP), Noida, India, IEEE XPLORE (pp. 1-6) http://ieeexplore.ieee.org/stamp/stamp.jsp?tp=&arnumber=7100742.
Accepted/Submitted:
Singh, V. K., Banshal, S. K., Singhal, K. & Uddin, A., A Sciento-Text Framework for Fine-grained Characterization of the Leading World Institutions in Computer Science Research, Accepted to appear in 15th International Conference on Scientometrics and Informetrics (ISSI), Istanbul, Turkey, 29th June-3rd July, 2015.
Singh, V. K., Banshal, S. K., Singhal, K. & Uddin, A., Identifying Area Specific Strong Research Centers in the Leading World Institutions in Computer Science Research, Submitted to Atlanta Conference On Science and Innovation Policy, Atlanta, USA, 17th Sept. - 19th Sept., 2015.
Banshal, S. K., Singhal, K., Uddin, A., & Singh, V. K, Scientometric Mapping of Research on ‘Big Data’, Submitted to Journal of Scientometrics ISSN: 0138-9130 (Print) 1588-2861 (Online); Impact Factor (2013) : 2.274.

Selected Bibliography
Geraci, M., & Degli Esposti, M. (2011). Where do Italian universities stand? An in-depth statistical analysis of national and international rankings.
Scientometrics, 87(3), 667-681.
Hirsch, J. (2005). An index to quantify an individual's scientific research output. Proceedings of the National academy of Sciences of the United States of
America, 102, 16569-16572.
Uddin, A., & Singh, V. K. (2014). Mapping the Computer Science Research in SAARC Countries. IETE Technical Review, 31, 287-296.
Uddin, A. & Singh, V.K. (2015). A Quantity-Quality Composite Ranking of Indian Institutions in Computer Science Research. IETE Technical Review
(forthcoming) DOI: http://dx.doi.org/10.1080/02564602.2015.1010614
Singhal K, Banshal SK, Uddin A, Singh VK. The information technology knowledge infrastructure and research in South Asia. J Sci Res 2014;3:134-42
Banshal SK, Singhal K, Uddin A, Singh VK. & Sharmin MF. Mapping the Computer Science Research in Bangladesh. Proceedings of the 8 th International
Conference on Software, Knowledge, Information Management and Applications, Dhaka, Bangladesh, IEEE Xplore; Dec, 2014
Liu, N. & Liu, L. (2005). University rankings in China. Higher Education in Europe, 30, 217-227.
Ma, R., Ni, C. & Qiu, J. (2008). Scientific research competitiveness of world universities in computer science. Scientometrics, 76, 245-260.
Uddin, A. & Singh, V.K. (2014) Measuring research output and collaboration in South Asian countries. Current Science 107, 1.
Prathap, G. (2010). The 100 most prolific economists using the p-index. Scientometrics, 84(1), 167-172.
Egghe, L. (2006). An improvement of the h-index: The g-index. ISSI newsletter, 2(1), 8-9.
Alonso, S., Cabrerizo, F. J., Herrera-Viedma, E. and Herrera, F. (2010). hg-index: A new index to characterize the scientific output of researchers
based on the h-and g-indices. Scientometrics, 82(2), 391-400.
Karpagam, R., Gopalakrishnan, S., Babu, B.R. and Natarajan, M. (2012). Scientometric Analysis of Stem cell Research: A comparative study of
India and other countries. Collnet Journal of Scientometrics and Information Management, 6(2), 229-252.
Karpagam, R., Gopalakrishnan, S., Natarajan, M., and Babu, B.R. (2011). Mapping of nanoscience and nanotechnology research in India: a
scientometric analysis, 1990–2009. Scientometrics, 89(2), 501-522.