Embed Size (px)
Citation preview
Scientific Methods
8th Grade Earth and Space Science
Scientific Methods
• Scientists work in many different places to gather information and learn about the world around us.
• There is no one “scientific method”.• Series of problem solving strategies that help scientists conduct experiments.
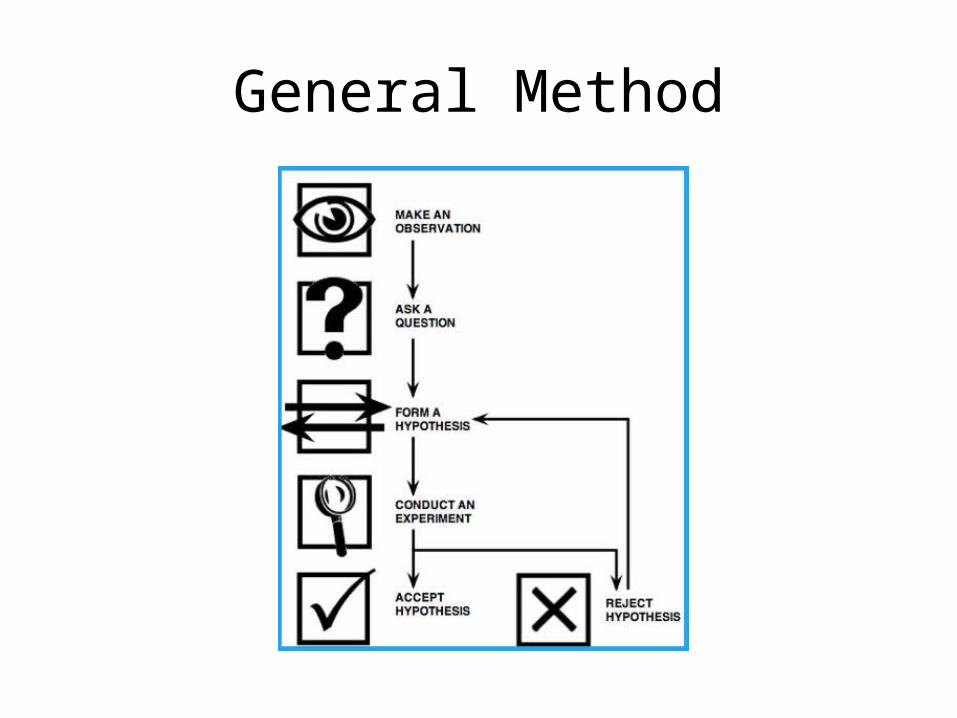
General Method
Hypotheses
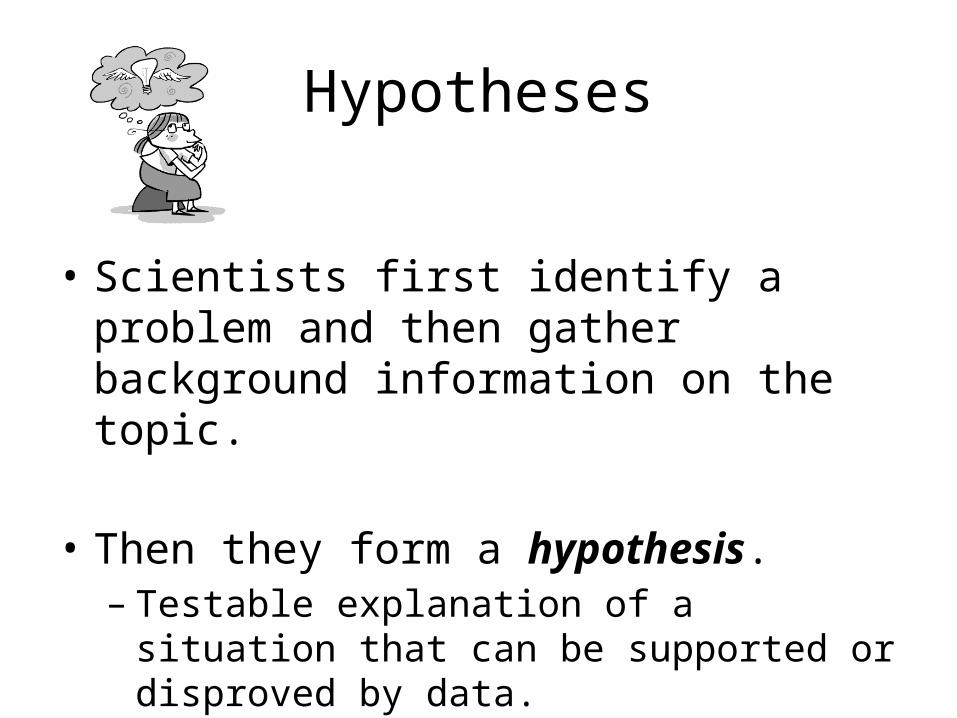
• Scientists first identify a problem and then gather background information on the topic.
• Then they form a hypothesis.– Testable explanation of a situation that can be
supported or disproved by data.
Experimentation• An experiment is an organized procedure that
makes observations and measurements to test a hypothesis.
• Experiments usually test only one variable at a time – the independent variable.
– Variable that is the only factor changed in an experiment.
Experimentation
• The dependent variable is the variable affected by changes in the independent variable.– This is what is measured or observed!
• Controls are factors that must be kept constant during an experiment so they do not affect the outcome.
• Control group is the part of the experiment that is given “normal” treatment and is used for comparison purposes.
• Experimental group is the group or groups being tested; they are “treated” with the independent variable.
Collecting Data• Data is the information collected during an
experiment.– Qualitative data – observations– Quantitative data – involves numbers
• Good experiments will collect different types of data.
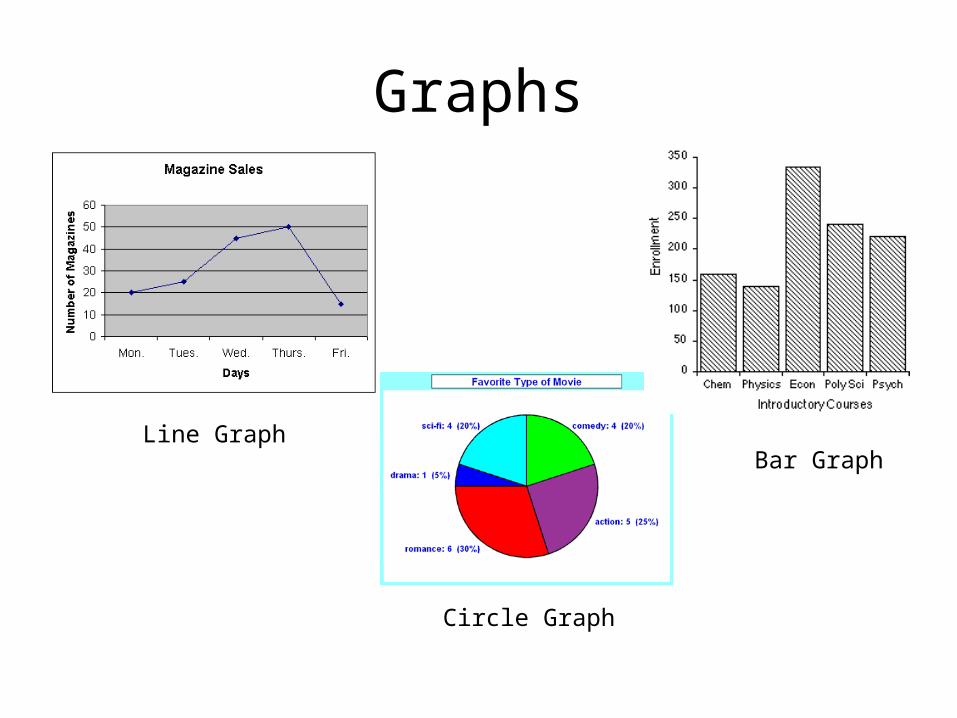
Graphs
• Graphs are used a lot of by scientists because they are an easy way to show relationships between data.
• There are three main types of graphs we will use:– Line graphs– Circle graphs– Bar graphs
Graphs
Line GraphBar Graph
Circle Graph
Analyzing Data
• After data is collected the hypothesis can be accepted or disproved.
• If the hypothesis is accepted it will be tested by other scientists to verify the results.
• If the hypothesis is disproved, then a new hypothesis will be formed and the process begins again!
Problem/Question
John watches his grandmother bake bread. He ask his
grandmother what makes the bread rise.
She explains that yeast releases a gas as it feeds
on sugar.
Problem/Question
John wonders if the amount of sugar used in the recipe will affect the size of the bread loaf?
Observation/ResearchJohn researches the areas
of baking and fermentation and tries to come up with a way
to test his question.He keeps all of his
information on this topic in a journal.
Formulate a HypothesisAfter talking with his
teacher and conducting further research, he
comes up with a hypothesis.
“If more sugar is added, then the bread will rise
higher.”
Independent Variable The independent, or manipulated
variable, is a factor that’s intentionally varied by the
experimenter.John is going to use 25g., 50g., 100g., 250g., 500g. of sugar in his
experiment.
Dependent Variable The dependent, or responding variable, is the factor that may change as a result of changes
made in the independent variable.In this case, it would be the size of
the loaf of bread.
Experiment
His teacher helps him come up with a
procedure and list of needed materials.
She discusses with John how to determine the
control group.
Control Group Because his grandmother always
used 50g. of sugar in her recipe, John is going to use that amount
in his control group.
ConstantsJohn’s teacher reminds him to
keep all other factors the same so that any observed
changes in the bread can be attributed to the variation in
the amount of sugar.
Can you think of some constants for this experiment?
ConstantsThey might include:
Other ingredients to the bread recipe, oven used, rise time, brand of ingredients, cooking
time, type of pan used, air temperature and humidity
where the bread was rising, oven temperature, age of the
yeast…
ExperimentJohn writes out his
procedure for his experiment along with a
materials list in his journal. He has both of
these checked by his teacher where she checks for any safety concerns.
Trials
Trials refer to replicate groups that are exposed to the same conditions in
an experiment.John is going to test each
sugar variable 3 times.
Collect and Analyze ResultsJohn comes up with a
table he can use to record his data.
John gets all his materials together and carries out his
experiment.
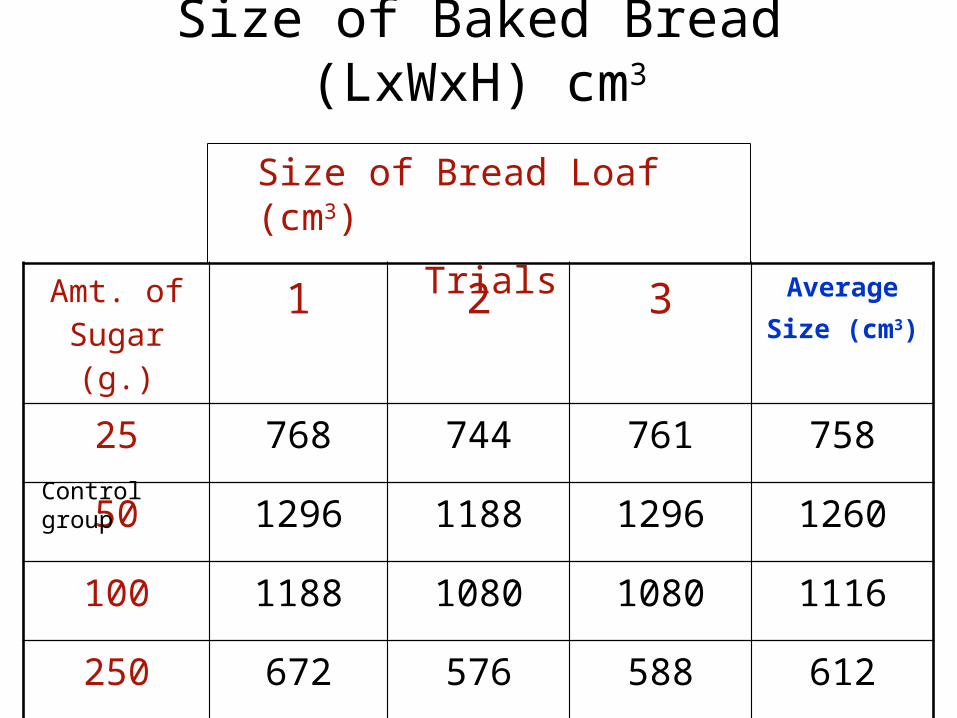
Size of Baked Bread (LxWxH) cm3
Amt. of Sugar (g.)
1 2 3 AverageSize (cm3)
25 768 744 761 758
50 1296 1188 1296 1260
100 1188 1080 1080 1116
250 672 576 588 612
500 432 504 360 432
Size of Bread Loaf (cm3)
Trials
Control group
Collect and Analyze ResultsJohn examines his data
and notices that his control worked the
best in this experiment, but not significantly better
than 100g. of sugar.
Conclusion
John rejects his hypothesis, but
decides to re-test using sugar amounts
between 50g. and 100g.
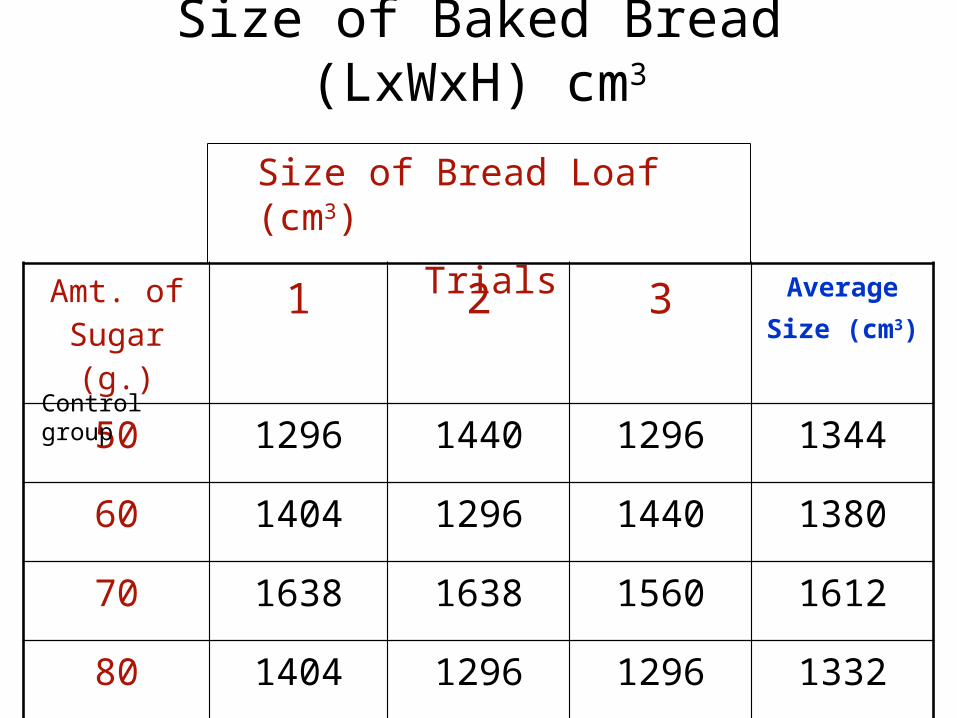
Size of Baked Bread (LxWxH) cm3
Amt. of Sugar (g.)
1 2 3 AverageSize (cm3)
50 1296 1440 1296 1344
60 1404 1296 1440 1380
70 1638 1638 1560 1612
80 1404 1296 1296 1332
90 1080 1200 972 1084
Size of Bread Loaf (cm3)
Trials
Control group
Conclusion
John finds that 70g. of sugar produces the
largest loaf.His hypothesis is
accepted.
Communicate the Results
John tells his grandmother about
his findings and prepares to present
his project in Science class.
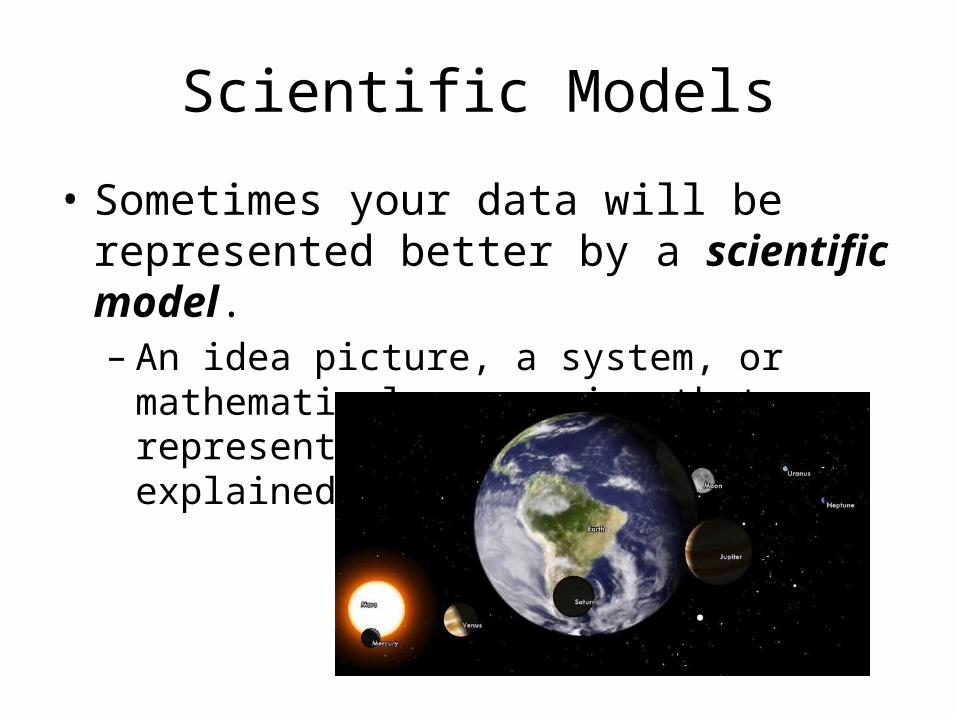
Scientific Models
• Sometimes your data will be represented better by a scientific model.– An idea picture, a system, or mathematical
expression that represents the idea being explained.
Scientific Theories and Laws• Scientific theories are explanations based on
many observations during repeated investigations.– Think of it as the “best available explanation”.– Big Bang Theory
• Scientific laws are principles that describes the behavior of a natural phenomenon.– Cause of the law is not always known– Theories are often used to explain laws.– Newton’s Laws of Motion, Universal Law of Gravitation