Embed Size (px)
Citation preview

Scientific Inquiry involves a process or series of steps that are used to
investigate a natural
occurrence.
We will take a closer look at
these steps and the terminology you will need to
understand before conducting a
scientific investigation.
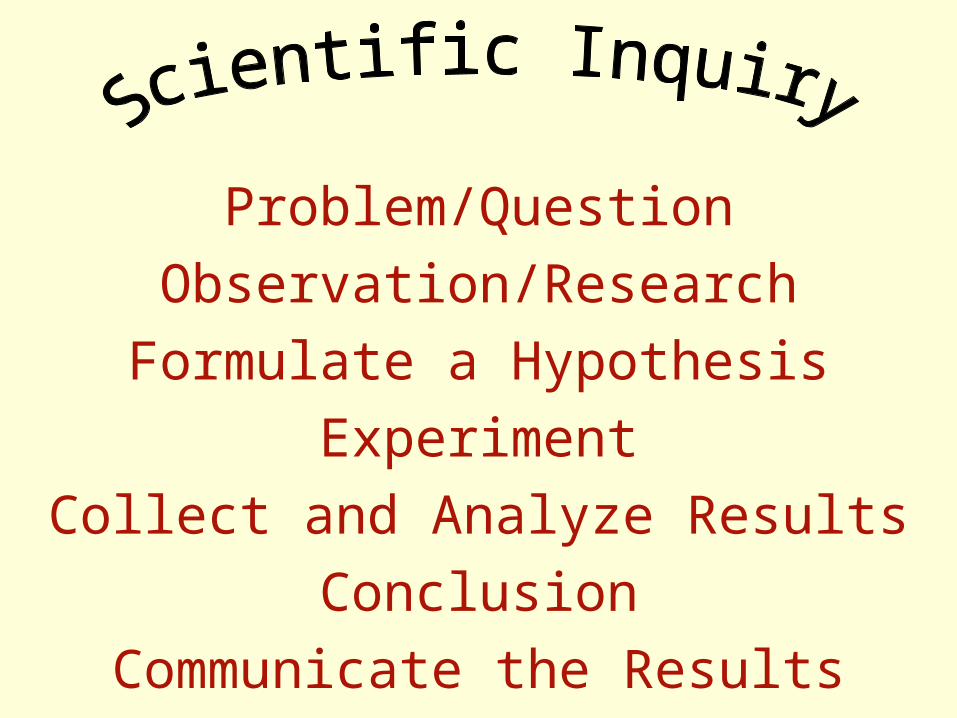
Problem/Question
Observation/Research
Formulate a Hypothesis
Experiment
Collect and Analyze Results
Conclusion
Communicate the Results
~Scientific Inquiry ~Observe the world around
you!!
1. Problem/QuestionProblem/Question: Develop a question or problem that can
be tested through experimentation.
Scientific Inquiry
2. Observation/ResearchObservation/Research: Make accurate observations and
research your topic of interest.

Do you remember the Do you remember the next step?next step?
Scientific Inquiry3. Develop a HypothesisDevelop a Hypothesis:
Predict a possible answer to the problem or question.If…then… statement
Example: If soil temperatures rise, then plant growth will
increase.
Scientific Inquiry
4. ExperimentExperiment: Develop and follow a detailed procedure.
Include a complete materials list.
The outcome must be measurable (quantifiable).
Scientific Inquiry
5. Collect, Record & Analyze Collect, Record & Analyze ResultsResults:
Modify the procedure if needed.
Confirm the results by retesting.
Include tables, graphs, and photographs.
Scientific Inquiry
6. ConclusionConclusion: Include a statement that supports (accepts), does not support (rejects) or is inconclusive
in regards to the hypothesis. Use data to provide evidence!
Make recommendations for further study and possible improvements
to the procedure.
Scientific Inquiry
7. Communicate the ResultsCommunicate the Results: Be prepared to present the project
to an audience.
Expect questions from the audience.
Can you explain the basic Can you explain the basic process of inquiry?process of inquiry?
Let’s apply our knowledge of Scientific Inquiry to a realistic
example that includes some of the terms you will need to use and
understand.
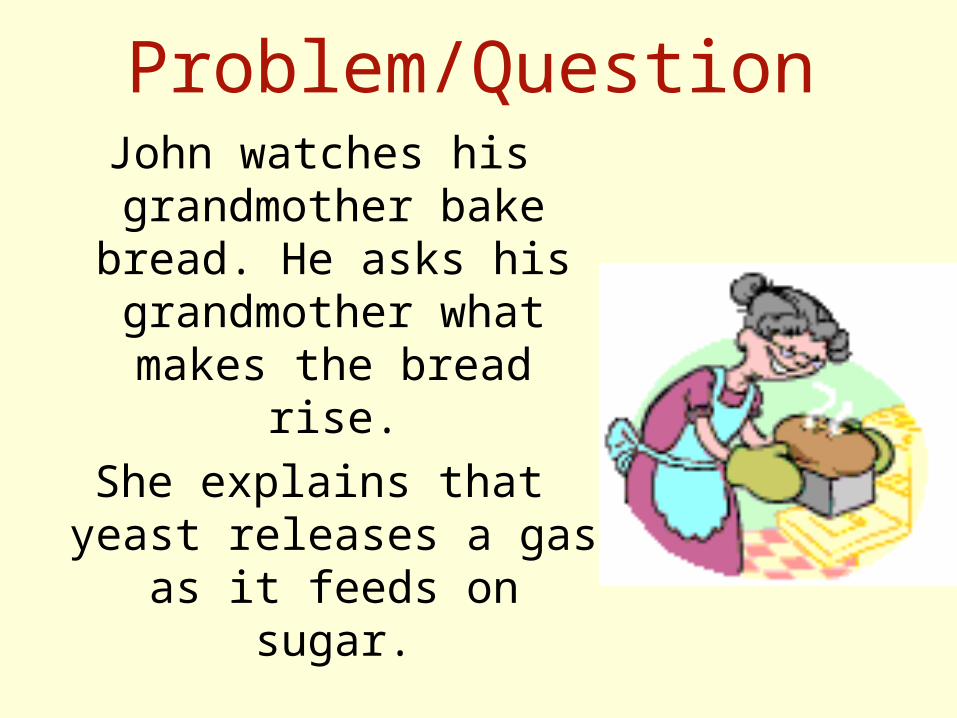
Problem/QuestionJohn watches his grandmother bake bread. He asks his grandmother what
makes the bread rise.
She explains that yeast releases a gas as it
feeds on sugar.
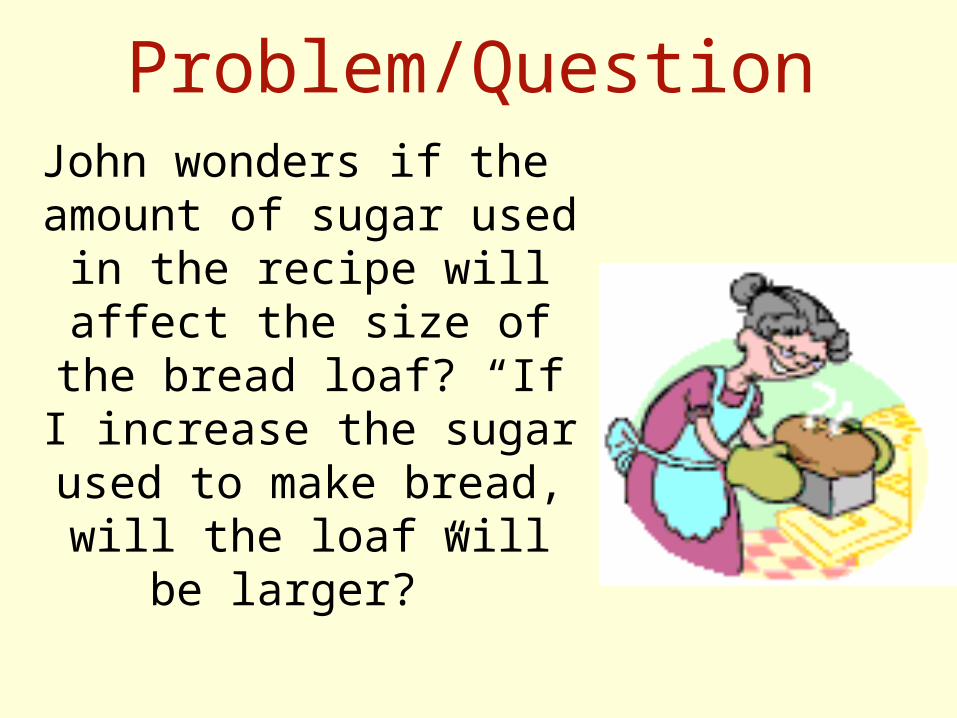
Problem/QuestionJohn wonders if the amount of sugar used in the recipe will affect the size of the bread
loaf? “If I increase the sugar used to make
bread, will the loaf will be larger?”
Caution!
Be careful how you use effect and affect.
Effect is usually a noun and affect, a verb.
“ The effect of sugar amounts on the rising of bread.”
“How does sugar affect the rising of bread?”
Observation/ResearchJohn researches the areas of baking and
fermentation and tries to come up with a way
to test his question.
He records all of his information on this topic in a journal.
John develops a testable question that he can use to set up his hypothesis. John identifies what he will
test, control and measure.
Hypothesis
John’s hypothesis is an educated prediction about the
relationship between the changed (manipulated) and
measured (responding) variables.
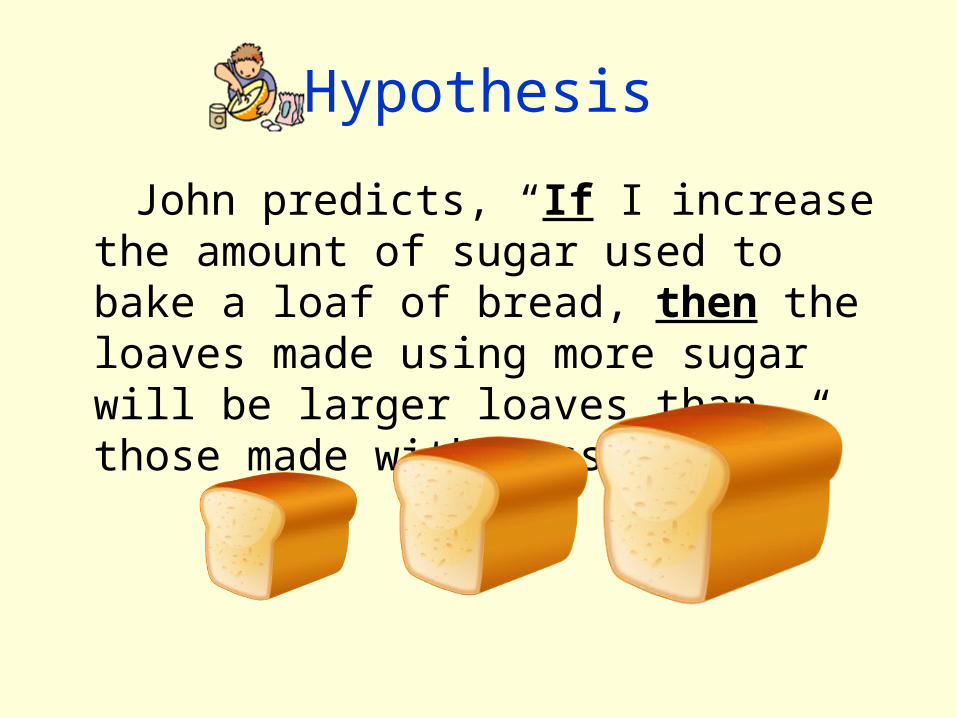
Hypothesis
John predicts, “If I increase the amount of sugar used to bake a loaf of bread, then the loaves made using more sugar will be larger loaves than those made with less sugar.”
Do you know the difference Do you know the difference between the changed between the changed
(manipulated) and measured (manipulated) and measured (responding) variables?(responding) variables?
Manipulated Variable The changed, or manipulated
variable, is a factor that’s intentionally changed (tested)
by the experimenter.John is going to use 25g., 50g.,
100g., 250g., 500g. of sugar in his experiment (amount of
sugar is the MV).
Responding Variable The measured, or responding variable, is the factor that may change as a result of changes
made to the manipulated (changed)variable.
In this case, it would be the size of the loaf of bread (RV).
Experiment/Test/Trial
John’s teacher helps him come up with a procedure and list of
needed materials.
She discusses with John how to
determine the control group.
Control Group
In a scientific experiment, the control group provides a
standard of comparison for the changed (manipulated)
variable.
Control Group
The control group is exposed to the same conditions as the
experimental group, except for the variable being tested.
The control group provides the “normal” for comparisons.
Control Group
Because his grandmother always used 50g. of sugar in
her recipe, John is going to use that amount as his control
group.
Controlled Variables
John’s teacher reminds him to keep all other factors the same so that any observed
changes in the bread can be attributed to the variation in the amount of sugar.
Controlled Variables
The controlled variables (also called
constants) in an experiment are all the
factors that the experimenter attempts
to keep the same.
Can you think of some Can you think of some controlled variables for this controlled variables for this
experiment?experiment?
Controlled VariablesThey might include:
Other ingredients to the bread recipe, oven used,
rise time, brand of ingredients, cooking time,
type of pan used, air temperature and humidity
where the bread was rising, oven temperature, age of the yeast… (CV’s)
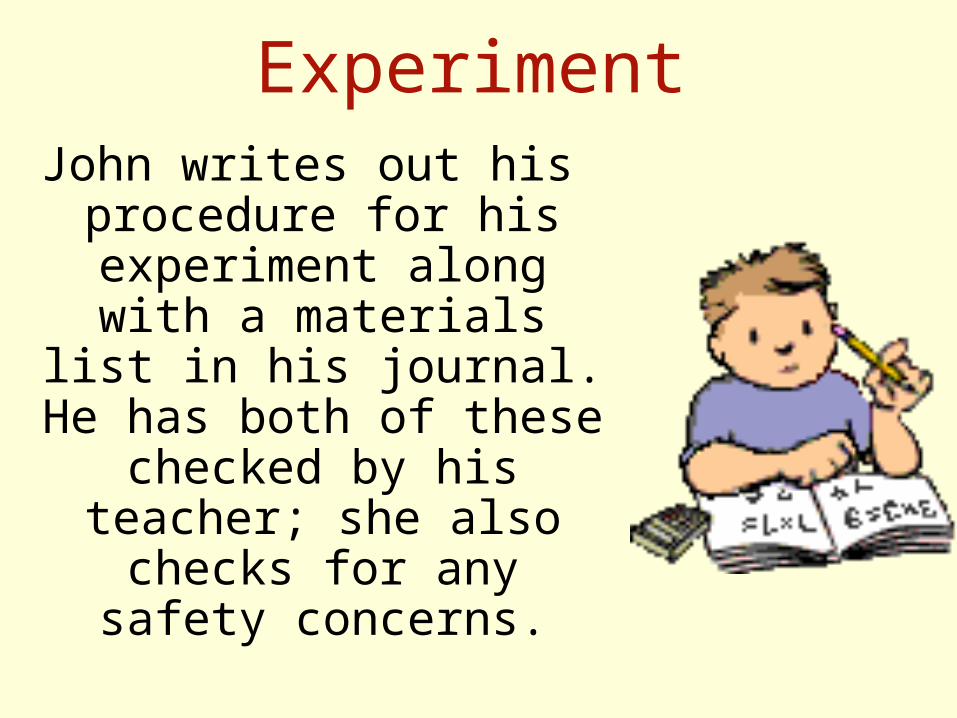
ExperimentJohn writes out his
procedure for his experiment along with a materials list in his
journal. He has both of these checked by his
teacher; she also checks for any safety
concerns.
Trials• It is very important to complete
multiple trials for each experiment.
• Multiple trials provide additional data and help to validate results.
• John decides to test each sugar variable 3 times.
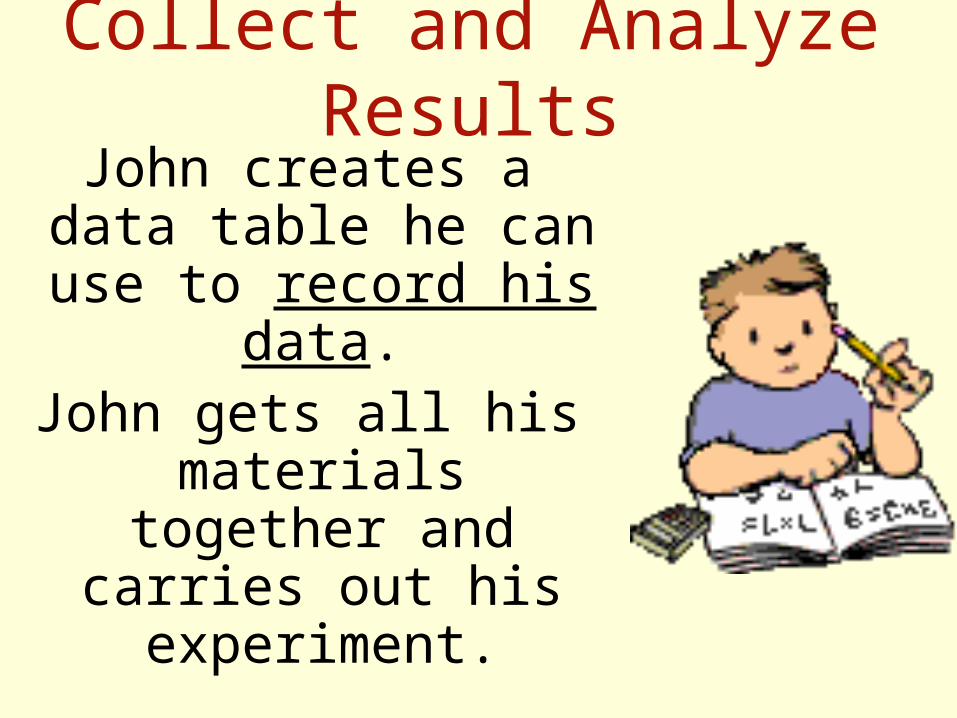
Collect and Analyze Results
John creates a data table he can use to
record his data.John gets all his materials together and carries out his
experiment.
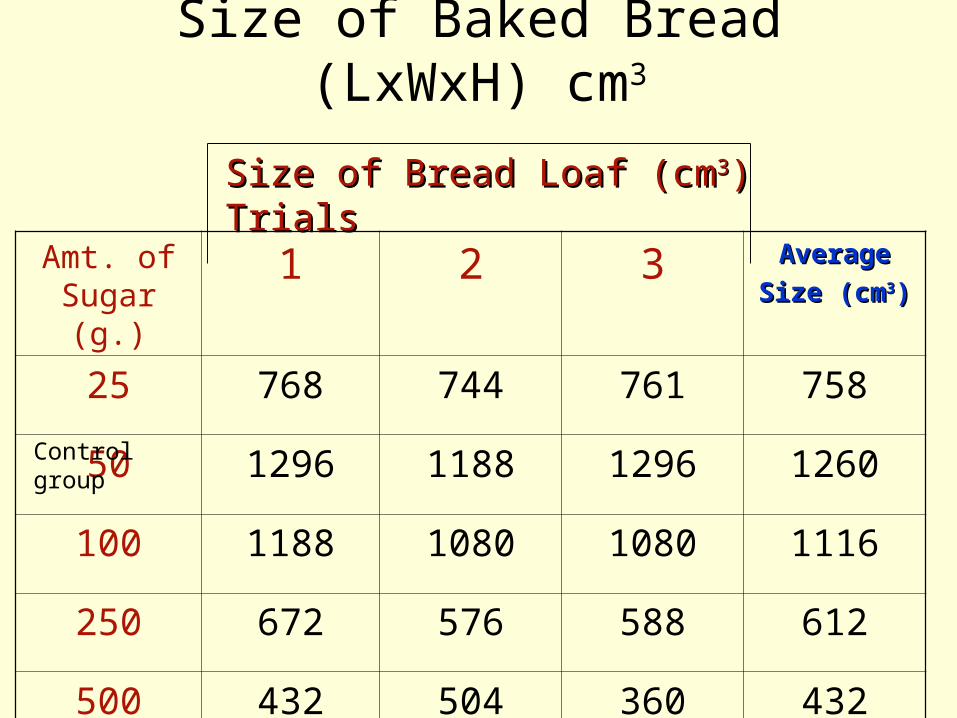
Size of Baked Bread (LxWxH) cm3
Amt. of Sugar (g.)
1 2 3 AverageAverage
Size (cmSize (cm33))
25 768 744 761 758
50 1296 1188 1296 1260
100 1188 1080 1080 1116
250 672 576 588 612
500 432 504 360 432
Size of Bread Loaf (cmSize of Bread Loaf (cm33) Trials) Trials
Control group
Collect and Analyze ResultsJohn examines his data and notices that
his control group produced the largest
loaf in this experiment, but not significantly larger
than 100g. of sugar.
Conclusion
John decides his hypothesis is not supported, but
decides to re-test using sugar
amounts between 50g. and 100g.
Experiment
Once again, John gathers his materials and carries out his
experiment.
Here are the results.
Can you tell which group Can you tell which group produced the largest produced the largest
loaf?loaf?
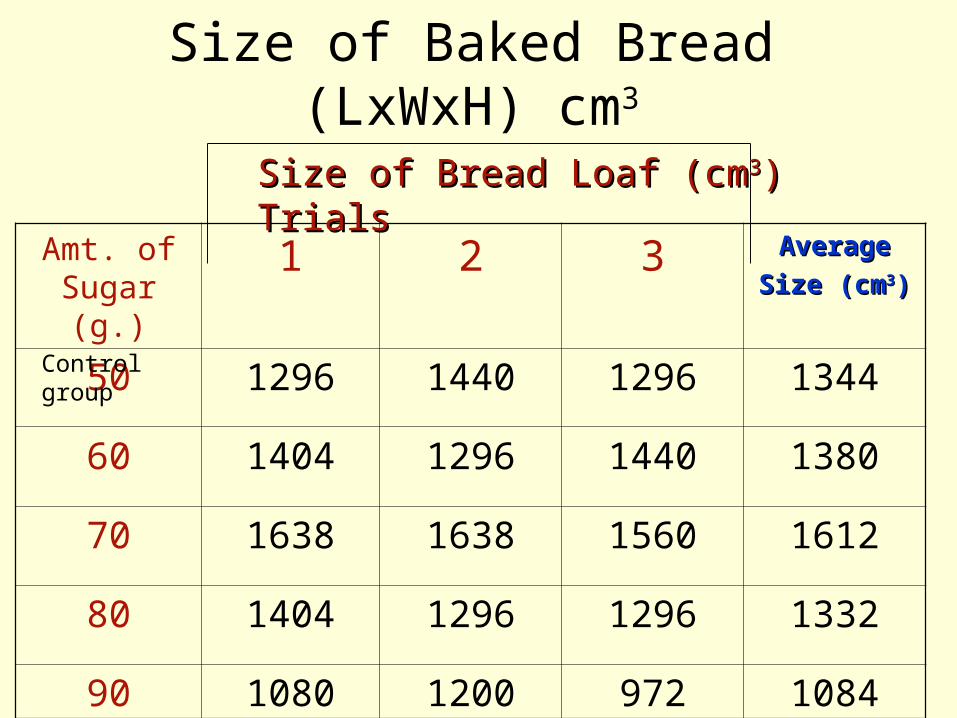
Size of Baked Bread (LxWxH) cm3
Amt. of Sugar (g.)
1 2 3 AverageAverage
Size (cmSize (cm33))
50 1296 1440 1296 1344
60 1404 1296 1440 1380
70 1638 1638 1560 1612
80 1404 1296 1296 1332
90 1080 1200 972 1084
Size of Bread Loaf (cmSize of Bread Loaf (cm33) Trials) Trials
Control group
Conclusion
John finds that 70g. of sugar produces
the largest loaf.
Communicate the Results
John tells his grandmother about
his findings and prepares to present
his project in Science class.