Embed Size (px)
Citation preview
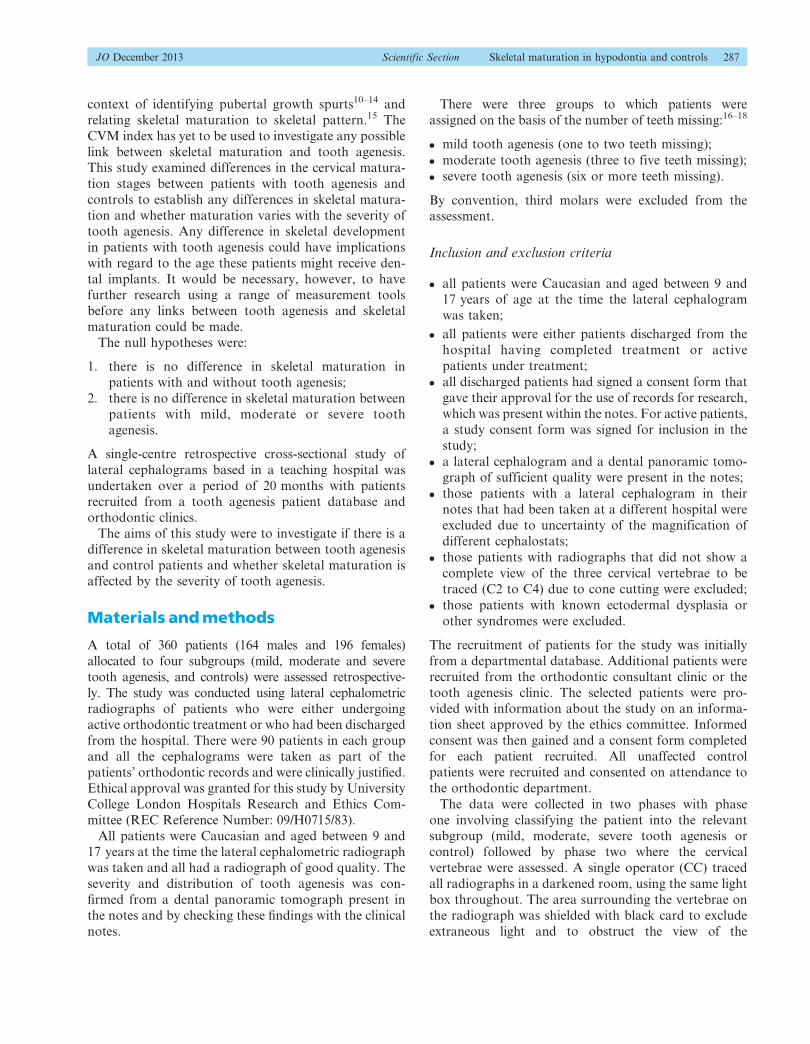
SCIENTIFICSECTION
A comparison of skeletal maturationin patients with tooth agenesis andunaffected controls assessed by thecervical vertebral maturation(CVM) index
Christine Casey, Daljit S. Gill and Steven P. JonesEastman Dental Hospital, London, UK
Objective: The aims of this study were to (1) investigate if there is a difference in skeletal maturation between tooth agenesis
and control patients and (2) whether skeletal maturation is affected by the severity of tooth agenesis. The cervical vertebral
maturation (CVM) index can be used to assess skeletal maturation.
Design: A retrospective cross-sectional study.
Setting: Eastman Dental Hospital, London, UK.
Methods and materials: A total of 360 cephalograms of patients aged 9–17 years (164 males and 196 females) allocated to four
subgroups (mild, moderate and severe tooth agenesis patients, and controls) were assessed retrospectively. There were 90
patients in each of the four subgroups. The skeletal maturation of each subject was assessed both quantitatively and
qualitatively using the CVM index. All patients in the study were either currently receiving treatment or had been discharged
from the hospital.
Results: There was no statistically significant relationship between skeletal maturation and the presence of tooth agenesis.
Furthermore, there was no statistically significant relationship between the skeletal maturity of patients and different severities
of tooth agenesis.
Conclusions: The data obtained from this group of patients and using this measurement tool alone does not supply sufficient
reason to reject the null hypothesis. However, it suggests that it is possible that no difference exists between the groups.
Key words: Cervical maturation index, tooth agenesis
Received 10 November 2012; accepted 27 May 2013
Introduction
Tooth agenesis is a condition involving the develop-
mental absence of teeth with a prevalence of between
4.6% (males) and 6.3% (females) in the European
Caucasian population.1 The male to female ratio for
European populations is 1 : 1.4. The aetiology of tooth
agenesis is best described in terms of a polygenic
multifactorial model and can be divided broadly in-
to genetic factors, environmental factors or systemic
manifestations.2,3 Msx genes have roles in craniofacial
and tooth development in mice and humans.4–7 Studies
have shown that dental development is delayed in
patients with tooth agenesis and the delay is affected
by severity.8 Since the Msx family of genes, among
others are common to tooth and craniofacial formation,
it is postulated that there may be concomitant delayed
skeletal development in association with missing teeth.
However, growth is a process that shows wide individual
variation and is difficult to predict. A number of
methods have been used to assess growth including
chronological age, dental developmental stage, peak
height velocity, pubescent changes in the body and
skeletal ossification events in the hand-wrist or cervical
vertebrae.
The cervical vertebral maturation (CVM) index was
developed using information from hand-wrist radio-
graphs to estimate growth phases and develop standards
for gender and age groups.9 This index has also been
used to investigate mandibular growth potential in the
Journal of Orthodontics, Vol. 40, 2013, 286–298
Address for correspondence: C. Casey, Orthodontic Department,
Eastman Dental Hospital, 256 Gray’s Inn Road, London WC1X
8LD, UK.
Email: [email protected]# 2013 British Orthodontic Society DOI 10.1179/1465313313Y.0000000070
context of identifying pubertal growth spurts10–14 and
relating skeletal maturation to skeletal pattern.15 The
CVM index has yet to be used to investigate any possible
link between skeletal maturation and tooth agenesis.This study examined differences in the cervical matura-
tion stages between patients with tooth agenesis and
controls to establish any differences in skeletal matura-
tion and whether maturation varies with the severity of
tooth agenesis. Any difference in skeletal development
in patients with tooth agenesis could have implications
with regard to the age these patients might receive den-
tal implants. It would be necessary, however, to havefurther research using a range of measurement tools
before any links between tooth agenesis and skeletal
maturation could be made.
The null hypotheses were:
1. there is no difference in skeletal maturation in
patients with and without tooth agenesis;
2. there is no difference in skeletal maturation between
patients with mild, moderate or severe tooth
agenesis.
A single-centre retrospective cross-sectional study of
lateral cephalograms based in a teaching hospital was
undertaken over a period of 20 months with patients
recruited from a tooth agenesis patient database and
orthodontic clinics.
The aims of this study were to investigate if there is adifference in skeletal maturation between tooth agenesis
and control patients and whether skeletal maturation is
affected by the severity of tooth agenesis.
Materials and methods
A total of 360 patients (164 males and 196 females)
allocated to four subgroups (mild, moderate and severe
tooth agenesis, and controls) were assessed retrospective-
ly. The study was conducted using lateral cephalometric
radiographs of patients who were either undergoingactive orthodontic treatment or who had been discharged
from the hospital. There were 90 patients in each group
and all the cephalograms were taken as part of the
patients’ orthodontic records and were clinically justified.
Ethical approval was granted for this study by University
College London Hospitals Research and Ethics Com-
mittee (REC Reference Number: 09/H0715/83).
All patients were Caucasian and aged between 9 and17 years at the time the lateral cephalometric radiograph
was taken and all had a radiograph of good quality. The
severity and distribution of tooth agenesis was con-
firmed from a dental panoramic tomograph present in
the notes and by checking these findings with the clinical
notes.
There were three groups to which patients were
assigned on the basis of the number of teeth missing:16–18
N mild tooth agenesis (one to two teeth missing);
N moderate tooth agenesis (three to five teeth missing);
N severe tooth agenesis (six or more teeth missing).
By convention, third molars were excluded from theassessment.
Inclusion and exclusion criteria
N all patients were Caucasian and aged between 9 and17 years of age at the time the lateral cephalogram
was taken;
N all patients were either patients discharged from the
hospital having completed treatment or active
patients under treatment;
N all discharged patients had signed a consent form that
gave their approval for the use of records for research,
which was present within the notes. For active patients,
a study consent form was signed for inclusion in the
study;
N a lateral cephalogram and a dental panoramic tomo-graph of sufficient quality were present in the notes;
N those patients with a lateral cephalogram in their
notes that had been taken at a different hospital were
excluded due to uncertainty of the magnification of
different cephalostats;
N those patients with radiographs that did not show a
complete view of the three cervical vertebrae to be
traced (C2 to C4) due to cone cutting were excluded;
N those patients with known ectodermal dysplasia or
other syndromes were excluded.
The recruitment of patients for the study was initially
from a departmental database. Additional patients were
recruited from the orthodontic consultant clinic or the
tooth agenesis clinic. The selected patients were pro-vided with information about the study on an informa-
tion sheet approved by the ethics committee. Informed
consent was then gained and a consent form completed
for each patient recruited. All unaffected control
patients were recruited and consented on attendance to
the orthodontic department.
The data were collected in two phases with phase
one involving classifying the patient into the relevantsubgroup (mild, moderate, severe tooth agenesis or
control) followed by phase two where the cervical
vertebrae were assessed. A single operator (CC) traced
all radiographs in a darkened room, using the same light
box throughout. The area surrounding the vertebrae on
the radiograph was shielded with black card to exclude
extraneous light and to obstruct the view of the
JO December 2013 Scientific Section Skeletal maturation in hypodontia and controls 287
dentition. Every patient was allocated a subject number
so that the operator was blinded to the patient’s subgroup
to minimize bias. To avoid operator fatigue, no more
than 10 radiographs were traced in any one session and a
period of operator training commenced prior to the data
collection.
The following qualitative and quantitative data were
captured for each patient based on the CVM index
previously described:9
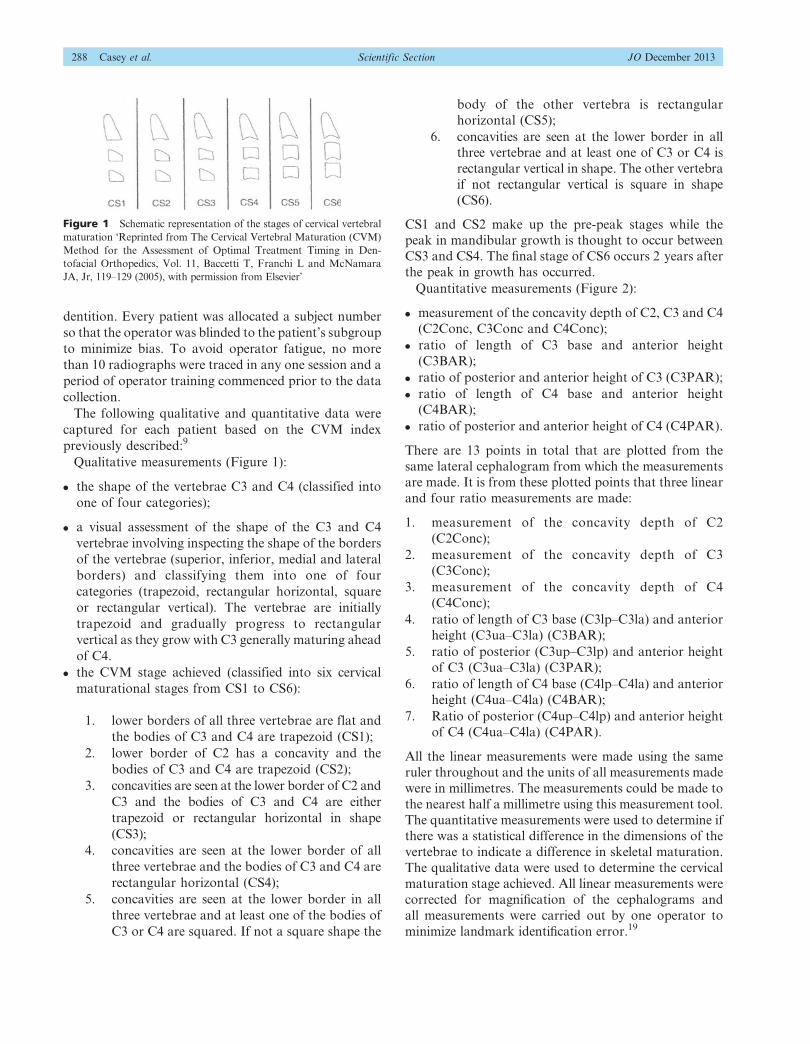
Qualitative measurements (Figure 1):
N the shape of the vertebrae C3 and C4 (classified into
one of four categories);
N a visual assessment of the shape of the C3 and C4
vertebrae involving inspecting the shape of the borders
of the vertebrae (superior, inferior, medial and lateral
borders) and classifying them into one of four
categories (trapezoid, rectangular horizontal, square
or rectangular vertical). The vertebrae are initially
trapezoid and gradually progress to rectangular
vertical as they grow with C3 generally maturing ahead
of C4.
N the CVM stage achieved (classified into six cervical
maturational stages from CS1 to CS6):
1. lower borders of all three vertebrae are flat and
the bodies of C3 and C4 are trapezoid (CS1);
2. lower border of C2 has a concavity and the
bodies of C3 and C4 are trapezoid (CS2);
3. concavities are seen at the lower border of C2 and
C3 and the bodies of C3 and C4 are either
trapezoid or rectangular horizontal in shape
(CS3);
4. concavities are seen at the lower border of all
three vertebrae and the bodies of C3 and C4 are
rectangular horizontal (CS4);
5. concavities are seen at the lower border in all
three vertebrae and at least one of the bodies of
C3 or C4 are squared. If not a square shape the
body of the other vertebra is rectangular
horizontal (CS5);
6. concavities are seen at the lower border in allthree vertebrae and at least one of C3 or C4 is
rectangular vertical in shape. The other vertebra
if not rectangular vertical is square in shape
(CS6).
CS1 and CS2 make up the pre-peak stages while thepeak in mandibular growth is thought to occur between
CS3 and CS4. The final stage of CS6 occurs 2 years after
the peak in growth has occurred.
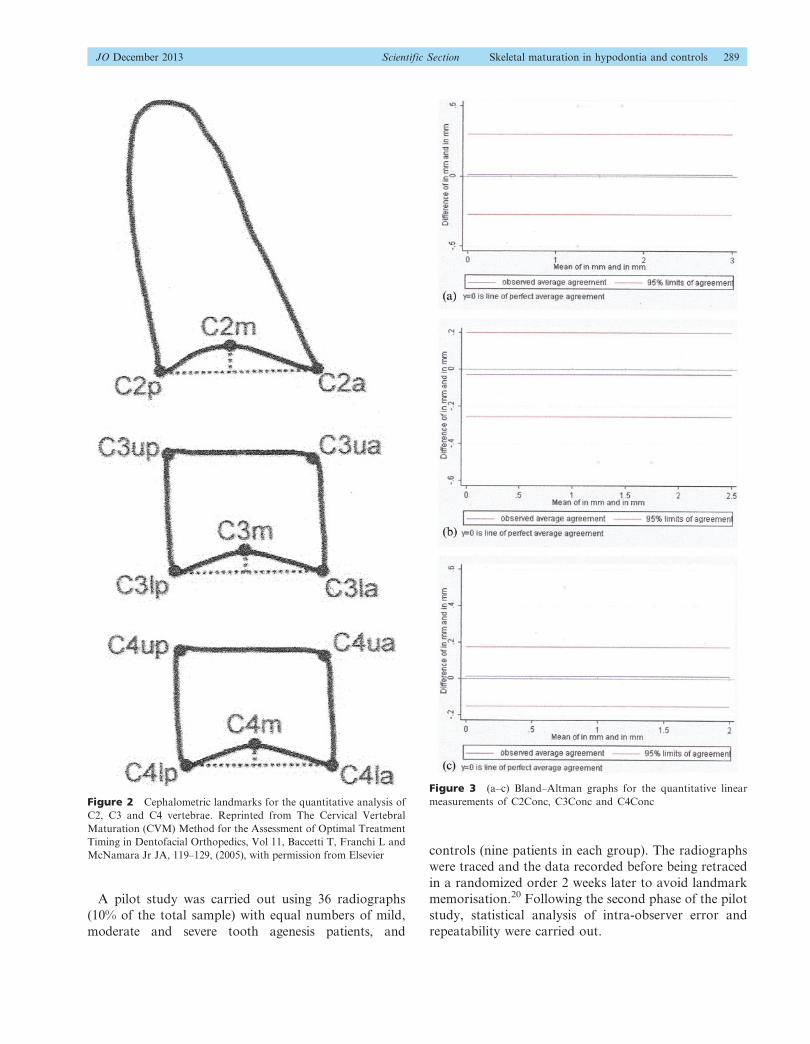
Quantitative measurements (Figure 2):
N measurement of the concavity depth of C2, C3 and C4
(C2Conc, C3Conc and C4Conc);
N ratio of length of C3 base and anterior height
(C3BAR);
N ratio of posterior and anterior height of C3 (C3PAR);
N ratio of length of C4 base and anterior height
(C4BAR);
N ratio of posterior and anterior height of C4 (C4PAR).
There are 13 points in total that are plotted from the
same lateral cephalogram from which the measurements
are made. It is from these plotted points that three linear
and four ratio measurements are made:
1. measurement of the concavity depth of C2
(C2Conc);
2. measurement of the concavity depth of C3
(C3Conc);
3. measurement of the concavity depth of C4
(C4Conc);
4. ratio of length of C3 base (C3lp–C3la) and anterior
height (C3ua–C3la) (C3BAR);
5. ratio of posterior (C3up–C3lp) and anterior height
of C3 (C3ua–C3la) (C3PAR);
6. ratio of length of C4 base (C4lp–C4la) and anterior
height (C4ua–C4la) (C4BAR);
7. Ratio of posterior (C4up–C4lp) and anterior height
of C4 (C4ua–C4la) (C4PAR).
All the linear measurements were made using the same
ruler throughout and the units of all measurements made
were in millimetres. The measurements could be made to
the nearest half a millimetre using this measurement tool.
The quantitative measurements were used to determine ifthere was a statistical difference in the dimensions of the
vertebrae to indicate a difference in skeletal maturation.
The qualitative data were used to determine the cervical
maturation stage achieved. All linear measurements were
corrected for magnification of the cephalograms and
all measurements were carried out by one operator to
minimize landmark identification error.19
Figure 1 Schematic representation of the stages of cervical vertebral
maturation ‘Reprinted from The Cervical Vertebral Maturation (CVM)
Method for the Assessment of Optimal Treatment Timing in Den-
tofacial Orthopedics, Vol. 11, Baccetti T, Franchi L and McNamara
JA, Jr, 119–129 (2005), with permission from Elsevier’
288 Casey et al. Scientific Section JO December 2013
A pilot study was carried out using 36 radiographs
(10% of the total sample) with equal numbers of mild,
moderate and severe tooth agenesis patients, and
controls (nine patients in each group). The radiographs
were traced and the data recorded before being retraced
in a randomized order 2 weeks later to avoid landmark
memorisation.20 Following the second phase of the pilot
study, statistical analysis of intra-observer error and
repeatability were carried out.
Figure 3 (a–c) Bland–Altman graphs for the quantitative linear
measurements of C2Conc, C3Conc and C4ConcFigure 2 Cephalometric landmarks for the quantitative analysis of
C2, C3 and C4 vertebrae. Reprinted from The Cervical Vertebral
Maturation (CVM) Method for the Assessment of Optimal Treatment
Timing in Dentofacial Orthopedics, Vol 11, Baccetti T, Franchi L and
McNamara Jr JA, 119–129, (2005), with permission from Elsevier
JO December 2013 Scientific Section Skeletal maturation in hypodontia and controls 289
A sample size calculation using nQuery advisor
softwareTM (version 4.0 Statistical Solutions, Sangus,
MA, USA) showed that a minimum sample size of 85
patients would be necessary within each group to detecta difference of 25 per cent in skeletal maturation
between the mild tooth agenesis and the control groups
at a power of 90% and significance level of 0.05. The
sample sizes were rounded up to 90 within each
subgroup to ensure that this power was achieved.
Repeatability (error) study
Intra-operator repeatability was assessed for the cate-
gorical data using Cohen’s kappa and for the numerical
data using the Bland–Altman method.21
The intra-operator repeatability was assessed using
Cohen’s kappa statistic and the values were as follows:
N shape of C3 (kappa value 0.89);
N shape of C4 (kappa value 1.00);
N CVM stage (kappa value 1.00).
A kappa score of 0.80 indicates good agreement between
two sets of measurements while a score of 1.00 indicates
perfect agreement. It can be seen from the results that
good agreement was obtained for the C3 analysis and
perfect agreement for the C4 analysis and the CVM
stage. It can be concluded that for this study therepeatability was acceptable to a good or perfect level of
agreement.
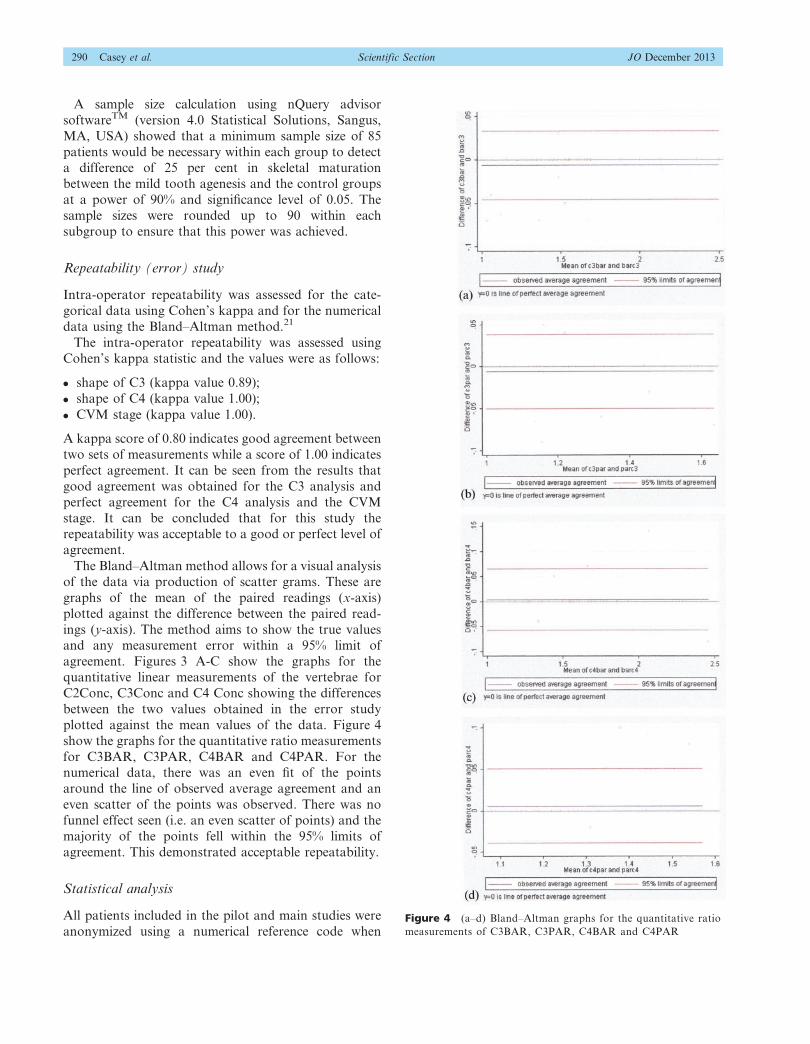
The Bland–Altman method allows for a visual analysis
of the data via production of scatter grams. These are
graphs of the mean of the paired readings (x-axis)
plotted against the difference between the paired read-
ings (y-axis). The method aims to show the true valuesand any measurement error within a 95% limit of
agreement. Figures 3 A-C show the graphs for the
quantitative linear measurements of the vertebrae for
C2Conc, C3Conc and C4 Conc showing the differences
between the two values obtained in the error study
plotted against the mean values of the data. Figure 4
show the graphs for the quantitative ratio measurements
for C3BAR, C3PAR, C4BAR and C4PAR. For thenumerical data, there was an even fit of the points
around the line of observed average agreement and an
even scatter of the points was observed. There was no
funnel effect seen (i.e. an even scatter of points) and the
majority of the points fell within the 95% limits of
agreement. This demonstrated acceptable repeatability.
Statistical analysis
All patients included in the pilot and main studies were
anonymized using a numerical reference code whenFigure 4 (a–d) Bland–Altman graphs for the quantitative ratio
measurements of C3BAR, C3PAR, C4BAR and C4PAR
290 Casey et al. Scientific Section JO December 2013
analysing and presenting the results. Intra-operator
repeatability and data analysis were assessed using the
statistical packages SPSSH software (Statistical Package
for the Social Sciences, version 17.0) and Stata (DataAnalysis and Statistical Software, version 10.0).
In order to assess the distribution of the data obtained
in the study, one of the continuous variables was
selected (C2Conc) and the values were plotted as a
histogram. This variable was chosen as it was the largest
of the three linear variables to be measured. The data
was skewed to the left and was therefore not normally
distributed. The median and the range were used todescribe the data and non-parametric tests were used.
The ages of the subjects and the linear depth of the
vertebrae concavities were normally distributed. The
mean and the standard deviation were used to describe
the data and parametric tests were used. Statistical
significance was inferred at P,0.05.
The ages of the subjects were compared with the
study subgroups (mild/moderate/severe/control) usingthe t-test. Gender, study subgroups and CVM stages
were analysed using the Chi-squared test.
The relationship between number of missing teeth and
gender was investigated using the Mann–Whitney U
test. All the quantitative ratio measurements of the
vertebrae were analysed using the Kruskal–Wallis test as
well as the subgroups, the number of missing teeth and
CVM stages.The Pearson correlation coefficient was used to compare
age with the CVM stages and the linear measurements of
vertebrae concavity with both the different subgroups
and gender. The Spearman’s rank correlation coefficient
examined the study subgroups and CVM stages.
Results
All the patients undergoing treatment at the hospital
who were recruited for the study agreed to participateand there were no withdrawals. There were a total of 270
tooth agenesis patients and 90 controls in the study.
Socio-demographic data: age and gender
Table 1 shows the age of the patients included in the study
ranged from 9.08 to 16.92 years. This range was not
statistically significant between the subgroups (P50.077).
The mean age range between the subgroups was 13.09–13.50 years and the age of the patients in the different
study subgroups was normally distributed.
There was no statistically significant difference seen
between the gender and the different subgroups (P5
0.463). The male and female groups were compar-
able in terms of the number of missing teeth and this
range of missing teeth was not statistically significant
(P50.572).
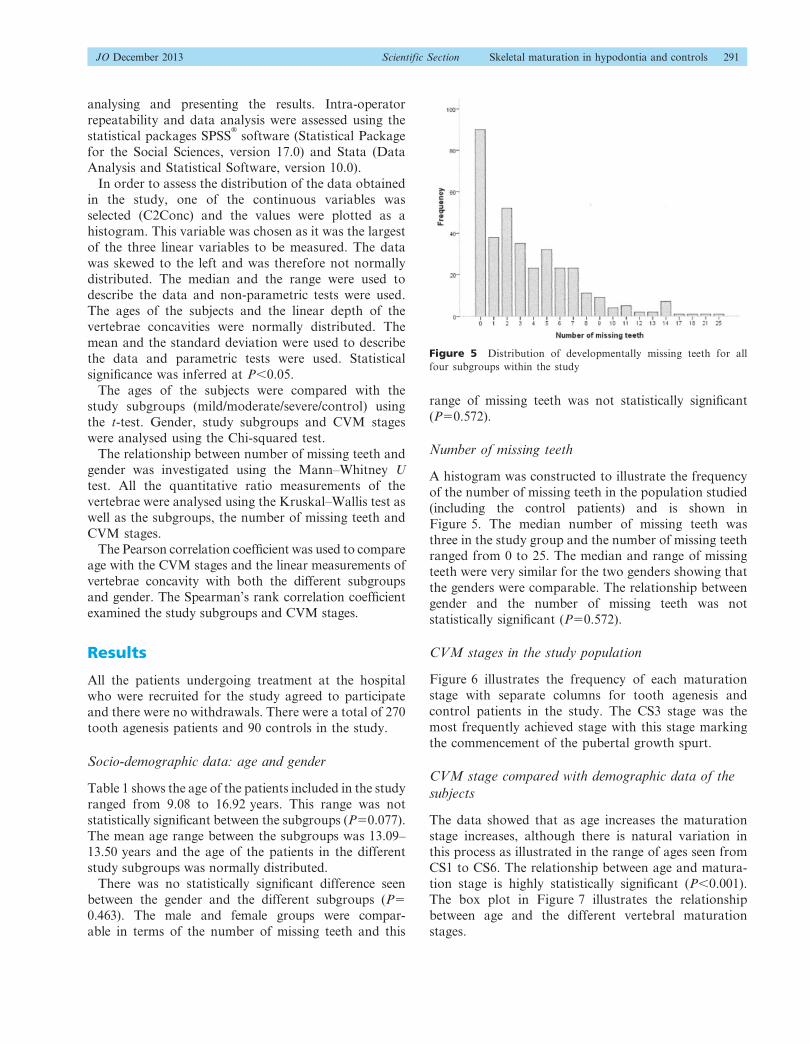
Number of missing teeth
A histogram was constructed to illustrate the frequency
of the number of missing teeth in the population studied
(including the control patients) and is shown in
Figure 5. The median number of missing teeth was
three in the study group and the number of missing teethranged from 0 to 25. The median and range of missing
teeth were very similar for the two genders showing that
the genders were comparable. The relationship between
gender and the number of missing teeth was not
statistically significant (P50.572).
CVM stages in the study population
Figure 6 illustrates the frequency of each maturation
stage with separate columns for tooth agenesis and
control patients in the study. The CS3 stage was the
most frequently achieved stage with this stage marking
the commencement of the pubertal growth spurt.
CVM stage compared with demographic data of the
subjects
The data showed that as age increases the maturation
stage increases, although there is natural variation inthis process as illustrated in the range of ages seen from
CS1 to CS6. The relationship between age and matura-
tion stage is highly statistically significant (P,0.001).
The box plot in Figure 7 illustrates the relationship
between age and the different vertebral maturation
stages.
Figure 5 Distribution of developmentally missing teeth for all
four subgroups within the study
JO December 2013 Scientific Section Skeletal maturation in hypodontia and controls 291
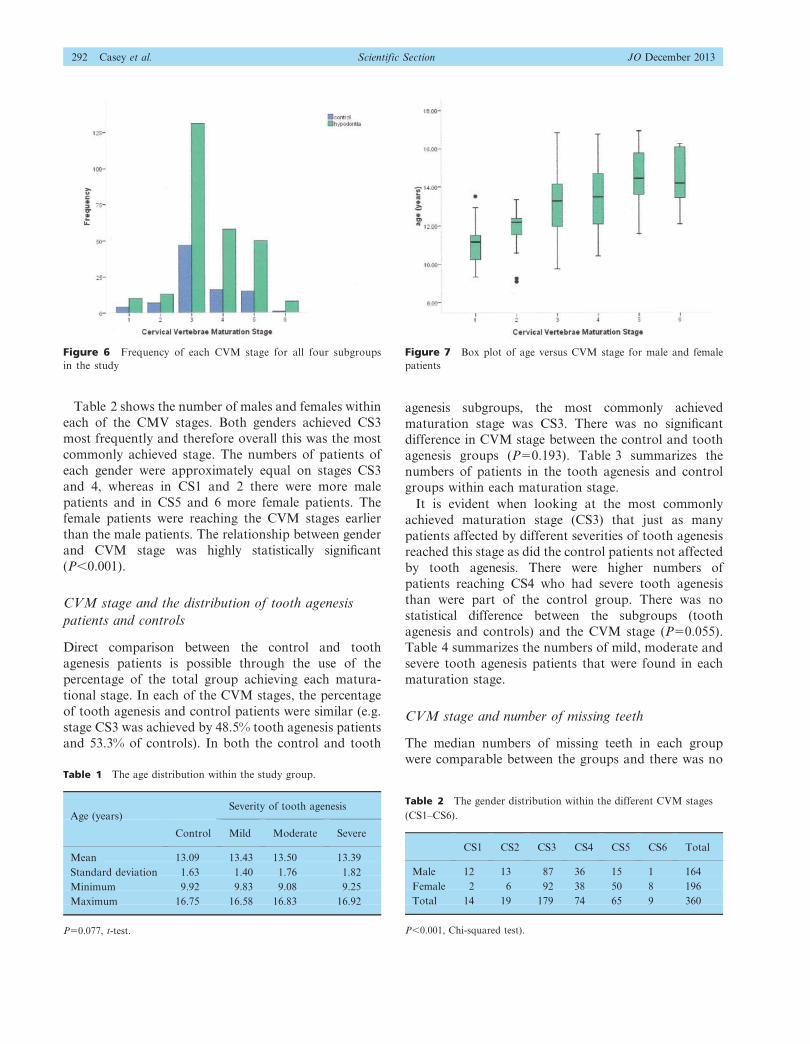
Table 2 shows the number of males and females within
each of the CMV stages. Both genders achieved CS3
most frequently and therefore overall this was the most
commonly achieved stage. The numbers of patients of
each gender were approximately equal on stages CS3
and 4, whereas in CS1 and 2 there were more male
patients and in CS5 and 6 more female patients. The
female patients were reaching the CVM stages earlier
than the male patients. The relationship between gender
and CVM stage was highly statistically significant
(P,0.001).
CVM stage and the distribution of tooth agenesis
patients and controls
Direct comparison between the control and tooth
agenesis patients is possible through the use of the
percentage of the total group achieving each matura-
tional stage. In each of the CVM stages, the percentage
of tooth agenesis and control patients were similar (e.g.
stage CS3 was achieved by 48.5% tooth agenesis patients
and 53.3% of controls). In both the control and tooth
agenesis subgroups, the most commonly achieved
maturation stage was CS3. There was no significant
difference in CVM stage between the control and tooth
agenesis groups (P50.193). Table 3 summarizes the
numbers of patients in the tooth agenesis and control
groups within each maturation stage.
It is evident when looking at the most commonly
achieved maturation stage (CS3) that just as many
patients affected by different severities of tooth agenesis
reached this stage as did the control patients not affected
by tooth agenesis. There were higher numbers of
patients reaching CS4 who had severe tooth agenesis
than were part of the control group. There was no
statistical difference between the subgroups (tooth
agenesis and controls) and the CVM stage (P50.055).
Table 4 summarizes the numbers of mild, moderate and
severe tooth agenesis patients that were found in each
maturation stage.
CVM stage and number of missing teeth
The median numbers of missing teeth in each group
were comparable between the groups and there was no
Figure 6 Frequency of each CVM stage for all four subgroups
in the study
Figure 7 Box plot of age versus CVM stage for male and female
patients
Table 2 The gender distribution within the different CVM stages
(CS1–CS6).
CS1 CS2 CS3 CS4 CS5 CS6 Total
Male 12 13 87 36 15 1 164
Female 2 6 92 38 50 8 196
Total 14 19 179 74 65 9 360
P,0.001, Chi-squared test).
Table 1 The age distribution within the study group.
Age (years)Severity of tooth agenesis
Control Mild Moderate Severe
Mean 13.09 13.43 13.50 13.39
Standard deviation 1.63 1.40 1.76 1.82
Minimum 9.92 9.83 9.08 9.25
Maximum 16.75 16.58 16.83 16.92
P50.077, t-test.
292 Casey et al. Scientific Section JO December 2013
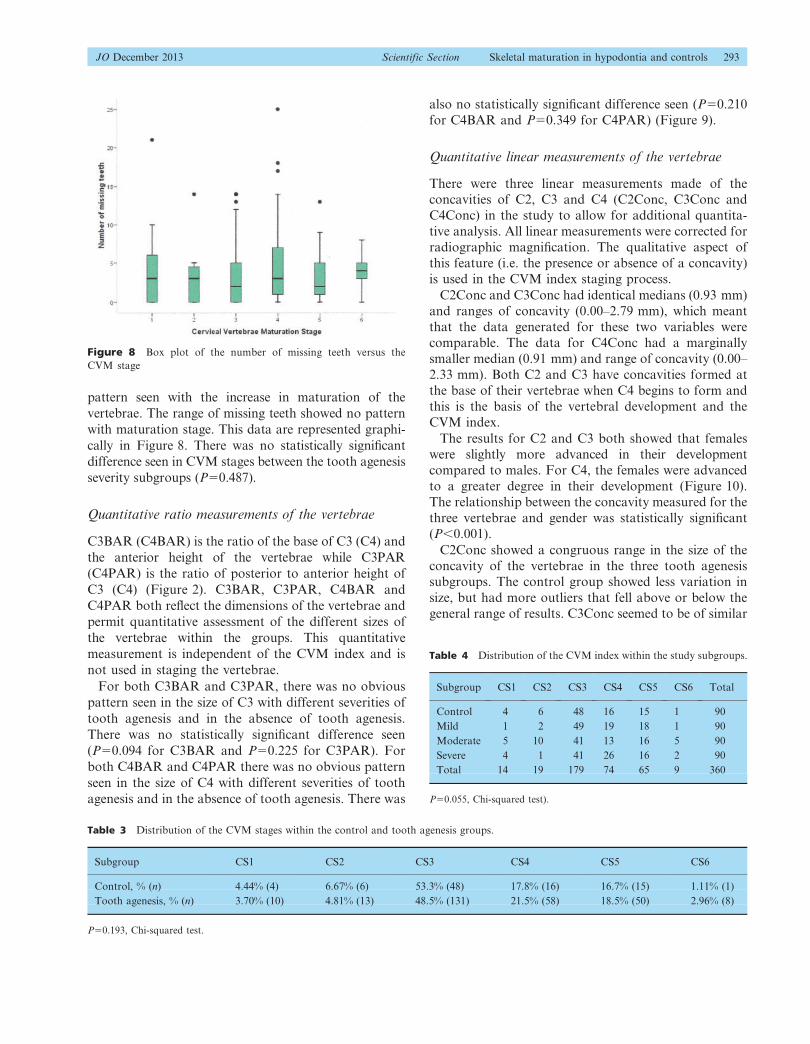
pattern seen with the increase in maturation of the
vertebrae. The range of missing teeth showed no pattern
with maturation stage. This data are represented graphi-
cally in Figure 8. There was no statistically significant
difference seen in CVM stages between the tooth agenesis
severity subgroups (P50.487).
Quantitative ratio measurements of the vertebrae
C3BAR (C4BAR) is the ratio of the base of C3 (C4) and
the anterior height of the vertebrae while C3PAR
(C4PAR) is the ratio of posterior to anterior height of
C3 (C4) (Figure 2). C3BAR, C3PAR, C4BAR and
C4PAR both reflect the dimensions of the vertebrae and
permit quantitative assessment of the different sizes of
the vertebrae within the groups. This quantitative
measurement is independent of the CVM index and is
not used in staging the vertebrae.
For both C3BAR and C3PAR, there was no obvious
pattern seen in the size of C3 with different severities of
tooth agenesis and in the absence of tooth agenesis.
There was no statistically significant difference seen
(P50.094 for C3BAR and P50.225 for C3PAR). For
both C4BAR and C4PAR there was no obvious pattern
seen in the size of C4 with different severities of tooth
agenesis and in the absence of tooth agenesis. There was
also no statistically significant difference seen (P50.210
for C4BAR and P50.349 for C4PAR) (Figure 9).
Quantitative linear measurements of the vertebrae
There were three linear measurements made of theconcavities of C2, C3 and C4 (C2Conc, C3Conc and
C4Conc) in the study to allow for additional quantita-
tive analysis. All linear measurements were corrected for
radiographic magnification. The qualitative aspect of
this feature (i.e. the presence or absence of a concavity)
is used in the CVM index staging process.
C2Conc and C3Conc had identical medians (0.93 mm)
and ranges of concavity (0.00–2.79 mm), which meantthat the data generated for these two variables were
comparable. The data for C4Conc had a marginally
smaller median (0.91 mm) and range of concavity (0.00–
2.33 mm). Both C2 and C3 have concavities formed at
the base of their vertebrae when C4 begins to form and
this is the basis of the vertebral development and the
CVM index.
The results for C2 and C3 both showed that femaleswere slightly more advanced in their development
compared to males. For C4, the females were advanced
to a greater degree in their development (Figure 10).
The relationship between the concavity measured for the
three vertebrae and gender was statistically significant
(P,0.001).
C2Conc showed a congruous range in the size of the
concavity of the vertebrae in the three tooth agenesissubgroups. The control group showed less variation in
size, but had more outliers that fell above or below the
general range of results. C3Conc seemed to be of similar
Table 3 Distribution of the CVM stages within the control and tooth agenesis groups.
Subgroup CS1 CS2 CS3 CS4 CS5 CS6
Control, % (n) 4.44% (4) 6.67% (6) 53.3% (48) 17.8% (16) 16.7% (15) 1.11% (1)
Tooth agenesis, % (n) 3.70% (10) 4.81% (13) 48.5% (131) 21.5% (58) 18.5% (50) 2.96% (8)
P50.193, Chi-squared test.
Table 4 Distribution of the CVM index within the study subgroups.
Subgroup CS1 CS2 CS3 CS4 CS5 CS6 Total
Control 4 6 48 16 15 1 90
Mild 1 2 49 19 18 1 90
Moderate 5 10 41 13 16 5 90
Severe 4 1 41 26 16 2 90
Total 14 19 179 74 65 9 360
P50.055, Chi-squared test).
Figure 8 Box plot of the number of missing teeth versus the
CVM stage
JO December 2013 Scientific Section Skeletal maturation in hypodontia and controls 293
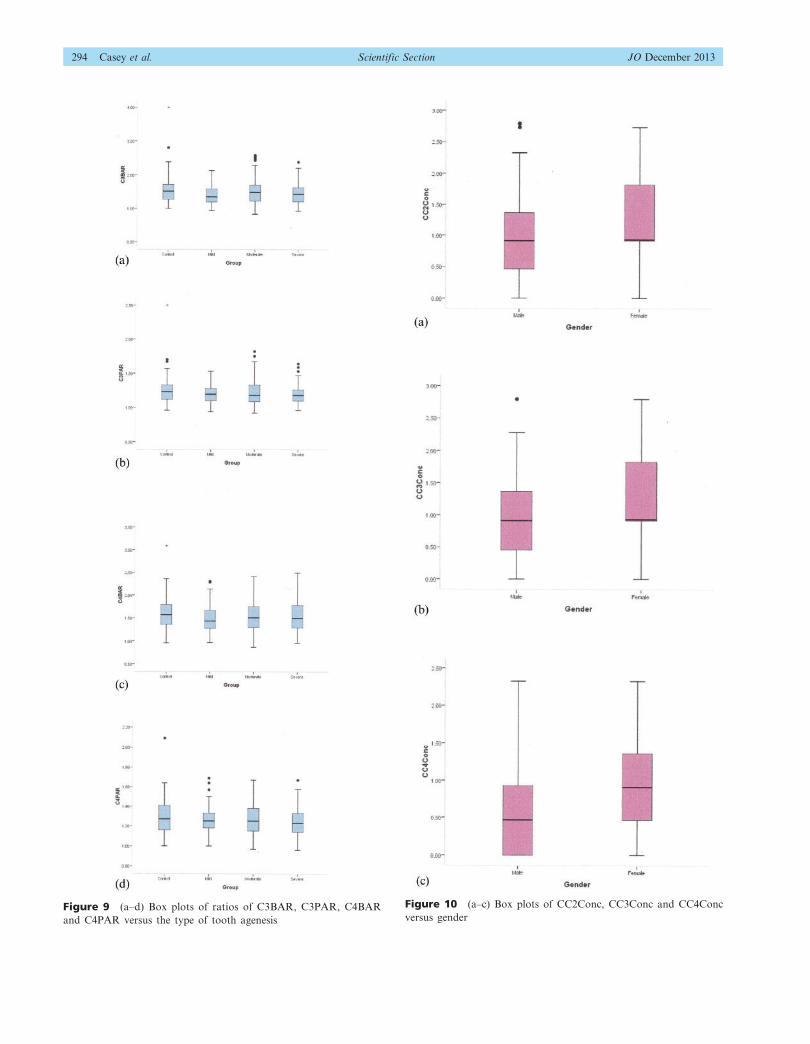
Figure 10 (a–c) Box plots of CC2Conc, CC3Conc and CC4Conc
versus genderFigure 9 (a–d) Box plots of ratios of C3BAR, C3PAR, C4BAR
and C4PAR versus the type of tooth agenesis
294 Casey et al. Scientific Section JO December 2013
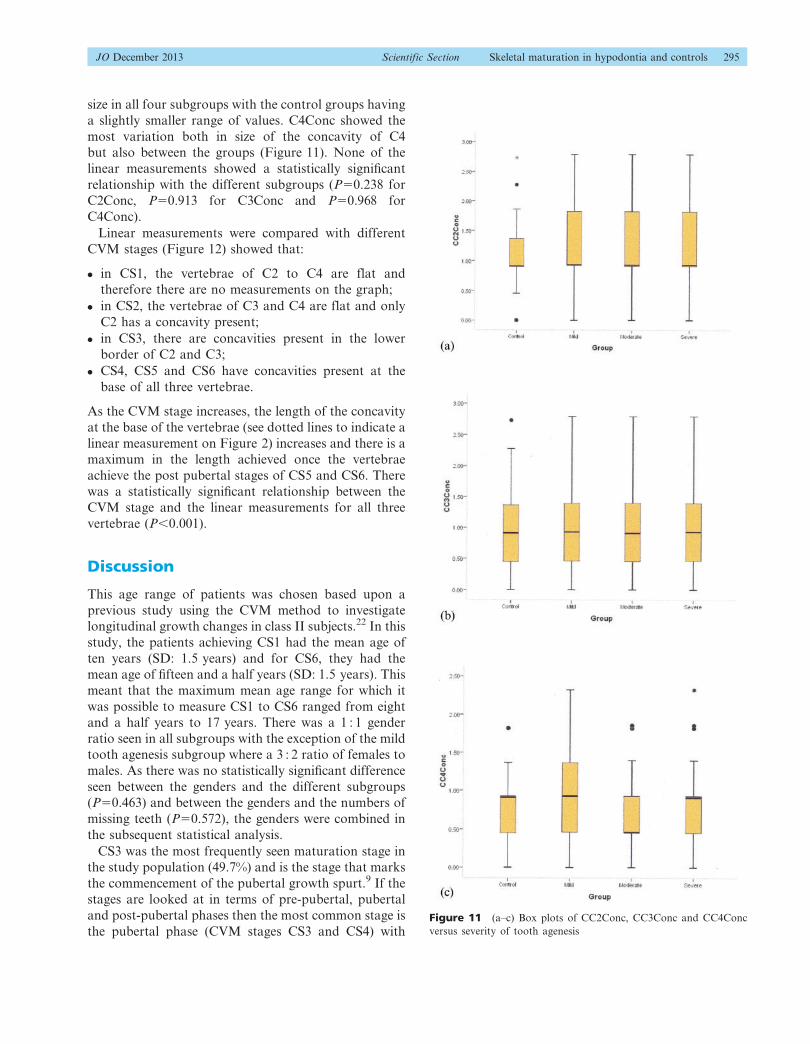
size in all four subgroups with the control groups having
a slightly smaller range of values. C4Conc showed the
most variation both in size of the concavity of C4
but also between the groups (Figure 11). None of the
linear measurements showed a statistically significant
relationship with the different subgroups (P50.238 for
C2Conc, P50.913 for C3Conc and P50.968 for
C4Conc).
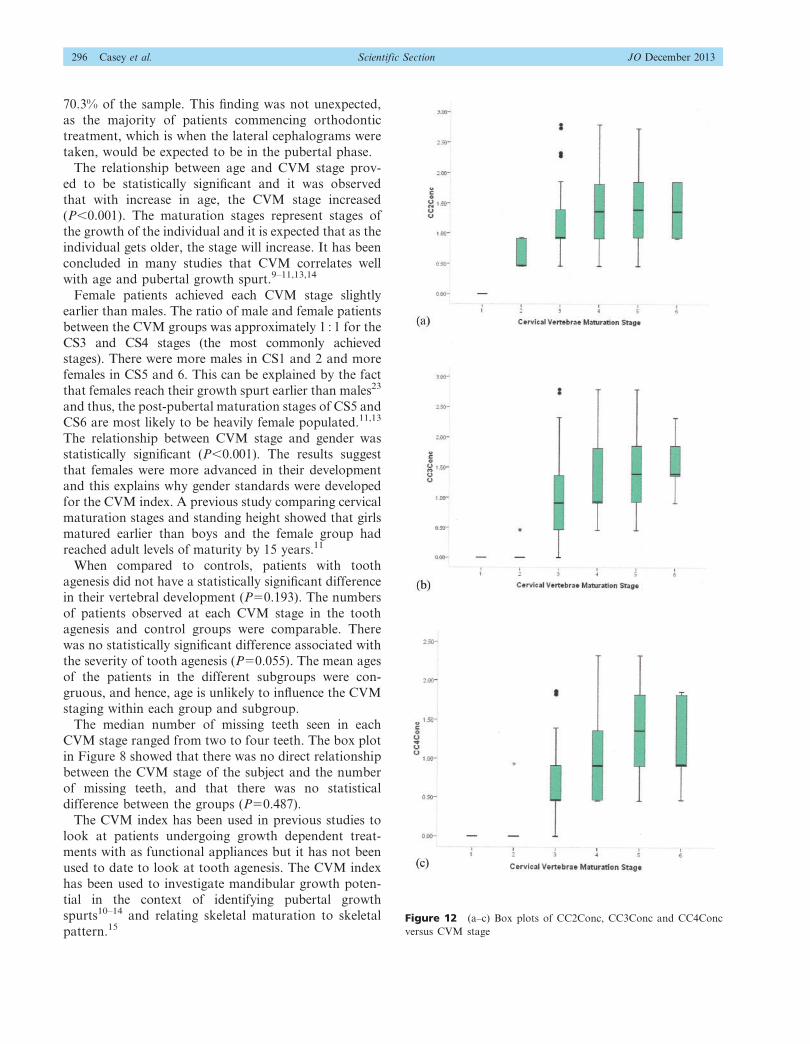
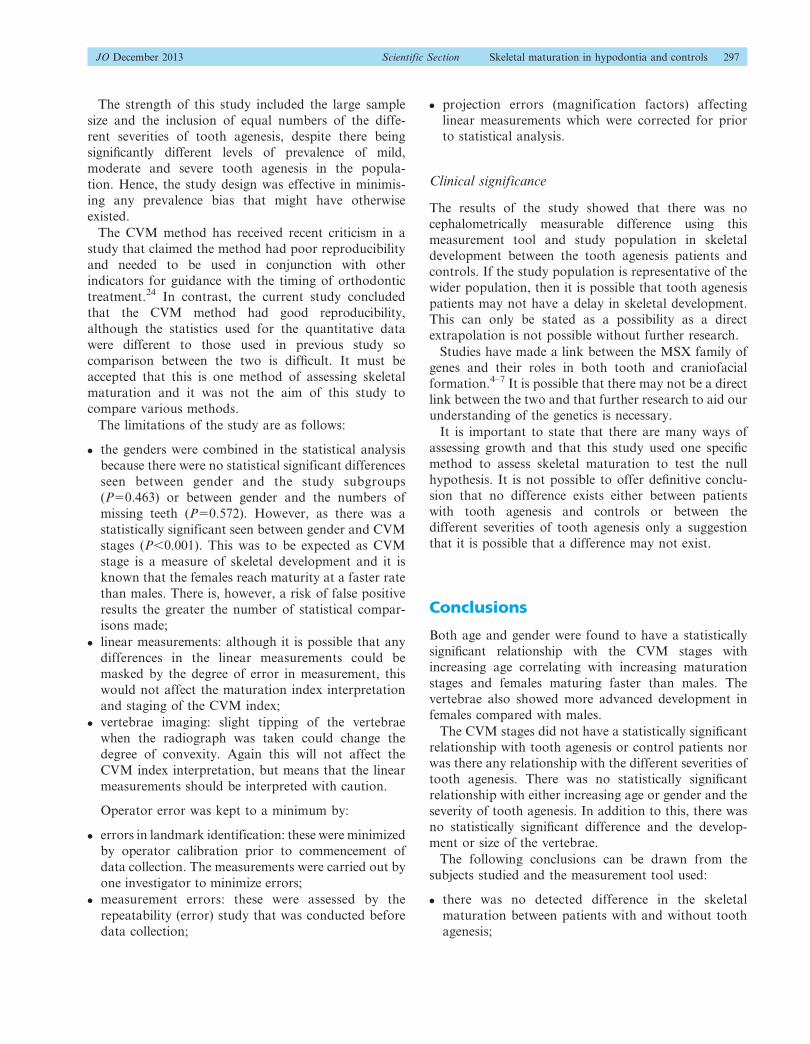
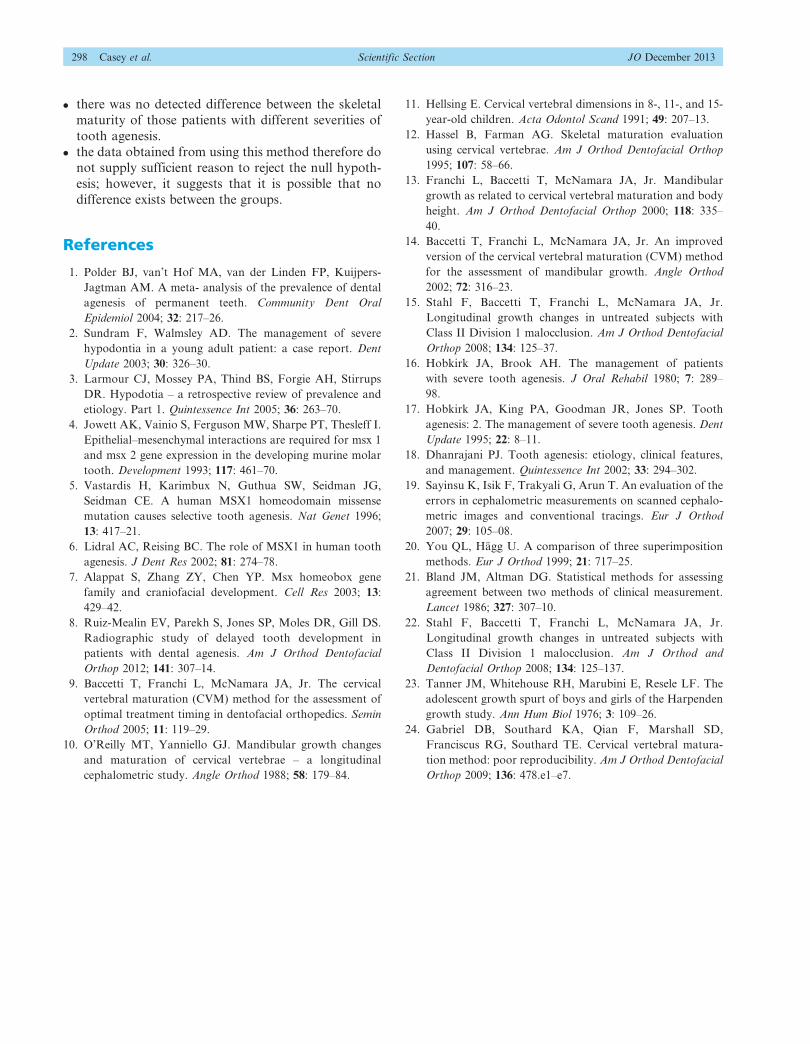
Linear measurements were compared with different
CVM stages (Figure 12) showed that:
N in CS1, the vertebrae of C2 to C4 are flat and
therefore there are no measurements on the graph;
N in CS2, the vertebrae of C3 and C4 are flat and only
C2 has a concavity present;
N in CS3, there are concavities present in the lower
border of C2 and C3;
N CS4, CS5 and CS6 have concavities present at the
base of all three vertebrae.
As the CVM stage increases, the length of the concavity
at the base of the vertebrae (see dotted lines to indicate a
linear measurement on Figure 2) increases and there is a
maximum in the length achieved once the vertebrae
achieve the post pubertal stages of CS5 and CS6. There
was a statistically significant relationship between the
CVM stage and the linear measurements for all three
vertebrae (P,0.001).
Discussion
This age range of patients was chosen based upon a
previous study using the CVM method to investigate
longitudinal growth changes in class II subjects.22 In this
study, the patients achieving CS1 had the mean age of
ten years (SD: 1.5 years) and for CS6, they had the
mean age of fifteen and a half years (SD: 1.5 years). This
meant that the maximum mean age range for which it
was possible to measure CS1 to CS6 ranged from eight
and a half years to 17 years. There was a 1 : 1 gender
ratio seen in all subgroups with the exception of the mild
tooth agenesis subgroup where a 3 : 2 ratio of females to
males. As there was no statistically significant difference
seen between the genders and the different subgroups
(P50.463) and between the genders and the numbers of
missing teeth (P50.572), the genders were combined in
the subsequent statistical analysis.
CS3 was the most frequently seen maturation stage in
the study population (49.7%) and is the stage that marks
the commencement of the pubertal growth spurt.9 If the
stages are looked at in terms of pre-pubertal, pubertal
and post-pubertal phases then the most common stage is
the pubertal phase (CVM stages CS3 and CS4) withFigure 11 (a–c) Box plots of CC2Conc, CC3Conc and CC4Conc
versus severity of tooth agenesis
JO December 2013 Scientific Section Skeletal maturation in hypodontia and controls 295
70.3% of the sample. This finding was not unexpected,
as the majority of patients commencing orthodontic
treatment, which is when the lateral cephalograms were
taken, would be expected to be in the pubertal phase.
The relationship between age and CVM stage prov-
ed to be statistically significant and it was observed
that with increase in age, the CVM stage increased
(P,0.001). The maturation stages represent stages ofthe growth of the individual and it is expected that as the
individual gets older, the stage will increase. It has been
concluded in many studies that CVM correlates well
with age and pubertal growth spurt.9–11,13,14
Female patients achieved each CVM stage slightly
earlier than males. The ratio of male and female patients
between the CVM groups was approximately 1 : 1 for the
CS3 and CS4 stages (the most commonly achievedstages). There were more males in CS1 and 2 and more
females in CS5 and 6. This can be explained by the fact
that females reach their growth spurt earlier than males23
and thus, the post-pubertal maturation stages of CS5 and
CS6 are most likely to be heavily female populated.11,13
The relationship between CVM stage and gender was
statistically significant (P,0.001). The results suggest
that females were more advanced in their developmentand this explains why gender standards were developed
for the CVM index. A previous study comparing cervical
maturation stages and standing height showed that girls
matured earlier than boys and the female group had
reached adult levels of maturity by 15 years.11
When compared to controls, patients with tooth
agenesis did not have a statistically significant differencein their vertebral development (P50.193). The numbers
of patients observed at each CVM stage in the tooth
agenesis and control groups were comparable. There
was no statistically significant difference associated with
the severity of tooth agenesis (P50.055). The mean ages
of the patients in the different subgroups were con-
gruous, and hence, age is unlikely to influence the CVM
staging within each group and subgroup.
The median number of missing teeth seen in each
CVM stage ranged from two to four teeth. The box plot
in Figure 8 showed that there was no direct relationship
between the CVM stage of the subject and the number
of missing teeth, and that there was no statistical
difference between the groups (P50.487).
The CVM index has been used in previous studies to
look at patients undergoing growth dependent treat-ments with as functional appliances but it has not been
used to date to look at tooth agenesis. The CVM index
has been used to investigate mandibular growth poten-
tial in the context of identifying pubertal growth
spurts10–14 and relating skeletal maturation to skeletal
pattern.15Figure 12 (a–c) Box plots of CC2Conc, CC3Conc and CC4Conc
versus CVM stage
296 Casey et al. Scientific Section JO December 2013
The strength of this study included the large sample
size and the inclusion of equal numbers of the diffe-
rent severities of tooth agenesis, despite there being
significantly different levels of prevalence of mild,
moderate and severe tooth agenesis in the popula-
tion. Hence, the study design was effective in minimis-
ing any prevalence bias that might have otherwise
existed.
The CVM method has received recent criticism in a
study that claimed the method had poor reproducibility
and needed to be used in conjunction with other
indicators for guidance with the timing of orthodontic
treatment.24 In contrast, the current study concluded
that the CVM method had good reproducibility,
although the statistics used for the quantitative data
were different to those used in previous study so
comparison between the two is difficult. It must be
accepted that this is one method of assessing skeletal
maturation and it was not the aim of this study to
compare various methods.
The limitations of the study are as follows:
N the genders were combined in the statistical analysis
because there were no statistical significant differences
seen between gender and the study subgroups
(P50.463) or between gender and the numbers of
missing teeth (P50.572). However, as there was a
statistically significant seen between gender and CVM
stages (P,0.001). This was to be expected as CVM
stage is a measure of skeletal development and it is
known that the females reach maturity at a faster rate
than males. There is, however, a risk of false positive
results the greater the number of statistical compar-
isons made;
N linear measurements: although it is possible that any
differences in the linear measurements could be
masked by the degree of error in measurement, this
would not affect the maturation index interpretation
and staging of the CVM index;
N vertebrae imaging: slight tipping of the vertebrae
when the radiograph was taken could change the
degree of convexity. Again this will not affect the
CVM index interpretation, but means that the linear
measurements should be interpreted with caution.
Operator error was kept to a minimum by:
N errors in landmark identification: these were minimized
by operator calibration prior to commencement of
data collection. The measurements were carried out by
one investigator to minimize errors;
N measurement errors: these were assessed by the
repeatability (error) study that was conducted before
data collection;
N projection errors (magnification factors) affecting
linear measurements which were corrected for prior
to statistical analysis.
Clinical significance
The results of the study showed that there was no
cephalometrically measurable difference using this
measurement tool and study population in skeletal
development between the tooth agenesis patients and
controls. If the study population is representative of the
wider population, then it is possible that tooth agenesis
patients may not have a delay in skeletal development.
This can only be stated as a possibility as a direct
extrapolation is not possible without further research.
Studies have made a link between the MSX family of
genes and their roles in both tooth and craniofacial
formation.4–7 It is possible that there may not be a direct
link between the two and that further research to aid our
understanding of the genetics is necessary.
It is important to state that there are many ways of
assessing growth and that this study used one specific
method to assess skeletal maturation to test the null
hypothesis. It is not possible to offer definitive conclu-
sion that no difference exists either between patients
with tooth agenesis and controls or between the
different severities of tooth agenesis only a suggestion
that it is possible that a difference may not exist.
Conclusions
Both age and gender were found to have a statistically
significant relationship with the CVM stages with
increasing age correlating with increasing maturation
stages and females maturing faster than males. The
vertebrae also showed more advanced development in
females compared with males.
The CVM stages did not have a statistically significant
relationship with tooth agenesis or control patients nor
was there any relationship with the different severities of
tooth agenesis. There was no statistically significant
relationship with either increasing age or gender and the
severity of tooth agenesis. In addition to this, there was
no statistically significant difference and the develop-
ment or size of the vertebrae.
The following conclusions can be drawn from the
subjects studied and the measurement tool used:
N there was no detected difference in the skeletal
maturation between patients with and without tooth
agenesis;
JO December 2013 Scientific Section Skeletal maturation in hypodontia and controls 297
N there was no detected difference between the skeletal
maturity of those patients with different severities of
tooth agenesis.
N the data obtained from using this method therefore donot supply sufficient reason to reject the null hypoth-
esis; however, it suggests that it is possible that no
difference exists between the groups.
References
1. Polder BJ, van’t Hof MA, van der Linden FP, Kuijpers-
Jagtman AM. A meta- analysis of the prevalence of dental
agenesis of permanent teeth. Community Dent Oral
Epidemiol 2004; 32: 217–26.
2. Sundram F, Walmsley AD. The management of severe
hypodontia in a young adult patient: a case report. Dent
Update 2003; 30: 326–30.
3. Larmour CJ, Mossey PA, Thind BS, Forgie AH, Stirrups
DR. Hypodotia – a retrospective review of prevalence and
etiology. Part 1. Quintessence Int 2005; 36: 263–70.
4. Jowett AK, Vainio S, Ferguson MW, Sharpe PT, Thesleff I.
Epithelial–mesenchymal interactions are required for msx 1
and msx 2 gene expression in the developing murine molar
tooth. Development 1993; 117: 461–70.
5. Vastardis H, Karimbux N, Guthua SW, Seidman JG,
Seidman CE. A human MSX1 homeodomain missense
mutation causes selective tooth agenesis. Nat Genet 1996;
13: 417–21.
6. Lidral AC, Reising BC. The role of MSX1 in human tooth
agenesis. J Dent Res 2002; 81: 274–78.
7. Alappat S, Zhang ZY, Chen YP. Msx homeobox gene
family and craniofacial development. Cell Res 2003; 13:
429–42.
8. Ruiz-Mealin EV, Parekh S, Jones SP, Moles DR, Gill DS.
Radiographic study of delayed tooth development in
patients with dental agenesis. Am J Orthod Dentofacial
Orthop 2012; 141: 307–14.
9. Baccetti T, Franchi L, McNamara JA, Jr. The cervical
vertebral maturation (CVM) method for the assessment of
optimal treatment timing in dentofacial orthopedics. Semin
Orthod 2005; 11: 119–29.
10. O’Reilly MT, Yanniello GJ. Mandibular growth changes
and maturation of cervical vertebrae – a longitudinal
cephalometric study. Angle Orthod 1988; 58: 179–84.
11. Hellsing E. Cervical vertebral dimensions in 8-, 11-, and 15-
year-old children. Acta Odontol Scand 1991; 49: 207–13.
12. Hassel B, Farman AG. Skeletal maturation evaluation
using cervical vertebrae. Am J Orthod Dentofacial Orthop
1995; 107: 58–66.
13. Franchi L, Baccetti T, McNamara JA, Jr. Mandibular
growth as related to cervical vertebral maturation and body
height. Am J Orthod Dentofacial Orthop 2000; 118: 335–
40.
14. Baccetti T, Franchi L, McNamara JA, Jr. An improved
version of the cervical vertebral maturation (CVM) method
for the assessment of mandibular growth. Angle Orthod
2002; 72: 316–23.
15. Stahl F, Baccetti T, Franchi L, McNamara JA, Jr.
Longitudinal growth changes in untreated subjects with
Class II Division 1 malocclusion. Am J Orthod Dentofacial
Orthop 2008; 134: 125–37.
16. Hobkirk JA, Brook AH. The management of patients
with severe tooth agenesis. J Oral Rehabil 1980; 7: 289–
98.
17. Hobkirk JA, King PA, Goodman JR, Jones SP. Tooth
agenesis: 2. The management of severe tooth agenesis. Dent
Update 1995; 22: 8–11.
18. Dhanrajani PJ. Tooth agenesis: etiology, clinical features,
and management. Quintessence Int 2002; 33: 294–302.
19. Sayinsu K, Isik F, Trakyali G, Arun T. An evaluation of the
errors in cephalometric measurements on scanned cephalo-
metric images and conventional tracings. Eur J Orthod
2007; 29: 105–08.
20. You QL, Hagg U. A comparison of three superimposition
methods. Eur J Orthod 1999; 21: 717–25.
21. Bland JM, Altman DG. Statistical methods for assessing
agreement between two methods of clinical measurement.
Lancet 1986; 327: 307–10.
22. Stahl F, Baccetti T, Franchi L, McNamara JA, Jr.
Longitudinal growth changes in untreated subjects with
Class II Division 1 malocclusion. Am J Orthod and
Dentofacial Orthop 2008; 134: 125–137.
23. Tanner JM, Whitehouse RH, Marubini E, Resele LF. The
adolescent growth spurt of boys and girls of the Harpenden
growth study. Ann Hum Biol 1976; 3: 109–26.
24. Gabriel DB, Southard KA, Qian F, Marshall SD,
Franciscus RG, Southard TE. Cervical vertebral matura-
tion method: poor reproducibility. Am J Orthod Dentofacial
Orthop 2009; 136: 478.e1–e7.
298 Casey et al. Scientific Section JO December 2013