Embed Size (px)
Citation preview

ScientiaVol. 6 Spring 2015
Undergraduate Journal of Scientific ResearchUniversity of Notre Dame

A Letter From Dean Crawford
The College of Science at the University of Notre Dame is establishing itself as an important player in the fight against global problems, from climate change to economic inequality, as well as an integral part in advancing the understanding of some of the most basic and enduring questions of our time. Many of the strategies for tackling these big problems involve collaborations—collaborations across disciplines, with outside institutions, and even with corporations. As you read through this issue of Scientia, you’ll see that this was a big year for collaborations in the College of Science.
We have relationships with top research institutions around the country to provide summer undergraduate research opportunities for our students. This past summer, the first group of eight Notre Dame students spent the summer with our newest partner, MD Anderson Cancer Center in Houston, Texas, performing cancer research and learning about the clinical aspects of medicine.
We are also forming new relationships in Silicon Valley as part of Notre Dame’s California Initiative. The goal of these new collaborations is to provide new career and research opportunities for students; identify partners to help commercialize Notre Dame’s research; and recruit undergraduate, master’s, and Ph.D. students to the University.
Even the production of this incredible student-run journal is a great example of an interdisciplinary collaboration of science students who represent all of the exciting areas of research within the college.
These are just a few of the many collaborations that are strengthening the research enterprise in the College of Science. As research becomes more interdisciplinary, we will find that the answers to some of the world’s most challenging issues will come from collaborations of diverse people who share a common passion for using their talents to change the world.
It has been a pleasure reading the pages of this issue of Scientia. I am very proud of the hard work of this year’s editorial team and I hope you enjoy it as much as I did.
Yours in Notre Dame,
Gregory P. Crawford, Ph.D.William K. Warren Foundation Dean of the College of ScienceProfessor of Physics
PhysicsKatrina Magno, Section Editor
Luke Maillie
BiologyJonathan Jou, Section Editor
Dennis LeeJune Tome
Elizabeth McGoughCandice Park
ChemistryToby Turney, Section Editor
Richard BarrowDaniel Pape
MathematicsColleen Pinkelman, Section Editor
Justin Skycak
HealthLaura Anderson, Section EditorPatrick DoneganElizabeth McGoughJane PangburnKaleigh O’BoyleTiffany ToniHarisa SpahicLeigh Anne Tang
NewsMichael Fliotsos, Section EditorLuke Maillie, Section EditorJohnny Malin
Layout, Design & PublishingKaitlin Jacobson, Section EditorDaniel PapeGrace Reilly
Acknowledgments: Scientia, comprised of exclusively undergraduate work, is sincerely thankful to the students who have submitted their research. Additionally, the Editorial Board expresses its gratitude for the dedication and guidance of Dominic Chaloner, Ph.D., our faculty advisor, Gregory Crawford, Ph.D., the dean of the College of Science for his inspiration, enthusiasm, and support for our mission, Marissa Gebhard and Stephanie Healey for helping us through the publication process, and the College of Science and the Charles Edison Fund for their financial support.
Editorial Board 2014-2015
1
Editors-in-Chief Orrin Belden Katrina Magno
Managing Editors Michael Dinh Kaitlin Jacobson
Photo CreditsMatt Cashore, Steve Toepp, Constance Brukin, Barbara Johnston,
Peter Ringenberg, Catherine McQuestion, Michael Dinh, Cory Ayres

On the Front & Back CoversProfessor Justin Crepp and students work at the Sarah L. Krizmanich telescope, one of the largest university telescopes in the country. It provides undergraduate and graduate students with cutting-edge astrophysics research experience. With a 32-inch diameter mirror and 820mm f/8 optics, the research-grade telescope will also be used to test new instrumentation developed at Notre Dame.
ContentsNews
Biology
Chemistry
4 College of Science New Faculty Spotlight Ijeoma Ogbogu
5 Notre Dame Collaborates with Major Cancer Centers Sarah Fracci
6 Notre Dame Visits D.C. for Science Policy Ethics Seminar Michael Koller
8 Whaley Honored as Indiana Professor of the Year John Richardson
9 Notre Dame Heads West to Form New California Initiative Mary Brinkman
9 New Lightboard Technology Flips the Traditional College Classroom Luke Maillie
10 Notre Dame Undergraduates Find Research Opportunities Off-Campus Michelle Kim, Brennan Lee
11 Boler-Parseghian Center and Warren Family Research Center Partner to Fight Rare and Neglected Diseases Casey O’Donnell
12 Notre Dame Professor Appointed to IUPAP Luke Maillie
13 Vector Control Project Awarded Notre Dame’s Second-Largest Reseach Grant Ever Mariel Cuellar
3
Physics
To our readers,
We are pleased to present the sixth volume of Scientia, Notre Dame’s Undergraduate Journal of Scientific Research. This year’s edition carries on our proud tradition of highlighting the vibrant research undertaken by undergraduates, written by undergraduates, and reviewed by undergraduate peers.
The very name of this journal, Scientia, is derived from the ideas of Sir Francis Bacon, who expressed that scientia, knowledge of the natural world, is itself the proper partner of potentia, or power. Scientia embodies the mission of the College of Science to prepare tomorrow’s scientific leaders to think big while also inspiring them advance learning and contribute to the common good. In the pages of this journal, you will discover papers on topics ranging from the prediction of online advertisement demand to the elucidation of the effects of plasma irradiation on healthy cells. These articles are only small glimpses into the variety of research done by undergraduates across the college.
By driving undergraduate participation in the publication and peer review process, Scientia aims to foster scientific discussion across disciplines, students, and faculty. Beyond the publication of this print journal, we also celebrate the fifth successful year of our monthly Talk Science seminars. By providing a forum for undergraduates and faculty members to present their research in a relaxed and informal setting, the seminars encourage dynamic and interdisciplinary discussion. This year, we introduced the first Talk Science: Innovation Series, which aimed at educating students on the importance of innovative thinking between seemingly disparate topics. We thank our student and faculty presenters this year, who are listed on the final page of the journal. We are also proud to have a launched a new article submission system and a revamped Scientia website—both of which will continue to further Scientia’s mission.
As we prepare to graduate from Notre Dame, we look back on our involvement in Scientia with great fondness and pride. Though we must part ways, we have made every effort to ensure Scientia’s continued success and growth for years to come. We are excited to announce Kaitlin Jacobson and Michael Dinh as Scientia’s next editors-in-chief. Kaitlin and Michael both joined Scientia as freshmen, during which time they took on tasks that vary from coordinating the layout of the journal to writing and selecting the news articles. This year as managing editors they have done phenomenal work organizing many aspects of Scientia. We are confident they will do an excellent job as editors-in-chief.
In closing, we thank all of the people whose support has contributed to the continued success of Scientia. In particular, we would like to recognize Greg Crawford, dean of the College of Science, the staff of the dean’s office, and Prof. Dom Chaloner, our faculty advisor. We greatly appreciate all of the students who submitted their papers for review, as well as their faculty mentors. Finally, we thank all of our staff members, particularly our section editors, for all of their hard work and ideas throughout the year. Without them, Scientia would not be possible nor would it continue to evolve.
In Notre Dame,
Orrin Belden Scientia Co-Editor-in-Chief
From the Editors
32 Absolute Absorption Profile of the Cesium D Lines Andrew Piper
Katrina MagnoScientia Co-Editor-in-Chief
14 Synthesis of a Novel GEX1A Analogue: A Potential Lead Towards the Cure of Niemann- Pick Type C Disease Michael J. Ahlers, Jarred R.E. Pickering, Eve A. Granatosky
Math
17 Inventory Forecasting for Online Advertisements Melissa Krumdick, Sarah Jeffreson, Joshua Nunley, Kunming Wu
22 On Matrix Invariants of Knots Austin Rodgers
26 Numerical Investigation of the 3n+1 Problem and its Continuous Extension Justin Paul Skycak
35 Effects of Atmospheric Pressure Plasma on Cytosine Solutions Emily Kunce
42 Shaping Seed Preference: Familiarity with Food Sources in Forest Deer Mice (Peromyscus maniculatus gracilis) Kaya Moore
39 Assessing Environmental DNA in Lake Water and Ice Sharlo Bayless, Nicole Keller, Joseph Schachner, Charles Cong Xu
ScientiaVol. 6 Spring 2015
Undergraduate Journal of Scientific ResearchUniversity of Notre Dame

4 5scientia.nd.edu SCIENTIA Vol 6 - Spring 2015 scientia.nd.edu SCIENTIA Vol 6 - Spring 2015
news NewsCollege of Science New Faculty SpotlightIJEOMA OGBOGU
Mark Behrens, professor of mathematics, John and Margaret McAndrews Chair, received his B.S. in mathematics and physics and M.A in mathematics at the University of Alabama at Tuscaloosa and earned his Ph. D. in mathematics at the University of Chicago. Behrens’ field of research focuses on the topology of spheres and the information that can be acquired
through analyzing data of spheres through moduli of spaces, also known as algebraic topology. Homotopy, two continuous functions creating a single topological space, is also part of his research agenda. By studying and understanding the stability of these interactions, the knowledge can be used to understand and glean information about the unstable homotopy of spheres.
Heidi Beidinger-Bunnet, professor at the Eck Institute for Global Health, received her B.S. in public health at Indiana University Bloomington, her master’s at the University of Illinois at Chicago, and her Ph.D. at Western Michigan University. Beidinger-Bunnet has experience as the developer of SMK Consulting, an organization which sought to
improve leadership and grant writing. Her work also focused
on student empowerment through the remodeling of existing infrastructure. As project director, she led the redesign of Penn High School and raised the graduation rate almost 30 percent. In South Bend, she has led remolding of infrastructure of four high schools, especially at the student curriculum level.
Martina Bukač, assistant professor of applied and computational mathematics and statistics, received her M.S. at the University of Zagreb, Croatia, and her Ph.D. at the University of Houston. With her experience in higher order mathematics, she brings many research interests to the University, ranging from partial differential equations to fluid-structure interaction. Her publications include: “Fluid-structure Interaction in Biomedical Applications,” “Fluid-structure interaction in blood flow allowing non-zero longitudinal displacement,” and “Stability of the kinematically coupled beta-scheme for fluid-structure interaction problems in hemodynamics” published and co-written in the International Journal of Numerical Analysis and Modeling.
Jon Camden, associate professor of chemistry, received his B.S. in chemistry and music at the University of Notre Dame and his Ph.D. in physical chemistry at Stanford University. Professor Camden specializes in physical and analytical chemistry. His focus is on molecular plasmonics, the interaction between free electrons in a metal and the electromagnetic field and the interaction between molecules and the plasmonic nanostructures. He and his colleagues also focus on surface-enhanced nonlinear spectroscopy. Currently, the Camden group is striving to create new applications of plasmonic nanostructures and to understand the fundamental features of the molecule-plasmon processes that are the fundamentals for these applications. Plasmonic nanostructures have the ability to harvest light and are capable of concentrating it in the near field. These special attributes are a consequence from the collective oscillation of the conduction electrons in a metallic nanostructure; as a result, a myriad of useful applications are being studied and developed. Currently, these areas of interest are nuclear forensics, solar-energy harvesting, and chemical sensing.
Per-Ola Norrby, adjunct professor of chemistry and biochemistry, will educate Notre Dame on the requirements of living in a future sustainable society. This includes understanding the chemical properties and reactions that are needed to turn renewable resources into materials that can be utilized. His current research is focused on learning and experimenting with methods that can change materials found in biology into
useable products. The focus is heavily on alcohols because they are the most abundant of such materials. These techniques will emphasize efficient chemical transformations. This is especially crucial in the SYNFLOW in Europe, which is a network that connects nineteen academic and industrial institutions focused on the catalysts needed to make these
Notre Dame Collaborates with Major Cancer CentersSARAH FRACCI
From Chicago to Houston and South Bend in between, there are now opportunities for both Notre Dame undergraduate students and research faculty to expand their research beyond laboratories on campus. Through the recent establishment of two collaborative efforts with MD Anderson Cancer Center—a powerhouse in data production—and Loyola University of Chicago—an institution with strengths in clinical and translational research—Notre Dame students and faculty are making powerful strides towards eradicating diseases, such as auto-immune disorders, leukemia, and ovarian and breast cancers. While both of these alliances are rather young, they present promising outlooks for the future of research. They provide experiences and learning opportunities for students that contribute to the mission of serving the greater good, by allowing the investigation of possible therapeutics for a variety of diseases.
The coalition with Loyola is an endeavor to provide support for revolutionary cancer research through Notre Dame’s Harper Cancer Research Institute (HCRI), which is a collaboration between Notre Dame and Indiana University School of Medicine South Bend. The collaboration work with Loyola is
special in many ways, one of which includes the establishment of the partnership itself. A few years ago, Professor Sharon Stack, Director of HCRI, had the opportunity to meet with a delegation of senior leadership from Loyola. Beyond the common areas of interest in research, Stack said that the scientists and clinicians of Loyola were motivated to work with Notre Dame because they were interested in a shared mission as two Catholic research institutions. Stack noted, “A large part of the mission of both institutions is to serve the greater good. As practically every family is affected by cancer in one way or another, focusing collaborative efforts on cancer research is one way to help achieve this mission.”
Both HCRI and Loyola bring unique strengths to the table in this collaborative relationship. Loyola serves a diverse patient population with distinct demographics in Chicago, which allows the scientists to answer the questions posed by daily clinical practice. Stack writes, “Working collaboratively can help to ensure that scientists use their knowledge and resources to design model systems that best mimic what is found in humans so that the output from these models (biomarkers, therapeutic targets, basic mechanisms) can help us to more accurately target
chemical processes possible. This information is one of the first steps in creating a livable and eco-friendly world.
T. Alex Perkins, assistant professor of biological sciences, earned his B.A. in computational ecology at the University of Tennessee and his Ph.D. at the University of California, Davis. At UC Davis, he studied population biology utilizing mathematical computational data to analyze and understand the spread of infectious agents, especially malaria and other
vector-borne diseases. His research at Notre Dame focuses on how human migration patterns affect the exposure and spread of these diseases and how these complex interactions may create future consequences, because they are often seen as simple and direct. The main concern of the research is to use computational analysis to examine and control such diseases and create a theory that could predict transmission pathways to rein in infectious agents. These seemingly simple interactions are in fact complex, and this may lead to other consequences. Professor Perkins will
investigate the consequences of controlling transmission of these diseases, use statistical analysis to create a theory about transmission, and control to make predictions about transition networks and possibly prevent them.
Amy Stark, director of the DNA Learning Center, received her B.S. in biology and political science at Valparaiso University. She earned her Ph.D. in human genetics at the University of Chicago. She has a rich background in pharmacogenomics, where a patient’s response to a drug can be predicted by utilizing genetics. Stark’s specialty is chemotherapy predictors. Before coming to Notre Dame, Stark completed her postdoctoral work at the University of Chicago where she studied the predications and response of chemotherapy drugs based on protein level and gene expression. She served as a teaching expert for a genetics course for at-risk high school students developed by EduCuriousTM. The Notre Dame DNA Learning Center is devoted to preparing elementary and high-school students to excel in the age of genetics. As the center’s director, Stark’s work will revolve around offering workshops and research experiences not only for students but also the community. The DNA Learning Center will not only extend the biological and genetic education of high-school and middle school students, but will also arm them for various careers in these fields. Stark, with her many leadership roles, such as the Professional Society for Human Genetics and the American Society for Human Genetics, and her aspiration to serve the community, is an exciting addtion to the College of Science.
Timothy Beers, professor of physics, Notre Dame Chair in Astrophysics. Professor Beers obtained B.S. degrees in physics as well as metallurgical engineering at Purdue University and received his Ph.D. in astronomy at Harvard University. Before coming to Notre Dame, he was University Distinguished Professor at Michigan State University, and the Director
of Kitt Peak National Observatory. Beers’ research stretches across many dimensions of astrophysics and the origin of the elements in our universe. He has made a number of discoveries, based on detailed studies of thousands of the most ancient, chemically primitive stars known. He now leads Notre Dame astronomers in SDSS-IV, the third extension of the Sloan Digital Sky Survey, and focuses primarily on the Milky Way Galaxy. Beers is also co-PI and an Associate Director of NSF Physics Frontier Center, JINA: Joint Institute for Nuclear Astrophysics -- Center for the Evolution of Elements. This program allows many researchers in this field to collaborate toward developing an understanding of the nucleosynthesis history of elements in the universe, as well as the assembly history of the Milky Way.
During the 2014-15 academic year, nearly 30 new facutly and adunjct faculty joined the College of Science. Highlighted here is a small sampling of the newest members of the college.

6 7scientia.nd.edu SCIENTIA Vol 6 - Spring 2015 scientia.nd.edu SCIENTIA Vol 6 - Spring 2015
news Newsthe human condition.”
Some of the many exciting projects that are currently in progress involve new treatments for ovarian cancer; therapies to help the immune system fight cancer; and better models to study leukemia, anti-melanoma drugs. Professor Brian Baker of HCRI and Professor Michael Nishimura of Loyola are currently working on a novel anti-cancer vaccine. Clinical trials using similar anti-cancer vaccines are being run by the NIH for melanoma. Baker and Nishimura are hoping to implement similar trials on liver cancer. Novel projects are being designed and new findings are being discovered frequently due to this collaborative work. With more than ten principal investigators involved, the range of research is expanding. This collaboration is looking to utilize the work of scientists, engineers, mathematicians, and many other professionals.
Notre Dame has also recently expanded its research opportunities by developing a relationship with MD Anderson Cancer Center. An alumnus brought together faculty of Notre Dame and MD Anderson in order to provide opportunities for both institutions. MD Anderson is a data powerhouse and is currently producing large amounts of proteomic and genomic data. Notre Dame undergraduate students are known to be strong quantitatively, so this collaboration was created to provide undergraduates with experience in the field and to provide MD Anderson with students capable of analyzing data. The overall design of this partnership for the long term is to develop partnerships between principal investigators at MD Anderson and Notre Dame, with undergraduates being instrumental in buliding these partnerships. The hope for the future is to have a student work in a lab at Notre Dame, followed by a summer spent working with a PI at MD Anderson. The student would then be able to return to Notre Dame to connect the work of the two PIs and aid the PI in making further advances with the research.
The ten week summer program with MD Anderson started the summer of 2014. Eight Notre Dame students traveled to Houston and participated under the Cancer Prevention
Research Institute of Texas (CPRIT) summer program. This program is aimed at students looking to pursue a career in cancer research. After a very successful first summer for the program, the partnership is breaking from the CPRIT program, in order to make it a stand-alone program where the emphasis will be between the University of Notre Dame and MD Anderson Cancer Center.
The students who participated in the program last summer were not only given the chance to cultivate their learning while in the laboratory, but also the chance to observe the clinical aspects of medicine as well. Many of the students were placed with mentors who were MD/Ph.D.s, providing excellent experience to supplement their Notre Dame education. Megan McGarel, who worked in Professor Valeri LeBleu’s lab in the Department of Cancer Biology, states, “Besides getting a ton of valuable lab experience, I was also able to shadow amazing physician scientists, including Dr. Dennis Hughes, a Notre Dame graduate who is now a MD/Ph.D.” Megan went on rounds, went to clinics, and presented for a tumor board. Megan was even given the opportunity to speak with and learn from Dr. Emil Friereich, who conducted some of the first combined therapy leukemia clinical trials. Matthew Metzinger, a senior at ND, explained how he enjoyed seeing how the discoveries in the laboratory directly impact patients’ treatments, especially in terms of clinical trials and experimental treatments. Although Matthew is uncertain of his role in research in the future, he is sure that he will be taking his experiences gained at HCRI and MD Anderson with him as he moves on to medical school upon graduation.
Notre Dame continues to make strides in the field of cancer research, as has been demonstrated vividly by the recent endeavors to collaborate with MD Anderson Cancer Center and Loyola University’s Cardinal Bernadin Cancer Center, as well as ongoing collaborations with Indiana University School of Medicine. These programs will coninue to provide meaningful research opportunities for undergraduates to learn about research on campus and beyond.
Notre Dame Visits D.C. for Science Policy Ethics Seminar
Toward the end of a long and enduringly frigid winter, spring break offered many students the opportunity to travel to a warm destination or spend some quality time with their families. A select few students, however, saw this as the perfect time to explore the intersection between science research, government policy, and ethics. Twelve College of Science students were selected to participate in the seminar “Science Policy Ethics: Guiding Science Through the Regulation of Research and Funding” offered jointly by the College of Science and the Center for Social Concerns. The seminar served to guide the students in learning about the process of government funding for science research at the federal level.
MICHAEL KOLLER
In its third year, the seminar was organized and guided by student leaders Katrina Magno ’15 and Michael Fliotsos ’16 who coordinated guest speakers and organized meetings during the trip to Washington, D.C. In addition to working with the Notre Dame Federal Relations team, these student leaders collaborated with Dean Gregory Crawford of the College of Science and Kyle Lantz from the Center for Social Concerns. The ten students, including both undergraduate and graduate students from variety of backgrounds within the College of Science, were selected for the seminar through an application process facilitated by the Center for Social Concerns.
This experience of traveling to Washington, D.C., was
The group poses on the steps of the United States Supreme Court Building.preceded by weekly class meetings to help students develop a basic background in both science policy and Catholic Social Teaching. In order to accomplish this, the class sessions leading up to the immersion experience included a variety of experts from different fields. Some of the first speakers for the seminar included: Don Howard, former director and Fellow at the Reilly Center for Science, Technology, and Values; Kyle Lantz, who explored the social concerns of the scientist; Professor David Hyde, director of the Center for Adult Stem Cells and Regenerative Medicine, who discussed his work with stem cells and their importance in terms of human dignity; and Peter Burns, the director of the Energy Frontier Research Center, who talked about his extensive experience in applying for federal research grants. Additional speakers included Martin Murillo, a data scientist for the Notre Dame Global Adaptation Index (ND-GAIN) and Professor Jennifer Tank, a research biologist with the Notre Dame Environmental Change Initiative who spoke about the politically charged nature of scientific research, detailing specifically the challenges presented by her work on the effects of commercial transgenic corn byproducts on agricultural stream ecology. Tank called the students to act toward the pursuit of truth in their future careers in research or policy.
The knowledge gained from the classroom sessions provided a basic foundation from which students were able to ask informed questions during the immersion experience in D.C. Students gained first-hand experience of how science policy and government intersect through meetings with federal research organizations, lobbyists, and other individuals on Capitol Hill.
At the National Institute of Allergy and Infectious Diseases (NIAID) of the National Institutes of Health (NIH) students met with Dr. Gregory Deye, Program Officer at the Parasitology and International Programs Branch at the Division of Microbiology and Infectious Diseases (DMID), as well as Dr. Patrick Duffy, Chief of the Laboratory of Malaria Immunology and Vaccinology. The group also visited the Defense Advanced Research Projects Agency (DARPA), where they met
with Deputy Director Dr. Steven Walker and Biological Technologies Office Program Manager COL Matt Hepburn to hear about the process of developing ambitious and progressive research projects technologies utilized by the military and beyond. Hannah Legatzke ’17 was particularly moved by this visit: “I was impressed by the fact that research conducted by both DARPA and the Naval Research Lab extended beyond military and defense strategies into areas such as global health and climate change. Communication can make the public more aware of the broader benefits of federally-funded research and aid policy-makers to set research priorities that will provide the most benefit to people.”
At the Uniformed Services University of Health Services (USUHS), students learned about medical education for members of the armed forces in addition to touring molecular biology and anatomy labs. Additionally, students were given a tour of USUHS’s state-of-the-art simulation center, where medical students at the University are able to experience simulation scenarios ranging from open combat situations to civilian clinical settings.
Another highlight of the trip was traveling to the Food and Drug Administration (FDA), where regulatory scientist Larry Bauer and Chris Leptak, M.D., Ph.D, from the Office of New Drugs (OND) at the Center for Drug Evaluation and Research (CDER), met with the students to provide an introduction to the history and regulations surrounding the FDA and clinical trials. Dr. Laura Jaeger, a Microbiology reviewer in the Center for Devices and Radiologic Health, Office of In Vitro Diagnostics and Radiology (CDRH/OIR), discussed how the FDA goes about approving new biomedical devices, detailing extensively the close professional relationships the FDA maintains with the small businesses and companies it works with.
The students also visited RADM Mathias Winter, director of Naval Research at the Office of Naval Research, who explained the importance of virtues-driven leadership in scientific research. After this visit, the students travelled to the Naval Research Laboratory, where they received an extensive tour of labs conducting groundbreaking research in a variety of fields from robotics to nanotechnology to climate change and astrophysics.
One of the final meetings of the trip was a discussion with officials from the Environmental Protection Agency (EPA). Senior specialist Dr. Gerald Filbin gave background regarding the mission behind and formation of the EPA’s policy, especially in light of climate change and remedial adaptation efforts. Leanne Nurse, program analyst of the Office of Policy, and Dr. William Hall, conflict resolution specialist, spoke about EPA community engagement and alternative environmental resolutions, respectively.
For the students, the level of personal and intellectual growth over the course of the seminar was described as “eye-opening” more frequently than anything else. “The Science Policy Ethics seminar gave me the opportunity to see the crossroads between scientific research and government policy and understand how extensively these areas influence each other,” said Michael Dinh, ’16. Undoubtedly, this seminar provides an unmatched platform for the passing of ideas between the Notre Dame College of Science, the Center for Social Concerns, and chief leaders in Washington, D.C.

8 9scientia.nd.edu SCIENTIA Vol 6 - Spring 2015 scientia.nd.edu SCIENTIA Vol 6 - Spring 2015
news News
The Carnegie Foundation for the Advancement of Teaching and the Council for the Advancement and Support of Education (CASE) awarded the 2014 Indiana Professor of the Year to Michelle Whaley, a teaching professor and researcher in the Department of Biological Sciences at the University of Notre Dame. Prof. Whaley represents the first professor from the University of Notre Dame to win this prestigious state award. She was among thirty other state recipients who were honored in Washington, D.C this fall for their work and achievement as undergraduate professors, having displayed excellence in teaching and positively influencing the lives and careers of students.
Professor Whaley joined the faculty at Notre Dame in 1993, after completing her Ph.D. at the University of Notre Dame under Prof. Joseph E. O’Tousa on the “Characterization of mda, A Novel Homeobox Gene Involved in the Development of the Drosophila Larval.” Since then, she has taken on a multitude of roles as both an educator and administrator who focuses on undergraduate research. She has helped to create and teach research-based courses such as genetics and cell biology laboratory courses, as well as junior and senior biology honors research seminars. In addition, she is the Director of Research Experience for Undergraduates (REU) in Biological Sciences and the committee chair for Undergraduate Research in Biological Sciences.
Whaley’s honors extend beyond the Professor of the Year for Indiana, having received several awards from Notre Dame during her tenure. These awards include two departmental
Whaley Honored as Indiana Professor of the YearJOHN RICHARDSON
Professor Michelle Whaley teaching her Genetics laboratory class.
New Lightboard Technology Flips the Traditional College ClassroomLUKE MAILLIE
Notre Dame Heads West to Form New California InitiativeMARY BRINKMAN
If your professor records any sort of video supplements for their class, you may find yourself wondering two things: when did the board become transparent and how did my professor learn to write backwards so well? These surprising feats are the result of new Lightboard technology, brought to Notre Dame thanks to a joint effort between the College of Science and OIT’s Academic Technologies Group. The hardware was invented by Northwestern University engineering professor
Michael Peshkin who open-sourced the technology, encouraging other universities to follow suit. But the question remains: how does it work?
For starters, the board itself is made of glass and mounted on an aluminum frame. Since the board is transparent, professors are now able to actually face the camera, enabling them to look at students instead of turning their backs, as occurs when teaching using a blackboard. Strings of LED lights are placed
In the fall of 2014, the University of Notre Dame announced its plans to establish the brand-new Notre Dame California Initiative. Gregory Crawford, dean of the College of Science, has taken on the new role as vice president and associate provost, focusing on the Initiative and its nascent development. When asked about the Notre Dame California Initiative, Crawford stated, “California is really a natural next step for the University. Father Sorin founded us to be a ‘force for good’ in the world, certainly an audacious goal in northern Indiana in 1842, and our history has always pursued that vision with bold thinking and actions…To be a force for good in the world, we want to be present there and bring our Notre Dame spirit and values, as well as bring back to campus the remarkable diversity and entrepreneurial ecosystem that has developed in places like Silicon Valley.”
Since Notre Dame has no physical campus in California at this time, the goal of the Initiative is to establish this presence in a significant way, integrating efforts from the Office of Admissions, Career Services, and Development as well as
Notre Dame started the California Initiative to expand the University’s presence in California.
other departments at the University. There is currently a small staff working on this project, but it is expected to grow as the Initiative develops.
Despite the lack of a physical campus, Notre Dame has high hopes for the California Initiative as a resource in this dynamic region. Dean Crawford described the many services and opportunities for students and alumni such as “internships and experiential learning; recruiting from top high schools; enhanced development efforts; new master’s programs and recruiting for our Ph.D. programs on campus; helping our student and faculty startup companies find talent, leadership, and support; and research efforts in areas that are emphasized in California, such as big data and biomedical.” Notre Dame believes that the Initiative will establish the University firmly in the area and give exposure to researchers. Employers will learn about the excellence of Notre Dame students, discovering, as Crawford posits, “not only their remarkable intelligence and skills but also their virtues and passion for making a positive difference.”
The California Initiative will have opportunities for every major and concentration. While certain programs at the University, like the ESTEEM and Patent Law master’s programs, are clear fits for the culture of California and Silicon Valley, the Initiative will have opportunities for a wide range of fields. When asked about future opportunities the California Initiative will have for Notre Dame, Dean Crawford stated, “I am confident, with no exaggeration, that the opportunities in California are unlimited…There will be opportunities for our students, our faculty, our alumni, and our campus that we haven’t even imagined yet.”
awards given by the senior class; the Kaneb Teaching Award in 1998, 2000, and 2002; and two Joyce Awards for Teaching Excellence.
Her approach to her work of teaching and administration is uniform. Whaley stresses the need for the students to be engaged learners, and seeks to develop authentic research skills in her students that causes them to ask thought provoking questions. Whaley highlights, “treating students as colleagues is key, as well as allowing them to see that in science there are open ended questions.” This allows students to contribute to the research process, an ability that is furthered through her focus on placing students into leadership positions. Whaley focuses on developing undergraduate and graduate teaching assistants, who not only contribute to their own development as teachers but also to
her efforts. She says, “I listen to and learn from undergraduate and graduate TA’s. They have helped shape my courses, and in turn, have made my teaching better.” She also mentors the Senior Leadership Committee in Biology that advises the department on curricular issues and student retention and represents the department at various events.
Whaley contributes much of her success to the culture at Notre Dame, both through the students and her fellow faculty members. “My department and faculty colleagues have been very supportive of many new undergraduate initiatives, especially ones that involve undergraduate research. I am very thankful for that…students here have shown remarkable talents and, through their time and dedication, have shown that they can accomplish amazing things,” said Whaley.
Despite her current involvement and influence, this is just the beginning for both her personal and departmental initiatives. She continues her research on the molecular basis of mosquito vision, which includes the support of several undergraduate researchers. Furthermore, she plans to continue to expand on the projects and opportunities for undergraduate researchers. Whaley says, “I hope to develop a program to allow students to learn about pedagogy and effective teaching methods, and then they can earn a teaching certificate as evidence of their training. Additionally, I would like to develop training to help students ask their own questions. If they can engage in material by asking intellectually deep questions early in their career, it will only strengthen their intellectual curiosity and commitment to their field of study.”
10 11scientia.nd.edu SCIENTIA Vol 6 - Spring 2015 scientia.nd.edu SCIENTIA Vol 6 - Spring 2015
news News
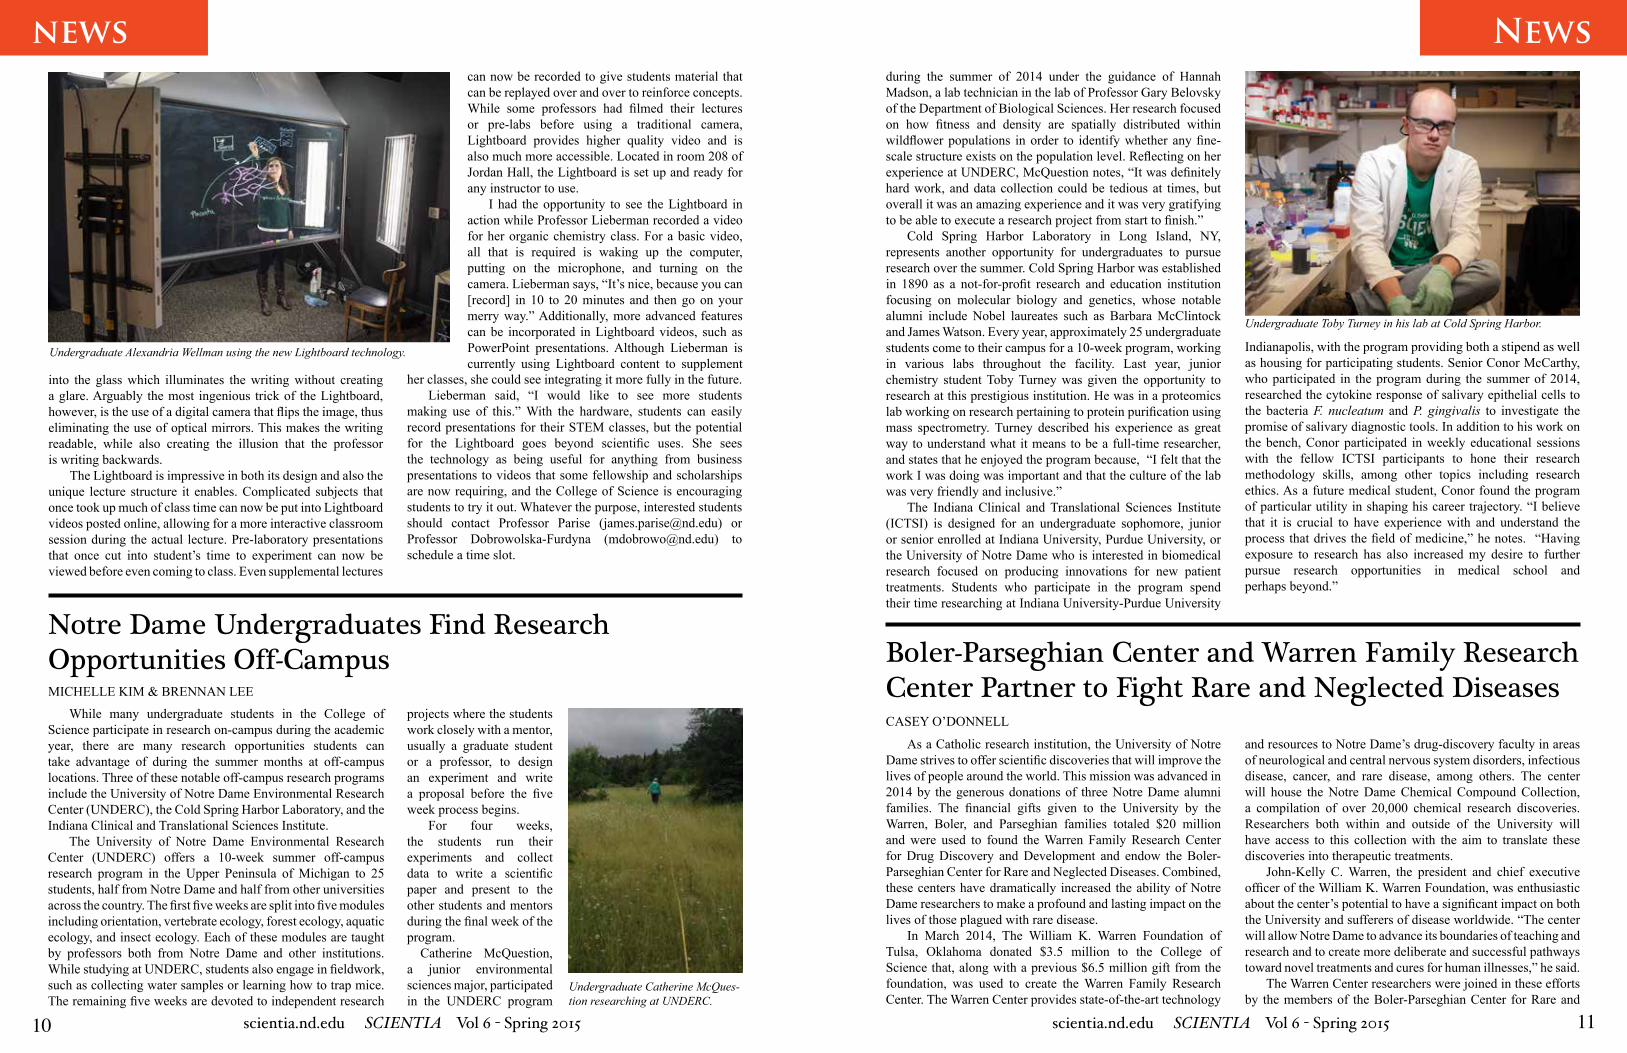
Undergraduate Catherine McQues-tion researching at UNDERC.
projects where the students work closely with a mentor, usually a graduate student or a professor, to design an experiment and write a proposal before the five week process begins.
For four weeks, the students run their experiments and collect data to write a scientific paper and present to the other students and mentors during the final week of the program.
Catherine McQuestion, a junior environmental sciences major, participated in the UNDERC program
into the glass which illuminates the writing without creating a glare. Arguably the most ingenious trick of the Lightboard, however, is the use of a digital camera that flips the image, thus eliminating the use of optical mirrors. This makes the writing readable, while also creating the illusion that the professor is writing backwards.
The Lightboard is impressive in both its design and also the unique lecture structure it enables. Complicated subjects that once took up much of class time can now be put into Lightboard videos posted online, allowing for a more interactive classroom session during the actual lecture. Pre-laboratory presentations that once cut into student’s time to experiment can now be viewed before even coming to class. Even supplemental lectures
Undergraduate Alexandria Wellman using the new Lightboard technology.
can now be recorded to give students material that can be replayed over and over to reinforce concepts. While some professors had filmed their lectures or pre-labs before using a traditional camera, Lightboard provides higher quality video and is also much more accessible. Located in room 208 of Jordan Hall, the Lightboard is set up and ready for any instructor to use.
I had the opportunity to see the Lightboard in action while Professor Lieberman recorded a video for her organic chemistry class. For a basic video, all that is required is waking up the computer, putting on the microphone, and turning on the camera. Lieberman says, “It’s nice, because you can [record] in 10 to 20 minutes and then go on your merry way.” Additionally, more advanced features can be incorporated in Lightboard videos, such as PowerPoint presentations. Although Lieberman is currently using Lightboard content to supplement
her classes, she could see integrating it more fully in the future.Lieberman said, “I would like to see more students
making use of this.” With the hardware, students can easily record presentations for their STEM classes, but the potential for the Lightboard goes beyond scientific uses. She sees the technology as being useful for anything from business presentations to videos that some fellowship and scholarships are now requiring, and the College of Science is encouraging students to try it out. Whatever the purpose, interested students should contact Professor Parise ([email protected]) or Professor Dobrowolska-Furdyna ([email protected]) to schedule a time slot.
Notre Dame Undergraduates Find Research Opportunities Off-CampusMICHELLE KIM & BRENNAN LEE
While many undergraduate students in the College of Science participate in research on-campus during the academic year, there are many research opportunities students can take advantage of during the summer months at off-campus locations. Three of these notable off-campus research programs include the University of Notre Dame Environmental Research Center (UNDERC), the Cold Spring Harbor Laboratory, and the Indiana Clinical and Translational Sciences Institute.
The University of Notre Dame Environmental Research Center (UNDERC) offers a 10-week summer off-campus research program in the Upper Peninsula of Michigan to 25 students, half from Notre Dame and half from other universities across the country. The first five weeks are split into five modules including orientation, vertebrate ecology, forest ecology, aquatic ecology, and insect ecology. Each of these modules are taught by professors both from Notre Dame and other institutions. While studying at UNDERC, students also engage in fieldwork, such as collecting water samples or learning how to trap mice. The remaining five weeks are devoted to independent research
Undergraduate Toby Turney in his lab at Cold Spring Harbor.
Boler-Parseghian Center and Warren Family Research Center Partner to Fight Rare and Neglected DiseasesCASEY O’DONNELL
As a Catholic research institution, the University of Notre Dame strives to offer scientific discoveries that will improve the lives of people around the world. This mission was advanced in 2014 by the generous donations of three Notre Dame alumni families. The financial gifts given to the University by the Warren, Boler, and Parseghian families totaled $20 million and were used to found the Warren Family Research Center for Drug Discovery and Development and endow the Boler-Parseghian Center for Rare and Neglected Diseases. Combined, these centers have dramatically increased the ability of Notre Dame researchers to make a profound and lasting impact on the lives of those plagued with rare disease.
In March 2014, The William K. Warren Foundation of Tulsa, Oklahoma donated $3.5 million to the College of Science that, along with a previous $6.5 million gift from the foundation, was used to create the Warren Family Research Center. The Warren Center provides state-of-the-art technology
and resources to Notre Dame’s drug-discovery faculty in areas of neurological and central nervous system disorders, infectious disease, cancer, and rare disease, among others. The center will house the Notre Dame Chemical Compound Collection, a compilation of over 20,000 chemical research discoveries. Researchers both within and outside of the University will have access to this collection with the aim to translate these discoveries into therapeutic treatments.
John-Kelly C. Warren, the president and chief executive officer of the William K. Warren Foundation, was enthusiastic about the center’s potential to have a significant impact on both the University and sufferers of disease worldwide. “The center will allow Notre Dame to advance its boundaries of teaching and research and to create more deliberate and successful pathways toward novel treatments and cures for human illnesses,” he said.
The Warren Center researchers were joined in these efforts by the members of the Boler-Parseghian Center for Rare and
during the summer of 2014 under the guidance of Hannah Madson, a lab technician in the lab of Professor Gary Belovsky of the Department of Biological Sciences. Her research focused on how fitness and density are spatially distributed within wildflower populations in order to identify whether any fine-scale structure exists on the population level. Reflecting on her experience at UNDERC, McQuestion notes, “It was definitely hard work, and data collection could be tedious at times, but overall it was an amazing experience and it was very gratifying to be able to execute a research project from start to finish.”
Cold Spring Harbor Laboratory in Long Island, NY, represents another opportunity for undergraduates to pursue research over the summer. Cold Spring Harbor was established in 1890 as a not-for-profit research and education institution focusing on molecular biology and genetics, whose notable alumni include Nobel laureates such as Barbara McClintock and James Watson. Every year, approximately 25 undergraduate students come to their campus for a 10-week program, working in various labs throughout the facility. Last year, junior chemistry student Toby Turney was given the opportunity to research at this prestigious institution. He was in a proteomics lab working on research pertaining to protein purification using mass spectrometry. Turney described his experience as great way to understand what it means to be a full-time researcher, and states that he enjoyed the program because, “I felt that the work I was doing was important and that the culture of the lab was very friendly and inclusive.”
The Indiana Clinical and Translational Sciences Institute (ICTSI) is designed for an undergraduate sophomore, junior or senior enrolled at Indiana University, Purdue University, or the University of Notre Dame who is interested in biomedical research focused on producing innovations for new patient treatments. Students who participate in the program spend their time researching at Indiana University-Purdue University
Indianapolis, with the program providing both a stipend as well as housing for participating students. Senior Conor McCarthy, who participated in the program during the summer of 2014, researched the cytokine response of salivary epithelial cells to the bacteria F. nucleatum and P. gingivalis to investigate the promise of salivary diagnostic tools. In addition to his work on the bench, Conor participated in weekly educational sessions with the fellow ICTSI participants to hone their research methodology skills, among other topics including research ethics. As a future medical student, Conor found the program of particular utility in shaping his career trajectory. “I believe that it is crucial to have experience with and understand the process that drives the field of medicine,” he notes. “Having exposure to research has also increased my desire to further pursue research opportunities in medical school and perhaps beyond.”
12 13scientia.nd.edu SCIENTIA Vol 6 - Spring 2015 scientia.nd.edu SCIENTIA Vol 6 - Spring 2015
news News
Vector Control Project Awarded Notre Dame’s Second-Largest Research Grant EverMARIEL CUELLAR
Receiving a mosquito bite is never a reason to celebrate, but in several countries across the globe such a bite can raise concerns far more dangerous than an annoying itch. Disease-carrying mosquitos, or vectors, create a serious health concern that severely affects several populations throughout the world. Though advancements have been made in technologies that control vectors, one with the potential power to eradicate the issue, spatial repellency, has yet to be distributed for public use.
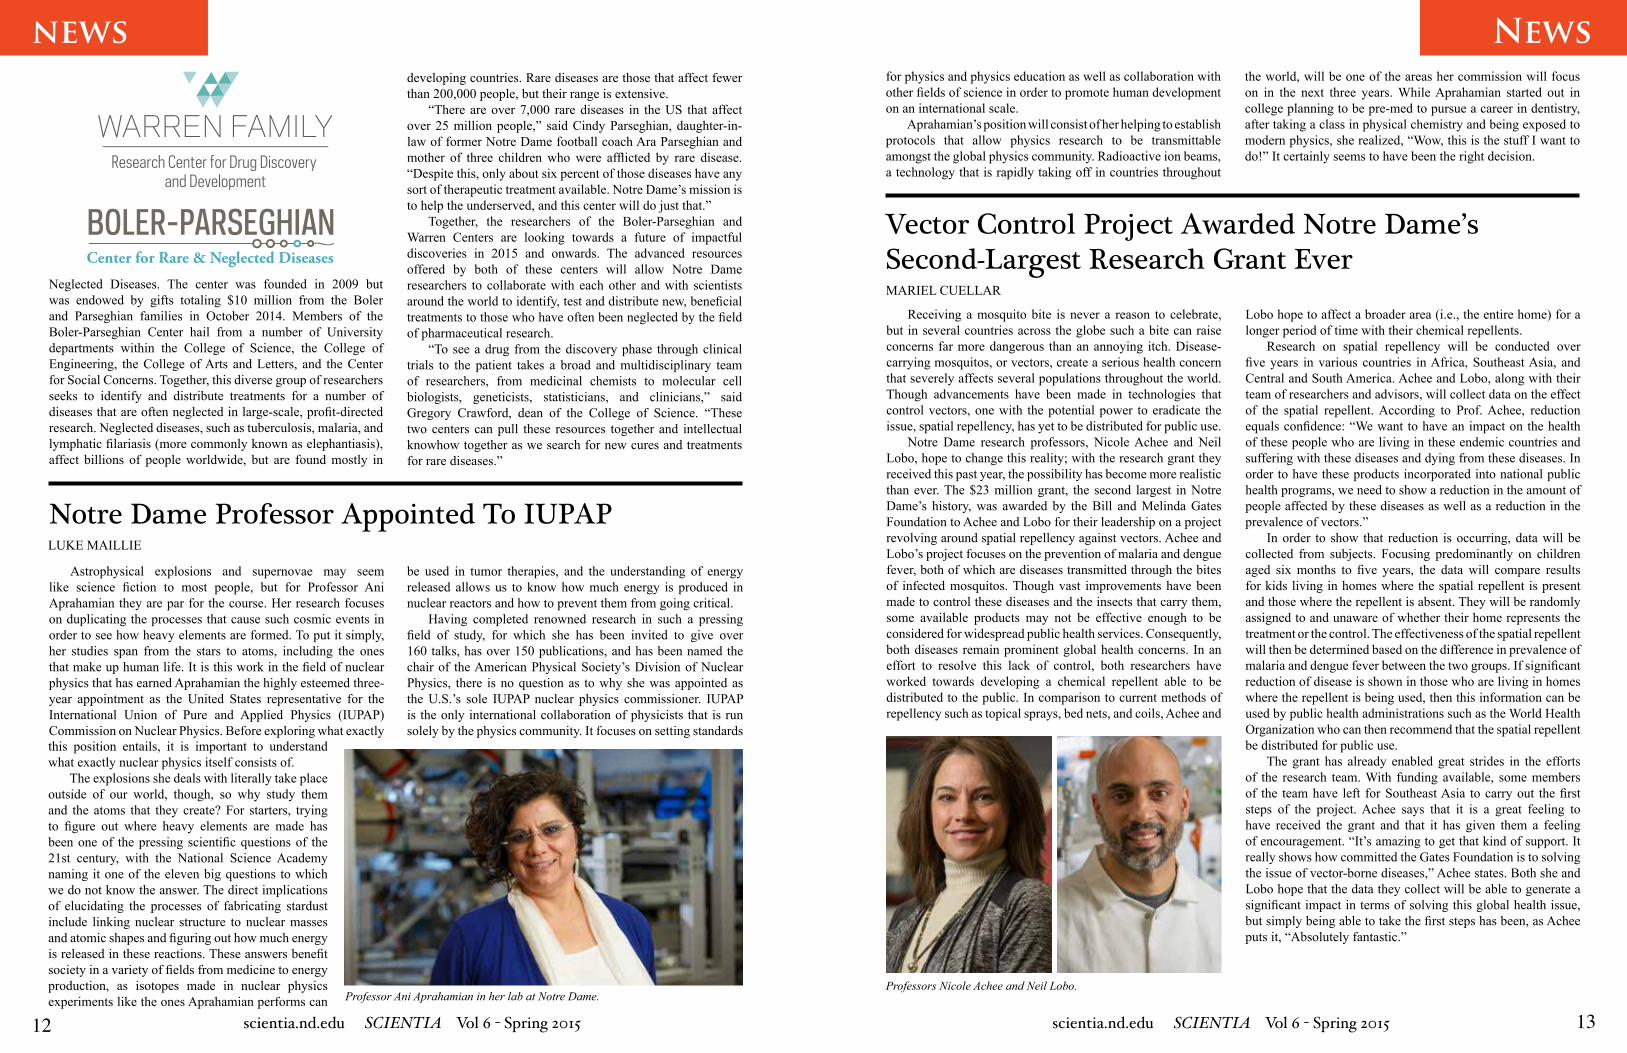
Notre Dame research professors, Nicole Achee and Neil Lobo, hope to change this reality; with the research grant they received this past year, the possibility has become more realistic than ever. The $23 million grant, the second largest in Notre Dame’s history, was awarded by the Bill and Melinda Gates Foundation to Achee and Lobo for their leadership on a project revolving around spatial repellency against vectors. Achee and Lobo’s project focuses on the prevention of malaria and dengue fever, both of which are diseases transmitted through the bites of infected mosquitos. Though vast improvements have been made to control these diseases and the insects that carry them, some available products may not be effective enough to be considered for widespread public health services. Consequently, both diseases remain prominent global health concerns. In an effort to resolve this lack of control, both researchers have worked towards developing a chemical repellent able to be distributed to the public. In comparison to current methods of repellency such as topical sprays, bed nets, and coils, Achee and
Professors Nicole Achee and Neil Lobo.
Notre Dame Professor Appointed To IUPAPLUKE MAILLIE
Astrophysical explosions and supernovae may seem like science fiction to most people, but for Professor Ani Aprahamian they are par for the course. Her research focuses on duplicating the processes that cause such cosmic events in order to see how heavy elements are formed. To put it simply, her studies span from the stars to atoms, including the ones that make up human life. It is this work in the field of nuclear physics that has earned Aprahamian the highly esteemed three-year appointment as the United States representative for the International Union of Pure and Applied Physics (IUPAP) Commission on Nuclear Physics. Before exploring what exactly this position entails, it is important to understand what exactly nuclear physics itself consists of.
The explosions she deals with literally take place outside of our world, though, so why study them and the atoms that they create? For starters, trying to figure out where heavy elements are made has been one of the pressing scientific questions of the 21st century, with the National Science Academy naming it one of the eleven big questions to which we do not know the answer. The direct implications of elucidating the processes of fabricating stardust include linking nuclear structure to nuclear masses and atomic shapes and figuring out how much energy is released in these reactions. These answers benefit society in a variety of fields from medicine to energy production, as isotopes made in nuclear physics experiments like the ones Aprahamian performs can Professor Ani Aprahamian in her lab at Notre Dame.
be used in tumor therapies, and the understanding of energy released allows us to know how much energy is produced in nuclear reactors and how to prevent them from going critical.
Having completed renowned research in such a pressing field of study, for which she has been invited to give over 160 talks, has over 150 publications, and has been named the chair of the American Physical Society’s Division of Nuclear Physics, there is no question as to why she was appointed as the U.S.’s sole IUPAP nuclear physics commissioner. IUPAP is the only international collaboration of physicists that is run solely by the physics community. It focuses on setting standards
Lobo hope to affect a broader area (i.e., the entire home) for a longer period of time with their chemical repellents.
Research on spatial repellency will be conducted over five years in various countries in Africa, Southeast Asia, and Central and South America. Achee and Lobo, along with their team of researchers and advisors, will collect data on the effect of the spatial repellent. According to Prof. Achee, reduction equals confidence: “We want to have an impact on the health of these people who are living in these endemic countries and suffering with these diseases and dying from these diseases. In order to have these products incorporated into national public health programs, we need to show a reduction in the amount of people affected by these diseases as well as a reduction in the prevalence of vectors.”
In order to show that reduction is occurring, data will be collected from subjects. Focusing predominantly on children aged six months to five years, the data will compare results for kids living in homes where the spatial repellent is present and those where the repellent is absent. They will be randomly assigned to and unaware of whether their home represents the treatment or the control. The effectiveness of the spatial repellent will then be determined based on the difference in prevalence of malaria and dengue fever between the two groups. If significant reduction of disease is shown in those who are living in homes where the repellent is being used, then this information can be used by public health administrations such as the World Health Organization who can then recommend that the spatial repellent be distributed for public use.
The grant has already enabled great strides in the efforts of the research team. With funding available, some members of the team have left for Southeast Asia to carry out the first steps of the project. Achee says that it is a great feeling to have received the grant and that it has given them a feeling of encouragement. “It’s amazing to get that kind of support. It really shows how committed the Gates Foundation is to solving the issue of vector-borne diseases,” Achee states. Both she and Lobo hope that the data they collect will be able to generate a significant impact in terms of solving this global health issue, but simply being able to take the first steps has been, as Achee puts it, “Absolutely fantastic.”
Neglected Diseases. The center was founded in 2009 but was endowed by gifts totaling $10 million from the Boler and Parseghian families in October 2014. Members of the Boler-Parseghian Center hail from a number of University departments within the College of Science, the College of Engineering, the College of Arts and Letters, and the Center for Social Concerns. Together, this diverse group of researchers seeks to identify and distribute treatments for a number of diseases that are often neglected in large-scale, profit-directed research. Neglected diseases, such as tuberculosis, malaria, and lymphatic filariasis (more commonly known as elephantiasis), affect billions of people worldwide, but are found mostly in
BOLER-PARSEGHIANCenter for Rare & Neglected Diseases
for physics and physics education as well as collaboration with other fields of science in order to promote human development on an international scale.
Aprahamian’s position will consist of her helping to establish protocols that allow physics research to be transmittable amongst the global physics community. Radioactive ion beams, a technology that is rapidly taking off in countries throughout
the world, will be one of the areas her commission will focus on in the next three years. While Aprahamian started out in college planning to be pre-med to pursue a career in dentistry, after taking a class in physical chemistry and being exposed to modern physics, she realized, “Wow, this is the stuff I want to do!” It certainly seems to have been the right decision.
developing countries. Rare diseases are those that affect fewer than 200,000 people, but their range is extensive.
“There are over 7,000 rare diseases in the US that affect over 25 million people,” said Cindy Parseghian, daughter-in-law of former Notre Dame football coach Ara Parseghian and mother of three children who were afflicted by rare disease. “Despite this, only about six percent of those diseases have any sort of therapeutic treatment available. Notre Dame’s mission is to help the underserved, and this center will do just that.”
Together, the researchers of the Boler-Parseghian and Warren Centers are looking towards a future of impactful discoveries in 2015 and onwards. The advanced resources offered by both of these centers will allow Notre Dame researchers to collaborate with each other and with scientists around the world to identify, test and distribute new, beneficial treatments to those who have often been neglected by the field of pharmaceutical research.
“To see a drug from the discovery phase through clinical trials to the patient takes a broad and multidisciplinary team of researchers, from medicinal chemists to molecular cell biologists, geneticists, statisticians, and clinicians,” said Gregory Crawford, dean of the College of Science. “These two centers can pull these resources together and intellectual knowhow together as we search for new cures and treatments for rare diseases.”
14 15scientia.nd.edu SCIENTIA Vol 6 - Spring 2015 scientia.nd.edu SCIENTIA Vol 6 - Spring 2015
Chemistry ChemistrySynthesis of a Novel GEX1A Analogue: A Potential Lead Towards the Cure of Niemann-Pick Type C Disease
ResultsUtilization of Leighton Ligand for Stereoselective Allylation and Crotylation
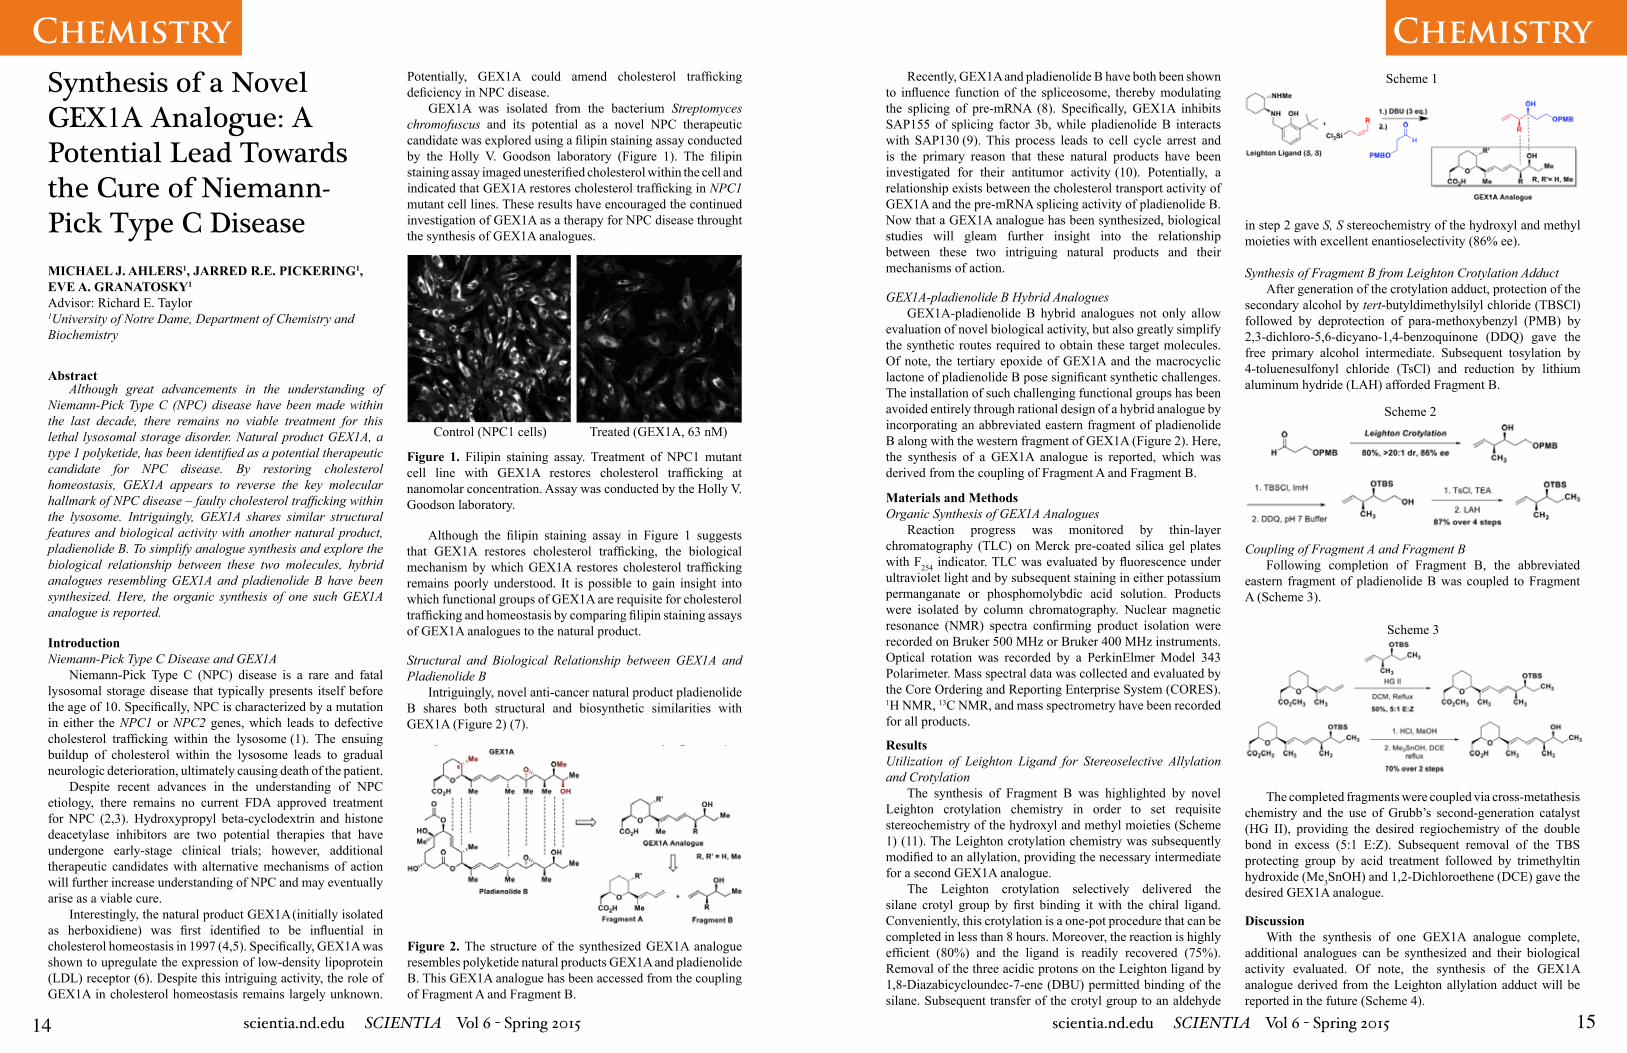
The synthesis of Fragment B was highlighted by novel Leighton crotylation chemistry in order to set requisite stereochemistry of the hydroxyl and methyl moieties (Scheme 1) (11). The Leighton crotylation chemistry was subsequently modified to an allylation, providing the necessary intermediate for a second GEX1A analogue.
The Leighton crotylation selectively delivered the silane crotyl group by first binding it with the chiral ligand. Conveniently, this crotylation is a one-pot procedure that can be completed in less than 8 hours. Moreover, the reaction is highly efficient (80%) and the ligand is readily recovered (75%). Removal of the three acidic protons on the Leighton ligand by 1,8-Diazabicycloundec-7-ene (DBU) permitted binding of the silane. Subsequent transfer of the crotyl group to an aldehyde
AbstractAlthough great advancements in the understanding of
Niemann-Pick Type C (NPC) disease have been made within the last decade, there remains no viable treatment for this lethal lysosomal storage disorder. Natural product GEX1A, a type 1 polyketide, has been identified as a potential therapeutic candidate for NPC disease. By restoring cholesterol homeostasis, GEX1A appears to reverse the key molecular hallmark of NPC disease – faulty cholesterol trafficking within the lysosome. Intriguingly, GEX1A shares similar structural features and biological activity with another natural product, pladienolide B. To simplify analogue synthesis and explore the biological relationship between these two molecules, hybrid analogues resembling GEX1A and pladienolide B have been synthesized. Here, the organic synthesis of one such GEX1A analogue is reported.
IntroductionNiemann-Pick Type C Disease and GEX1A
Niemann-Pick Type C (NPC) disease is a rare and fatal lysosomal storage disease that typically presents itself before the age of 10. Specifically, NPC is characterized by a mutation in either the NPC1 or NPC2 genes, which leads to defective cholesterol trafficking within the lysosome (1). The ensuing buildup of cholesterol within the lysosome leads to gradual neurologic deterioration, ultimately causing death of the patient.
Despite recent advances in the understanding of NPC etiology, there remains no current FDA approved treatment for NPC (2,3). Hydroxypropyl beta-cyclodextrin and histone deacetylase inhibitors are two potential therapies that have undergone early-stage clinical trials; however, additional therapeutic candidates with alternative mechanisms of action will further increase understanding of NPC and may eventually arise as a viable cure.
Interestingly, the natural product GEX1A (initially isolated as herboxidiene) was first identified to be influential in cholesterol homeostasis in 1997 (4,5). Specifically, GEX1A was shown to upregulate the expression of low-density lipoprotein (LDL) receptor (6). Despite this intriguing activity, the role of GEX1A in cholesterol homeostasis remains largely unknown.
MICHAEL J. AHLERS1, JARRED R.E. PICKERING1, EVE A. GRANATOSKY1 Advisor: Richard E. Taylor1University of Notre Dame, Department of Chemistry and Biochemistry
Potentially, GEX1A could amend cholesterol trafficking deficiency in NPC disease.
GEX1A was isolated from the bacterium Streptomyces chromofuscus and its potential as a novel NPC therapeutic candidate was explored using a filipin staining assay conducted by the Holly V. Goodson laboratory (Figure 1). The filipin staining assay imaged unesterified cholesterol within the cell and indicated that GEX1A restores cholesterol trafficking in NPC1 mutant cell lines. These results have encouraged the continued investigation of GEX1A as a therapy for NPC disease throught the synthesis of GEX1A analogues.
Materials and MethodsOrganic Synthesis of GEX1A Analogues
Reaction progress was monitored by thin-layer chromatography (TLC) on Merck pre-coated silica gel plates with F254 indicator. TLC was evaluated by fluorescence under ultraviolet light and by subsequent staining in either potassium permanganate or phosphomolybdic acid solution. Products were isolated by column chromatography. Nuclear magnetic resonance (NMR) spectra confirming product isolation were recorded on Bruker 500 MHz or Bruker 400 MHz instruments.Optical rotation was recorded by a PerkinElmer Model 343 Polarimeter. Mass spectral data was collected and evaluated by the Core Ordering and Reporting Enterprise System (CORES). 1H NMR, 13C NMR, and mass spectrometry have been recorded for all products.
Figure 2. The structure of the synthesized GEX1A analogue resembles polyketide natural products GEX1A and pladienolide B. This GEX1A analogue has been accessed from the coupling of Fragment A and Fragment B.
Figure 1. Filipin staining assay. Treatment of NPC1 mutant cell line with GEX1A restores cholesterol trafficking at nanomolar concentration. Assay was conducted by the Holly V. Goodson laboratory.
Although the filipin staining assay in Figure 1 suggests that GEX1A restores cholesterol trafficking, the biological mechanism by which GEX1A restores cholesterol trafficking remains poorly understood. It is possible to gain insight into which functional groups of GEX1A are requisite for cholesterol trafficking and homeostasis by comparing filipin staining assays of GEX1A analogues to the natural product.
Structural and Biological Relationship between GEX1A and Pladienolide B
Intriguingly, novel anti-cancer natural product pladienolide B shares both structural and biosynthetic similarities with GEX1A (Figure 2) (7).
Recently, GEX1A and pladienolide B have both been shown to influence function of the spliceosome, thereby modulating the splicing of pre-mRNA (8). Specifically, GEX1A inhibits SAP155 of splicing factor 3b, while pladienolide B interacts with SAP130 (9). This process leads to cell cycle arrest and is the primary reason that these natural products have been investigated for their antitumor activity (10). Potentially, a relationship exists between the cholesterol transport activity of GEX1A and the pre-mRNA splicing activity of pladienolide B. Now that a GEX1A analogue has been synthesized, biological studies will gleam further insight into the relationship between these two intriguing natural products and their mechanisms of action.
GEX1A-pladienolide B Hybrid AnaloguesGEX1A-pladienolide B hybrid analogues not only allow
evaluation of novel biological activity, but also greatly simplify the synthetic routes required to obtain these target molecules.Of note, the tertiary epoxide of GEX1A and the macrocyclic lactone of pladienolide B pose significant synthetic challenges. The installation of such challenging functional groups has been avoided entirely through rational design of a hybrid analogue by incorporating an abbreviated eastern fragment of pladienolide B along with the western fragment of GEX1A (Figure 2). Here, the synthesis of a GEX1A analogue is reported, which was derived from the coupling of Fragment A and Fragment B.
in step 2 gave S, S stereochemistry of the hydroxyl and methyl moieties with excellent enantioselectivity (86% ee).
Synthesis of Fragment B from Leighton Crotylation AdductAfter generation of the crotylation adduct, protection of the
secondary alcohol by tert-butyldimethylsilyl chloride (TBSCl) followed by deprotection of para-methoxybenzyl (PMB) by 2,3-dichloro-5,6-dicyano-1,4-benzoquinone (DDQ) gave the free primary alcohol intermediate. Subsequent tosylation by 4-toluenesulfonyl chloride (TsCl) and reduction by lithium aluminum hydride (LAH) afforded Fragment B.
Coupling of Fragment A and Fragment BFollowing completion of Fragment B, the abbreviated
eastern fragment of pladienolide B was coupled to Fragment A (Scheme 3).
The completed fragments were coupled via cross-metathesis chemistry and the use of Grubb’s second-generation catalyst (HG II), providing the desired regiochemistry of the double bond in excess (5:1 E:Z). Subsequent removal of the TBS protecting group by acid treatment followed by trimethyltin hydroxide (Me3SnOH) and 1,2-Dichloroethene (DCE) gave the desired GEX1A analogue.
Scheme 1
Scheme 2
Scheme 3
DiscussionWith the synthesis of one GEX1A analogue complete,
additional analogues can be synthesized and their biological activity evaluated. Of note, the synthesis of the GEX1A analogue derived from the Leighton allylation adduct will be reported in the future (Scheme 4).
Control (NPC1 cells) Treated (GEX1A, 63 nM)
17scientia.nd.edu SCIENTIA Vol 6 - Spring 2015
Math
16 scientia.nd.edu SCIENTIA Vol 6 - Spring 2015
Chemistry
About the AuthorMichael Ahlers is a senior chemistry major hailing from Le Mars, Iowa. At Notre Dame, Michael works in the Taylor Laboratory as a synthetic organic chemist. He joined the Taylor Laboratory in the fall of his sophomore year under the guidance of Ian Harrier. Michael then transitioned projects to begin GEX1A analogue synthesis during the 2013 summer in a full-time assistantship under the mentorship of Jarred Pickering. In addition to this paper, Michael has also written a senior honors thesis concerning his GEX1A analogue research. During the summer of 2014, Michael performed colorectal cancer research at Washington University School of Medicine in St. Louis and Siteman Cancer Center, where he developed patient-derived mouse xenografts and quantified mRNA and protein levels of the chemokine CCL2. Following graduation, Michael plans to spend the summer with his four younger siblings before attending medical school in the fall.
By this approach, it may be possible to achieve an understanding of how GEX1A and pladienolide B affect cholesterol homeostasis at both the cellular and molecular level.
AcknowledgmentsI would like to thank all members of the Taylor Laboratory
during my time as an undergraduate researcher, including Jarred Pickering, Eve Granatosky, Ansel Nalin, John Rieth, Andrew Gasparrini, Ian Harrier, Matthew Wilson, Prof. Cole Stevens, Laura Woods, Danielle Ronnow, Erik Larsen, Chia Fu Chang, Patrick Lichtenberger, Kristin Hillgamyer, Meredith Viera, and Emily Zion. Their kindness and support in teaching me how to become a synthetic organic chemist is greatly appreciated. I would also like to send a special thank you to Prof. Richard E. Taylor and Jarred R. E. Pickering. Prof. Taylor welcomed me to his laboratory over two years ago, and his support for my professional development has been outstanding. I have worked closely with Jarred Pickering on this GEX1A analogue project. I am appreciative of his mentorship in helping me become an independent researcher and his support as a great friend. Additionally, Jarred was responsible for synthesis of Fragment A, isolation of GEX1A from S. chromofuscus broth (along with Eve Granatosky), and development of Scheme 3. I would also like to thank the University of Notre Dame College of Science, the Dr. Norbert Wiech Endowment, the Ara Parseghian Medical Research Foundation, and NIH Grant #T32GM075762 for funding my research efforts.
References
1. H.J. Kwon, L. Abi-Mosleh, M.L Wang, J. Deisenhofer, J.L Gold-stein, M.S. Brown, R.E. Infante. Cell. 137, 1213-1224 (2009).
2. L.A. Mosleh, R.E. Infante, A. Radhakrishnan, J.L Goldstein, M.S. Brown, P. Natl. Acad. Sci. USA. 106, 19316-19321 (2009).
3. N.H. Pipalia, C.C. Cosner, A. Huang, A. Chatterjee, P. Bourbon, N. Farley, P. Helquist, O. Wiest, F.R. Maxfield. P. Natl. Acad. Sci. USA. 108, 5620-5625 (2011).
4. Y. Sakai, T. Yoshida, K. Ochiai, Y. Uosaki, Y. Saitoh, F. Tanaka, T. Akiyama, S. Akinaga, T. Mizukami. J. Antibiot. 55, 855-862 (2002).
5. B.G. Isaac, S.W. Ayer, R.C. Elliott, R.J. Stonard. J. Org. Chem. 57, 7220-7226 (1992).
6. Y. Koguchi, M. Nishio, J. Kotera, K. Omori, T. Ohnuki, S. Komat-subara. J. Antibiot. 50, 970-971 (1997).
7. L. Shao, J. Zi, J. Zeng, J. Zhan, J. Appl. environ. microb. 78, 2034-8 (2012).
8. T.R. Webb, A.S. Joyner, P.M Potter. Drug Discov. Today. 18, 43-49 (2012).
9. Y. Gao, A. Vogt, C.J. Forsyth, K. Koide. ChemBioChem. 14, 49-52 (2013).
10. M. Hasegawa, T. Miura, K. Kuzuya, A. Inoue, S.W. Ki, S. Horinouchi, T. Yoshida, T. Kunoh, K. Koseki, K. Mino, R. Sasaki, M. Yoshida, T. Mizukami. ACS Chem. Biol. 6, 229-233 (2011).
11. L.M. Suen, M.L Steigerwald, J.L Leighton. Chem. Sci. 4, 2413-2417 (2013).
Inventory Forecasting for Online AdvertisementsMELISSA KRUMDICK1, SARAH JEFFRESON2, JOSHUA NUNLEY3, KUNMING WU4
Advisor: Konstantin Dragomiretskiy5
1University of Notre Dame, Department of Applied and Computational Mathematics and Statistics2University of Cambridge, Department of Physics3University of Arkansas, Department of Mathematics4University of California, Berkeley, Department of Mathematics5University of California, Los Angeles, Department of Mathematics
AbstractForecasting time series data is an important component
of operations research. A business’ inventory model requires estimates of future demand, and time series analysis provides tools for selecting a model that can be used to accurately forecast future events. The sample data used in this paper was provided by an online image-based advertising company that was interested in adopting a model to increase the accuracy of its demand planning. For online advertising companies, there exists a strong periodic trend in demand, in accordance with the significant Internet traffic pattern that occurs during a week Accurately taking into account this pattern is necessary to be effective in demand planning. The goal of this project was to create predictive models that could accurately capture a strong weekly trend. After plotting and analyzing this historical data, two time series methods, a de-trended ARIMA FFT method and a Smoothed ARIMA Sinusoid method, were created to capture the trend in clients’ demand. Modeling time series data is a statistical problem, and, as such, the accuracy of the model predictions was evaluated by calculating and comparing different statistical measures of the two models. From a purely mathematical perspective, both models performed well, and the differences in the proposed models were not shown to be statistically significant at the 95% confidence level. Yet, from a business perspective, the Smoothed ARIMA Sinusoid model, with a slight tendency to over forecast, may be better suited for an online advertising company’s business plan.
IntroductionInventory forecasting is a well-studied problem, used by
any company wishing to predict future demand and allocation for a product. However, online advertising inventory presents its own unique set of properties, making the problem more complex. Because the day of the week has a very significant effect on the amount of traffic to a website on any given day, demand exhibits significant periodic seven-day trends that need to be considered when an online advertising company decides how to best allocate its inventory (6). There exists little previous work in literature that deals with this type of inventory.
Creating a predictive model for online advertising demand planning involves feeding historical data on the number of visits
Materials and MethodsTwo forecasting models are considered: the first method
follows the de-trended ARIMA FFT method while the second method treats the smoothed data and residuals separately, via the application of smoothing and ARIMA modeling, and Linear Regression analysis, respectively. The accuracy of these two methods is then evaluated using different statistical criteria.The methodology we used in developing these models was the Box-Jenkins methodology of (1) identification of a suitable model, (2) estimation of parameters using given data, and (3) application, as outlined in (1).
One year’s worth of historical data on asset views from an online image-based advertising company is used to test both of these models. Three hundred days of historical data on total asset views are used to create each model, and each model is then extrapolated to predict the next two weeks. These predictions are then compared with the actual number of impressions for those weeks to test the models’ accuracy.
Method 1: de-trended ARIMA FFT MethodThe first step in the application of the de-trended ARIMA
FFT model is to use linear regression to de-trend the data using the parameterized equation a + bt + ct2.
The second step is to apply the Fast Fourier Transform (FFT) to the de-trended data. The Fast Fourier Transform technique is a computationally fast algorithm to find the Fourier Transform of a discrete time series (2). The FFT transform gives the power spectrum of the series in the frequency domain. By defining a confidence interval within which frequency peaks are ignored, the inverse transform is applied to obtain a model for the overall periodic trends in the data based off of only the significant frequencies.
The next step is to apply the ARIMA (Auto-Regressive Integrated Moving Average) model to these residuals. The ARIMA model is based off of the Auto-Regressive Moving Average model, with the inclusion of differencing to remove long-term trends and seasonality (3).
We plot the ACF (autocorrelation function) and PACF (partial autocorrelation function) of the residuals to determine the ARIMA parameters. The most accurate ARIMA model is determined using these ACF and PACF and experimentation with parameters to minimize the Akaike Information Criterion (AIC), a quantification of information loss.
Using the ARIMA forecast, the periodic pattern extracted, and the trend, the predicted future values due to a combination of de-trending, FFT, and ARIMA can be calculated.
Method 2: Smoothed ARIMA Sinusoid MethodThe first step in the Smoothed ARIMA Sinusoid Method is
to apply Gaussian smoothing to eliminate some of the noise in the data set. Using Gaussian smoothing, more weight is applied
made to the images on all of a company’s publishing websites, or asset views, into a model to extrapolate the data to predict the future number of times an advertisement will be seen, or the future number of advertising impressions. Accurately predicting the number of impressions a company has available to allocate to clients is important for maximizing both revenue and efficiency.
Scheme 4

18 19scientia.nd.edu SCIENTIA Vol 6 - Spring 2015 scientia.nd.edu SCIENTIA Vol 6 - Spring 2015
Math Mathto nearby data points (6). The ARIMA model then is applied to this smoothed data. Again the ACF and PACF of the smoothed data are plotted to determine the ARIMA parameters. Like the de-trended FFT ARIMA model, the ACF and PACF and experimentation to minimize the AIC are used to determine the most accurate ARIMA model.
The next step is to run linear regression to fit sinusoids to the residuals of the Gaussian smoothing. Then future values are predicted using the ARIMA forecast and the periodic trend; this gives the predicted future values due to a combination of smoothing, ARIMA and linear regression.
Statistical ComparisonThe overall accuracy of these two forecasting models has
been evaluated by a number of different methods emphasizing different sources of error. The Mean Error (ME) and Mean Percentage Error (MPE) are used to evaluate the bias, or the measure of a model’s tendency to over- or under- forecast. The Root Mean Square Error (RMSE), Mean Absolute Error (MAE)and Mean Absolute Percentage Error (MAPE) are calculated to measure the absolute variability between estimated and actual values, independent of the bias.
To directly compare the accuracy of the two different models, the Diebold-Mariano Test Statistic is used in hypothesis testing to determine if one model is in fact outperforming the other. The Diebold-Mariano statistic is a comparison statistic—it compares the accuracy of two different forecasting models. The statistic arises through hypothesis test of loss function L(e) which has the following properties:
• Depends on the error at time t.• Equals zero in the absence of any error.• Is never negative.• Increases with the magnitude of error.Common loss functions are formed by taking the squares or
absolute values of each error term. The loss differential is given in the form of the difference between two loss functions. To determine whether one model performs better than the other, this test statistic is used in hypothesis testing. The null hypothesis H0 represents the situation in which the models have equivalent accuracy, while the alternative HA represents the situation in which one model is outperforming the other. An HA of E(dt) ≠ 0 simply states that one of the models is more accurate, while an HA of E(dt) > 0 (right-tailed) states that the first model is more accurate and an HA of E(dt) < 0 (left-tailed) states that the second is more accurate. Looking at the p-values produced by the Diebold-Mariano test determines if the differences in our two models are statistically significant or if we cannot support the claim that one model will perform the other (4).
Continual tracking of the error between a model and real data over the course of time is a good measure of the model’s ongoing performance. Unexpected fluctuations, new periodic cycles, or changes in long-term trends over the course of a campaign may cause growing deviation between predictions and real data. Using a tracking signal would alert a business to this discrepancy as it begins to affect the model, making it easier to identify the source and mitigate the effect for upcoming predictions. The most popular tracking signal is Brown’s tracking signal, which is computed separately for each data point. The tracking signal responds most noticeably
Results Method 1: De-trended FFT Model
After running the linear regression on the historical data to de-trend the data using the parameterized equation a + bt + ct2, a, b and c were found to be: 48618101, 84551, and 0 respectively. Since the t2 term goes to 0, the trend is broadly linear. The residual is a de-trended, mean-zero time series (Figure 1).
The Fast Fourier Transform is applied to the de-trended data to determine the dominant frequencies. The three dominant peaks are at frequency indices of approximately 10, 90, and 165 (Figure 2). Applying FFT to the de-trended data, the periodic trend is modeled using only the significant frequencies found in the power domain (Figure 3). The next step is to plot the ACF and PACF of the residuals to determine the ARIMA parameters (Figure 4). Using the ACF and PACF in the previous step and experimentation with parameters to minimize the AIC the most accurate ARIMA model was found to be a seasonal ARIMA model: ARIMA(0, 1, 1) × ARIMA(0, 1, 1)7 (Figure 5).
Figure 1. Raw data (black line) and linear trend (red line) before de-trending.
Figure 2. Selecting the dominant frequencies.
Figure 3. Dominant frequencies in the time domain; the black line represents the de-trended data, while the red line represents only the dominant frequencies.
Figure 4. ACF (left) and PACF (right) for residuals of Figure 3; the two significant non-zero peaks in the PACF and the exponentially-decaying ACF indicate an AR(q) value of q = 1 and an MA(p) value of p = 0.
Figure 5. The dark-blue curve represents the prediction, the light-blue shaded region represents the 80% confidence interval, and the gray shaded region represents the 95% confidence interval.
Figure 6. The red dots represent the prediction, the yellow dots represent a forecast that lacks any predictive elements, and the blue line represents actual values.
Figure 7. Application of Gaussian smoothing; the black line represents the raw data, while the red line represents the smoothed data.
to sudden changes in predicted values relative to measured values, which the model cannot account for (7). Calculating the tracking signal for each future data point can help provide insight to the overall forecast accuracy of the two models over longer time frames:
• If the tracking signal is fluctuating around zero, the model exhibits no significant bias to either under forecast or over forecast.
• If the tracking signal is becoming increasingly negative, the model is predicting values consistently above those measured
• If the tracking signal is becoming increasingly positive, the model is predicting values consitently below those measured.
Combining the ARIMA forecast, the periodic pattern extracted in Figure 3 and adding back the trend that was removed in Figure 1 produces the predicted future values due to a combination of de-trending, FFT and ARIMA (Figure 6).
Method 2: Smoothed ARIMA Sinusoid MethodThe historical data is first smoothed to get a better picture
of the underlying trends, minus outliers and noise (Figure 7). The ARIMA model then is applied to this smoothed data. Again the ACF and PACF of the smoothed data are plotted to determine the ARIMA parameters (Figure 8). Using the PACF and experimentation with parameters to minimize the AIC, the most accurate ARIMA model was found to be ARIMA (4, 1, 0) (Figure 9). The next step is to run linear regression on the residual of Figure 7 with parameterized equation
a + s1sin( ) + c1cos( ) + s2sin( ) + c2cos( ) + s3sin( ) + c3cos( )
to fit sinusoids to the residuals of the Gaussian smoothing. Since the residuals of ARIMA show a clear weekly pattern, we use a seasonal period of 7 days. The parameters were found to be: a = −15578, s1 = −3840168, c1 = −5537705, s2 = −2437038, c2 = 2633772, s3 = 968355, and c3 = 324038 (Figure 10).
The final step then is to predict future values using the ARIMA forecast and add back the periodic trend extracted (Figure 9, 10). This gives the predicted future values due to a combination of smoothing, ARIMA and linear regression.
π––7π––7
2π––72π––7
3π––73π––7
Statistical Model AnalysisEach test in Table 1 indicates that the Smoothed ARIMA
Sinusoid model (Method 2) is more accurate than the de-trended FFT ARIMA model (Method 1). However, Method 2’s cumulative error shown in Table 2 is slightly higher. Notably, the magnitude of the ME and MAPE for Method 1 are
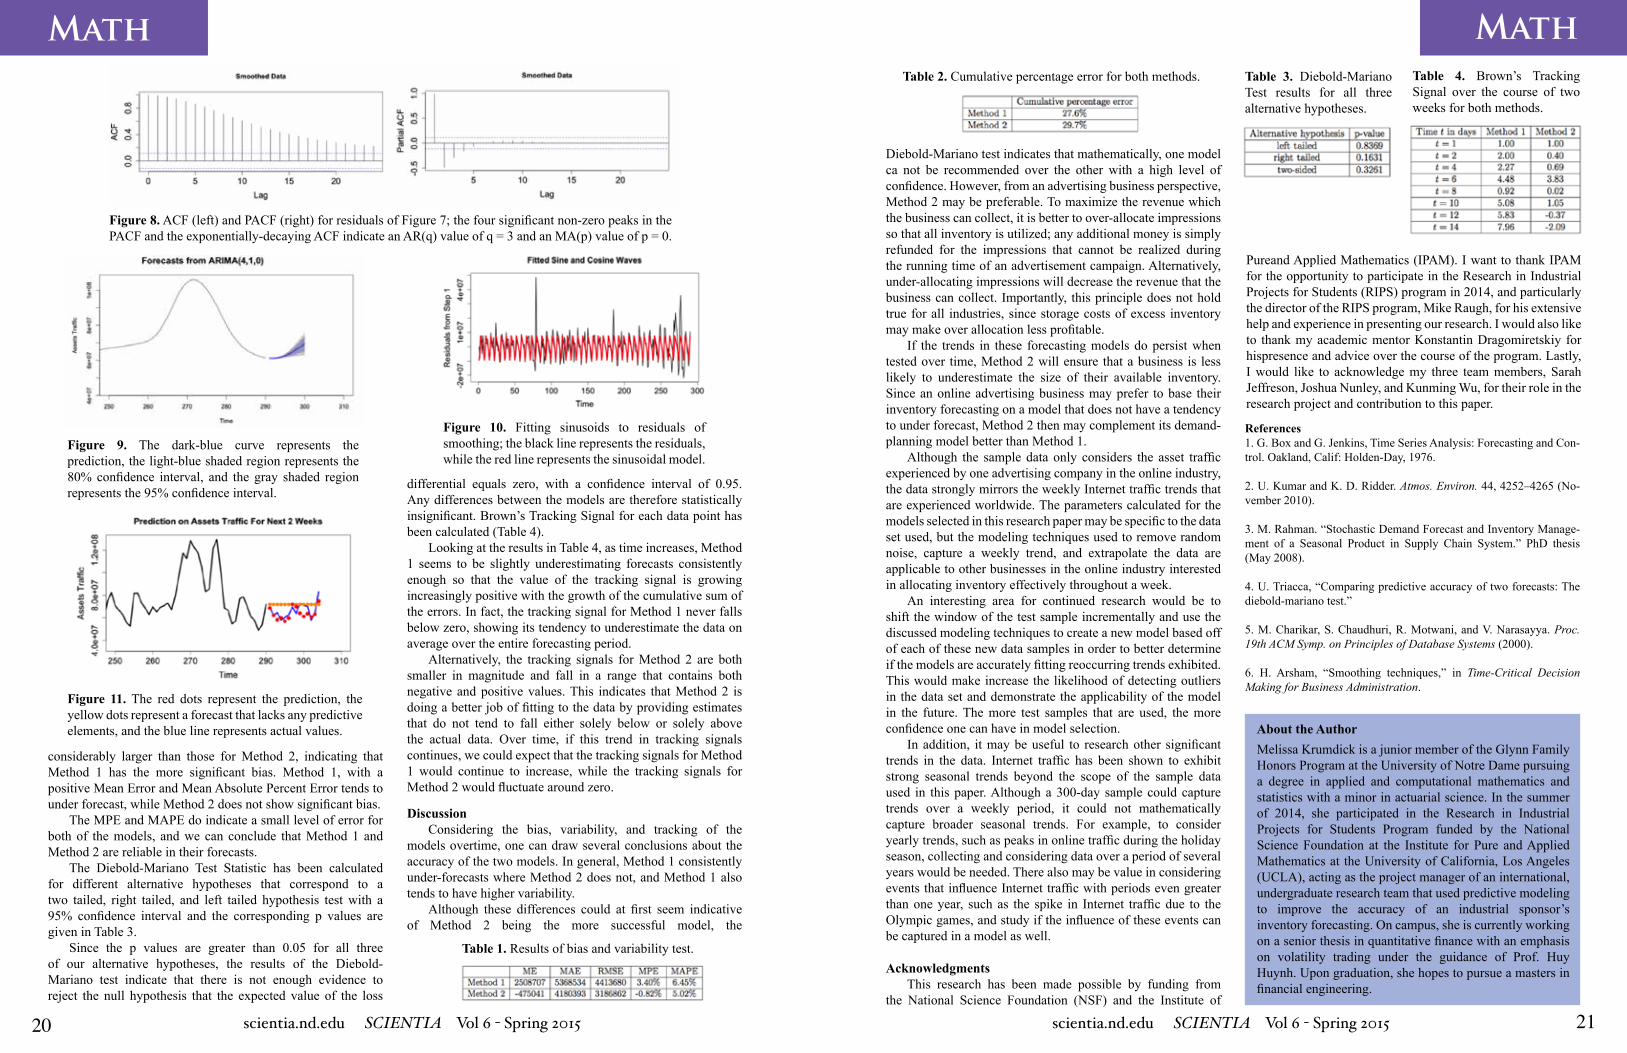
20 21scientia.nd.edu SCIENTIA Vol 6 - Spring 2015 scientia.nd.edu SCIENTIA Vol 6 - Spring 2015
Math Math
Figure 10. Fitting sinusoids to residuals of smoothing; the black line represents the residuals, while the red line represents the sinusoidal model.
Figure 11. The red dots represent the prediction, the yellow dots represent a forecast that lacks any predictive elements, and the blue line represents actual values.
Table 1. Results of bias and variability test.
Table 2. Cumulative percentage error for both methods.
considerably larger than those for Method 2, indicating that Method 1 has the more significant bias. Method 1, with a positive Mean Error and Mean Absolute Percent Error tends to under forecast, while Method 2 does not show significant bias.
The MPE and MAPE do indicate a small level of error for both of the models, and we can conclude that Method 1 and Method 2 are reliable in their forecasts.
The Diebold-Mariano Test Statistic has been calculated for different alternative hypotheses that correspond to a two tailed, right tailed, and left tailed hypothesis test with a 95% confidence interval and the corresponding p values are given in Table 3.
Since the p values are greater than 0.05 for all three of our alternative hypotheses, the results of the Diebold-Mariano test indicate that there is not enough evidence to reject the null hypothesis that the expected value of the loss
Table 3. Diebold-Mariano Test results for all three alternative hypotheses.
Table 4. Brown’s Tracking Signal over the course of two weeks for both methods.
DiscussionConsidering the bias, variability, and tracking of the
models overtime, one can draw several conclusions about the accuracy of the two models. In general, Method 1 consistently under-forecasts where Method 2 does not, and Method 1 also tends to have higher variability.
Although these differences could at first seem indicative of Method 2 being the more successful model, the
References1. G. Box and G. Jenkins, Time Series Analysis: Forecasting and Con-trol. Oakland, Calif: Holden-Day, 1976.
2. U. Kumar and K. D. Ridder. Atmos. Environ. 44, 4252–4265 (No-vember 2010).
3. M. Rahman. “Stochastic Demand Forecast and Inventory Manage-ment of a Seasonal Product in Supply Chain System.” PhD thesis (May 2008).
4. U. Triacca, “Comparing predictive accuracy of two forecasts: The diebold-mariano test.”
5. M. Charikar, S. Chaudhuri, R. Motwani, and V. Narasayya. Proc. 19th ACM Symp. on Principles of Database Systems (2000).
6. H. Arsham, “Smoothing techniques,” in Time-Critical Decision Making for Business Administration.
About the Author
Figure 8. ACF (left) and PACF (right) for residuals of Figure 7; the four significant non-zero peaks in the PACF and the exponentially-decaying ACF indicate an AR(q) value of q = 3 and an MA(p) value of p = 0.
Figure 9. The dark-blue curve represents the prediction, the light-blue shaded region represents the 80% confidence interval, and the gray shaded region represents the 95% confidence interval.
Diebold-Mariano test indicates that mathematically, one model ca not be recommended over the other with a high level of confidence. However, from an advertising business perspective, Method 2 may be preferable. To maximize the revenue which the business can collect, it is better to over-allocate impressions so that all inventory is utilized; any additional money is simply refunded for the impressions that cannot be realized during the running time of an advertisement campaign. Alternatively, under-allocating impressions will decrease the revenue that the business can collect. Importantly, this principle does not hold true for all industries, since storage costs of excess inventory may make over allocation less profitable.
If the trends in these forecasting models do persist when tested over time, Method 2 will ensure that a business is less likely to underestimate the size of their available inventory. Since an online advertising business may prefer to base their inventory forecasting on a model that does not have a tendency to under forecast, Method 2 then may complement its demand-planning model better than Method 1.
Although the sample data only considers the asset traffic experienced by one advertising company in the online industry, the data strongly mirrors the weekly Internet traffic trends that are experienced worldwide. The parameters calculated for the models selected in this research paper may be specific to the data set used, but the modeling techniques used to remove random noise, capture a weekly trend, and extrapolate the data are applicable to other businesses in the online industry interested in allocating inventory effectively throughout a week.
An interesting area for continued research would be to shift the window of the test sample incrementally and use the discussed modeling techniques to create a new model based off of each of these new data samples in order to better determine if the models are accurately fitting reoccurring trends exhibited.This would make increase the likelihood of detecting outliers in the data set and demonstrate the applicability of the model in the future. The more test samples that are used, the more confidence one can have in model selection.
In addition, it may be useful to research other significant trends in the data. Internet traffic has been shown to exhibit strong seasonal trends beyond the scope of the sample data used in this paper. Although a 300-day sample could capture trends over a weekly period, it could not mathematically capture broader seasonal trends. For example, to consider yearly trends, such as peaks in online traffic during the holiday season, collecting and considering data over a period of several years would be needed. There also may be value in considering events that influence Internet traffic with periods even greater than one year, such as the spike in Internet traffic due to the Olympic games, and study if the influence of these events can be captured in a model as well.
Melissa Krumdick is a junior member of the Glynn Family Honors Program at the University of Notre Dame pursuing a degree in applied and computational mathematics and statistics with a minor in actuarial science. In the summer of 2014, she participated in the Research in Industrial Projects for Students Program funded by the National Science Foundation at the Institute for Pure and Applied Mathematics at the University of California, Los Angeles (UCLA), acting as the project manager of an international, undergraduate research team that used predictive modeling to improve the accuracy of an industrial sponsor’s inventory forecasting. On campus, she is currently working on a senior thesis in quantitative finance with an emphasis on volatility trading under the guidance of Prof. Huy Huynh. Upon graduation, she hopes to pursue a masters in financial engineering.
Acknowledgments This research has been made possible by funding from
the National Science Foundation (NSF) and the Institute of
differential equals zero, with a confidence interval of 0.95. Any differences between the models are therefore statistically insignificant. Brown’s Tracking Signal for each data point has been calculated (Table 4).
Looking at the results in Table 4, as time increases, Method 1 seems to be slightly underestimating forecasts consistently enough so that the value of the tracking signal is growing increasingly positive with the growth of the cumulative sum of the errors. In fact, the tracking signal for Method 1 never falls below zero, showing its tendency to underestimate the data on average over the entire forecasting period.
Alternatively, the tracking signals for Method 2 are both smaller in magnitude and fall in a range that contains both negative and positive values. This indicates that Method 2 is doing a better job of fitting to the data by providing estimates that do not tend to fall either solely below or solely above the actual data. Over time, if this trend in tracking signals continues, we could expect that the tracking signals for Method 1 would continue to increase, while the tracking signals for Method 2 would fluctuate around zero.
Pureand Applied Mathematics (IPAM). I want to thank IPAM for the opportunity to participate in the Research in Industrial Projects for Students (RIPS) program in 2014, and particularly the director of the RIPS program, Mike Raugh, for his extensive help and experience in presenting our research. I would also like to thank my academic mentor Konstantin Dragomiretskiy for hispresence and advice over the course of the program. Lastly, I would like to acknowledge my three team members, Sarah Jeffreson, Joshua Nunley, and Kunming Wu, for their role in the research project and contribution to this paper.

22 23scientia.nd.edu SCIENTIA Vol 6 - Spring 2015 scientia.nd.edu SCIENTIA Vol 6 - Spring 2015
Math Math
On Matrix Invariants of KnotsAUSTIN RODGERS1
Advisor: Jeffrey Diller1
1University of Notre Dame, Department of Mathematics
Abstract The study and derivation of matrix invariants of knots is
an interesting and beautiful concept in higher mathematics. It brings together several seemingly disparate areas of mathematics into one confluence of theory; incidentally these areas are algebraic topology, graph theory, knot theory, and abstract algebra. Using techniques developed by Seifert and expanded upon by Murasugi and Cromwell, the ideas addressed in the paper are as follows:
1. Construction of Seifert surfaces of knots2. Construction of Seifert graphs3. Computation of Seifert matrices4. Determination of matrix invariants from properties of
Seifert matrices.
1. Seifert’s AlgorithmAt the core of this section is the fact that the topology of
links is intrinsically related to certain properties of surfaces, most notably the genus of a surface (2). We note that a surface F spans a link L if ∂F is ambient isotopic to L. That is to say, if a surface has a link as its boundary then the topological properties of the surface can in some way be related to the link. We can make the following relation from this assertion:
Definition 2.1.1 The genus of an oriented link is given by the minimal genus of any connected orientable surface that spans the link. If the link is unoriented then the genus is the minimum taken over all possible orientations. We regard genus here as the maximum number of times a surface can be cut along non-intersecting loops without rendering the surface disconnected. e.g. The sphere has genus 0, the torus genus 1, etc.
The problem that comes about with identifying the concept of genus to links is that it is not obvious that our definition of genus is well-defined. For instance, do we know for sure that every knot is bounded by a connected, orientable surface? Thanks to Herbert Seifert and his paper Uber das Geschlecht von Knoten from 1934, we have the following theorem, which answers this question affirmatively.
Theorem 2.1.2 Every link bounds a connected orientable surface.
Proof (sketch). The proof of this theorem follows an algorithmic procedure known as Seifert’s Algorithm.
1. Take a link diagram, L, and orient it arbitrarily.2. At all crossings there will be four strands, two incoming
and two outgoing. We connect each incoming strand with the outgoing strand which will preserve the
initial orientation of the knot. This procedure leaves us with disjoint loops in the plane, which we will call Seifert circles.
3. Span the circles with disks in the plane which we orient to match the orientation on the original diagram. We then connect the circles with twisted rectangles where each crossing once was, oriented in the same way that the original crossing was. The resulting surface is called a projection surface.
All that remains to be shown is that the surface is indeed orientable: We can color the disks according to the orientation from the diagram. If the boundary of a disk is oriented counterclockwise when viewed in the projection from above, then the upper surface is colored red, otherwise it is black.The coloring on the bands can just be extended to match the orientation on the diagram without any problems.
There is the small matter of connectedness, but this can be resolved easily by noting that if the diagram was disconnected then the resulting surface will also be disconnected. If there is a requirement of connectedness imposed upon the su face then we can pipe the components together to preserve the orientation. Therefore any surface generated using this algorithm is orientable and (can be made) connected.
2. Seifert GraphsWhile these relations are invaluable, they are somewhat
impractical and cumbersome to compute for large diagrams and links with more than a few crossings (2). In fact, some links do not permit a minimal genus surface from their standard minimum crossing diagram. At best, using these tools we can get an upper bound for the genus of a projection surface generated by Seifert’s Algorithm.
However, a much deeper result and a more attractive invariant than minimal genus can be constructed using the tools for computing simplicial homologies. In order to do so, we first outline how to construct the Seifert graph, denoted Γ from this point on, of a projective surface. Note that after this procedure the graph will be a connected graph.
Definition 2.2.1 (Seifert Graph construction)1. Start with a link diagram of the desired knot.2. Perform Seifert’s Algorithm on the link diagram.3. Index each vertex of Γ by the individual Seifert circles.4. Connect two vertices with an edge if and only if the
corresponding Seifert circles are joined by a band in the projection surface.
5. (Optional) Label the edges with + or − according to the sign of the crossing in the link diagram.
The following nice theorem emerges from this construction:
Proposition 2.2.2 Let Γ be a Seifert graph constructed from a projective surface F and a link diagram D. Then
rank(Γ) = c − s + 1.
Proof. Suppose Γ is a graph that has V vertices and E edges. For a connected graph with V vertices, any spanning tree will
have V − 1 edges. Because Γ is connected, we know that a spanning tree in Γ contains V − 1 edges. So the rank of Γ is E − V + 1. Given that each vertex corresponds to a Seifert circle and each edge corresponds to a band in the surface, we have that V = s and E = c.
3. Homology on the Seifert GraphWhat we will do from here is analyze the homology on the
Seifert graph of a surface to arrive at a suitable set of loops that can be embedded back into the surface. The interaction of these loops gives us a means by which to calculate the Seifert matrix and derive some invariants from it. It is rather obvious from our previous discussion of homology groups that the holes in the graph can be described by the cycles in the graph. So, intuitively the first homology group of a directed graph should just be the set of directed cycles.
Construction of the Homology of a Graph. Let Γ be a Seifert graph with vertex set V and edge set E.
Definition 2.3.1 Then we define C0(Γ), the group of 0-chains, to be the set of all formal linear combinations of vertices. A typical element in C0(Γ) would be of the form
∑ aivi, ai ∈ ℤ, vi ∈ V(Γ), ∣V(Γ)∣ = n
with group operation of vertex wise addition:
∑ αivi + ∑ βivi = ∑ (αi + βi)vi.
Definition 2.3.2 Likewise, we define C1(Γ), the group of 1-chains, to be the set of all formal linear combinations of edges. A typical element in C1(Γ) would be of the form
∑ γiei, γi ∈ ℤ, ei ∈ E(Γ), ∣E(Γ)∣ = m
with the formation of paths given by the group operation of edge wise addition:
∑ γiei + ∑ ηiei = ∑ (γi + ηi)ei
Definition 2.3.3 (1-cycles) Let δ1: C1(Γ) → C0(Γ) be a linear function such that for all directed edges [vi ,vj] ∈ E (Γ) we have that
δ1([vi ,vj])= vj − vi.
Then define Z1(Γ), the group of 1-cycles associated with a directed graph Γ, to be given by
Z1(Γ) = ker(δ1).
If we can show that Z1(Γ) has a basis, then we can associate the corresponding definition of the homology group to the graph.
Proposition 2.3.4 Z1(Γ) has a basis.
Proof.1. Find a spanning tree, T , for Γ.
2. Label the edges of Γ so that the first r edges are not in the tree, T, i.e e1,...,er ∉ T and er+1,...,en ∈ T.
3. For each edge ei not in the spanning tree, the subgraph T ∪ ei contains a unique cycle.
4. Take zi ∈ Z1(Γ) to be the 1-cycle corresponding to the cycle with proper orientation so that the coefficient ei in the path construction of the cycle is +1.
5. This process gives a set of r 1-cycles. We note that r is equivalent to the rank of the graph and does not depend on the type of tree chosen.
All that remains here is to show that the set of 1-cycles just constructed forms a basis in the group Z1(Γ). If Γ is a tree to start with, then r = 0 and the set is empty. So it fulfills the requirement to be a basis vacuously.
Now suppose that Γ is not a tree. Suppose further that z ∈ Z1(Γ) is a 1-cycle. Every cycle in Γ contains some positive number of edges that do not belong to the spanning tree. Call these edges e1, ..., er and call the cycles they define z1, ..., zr. Then the claim is that these cycles form a basis such that any cycle z can be written as
z = γ1 z1 + ... + γr zr.
We note that addition of two cycles is the symmetric difference of the two sets of edges that make up the cycles, such that multiple edges erase one another in pairs. Clearly, the sum of two cycles is itself a cycle. To see that the list z1, ..., zr is a basis of the group of cycles, suppose that a cycle w = γ1 z1 + ... + γr zr is different from z. Then z + w is also a cycle, but it does not contain any edges that do not belong to the spanning tree, i.e. z + w = 0. Therefore, z = w and every cycle can be expressed as a unique combination of basis cycles.
We can now rather intuitively define the first homology group on a graph, H1(Γ). The kernel of the boundary operator, ∂1, was the group of cycles, Z1(Γ), and since there are no 2-chains in a graph, the image of the boundary operator ∂2, is the zero group. So we have the following equivalence (3):
H1(Γ) = Z1(Γ)/0 = Z1(Γ).
This is convenient because we know that a loop in a triangulated surface F is isotopic to a 1-chain. We can now identify certain characteristics of the surface that contribute to its homology with those that define the homology of a graph. In fact we have the following theorem and corollary:
Theorem 2.3.5 Let F be a projection surface constructed from a link diagram and let Γ be its Seifert graph. Then F collapses to Γ.
Corollary 2.3.6 The homology groups of a projection surface and its Seifert graph are isomorphic.
We now have a procedure whereby we can calculate the first homology group of a surface with boundary L, where L is a link.
1. Construct a Seifert projective surface, F.2. Collapse F to a graph Γ.3. Determine some basis of Z1(Γ), the group of 1-cycles
i=1 i=1 i=1
n n n
n
i=1
m
i=1
m
i=1
m
i=1
m
i=1

24 25scientia.nd.edu SCIENTIA Vol 6 - Spring 2015 scientia.nd.edu SCIENTIA Vol 6 - Spring 2015
Math Math
4. Seifert MatricesThe next construction will give us the necessary objects
from which we can derive the matrix invariants of knots. Essentially what we will do is thicken the surface that we generate using Seifert’s Algorithm and look at the relationships between the different loops in the basis which we select for the first homology group of the Seifert graph. The way that these loops interact when embedded back onto the surface will provide us with the entries of what will be called the Seifert matrix, MK for a knot, K. We calculate this matrix as follows:
1. Define a homeomorphism L : F × [-1,1] → ℝ3 which maps F × {0} to F and which maps F × {1}to the positive side of F. Then any subset X ⊆ F can be lifted out of the surface on either side, such that X + = L(X × {1}) and X − = L(X ×{−1}). We will care about when X is a loop in our surface F, i.e. when X is one of the basis loops, z1,..., zn that we find for the first homology group of the Seifert graph, Γ.
2. To motivate the next step, note that two loops might intersect in our surface. However, if we deform one of them out of the surface, this intersection becomes a crossing, as in a link diagram, and we can analyze the linking number of the two loops. Therefore, we define the mapping called the Seifert pairing, or linking form, of the thickened surface together with the embedded loops from H1(F):
Θ : H1(F) × H1(F) → ℤ
This takes a pair of loops (z1, z2) in the homology group of the surface and generates the integer associated with the linking number of the pair (z1, z2
+).3. Create the array with labels z1 , ... , zn for the rows and
z1+,..., zn
+ for the columns, like the following diagram.
z1+ . . . zn
+
z1
zn Then the matrix MK has as its ij-th entry the linking number of the two loops forming the pair (zi , zj
+).
5. Matrix InvariantsIt must be noted that these matrices themselves are not
the invariants (6). Given that a Seifert graph may have several different possibilities for the choice of cycle basis in its first homology group, the matrix very much depends on this choice and on the diagram from which the Seifert surface is generated.However, there are two invariants that can be arrived at with a little more work: the determinant of a knot and the signature of a knot. Recall from linear algebra that any symmetric matrix A with real-valued entries is congruent to a diagonal matrix,
i.e. there is an orthogonal matrix P with real-valued entries and determinant ±1 such that PAPT has all its nonzero entries on the diagonal. Then we have that the signature of this matrix is the number of positive entries minus the number of negative entries. By Sylvester’s Theorem, we have that congruence operations preserve signature (2). Before stating the next theorem, we make the following definitions:
Definition 2.4.2 Define a function on a Seifert matrix, M1, called a congruence operation, Λ1 which takes M1 → PM1P
T
where P is the matrix noted above.
This operation either interchanges two rows and then interchanges the corresponding columns, or it adds some multiple of one row to another and then the same multiple of the corresponding column to the other related column (6). In a knot theory context, it can be taken to represent the change of order or the change of orientation of the closed curves we take as basis elements of H1(F ), where F is our Seifert surface.
Definition 2.4.3 Define a second function on a Seifert matrix, M1 called an enlargement (or reduction), Λ2, which takes M1 → M2, where M2 is defined as one of the following forms:
or
where the asterisk indicates the presence of an unknown integer.
This function corresponds to the change that occurs in the genus of a Seifert surface due to an ambient isotopy performed on the surface (6).
Definition 2.4.4 If two matrices can be transformed, one into the other, by a finite series of applications of Λ1 and Λ2 then the matrices are said to be S-equivalent.
It follows, then, that if two Seifert matrices are S-equivalent then their corresponding projection surfaces are also equivalent. Thus any property of the Seifert matrix that is invariant under these functions we have defined is a link invariant as well (2). So we have the following theorem:
Theorem 2.4.5 Let M be a Seifert matrix constructed from a projection surface F which spans a link L. Then |det(M + MT )| and the signature of M + MT , denoted σ(M + MT ), are link invariants which depend only on L.
Proof. We want to show that these two properties of the matrix
of the graph, where the number of elements in Z1(Γ) is given by rank(Γ).
4. Embed the cycles back onto the surface F.
. . .
M+M T are invariant under application of the two functions Λ1 and Λ2 we defined earlier. For the congruence operation Λ1, we note that by Sylvester’s Theorem these operations preserve signature.
For the determinant under Λ1, we note that our matrix P which M is related to has determinant ±1. Thus we have that
det(PMP T + (PMP T ) T ) = det(P(M + M T )P T ) = det(P)det(M + M T )det(P T ) = det(M+M T).
Now we have to consider the second function Λ2. The matrix Λ2(M +M T) has the block form
and if we expand the determinant using the lower right block, this yields −det(M + M T ). Since our definition for the determinant of a link was the absolute value of the matrix M + M T , we get that under Λ2 the link determinant is invariant.
For the signature of the link under Λ2 we note that the asterisks in the matrix above can be changed to zeroes by carrying out a change of basis through a finite sequence of applications of Λ1. Then the signature of the matrix is the sum of the signatures of the two diagonal blocks:
M + M T and [ ].
Diagonalizing the second matrix, we see that its signature is zero, and thus signature is preserved under Λ2.
6. ConclusionSo we have seen, over the course of this short foray into knot
theory, that elements of theories from superficially disparate areas of mathematics can combine to produce rather beautiful results. We proved that given a knot diagram, we can construct an orientable surface which can then be translated into a graph via a correspondence between distinct Seifert circles and vertices of the graph (respectively, bands connecting Seifert circles and edges of the graph). From this graph we proved that one can analyze the homology and get an analogous homology of the surface. Then by implementing certain techniques to create a basis of cycles in the graph and embedding these loops into the surface, we can analyze the linking forms on the surface and construct a square matrix, which when added to its transpose, has invariant properties (determinant and signature) under operations which correspond to ambient isotopies on the original knot.
References1. G. Chartrand and P. Zhang, A First Course in Graph Theory (Do-ver Publications, Mineola, NY, 2012).
2. P.R. Cromwell, Knots and Links (Cambridge UP, Cambridge, UK, 2004).
3. A. Hatcher, Algebraic Topology (Cambridge UP, Cambridge, UK, 2002).
4. I.N. Herstein, Abstract Algebra. (Macmillan, New York, 1986).
5. N. Jacobson, Basic Algebra (W.H. Freeman, San Francisco, 1974).
6. K. Murasugi, Knot Theory and Its Applications (Birkhauser, Bos-ton, 1996).
About the Author
0 11 0
Austin is a junior at the University of Notre Dame majoring in mathematics (honors concentration) with a minor in Mediterranean and Middle Eastern studies. He is currently doing math research for his senior thesis with Professor Claudia Polini in the field of commutative algebra and algebraic geometry. He is originally from Seattle, Washington, but lives in Alumni Hall on campus.

26 27scientia.nd.edu SCIENTIA Vol 6 - Spring 2015 scientia.nd.edu SCIENTIA Vol 6 - Spring 2015
Math Math
Numerical Investigation of the 3n+1 Problem and its Continuous ExtensionJUSTIN PAUL SKYCAK1,2
Advisor: Jeffrey Diller1
1University of Notre Dame, Department of Mathematics 2University of Notre Dame, Department of Computer Science
AbstractWe numerically investigate commonalities between the
iterative behavior of a variant T : ℕ → ℕ of the discrete Collatz function and a continuous function f : ℝ+ → ℝ+ that is equivalent to T on ℕ. The function f is a restriction to ℝ+ of Letherman, Schleicher, and Wood’s extension (1999) of T to ℂ. We then then generalize T and f to functions τa,b and Fa,b , where the 3n + 1 rule becomes an + b, and we numerically investigate how a shared property appears to affect the iterative behavior of both functions. Finally, we relate this property to random walks whose proportionality of step size to displacement causes them to converge. It is important to note that the investigations in this paper consist primarily of numerical experiments, rather than proofs, regarding the 3n+1 and an+b maps.
1. IntroductionThe 3n+1 problem, also known as the Collatz problem, the
Syracuse problem, Kakutani’s problem, and Ulam’s problem, is German mathematician Lothar Collatz’s 1937 conjecture about the iterative behavior of the Collatz function C.
Definition The Collatz function C : ℕ → ℕ is defined by
Remark The acronym HOTPO (Half Or Triple Plus One) is frequently used to describe C.
Definition C j is the jth iteration of C. That is, C
j is the composition of C with itself j times. Example
C0(n) = nC1(n) = C(n)C2(n) = (C ◦ C)(n)C3(n) = (C ◦ C ◦ C)(n)
Definition The 3n+1 problem is to prove the Collatz conjecture: for each n ∈ ℕ, there is a k ∈ ℕ such that C k(n) = 1.
Because the 3n + 1 step for an odd n always yields an even number, investigations of the 3n + 1 problem often utilize the function T : ℕ → ℕ defined by
3n + 1 if n ≡ 1 mod 2n/2 if n ≡ 0 mod 2{C(n) =
3n + 12 if n ≡ 1 mod 2
n2 if n ≡ 0 mod 2{T(n) = ––––
. . .
which combines the 3n + 1 step with the inevitable n/2 step afterwards.
The Collatz conjecture is largely supported by computation: Oliveira e Silva (2010) has verified the conjecture for each natural number up to 5 × 260 ≈ 5.8 × 10¹⁸. Furthermore, Lagarias (1985) offered an intuitive argument for the Collatz conjecture by considering iteration sequences of natural numbers under T.
Definition Let n ∈ ℕ. The iteration sequence of n under T is the sequence (n, T(n), T 2(n), ...), or, more compactly, (T j(n)) j=0.
Lagarias showed that if each term of each iteration sequence of T is equally likely to be even or odd, then each odd number in the sequence is expected to be 3/4 the previous odd number. Although Lagarias’s argument provides intuitive support for convergence, it does not guard against periodic cycles and is not a proof because its hypothesis has not been proven.
Despite the 3n + 1 problem’s apparent simplicity, every proposed proof has been shown incomplete, and the Collatz conjecture remains unproven over 70 years since its proposal. Although the 3n + 1 problem is not of immediate practical importance in itself, a solution technique could offer new insights to analysis of complex systems. The 3n + 1 problem lies in the intersection of number theory and dynamical systems, and the mathematics that produces a solution may unite aspects of the two fields.
In this paper, we extend T to a continuous function f : ℝ+ → ℝ+, and we discover commonalities between numerically-observed iterative behavior of T over ℕ and f over ℝ+. Then, we extend the 3n + 1 rule to an + b and generalize T and f to τa,b and Fa,b. We numerically investigate a shared property that appears to be related to the iterative behavior of the functions. Finally, we see how this property relates to random walks whose step size is proportional to displacement.
2. Construction of fNotice that T is bounded by the lines u(x) = and l(x) = .
Thus, a sinusoid which runs along the equilibrium e(x) = = with amplitude and period 2 will intersect u(x) when x is odd and l(x) when x is even. We define f(x) = e(x) − α(x)cos(xπ), which yields
f(x) = –––––– - –––––– cos(πx)
A plot of f (x) is shown below for 1 ≤ x ≤ 50.
∞
3x+1–––2
u(x) + l(x)––––––24x + 1–––––4
–2x
Although all computer programs are susceptible to roundoff error and cannot generate plots over the entirety of ℝ+, it is interesting that every value plotted follows the same trend: the plot suggests that for most points x of f, as j increases, f j(x) settles down and eventually becomes trapped in approximately the interval [1, 2] for 1 ≤ x ≤ 100. Similar plots for larger values of x suggest that f j(x) displays the same settling behavior as j increases.
We also see in f the property that even when seeds (input values) are very close together, their iteration sequences can take quite different paths before they settle.
Below is a plot of f j (174.99), f j (175), and f j (175.01) for 0 ≤ j ≤ 50. Although these three seeds are spaced at merely 0.01, their iteration sequences differ significantly. Small variations in x ∈ ℝ+ can lead to unexpected changes in the iteration sequence of x under f.
As j increases, f j (174.99) oscillates between 1 and 2 with period 1, and f j(175.01) oscillates between ~ 1.193 and ~ 2.139 with period 2.
We see that small variations in n ∈ ℕ can lead to unexpected changes in the iteration sequence of n under T.
Proposition 2. If the Collatz conjecture holds for a number n, then there is a k ∈ ℕ such that T j(n) ∈ {1, 2} for all natural numbers j ≥ k.
Proof. If n satisfies the Collatz conjecture, then there is a k ∈ ℕ such that T k(n)=1. But if T(1) = 2 and T(2) = 1, so 1 → 2 → 1 → 2 → ··· under T.
Remark If the Collatz conjecture is true, then values of iterates of ℕ under T are eventually confined to {1, 2}. This raises the question: how do iterates of ℝ+ behave under f ?
To visualize many iteration sequences at once, we create a 3D plot of f j(x) for 0 ≤ j ≤ 200 on 1 ≤ x ≤ 100:
3. Iterative Behavior of T & fThe Collatz conjecture says that for any n ∈ ℕ, T j (n) settles
down and eventually reaches 1 for some choice of j.Below are graphs of T j (174), T j (175), and T j (176) for 0 ≤
j ≤ 50. Indeed, all three inputs, or seeds, are eventually mapped to 1, consistent with the Collatz conjecture. However, although these inputs, or seeds, are as close to each other as possible, their iterative behavior prior to reaching 1 differs significantly.
n
Proposition 1. The functions f and T are equivalent on ℕ.
Proof. If n ∈ ℕ is even, then cos(nπ) = 1, so
f(n) = - =
If n ∈ ℕ is odd, then cos(nπ) = −1, so
f(n) = - =
Thus, f(ℕ) = T(ℕ).
Note that f can also be realized as a restriction to ℝ+ of Letherman, Schleicher, and Wood’s extension (1999) of T to ℂ.
4n + 1–––––42n + 1––––4 –2
4n + 1–––––42n + 1––––4
3n + 1––––2
4x + 1 2x + 1 4 4

28 29scientia.nd.edu SCIENTIA Vol 6 - Spring 2015 scientia.nd.edu SCIENTIA Vol 6 - Spring 2015
Math Math
However, after sufficiently many iterations, these points appear to converge into one of the cycles (1, 2) or (1.193..,2.139...). This behavior occurs for all points that were tested, although we show only a small interval [174.99, 175.01] for clarity because the graph oscillates so often.
Other points appear to demonstrate the same behavior: they first take different paths, reaching drastically different values after the same number of iterations.
Upon consideration of , the (1, 2) and (1.193...,2.105...), the cycles makes sense. By the chain rule, we know
and we also have that
We see that
4. Generalization to τa,b and Fa,bNow, we will extend T and f to larger, more general classes
of functions.Define the function τa,b : ℕ → ℕ by
where a, b ∈ N ∪ {0} with a + b even and nonzero.
Proposition 3. Provided that a,b ∈ N ∪ {0} are chosen that a + b is even and nonzero, τa,b indeed maps ℕ to ℕ.
Proof. If n is even, then τa,b(n) = n2 ∈ ℕ. Thus, we need only
consider the case when n is odd. If a+b is even, then a, b are either both even or both odd.
Suppose that n is odd. If a, b are both even, then an is even, so an + b is even. Moreover, because a, b are not both zero, we have that τa,b(n) = an+b
2 ∈ ℕ. Alternatively, if a, b are both odd, then an is odd, so an + b is even. Hence τa,b(n)= ––––– ∈ ℕ.
Remark Notice that τ2,1 is equivalent to T.
Using the method that we used to create the continuous extension f of T, we create the continuous extension Fa,b of τa,b. It is given by:
Fa,b(x) = ––––––– - –––––––– cos(πx)
Remark Notice that F2,1 is equivalent to f.
Proposition 4. The functions Fa,b and τa,b are equivalent on ℕ.
Proof. If n ∈ ℕ is even, then cos(nπ) = 1, so
Fa,b(n) = ––––––– - –––––––– = ––
df 2––dx
df 2(x0)––––dx = df ––dx (f(x0))df ––dx (x0),
df (x)––––dx = 1+ –– (cosπx) - 2x + 1 –––– πsinπx.12 4
and df –– (1) = dx
32––
df –– (2) = dx12––
f (1) = 2f (2) = 1{ { , so
df 2(1)––––dx = –– .df 2(2)––––dx = 34
Also, because and , df –– (1.193) = dx 2.105{ df –– (2.193) = dx -0.300
f (1.193) = 2.139 { f (2.193) = 1.193
we have thatdf 2(1.193)––––––dx ≈ .df 2(2.139)––––––dx ≈ -0.632
Since we have | | < 1 for p = 1,2,1.193...,2.193..., we know that the cycles (1,2) and (1.193...,2.139) are attracting.
df 2(p)––––––dx
an + b2 if n ≡ 1 mod 2
n2 if n ≡ 0 mod 2{τa,b = ––––
–
––––
(a + 1)x + b (a - 1)x + b4 4
(a + 1)n + 1 (a - 1)n + 1 n4 4 2
5. Area Investigation of τa,bThe overall iterative behavior of τa,b is related to • how frequently τa,b(n) > n and τa,b(n) < n occur relative
to each other, and• how much greater or lesser τa,b(n) is than n.Both of these aspects are encompassed in sum of a function’s
values function above the line y = x versus below the line y = x.
Accordingly, define the function Ha,b : ℕ → ℕ by
Ha,b(t) = ∑ τa,b(n) - n
where t is odd (for simplicity).Then
Ha,b(t) = ∑ ––––––––– - (2n + 1) + ∑ –– - 2n
= ∑ [(a - 3)n + –––––––]
= (a - 3)(––––) + (––––––)(–––)
= –––– t2 + ––––––– t + –––––––
We see that b does not offer unique contribution to any of the above terms: b is not included in the t2 term, and both a and b contribute in similar ways to the t term and the constant term. Thus, in our upcoming investigation, we will vary a and constrain b = 1.
A contour plot of Ha,1(t) is shown below for 0 ≤ a ≤ 5 and 0 ≤ t ≤ 500.
6. Area Investigation of Fa,bWhen we make the extension from discrete to continuous,
the sum of values above versus below the line y = x turns into an integral, or area, of the values above versus below the line y = x.
Define Ga,b: ℝ+ → ℝ by
Ga,b(t) = ∫ [Fa,b(x) - x] dx
Then
Ga,b(t) = ∫ [––––––––––– - –––––––––– cos(πx) - x] dx
= ∫ [––––––––––– - –––––––––– cos(πx)]dx
= ––––– t 2 + –– t - –– sin(πx) - –––– ∫ x cos(πx) dx
Using integration by parts, we know that
∫ x cos(πx) dx = –– t sin(πt) + ––– cos(πt) - ––– .
Thus, we reach
Ga,b(t) = ––––– t 2 + (–– - –––– sin(πx))t
- –– sin(πx) - –––– cos(πx) + –––––
A contour plot of Ga,1(t) is shown below for 0 ≤ a ≤ 5 and 0 ≤ t ≤ 500.
If n ∈ ℕ is odd, then cos(nπ) = −1, so
Fa,b(n) = ––––––– - –––––––– = –––––
Thus, Fa,b(ℕ) = τa,b(ℕ)
(a + 1)n + b (a - 1)n + b an + b4 4 2
n=1
t
a(2n + 1) + b 2n2 2
t-12––
n=0a + b - 2
2
t-12––
t 2 - 1 a + b - 2 t - 1 8 2 2
a - 3 a + b - 2 7 - 3a - 2b 4 4 4
We see that the Ha,1 = 0 isocline is given approximately by the line a = 3. This makes sense, because the t2 term of Ha,1(t) dominates the other terms: for very large t, we see that
Ha,1(t >> 0) ≈ –––– t2.
Interestingly, a = 3 also appears to be the crossover point from decreasing to increasing iterative behavior, as suggested by the following contour plot of τ
100a,1 (x) for 0 ≤ a ≤ 5 and
0 ≤ x ≤ 500.
a - 38
t
0
(a + 1) x + b (a - 1) x + b4 4
(a + 3) x + b (a - 1) x + b4 4
a - 3 b b a - 18 4 4π 4
t
0 t
0 t
0
a - 3 b a - 18 4 4π b a - 1 a - 1
4π 8π2 8π2
1 1 1 2π2 2π2π
t
0
an + b2
n=0 n=0
t-12––

30 31scientia.nd.edu SCIENTIA Vol 6 - Spring 2015 scientia.nd.edu SCIENTIA Vol 6 - Spring 2015
Math Math
7. Comparison to Random WalksIn the previous two sections, we saw that the ––– t2 term
appears to tell us a lot about the behavior of τa,b and Fa,b. In the case of b = 1, when one of the functions is positive in the t2 term, it increases over time, but when one of the functions is zero or negative in the t2 term, it appears to settle down regardless of the t or constant terms. Thus, the ––– t2 term is the focal point of this last investigation.
Let ga : ℝ+ → ℝ be a function that satisfies
∫ [ga(x) - x] dx = ––– t
2
We see that, just as for Ha,b, the Ga,1 = 0 isocline is given approximately by the line a = 3, and for very large t we have
Ga,b(t >> 0) ≈ –––– t2.
Again, a = 3 appears to be the crossover point from decreasing to increasing iterative behavior, as suggested by the following contour plot of F
100a,1 (x) for 0 ≤ a ≤ 5 and 0 ≤ x ≤ 500.
a - 38
a - 38
a - 38
a - 38
t
0
Then we have
∫ ga(x)dx = ––– t2 + –– t2 = –––– t2
And we see that
ga(x) = –––– x
When -5 < a < 3, we have that |––––| < 1, and so the iterate g
ka(x) approaches 0 as k increases. However, when a > 3, we
have that |––––| > 1 and so the iterate g ka(x) increases without
bound as k increases.Thus, it is not surprising that a = 3 appears to form a boundary for the cross-over from decreasing to increasing iterative behavior (at least, when b = 1).
It may seem surprising that we saw eventually decreasing behavior for F and τ when a = 3. When a = 3, we have that g3(x) = x, and so g
k3(x) = x for all k. However, F3,b(x) and
τ3,b(x) include fluctuations from the line y = x on the order of x. These fluctuations may have a role in the convergent behavior for a = 3.
Indeed, fluctuations play a role in the dynamics of random walks. Consider a random walk of the form
r(x) = x + δx
where δ takes on values +λ and -λ, where λ > 0, with equal probability. We see that r(x) moves x right or left by λ units for each iteration. However, writing
r(x) = (1 + δ)x,
we see that the expected value E[r k(x)] of r k(x) is
E[r k(x)] = x (1 + λ) –– (1 + λ) –– = x(1 - λ2) ––
As long as 0 < λ < √2 , we have that 0 < |1 - λ2| < 1. Thus, even if λ is nonzero but arbitrarily small, we have that for each x, E[r k(x)] → 0 as k → ∞.
ConclusionsWe extended the discrete function T on ℕ to the continuous
function f on ℝ+. Using plots we saw that although iteration sequences T and f change unexpectedly even with small changes in initial input, both functions appear to settle down after many iterations. T appears to cycle between the values 1 and 2, while f appears to become trapped in (or quite close to) the cycles (1, 2) and (1.193..., 2.139...).
We generalized T and f to larger classes of functions τa,b and Fa,b, and we saw that their sums and integrals above the line y = x on the interval [0, t] depends heavily on the ––– t2 term.For b = 1, when a < 3, the term is negative, and both τa,1 and Fa,1 appear to settle; when a > 3, the term is positive, and both τa,1 and Fa,1 appear to increase without bound. When a = 3, as in the Collatz conjecture, the term vanishes. However, when a = 3, the simplest function whose integral above the line y = x on [0, t] is ––– t2 becomes the identity function, whose iterates do not
a - 3 1 a + 18 2 8
t
0
a + 14
a + 14
a + 14
k k k2 2 2
a - 3 8
a - 3 8
AcknowledgmentsI would like to thank my advisor, Professor Jeff Diller, for
his curious insights, advice, and encouragment, and I thank my friend Nicholas Lohr for his helpful comments and suggestions that improved the clarity of this paper.
References1. J.C. Lagarias. Am. Math. Mon. 92,3-23 (1985).
2. S. Letherman, D. Schleicher, and R. Wood. Exp. Math. 8:3,241-252 (1999).
3. T. Oliveira e Silva. "Empirical verication of the 3x + 1 and related conjectures". In The Ultimate Challenge: The 3x + 1 Problem, J.C. Lagarias, ed. (American Mathematical Society, 2010).
About the Author
settle. Analogy to random walks offers an intuitive explanation for why small fluctuations from y = x that are proportional to x, as found in τa,b and Fa,b, can give rise to settling behavior.
Justin Paul Skycak is a freshman honors mathematics and computer science major from South Bend, Indiana. He has researched in the fields of physics (improving sound sensors for the COUPP dark matter detector; testing scintillator-wavelength shifter combinations for use in the CMS detector) and mathematics, but he has recently found his niche in the intersection of complex systems and network science. Justin currently investigates brain neuronal networks and cell mitochondrial networks with Prof. Dervis Can Vural at Notre Dame’s Interdisciplinary Center for Network Science and Applications, and he will spend this summer 1) working on a full-scale computational model of the primate visual cortex at Los Alamos National Lab and 2) developing blueprints for creation of a wiki-inspired research project database, a personal project he hopes to complete before he graduates. In his free time, Justin enjoys composing and performing music for guitar and observing real-life complex social networks.
––

32 33scientia.nd.edu SCIENTIA Vol 6 - Spring 2015 scientia.nd.edu SCIENTIA Vol 6 - Spring 2015
Physics PhysicsAbsolute Absorption Profile of the Cesium D LinesANDREW PIPER1
Advisor: Carol Tanner1
1University of Notre Dame, Department of Physics
AbstractIn this paper we present a theoretical absolute absorption
profile of the Cesium D lines, within the weak probe beam limit. This model incorporates the three primary elements that determine the overall absorption profile of any species: the line strengths of various electronic transitions, Doppler Broadening, and the electronic susceptibility of the material. The transmission profiles are plotted as a function of the laser detuning, and compared to those of the Rubidium D lines as calculated by Siddons et al.
IntroductionThe alkali metals, particularly Rubidium and Cesium,
have always been of special interest in Atomic, Molecular, and Optical Physics. The SI (International System of Units) definition of the second is defined by the Hyperfine Splitting of the ground state of 133Cs, with a frequency of 9.192 GHz (1). Also, vaporized 87Rb is currently one of the most common materials for the production of Bose-Einstein Condensates (2). There are several reasons for this, one of them being that alkali metals have a single valence electron simplifying their energy spectra. In addition both Cesium and Rubidium feature ground state transitions with wavelengths in the near infrared, for which there are inexpensive yet reliable lasers commercially available.
In this paper we study the absolute absorption profiles of the Cs D lines. With the goal of later comparing these absorption profiles with experimental data. The two D lines of Cesium involve those hyperfine transitions between the ground state of Cs, and it’s first two excited states (Fig. 1).
Optical absorption occurs when monochromatic light travels through a medium, and is governed by the Beer-Lambert Law for the decay in intensity as it travels along the optical axis:
I(z) = I0e-α(v,T) · z (Eq. 1)
Where I(z) is the intensity a distance z into the medium, IO is the initial intensity, and α(ν,T) is the absorption coefficient as a function of ν, the frequency of the incident light, and T is the temperature of the medium. This absorption coefficient depends on a variety of parameters. First and foremost, the various electronic transitions of the species that are near the incident light frequency. Each transition will have its own value of α(ν,T) which can then be summed over to achieve the total absorption coefficient αTotal(v,T) = ∑αi(v,T). For a closed cell of length, L, the intensity of light that exits the cell as a fraction of
the initial intensity is given by τ, the transmission:
τ = = e-∑ai(v,T) · L (Eq. 2)
In this paper we will generate plots of the transmission functions of the Cs D line transitions. We begin with the derivation of the absorption coefficients as functions of α(ν,T), and conclude with the generated transmission plots for expected laboratory conditions (L=50mm and T=22ºC).
Figure 1. Hyperfine Structure of the Cesium D Lines (Depicting Data by V. Gerginov et al. (3))
Materials and MethodsThe calculation of the absorption coefficient for each
relevant transition is determined by three factors which will each be treated individually: the line strengths of the transition, Doppler Broadening due to thermal motion, and the Susceptibility of the species (4).
For the purposes of this paper we will use the regular angular momentum quantum numbers ∣Fg , mFg⟩ for the ground state of Cesium, 62S1/2. The quantum number Fg represents the sum of the net nuclear spin, I, and the electron spin, J. The quantum number mFg the magnetic quantum number of the total atom, nucleus and valence electrons. The D1 line consists of those transitions between the 62S1/2 ground state and the 62P1/2 state, the D2 line consists of those between the 62S1/2 state and the 62P3/2 state.
Line StrengthsThe line strength of an electronic transition can be calculated
from the dipole matrix elements ⟨Fg , mFg∣erq∣Fe , mFe⟩.This matrix element can be rewritten as a product of Wigner 3-j, Wigner 6-j symbols, and a reduced matrix element, ⟨Lg∣er∣Le ⟩, to arrive at the following Eq. 3. Note that the matrix in parenthesis is a Wigner 3-j symbol and those matrices in curly brackets represent 6-j symbols.
F, L, S, J, and mF are their usual angular momentum quantum numbers and q represents the change in mF due to the
I(z = L)–––––IO
(-1)2Fe+I+Jg+Je+Lg+S+mFg+1⟨Lg│er│Le⟩
⋅√(2Fg+1)(2Fe+1)(2Jg+1)(2Je+1)(2Lg+1) Fe 1 Fg Jg Je 1 Lg Le 1
⋅ (mFe -q -mFg){Fe Fg I }{Je Jg S}
interaction with the probe beam. For our calculations we took q to be 0 for the use of linearly polarized light. Collecting the Wigner 3-j and 6-j symbols into a single constant cmF , we can rewrite the above equation as:
⟨Fg , mFg∣erq∣Fe , mFe⟩ = cmF⟨Lg∣er∣Le⟩ (Eq. 4)
The square of the above dipole matrix element determines the strength of the transition. If we assume that there are no magnetic fields in our experiment then each D line transition is degenerate in mF. This means that the total strength for a hyperfine transition, Fg→ Fe, is determined by the sum of the squares of the individual Zeeman transitions or C
2F = ∑c
2mF. Note that ⟨Lg∣er∣Le⟩ is the same for all Zeeman transitions in a given hyperfine transition. Table 1 provides the calculated value of C
2F for each of the possible hyperfine transitions.
In order to calculate the value of the reduced matrix element ⟨Lg∣er∣Le⟩, we turn to the expression for the decay rate of a hyperfine transition (6).
Γ = ∣⟨Jg∥er∥Je⟩∣2 (Eq. 5)
Where ω0 is the angular frequency of the transition, and the other symbols are constants as they are usually defined. This formula can be written in terms of the reduced matrix element ⟨Lg∣er∣Le⟩ and a Wigner 6-j symbol. Rearranging terms we arrive at an equation which holds true for transitions on both the D1 and D2 lines.
⟨Lg∣er∣Le⟩ = 3√ l
Note: In reality, there is a small measurable difference between ⟨Jg∥er∥Je⟩ and the product of ⟨Lg∣er∣Le⟩ and the Wigner 6-j symbol. See (9).
Doppler BroadeningThe Doppler Broadening of the absorption of light is
attributed to the change in the frequency of light when moving from one inertial frame to another. Therefore, when calculating the absorption we need to account for the thermal motion of the cesium vapor along the axis of propagation of the pumping beam. This distribution of velocities can be calculated by a Maxwell-Boltzmann Distribution:
g(v) = √ ∙ Exp[ ] (Eq. 7)
Where m is the atomic mass, Kb is the Boltzmann Constant, T is the temperature, and v is the magnitude of the velocity. The susceptibility of a material is a function of the angular detuning of the laser, defined as Δ = ωL - ω0. To incorporate the Doppler broadening we will replace all instances of Δ with Δ - kv. Where k is the wave vector of the laser light and v is the velocity of the light along the optical axis of the beam (4).
SusceptibilityThe electric susceptibility of a material is a complex quantity,
where the real part determines the dispersion properties of the material and the imaginary part the absorptivity. The absorption coefficient is the product of this imaginary component and the magnitude of the wave vector of the light, α(Δ)=kIm[χ(Δ)].The susceptibility for a given transition is given by (4):
χ(Δ) = N fΓ(Δ) (Eq. 8)
Where N is the number density of the cesium vapor (See Appendix A), and fΓ(Δ) is derived from the Steady State Solution to the optical Bloch equations of a two-level atom, in the absence of Doppler broadening. Replacing Δ with Δ-kv, (6):
fΓ(Δ) = [1-2i ] (Eq. 9)
Introducing a new function s(Δ), defined as the convolution of fΓ(Δ) with the Maxwell-Boltzmann distribution, g(Δ). This final step fully incorporates Doppler Broadening into the model and replaces fΓ(Δ) in the equation for the susceptibility.
Im[s(Δ)]= √π2 e
14 (a-2iy)2(Erfc[
a2 - iy]+e2iayErfc[
a2 - iy]) (Eq. 10)
Where for convenience we have made the substitutions: α = Γku, y = Δku, u =√ , and Erfc[x] is the complimentary error function of x. Putting everything together we get
α(Δ,T) = kIm[χ(Δ)] = N
For which, the term 2(2I+1) = (2J + 1)(2I + 1) represents the degeneracy of the ground state of Cs, which is 16 as I=7/2.
ResultsUsing Eq. 11 for the absorption coefficients, and the
measured values of various constants listed in Appendix C, we then were able to plot the absorption profile in Mathematica. For the temperature in the calculation we used 22º C to approximate room temperature and assumed a vapor cell of length 50mm.Using a computer with a dual-core Intel i5 processor clocked at 1.70GHz, it required approximately 40 seconds for both plots to resolve. In Figure 2, the plotted transmission function for the D1 line, each peak corresponds to an individual hyperfine transition, labeling from left to right they are: Fg = 4 → Fe = 3, Fg = 4 → Fe = 4, Fg = 3 → Fe = 3, and Fg = 3 → Fe = 4. In Figure 3, the plotted transmission function for the D2 line, the light blue curve represents the total transmission and each other line correspond to individual hyperfine transition as follows: red Fg = 4 → Fe = 3, purple Fg = 4 → Fe = 4, brown Fg = 4 → Fe = 5, blue Fg = 3 → Fe = 2, gold Fg = 3 → Fe = 3, and green Fg = 3 → Fe = 4.
DiscussionThe plots generated reveal a strong absorption, or weak
transmission, for the Cs D lines that is ideal for laser spectroscopy. For the sake of comparison, minimal transmissions for the D2 lines of Rubidium and Cesium are presented in Table 2. It is immediately apparent that the difference between minimal
Table 1. Values of CF2 for the D Lines of Cesium
––––––ω03
3πϵ0ℏc3 ––––––2Jg + 12Je + 1
ϵ0ℏΓλ3
8π2––––– (Eq. 6)
m2πKbT–––– mv2
2KbT- ––––
C 2F ∣⟨Lg∣er∣Le⟩∣2
ϵ0ℏ––––––––––––
2iΓ
––– Δ - kvΓ––––
– – –––––
–– –– 2KbT––––m––––
C 2F ∣⟨Lg∣er∣Le⟩∣2 1 Im[s(Δ)]
ϵ0ℏ 2(2I + 1) ku –––––––––– ––––––– –––––––∙ ∙
(Eq. 3)
(Eq. 11)

34 35scientia.nd.edu SCIENTIA Vol 6 - Spring 2015 scientia.nd.edu SCIENTIA Vol 6 - Spring 2015
Physics Physics
AppendixA. Calculation of the Number Density (7)
N =
log10PCs = 2.881 + 4.711 - 3999T
log10PRb = 2.881 + 4.857 - 4215T
Where the factor of 133.323 in the formula for N is to convert from Torr to Pa, log10PCs is the vapor pressure of solid Cs, and log10PRb is the vapor pressure of solid Rb accounting for both Rb85 and Rb87 in their natural abundances.
B. Detuning of Various Hyperfine Transitions (3)Table 3. Frequency Detuning in MHz
All Detunings are measured from the Center of Mass Frequency of the 62S1/2 → 62P1/2(6
2P3/2) transition, without hyperfine splitting
C. Other Data Used (7)Table 4. Cesium D Line Data
AcknowledgmentsI would like to acknowledge Prof. Carol Tanner for her
wonderful advice and guidance for the past several years and the College of Science for funding this research with a COS-Summer Undergraduate Research Fellowship.
References1. International Bureau of Weights and Measures. The International System of Units, 8th Edition (2006).
2. E. Cornell. J. Res. Natl. Inst. Stand. Technol. 101, 419 (1996).
3. V. Gerginov et al. Phys. Rev. A 73, 032504 (2006).
4. P. Siddons et al. J. Phys. B-At. Mol. Opt. 41, 155004 (2008).
5. A. R. Edmonds, Angular Momentum in Quantum Mechanics, Princeton University Press (1996)
6. R. Loudon, The Quantum Theory of Light (Oxford University Press, 1983).
7. D. Steck, Cesium D Line Data (1998)
8. D. Steck, Rubidium 85 D Line Data (2013)
9. R. J. Rafac et al. Phys. Rev. A. 50, R1976 (1994)
transmissions can be by an order of magnitude (At 22º C and L=50mm). The difference in magnitude corresponds to a difference in their respective absorption coefficients by a factor of approximately 2 to 2.5. This can largely be traced to a single primary reason, the difference in their number densities at room temperature.
NCs (T=295K) = 3.5507 * 1016 NRb = 7.5410*1015
This difference by a factor of approximately 4.7 is then reduced by the subtle changes in line strengths due to respective values of the decay rate, Γ, and their ground state degeneracies, 2(2I+1). All other characteristics between Cesium and Rubidium are nearly the same, besides the width of their respective Maxwell-Boltzmann distributions. However this difference is negligible in calculating the minimal transmissions.
Future work will endeavor to compare this theoretical absolute absorption profile to an experimentally measured profile.
Figure 2. Cesium D1 Line Transmission Profile
Figure 3. Cesium D2 Line Transmission Profile
About the Author
133.323 ∙ P KB ∙ T–––––––
–––––
–––––
Effects of Atmospheric Pressure Plasma on Cytosine Solutions
AbstractPlasmas, which are ionized gases ignited when a gas
passes through a large potential difference, are known to contain a variety of reactive species, such as UV light, ions, neutrals, electrons and electromagnetic fields. Because plasmas selectively induce apoptosis in cancer cells, they are a promising non-traumatic treatment to combating epithelial cancers. In this study, atmospheric pressure plasma jetswere used to investigate the effects of irradiation on cytosine solutions in order to better understand the interaction between plasma and healthy cell components. The fluorescent dye was used to determine the amount of reactive H2O2 produced in solutions of cytosine and water following a variable irradiation time. H2O2 is toxic to cells in high quantities and is a key factor for inducing apoptosis, making measurements of H2O2 applicable to medical studies. It was found that there was no substantial difference between the amount of H2O2 found in cytosine solution and in water following a few minutes of plasma treatment (5% difference between cytosine and water); however, there were large differences in H2O2 concentrations at several intermediary time points (34% difference after 0.5 minutes of irradiation, 16% difference after 5 minutes). A likely explanation is that this small percent difference in final H2O2 concentration could be due to the secure incorporation of the amide group within the cytosine heterocyclic structure. Further studies are needed to elucidate effects on other nucleobases.
IntroductionPlasma is the fourth state of matter and consists of
ionized gases usually ignited by a high-voltage power source. The ionization of these gases produces a variety of species within the plasma itself, such as visible light, UV radiation, electromagnetic fields, electrons, ions, and reactive radical species (1).When a solution is exposed to plasma, the species produced by the plasma interact with the target through unique chemical processes, and altered end products are formed. There are two primary categories of plasmas: thermal and non-thermal. Non-thermal plasmas, whose reactive ions and neutrals remain near room temperature, are far more adjustable and have wider applications than naturally occurring thermal plasmas, in which the reactive species possess temperatures of several thousand Kelvin (1). Moreover, non-thermal plasmas can be ignited under either low-pressure or atmospheric-pressure conditions. Atmospheric pressure plasmas can take the form of a plasma jet or dielectric barrier discharge (2), which can be operated in an open-air setting and thus used for many medical applications,
Emily Kunce1
Advisor: Sylwia Ptasinska1
1University of Notre Dame, Department of Physics
including cancer treatment.The American Cancer Society, using data from the National
Cancer Institute, has predicted that the average American has an approximately 40% chance of developing invasive cancer during his or her lifetime (3). The high prevalence of this devastating disease heightens the need for improved technologies and therapies to treat it. Researchers have recently applied plasma technology to solve biomedical problems and have found success in fields as diverse as instrument sterilization, wound treatment, bacterial inactivation, and induced cancer cell apoptosis (2). Apoptosis is a mechanism of controlled cell death that reduces the inflammation typically associated with necrotic, or traumatic, cell death (2).
Most pertinent to this study is the finding that plasmas can selectively induce apoptosis in cancer cells in a dose-dependent fashion (2). Even more promising, atmospheric pressure plasma jets (APPJs) are shown to induce apoptosis without destroying the extracellular matrix surrounding the cancerous cells, lending credence to the possibility that APPJ radiation can induce apoptosis in cancer cells with minimal damage to surrounding healthy cells (4). Additionally, studies of aqueous DNA have shown that plasma exposure primarily generates single strand breakages in the DNA, while double-strand breakages are seen following longer irradiation times with higher power sources (5). While single-strand breaks can result in apoptosis in most occasions, double-strand breaks definitively stop the cell cycle, which is then diverted to apoptosis. The increase of double-strand breaks with higher power plasma exposure indicates the dose-dependent nature of plasma damage (2). Since DNA strand breakages have been shown to prompt apoptosis and arrest the cell cycle, evidence that APPJ exposure results in significant single-strand breakage points to the power of the APPJ in inducing cell death (6). Moreover, it has been demonstrated that more breast cancer cells are inactivated by helium-oxygen and helium plasmas (30% and 20%, respectively) than in flow controls alone; however, this effect has been found to be heavily dependent on the constituents of the plasma effluent (4). In the flow control samples, the helium and helium-oxygen mixtures were flowed through the APPJ without igniting the plasma, ensuring that any observed differences can be directly attributed to the effect of the plasma itself.
The findings of Kim (2010) and Han (2014) identify a need to better understand the composition of the plasma effluent and to profile the reactive species found within the plasma jet. These previous studies have demonstrated the promise of plasma when treating cancer cells and tissues; however, concerns about the after-effects of these treatments still linger (4). Elucidation of the species produced by plasma interactions would provide clearer insight into the modality of induced apoptosis and the effects such APPJ treatments may have on healthy tissues and cells. The present study aims to investigate the reactive species produced when APPJ interacts with solutions of DNA constituents, namely nucleobases. The four nucleobases found in DNA act in two pairs: thymine and adenine, and cytosine and guanine. Cytosine is selected for study based on its solubility and is treated by helium APPJ for variable treatment times followed by H2O2 detection.
Table 2. Peak Transmissions for Cs and Rb D2 Lines.
Andrew Piper is a senior at the University of Notre Dame currently pursuing a degree in physics with a concentration in advanced physics. In the summer of 2013, he worked with Professor Tanner at the University of Notre Dame with funding provided by a College of Science Summer Undergraduate Research Fellowship. For his junior year he studied abroad at the University of Oxford through the Notre Dame International program. He plans on attending graduate school to earn a Ph.D. in either atomic, molecular and optical physics or condensed matter starting in the fall of 2015. He spends most summers serving on staff for a Boy Scouts of America summer camp, and enjoys spending his free time reading or experiencing the outdoors.

36 37scientia.nd.edu SCIENTIA Vol 6 - Spring 2015 scientia.nd.edu SCIENTIA Vol 6 - Spring 2015
Physics Physics
Results and DiscussionFor each data series, the background H2O2 concentration
was measured from the untreated samples and then subtracted from the data sets so that only the H2O2 produced by the plasma treatment was analyzed. Utilizing the relationship between H2O2 concentration and intensity of fluorescence given by the standard curve, the data collected for each cytosine and water sample were converted into the H2O2 concentration present in the solution. A sample calculation is provided below using data from a single trial of this experiment:
Linear regression: fluorescence = 904.41 · (concentration of H2O2)
Sample Data Point: irradiation time = 7 minutesfluorescence = 8939 relative fluorescence unitsdilution ratio = 1/8
Conversion Equation: concentration = dilution factor · (––––) · fluorescence
Conversion into H2O2: concentration = 8 · (–––––) · 8939 = 79.07 µM H2O2
The H2O2 concentrations for each irradiation time were then averaged and plotted to compare the H2O2 production of cytosine versus water (Figure 2).
It can be observed that the concentration of H2O2 found in the cytosine solutions increases linearly with increasing irradiation time, suggesting that the production of H2O2 is
Materials and MethodsExperimental Setup
In this experiment, the APPJ used to irradiate aqueous solutions of cytosine has been described previously (5). Figure 1 shows a diagram of the helium APPJ used in this experiment. Pure helium gas was fed through an inlet tube at a rate of 1.5 standard liters per minute (slm) before being ignited between two electrodes (i.e., powered and grounded electrode) attached to a quartz tube with a potential difference of 11.0 kV across them. A square waveform pulse was applied to the powered electrode at a frequency of 1.5 kHz, and both current and voltage were monitored on the grounded electrode via oscilloscope. The sample was positioned at a distance of 2.5 cm beneath the end of the quartz tube. This distance between the plasma source and the surface of the solution ensured that the sample was treated within the cone of the plasma jet.
Plasma TreatmentFollowing ignition of the plasma source, 500 µL samples of
45 mM aqueous cytosine solutions were treated in quartz dishes of 1.2 cm diameter (wall thickness 1 mm) on an adjustable sample holder so that the sample was centered in the plasma effluent and the surface of the solution was 2.5 cm from the end of the plasma source tube. Additionally, water samples were treated at the same time points following irradiation of the cytosine solutions to confirm that any observed effects could be attributed to the cytosine in solution and not merely the aqueous solvent. Samples were treated for times of 0, 0.5,
Figure 1. Diagram of the experimental setup for the APPJ used in this experiment. The adjustable stage was used to raise sam-ples so that the surface of the solution was 2.5 cm from the end of the inlet tube during treatment.
1, 3, 5, or 7 minutes. After treatment, samples were recovered via pipette into microcentrifuge tubes, which were immediately capped to prevent the evaporation of reactive species and the interaction of any species in the air with the solution. Treated samples were then diluted at a 1:8 ratio with distilled water before further measurements.
Measurement of H2O2 SpeciesThe Amplex Red Reagent (Life Technologies, Grand Island,
NY), a fluorescence dye, was prepared following the protocol specified by the manufacturer. A standard curve for known concentrations of H2O2 was created from a stock solution of 3% H2O2 via 1:2 ratio serial dilutions from a concentration of 100 µM down to 1.6 µM, with a control of 0 µM H2O2 to serve as a measure of the background. Following this preparation, 50 µL of the activated Amplex Red Reagent was incubated with 50 µL of each of the treated solution or standard H2O2 solution for 30 minutes in a Costar 96-well flat-bottom black polystyrol plate. Fluorescence measurements were then taken using an Infinite 200 Pro spectrophotometer with an excitation wavelength of 530 nm and an emission wavelength of 590 nm. The standard curve was used to generate a linear regression model of the relationship between fluorescence and the concentration of H2O2 in solution. This regression equation relating fluorescence to H2O2 concentration was then used to calculate the H2O2 concentration of each treated sample using the measured fluorescence from the Amplex Red Reagent.
1slope
1904.41
steady over time. However, H2O2 concentrations within water appear to increase non-linearly, showing some fluctuation at 3-minute and 5-minute treatment times.
Additionally, the H2O2 concentrations for both cytosine solution and water were compared at each irradiation time point. The difference in H2O2 concentration between cytosine and water was small for irradiation times up to 3 minutes; however, after 5 minutes of treatment, a large difference between the H2O2 concentrations was observed (Figure 2). This large difference in concentration prompted the analysis of the percent difference of H2O2 concentrations between the cytosine samples and the water control samples (Figure 3).
The greatest percent differences in H2O2 concentration arise early in the irradiation times. Figure 3 shows that the large percent differences are calculated for the 0.5-minute and 5-minute irradiation times. At the 1-minute time point, the percent difference in H2O2 concentration between the cytosine and water solutions is less than 10%, showing that large percent differences in H2O2 concentration are quickly reduced. The same decrease is seen for the 7-minute time point (5% difference) and the 5-minute sample (16% difference). This trend suggests that H2O2 is produced at different rates in the cytosine solutions and in water, but following 7 minutes of irradiation the difference in final H2O2 concentration is only 5% (Figure 3).
In summary, it is observed that, while the H2O2 production appears to occur at different rates in cytosine solutions and in water, both solutions contain similar amounts of H2O2 species following 7 minutes of irradiation. This similar ending concentration for both cytosine and water suggests that the presence of cytosine does not impede nor promote the production of H2O2.
Conclusions No substantial differences in the final H2O2 concentrations
were observed following the longest irradiation time, 7 minutes, under the APPJ for solutions of cytosine and water (Figure 2). However, there were large differences in H2O2 at intermediary irradiation times which indicates that H2O2 production may occur through different pathways for water and cytosine solutions. Notably, there was a 34% difference in H2O2 concentration after only 30 seconds of irradiation. While marked percent difference in H2O2 were observed at intermediate irradiation times, the final concentrations were nearly equal, and the final percent difference was only 5% between cytosine
Figure 2. H2O2 concentration in cytosine solution and in water as a function of irradiation time.
Figure 3. Percent difference in H2O2 concentrations between cytosine and water samples for each time point. The absolute value of the percent difference was plotted to demonstrate the difference in magnitude of H2O2 production.
and water (Figure 3). These findings suggest that cytosine itself is not easily attacked by reactive species found within the plasma jet to produce H2O2. This could potentially be due to the compact ring structure of cytosine, in which an amide group is securely incorporated into the stable 6-membered heterocyclic ring structure. The fact that greater amounts of H2O2 are not produced in solutions containing cytosine could mean that the reactive particles produced by the plasma do not have enough energy to damage or convert the ring when they encounter the cytosine solution. Alternatively, it may be that during solvation the water molecules that surround the cytosine molecules provide some protective characteristics, reducing the effects of the plasma effluent on the cytosine molecules.
This study was limited in scope due to the small number of samples, n=3, which could have an impact on the significance of the results gathered concerning H2O2 concentrations for each solution. Additionally, the stock solution of 30% H2O2 was not tested to ensure that the concentration at the time of this experiment was the same as the concentration stated on the label. Because H2O2 is unstable and slowly decays into water and oxygen gas when exposed to light, the stock concentration of H2O2 may have been lower than stated. This could introduce error into the results, because the relationship between fluorescence and H2O2 concentration used for calculations would be inaccurate. In future studies, the sample size could be expanded and measurements could be performed to confirm the concentration of the stock H2O2 solution.
Additionally, further studies are needed to better understand the interactions of nucleobase solutions with plasma and the reactive species it produces. The solutions studied will need to be expanded to include all four nucleobases in appropriate solvents, such as water or physiological solution. The data collected from these studies could be used in conjunction with previous studies on the effects of plasma on DNA to understand the interactions of plasma with cellular components. It is essential to study the interactions of these fundamental constituents with reactive species produced by plasma so that the effects of plasma irradiation on healthy cells can be understood from the smallest level upwards. Plasma radiation cannot be implemented as an efficacious cancer treatment until these ramifications are characterized and understood.
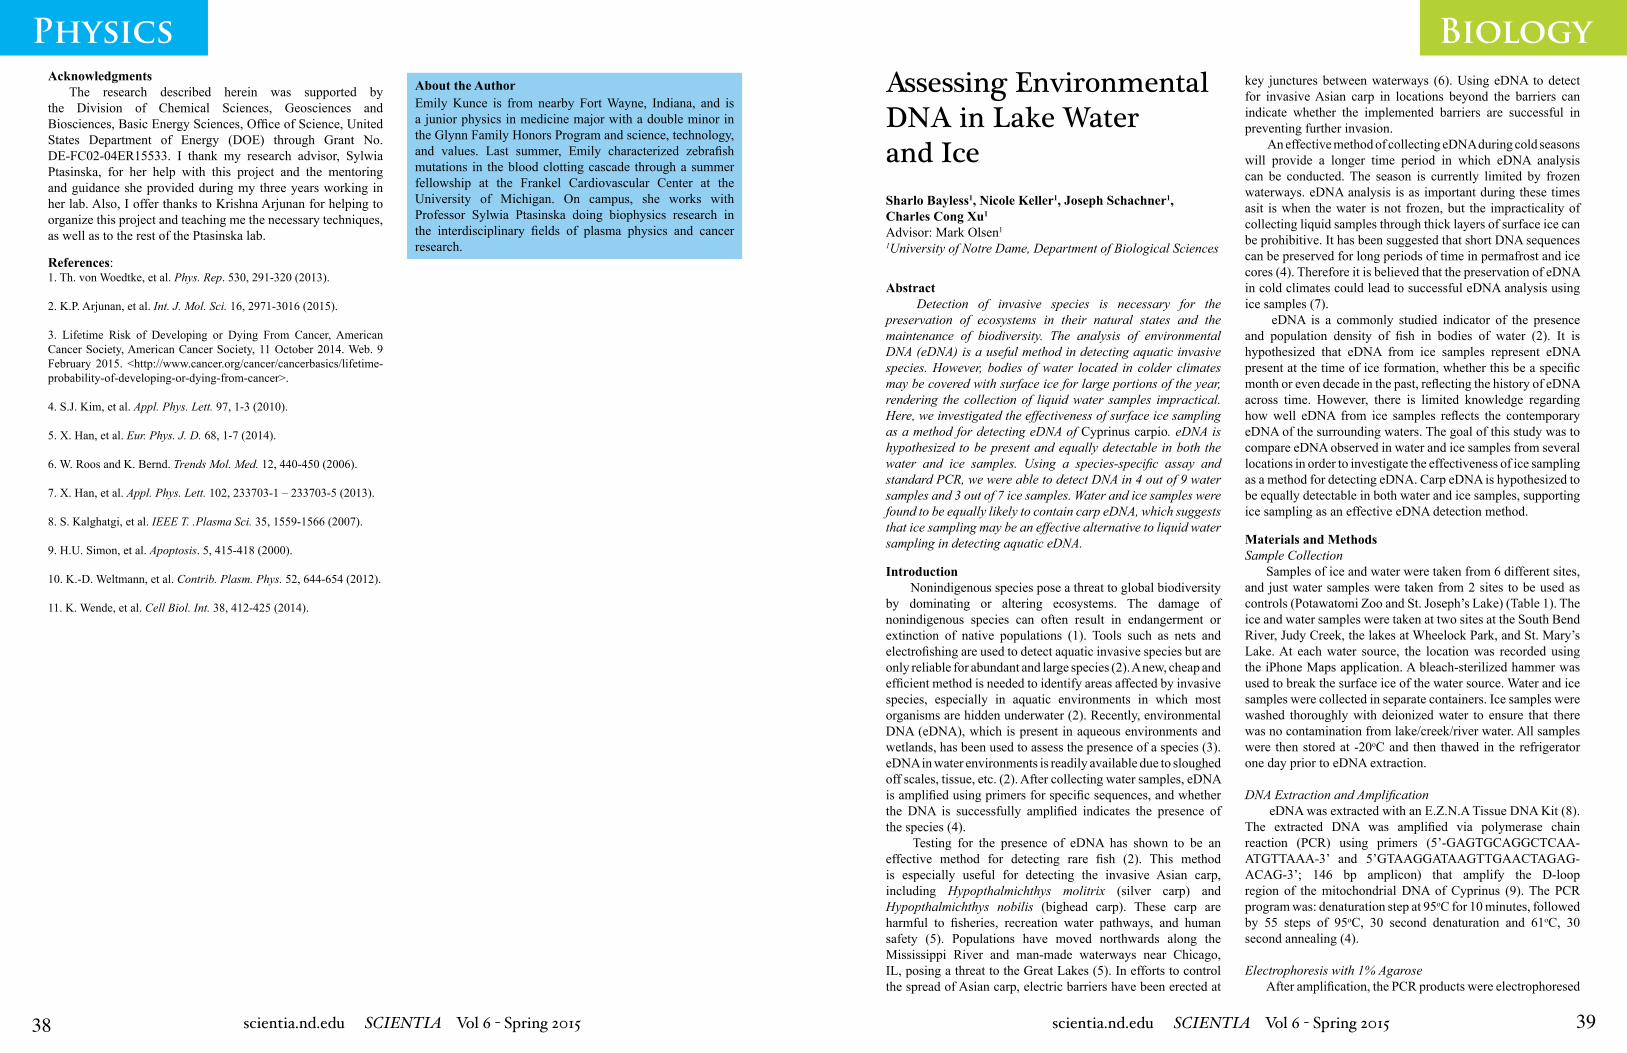
39scientia.nd.edu SCIENTIA Vol 6 - Spring 2015
Biology
38 scientia.nd.edu SCIENTIA Vol 6 - Spring 2015
PhysicsAbout the Author
References:1. Th. von Woedtke, et al. Phys. Rep. 530, 291-320 (2013).
2. K.P. Arjunan, et al. Int. J. Mol. Sci. 16, 2971-3016 (2015).
3. Lifetime Risk of Developing or Dying From Cancer, American Cancer Society, American Cancer Society, 11 October 2014. Web. 9 February 2015. <http://www.cancer.org/cancer/cancerbasics/lifetime-probability-of-developing-or-dying-from-cancer>.
4. S.J. Kim, et al. Appl. Phys. Lett. 97, 1-3 (2010).
5. X. Han, et al. Eur. Phys. J. D. 68, 1-7 (2014).
6. W. Roos and K. Bernd. Trends Mol. Med. 12, 440-450 (2006).
7. X. Han, et al. Appl. Phys. Lett. 102, 233703-1 – 233703-5 (2013).
8. S. Kalghatgi, et al. IEEE T. .Plasma Sci. 35, 1559-1566 (2007).
9. H.U. Simon, et al. Apoptosis. 5, 415-418 (2000).
10. K.-D. Weltmann, et al. Contrib. Plasm. Phys. 52, 644-654 (2012).
11. K. Wende, et al. Cell Biol. Int. 38, 412-425 (2014).
Assessing Environmental DNA in Lake Water and IceSharlo Bayless1, Nicole Keller1, Joseph Schachner1, Charles Cong Xu1
Advisor: Mark Olsen1
1University of Notre Dame, Department of Biological Sciences
Abstract Detection of invasive species is necessary for the
preservation of ecosystems in their natural states and the maintenance of biodiversity. The analysis of environmental DNA (eDNA) is a useful method in detecting aquatic invasive species. However, bodies of water located in colder climates may be covered with surface ice for large portions of the year, rendering the collection of liquid water samples impractical. Here, we investigated the effectiveness of surface ice sampling as a method for detecting eDNA of Cyprinus carpio. eDNA is hypothesized to be present and equally detectable in both the water and ice samples. Using a species-specific assay and standard PCR, we were able to detect DNA in 4 out of 9 water samples and 3 out of 7 ice samples. Water and ice samples were found to be equally likely to contain carp eDNA, which suggests that ice sampling may be an effective alternative to liquid water sampling in detecting aquatic eDNA.
Introduction Nonindigenous species pose a threat to global biodiversity
by dominating or altering ecosystems. The damage of nonindigenous species can often result in endangerment or extinction of native populations (1). Tools such as nets and electrofishing are used to detect aquatic invasive species but are only reliable for abundant and large species (2). A new, cheap and efficient method is needed to identify areas affected by invasive species, especially in aquatic environments in which most organisms are hidden underwater (2). Recently, environmental DNA (eDNA), which is present in aqueous environments and wetlands, has been used to assess the presence of a species (3). eDNA in water environments is readily available due to sloughed off scales, tissue, etc. (2). After collecting water samples, eDNA is amplified using primers for specific sequences, and whether the DNA is successfully amplified indicates the presence of the species (4).
Testing for the presence of eDNA has shown to be an effective method for detecting rare fish (2). This method is especially useful for detecting the invasive Asian carp, including Hypopthalmichthys molitrix (silver carp) and Hypopthalmichthys nobilis (bighead carp). These carp are harmful to fisheries, recreation water pathways, and human safety (5). Populations have moved northwards along the Mississippi River and man-made waterways near Chicago, IL, posing a threat to the Great Lakes (5). In efforts to control the spread of Asian carp, electric barriers have been erected at
Materials and MethodsSample Collection
Samples of ice and water were taken from 6 different sites, and just water samples were taken from 2 sites to be used as controls (Potawatomi Zoo and St. Joseph’s Lake) (Table 1). The ice and water samples were taken at two sites at the South Bend River, Judy Creek, the lakes at Wheelock Park, and St. Mary’s Lake. At each water source, the location was recorded using the iPhone Maps application. A bleach-sterilized hammer was used to break the surface ice of the water source. Water and ice samples were collected in separate containers. Ice samples were washed thoroughly with deionized water to ensure that there was no contamination from lake/creek/river water. All samples were then stored at -20oC and then thawed in the refrigerator one day prior to eDNA extraction.
DNA Extraction and Amplification eDNA was extracted with an E.Z.N.A Tissue DNA Kit (8).
The extracted DNA was amplified via polymerase chain reaction (PCR) using primers (5’-GAGTGCAGGCTCAA-ATGTTAAA-3’ and 5’GTAAGGATAAGTTGAACTAGAG-ACAG-3’; 146 bp amplicon) that amplify the D-loop region of the mitochondrial DNA of Cyprinus (9). The PCR program was: denaturation step at 95oC for 10 minutes, followed by 55 steps of 95oC, 30 second denaturation and 61oC, 30 second annealing (4).
Electrophoresis with 1% Agarose After amplification, the PCR products were electrophoresed
key junctures between waterways (6). Using eDNA to detect for invasive Asian carp in locations beyond the barriers can indicate whether the implemented barriers are successful in preventing further invasion.
An effective method of collecting eDNA during cold seasons will provide a longer time period in which eDNA analysis can be conducted. The season is currently limited by frozen waterways. eDNA analysis is as important during these times asit is when the water is not frozen, but the impracticality of collecting liquid samples through thick layers of surface ice can be prohibitive. It has been suggested that short DNA sequences can be preserved for long periods of time in permafrost and ice cores (4). Therefore it is believed that the preservation of eDNA in cold climates could lead to successful eDNA analysis using ice samples (7).
eDNA is a commonly studied indicator of the presence and population density of fish in bodies of water (2). It is hypothesized that eDNA from ice samples represent eDNA present at the time of ice formation, whether this be a specific month or even decade in the past, reflecting the history of eDNA across time. However, there is limited knowledge regarding how well eDNA from ice samples reflects the contemporary eDNA of the surrounding waters. The goal of this study was to compare eDNA observed in water and ice samples from several locations in order to investigate the effectiveness of ice sampling as a method for detecting eDNA. Carp eDNA is hypothesized to be equally detectable in both water and ice samples, supporting ice sampling as an effective eDNA detection method.
AcknowledgmentsThe research described herein was supported by
the Division of Chemical Sciences, Geosciences and Biosciences, Basic Energy Sciences, Office of Science, United States Department of Energy (DOE) through Grant No. DE-FC02-04ER15533. I thank my research advisor, Sylwia Ptasinska, for her help with this project and the mentoring and guidance she provided during my three years working in her lab. Also, I offer thanks to Krishna Arjunan for helping to organize this project and teaching me the necessary techniques, as well as to the rest of the Ptasinska lab.
Emily Kunce is from nearby Fort Wayne, Indiana, and is a junior physics in medicine major with a double minor in the Glynn Family Honors Program and science, technology, and values. Last summer, Emily characterized zebrafish mutations in the blood clotting cascade through a summer fellowship at the Frankel Cardiovascular Center at the University of Michigan. On campus, she works with Professor Sylwia Ptasinska doing biophysics research in the interdisciplinary fields of plasma physics and cancer research.

40 41scientia.nd.edu SCIENTIA Vol 6 - Spring 2015 scientia.nd.edu SCIENTIA Vol 6 - Spring 2015
Biology BiologyTable 1. Locations, Water Depth and Coordinates: Water and ice samples were taken from each of the provided location with the corresponding water depths in inches (only water samples were taken from St. Joseph’s Lake and the Creek at Potawatomi Zoo).
using a 1% agarose gel matrix for approximately 30 minutes at 120V. All 16 samples and DNA from carp tissue was used as a positive control. The final gel was photographed using Gel Doc XR+ System (Biorad).
Results16 samples of water and ice were analyzed, and 12 samples
showed successful DNA amplification (Fig. 1 and Fig. 2). Samples 5 (bridge ice) 8 (river 1 water), 9 (creek 1 ice), and 12 (St. Mary’s water) did not show DNA amplification. Seven samples had DNA bands between 100 and 200 base pairs were considered positive for carp eDNA, which is 146 base pairs long. The seven samples found to be positive include sample 1 (river 2 ice), sample 2 (river 2 water), sample 3 (creek 2 water), sample 7 (river 1 ice), sample 11 (zoo water), sample 13 (St. Mary’s 1 ice), and sample 14 (St. Mary’s 2 water). The positive control was also successfully amplified and showed a positive DNA band between 100 and 200 base pairs (Fig. 2). Data analysis was performed using a 2x2 contingency table and a fisher exact probability test. The one-sided p-value was 0.67132.
Figure 1. Results of agarose gel for samples 1-8. Samples 1, 2, 3, 4, 6 and 7 showed successful DNA amplification. There was no DNA amplified in samples 5 and 8. Samples 1, 2, 3, and 7 were positive because the samples had DNA bands, between 100 and 200 bps, indicating they carp DNA, which is 146 base pairs.
Figure 2. Results of agarose gel or samples 9-16. Samples 10, 11, 13-16 showed successful DNA amplification and out of those, samples 11, 13, and 14 had bands between 100-200bps. These lanes were indicative of carp DNA (146bps).
DiscussionThe p-value obtained from the fisher exact probability
test is greater than 0.05, therefore it does not fall within the 95% confidence interval. It can be assumed that there is not a significant difference between the ice and water sample results, suggesting ice sampling as an equally effective method for eDNA detection as water sampling. To confirm ice eDNA as a useful tool, samples with positive amplification containing bands between 100-200 bps should be DNA sequenced. A BLAST search can then confirm the species identity of amplified sequences.
About the Author
Extracting and analyzing eDNA from ice samples is not as common as using liquid samples to test for the presence of invasive species, but such methods may be useful in colder climates. The ability to test for eDNA using ice would have several practical uses. Previous studies of glaciers have suggested that eDNA can be extracted from melted ice to detect rare species of bacteria in arctic areas, but the efficiency of this method is not completely understood (10).
The use of frozen DNA is important in studying ancient life, which is best preserved in ice cores. Body parts and even hair of early humans are still intact in ice, and by extracting DNA from these samples, insights to early human global migrations can be revealed (11). DNA may even be viable from prehistoric ages, allowing scientists to further understand extinct life that would otherwise go unstudied. With more
AcknowledgmentsWe would like to thank Prof. T. Mark Olsen, Jamie Dawson
and Hildamarie Caceres-Velasquez for their guidance and laboratory equipment during our research. We would also like to thank Charles Cong Xu for spearheading the project, his dedication to the experiment, and the time spent improving our research. Also thanks to Michael Dinh and Jimmy Haubert for their support and time with our project.
References1. S. Lowe, M. Browne, S. Boudjelas, M. De Poorter. 100 of the world’s worst invasive alien species: A selection from the Global Inva-sive Species Database. Aliens. 12 (2000).
2. C.L Jerde, A.R. Mahon, W.L Chadderton, D.M Lodge. Conserv. Lett. 4, 150-157 (2011).
3. W. Amos, H. Whitehead, M. Ferrari, D. Glockner-Ferrari, R. Payne, J. Gordon. Mar. Mammal Sci. 8(3), 275-283 (1992).
4. G.F. Ficetola, C. Miaud, F. Pompanon, P. Taberlet. Biol. Lett. 4, 423-425 (2008).
5. J. Rasmussen, H. Regier, R. Sparks, W. Taylor. J. Great Lakes Res. 5, 4C:3 (2011).
6. M.J.V. Zanden, J.D. Olden. Can. J. Fish. Aquat. Sci. 65, 7 C:1512-1522 (2008).
7. M. Hofreiter, J.I. Mead, P. Martin, H.N. Poinar. Curr. Biol. 13, R693-R695 (2003).
8. E.Z.N.A Tissue DNA Kit. Omega Bio-tek Inc. Nocross, Georgia. 8-11 (2009).
9. C. Turner, M. Barnes, C. Xu, S. Jones, C. Jerde, D. Lodge. Meth. Ecol. Evol. Jul(7), 676-684 (2013).
10. K. Junge, C. Krembs, J. Deming, A. Stierle, H. Eicken. Ann. Gla-ciol. 33 (2001).
11. M. Balter. Science. 320, 1146-1147 (2008).
12. E. Willerslev and A. Cooper. P. Natl. Acad. Sci-Biol. 272, 3-16 (2005).
13. M. Tavares, G. De Melo. Antarct. Sci. 16(2), 129-131 (2004).
knowledge about the beginnings of life on earth, researchers will learn of new approaches to search for early signs of life (or signs of extinct life) on other planets. In one example, DNA fragments that could be present on Mars would be capable of surviving for millions of years in Martian permafrost (12). Such findings would suggest that forms of life were once present in other areas of the solar system.
As invasive organisms continue to spread to colder climates, such as glacial regions, eDNA from ice would be helpful in the future. In a specific example, the North Atlantic Spider Crab was recently identified as the first invasive species to be discovered in the Southern Ocean, near the Antarctic Peninsula (13). Environmental DNA analysis can be used to track the progress of invasive species into new territories, as it provides a reliable assessment of the current species’ presence in bodies of water (4). Thus, ice sampling will become even more relevant with the global movement of invasive species populations, and studies should be conducted in the present in order to better prepare for the future.
Sharlo Bayless is a sophomore with a major in environmental sciences and supplementary major in Spanish. She is currently working in an ecology research lab under the direction of Prof. Gary Belovsky, studying the long-term environmental effects of the grasshopper population on the nitrogen levels in Montana. In the summer of 2015, she will be participating in UNDERC, a 10-week environmental research program through the University of Notre Dame in the Upper Peninsula of Michigan. Despite her deep interest in ecology, she intends to go to medical school in the hopes of being a pediatrician or general practitioner.
About the Author
About the Author
Nicole Keller is a sophomore at the University of Notre Dame, currently pursuing a major in biological sciences with a studio art minor. She is from Grosse Pointe, Michigan. In addition to studying the detection of environmental DNA (this paper) she has also researched the synergistic effects of different drugs on brain cancer cells led by Prof. Susan Gursky. After Notre Dame, she plans to pursue an M.D. degree with hopes of becoming a surgeon.
Joseph Schachner is a sophomore from Charlotte, North Carolina, studying chemical engineering at the University of Notre Dame. This is his first research contribution to Scientia and he greatly appreciates the honor of being published. He enjoys helping others and looks forward to contributing more to research organizations in the future.
About the AuthorCharles Cong Xu graduated in 2014 with a major in environmental sciences and a minor in Chinese. While at Notre Dame, he worked on environmental DNA in Prof David Lodge’s lab and evolutionary genomics in Prof.Jeffrey Feder’s lab. He is interested in using genomics to answer ecological, evolutionary, and conservation questions. He is now a student in the MEME Erasmus Mundus masters programme in evolutionary biology and currently researching the genes associated with resistance to starvation in European sea bass at the University of Montpellier, France.

42 43scientia.nd.edu SCIENTIA Vol 6 - Spring 2015 scientia.nd.edu SCIENTIA Vol 6 - Spring 2015
Biology BiologyShaping Seed Preference: Familiarity with Food Sources in Forest Deer Mice (Peromyscus maniculatus gracilis)Kaya Moore1
Advisor: Michael J. Cramer1
1University of Notre Dame, Department of Biological Sciences
AbstractForaging decisions are not only affected by nutritional
value and toxicity but also by an individual’s familiarity with that food source. This study examines the foraging choices of deer mice (Peromyscus maniculatus gracilis) between red maple (Acer rubrum) and balsam fir (Abies balsamea) seeds. I hypothesized that mice trapped in deciduous forests would prefer red maple seeds, whereas those trapped in coniferous forests would prefer balsam fir seeds. Mice were left overnight with 5 g of both seed species to choose from. While there was no preference for balsam fir seeds in mice trapped in coniferous forests, there was a significant preference for red maple over balsam fir seeds for all mice tested. These results suggest that habitat does not shape seed preference. Despite these results, familiarity could still be occurring with P. m. gracilis. Either the assumption that mice trapped in coniferous forests would have been exposed to balsam fir seeds was incorrect, or the effect of familiarity may have been masked by the species’ innate preference for red maple seeds. Further experimentation is necessary to determine whether familiarity with a food source shapes seed preference in P. m. gracilis.
IntroductionFamiliarity with a resource can shape individual preferences
in adult life. To become familiar with something, in this sense, is to have a certain level of experience or exposure to it early in life. Familiarity is sometimes referred to as imprinting; however, imprinting suggests that there is a ‘sensitive period’ when the individual is particularly susceptible to that experience, and any experience occurring after this period cannot reverse the imprint (1).
Individuals can become familiar with conspecifics, habitats, and food sources. Kavaliers et al. (2005) showed that deer mice, Peromyscus maniculatus, need familiarity with a conspecific for social learning, while habitat selection in deer mice (3) and brush mice (4) is affected by an individual’s early experience with that habitat. When experience with a natal habitat influences an individual’s habitat preference, it is referred to as natal habitat preference induction (NHPI). Similarly, when an individual’s food preference is shaped by early experience, as it is in Mearns’ grasshopper mice with respect to food-borne olfactory cues (5), it could be
MethodsStudy site
Approximately 2490 hectares of land area on the border between Wisconsin and Michigan constitutes the University of Notre Dame Enivronmental Research Center (UNDERC). There are 30 lakes in this region, and the altitude ranges from 500 to 520 meters. As indicated by Curtis (1959), northern mesic forest compromises the upland habitat. I set up trapping grids that were randomly located within deciduous forests containing red maple (Acer rubrum) or within forests dominated by balsam fir (Abies balsamea).
Trapping protocolForest deer mice, Peromyscus maniculatus gracilis, were
trapped in the two forest types outlined above: Bono and Storage were the deciduous grids, while Firestone and Plum Coniferous were the coniferous grids. The deciduous grids contained 25 traps in a 5 x 5 configuration with 15 m spacing, and the Firestone and Plum Coniferous grids had 24 traps in a 3 x 8 configuration and a 4 x 6 configuration, respectively. Mice were live-trapped using Sherman traps (7.62 x 8.89 x 22.86 cm; H. B. Sherman Traps, Inc., Tallahassee FL) and baited using a mixture of rolled oats and black oil sunflower seeds. All captured animals were identified to species. They were also sexed, marked, weighed, and their body length was measured. P. m. gracilis individuals were taken to the laboratory for testing after their second capture.
Experimental procedureIndividuals were taken into the laboratory and singly
housed in cages (19 x 29 x 12.5 cm) with corncob bedding. Only mice that were not lactating or pregnant were used for trials. Throughout the day, individuals were provided standard mouse feed and water ad libitum. Five hours prior to trials, mice were starved. After the starvation period, mice were transferred from their cages into another cage (19 x 29 x 12.5 cm) that had sand bedding. This new cage had two petri dishes, each containing 5 g of each seed (A. rubrum and A. balsamea), and the mice remained in those trial cages for 12 hours during the night. Seeds were obtained from Sheffield Seed Co., N.Y. Uneaten
considered diet preference induction (DPI).The question being addressed is whether deer mice trapped
from two different areas—deciduous forest and coniferous forest—have a strong preference for seeds commonly found in those forest types. P. m. gracilis provide a good model system for studying the effect of familiarity on seed preference because this species dominates the small mammal community in northern Wisconsin where the University of Notre Dame Environmental Research Center (UNDERC) is located (6). The forests on the UNDERC property are primarily deciduous with few coniferous stands. The lack of available coniferous trapping areas resulted in balsam fir seeds (Abies balsamea) being used to represent coniferous forest food sources, while the seed species used to represent deciduous forests was red maple (Acer rubrum). Both tree species are native to northern Wisconsin. I hypothesized that mice trapped in deciduous forests would prefer red maple seeds, whereas mice trapped in coniferous stands would prefer balsam fir seeds.
A. balsamea seeds were separated from A. rubrum seeds, dried at around 45˚C until their mass dropped by 0.001 g per hour, and weighed. The mass of consumed seeds were calculated by taking the difference between initial mass and uneaten mass.
Statistical analyses Seed selectivity was determined as a ratio of consumed red
maple seeds to consumed balsam fir seeds (RRM/RBF). Mann-Whitney U tests were conducted to determine whether there was a statistical difference between the seed selectivity of mice trapped in the two different forest types. Seed preference of individual mice was ascertained by running a paired t-test that compared the mass of consumed red maple seeds to consumed balsam fir seeds. All statistical analyses were conducted using R (R Development Core Team 2008), and all statistics are reported as means ± standard error of the means.
ResultsTen trials from each forest type were run, with five coming
from each coniferous grid and six from Bono and four from Storage. There was no significant difference between the ratio of consumed red maple to balsam fir seeds eaten between the coniferous (10.032 ± 4.2) and deciduous (10.484 ± 4.2) forests at UNDERC (W = 59, p = 0.5288; Figure 1).
To ascertain which is the more preferable seed, a paired t test was conducted (t19 = 11.5648, p < 0.001; Figure 2) that compared the mass of consumed red maple seeds (4.640 g ± 0.043) to balsam fir seeds (1.563 g ± 0.24). This result shows that there is a significant difference between the consumed masses of the two seeds with red maple seeds being the preferred option.
Figure 1. Plot showing the similarity between the selectivity in different forest types. Mice from either coniferous or deciduous forests were left with both red maple and balsam fir seeds overnight to determine whether a mouse’s familiarity with a certain seed made the individual more likely to select that seed over another. Selectivity was determined as a ratio of consumed red maple seeds to consumed balsam fir seeds (RRM/RBF) and analyzed between the two forest types (deciduous 10.032 ± 4.2; coniferous 10.484 ± 4.2). The ratios of the consumed seeds were analyzed using the Mann-Whitney U test (W = 59, p = 0.5288). There was no significant difference between the ratio of consumed red maple seeds to balsam fir seeds eaten across the coniferous and deciduous forests at UNDERC.
DiscussionThese results demonstrate that there is no significant
relationship between the habitat in which a P. m. gracilis individual is trapped and the seed it prefers. Mice that were trapped in both coniferous and deciduous forest types inherently preferred red maple seeds over balsam fir seeds, suggesting that habitat does not shape seed preference.
Familiarity, however, may still be affecting preferences. There was the assumption that mice trapped in a specific forest type would have had early experiences to seeds found in that forest. Although deer mice juveniles commonly remain in their natal area, they have been shown to move between habitats (8). In an attempt to avoid this issue, only recaptured mice were used in the trials. Had this not been done, it is likely that mice only passing through the grids could have been tested. Despite these attempts to control for habitat, there is no way to determine the natal habitats of the adult mice studied. Not only do some juveniles disperse from their natal habitat (8), but also the forests at UNDERC contain very few and relatively small stands of coniferous canopy. The coniferous trapping sites, therefore, were located near large expanses of deciduous forest, which meant that the mice trapped in these grids would likely have had early experiences with deciduous seeds as well as coniferous seeds. Further experimentation could avoid this limitation by using lab-reared mice and controlling the seeds to which juveniles are exposed.
Alternatively, innate preferences for red maple over balsam
Figure 2. Mass of consumed red maple seeds exceeded that of consumed balsam fir seeds. A paired t test was conducted (t19 = 11.5648, p < 0.001) to ascertain whether red maple or balsam fir is the more preferable seed. The graph shows that red maple (4.640 g ± 0.043) is significantly more preferred over balsam fir (1.563 g ± 0.24).
fir could outweigh the familiarity with balsam fir seeds that P. m. gracilis may have had. P. m. gracilis has a documented preference for red maple over sugar maple seeds (6), while balsam fir seeds are not preferred to white pine seeds, with pine seed predation being ten times greater than that of balsam fir seeds (9). Further experimentation could focus on different seed species. A similar experiment looking into familiarity and olfactory cues has shown imprinting to occur in larval
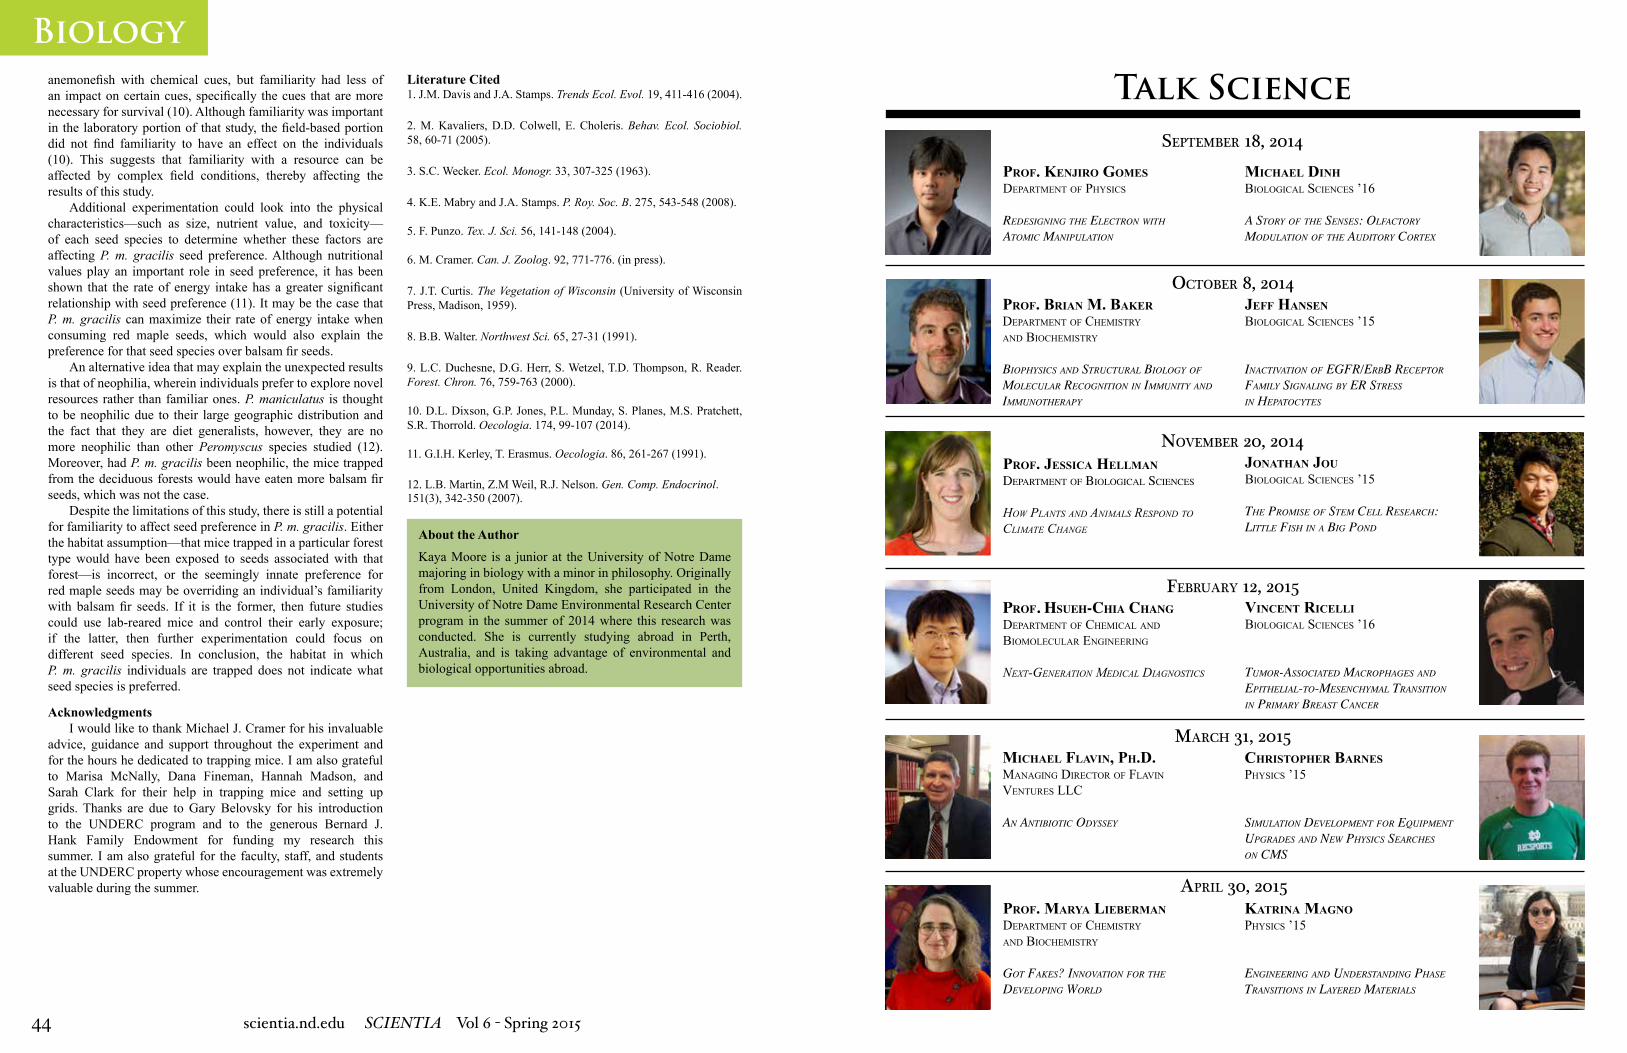
44 scientia.nd.edu SCIENTIA Vol 6 - Spring 2015
BiologyLiterature Cited1. J.M. Davis and J.A. Stamps. Trends Ecol. Evol. 19, 411-416 (2004).
2. M. Kavaliers, D.D. Colwell, E. Choleris. Behav. Ecol. Sociobiol. 58, 60-71 (2005).
3. S.C. Wecker. Ecol. Monogr. 33, 307-325 (1963).
4. K.E. Mabry and J.A. Stamps. P. Roy. Soc. B. 275, 543-548 (2008).
5. F. Punzo. Tex. J. Sci. 56, 141-148 (2004).
6. M. Cramer. Can. J. Zoolog. 92, 771-776. (in press).
7. J.T. Curtis. The Vegetation of Wisconsin (University of Wisconsin Press, Madison, 1959).
8. B.B. Walter. Northwest Sci. 65, 27-31 (1991).
9. L.C. Duchesne, D.G. Herr, S. Wetzel, T.D. Thompson, R. Reader. Forest. Chron. 76, 759-763 (2000).
10. D.L. Dixson, G.P. Jones, P.L. Munday, S. Planes, M.S. Pratchett, S.R. Thorrold. Oecologia. 174, 99-107 (2014).
11. G.I.H. Kerley, T. Erasmus. Oecologia. 86, 261-267 (1991).
12. L.B. Martin, Z.M Weil, R.J. Nelson. Gen. Comp. Endocrinol. 151(3), 342-350 (2007).
AcknowledgmentsI would like to thank Michael J. Cramer for his invaluable
advice, guidance and support throughout the experiment and for the hours he dedicated to trapping mice. I am also grateful to Marisa McNally, Dana Fineman, Hannah Madson, and Sarah Clark for their help in trapping mice and setting up grids. Thanks are due to Gary Belovsky for his introduction to the UNDERC program and to the generous Bernard J. Hank Family Endowment for funding my research this summer. I am also grateful for the faculty, staff, and students at the UNDERC property whose encouragement was extremely valuable during the summer.
About the Author
anemonefish with chemical cues, but familiarity had less of an impact on certain cues, specifically the cues that are more necessary for survival (10). Although familiarity was important in the laboratory portion of that study, the field-based portion did not find familiarity to have an effect on the individuals (10). This suggests that familiarity with a resource can be affected by complex field conditions, thereby affecting the results of this study.
Additional experimentation could look into the physical characteristics—such as size, nutrient value, and toxicity—of each seed species to determine whether these factors are affecting P. m. gracilis seed preference. Although nutritional values play an important role in seed preference, it has been shown that the rate of energy intake has a greater significant relationship with seed preference (11). It may be the case that P. m. gracilis can maximize their rate of energy intake when consuming red maple seeds, which would also explain the preference for that seed species over balsam fir seeds.
An alternative idea that may explain the unexpected results is that of neophilia, wherein individuals prefer to explore novel resources rather than familiar ones. P. maniculatus is thought to be neophilic due to their large geographic distribution and the fact that they are diet generalists, however, they are no more neophilic than other Peromyscus species studied (12). Moreover, had P. m. gracilis been neophilic, the mice trapped from the deciduous forests would have eaten more balsam fir seeds, which was not the case.
Despite the limitations of this study, there is still a potential for familiarity to affect seed preference in P. m. gracilis. Either the habitat assumption—that mice trapped in a particular forest type would have been exposed to seeds associated with that forest—is incorrect, or the seemingly innate preference for red maple seeds may be overriding an individual’s familiarity with balsam fir seeds. If it is the former, then future studies could use lab-reared mice and control their early exposure; if the latter, then further experimentation could focus on different seed species. In conclusion, the habitat in which P. m. gracilis individuals are trapped does not indicate what seed species is preferred.
Talk Science
Prof. Jessica HellmanDepartment of Biological ScienceS
How Plants and animals ResPond to Climate CHange
JonatHan JouBiological ScienceS ’15
The Promise of sTem Cell researCh: liTTle fish in a Big Pond
November 20, 2014
micHael flavin, PH.D.Managing Director of flavin ventureS llc
an anTiBioTiC odyssey
cHristoPHer BarnesPhySicS ’15
simulaTion develoPmenT for equiPmenT uPgrades and new PhysiCs searChes on Cms
march 31, 2015
Prof. HsueH-CHia CHangDePartMent of cheMical anD BioMolecular engineering
next-geneRation mediCal diagnostiCs
vincent ricelliBiological ScienceS ’16
Tumor-assoCiaTed maCroPhages and ePiThelial-To-mesenChymal TransiTion in Primary BreasT CanCer
February 12, 2015
Prof. KenJiro GomesDePartMent of PhySicS
redesigning The eleCTron wiTh aTomiC maniPulaTion
September 18, 2014
micHael DinHBiological ScienceS ’16
a sTory of The senses: olfaCTory modulaTion of The audiTory CorTex
Prof. Brian m. BaKerDePartMent of cheMiStry anD BiocheMiStry
BioPhysiCs and sTruCTural Biology of moleCular reCogniTion in immuniTy and immunoTheraPy
october 8, 2014Jeff HansenBiological ScienceS ’15
inaCTivaTion of egfr/erBB reCePTor family signaling By er sTress in hePaToCyTes
Kaya Moore is a junior at the University of Notre Dame majoring in biology with a minor in philosophy. Originally from London, United Kingdom, she participated in the University of Notre Dame Environmental Research Center program in the summer of 2014 where this research was conducted. She is currently studying abroad in Perth, Australia, and is taking advantage of environmental and biological opportunities abroad.
Prof. marya lieBermanDePartMent of cheMiStry anD BiocheMiStry
goT fakes? innovaTion for The develoPing world
Katrina maGnoPhySicS ’15
engineering and undersTanding Phase TransiTions in layered maTerials
april 30, 2015