Embed Size (px)
Citation preview

ISSN 8755-6839
SCIENCE OF TSUNAMI HAZARD
Journal of Tsunami Society International
Volume 36 Number 4 2017
SPECTRAL ANALYSIS OF ENERGY DISTRIBUTION AT TSUNAMI WAVE PROPAGATION IN OKHOTSK SEA BASIN
Alexandr RASSADIN1, Artem TUGARYOV1, Broneslav KISELMAN1, Raissa MAZOVA1 AND Leopold LOBKOVSKY2
1 R.E.Alekseev Nizhny Novgorod State Technical University, 24 Minin str., Nizhny Novgorod 603695 Russia
2P.P.ShirshovInstitute of Oceanology, Russian Academy of Sciences, 36 Nakhimovsky ave., Moscow, 123456 Russia
E-mail address: [email protected], [email protected], [email protected], [email protected]
ABSTRACT
The presence of residual subduction zone under Kuril island arc makes a region of Kuril ridge islands be potential seismic-danger since underwater earthquakes in subduction zone with magnitude М > 6 are usually tsunamigenic. Potential strong earthquakes near the Kuril-Kamchatka trench passes along Kuril island, and tsunami generated by them carry a greater risk while passing through Bussol and Krusenstern straits for all Okhotsk seashore including the Sakhalin coast where now taking place a rising of infrastructure development connected with development an oil and gas industry. In the history, a few occasions of tsunami generation near the Sakhalin coast, caused by earthquakes in Kuril ridge region had been recorded (see, e.g. [1]).
Such occasion taken place while strongest earthquake occurs recently near the Simushir island (15 November 2006). This earthquake and tsunami were predicted half of year before the event: while marine expedition clarified structure and size of possible undersea source in the area of seismic gap in Middle Kuril region. Then, the numerical
" 1Vol 36. No. 4, page 243 (2017)

simulation of tsunami generation and propagation was performed using keyboard model of an earthquake. Since not all seismic gap area was activated, it’s interesting to perform a numerical modeling of potential catastrophic earthquake and tsunami in residual seismic gap of Middle Kuril and compare results with similar scenario of earthquake and tsunami for hypothetical source placed in inactive part of seismic gap. In this paper, such modeling was performed based on keyboard model of tsunamigenic earthquakes [2]. Calculation was performed using nonlinear shallow water equations and considering bottom dissipation. Spectral analysis of tsunami wave field in this model gives new possibilities for determination of energy characteristics of tsunami in the whole modeling area.
1. INTRODUCTION
Currently, there are several seismic gaps, where earthquake did not happen for a long time. These include Aleutian, and Shumagin seismic gaps, and residual seismic gap in the area of middle Kuriles. The seismic gap of the Middle Kuril Islands [3] until 30 September 2006 was one of these "zones of silence." The hypothetical earthquake source in this area was determined by two Russian expeditions of the Shirshov Institute of Oceanology of the Russian Academy of Sciences, conducted in 2005 and 2006. This center was schematically represented as 8-keyboard blocks [4]. After the earthquake of September 30, 2006 and tsunamigenic earthquake November 15, 2006, seismic gap has been in fact halved. It is now possible to talk about a potential earthquake with a source, localized in the Pacific against the Kruzenshtern Strait, which is now presented by the remaining four blocks. Preliminary calculation performed before the events of 30 September and 15 November 2006 [4.5] for a full 8-block area of source in the middle Kuriles, has shown that the strong earthquake with a magnitude of more than 7.5 - 8 catastrophic tsunami on the coasts of the settlement area are possible. The occurred six months after these preliminary calculations of earthquake simulation in the area of the Kuril chain in September 30, 2017 with a magnitude of M = 7.1, does not cause catastrophic consequences, while earthquake 15 November.2006 with magnitude M = 8.3 caused a tsunami that confirm the preliminary calculation [4]. As known, on Sakhalin Island, there are numerous mining and processing of oil, and there are numerous settlements. For any significant earthquake and subsequent tsunami attacking the Sakhalin coast an enormous damage, both human and material is possible. In this regard, we now discuss in detail the wave energy distribution in the Sea of Okhotsk in different variants of its arrival in the Pacific Ocean. To analyze the process of generation and propagation of tsunami waves before and after the passage of the Bussole and Kruzenshtern straits in the water area synthetic tide gauges at given points were placed. At the propagation of tsunami waves both the amplitude characteristics of the wave field and distribution of energy over the frequencies are determined not only by bathymetry basin, depending not only on the direction of propagation, but also on a form of tsunami source and its evolution during the formation tsunami. Numerical modeling of tsunami generation and thus the formation of his
" 2Vol 36. No. 4, page 244 (2017)

Fig. 1. Location of virtual tide gauges calculated: points B1, B2 correspond to input and output of wave flow through Bussole strait; points 1,8,15 correspond to
centers of considered regions of the basin; points 2-7, 9-14, 16-21 indicate location of computed (synthetic) tide gauges.
source using the proposed keyboard block model of underwater seismic source [4-6] allows one to calculate the structure of the wave field in coastal area in more detail, which is important for practical applications [7].
2. STATEMENT OF THE PROBLEM
To simulate potential catastrophic earthquakes with a magnitude of 8.2, two hypothetical earthquake sources were selected, about 230 km long and 100 km wide, located in front of the Bussole strait (SCENARIO 1) (Fig. 1) and the Kruzenshtern strait (SCENARIO 2) (Fig. 2). To estimate the wave energy directivity of the given seismic sources the synthetic tide gauges have been placed at the inlet and outlet passages, and in the Sea of Okhotsk, where they are grouped into six "point clouds". Such an arrangement of synthetic tide gauges allows us to keep track of what part of the wave energy is transferred from the Pacific Ocean to the Okhotsk Sea through the Bussole and the Kruzenshtern straits, respectively, and how, for both scenarios, wave energy are distributed on the Sea of Okhotsk. Data from these gauges are analyzed using time-frequency analysis [8-12].
" 3Vol 36. No. 4, page 245 (2017)
Bussol strait

Fig.2. Location of virtual tide gauges: points K1,K2 correspond to input and output of wave flow through Kruzenshtern strait; points1,8,15 correspond to centers of considered regions of the basin; points 2-7, 9-14, 16-21 indicate location of computation synthetic tide gauges.
3. MATHEMATICAL MODEL USED FOR COMPUTATION
Simulation of the process of generation and propagation of tsunami wave was carried out in the framework of nonlinear shallow water equations (see, e.g. [3,4,13,14]
" (1)
where x and y are the spatial coordinates; t is the time, " is the velocity of the particle; u (x, y, t),v (x, y, t) are the velocity components; η is the water surface disturbance with respect to its initial level; H is the depth of the basin, В(x,y,t) is the change in the seabed (considering the dynamic characteristics of the seismic source); g is the gravitational acceleration. Here,
( )( )⎪⎩
⎪⎨⎧
=−++
=⋅+⋅+
tt
t
BUBHdiv
FgradgUgradUU!
!!!!
ηη
η
),( vuU!
" 4Vol 36. No. 4, page 246 (2017)
Krusenstern strait

" ; where " , " determine the
bottom friction, and " - Shezy coefficient, and sh is the roughness
coefficient function, " describes the variation of the sea bottom in the area of the seismic source. The computational domain is shown in Fig.1 and Fig.2.
Of the variety of difference schemes approximating equations (1), we chose the scheme proposed in [15] because of its high algorithmic versatility. The scheme is based on a divided difference and, in conjunction with the central difference approximation of spatial derivatives, simplifies the numerical implementation of boundary conditions. For the numerical calculations it was used bathymetric map, compiled by Svarichevsky (see, e.g. [16]) with section isobaths from 100 to 250 m. When knowing step by coordinates, the best time step for the whole area was found. The distance between adjacent nodes on the
parallel in meters calculated from the ratio " , step at a time, in seconds, was obtained it turns out, on the basis of the conditions of stability of the difference
scheme " , where " is the absolute value of the maximum
depth of the water area under consideration " .
4. RESULTS OF THE NUMERICAL SIMULATION
In Figs.3,4, examples of realization of generation and propagation of tsunami waves for the two scenarios are presented. It is clearly seen that the ridge Vityaz and the Kuril Islands hinder the passage of the wave in the direction of the Sea of Okhotsk. In this part, the wave energy is reflected from the islands to the ocean, but the main part of the wave passes through the deep of Krusenstern and Bussole straits, which act as natural waveguides. After passing the Kurile chain these straits serve as two point sources being primary sources reradiating energy of waves. Wave fronts are generated as a function of time, speed and vertical position of moving keyboard blocks on the bottom.
In Fig.3, results of numerical simulation of generation and propagation of tsunami waves, when the seismic source is located in front of the Bussole strait (Scenario 1) are presented. The figure shows the position of the wave fronts for the 9 time points of wave propagation through the Bussole strait and propagation of tsunami waves across the Sea of Okhotsk. On the top left panel, t = 16 min wave passes through the strait. It is clearly seen that the wave front has a rounded shape, which is then slightly elongated toward the Deriugina Trough and is directed along the Kurile basin toward Sakhalin Island and
⎟⎟⎠
⎞⎜⎜⎝
⎛=
2
1
ff
F!
221 vuuHCf h ++
−=
η22
2 vuvHCf h ++
−=
η
( )shBHCh
4.0−+=
η
( )tyxB ,,
( )180
cos yjyxу np
jp
Δ⋅+⋅⋅Δ=Δ
π
( )22max jpp
jpp
jyxHg
Myxt
Δ+Δ⋅⋅
⋅Δ⋅Δ=Δ
maxH
211 2
2 ++=
fM
" 5 Vol 36. No. 4, page 247 (2017)
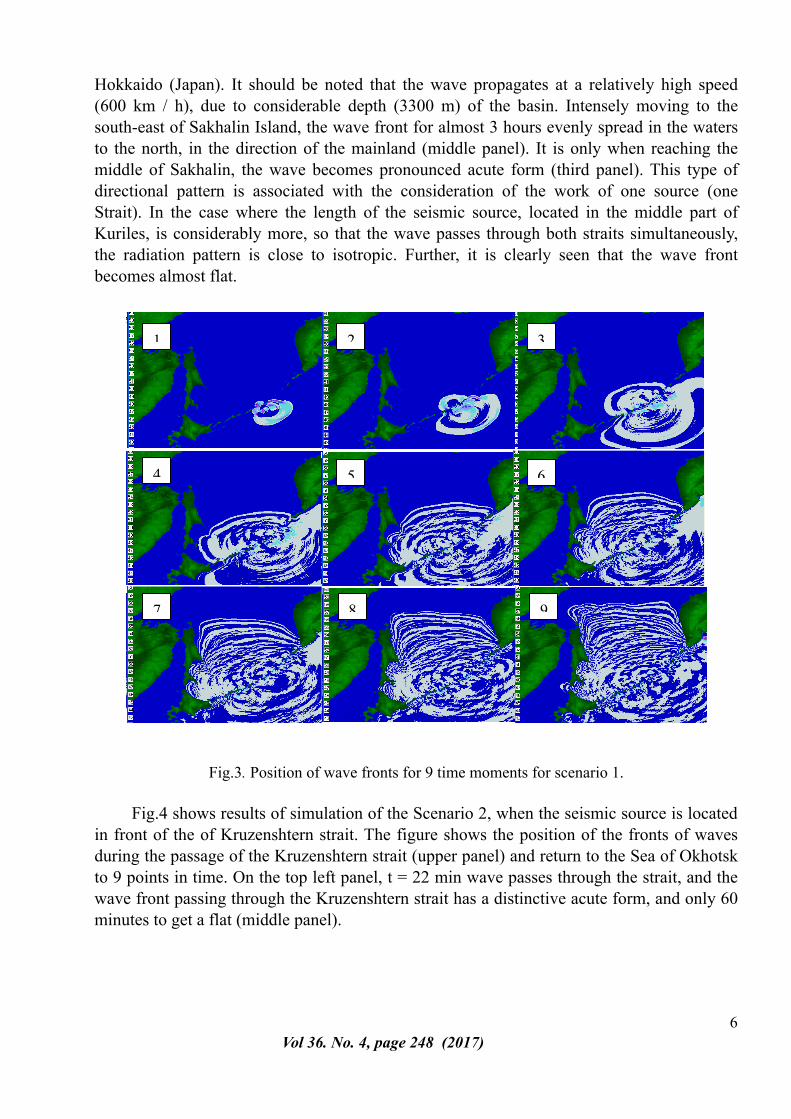
Hokkaido (Japan). It should be noted that the wave propagates at a relatively high speed (600 km / h), due to considerable depth (3300 m) of the basin. Intensely moving to the south-east of Sakhalin Island, the wave front for almost 3 hours evenly spread in the waters to the north, in the direction of the mainland (middle panel). It is only when reaching the middle of Sakhalin, the wave becomes pronounced acute form (third panel). This type of directional pattern is associated with the consideration of the work of one source (one Strait). In the case where the length of the seismic source, located in the middle part of Kuriles, is considerably more, so that the wave passes through both straits simultaneously, the radiation pattern is close to isotropic. Further, it is clearly seen that the wave front becomes almost flat.
Fig.3. Position of wave fronts for 9 time moments for scenario 1.
Fig.4 shows results of simulation of the Scenario 2, when the seismic source is located in front of the of Kruzenshtern strait. The figure shows the position of the fronts of waves during the passage of the Kruzenshtern strait (upper panel) and return to the Sea of Okhotsk to 9 points in time. On the top left panel, t = 22 min wave passes through the strait, and the wave front passing through the Kruzenshtern strait has a distinctive acute form, and only 60 minutes to get a flat (middle panel).
" 6Vol 36. No. 4, page 248 (2017)
2 31
4 5 6
7 8 9

Fig.4. Position of wave fronts for 9 time moments for scenario 2.
5. SPECTRAL ANALYSIS
Using the above results of simulation of the generation and propagation of tsunami waves in the basin it was carried out the one-dimensional and two-dimensional (wavelet) spectral analysis and obtained spectral characteristics of tsunami waves in the Sea of Okhotsk for the potential strong underwater earthquakes with sources located in the seismic gap of middle Kuriles before Bussol and Kruzenshtern straits.
To analyze the energy distribution in the Sea of Okhotsk, two approaches were used: amplitude logarithmic transfer functions and amplitude wavelet-spectrogram. From each tide gauge records there were sampled segments of a length of N = 35,000 counts (about 5 RTC) [11-13]. The transfer functions of the amplitude spectra demonstrate the correlation between the absolute values of energies (the energy in our case is a quantity proportional to the square of the amplitude of the wave) in the two points of observation. For each set of tide-gauge data it was calculated spectral density of signal power received by the periodogram method
(2)
, ,
as well as the value (3)
" 7Vol 36. No. 4, page 249 (2017)
2 31
4 5 6
7 8 9

where T is the tide gauge record sampling interval, is the signal received from a
synthetic tide gauge, is the number of spectral estimation segments, is the number of
samples in the segment , is the start time of observation, is the end time of
observation, is the weighting function.
The transfer functions for the points with numbers m and n are as the ratio of the spectral density of the signal modules in the corresponding points [12]:
(4)
Spectrogram is the most obvious way to understand how to change over time, the frequency distribution of wave energy. Amplitude spectra were calculated using a filter set based on a Gaussian function for different
"
, for different . (5)
200 filters were used with same Q-factor and central frequency, linearly distributed from 0.1 to 8 cph.
6. IMPLEMENTATION OF SCENARIOS I AND II
6.1 Analysis of the implementation scenario I.
Fig.5 shows the wave and power characteristics for the tsunami wave that came from the Pacific Ocean to the Bussole strait (see Fig.1, B1). Fig.5.1 shows the calculated tide gauge record with synthetic tide gauge located at the entrance to the strait. Built to it, using the formulas (2) - (5) wavelet-spectrogram is shown in Fig.5.3. The figure which clearly shows that the main wave energy to an entry point in the Strait is concentrated in the area of almost triangular in shape for the interval from 20 to 70 minutes, and the frequency in the range of 1-4 cph, which corresponds to T ~ 15-60 min waves. The intensity is of about 50 dB. This is reflected on the energy curve (Fig.5.4) as a peak at a given interval. It can be seen that the maximum concentration of energy is typical for the time range of 20-70 min (Fig.5.2). Energy for the exit of the Strait (Fig.6.3) is distributed more evenly over the entire range of
" 8Vol 36. No. 4, page 250 (2017)

observation, that can be well seen in the graph of wavelet-spectrogram. The highest intensity of the wave to 45 dB in the frequency range of 3.1 cph is observed in the range of 30 to 80
min. In the interval of 110 to 170 min in the same frequency range 3.1 cph, less intensity of up to 35 dB is obtained (Fig.6.3). At the energy curve (Fig.6.4) this range corresponds to a region of increasing functions. One can also see that the maximum concentration of energy is typical for the time range T ~ 30-80 min (Fig.6.2). The peak on the energy curve (Fig.6.2) is in the time interval T ~ 20-50 min. Comparing the peaks of the input points in the Strait of (B1) (Fig.5.4) and exit the Strait (B2) (Fig.6.4) in the plot of the instantaneous power, it can be concluded about the time of the passage of a wave of strait T ~ 20-30 min. Relevant frequency range for point B2 (out of the Strait) is wider than B1 (the entrance to the Strait) is 1.5 times that can be clearly seen from the graphs of the frequency distribution of energy (Fig.5.4, Fig.6.4).
" Fig.5. Wave and energy characteristics of tsunami before enter to Bussol strait: (1)- tide gauge
record, (2)- short time power for wave front, (3)- wavelet-spectrogram, (4) - estimation of spectrum of energy.
" 9Vol 36. No. 4, page 251 (2017)

!
Fig.6. Wave and energy characteristics of tsunami at output from the Bussol strait: 1) tide gauge record, (2)- short time for wave front, (3)- wavelet spectrogram, (4) - estimation of spectrum of
energy.
Speaking about the transfer of energy through the strait, it should be noted that the wave loses its energy much with the greatest loss was for long waves (up to 20 dB and a maximum of 7 dB on average) (see Fig.7). The attenuation for frequencies are 0.6, 2.5, 4.2, 7.5 cph i.e., for periods of T = 100 min, 25 min, 14 min, 8 min, most intense observed attenuation, although local maxima at the frequencies f = 1.5, 3.5, 6.5 cph (T = 40 min, 17 min, 6 min) are visible.
" Fig.7. Logarithmic transfer function input-output for Bussol strait.
6.2 Analysis of the implementation of the II scenario.
Fig.8 and Fig.9 show the energy wave characteristics, at the entrance to the Strait of Kruzenshtern and after outcome the wave of the Strait. Fig.8.3 clearly shows that the spectrum contains three areas of signal amplification corresponding to the frequencies f ≈
" 10Vol 36. No. 4, page 252 (2017)

1-3,5 cph (period T = 17-60 min). Analysis of the data shows that the amplification exists in range of T ~ 20-50 min, 125-175 min and 200-280 min with the greatest intensity to 45 dB. For the time range at the instantaneous power plot (Fig.8.2) the uniform energy distribution is characteristic with a peak at around 18 min.
" Fig.8. Wave and energy characteristics of tsunami before enter to Kruzenshtern strait:
1) tide gauge record, 2) instant power for wave front, 3) wavelet-spectrogram, 4) frequency characteristics of wave energy.
In Fig.9.3 it can be clearly seen that in spectrum it is present almost permanent component with a frequency of f ~ 1-2 cph (during 30-60min) with an intensity of > 50 dB. As follows from the instantaneous power plot (Fig.9.2), under the passage of the waves through the Strait Kruzenshtern part of the wave energy (up 2.5 times) is also lost. In the wave train at outcome from the Kruzenshtern Strait the long-wavelength component prevails what is reflected in the characteristic form of a graph of the frequency distribution (Fig.9.4).
"
Fig.9. Wave and energy characteristics of tsunami after passing to Kruzenshtern strait: (1)- tide gauge record, (2)- short time power for wave front, (3)- wavelet-spectrogram, (4) -estimation of
spectrum of energy " 11
Vol 36. No. 4, page 253 (2017)

For Kruzenshtern Strait (Fig.10) it is clearly seen the amplification of the signal at the output for the low frequency range in the interval 1.5 4 cph. The transfer function quite changeable – in the plot there are present in the average much pronounced resonance regions, the most intense gain up to 15 dB is observed for frequencies of 1.5, 2.0, 4.0 cph, i.e. for periods T = 40 min, 30 min, 15 min, although there is a local minimum at a frequency f = 0,5 cph.
" Fig.10. Logarithmic transfer function input-output for Kruzenshtern strait.
Consider now the propagation of wave energy in the Sea of Okhotsk and make analysis of the direction of its gain for Scenario 1. It can be seen that in comparison with the output of the Bussole strait (p.B2) component of the low-frequency waves, which came into the center of the "cloud 1" p.1 almost retains its energy (Fig.11.2). For the center of the "cloud II» (p.8) part of the low-frequency energy is transferred into the high-frequency range, while the center of the "cloud III» p.15, the low-frequency component prevails again.
! Fig. 11. Wavelet-spectrograms for scenario I : 1) p. B2; 2) p. 1; 3) p. 8: 4) p. 15 (see Fig. 1).
" 12Vol 36. No. 4, page 254 (2017)

For a more detailed analysis of the propagation of wave energy on the Sea of Okhotsk, there were built transfer functions, with the smoothed cubic spline (Fig.12). Thus, Fig.12.1 shows the transfer functions for the points described in the wavelet-spectrograms in Fig.11. It is clearly seen that the attenuation of the wave energy is characteristic for the entire frequency range and in all directions. The lowest energy loss is for the low-frequency range up to 3.5 cph for a direction from p.B2 to p.1 (see Fig.1). For higher frequency bands 5-6 and 6.8-7.5 cph, i.e., duration of 10-12 min and 8-9 min, the waves with the least loss of energy, will be the direction of the exit of the Strait Bussol to points 8 and 15, respectively. In Figs.12.2-12.4 there are presented transfer functions of the localization centers "point clouds" - gauges 1,8,15, to the points on the circle of the "cloud", where the synthetic gauges (see Fig.1) were placed.
"
Fig.12. Logarithmic transfer functions: 1) for output from Bussol strait to centers of «clouds» of virtual tide gauges, 2)-4) from centers of «clouds» (pp.1,8,15) to points at the circle.
Choosing only three of the six areas, presented at the circles of "clouds" on Fig.1, connected with the preliminary analysis of the data of synthetic tide gauges, which allowed us to select the direction with the greatest intensity of wave energy. Fig.12.2 shows the transfer functions from the center of a "cloud I» to the pp.2,5,7; Fig.12.3 shows the transfer functions from the center of the "cloud II» (p.8) to pp.9,11,13 and Fig.12.4 shows the transfer functions from the center of the "cloud III» (p.15) to the pp.16,20,21 at the circles, in which the synthetic tide gauges are placed (the direction is indicated in the upper left corner of each block). For the "cloud I» it is characteristic a more uniform distribution of wave energy with a predominance in the direction of p.5 (direction to Sakhalin island). Considering the "cloud II», we come to the conclusion that a large part of the wave moves to the Terpeniya Gulf and a little less in the direction of "cloud III» (see Fig.1).
Consider now the propagation of wave energy in the Sea of Okhotsk for Scenario 2. As described above, when wave come from the output of the Kruzenshtern Strait, permanent
" 13Vol 36. No. 4, page 255 (2017)

component with a frequency of 1-2 cph, period (60-30 minutes) is present in its spectrum with an intensity of up to 50 dB. It is clearly seen that most of the wave energy is concentrated in the range of 30 to 200 min (Fig. 13.1).
!
Fig. 13. Wavelet-spectrograms for scenario II : 1) p. K2; 2) p. 1; 3) p. 8; 4) p.5 (see Fig. 2).
It can be seen that in comparison with the outcome of the Strait (p.K2) low-frequency component of the wave, which came in p.1, is concentrated only in the range of ≈ 20-80 min, with low energy loss up to 35-40 dB (Fig. 13.2). It is clearly seen that for p.8 (Fig. 13.3) the low-frequency energy in the interval 170-300 min are considerably weakened, and for the third "cloud" center of p.15 (Fig.13.4), for the low-frequency component is a some amplification for frequencies of 1.5-3 cph, shifted in the time interval 200-300min.
For a more detailed analysis of the propagation of wave energy in the water area for Scenario II construct transfer functions, smoothed with cubic spline. Choosing only three of the six areas, presented on the circles of "clouds" on Fig.2, related to the preliminary analysis of the data of synthetic gauges, which allowed us to select the direction with the greatest intensity of wave energy. Fig.14.1 shows the transfer functions from the exit of the Kruzenshtern strait K1 in the "clouds" centers (IV, V, VI). It is clearly seen that the general weakening of the signal, with the exception of the direction to "cloud I» the center, and then the "cloud III». It is clearly seen that the wave intensity for the direction of the "cloud III», significantly less than in the first two directions.
" 14Vol 36. No. 4, page 256 (2017)

" Fig.14. Logarithmic transfer functions: 1) for output from Kruzenshtern strait to centers of «clouds»
of virtual tide gauges, 2)-4) from centers of «clouds» (pp.1,8,15) to points at the circle.
This leads to the conclusion that the main flow of the wave energy is turn to on Sakhalin. Fig.14.2 shows the transfer functions from the center of the "cloud IV» to the pp.2,5,7; Fig.14.3 shows the transfer functions from the center of the "cloud V» to pp.9,13,14 and Fig.14.4 shows the transfer functions from the center of the "cloud VI» to pp.19,20,21 at the circles, at which synthetic tide gauges are placed (the directionis indicated in the upper left corner of each block). In Fig.14.2 we can see that in the "cloud IV» gauges (see Fig.2) is dominated by the energy in the direction of p.5 in the frequency range up to 2.3 cph, with a fairly sharp turn to the islands along the Deriugina Trough. One can see almost uniform energy distribution from 2.3 to 3,6 cph in all three directions (to the pp.2, 5 and 7, with a slight increase in the intensity to 2 (in the direction of Kamchatka).
For cloud V» (Fig.14.3) it is well seen practically uniform energy distribution with a predominance of direction to p.9, which is then in this direction, it decreases significantly. There are clearly seen energy peaks for frequencies of 3.5 cph and 6 cph (17 min and 10 min waves) for directions to pp.13 and 14 (north-east Sakhalin).
For the "cloud VI» (Fig.14.4) in the range of up to 2.2 cph (wavelength of 27 min) to the predominant direction of p.21 (northeast Sakhalin), a significant increase in energy towards the p.19 for the frequency 2 5 cph and 6 cph (24 min and 10 min wavelength) is observed. For a frequency of 1.8 cph (for 33 min waves) a significant decline in energy in the direction of p.20 (the middle of Sakhalin), then for frequencies 3-4,8 cph (20 to 12 min waves) uniform energy distribution for pp.19,20; for the frequency of 7.2 cph (8 min waves) a significant decline in energy.
7. DISCUSSION Thus, the tsunami waves generation analysis of seismic sources located about Boussole Strait [7], as well as seismic sources other configurations (see, e.g, [17-21]), confirmed that
" 15Vol 36. No. 4, page 257 (2017)

an abnormally weak manifestations of tsunami waves 15 November 2006 in Sea of Okhotsk, the northern and southern parts of the Pacific coasts of the islands of the Kuril island arc and the Japanese islands, with a strong earthquake with a magnitude of 8.3, is not a random event, but a natural consequence of the "work" only of one - Boussole Strait, actively extinguishing energy suitable to the strait waves. It also shows that at a given location of the earthquake source, the greatest wave heights can be achieved only in the southern part of Sakhalin Island. In the middle of the Sakhalin gain achieved probably due to the effect of trapped waves (cf. [22,23]. At that time, in the case of the location of the seismic source near the Kruzenshtern Strait, signal amplification will be observed for all low-frequency range, and can lead to more serious consequences on the Okhotsk coast of our islands, especially in the north-eastern coast of Sakhalin Island and on the Pacific Coast of Kamchatka and the islands of Hokkaido and Honshu (Japan).
Fig. 15 compares the results of the presented calculations with the data of [24]. It is clearly seen that the direction of the energy flows from the Bussol Strait and the Krusenstern Strait coincides with the data of [24]. However, the direction of energy flows in more limited areas, where synthetic gauges are localized, differs somewhat from the data of the work [24]. For example, in Fig.15a, b, a turn of energy flows to Sakhalin Island is clearly seen, and when the wave passes through the Bussol Strait the flow goes to the middle part of Sakhalin, and when the wave passes through the Kruzenshtern Strait, the energy flow "attacks" the north-eastern part of Sakhalin Island.
a) b)
Fig. 15. Comparison of the synthetic energy fluxes for tsunami, generated by the November 2006 earthquake obtained in the present work with the data of the energy fluxes from the work of
Rabinovich, et al. (2008) [24]. Red and black points indicate the location of virtual tide gauges of computed. The blue arrows show the direction of the propagation of energy flows from the Bussol
Strait (a) and the Kruzenstern Strait (b).
" 16Vol 36. No. 4, page 258 (2017)

8. CONCLUSION
Thus, from the analysis above, it follows that: • Wave front, leaving the Boussole Strait in the Sea of Okhotsk, takes place on a broad front in the direction of the south-eastern tip of Sakhalin, as well as starting the movement to the northwest, is in the direction of the middle part of Sakhalin • Bussol Strait actively dampens the energy of a suitable wavelength to the strait, in the first place, the low-frequency part of the spectrum; • When comparing the graphs of transfer functions B1-B2 (input-output of the Bussole Strait) and K1-K2 (input-output of the Kruzenshtern Strait), the most intense attenuation for Boussole Strait is for frequencies of 0.6, 2.5, 4.2, 7.5 cph (signal attenuation interval); signal amplification intervals for Boussole Strait are slightly expressed, while as for Kruzenshtern Strait signal amplification was observed for all the low frequency band in the range of 10-18 cph; • For Kruzenshtern Strait transfer functions are changeable enough - in the plots in the average a lot of distinct resonance regions is present; amplification of the signal is observed for all the low-frequency range; • for waves coming from the Kruzenshtern Strait amplification of wave energy is significant in the areas of the middle and north-eastern regions of Sakhalin.
9. ACKNOWLEDGEMENTS
This work was supported by the Russian Science Foundation, project no. 14-50-00095.
REFERENCES
1. Shchetnikov N.A. The tsunami along the coast of Sakhalin and the Kuril Islands from tide-gauge data 1952-1968. FEB USSR Academy of Sciences, Vladivostok, 24, 1990 2. Lobkovsky L.I., Baranov B.V. Keyoard model of strong earthquakes in island arcs and active continental margins. Doklady of the Academy of Sciences of the USSR. V. 275. № 4. p. 843-847. 1984. 3. Lobkovsky L.I., Mazova R.Kh., Kataeva L.Y., Baranov B.V. Generation and distribution of the catastrophic tsunami in the Sea of Okhotsk. Possible scenarios. Doklady AN V. 410, pp 528-531, 2006a. 4. Lobkovsky LI Mazova AD Baranov BV Kataeva LY Simulation of a tsunami in the Sea of Okhotsk on the basis of the keyboard models of subduction zone. in the book .: Fundamental research of seas and oceans (Ed. Laverov NP), Moscow, Nauka Press, Part 1, p. 292- 303, 2006b. 5. Lobkovsky L.I., Baranov B.V., Mazova R.Kh., Kataeva L.Yu. Implications of the seismic source dynamics for the characteristics of a possible tsunami in a model problem of the seismic gap in the Central Kurile region, Russ. J. Earth Sci., V.8,ES5002,doi:10.2205/ 2006ES000209, http://dx. doi. org/ 10.2205/2006ES000209, (2006c).
" 17Vol 36. No. 4, page 259 (2017)

6. Lobkovsky L.I. Mazova R.H., Kiselman B.A. Morozova S.A. Numerical simulation and spectral analysis of the tsunami November 15, 2006 in the Kuril-Kamchatka region. Oceanology V.50. No. 4. p.1-10. 2010. 7. Gusiakov VK An estimate of the tsunami earthquake underwater spectral characteristics of Rayleigh waves // in: Proc : Generation of tsunami waves and access to the beach, Moscow, Radio and Communications, 1984, p.84-95. 8. Kulikov E.A., Poole S.L., Rabinovich A.B. The spectrum of long waves in the open ocean and the tides radiation // in Proc.: Wave processes in the northwestern part of the Pacific Ocean, Vladivostok: Far Eastern Scientific Center, Academy of Sciences of the USSR, 1980, p.28-38 9. Vetterli M., Kovacevic J., Goyal V. - Foundation of Signal Processing, Cambridge University Press (ISBN 110703860X), 2013, 707p. 10. Lyons R. Digital Signal Processing // Binom-Press, 2006. 11. Sergienko A.B. Digital Signal Processing // SPb .: Peter, 2002. 12. Mallat Stephane A wavelet tour of signal processing , Academic Press, 1999. 13. Pelinovsky E.N. Nonlinear dynamics of tsunami waves. Preprint of Institute of Applied Physics Academy of Sciences of the USSR, Gorky, 1982. - 226 p. 14. Voltsinger, N. E., Klevanny K. A., and Pelinovsky E. N., Long-wavelength dynamics of coastal zone (in Russian),., Hydrometeoizdat, Leningrad. 272 p (1989) 15. Marchuk, A. G., Chubarov L. B., and Shokin Yu. I., Numerical Simulation of Tsunami Waves (in Russian), 175 pp., Nauka Press, Novosibirsk. (1983). 16. Baranov B.V.,Pristavakina E.I., Dozorova K.A., Svarichevsky A.S The structure of the Okhotsk Sea and the development of its sedimentary basins, Arctic and Russian Studies II, Report 671, edited by R.Flecker, 997,Cambridge, 58p. 17. Soloviev S.L., Nekrasov A.V., Buhteev V.G. Pyaskovsky R.V. Pre-tsunami Kuril-Kamchatka coast, based on hydrodynamic calculations // in the book .: Theoretical and experimental research on the tsunami. Moscow, Nauka Press, 1977, p. 131-139. 18. Kurkin A.A. Pelinovsky E.N., Choi B.H., Lee D.S. Comparative evaluation of the coast tsunami Japonomorsky Russian numerical simulation. Oceanology.. T. 44. № 2. p. 179-188. 2004. 19. Horrillo J., Knight W., Kowalik Z. Kurile Islands tsunami of November 2006: 2. Impact at Crescent City by local enhancement. J.Geophys.Res. 2008. V.113. P.C01021 doi:10.1029/ 2007JC004404. 20.Kowalik Z., Horrillo J., Knight W., Logan T. Kurile Islands tsunami of November 2006: 1. Impact at Crescent City by distant scattering. J.Geophys.Res. 2008. V. 113. P.C01020. doi:10.1029/2007JC004402 21. AI Zaitsev, DP Kovalev, Kurkin AA, Levin BV, Pelinovsky EN, Chernov AG, Yalchiner A. Nevelsk tsunami 2 August 2007: Tool data and numerical simulation // Doklady of the Academy of Sciences.. T. 421. № 2. p.249-252. 2008 22. Levin B.V., Chernov A.G., Shevchenko G.V., Kovalev P.D., Kovalev D.P., Kurkin A.A. Likhachev O.N., Shishkin A.A. First results registration wavelength range periods of tsunami Kuril ridge on network diversity stations // Doklady of the Academy of Sciences. V. 427. № 2. p. 239-244. 2009
" 18Vol 36. No. 4, page 260 (2017)

23.Lobkovsky, L.I., Rabinovich, A.B., Kulikov, E.A., Ivashchenko, A.I., Fine, I.V., Thomson, R.E., Ivelskaya, T.N. and Bogdanov, G.S.,. The Kuril Earthquakes and tsunamis of November 15, 2006, and January 13, 2007: Observations, analysis, and numerical modeling. Oceanology, 49(2), pp.166-181. 2009
24.Rabinovich, A.B., Lobkovsky, L.I., Fine, I.V., Thomson, R.E., Ivelskaya, T.N. and Kulikov, E.A.,. Near-source observations and modeling of the Kuril Islands tsunamis of 15 November 2006 and 13 January 2007. Advances in Geosciences, 14, pp.105-116. 2008.
25.Mazova R.K., Kiselman B.A., Kolchina E.A.,. Numerical simulation of tsunami wave height distribution for Turkish Black Sea coast in nonlinear dynamic keyboard model of underwater seismic source. Journal of Computational and Applied Mathematics, 259, pp.887-89. 2014.
" 19Vol 36. No. 4, page 261 (2017)