Embed Size (px)
Citation preview
Science of the Total Environment 795 (2021) 148872
Contents lists available at ScienceDirect
Science of the Total Environment
j ourna l homepage: www.e lsev ie r .com/ locate /sc i totenv
Predicting wildfire particulate matter and hypothetical re-emission ofradiological Cs-137 contamination incidents
Kirk R. Baker a,⁎, Sang Don Lee a, Paul Lemieux a, Scott Hudsonb, Benjamin N. Murphy a, Jesse O. Bash a,Shannon N. Koplitz a, Thien Khoi V. Nguyen c, Wei Min Hao d, Stephen Baker d, Emily Lincoln d
a U.S. Environmental Protection Agency, Research Triangle Park, NC, USAb U.S. Environmental Protection Agency, Cincinnati, OH, USAc U.S. Environmental Protection Agency, San Francisco, CA, USAd Missoula Fire Sciences Laboratory, Rocky Mountain Research Station, US Forest Service, Missoula, MT, USA
H I G H L I G H T S G R A P H I C A L A B S T R A C T
• This modeling system captures local toregional scale transport and levels ofPM2.5 from wildfire.
• The model reasonably captured the ex-tent of the surface mixing layer com-pared to measurements.
• Multiple hypothetical wildfire scenariosmodeled with post-incident 137Cs emis-sions.
• Modeled post-incident ambient levels137Cs would not require populationevacuation or shelter-in-place.
⁎ Corresponding author.E-mail address: [email protected] (K.R. Baker).
https://doi.org/10.1016/j.scitotenv.2021.1488720048-9697/Published by Elsevier B.V.
a b s t r a c t
a r t i c l e i n f oArticle history:Received 10 April 2021Received in revised form 1 July 2021Accepted 2 July 2021Available online 5 July 2021
Editor: Elena Paoletti
Keywords:WildfireCesiumCMAQPM2.5
Radiological release incidents can potentially contaminate widespread areas with radioactive materials and de-contamination efforts are typically focused on populated areas, which means radionuclides may be left in for-ested areas for long periods of time. Large wildfires in contaminated forested areas have the potential toreintroduce these radionuclides into the atmosphere and cause exposure to first responders and downwind com-munities. One important radionuclide contaminant released from radiological incidents is radiocesium (137Cs)due to high yields and its long half-life of 30.2 years. An Eulerian 3D photochemical transport model was usedto estimate potential ambient impacts of 137Cs re-emission due to wildfire following hypothetical radiological re-lease scenarios. The CommunityMultiscale Air Quality (CMAQ)model didwell at predicting levels and periods ofincreased PM2.5 carbon due to wildfire smoke at routine surface monitors in California during the summer of2016. Themodel also did well at capturing the extent of the surfacemixing layer compared to aerosol lidar mea-surements. Emissions from a large hypothetical wildfire were introduced into the wildland-urban interface(WUI) impacted by a hypothetical radiological release event.While ambient concentrations tended to be highestnear the fire, the highest population committed effective dose equivalent by inhalation to an adult from 137Csover an hour was downwind where wind flows moved smoke to high population areas. Seasonal variations inmeteorology (wind flows) can result in differential population impacts even in the same metropolitan area.Modeled post-incident ambient levels of 137Cs both near these wildfires and further downwind in nearbyurban areas were well below levels that would necessitate population evacuation or warrant other protective
K.R. Baker, S.D. Lee, P. Lemieux et al. Science of the Total Environment 795 (2021) 148872
action recommendations such as shelter-in-place. These results suggest that 1) the modeling system captureslocal to regional scale transport and levels of PM2.5 from wildfire and 2) first responders and downwind popu-lation would not be expected to be at elevated risk from the initial inhalathion exposure of 137Cs re-emission.
Published by Elsevier B.V.
1. Introduction
Wildland (wild and prescribed) fires have primary emissions of fine(PM2.5) and coarse (”coarse PM”) fraction particulate matter (Bakeret al., 2016; Baker et al., 2018), both of which are known to negativelyaffect human health (Reid et al., 2016). Exposure to wildfire smokeis expected to increase in the future based on increased fuelavailability and conducive meteorology (Abatzoglou and Williams,2016; Schoennagel et al., 2017). Particulatematter emissions fromwild-land fires can include legacy pollutants that also have negative humanhealth effects such as mercury (Wiedinmyer and Friedli, 2007), lead(Kristensen et al., 2014), and asbestos (Harper et al., 2015) in areaswhere these pollutants deposited in the past. Additionally, elevatedlevels of radiocesium (137Cs) have been measured in biomass in areasimpacted by radiological incidents (Takada et al., 2016; Yoschenkoet al., 2006), and wildfire has been identified as a mechanism for envi-ronmental redistribution (Bourcier et al., 2010; Commodore et al.,2012; Paatero et al., 2009; Strode et al., 2012; Wotawa et al., 2006;Yoschenko et al., 2006).
Studies have shown ambient radionuclide concentration increased bymultiple orders of magnitude compared to background levels during bio-mass burning in the area contaminated with 137Cs from the Chernobylpower plant accident (Kashparov et al., 2000; Yoschenko et al., 2006).However, the levels observed and modeled were not considered signifi-cant in terms of inhalation exposure or a notablemechanism of terrestrialredistribution of radionuclides (Kashparov et al., 2000; Yoschenko et al.,2006). More recently, 137Cs has been measured in biomass in areas im-pacted by the 2011 Fukushima Daiichi power plant accident (Hashimotoet al., 2012; Imamura et al., 2017). The amount of accumulated 137Csvaries by biomass type and biomass form (leaves, litter, soil)(Hashimoto et al., 2012; Imamura et al., 2017; Tikhomirov andShcheglov, 1994). Levels also vary by time elapsed since the accidentand vary spatially due to proximity from the facility (Takada et al., 2016).
Nuclear power plant accidents, improvised nuclear device detona-tions, and radiological dispersal devices can introduce radionuclidesinto the environment, potentially contaminating large areas. 137Cs iswater soluble, has a long half-life (30.17 years), and can easily betaken up by plants (Zhu and Smolders, 2000). These properties meana long residence time in soil and biomass contaminated by radiologicalincidents and thus increased re-emission potential during wildland fireactivity (Garten Jr et al., 2000; Saffarzadeh et al., 2014). It is important tounderstand the potential post-incident impacts of 137Cs from a typicalwildfire to characterize exposure to support prioritization of post-incident remediation efforts (e.g., focus efforts on impacted urban, sub-urban, rural, or forested areas). Decontamination of forests is expensiveandhas negative ecosystem impacts through loss of habitat, soil erosion,and nutrient loss (Jouve et al., 1993; Linkov et al., 1997). Understandingpotential exposure related to re-emission of 137Cs during a wildfirecould help determine whether potential negative human health im-pacts would necessitate remediation despite known negative ecosys-tem impacts related to forest decontamination.
Large wildfires in areas contaminated due to a radiological incidentcould result in significant exposure to first responders and downwindpopulation areas depending on the amounts of radionuclides in con-sumed biomass, plume buoyancy, and meteorology (Goldammer et al.,2008; Hohl et al., 2012; Viner et al., 2015). Photochemical grid modelshave been shown to capture local (Zhou et al., 2018) to regional scale(Baker et al., 2018) wildfire plume transport (e.g., plume buoyancyand meteorologically driven transport) and skill in estimating surface
2
level components of particulate matter for large wildfires (Baker et al.,2016; Baker et al., 2018). Here, a photochemical gridmodel was appliedto estimate 1) actual downwind PM2.5 and coarse PM wildfire impactsin California during the summer of 2016 which had notable wildfire ac-tivity and 2) use that platform to test hypothetical scenarios wherewildfires caused re-emission of legacy 137Cs. The hypothetical scenariosinvolve modeling downwind 137Cs concentrations and exposure tonearby populated areas from large (but not extreme) wildfires emitting137Cs from hypothetical past radiological incidents in Los Angeles andDenver developed for multi-agency emergency response planning.Wildfire emissions of 137Cs were based on laboratory testing and mod-ulated to reflect anticipated post-incident levels of 137Cs in biomass. Theinhalation exposure pathwaywas estimated for each of these hypothet-ical scenarios using conservative assumptions to determine whether137Cs re-emission during a wildfire would necessitate people exposeddownwind to wear personal protection equipment or shelter in place.
This study intends to show that a regional scale application of a pho-tochemical grid model provides a reasonable representation of thetiming and level of PM2.5 impacts of smoke fromwildfire in thewesternU.S. Model performance will be based on model predictions of surfacelevel PM2.5 compared to routine surface level measurements ofspeciated PM2.5 during a period of wildfire activity in California during2016. Second, themodeling systemwill have awildfire augmentedwithhypothetical 137Cs emissions to estimate downwind ambient 137Cs andcommitted effective dose equivalent. The objective is to understandwhether levels are high enough to warrant shelter-in-place warningsfor people exposed to wildfire smoke in situations where a past radio-logical event had contaminated the fuel.
2. Methods
2.1. Modeling system description and application
The Community Multiscale Air Quality (CMAQ) modeling systemversion 5.3.2 (doi: https://doi.org/10.5281/zenodo.4081737) was usedto model wildfire 137Cs impacts and has been applied extensively to es-timate local to regional scale coarse (Li et al., 2013; Nolte et al., 2015)and fine fraction PM (Appel et al., 2013; Nolte et al., 2015). CMAQ wasapplied using 4 km sized grid cells for domains covering California andColorado (Fig. S1). A total of 35 layers were used to resolve the verticalatmosphere from the surface to 50mbwithmore layers near the surfaceto best resolve diurnal variation in the surface mixing layer. Meteoro-logical inputs to CMAQwere generated using version 3.7 of theWeatherResearch and Forecasting (WRF) model (Skamarock et al., 2005). WRFand CMAQ were applied with the same Lambert conic conformal gridprojection. CMAQ was also applied using 1 km sized grid cells for asmaller area around each of the hypothetical fires. Meteorological in-puts for the 1 km simulations were interpolated from the coarser4 kmmeteorology.
Anthropogenic emissionswere based on the 2014National EmissionInventory (U.S. Environmental Protection Agency, 2018) and processedfor input to CMAQ using the Sparse Matrix Operator Kernel Emissions(SMOKE) model (DOI: https://doi.org/10.5281/zenodo.1321280).Biogenic emissions were estimated with the Biogenic Emission Inven-tory System (BEIS) version 3.6.1 using temperature and solar radiationestimated by the WRF model (Bash et al., 2016). Previous work hasshown that anthropogenic (Baker et al., 2015) and biogenic (Bashet al., 2016) emissions are generally well characterized in southernCalifornia andDenver region (Kelly et al., 2016). Spatial and time variant
K.R. Baker, S.D. Lee, P. Lemieux et al. Science of the Total Environment 795 (2021) 148872
chemical species inflowwere based on an annual CMAQ simulation cov-ering the contiguous United States. Wildland fire emissions were dayspecific and based on incident information and satellite fire detectionsfor actual fire location and size (Baker et al., 2016; Larkin et al., 2020).
Model predictions of PM2.5 organic carbon and coarse PM(unspeciated) were paired with measurements at rural monitors inCalifornia in 2016 when wildfire activity was present in the area todemonstratemodel skill in capturing fire-receptor relationships. Hourlymodel predictions were converted to local time and aggregated to dailyaverage and matched with daily average measurements taken every 3days. PM2.5 organic carbon is used as an indicator for wildfire smoke be-cause it is the largest chemical component, and rural non-coastal mon-itors are used to minimize the influence of model performance relatedto anthropogenic or other geogenic (e.g., sea salt) emissions sources.Coarse PMmass performance is included since the hypothetical scenar-ios include coarse PM impacts.
Special instruments deployed as part of field study efforts inCalifornia in 2016 (Faloona et al., 2020) and in Denver in 2014 (Flockeet al., 2020) provide information about the height of the surface mixinglayer and an indication about how well the model is representingthis important parameter for surface level concentration estimates(Langford et al., 2019; Senff et al., 2020). The ceilometer deployed inDenver has a gradient-based algorithm that is part of Vaisala'sceilometer data logging software that calculates 3 mixed-layer heightsand up to 3 cloud levels (Knepp et al., 2017). In addition to surfacemixing layer height prediction, a visual examination of vertical gradi-ents in aerosolmeasured by these instruments provides a strong indica-tion about the height of the surface mixing layer. Model skill inrepresenting smoke transport is based on a comparison of model pre-dicted winds with those measured at routine National Weather Servicesurface monitors.
2.2. Incident scenarios
CMAQwas applied for the period of July 1 to 13, 2014 for the Denverscenario andMay15 toOctober 1, 2016 for the Los Angeles scenario. The2014 period was selected for Denver to take advantage of a field cam-paign (Flocke et al., 2020) that provided unique measurements of sur-face layer mixing height useful for evaluating model vertical mixing ofpollutants. The 2016 period was chosen for California because a fieldcampaign provided information about the vertical structure of aerosolfrom smoke plumes using lidar technology (Langford et al., 2019;Senff et al., 2020) and because that summer featured large wildfiresnear Los Angeles that could serve as a basis of the hypothetical scenar-ios. A summer and fall episode were extracted from the California sce-nario to focus on different seasons with winds blowing toward the LosAngeles area.
Each hypothetical wildfire was modeled for each day of the simula-tion.Wildfire impacts were estimated as the difference between a base-line simulationwith all sources and a second simulationwith all sourceswith the hypothetical wildfire. The California hypothetical scenarioswas based on the actual emissions and location of the Sand fire (locatedto the north of Los Angeles in 2016), with radionuclides artificially in-cluded in the emissions. The wildfire in the Denver scenario is basedon the actual Sand fire (same as the California scenario) but the locationis hypothetical (located just west of Denver).
The Denver scenario (Fig. S2) was based on a hypothetical truck-dirty-bomb incident developed for the 2012 Wide Area Recovery andResiliency Program (WARRP). WARRP was an interagency initiativeintended to reduce time and resources required to remediate urbanareas following a catastrophic chemical, biological, or radiological inci-dent (Connell, 2012). The original radiological incident plume impactswere based on southerly winds. The impact plume orientation wasmodified for this hypothetical scenario by assuming winds were out ofthe east during the hypothetical radiological incident so that the 137Csrelease impacted forested areas in the foothills west of Denver where
3
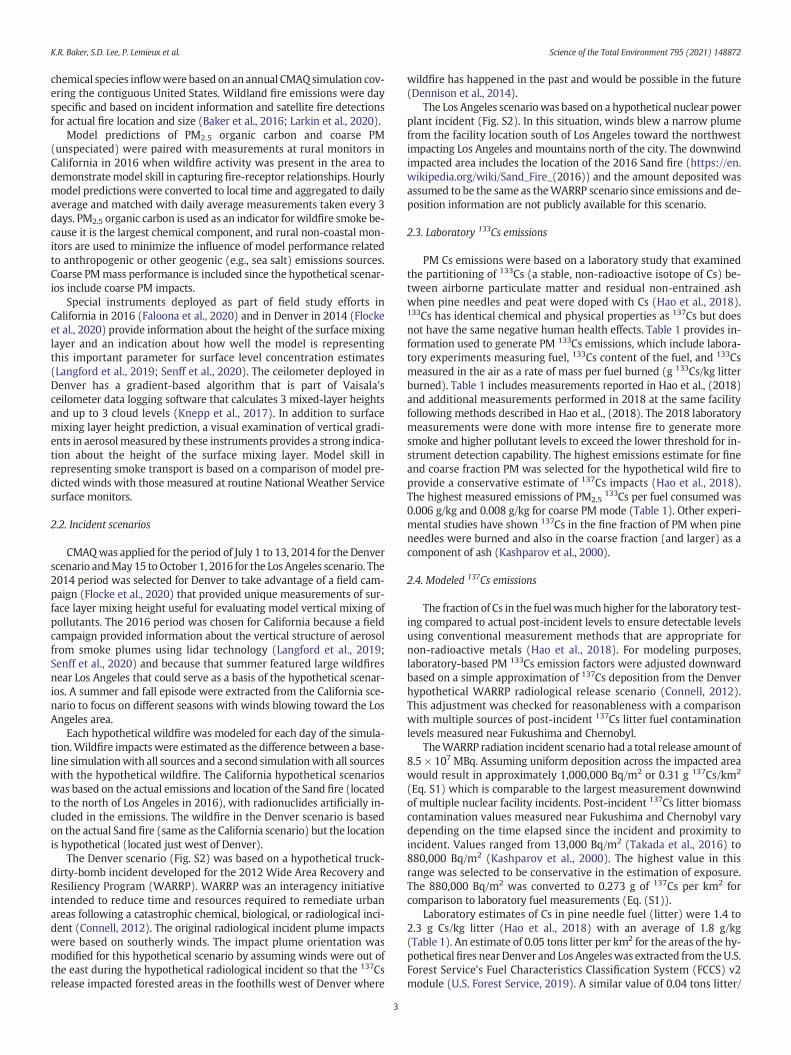
wildfire has happened in the past and would be possible in the future(Dennison et al., 2014).
The Los Angeles scenariowas based on a hypothetical nuclear powerplant incident (Fig. S2). In this situation, winds blew a narrow plumefrom the facility location south of Los Angeles toward the northwestimpacting Los Angeles and mountains north of the city. The downwindimpacted area includes the location of the 2016 Sand fire (https://en.wikipedia.org/wiki/Sand_Fire_(2016)) and the amount deposited wasassumed to be the same as theWARRP scenario since emissions and de-position information are not publicly available for this scenario.
2.3. Laboratory 133Cs emissions
PM Cs emissions were based on a laboratory study that examinedthe partitioning of 133Cs (a stable, non-radioactive isotope of Cs) be-tween airborne particulate matter and residual non-entrained ashwhen pine needles and peat were doped with Cs (Hao et al., 2018).133Cs has identical chemical and physical properties as 137Cs but doesnot have the same negative human health effects. Table 1 provides in-formation used to generate PM 133Cs emissions, which include labora-tory experiments measuring fuel, 133Cs content of the fuel, and 133Csmeasured in the air as a rate of mass per fuel burned (g 133Cs/kg litterburned). Table 1 includes measurements reported in Hao et al., (2018)and additional measurements performed in 2018 at the same facilityfollowing methods described in Hao et al., (2018). The 2018 laboratorymeasurements were done with more intense fire to generate moresmoke and higher pollutant levels to exceed the lower threshold for in-strument detection capability. The highest emissions estimate for fineand coarse fraction PM was selected for the hypothetical wild fire toprovide a conservative estimate of 137Cs impacts (Hao et al., 2018).The highest measured emissions of PM2.5
133Cs per fuel consumed was0.006 g/kg and 0.008 g/kg for coarse PM mode (Table 1). Other experi-mental studies have shown 137Cs in the fine fraction of PM when pineneedles were burned and also in the coarse fraction (and larger) as acomponent of ash (Kashparov et al., 2000).
2.4. Modeled 137Cs emissions
The fraction of Cs in the fuelwasmuchhigher for the laboratory test-ing compared to actual post-incident levels to ensure detectable levelsusing conventional measurement methods that are appropriate fornon-radioactive metals (Hao et al., 2018). For modeling purposes,laboratory-based PM 133Cs emission factors were adjusted downwardbased on a simple approximation of 137Cs deposition from the Denverhypothetical WARRP radiological release scenario (Connell, 2012).This adjustment was checked for reasonableness with a comparisonwith multiple sources of post-incident 137Cs litter fuel contaminationlevels measured near Fukushima and Chernobyl.
TheWARRP radiation incident scenario had a total release amount of8.5 × 107 MBq. Assuming uniform deposition across the impacted areawould result in approximately 1,000,000 Bq/m2 or 0.31 g 137Cs/km2
(Eq. S1) which is comparable to the largest measurement downwindof multiple nuclear facility incidents. Post-incident 137Cs litter biomasscontamination values measured near Fukushima and Chernobyl varydepending on the time elapsed since the incident and proximity toincident. Values ranged from 13,000 Bq/m2 (Takada et al., 2016) to880,000 Bq/m2 (Kashparov et al., 2000). The highest value in thisrange was selected to be conservative in the estimation of exposure.The 880,000 Bq/m2 was converted to 0.273 g of 137Cs per km2 forcomparison to laboratory fuel measurements (Eq. (S1)).
Laboratory estimates of Cs in pine needle fuel (litter) were 1.4 to2.3 g Cs/kg litter (Hao et al., 2018) with an average of 1.8 g/kg(Table 1). An estimate of 0.05 tons litter per km2 for the areas of the hy-pothetical fires nearDenver and Los Angeleswas extracted from theU.S.Forest Service's Fuel Characteristics Classification System (FCCS) v2module (U.S. Forest Service, 2019). A similar value of 0.04 tons litter/
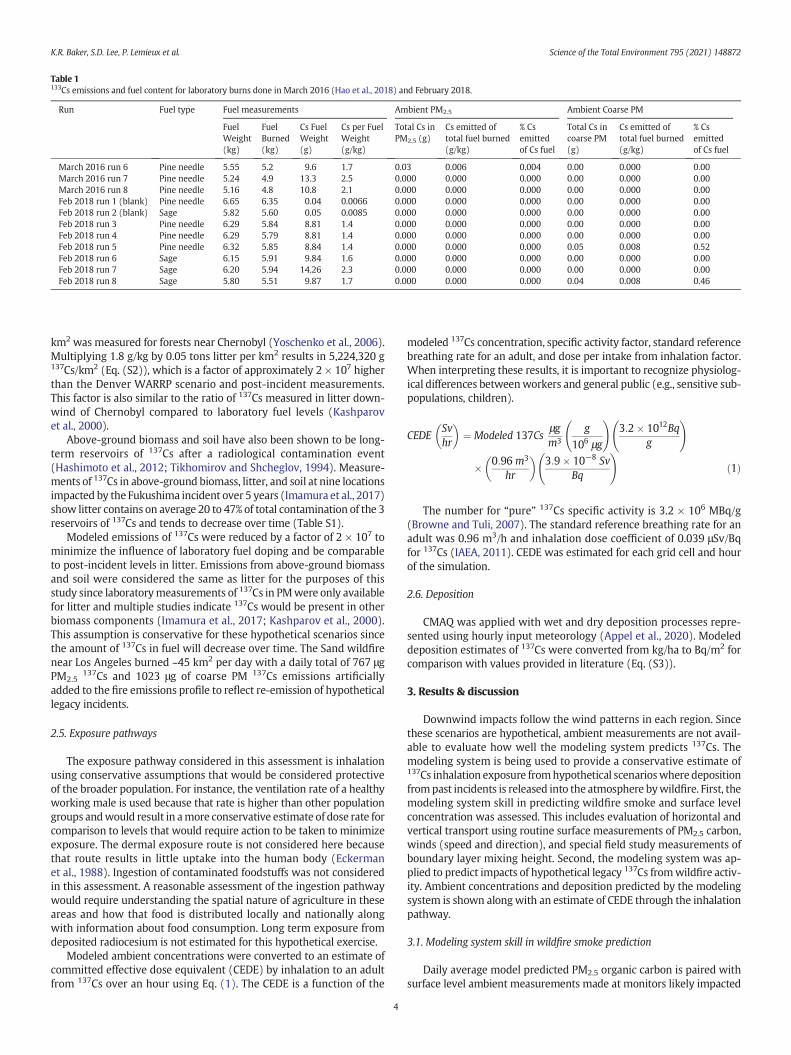
Table 1133Cs emissions and fuel content for laboratory burns done in March 2016 (Hao et al., 2018) and February 2018.
Run Fuel type Fuel measurements Ambient PM2.5 Ambient Coarse PM
FuelWeight(kg)
FuelBurned(kg)
Cs FuelWeight(g)
Cs per FuelWeight(g/kg)
Total Cs inPM2.5 (g)
Cs emitted oftotal fuel burned(g/kg)
% Csemittedof Cs fuel
Total Cs incoarse PM(g)
Cs emitted oftotal fuel burned(g/kg)
% Csemittedof Cs fuel
March 2016 run 6 Pine needle 5.55 5.2 9.6 1.7 0.03 0.006 0.004 0.00 0.000 0.00March 2016 run 7 Pine needle 5.24 4.9 13.3 2.5 0.000 0.000 0.000 0.00 0.000 0.00March 2016 run 8 Pine needle 5.16 4.8 10.8 2.1 0.000 0.000 0.000 0.00 0.000 0.00Feb 2018 run 1 (blank) Pine needle 6.65 6.35 0.04 0.0066 0.000 0.000 0.000 0.00 0.000 0.00Feb 2018 run 2 (blank) Sage 5.82 5.60 0.05 0.0085 0.000 0.000 0.000 0.00 0.000 0.00Feb 2018 run 3 Pine needle 6.29 5.84 8.81 1.4 0.000 0.000 0.000 0.00 0.000 0.00Feb 2018 run 4 Pine needle 6.29 5.79 8.81 1.4 0.000 0.000 0.000 0.00 0.000 0.00Feb 2018 run 5 Pine needle 6.32 5.85 8.84 1.4 0.000 0.000 0.000 0.05 0.008 0.52Feb 2018 run 6 Sage 6.15 5.91 9.84 1.6 0.000 0.000 0.000 0.00 0.000 0.00Feb 2018 run 7 Sage 6.20 5.94 14.26 2.3 0.000 0.000 0.000 0.00 0.000 0.00Feb 2018 run 8 Sage 5.80 5.51 9.87 1.7 0.000 0.000 0.000 0.04 0.008 0.46
K.R. Baker, S.D. Lee, P. Lemieux et al. Science of the Total Environment 795 (2021) 148872
km2 was measured for forests near Chernobyl (Yoschenko et al., 2006).Multiplying 1.8 g/kg by 0.05 tons litter per km2 results in 5,224,320 g137Cs/km2 (Eq. (S2)), which is a factor of approximately 2 × 10⁷ higherthan the Denver WARRP scenario and post-incident measurements.This factor is also similar to the ratio of 137Cs measured in litter down-wind of Chernobyl compared to laboratory fuel levels (Kashparovet al., 2000).
Above-ground biomass and soil have also been shown to be long-term reservoirs of 137Cs after a radiological contamination event(Hashimoto et al., 2012; Tikhomirov and Shcheglov, 1994). Measure-ments of 137Cs in above-ground biomass, litter, and soil at nine locationsimpacted by the Fukushima incident over 5 years (Imamura et al., 2017)show litter contains on average 20 to 47% of total contamination of the 3reservoirs of 137Cs and tends to decrease over time (Table S1).
Modeled emissions of 137Cs were reduced by a factor of 2 × 10⁷ tominimize the influence of laboratory fuel doping and be comparableto post-incident levels in litter. Emissions from above-ground biomassand soil were considered the same as litter for the purposes of thisstudy since laboratorymeasurements of 137Cs in PMwere only availablefor litter and multiple studies indicate 137Cs would be present in otherbiomass components (Imamura et al., 2017; Kashparov et al., 2000).This assumption is conservative for these hypothetical scenarios sincethe amount of 137Cs in fuel will decrease over time. The Sand wildfirenear Los Angeles burned ~45 km2 per day with a daily total of 767 μgPM2.5
137Cs and 1023 μg of coarse PM 137Cs emissions artificiallyadded to the fire emissions profile to reflect re-emission of hypotheticallegacy incidents.
2.5. Exposure pathways
The exposure pathway considered in this assessment is inhalationusing conservative assumptions that would be considered protectiveof the broader population. For instance, the ventilation rate of a healthyworking male is used because that rate is higher than other populationgroups andwould result in amore conservative estimate of dose rate forcomparison to levels that would require action to be taken to minimizeexposure. The dermal exposure route is not considered here becausethat route results in little uptake into the human body (Eckermanet al., 1988). Ingestion of contaminated foodstuffs was not consideredin this assessment. A reasonable assessment of the ingestion pathwaywould require understanding the spatial nature of agriculture in theseareas and how that food is distributed locally and nationally alongwith information about food consumption. Long term exposure fromdeposited radiocesium is not estimated for this hypothetical exercise.
Modeled ambient concentrations were converted to an estimate ofcommitted effective dose equivalent (CEDE) by inhalation to an adultfrom 137Cs over an hour using Eq. (1). The CEDE is a function of the
4
modeled 137Cs concentration, specific activity factor, standard referencebreathing rate for an adult, and dose per intake from inhalation factor.When interpreting these results, it is important to recognize physiolog-ical differences betweenworkers and general public (e.g., sensitive sub-populations, children).
CEDESvhr
� �¼ Modeled 137Cs
μgm3
g
106 μg
!3:2� 1012Bq
g
!
� 0:96 m3
hr
� �3:9� 10−8 Sv
Bq
!ð1Þ
The number for “pure” 137Cs specific activity is 3.2 × 10⁶ MBq/g(Browne and Tuli, 2007). The standard reference breathing rate for anadult was 0.96 m3/h and inhalation dose coefficient of 0.039 μSv/Bqfor 137Cs (IAEA, 2011). CEDE was estimated for each grid cell and hourof the simulation.
2.6. Deposition
CMAQ was applied with wet and dry deposition processes repre-sented using hourly input meteorology (Appel et al., 2020). Modeleddeposition estimates of 137Cs were converted from kg/ha to Bq/m2 forcomparison with values provided in literature (Eq. (S3)).
3. Results & discussion
Downwind impacts follow the wind patterns in each region. Sincethese scenarios are hypothetical, ambient measurements are not avail-able to evaluate how well the modeling system predicts 137Cs. Themodeling system is being used to provide a conservative estimate of137Cs inhalation exposure fromhypothetical scenarioswheredepositionfrompast incidents is released into the atmosphere bywildfire. First, themodeling system skill in predicting wildfire smoke and surface levelconcentration was assessed. This includes evaluation of horizontal andvertical transport using routine surface measurements of PM2.5 carbon,winds (speed and direction), and special field study measurements ofboundary layer mixing height. Second, the modeling system was ap-plied to predict impacts of hypothetical legacy 137Cs fromwildfire activ-ity. Ambient concentrations and deposition predicted by the modelingsystem is shown alongwith an estimate of CEDE through the inhalationpathway.
3.1. Modeling system skill in wildfire smoke prediction
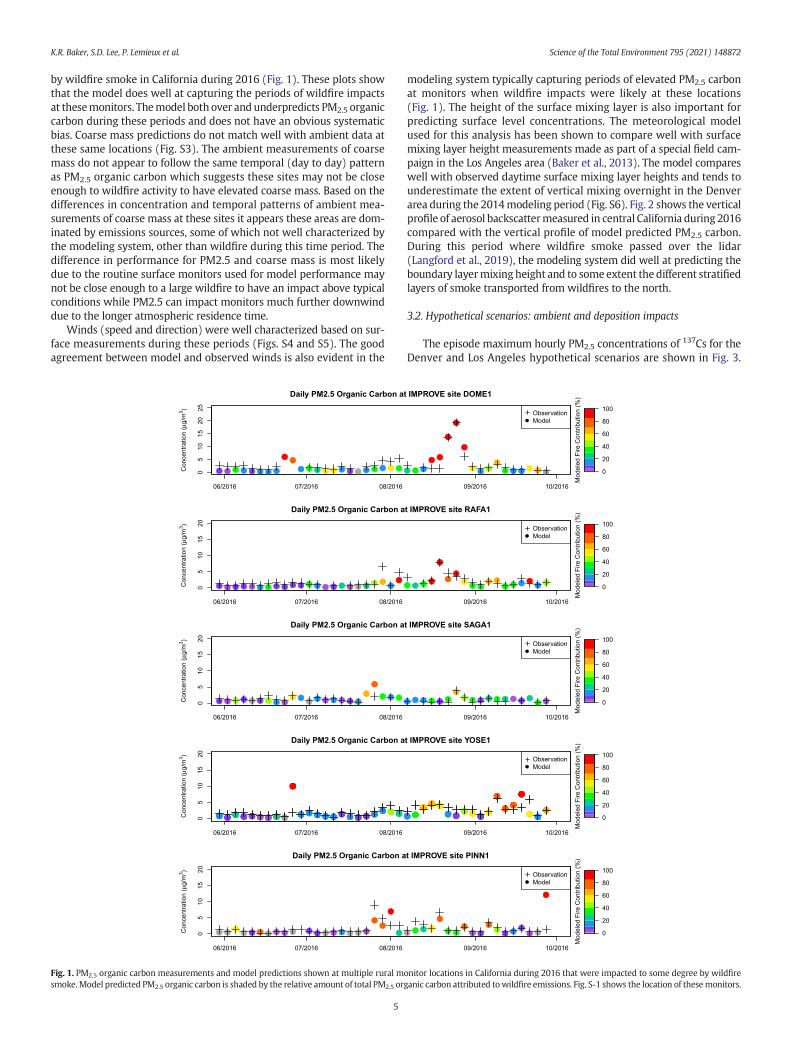
Daily average model predicted PM2.5 organic carbon is paired withsurface level ambient measurements made at monitors likely impacted
K.R. Baker, S.D. Lee, P. Lemieux et al. Science of the Total Environment 795 (2021) 148872
by wildfire smoke in California during 2016 (Fig. 1). These plots showthat the model does well at capturing the periods of wildfire impactsat thesemonitors. Themodel both over and underpredicts PM2.5 organiccarbon during these periods and does not have an obvious systematicbias. Coarse mass predictions do not match well with ambient data atthese same locations (Fig. S3). The ambient measurements of coarsemass do not appear to follow the same temporal (day to day) patternas PM2.5 organic carbon which suggests these sites may not be closeenough to wildfire activity to have elevated coarse mass. Based on thedifferences in concentration and temporal patterns of ambient mea-surements of coarse mass at these sites it appears these areas are dom-inated by emissions sources, some of which not well characterized bythe modeling system, other than wildfire during this time period. Thedifference in performance for PM2.5 and coarse mass is most likelydue to the routine surface monitors used for model performance maynot be close enough to a large wildfire to have an impact above typicalconditions while PM2.5 can impact monitors much further downwinddue to the longer atmospheric residence time.
Winds (speed and direction) were well characterized based on sur-face measurements during these periods (Figs. S4 and S5). The goodagreement between model and observed winds is also evident in the
Fig. 1. PM2.5 organic carbon measurements and model predictions shown at multiple rural msmoke.Model predicted PM2.5 organic carbon is shaded by the relative amount of total PM2.5 or
5
modeling system typically capturing periods of elevated PM2.5 carbonat monitors when wildfire impacts were likely at these locations(Fig. 1). The height of the surface mixing layer is also important forpredicting surface level concentrations. The meteorological modelused for this analysis has been shown to compare well with surfacemixing layer height measurements made as part of a special field cam-paign in the Los Angeles area (Baker et al., 2013). The model compareswell with observed daytime surface mixing layer heights and tends tounderestimate the extent of vertical mixing overnight in the Denverarea during the 2014modeling period (Fig. S6). Fig. 2 shows the verticalprofile of aerosol backscattermeasured in central California during 2016compared with the vertical profile of model predicted PM2.5 carbon.During this period where wildfire smoke passed over the lidar(Langford et al., 2019), the modeling system did well at predicting theboundary layermixing height and to some extent the different stratifiedlayers of smoke transported from wildfires to the north.
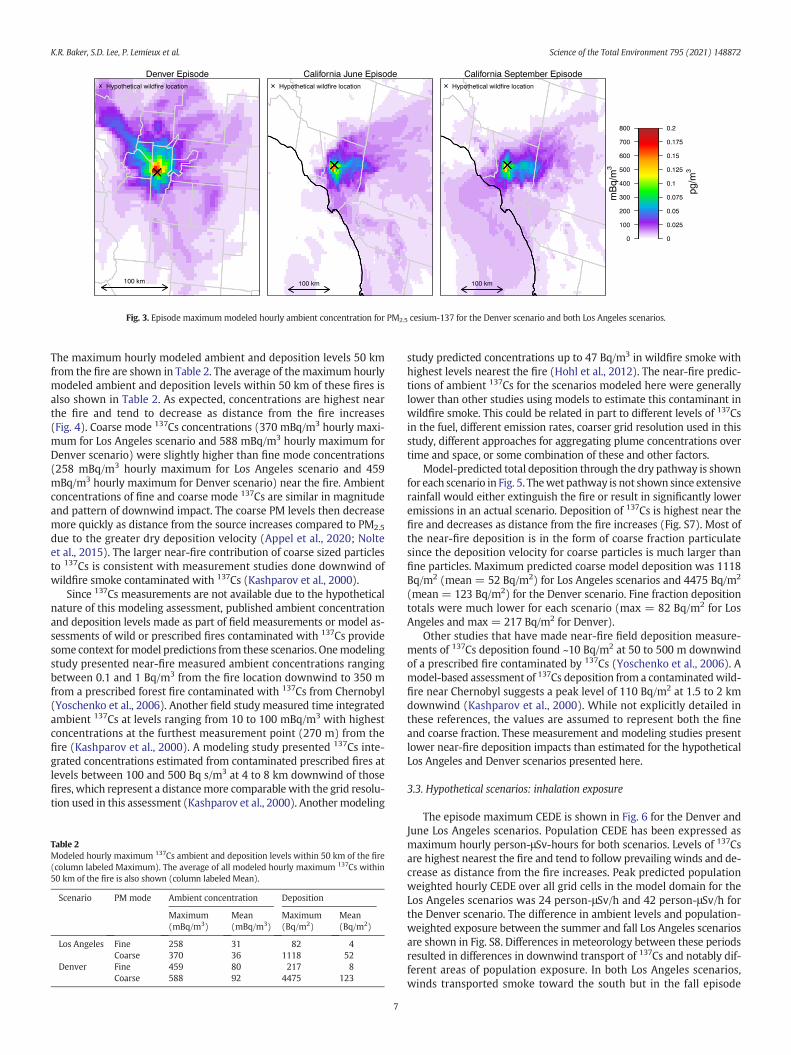
3.2. Hypothetical scenarios: ambient and deposition impacts
The episode maximum hourly PM2.5 concentrations of 137Cs for theDenver and Los Angeles hypothetical scenarios are shown in Fig. 3.
onitor locations in California during 2016 that were impacted to some degree by wildfireganic carbon attributed towildfire emissions. Fig. S-1 shows the location of thesemonitors.
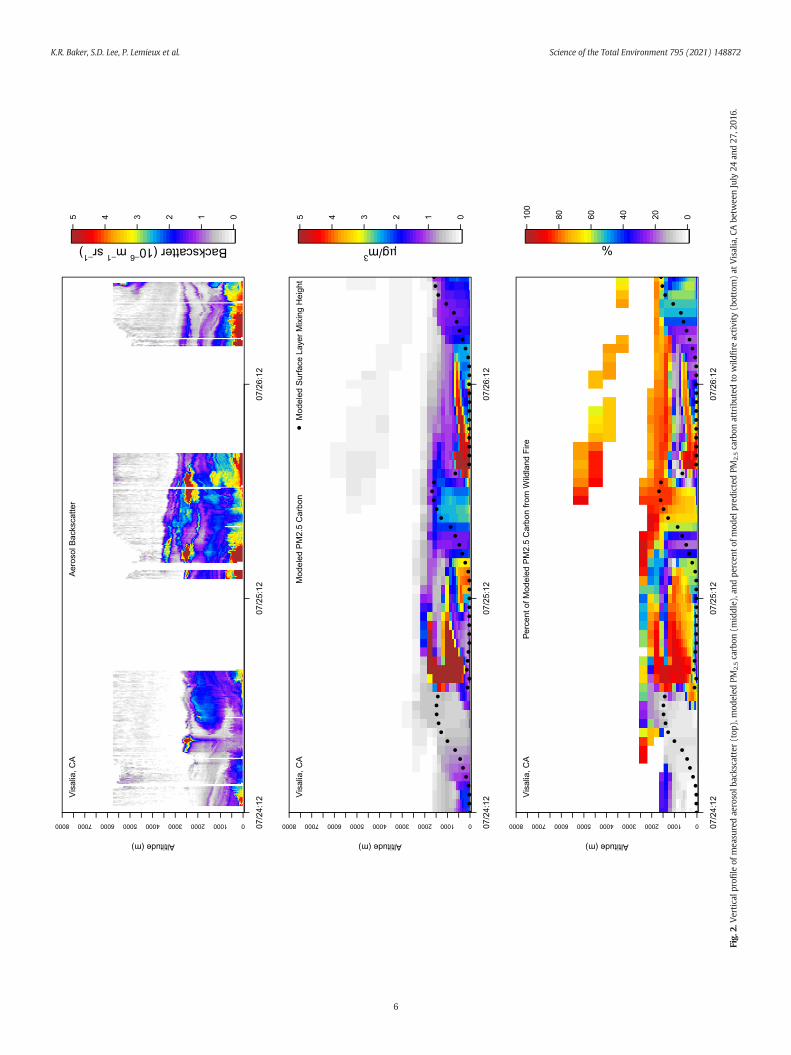
Fig.
2.Verticalp
rofileof
mea
suredaerosolb
ackscatter
(top
),mod
eled
PMcarbon
(middle),and
percen
tofm
odel
pred
ictedPM
carbon
attributed
towild
fireactivity
(bottom)at
Visalia,C
Abe
twee
nJuly
24an
d27
,201
6.
K.R. Baker, S.D. Lee, P. Lemieux et al. Science of the Total Environment 795 (2021) 148872
6
2.5
2.5
Hypothetical wildfire location
Denver Episode
100 km
Hypothetical wildfire location
California June Episode
100 km
Hypothetical wildfire location
California September Episode
100 km
mB
q/m
3
p
g/m
3
0
100
200
300
400
500
600
700
800
0
0.025
0.05
0.075
0.1
0.125
0.15
0.175
0.2
Fig. 3. Episode maximummodeled hourly ambient concentration for PM2.5 cesium-137 for the Denver scenario and both Los Angeles scenarios.
K.R. Baker, S.D. Lee, P. Lemieux et al. Science of the Total Environment 795 (2021) 148872
The maximum hourly modeled ambient and deposition levels 50 kmfrom the fire are shown in Table 2. The average of themaximum hourlymodeled ambient and deposition levels within 50 km of these fires isalso shown in Table 2. As expected, concentrations are highest nearthe fire and tend to decrease as distance from the fire increases(Fig. 4). Coarse mode 137Cs concentrations (370 mBq/m3 hourly maxi-mum for Los Angeles scenario and 588 mBq/m3 hourly maximum forDenver scenario) were slightly higher than fine mode concentrations(258 mBq/m3 hourly maximum for Los Angeles scenario and 459mBq/m3 hourly maximum for Denver scenario) near the fire. Ambientconcentrations of fine and coarse mode 137Cs are similar in magnitudeand pattern of downwind impact. The coarse PM levels then decreasemore quickly as distance from the source increases compared to PM2.5
due to the greater dry deposition velocity (Appel et al., 2020; Nolteet al., 2015). The larger near-fire contribution of coarse sized particlesto 137Cs is consistent with measurement studies done downwind ofwildfire smoke contaminated with 137Cs (Kashparov et al., 2000).
Since 137Cs measurements are not available due to the hypotheticalnature of this modeling assessment, published ambient concentrationand deposition levels made as part of field measurements or model as-sessments of wild or prescribed fires contaminated with 137Cs providesome context formodel predictions from these scenarios. Onemodelingstudy presented near-fire measured ambient concentrations rangingbetween 0.1 and 1 Bq/m3 from the fire location downwind to 350 mfrom a prescribed forest fire contaminated with 137Cs from Chernobyl(Yoschenko et al., 2006). Another field study measured time integratedambient 137Cs at levels ranging from 10 to 100 mBq/m3 with highestconcentrations at the furthest measurement point (270 m) from thefire (Kashparov et al., 2000). A modeling study presented 137Cs inte-grated concentrations estimated from contaminated prescribed fires atlevels between 100 and 500 Bq s/m3 at 4 to 8 km downwind of thosefires, which represent a distancemore comparable with the grid resolu-tion used in this assessment (Kashparov et al., 2000). Anothermodeling
Table 2Modeled hourly maximum 137Cs ambient and deposition levels within 50 km of the fire(column labeled Maximum). The average of all modeled hourly maximum 137Cs within50 km of the fire is also shown (column labeled Mean).
Scenario PM mode Ambient concentration Deposition
Maximum(mBq/m3)
Mean(mBq/m3)
Maximum(Bq/m2)
Mean(Bq/m2)
Los Angeles Fine 258 31 82 4Coarse 370 36 1118 52
Denver Fine 459 80 217 8Coarse 588 92 4475 123
7
study predicted concentrations up to 47 Bq/m3 in wildfire smoke withhighest levels nearest the fire (Hohl et al., 2012). The near-fire predic-tions of ambient 137Cs for the scenarios modeled here were generallylower than other studies using models to estimate this contaminant inwildfire smoke. This could be related in part to different levels of 137Csin the fuel, different emission rates, coarser grid resolution used in thisstudy, different approaches for aggregating plume concentrations overtime and space, or some combination of these and other factors.
Model-predicted total deposition through the dry pathway is shownfor each scenario in Fig. 5. Thewet pathway is not shown since extensiverainfall would either extinguish the fire or result in significantly loweremissions in an actual scenario. Deposition of 137Cs is highest near thefire and decreases as distance from the fire increases (Fig. S7). Most ofthe near-fire deposition is in the form of coarse fraction particulatesince the deposition velocity for coarse particles is much larger thanfine particles. Maximum predicted coarse model deposition was 1118Bq/m2 (mean = 52 Bq/m2) for Los Angeles scenarios and 4475 Bq/m2
(mean = 123 Bq/m2) for the Denver scenario. Fine fraction depositiontotals were much lower for each scenario (max = 82 Bq/m2 for LosAngeles and max = 217 Bq/m2 for Denver).
Other studies that have made near-fire field deposition measure-ments of 137Cs deposition found ~10 Bq/m2 at 50 to 500 m downwindof a prescribed fire contaminated by 137Cs (Yoschenko et al., 2006). Amodel-based assessment of 137Cs deposition from a contaminatedwild-fire near Chernobyl suggests a peak level of 110 Bq/m2 at 1.5 to 2 kmdownwind (Kashparov et al., 2000). While not explicitly detailed inthese references, the values are assumed to represent both the fineand coarse fraction. These measurement and modeling studies presentlower near-fire deposition impacts than estimated for the hypotheticalLos Angeles and Denver scenarios presented here.
3.3. Hypothetical scenarios: inhalation exposure
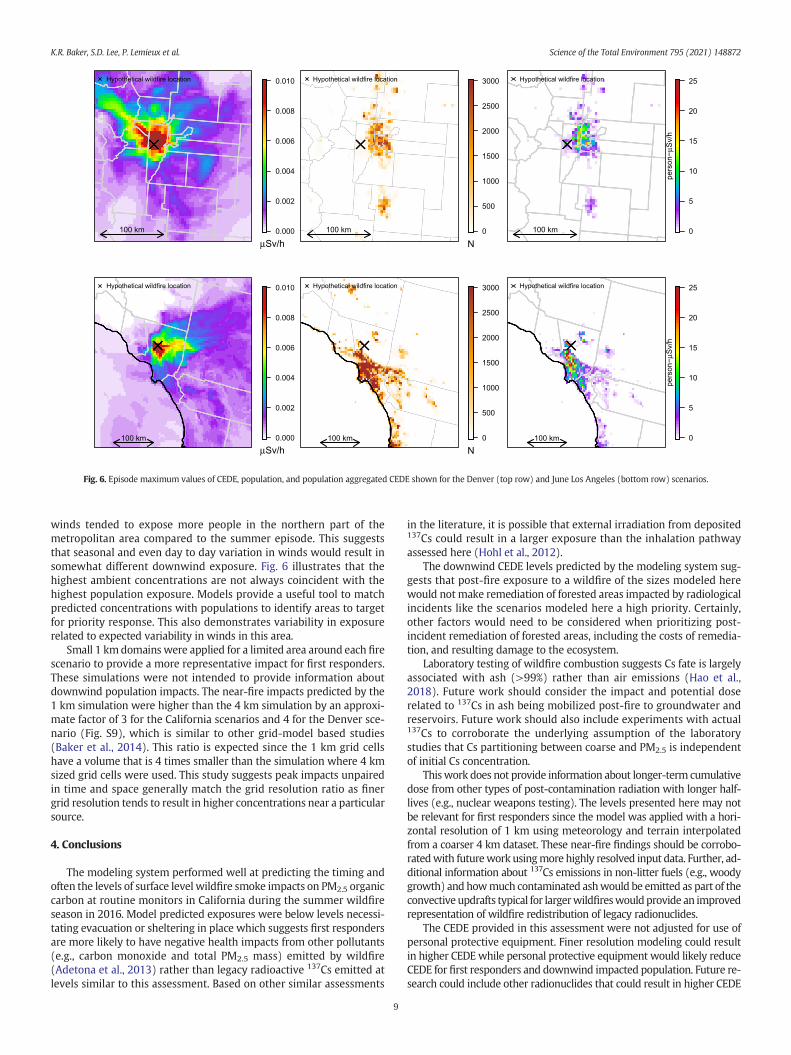
The episode maximum CEDE is shown in Fig. 6 for the Denver andJune Los Angeles scenarios. Population CEDE has been expressed asmaximum hourly person-μSv-hours for both scenarios. Levels of 137Csare highest nearest the fire and tend to follow prevailing winds and de-crease as distance from the fire increases. Peak predicted populationweighted hourly CEDE over all grid cells in the model domain for theLos Angeles scenarios was 24 person-μSv/h and 42 person-μSv/h forthe Denver scenario. The difference in ambient levels and population-weighted exposure between the summer and fall Los Angeles scenariosare shown in Fig. S8. Differences in meteorology between these periodsresulted in differences in downwind transport of 137Cs and notably dif-ferent areas of population exposure. In both Los Angeles scenarios,winds transported smoke toward the south but in the fall episode
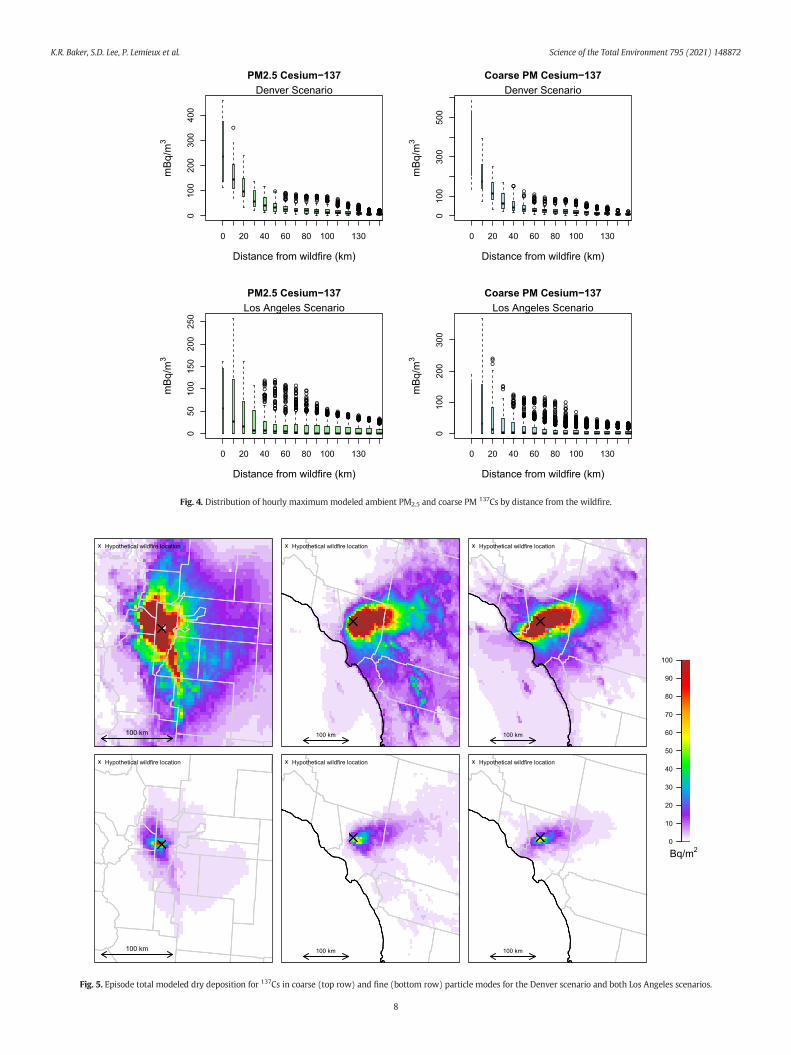
Fig. 4. Distribution of hourly maximummodeled ambient PM2.5 and coarse PM 137Cs by distance from the wildfire.
Fig. 5. Episode total modeled dry deposition for 137Cs in coarse (top row) and fine (bottom row) particle modes for the Denver scenario and both Los Angeles scenarios.
K.R. Baker, S.D. Lee, P. Lemieux et al. Science of the Total Environment 795 (2021) 148872
8
0.000
0.002
0.004
0.006
0.008
0.010
µSv/h
Hypothetical wildfire location
100 km 0
500
1000
1500
2000
2500
3000
N
Hypothetical wildfire location
100 km 0
5
10
15
20
25
pers
on−µ
Sv/h
Hypothetical wildfire location
100 km
0.000
0.002
0.004
0.006
0.008
0.010
µSv/h
Hypothetical wildfire location
100 km 0
500
1000
1500
2000
2500
3000
N
Hypothetical wildfire location
100 km 0
5
10
15
20
25
pers
on−µ
Sv/h
Hypothetical wildfire location
100 km
Fig. 6. Episode maximum values of CEDE, population, and population aggregated CEDE shown for the Denver (top row) and June Los Angeles (bottom row) scenarios.
K.R. Baker, S.D. Lee, P. Lemieux et al. Science of the Total Environment 795 (2021) 148872
winds tended to expose more people in the northern part of themetropolitan area compared to the summer episode. This suggeststhat seasonal and even day to day variation in winds would result insomewhat different downwind exposure. Fig. 6 illustrates that thehighest ambient concentrations are not always coincident with thehighest population exposure. Models provide a useful tool to matchpredicted concentrations with populations to identify areas to targetfor priority response. This also demonstrates variability in exposurerelated to expected variability in winds in this area.
Small 1 kmdomains were applied for a limited area around each firescenario to provide a more representative impact for first responders.These simulations were not intended to provide information aboutdownwind population impacts. The near-fire impacts predicted by the1 km simulation were higher than the 4 km simulation by an approxi-mate factor of 3 for the California scenarios and 4 for the Denver sce-nario (Fig. S9), which is similar to other grid-model based studies(Baker et al., 2014). This ratio is expected since the 1 km grid cellshave a volume that is 4 times smaller than the simulation where 4 kmsized grid cells were used. This study suggests peak impacts unpairedin time and space generally match the grid resolution ratio as finergrid resolution tends to result in higher concentrations near a particularsource.
4. Conclusions
The modeling system performed well at predicting the timing andoften the levels of surface level wildfire smoke impacts on PM2.5 organiccarbon at routine monitors in California during the summer wildfireseason in 2016. Model predicted exposures were below levels necessi-tating evacuation or sheltering in place which suggests first respondersare more likely to have negative health impacts from other pollutants(e.g., carbon monoxide and total PM2.5 mass) emitted by wildfire(Adetona et al., 2013) rather than legacy radioactive 137Cs emitted atlevels similar to this assessment. Based on other similar assessments
9
in the literature, it is possible that external irradiation from deposited137Cs could result in a larger exposure than the inhalation pathwayassessed here (Hohl et al., 2012).
The downwind CEDE levels predicted by the modeling system sug-gests that post-fire exposure to a wildfire of the sizes modeled herewould not make remediation of forested areas impacted by radiologicalincidents like the scenarios modeled here a high priority. Certainly,other factors would need to be considered when prioritizing post-incident remediation of forested areas, including the costs of remedia-tion, and resulting damage to the ecosystem.
Laboratory testing of wildfire combustion suggests Cs fate is largelyassociated with ash (>99%) rather than air emissions (Hao et al.,2018). Future work should consider the impact and potential doserelated to 137Cs in ash being mobilized post-fire to groundwater andreservoirs. Future work should also include experiments with actual137Cs to corroborate the underlying assumption of the laboratorystudies that Cs partitioning between coarse and PM2.5 is independentof initial Cs concentration.
Thiswork does not provide information about longer-term cumulativedose from other types of post-contamination radiation with longer half-lives (e.g., nuclear weapons testing). The levels presented here may notbe relevant for first responders since the model was applied with a hori-zontal resolution of 1 km using meteorology and terrain interpolatedfrom a coarser 4 km dataset. These near-fire findings should be corrobo-ratedwith futurework usingmore highly resolved input data. Further, ad-ditional information about 137Cs emissions in non-litter fuels (e.g., woodygrowth) and howmuch contaminated ashwould be emitted as part of theconvective updrafts typical for largerwildfireswouldprovide an improvedrepresentation of wildfire redistribution of legacy radionuclides.
The CEDE provided in this assessment were not adjusted for use ofpersonal protective equipment. Finer resolution modeling could resultin higher CEDE while personal protective equipment would likely reduceCEDE for first responders and downwind impacted population. Future re-search could include other radionuclides that could result in higher CEDE
K.R. Baker, S.D. Lee, P. Lemieux et al. Science of the Total Environment 795 (2021) 148872
with lower concentrations (e.g., alpha emitters)wouldbe auseful compli-ment to this assessment. Further, futurework could include additional ex-posure pathways such as ingestion of contaminated food or externalradiation from the ground through newly deposited radionuclides.
Disclaimer
The views expressed in this article are those of the authors and do notnecessarily represent the views or policies of the U.S. EnvironmentalProtection Agency. The U.S. Environmental Protection Agency throughits Office of Research and Development and Office of Air and Radiationfunded, managed, and collaborated in the research described hereunder contract EP-D-11-006, Work Assignment 5–14 with EasternResearch Group, GSA Task Order No. ID04160145 “EPA Air QualityModeling and Simulation Analysis”, and Interagency Agreement DW-12-92,437,601-0 with the U.S. Forest Service. It has been subjected tothe Agency's review and has been approved for publication. Note thatapproval does not signify that the contents necessarily reflect the viewsof the Agency. Mention of trade names, products, or services does notconvey official EPA approval, endorsement, or recommendation.
CRediT authorship contribution statement
Kirk R. Baker: Conceptualization, Methodology, Writing – originaldraft, Data curation, Investigation, Writing – review & editing.Sang Don Lee: Conceptualization, Methodology, Data curation, Investi-gation, Writing – review & editing. Paul Lemieux: Conceptualization,Methodology, Data curation, Investigation, Writing – review & editing.Scott Hudson:Methodology, Investigation, Writing – review & editing.Benjamin N. Murphy: Software, Writing – review & editing. Jesse O.Bash: Software, Data curation. Shannon N. Koplitz: Formal analysis,Investigation. Thien Khoi V. Nguyen: Formal analysis,Writing – review& editing. Wei Min Hao: Data curation. Stephen Baker: Data curation.Emily Lincoln: Data curation.
Declaration of competing interest
The authors declare that they have no known competing financialinterests or personal relationships that could have appeared to influ-ence the work reported in this paper.
Acknowledgements
The authors would like to recognize the contributions of JamesBeidler, Barron Henderson, Chris Allen, Lara Reynolds, AndrewLangford, Christoph Senff, Raul Alvarez, David Stuenkel, and SaraDeCair.
Supplementary data
Supplementary data to this article can be found online at https://doi.org/10.1016/j.scitotenv.2021.148872.
References
Abatzoglou, J.T., Williams, A.P., 2016. Impact of anthropogenic climate change on wildfireacross western US forests. Proc. Natl. Acad. Sci. 113, 11770–11775.
Adetona, O., Simpson, C.D., Onstad, G., Naeher, L.P., 2013. Exposure of wildland firefightersto carbon monoxide, fine particles, and levoglucosan. Ann. Occup. Hyg. 57, 979–991.
Appel, K., Pouliot, G., Simon, H., Sarwar, G., Pye, H., Napelenok, S., Akhtar, F., Roselle, S.,2013. Evaluation of dust and trace metal estimates from the Community MultiscaleAir Quality (CMAQ) model version 5.0. Geosci. Model Dev. 6, 883–899.
Appel, K.W., Bash, J.O., Fahey, K.M., Foley, K.M., Gilliam, R.C., Hogrefe, C., Hutzell, W.T.,Kang, D., Mathur, R., Murphy, B.N., 2020. The Community Multiscale Air Quality(CMAQ) model versions 5.3 and 5.3. 1: system updates and evaluation. Geosci.Model Dev. Discuss. 1–41.
Baker, K.R., Misenis, C., Obland, M.D., Ferrare, R.A., Scarino, A.J., Kelly, J.T., 2013. Evaluationof surface and upper air fine scaleWRFmeteorological modeling of theMay and June2010 CalNex period in California. Atmos. Environ. 80, 299–309.
10
Baker, K.R., Hawkins, A., Kelly, J.T., 2014. Photochemical grid model performance withvarying horizontal grid resolution and sub-grid plume treatment for the MartinsCreek near-field SO 2 study. Atmos. Environ. 99, 148–158.
Baker, K., Carlton, A., Kleindienst, T., Offenberg, J., Beaver, M., Gentner, D., Goldstein, A.,Hayes, P., Jimenez, J., Gilman, J., 2015. Gas and aerosol carbon in California: compar-ison of measurements and model predictions in Pasadena and Bakersfield. Atmos.Chem. Phys. 15, 5243–5258.
Baker, K., Woody, M., Tonnesen, G., Hutzell, W., Pye, H., Beaver, M., Pouliot, G., Pierce, T.,2016. Contribution of regional-scale fire events to ozone and PM 2.5 air quality esti-mated by photochemical modeling approaches. Atmos. Environ. 140, 539–554.
Baker, K., Woody, M., Valin, L., Szykman, J., Yates, E., Iraci, L., Choi, H., Soja, A., Koplitz, S.,Zhou, L., 2018. Photochemical model evaluation of 2013 Californiawild fire air qualityimpacts using surface, aircraft, and satellite data. Sci. Total Environ. 637, 1137–1149.
Bash, J.O., Baker, K.R., Beaver, M.R., 2016. Evaluation of improved land use and canopyrepresentation in BEIS v3. 61 with biogenic VOC measurements in California. Geosci.Model Dev. 9, 2191.
Bourcier, L., Sellegri, K., Masson, O., Zangrando, R., Barbante, C., Gambaro, A., Pichon, J.-M.,Boulon, J., Laj, P., 2010. Experimental evidence of biomass burning as a source of at-mospheric 137Cs, puy de Dôme (1465m asl), France. Atmos. Environ. 44, 2280–2286.
Browne, E., Tuli, J., 2007. Nuclear data sheets for A = 137. Nucl. Data Sheets 108,2173–2318.
Commodore, A.A., Jannik, G.T., Eddy, T.P., Rathbun, S.L., Hejl, A.M., Pearce, J.L., Irvin-Barnwell, E.A., Naeher, L.P., 2012. Radioactivity in smoke particulates from prescribedburns at the Savannah River Site and at selected southeastern United States forests.Atmos. Environ. 54, 643–656.
Connell, R., 2012. Wide Area Recovery and Resiliency Program (WARRP) Interim Clear-ance Strategy for Environments Contaminated with Cesium-137. Environmental Pro-tection Agency Washington DC.
Dennison, P.E., Brewer, S.C., Arnold, J.D., Moritz, M.A., 2014. Large wildfire trends in thewestern United States, 1984–2011. Geophys. Res. Lett. 41, 2928–2933.
Eckerman, K.F., Wolbarst, A.B., Richardson, A.C., 1988. Limiting Values of Radionuclide In-take and Air Concentration and Dose Conversion Factors for Inhalation, Submersion,and Ingestion: Federal Guidance Report No. 11. Environmental Protection Agency,Washington, DC (USA). Office of Radiation.
Faloona, I.C., Chiao, S., Eiserloh, A.J., Alvarez, R.J., Kirgis, G., Langford, A.O., Senff, C.J., Caputi,D., Hu, A., Iraci, L.T., 2020. The California Baseline Ozone Transport Study (CABOTS).Bull. Am. Meteorol. Soc. 101, E427–E445.
Flocke, F., Pfister, G., Crawford, J.H., Pickering, K.E., Pierce, G., Bon, D., Reddy, P., 2020. Airquality in the northern Colorado front range metro area: the front range air pollutionand photochemistry Éxperiment (FRAPPÉ). J. Geophys. Res.-Atmos. 125(e2019JD031197).
Garten Jr., C.T., Hamby, D., Schreckhise, R., 2000. Radiocesium discharges and subsequentenvironmental transport at the major US weapons production facilities. Sci. Total En-viron. 255, 55–73.
Goldammer, J.G., Statheropoulos, M., Andreae, M.O., 2008. Impacts of vegetation fireemissions on the environment, human health, and security: a global perspective.Dev. Environ. Sci. 8, 3–36.
Hao, W.M., Baker, S., Lincoln, E., Hudson, S., Lee, S.D., Lemieux, P., 2018. Cesium emissionsfrom laboratory fires. J. Air Waste Manage. Assoc. 68, 1211–1223.
Harper, M., Butler, C., Berry, D., Wroble, J., 2015. Where occupation and environmentoverlap: US forest service worker exposure to libby amphibole fibers. J. Occup. Envi-ron. Hyg. 12, D47–D53.
Hashimoto, S., Ugawa, S., Nanko, K., Shichi, K., 2012. The total amounts of radioactivelycontaminated materials in forests in Fukushima, Japan. Sci. Rep. 2, 416.
Hohl, A., Niccolai, A., Oliver, C., Melnychuk, D., Zibtsev, S., Goldammer, J.G., Gulidov, V.,2012. The human health effects of radioactive smoke from a catastrophic wildfirein the Chernobyl Exclusion Zone: a worst case scenario. International Scientific Elec-tronic Journal Earth Bioresources and Life Quality Founded by National University ofLife and Environmental Sciences of Ukraine (NUBiP of Ukraine) and Global Consor-tium of Higher Education and Research for Agriculture (GCHERA), p. 1.
IAEA, 2011. Radiation protection and safety of radiation sources: international basic safetystandards: general safety requirements. Vienna: International Atomic Energy Agency,General Safety Requirements Part 3, 2011, Interim edition https://www-pub.iaea.org/MTCD/Publications/PDF/p1531interim_web.pdf.
Imamura, N., Komatsu, M., Ohashi, S., Hashimoto, S., Kajimoto, T., Kaneko, S., Takano, T.,2017. Temporal changes in the radiocesium distribution in forests over the fiveyears after the Fukushima Daiichi Nuclear Power Plant accident. Sci. Rep. 7, 8179.
Jouve, A., Schulte, E., Bon, P., Cardot, A., 1993. Mechanical and physical removing of soiland plants as agricultural mitigation techniques. Sci. Total Environ. 137, 65–79.
Kashparov, V., Lundin, S., Kadygrib, A., Protsak, V., Levtchuk, S., Yoschenko, V., Kashpur, V.,Talerko, N., 2000. Forest fires in the territory contaminated as a result of the Cherno-byl accident: radioactive aerosol resuspension and exposure of fire-fighters.J. Environ. Radioact. 51, 281–298.
Kelly, J.T., Baker, K.R., Nolte, C.G., Napelenok, S.L., Keene, W.C., Pszenny, A.A., 2016. Simu-lating the phase partitioning of NH 3, HNO 3, and HCl with size-resolved particlesover northern Colorado in winter. Atmos. Environ. 131, 67–77.
Knepp, T.N., Szykman, J.J., Long, R., Duvall, R.M., Krug, J., Beaver, M., Cavender, K.,Kronmiller, K., Wheeler, M., Delgado, R., 2017. Assessment of mixed-layer height es-timation from single-wavelength ceilometer profiles. Atmos. Meas. Tech. 10, 3963.
Kristensen, L.J., Taylor, M.P., Odigie, K.O., Hibdon, S.A., Flegal, A.R., 2014. Lead isotopiccompositions of ash sourced from Australian bushfires. Environ. Pollut. 190, 159–165.
Langford, A.O., Alvarez, I.I.R.J., Kirgis, G., Senff, C.J., Caputi, D., Conley, S.A., Faloona, I.C.,Iraci, L.T., Marrero, J.E., McNamara, M.E., 2019. Intercomparison of lidar, aircraft, andsurface ozone measurements in the San Joaquin Valley during the California BaselineOzone Transport Study (CABOTS). Atmos. Meas. Tech. 12, 1889–1904.
K.R. Baker, S.D. Lee, P. Lemieux et al. Science of the Total Environment 795 (2021) 148872
Larkin, N., Raffuse, S., Huang, S., Pavlovic, N., Rao, V., 2020. The comprehensive fire infor-mation reconciled emissions (CFIRE) inventory: wildland fire emissions developedfor the 2011 and 2014 US National Emissions Inventory. J. Air Waste Manage.Assoc. 70 (11), 1165–1185.
Li, R., Wiedinmyer, C., Baker, K., Hannigan, M., 2013. Characterization of coarse particulatematter in the western United States: a comparison between observation and model-ing. Atmos. Chem. Phys. 13, 1311.
Linkov, I., Morel, B., Schell, W.R., 1997. Remedial policies in radiologically-contaminatedforests: environmental consequences and risk assessment. Risk Anal. 17, 67–75.
Nolte, C., Appel, K., Kelly, J., Bhave, P., Fahey, K., Collett Jr., J., Zhang, L., Young, J., 2015. Eval-uation of the Community Multiscale Air Quality (CMAQ) model v5. 0 against size-resolved measurements of inorganic particle composition across sites in NorthAmerica. Geosci. Model Dev. 8, 2877–2892.
Paatero, J., Vesterbacka, K., Makkonen, U., Kyllönen, K., Hellen, H., Hatakka, J., Anttila, P.,2009. Resuspension of radionuclides into the atmosphere due to forest fires.J. Radioanal. Nucl. Chem. 282, 473–476.
Reid, C.E., Brauer, M., Johnston, F.H., Jerrett, M., Balmes, J.R., Elliott, C.T., 2016. Critical re-view of health impacts of wildfire smoke exposure. Environ. Health Perspect. 124,1334–1343.
Saffarzadeh, A., Shimaoka, T., Kakuta, Y., Kawano, T., 2014. Cesium distribution and phasesin proxy experiments on the incineration of radioactively contaminated waste fromthe Fukushima area. J. Environ. Radioact. 136, 76–84.
Schoennagel, T., Balch, J.K., Brenkert-Smith, H., Dennison, P.E., Harvey, B.J., Krawchuk,M.A., Mietkiewicz, N., Morgan, P., Moritz, M.A., Rasker, R., 2017. Adapt to more wild-fire in western North American forests as climate changes. Proc. Natl. Acad. Sci. 114,4582–4590.
Senff, C., Langford, A., Alvarez, R., Bonin, T., Brewer, A., Choukulkar, A., Kirgis, G.,Marchbanks, R., Sandberg, S., Weickmann, A., 2020. Entrainment and Mixing ofTransported Ozone Layers: Implications for Surface Air Quality in the Western US,EPJ Web of Conferences. EDP Sciences.
Skamarock, W.C., Klemp, J.B., Dudhia, J., Gill, D.O., Barker, D.M., Wang, W., Powers, J.G.,2005. A description of the advanced research WRF version 2. National Center For At-mospheric Research Boulder Co Mesoscale and Microscale.
11
Strode, S.A., Ott, L.E., Pawson, S., Bowyer, T.W., 2012. Emission and transport of cesium-137 from boreal biomass burning in the summer of 2010. J. Geophys. Res.-Atmos.117.
Takada, M., Yamada, T., Takahara, T., Okuda, T., 2016. Spatial variation in the 137Cs inven-tory in soils in a mixed deciduous forest in Fukushima, Japan. J. Environ. Radioact.161, 35–41.
Tikhomirov, F., Shcheglov, A., 1994. Main investigation results on the forest radioecologyin the Kyshtym and Chernobyl accident zones. Sci. Total Environ. 157, 45–57.
U.S. Environmental Protection Agency, 2018. 2014 National Emissions Inventory, version2 technical support document. https://www.epa.gov/sites/production/files/2018-07/documents/nei2014v2_tsd_05jul2018.pdf.
U.S. Forest Service, 2019. The fuel characteristic classification system. https://www.fs.fed.us/pnw/fera/fft/fccsmodule.shtml.
Viner, B.J., Jannik, T., Stone, D., Hepworth, A., Naeher, L., Adetona, O., Blake, J., Eddy, T.,2015. Modelling and mitigating dose to firefighters from inhalation of radionuclidesin wildland fire smoke. Int. J. Wildland Fire 24, 723–733.
Wiedinmyer, C., Friedli, H., 2007. Mercury emission estimates from fires: an initial inven-tory for the United States. Environ. Sci. Technol. 41, 8092–8098.
Wotawa, G., De Geer, L.E., Becker, A., D’Amours, R., Jean, M., Servranckx, R., Ungar, K.,2006. Inter-and intra-continental transport of radioactive cesium released by borealforest fires. Geophys. Res. Lett. 33.
Yoschenko, V., Kashparov, V., Levchuk, S., Glukhovskiy, A., Khomutinin, Y.V., Protsak, V.,Lundin, S., Tschiersch, J., 2006. Resuspension and redistribution of radionuclides dur-ing grassland and forest fires in the Chernobyl exclusion zone: part II. Modeling thetransport process. J. Environ. Radioact. 87, 260–278.
Zhou, L., Baker, K.R., Napelenok, S.L., Pouliot, G., Elleman, R., O’Neill, S.M., Urbanski, S.P.,Wong, D.C., 2018. Modeling crop residue burning experiments to evaluate smokeemissions and plume transport. Sci. Total Environ. 627, 523–533.
Zhu, Y.G., Smolders, E., 2000. Plant uptake of radiocaesium: a review of mechanisms, reg-ulation and application. J. Exp. Bot. 51, 1635–1645.