Embed Size (px)
Citation preview
Science of the Total Environment 553 (2016) 120–127
Contents lists available at ScienceDirect
Science of the Total Environment
j ourna l homepage: www.e lsev ie r .com/ locate /sc i totenv
The environmental cost of subsistence: Optimizing diets tominimize footprints
Jessica A. Gephart a,⁎, Kyle F. Davis a, Kyle A. Emery a,b, Allison M. Leach c, James N. Galloway a, Michael L. Pace a
a University of Virginia, Department of Environmental Sciences, 291 McCormick Road, Charlottesville, VA 22904, USAb University of California, Santa Barbara. Marine Science Institute, Santa Barbara, CA 93106, USAc University of New Hampshire, 107 Nesmith Hall, 131 Main Street, Durham, NH, 03824, USA
H I G H L I G H T S G R A P H I C A L A B S T R A C T
• Identifies low footprint (FP) subsistencediets and quantifies FP tradeoffs.
• Synergies amongFPs suggestedby similardiets at each FP minimum
• Plants and seafood supply macronutri-ents and micronutrients most efficiently
⁎ Corresponding author.
http://dx.doi.org/10.1016/j.scitotenv.2016.02.0500048-9697/© 2016 Elsevier B.V. All rights reserved.
a b s t r a c t
a r t i c l e i n f oArticle history:Received 7 October 2015Received in revised form 1 February 2016Accepted 7 February 2016Available online xxxx
Editor: Simon Pollard
The question of how to minimize monetary cost while meeting basic nutrient requirements (a subsistence diet)was posed by George Stigler in 1945. The problem, known as Stigler's diet problem, was famously solved usingthe simplex algorithm. Today,we are not only concernedwith themonetary cost of food, but also the environmentalcost. Efforts to quantify environmental impacts led to the development of footprint (FP) indicators. The environmen-tal footprints of food production spanmultiple dimensions, including greenhouse gas emissions (carbon footprint),nitrogen release (nitrogen footprint),water use (blue andgreenwater footprint) and landuse (land footprint), and adiet minimizing one of these impacts could result in higher impacts in another dimension. In this study based onnutritional and population data for the United States, we identify diets that minimize each of these four footprintssubject to nutrient constraints. We then calculate tradeoffs by taking the composition of each footprint's minimumdiet and calculating the other three footprints. We find that diets for the minimized footprints tend to be similarfor the four footprints, suggesting there are generally synergies, rather than tradeoffs, among low footprint diets.Plant-based food and seafood (fish and other aquatic foods) commonly appear in minimized diets and tend tomost efficiently supply macronutrients and micronutrients, respectively. Livestock products rarely appear in mini-mized diets, suggesting these foods tend to be less efficient from an environmental perspective, evenwhen nutrientcontent is considered. The results' emphasis on seafood is complicated by the environmental impacts of aquacultureversus capture fisheries, increasing in aquaculture, and shifting compositions of aquaculture feeds. While thisanalysis does not make specific diet recommendations, our approach demonstrates potential environmentalsynergies of plant- and seafood-based diets. As a result, this study provides a useful tool for decision-makers inlinking human nutrition and environmental impacts.
© 2016 Elsevier B.V. All rights reserved.
Keywords:Carbon footprintNitrogen footprintWater footprintLand footprintDiet optimizationSustainability
121J.A. Gephart et al. / Science of the Total Environment 553 (2016) 120–127
1. Introduction
In 1945 economist George Stigler published on the minimal costdiet that meets basic nutritional requirements (Stigler, 1945).Since no technique existed to solve for the true minimum, heinvented a method to find a diet whose cost could not be substan-tially reduced. The diet consisted of wheat flour, evaporated milk,cabbage, spinach and dried navy beans, at a cost $39.93 per year(in 1939 prices). In 1947 the newly-developed simplex algorithmfor solving linear programming problems was tested on Stigler's“diet problem” and found the true minimum to be only 24 centsless than Stigler's calculation (Dantzig, 1990).
While the question of how to provide low cost nutrition is stillrelevant, there is an additional question of how to produce food withlow environmental costs. As global food production has increased tokeep up with population growth and changing diet preferences,greenhouse gas emissions, nutrient pollution, water use, and land usehave all increased. Globally, 15% of greenhouse gas emissions fromhuman activities is related to food production (Olivier et al., 2005).Fertilizer application has improved yields, but also releases nutrientsinto waterways, groundwater, and the atmosphere, leading to wateracidification, eutrophication, climate change, and biodiversity loss(Galloway et al., 2003; Erisman et al. 2013). Over 80% of freshwater useis allocated to food production (Carr et al., 2013). Land conversionfor agricultural production further increases biodiversity loss,nutrient runoff, and soil erosion (Turner et al., 2007; Lambin andMeyfroidt, 2011).
Concerns over the environmental effects of food productionhave led to studies measuring the impacts and the developmentof footprint (FP) indicators, including the carbon, nitrogen, water,and land footprints. However, these footprints focus on single envi-ronmental impacts. Indicators that do include multiple impacts,such as the ecological footprint, convert all impacts into a singleunit (land units in the case of the ecological footprint). This hasprompted attempts to consider multiple indicators simultaneously(Galli et al., 2012; Leach et al., in revision). For example, Galli et al.(2012) present the “Footprint Family” and advocate for simulta-neous consideration of carbon, water, and ecological footprints bypolicymakers.
Focusing on a single footprint ignores potential tradeoffs amongthe different impacts. Accounting for tradeoffs is important be-cause policies incentivizing decreases in one footprint may inad-vertently increase another footprint. However, focusing on multipleimpacts simultaneously can lead to confusion and may not take advan-tage of synergies. For example, since every footprint indicator shows alarge environmental impact for beef production (Leach et al., inrevision), all four environmental footprints considered can be improvedby consuming less beef.
Further, environmental impacts cannot be evaluated inisolation from their nutritional value. A diet consisting exclusivelyof a single product that has the lowest footprint would not meetbasic nutritional needs. As a result, the question of how tominimize a given footprint while meeting a set of nutritional re-quirements can be answered using the solution to an old problemin a new way. In order to evaluate potential tradeoffs and synergiesin footprints within a diet, we modified Stigler's “diet problem” tocalculate the diet that minimizes each of the carbon, nitrogen,water, and land footprints in the United States. We use this methodto assess which products tend to appear in minimized diets.Tradeoffs are then quantified by taking the composition ofeach footprint's minimum diet and calculating the other threefootprints. In this way, we can quantify the increase in a footprintby moving from the diet at one footprint's minimum to the dietat another. Through our approach, we provide a quantitativetool for integrating nutritional requirements with environmentalimpacts.
2. Methods
2.1. Data
Food products were selected and grouped based on the USDADietary Guidelines (2010) and the more detailed Harvard UniversityHealthy Eating Plate (http://www.hsph.harvard.edu/nutritionsource/healthy-eating-plate/) food groups. In this analysis we consider bothanimal products (chicken, pigmeat, beef, fish and other aquatic foods(seafood), eggs, milk and cheese) and vegetable products (wheat,rice, fruits, pulses, starchy roots, vegetables and nuts). We used fourfootprint indicators to analyze the environmental impacts of theproduction of these foods; the carbon footprint (greenhouse gasemissions), nitrogen footprint (pollution), water footprint (blue andgreen water use), and land footprint (land use). Each footprint detailsa different aspect of the environmental impacts of food productionand together are able to portray a more complete picture of how differ-ent food products impact the environment (Leach et al., in revision).
2.1.1. Carbon footprintCarbon footprint values for the vegetable and animal products were
reported by Heller and Keoleian (2014). Heller and Keoleian (2014)conducted a meta-analysis of life-cycle studies of around 100 foodproducts and calculated the average carbon footprints by food type.Given the diversity in the methodology of the life-cycle analyses, theirapproach provides carbon footprints meant to be representative andwithin the range of expected values for the given food types producedin developed countries (Supplementary Table 1).
2.1.2. Nitrogen footprintA nitrogen footprint reports the amount of reactive nitrogen (all
species of nitrogen except N2) released to the environment associ-ated with the consumption of resources. A food nitrogen footprinttypically has two parts: food consumption and food production.The food consumption N footprint is the nitrogen contained inthe consumed food product, which ultimately enters the wastewa-ter stream. The food production N footprint accounts for all of thenitrogen lost to the environment throughout the food productionprocess, such as from fertilizer runoff, manure losses, and foodwaste. The food production N footprint can be estimated using vir-tual N factors, which report the amount of N lost to the environ-ment per unit of N consumed for major food categories (Leachet al., 2012). These factors are available for the following food cat-egories in the United States: poultry, pigmeat, beef, seafood, milk,grains, pulses, starchy roots, and vegetables.
To estimate the N footprint associated with different diets inthis study, we used the virtual N factors from Leach et al., 2012 tocalculate the food production N footprint (SupplementaryTable 1). The virtual N factors were converted to units of N releasedper weight of the food product using protein contents from theUSDA National Nutrient Database (2013; Supplementary Tables 1and 5). We focused on the food production N footprint for consis-tency with the other footprints, which are upstream of food con-sumption. When a virtual N factor was not available for aparticular food category, the most similar virtual N factor was ap-plied (e.g., the milk virtual N factor was used for cheese). This cal-culation then reports the total amount of reactive N released to theenvironment as a result of a given diet.
2.1.3. Water footprintWater footprint values came from Mekonen and Hoekstra (2010a,
2010b) (Supplementary Table 1). We focus on surface water (bluewater) and soil water (green) use. United States water footprints werecalculated as the production-weighted average for 62 foods belongingto 13 food commodity groups. Since the water footprint database doesnot include an estimate for the water footprint of seafood, it was
122 J.A. Gephart et al. / Science of the Total Environment 553 (2016) 120–127
estimated using the global production of the top cultivated aquacultureproducts (excluding aquatic plants), the conversion factor to become anedible product (with minimal processing), the total feeds used for eachproduct group, the composition of feeds for each product group, and thewater footprint of the inputs. Thewater footprint of capture production,bivalves, fishmeal, and fish oil were assumed to be zero within the sys-tem boundaries of the water footprints calculated by Mekonnen andHoekstra (2012) following the arguments of Gephart et al. (2014).
We used global production data from Tacon et al. (2011) to ensurethat the species groupings were consistent between the productionand feed use data. Since production data on bivalves is not included inTacon et al. (2011), we used the bivalve production data in FAO FishStat(FAO, 2015a). The conversion factors from live weight to edible productare from the FAO (2000).We selected values that represent aminimallyprocessed edible product (e.g. filet or shelled meat). When a value wasnot available for the product group, the conversion factor for a similarproduct (or average across similar products) was used. Fishmeal, fishoil, and terrestrial feed ingredients for the species groups are fromTacon et al. (2011). The mean of the estimate ranges were used andscaled so that the percentages from all inputs summed to 100%. Thewater footprints for the terrestrial feed inputs are from Mekonnen andHoekstra (2011).
To calculate the water footprint of aquaculture, the water foot-print of the feeds for each species group (L/g feed) was calculatedby multiplying the water footprint of each input (SupplementaryTable 2). A recent study by Pahlow et al. (2015) applied a similarmethod to compute a global average water footprint for aquafeeds.If we include similar products, the average blue and green waterfootprint for aquaculture feeds (1712 m3/t) agrees reasonablywell with the global average estimate of 1808 m3/t by Pahlowet al. (2015). To calculate the overall footprint of seafood we calcu-lated the average of the water footprint of aquaculture(0.00356 m3/g product) and capture fisheries (0 m3/g product),weighted by the proportion of global production of each from theFAO FishStat (2015a) (0.399 from aquaculture and 0.601 from cap-ture fisheries for 2010).
It should be noted that the water footprint of seafood based onfeeds does not necessarily include all relevant aspects of wateruse for seafood production. For example, water used in ponds andduring processing can be high for some species. Inclusion of thepond evaporation- and infiltration-related water footprint wouldresult in a higher water footprint for seafood (Verdegem andBosma, 2009) and would be particularly important for countrieswhich have high reliance on pond aquaculture (e.g. China). Whilea more comprehensive calculation of water use for seafood produc-tion is needed, the approach here provides a reasonable estimate ofthe water footprint associated with aquafeeds, which is compara-ble to the system boundaries used to calculate the water footprintsof livestock (Mekonnen and Hoekstra, 2012).
2.1.4. Land footprintCountry-specific land use efficiency for plant commodities (i.e. ha
per kg of crop) was calculated as the harvested area in 2010 dividedby the amount of crop production (FAO, 2015b). The land use efficiencyvalue for vegetable oils, ηvo, was calculated as:
ηvo ¼ ηocpvo
apocð Þ−pcake
� �
where ηoc is the land use efficiency for oil crops, pvo is the production ofvegetable oil in metric tons, a is the fraction of oil crop production usedfor processed goods, poc is the production of oil crops and pcake is theproduction of oilcakes. Based on feed conversion ratios (FCRs) andfeed rations reported by MacLeod et al. (2013) and Opio et al. (2013)(Supplementary Table 3), the feed component of the global land use
efficiency of animal product k, ηk, was then calculated as follows:
ηk ¼ f kX rpc;kηpc
100
� �
where fk is the FCR for animal product k, rpc,k is the feed ration of a givenplant commodity for animal product k and ηpc is the land use efficiencyof that plant commodity (Supplementary Table 3). Pasture land wassplit between beef and milk production (92% and 8%, respectively)following the methodology of Eshel et al. (2014). The land footprint ofcheese was calculated as 10 times the land footprint of milk, assuminga 10:1 conversion ratio.
The land footprint for seafood was calculated using the samemethods as for thewater footprint. The land footprints for the terrestrialfeed inputs were derived from primary crop yield values reported inthe FAOSTAT database (FAO, 2015b). To calculate the land footprint ofcrop-derived feeds, some conversionswere required. The land footprintfor feed meal from crop i was calculated as:
ηfmi ¼ ηrc;iproc;ipoc;i
!
where ηrc,i is the land footprint of raw crop i, proc,i is the oilcake produc-tion of crop i in the year 2010 in raw equivalents, and proc,i is the oilcakeproduction of crop i in 2010 (FAO, 2015b). This calculation was used forcottonseed meal, mustard seed cake, peanut meal, rapeseed meal,soybean meal, and sunflower seed meal. The value for rapeseed mealwas used for canola protein concentrate. The average value of soybeanmeal and peanut meal was used for lupin kernel meal, faba bean mealand field pea meal.
The land footprints for soybean oil and rapeseed oil were calculatedas:
ηvo;i ¼ ηrc;ipvo;i
aprc;i−poc;i
!
where ηrc,i is the land use efficiency for raw crop i, pvo,i is the productionof oil from crop i, a is the fraction of raw crop production used forprocessed goods, prc,i is the production of crop i and poc,i is the produc-tion of oilcake from crop i. Finally, because gluten products are theprotein concentrate of a crop, wheat gluten and corn meal glutenwere calculated as:
ηg;i ¼ ηrc;ipcfood;ipcprot;i
� �
where pcfood,i is the daily per capita food supply of wheat or maize andpcprot,i is the daily per capita protein supply of wheat or maize.
The total land use for aquaculture was estimated at 36.6 Mha(Verdegem and Bosma, 2009). Because a reliable value does not exist,the area actually occupied by aquaculture ponds – reported up to8.2 Mha (Verdegem and Bosma, 2009) – was not included in ourestimate.
2.1.5. Combined footprintThe combined footprint is an index calculated as the sum of the four
footprints, each normalized to the largest footprint value among thefood items. Each normalized footprint then varies between 0 and 1and the combined footprint between 0 and 4. Coefficients could beadded to each of the summed terms to change the relative weights ofthe footprints. We expand on this point in the discussion.
2.1.6. Nutrition content and constraintsAverage nutrient contents of food groups were obtained by aver-
aging the reported nutrient contents of representative food items
123J.A. Gephart et al. / Science of the Total Environment 553 (2016) 120–127
from the United States Department of Agriculture (USDA) NationalNutrient Database (USDA, 2013). The average nutrient content ofeach food group is provided in Supplementary Table 4 and the listof representative food items is provided in Supplementary Table 5.Nineteen nutrients were selected to represent a broad range ofmicro- and macro-nutrients required in the diet. Any nutrient notincluded is assumed to be satisfied whenever the included nutrientsare satisfied, following the assumption in the original Stigler'sdiet problem (Dantzig, 1963). Nutrient requirements are based onthe USDA (2010) guidelines with minimum recommendationsrepresenting a population-weighted average of the age and genderrecommendations, with demographic information from the UnitedNations Population Division for 2010 (United Nations, 2013). Thisgave a minimum calorie requirement of 1900 and we selected amaximum calorie intake of 3200 (the maximum recommendationfor an active individual). This range ensures that the diet exceedsthe minimum requirement without placing stringent constraints onthe optimization problem.
Nutrition is more complex than the simple minimum requirementsused in this method. For example, we make the simplifying assumptionthat there is no interaction among the foods. This implies that the pres-ence of a food does not affect the availability of nutrients in anotherfood. However, this is likely an over-simplified view of nutrition, andeven when Stigler published his original paper he acknowledged thatthe optimum quantity of a nutrient depends on the quantities of theother nutrients (Dantzig, 1963). However, the goal of this paper is notto suggest an exact diet that should be adopted. Rather our goal is toevaluate diet composition patterns and tradeoffs at footprintminimumsand thus these assumptions are reasonable.
2.2. Data analysis
Weused the original formulation of Stigler's diet problem to analyzethe diet composition with optimum footprints and conducted anuncertainty analysis of the footprint estimates. For i nutrient constraintsand j food items, the i by jmatrix A consists of the nutrient contents foreach food item and the vector b consists of the minimum nutrientrequirements. The vector f consists of the carbon (C), nitrogen (N),water (W), land (L), or combined (T) footprint for each food item, andrepresents the cost vector in the original problem. We minimized fxsubject to Ax N b, where x is the vector of the quantity of each fooditem. The optimum was solved for in Matlab using the Dual Simplexalgorithm with linprog. The tradeoffs were calculated by t=xb⁎fa-xa⁎fawhere a∈ {C,N,W,L,T}, b∈ {C,N,W,L,T} and is not equal to a, and x⁎-represents the optimized diet composition. This gives the increase inthe a footprint when moving from the minimized diet for a to the min-imized diet for b.
We evaluated the uncertainty in the optimized diets that is due tovariability in the footprint estimates by resampling footprint valuesfrom a gamma distribution (with shape parameters based on themean and standard deviation of the footprint estimate for each foodgroup) and rerunning the optimization. When the standard deviationwas unavailable, we used 50% of themean (indicated in SupplementaryTable 1). There is greater uncertainty in the diet composition when noserving constraint is imposed, with the largest uncertainty in theoptimal servings of fruits, vegetables, and nuts (Supplementary Figs. 1and 2). Resampling with deviations from themean footprint also allowsidentification of alternative diet compositions which may have foot-prints only slightly larger than true the minimum.
In order to allow other food products to enter the diet at thefootprint minimum, we sequentially removed products occurring inthe minimized diet. This removal is only possible with a reduced set ofnutritional constraints. For each footprint, we found the combinationsof up to five product removals that would satisfy the calorie, protein,carbohydrate, and fiber constraints and used a maximum serving
constraint of 35. The footprints and tradeoffs with the other footprintswere then calculated for this expanded set of diets.
3. Results
3.1. Diet compositions at footprint minimums
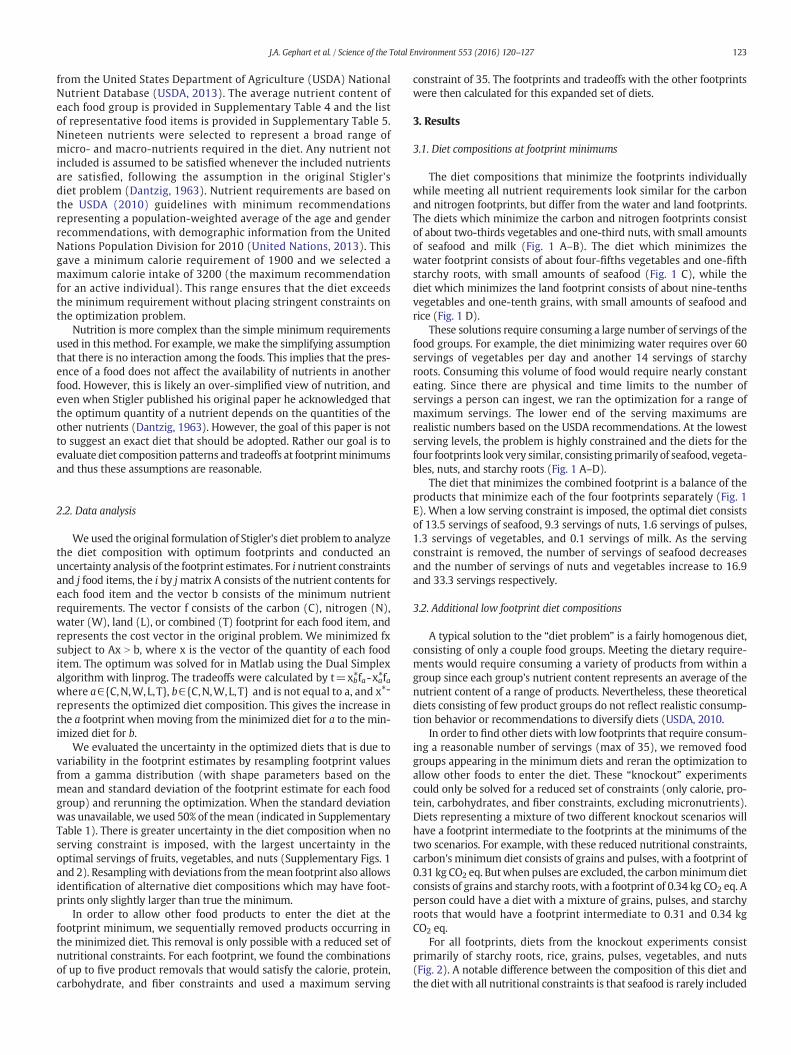
The diet compositions that minimize the footprints individuallywhile meeting all nutrient requirements look similar for the carbonand nitrogen footprints, but differ from the water and land footprints.The diets which minimize the carbon and nitrogen footprints consistof about two-thirds vegetables and one-third nuts, with small amountsof seafood and milk (Fig. 1 A–B). The diet which minimizes thewater footprint consists of about four-fifths vegetables and one-fifthstarchy roots, with small amounts of seafood (Fig. 1 C), while thediet which minimizes the land footprint consists of about nine-tenthsvegetables and one-tenth grains, with small amounts of seafood andrice (Fig. 1 D).
These solutions require consuming a large number of servings of thefood groups. For example, the diet minimizing water requires over 60servings of vegetables per day and another 14 servings of starchyroots. Consuming this volume of food would require nearly constanteating. Since there are physical and time limits to the number ofservings a person can ingest, we ran the optimization for a range ofmaximum servings. The lower end of the serving maximums arerealistic numbers based on the USDA recommendations. At the lowestserving levels, the problem is highly constrained and the diets for thefour footprints look very similar, consisting primarily of seafood, vegeta-bles, nuts, and starchy roots (Fig. 1 A–D).
The diet that minimizes the combined footprint is a balance of theproducts that minimize each of the four footprints separately (Fig. 1E). When a low serving constraint is imposed, the optimal diet consistsof 13.5 servings of seafood, 9.3 servings of nuts, 1.6 servings of pulses,1.3 servings of vegetables, and 0.1 servings of milk. As the servingconstraint is removed, the number of servings of seafood decreasesand the number of servings of nuts and vegetables increase to 16.9and 33.3 servings respectively.
3.2. Additional low footprint diet compositions
A typical solution to the “diet problem” is a fairly homogenous diet,consisting of only a couple food groups. Meeting the dietary require-ments would require consuming a variety of products from within agroup since each group's nutrient content represents an average of thenutrient content of a range of products. Nevertheless, these theoreticaldiets consisting of few product groups do not reflect realistic consump-tion behavior or recommendations to diversify diets (USDA, 2010.
In order to find other diets with low footprints that require consum-ing a reasonable number of servings (max of 35), we removed foodgroups appearing in the minimum diets and reran the optimization toallow other foods to enter the diet. These “knockout” experimentscould only be solved for a reduced set of constraints (only calorie, pro-tein, carbohydrates, and fiber constraints, excluding micronutrients).Diets representing a mixture of two different knockout scenarios willhave a footprint intermediate to the footprints at the minimums of thetwo scenarios. For example, with these reduced nutritional constraints,carbon's minimum diet consists of grains and pulses, with a footprint of0.31 kg CO2 eq. Butwhen pulses are excluded, the carbonminimumdietconsists of grains and starchy roots, with a footprint of 0.34 kg CO2 eq. Aperson could have a diet with a mixture of grains, pulses, and starchyroots that would have a footprint intermediate to 0.31 and 0.34 kgCO2 eq.
For all footprints, diets from the knockout experiments consistprimarily of starchy roots, rice, grains, pulses, vegetables, and nuts(Fig. 2). A notable difference between the composition of this diet andthe diet with all nutritional constraints is that seafood is rarely included
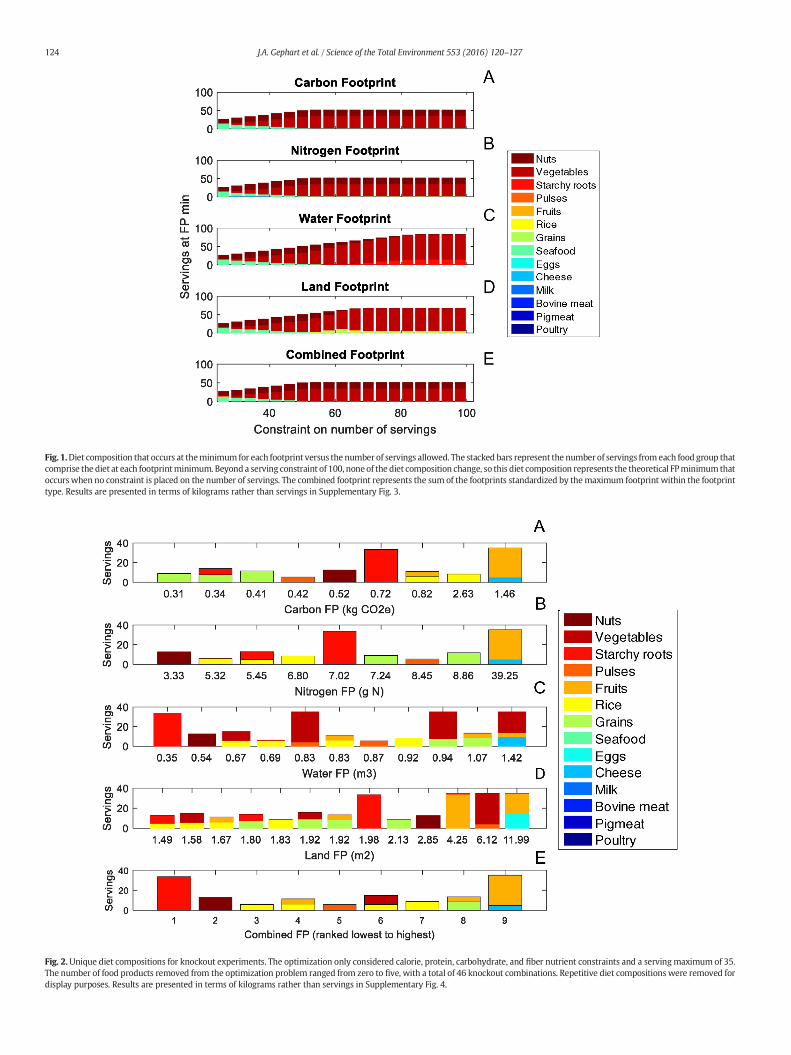
Fig. 1.Diet composition that occurs at theminimum for each footprint versus the number of servings allowed. The stacked bars represent the number of servings from each food group thatcomprise the diet at each footprintminimum. Beyonda serving constraint of 100, noneof the diet composition change, so this diet composition represents the theoretical FPminimum thatoccurs when no constraint is placed on the number of servings. The combined footprint represents the sum of the footprints standardized by themaximum footprint within the footprinttype. Results are presented in terms of kilograms rather than servings in Supplementary Fig. 3.
Fig. 2.Unique diet compositions for knockout experiments. The optimization only considered calorie, protein, carbohydrate, and fiber nutrient constraints and a servingmaximum of 35.The number of food products removed from the optimization problem ranged from zero to five, with a total of 46 knockout combinations. Repetitive diet compositions were removed fordisplay purposes. Results are presented in terms of kilograms rather than servings in Supplementary Fig. 4.
124 J.A. Gephart et al. / Science of the Total Environment 553 (2016) 120–127
TaFo
F
TaFo
F
125J.A. Gephart et al. / Science of the Total Environment 553 (2016) 120–127
at the minimum. This implies that seafood is efficient at supplying themicronutrients when the four footprints are minimized, but lessefficient than the vegetal products at supplying the macronutrients. Ingeneral, other animal products rarely appear in any of the optimizeddiets. These results extend the findings of prior studies (e.g. Eshelet al., 2014) – that reducing animal product intake is an effective wayfor individual's to reduce their footprints – by showing that animalproducts (excluding seafood) are less efficient even when accountingfor nutritional content.
3.3. Tradeoffs and synergies among C, N, W, and L footprints in diets
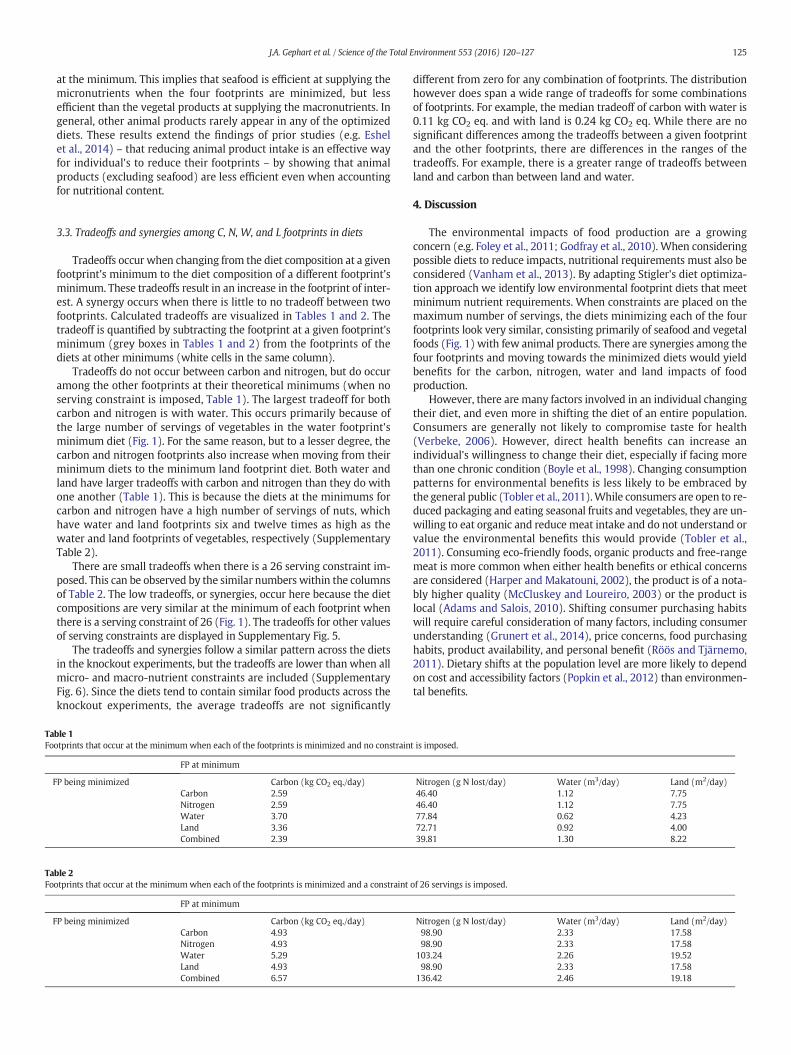
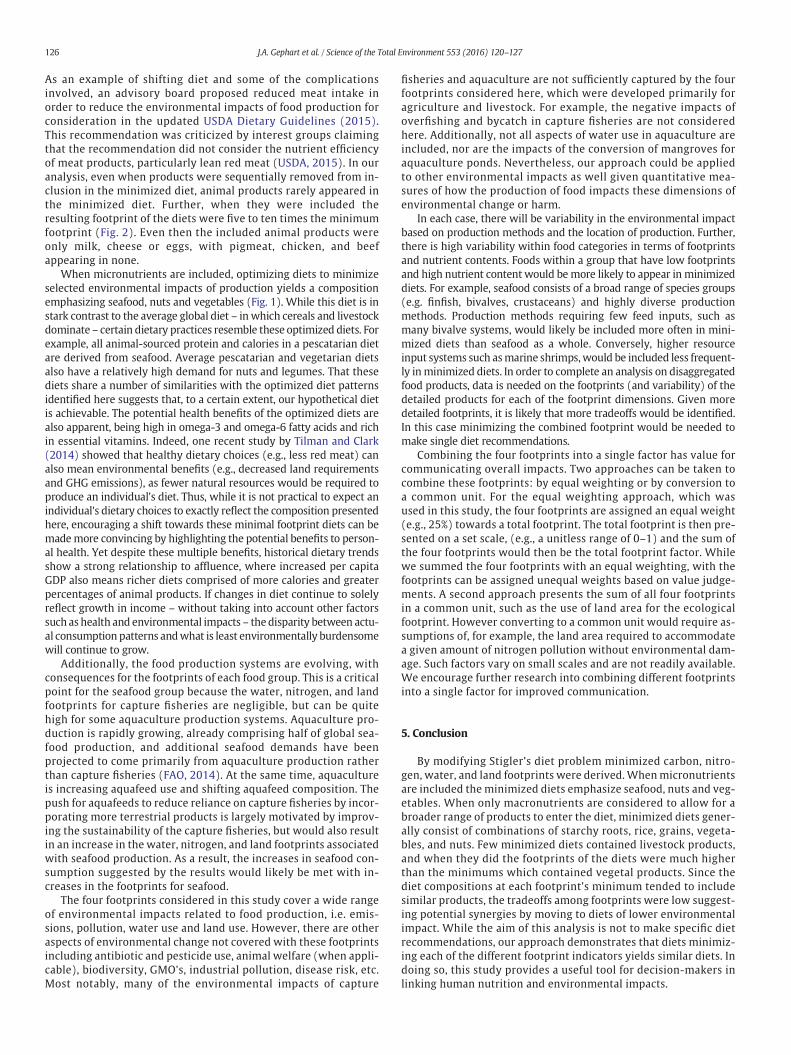
Tradeoffs occur when changing from the diet composition at a givenfootprint's minimum to the diet composition of a different footprint'sminimum. These tradeoffs result in an increase in the footprint of inter-est. A synergy occurs when there is little to no tradeoff between twofootprints. Calculated tradeoffs are visualized in Tables 1 and 2. Thetradeoff is quantified by subtracting the footprint at a given footprint'sminimum (grey boxes in Tables 1 and 2) from the footprints of thediets at other minimums (white cells in the same column).
Tradeoffs do not occur between carbon and nitrogen, but do occuramong the other footprints at their theoretical minimums (when noserving constraint is imposed, Table 1). The largest tradeoff for bothcarbon and nitrogen is with water. This occurs primarily because ofthe large number of servings of vegetables in the water footprint'sminimum diet (Fig. 1). For the same reason, but to a lesser degree, thecarbon and nitrogen footprints also increase when moving from theirminimum diets to the minimum land footprint diet. Both water andland have larger tradeoffs with carbon and nitrogen than they do withone another (Table 1). This is because the diets at the minimums forcarbon and nitrogen have a high number of servings of nuts, whichhave water and land footprints six and twelve times as high as thewater and land footprints of vegetables, respectively (SupplementaryTable 2).
There are small tradeoffs when there is a 26 serving constraint im-posed. This can be observed by the similar numbers within the columnsof Table 2. The low tradeoffs, or synergies, occur here because the dietcompositions are very similar at the minimum of each footprint whenthere is a serving constraint of 26 (Fig. 1). The tradeoffs for other valuesof serving constraints are displayed in Supplementary Fig. 5.
The tradeoffs and synergies follow a similar pattern across the dietsin the knockout experiments, but the tradeoffs are lower than when allmicro- and macro-nutrient constraints are included (SupplementaryFig. 6). Since the diets tend to contain similar food products across theknockout experiments, the average tradeoffs are not significantly
ble 1otprints that occur at the minimumwhen each of the footprints is minimized and no constrain
FP at minimum
P being minimized Carbon (kg CO2 eq./day)Carbon 2.59Nitrogen 2.59Water 3.70Land 3.36Combined 2.39
ble 2otprints that occur at the minimumwhen each of the footprints is minimized and a constraint
FP at minimum
P being minimized Carbon (kg CO2 eq./day)Carbon 4.93Nitrogen 4.93Water 5.29Land 4.93Combined 6.57
different from zero for any combination of footprints. The distributionhowever does span a wide range of tradeoffs for some combinationsof footprints. For example, the median tradeoff of carbon with water is0.11 kg CO2 eq. and with land is 0.24 kg CO2 eq. While there are nosignificant differences among the tradeoffs between a given footprintand the other footprints, there are differences in the ranges of thetradeoffs. For example, there is a greater range of tradeoffs betweenland and carbon than between land and water.
4. Discussion
The environmental impacts of food production are a growingconcern (e.g. Foley et al., 2011; Godfray et al., 2010). When consideringpossible diets to reduce impacts, nutritional requirements must also beconsidered (Vanham et al., 2013). By adapting Stigler's diet optimiza-tion approach we identify low environmental footprint diets that meetminimum nutrient requirements. When constraints are placed on themaximum number of servings, the diets minimizing each of the fourfootprints look very similar, consisting primarily of seafood and vegetalfoods (Fig. 1) with few animal products. There are synergies among thefour footprints and moving towards the minimized diets would yieldbenefits for the carbon, nitrogen, water and land impacts of foodproduction.
However, there are many factors involved in an individual changingtheir diet, and even more in shifting the diet of an entire population.Consumers are generally not likely to compromise taste for health(Verbeke, 2006). However, direct health benefits can increase anindividual's willingness to change their diet, especially if facing morethan one chronic condition (Boyle et al., 1998). Changing consumptionpatterns for environmental benefits is less likely to be embraced bythe general public (Tobler et al., 2011).While consumers are open to re-duced packaging and eating seasonal fruits and vegetables, they are un-willing to eat organic and reduce meat intake and do not understand orvalue the environmental benefits this would provide (Tobler et al.,2011). Consuming eco-friendly foods, organic products and free-rangemeat is more common when either health benefits or ethical concernsare considered (Harper and Makatouni, 2002), the product is of a nota-bly higher quality (McCluskey and Loureiro, 2003) or the product islocal (Adams and Salois, 2010). Shifting consumer purchasing habitswill require careful consideration of many factors, including consumerunderstanding (Grunert et al., 2014), price concerns, food purchasinghabits, product availability, and personal benefit (Röös and Tjärnemo,2011). Dietary shifts at the population level are more likely to dependon cost and accessibility factors (Popkin et al., 2012) than environmen-tal benefits.
t is imposed.
Nitrogen (g N lost/day) Water (m3/day) Land (m2/day)46.40 1.12 7.7546.40 1.12 7.7577.84 0.62 4.2372.71 0.92 4.0039.81 1.30 8.22
of 26 servings is imposed.
Nitrogen (g N lost/day) Water (m3/day) Land (m2/day)98.90 2.33 17.5898.90 2.33 17.58
103.24 2.26 19.5298.90 2.33 17.58
136.42 2.46 19.18
126 J.A. Gephart et al. / Science of the Total Environment 553 (2016) 120–127
As an example of shifting diet and some of the complicationsinvolved, an advisory board proposed reduced meat intake inorder to reduce the environmental impacts of food production forconsideration in the updated USDA Dietary Guidelines (2015).This recommendation was criticized by interest groups claimingthat the recommendation did not consider the nutrient efficiencyof meat products, particularly lean red meat (USDA, 2015). In ouranalysis, even when products were sequentially removed from in-clusion in the minimized diet, animal products rarely appeared inthe minimized diet. Further, when they were included theresulting footprint of the diets were five to ten times the minimumfootprint (Fig. 2). Even then the included animal products wereonly milk, cheese or eggs, with pigmeat, chicken, and beefappearing in none.
When micronutrients are included, optimizing diets to minimizeselected environmental impacts of production yields a compositionemphasizing seafood, nuts and vegetables (Fig. 1). While this diet is instark contrast to the average global diet – in which cereals and livestockdominate – certain dietary practices resemble these optimized diets. Forexample, all animal-sourced protein and calories in a pescatarian dietare derived from seafood. Average pescatarian and vegetarian dietsalso have a relatively high demand for nuts and legumes. That thesediets share a number of similarities with the optimized diet patternsidentified here suggests that, to a certain extent, our hypothetical dietis achievable. The potential health benefits of the optimized diets arealso apparent, being high in omega-3 and omega-6 fatty acids and richin essential vitamins. Indeed, one recent study by Tilman and Clark(2014) showed that healthy dietary choices (e.g., less red meat) canalso mean environmental benefits (e.g., decreased land requirementsand GHG emissions), as fewer natural resources would be required toproduce an individual's diet. Thus, while it is not practical to expect anindividual's dietary choices to exactly reflect the composition presentedhere, encouraging a shift towards these minimal footprint diets can bemademore convincing by highlighting the potential benefits to person-al health. Yet despite these multiple benefits, historical dietary trendsshow a strong relationship to affluence, where increased per capitaGDP also means richer diets comprised of more calories and greaterpercentages of animal products. If changes in diet continue to solelyreflect growth in income – without taking into account other factorssuch as health and environmental impacts – the disparity between actu-al consumption patterns andwhat is least environmentally burdensomewill continue to grow.
Additionally, the food production systems are evolving, withconsequences for the footprints of each food group. This is a criticalpoint for the seafood group because the water, nitrogen, and landfootprints for capture fisheries are negligible, but can be quitehigh for some aquaculture production systems. Aquaculture pro-duction is rapidly growing, already comprising half of global sea-food production, and additional seafood demands have beenprojected to come primarily from aquaculture production ratherthan capture fisheries (FAO, 2014). At the same time, aquacultureis increasing aquafeed use and shifting aquafeed composition. Thepush for aquafeeds to reduce reliance on capture fisheries by incor-porating more terrestrial products is largely motivated by improv-ing the sustainability of the capture fisheries, but would also resultin an increase in the water, nitrogen, and land footprints associatedwith seafood production. As a result, the increases in seafood con-sumption suggested by the results would likely be met with in-creases in the footprints for seafood.
The four footprints considered in this study cover a wide rangeof environmental impacts related to food production, i.e. emis-sions, pollution, water use and land use. However, there are otheraspects of environmental change not covered with these footprintsincluding antibiotic and pesticide use, animal welfare (when appli-cable), biodiversity, GMO's, industrial pollution, disease risk, etc.Most notably, many of the environmental impacts of capture
fisheries and aquaculture are not sufficiently captured by the fourfootprints considered here, which were developed primarily foragriculture and livestock. For example, the negative impacts ofoverfishing and bycatch in capture fisheries are not consideredhere. Additionally, not all aspects of water use in aquaculture areincluded, nor are the impacts of the conversion of mangroves foraquaculture ponds. Nevertheless, our approach could be appliedto other environmental impacts as well given quantitative mea-sures of how the production of food impacts these dimensions ofenvironmental change or harm.
In each case, there will be variability in the environmental impactbased on production methods and the location of production. Further,there is high variability within food categories in terms of footprintsand nutrient contents. Foods within a group that have low footprintsand high nutrient content would be more likely to appear in minimizeddiets. For example, seafood consists of a broad range of species groups(e.g. finfish, bivalves, crustaceans) and highly diverse productionmethods. Production methods requiring few feed inputs, such asmany bivalve systems, would likely be included more often in mini-mized diets than seafood as a whole. Conversely, higher resourceinput systems such asmarine shrimps,would be included less frequent-ly inminimized diets. In order to complete an analysis on disaggregatedfood products, data is needed on the footprints (and variability) of thedetailed products for each of the footprint dimensions. Given moredetailed footprints, it is likely that more tradeoffs would be identified.In this case minimizing the combined footprint would be needed tomake single diet recommendations.
Combining the four footprints into a single factor has value forcommunicating overall impacts. Two approaches can be taken tocombine these footprints: by equal weighting or by conversion toa common unit. For the equal weighting approach, which wasused in this study, the four footprints are assigned an equal weight(e.g., 25%) towards a total footprint. The total footprint is then pre-sented on a set scale, (e.g., a unitless range of 0–1) and the sum ofthe four footprints would then be the total footprint factor. Whilewe summed the four footprints with an equal weighting, with thefootprints can be assigned unequal weights based on value judge-ments. A second approach presents the sum of all four footprintsin a common unit, such as the use of land area for the ecologicalfootprint. However converting to a common unit would require as-sumptions of, for example, the land area required to accommodatea given amount of nitrogen pollution without environmental dam-age. Such factors vary on small scales and are not readily available.We encourage further research into combining different footprintsinto a single factor for improved communication.
5. Conclusion
By modifying Stigler's diet problem minimized carbon, nitro-gen, water, and land footprints were derived. Whenmicronutrientsare included the minimized diets emphasize seafood, nuts and veg-etables. When only macronutrients are considered to allow for abroader range of products to enter the diet, minimized diets gener-ally consist of combinations of starchy roots, rice, grains, vegeta-bles, and nuts. Few minimized diets contained livestock products,and when they did the footprints of the diets were much higherthan the minimums which contained vegetal products. Since thediet compositions at each footprint's minimum tended to includesimilar products, the tradeoffs among footprints were low suggest-ing potential synergies by moving to diets of lower environmentalimpact. While the aim of this analysis is not to make specific dietrecommendations, our approach demonstrates that diets minimiz-ing each of the different footprint indicators yields similar diets. Indoing so, this study provides a useful tool for decision-makers inlinking human nutrition and environmental impacts.
127J.A. Gephart et al. / Science of the Total Environment 553 (2016) 120–127
Acknowledgements
We thank Paolo D'Odorico, Laura Cattell-Noll, and Elizabeth Castnerfor their helpful suggestions. This work was supported in part by theNSF Graduate Research Fellowship Program (Grant # DGE-00809128).
Appendix A. Supplementary data
Supplementary data to this article can be found online at http://dx.doi.org/10.1016/j.scitotenv.2016.02.050.
References
Adams, D.C., Salois, M.J., 2010. Local versus organic: a turn in consumer preferences andwillingness-to-pay. Renewable Agric. Food Syst. 25, 331–341.
Boyle, R.G., O'Connor, P.J., Pronk, N.P., Tan, A., 1998. Stages of change for physical activity,diet, and smoking among HMO members with chronic conditions. Am. J. HealthPromot. 12, 170–175.
Carr, J.A., D'Odorico, P., Laio, F., Ridolfi, L., 2013. Recent history and geography of virtualwater trade. PLoS ONE 8 (2), e55825. http://dx.doi.org/10.1371/journal.pone.0055825.
Dantzig, G.B., 1963. Linear Programming and Extensions. Princeton Press, Princeton, NewJersey Available at: http://bioinfo.ict.ac.cn/~dbu/AlgorithmCourses/Lectures/Dantzig1963-1.pdf.
Dantzig, G.B., 1990. The diet problem. Interfaces 20 (4), 43–47.Erisman, J.W., Galloway, J.N., Seitzinger, S., Bleeker, A., Dise, N.B., Petrescu, R., Leach, A.M.,
de Vries, W., 2013. Consequences of human modification of the global nitrogen cycle.Philos. Trans. R. Soc. 368 (1621). http://dx.doi.org/10.1098/rstb.2013.0116.
Eshel, G., Shepon, A., Makov, T., Milo, R., 2014. Land, irrigation water, greenhouse gas, andreactive nitrogen burdens of meat, eggs, and dairy production in the United States.Proc. Natl. Acad. Sci. 111, 11996–12001.
Foley, J.A., et al., 2011. Solutions for a cultivated planet. Nature 478, 337–342.Food and Agricultural Organization of the United Nations, 2000. CWP Handbook of
Fishery Statistical Standards. Section I: Conversion Factors From Landed to NominalWeight. FAO, Rome.
Food and Agricultural Organization of the United Nations, 2014. The State of WorldFisheries and Aquaculture 2014. FAO, Rome.
Food and Agricultural Organization of the United Nations, 2015. FishStat. Available at.(Available at http://www.fao.org/fishery/statistics/software/fishstatj/en. AccessedJune 15, 2015).
Food and Agricultural Organization of the United Nations (2015b) FAOSTAT. (Available atfaostat3.fao.org. Accessed April 18, 2015).
Galli, A., Wiedmann, T., Ercin, E., Knoblauch, D., Ewing, B., Giljum, S., 2012. Integratingecological, carbon and water footprint into a “footprint family” of indicators: defini-tion and role in tracking human pressure on the planet. Ecol. Indic. 16, 100–112.
Galloway, J.N., Aber, J.D., Erisman, J.W., Seitzinger, S.P., Howarth, R.W., Cowling, E.B.,Cosby, B.J., 2003. The nitrogen cascade. Bioscience 53, 341–356.
Gephart, J.A., Pace, M.L., D'Odorico, P., 2014. Freshwater savings from marine proteinconsumption. Environ. Res. Lett. 9, 014005.
Godfray, H.C.J., Beddington, J.R., Crute, I.R., Haddad, L., Lawrence, D., Muir, J.F., Pretty, J.,Robinson, S., Thomas, S.M., Toulmin, C., 2010. Food security: the challenge of feeding9 billion people. Science 327, 812–818.
Grunert, K.G., Hieke, S., Wills, J., 2014. Sustainability labels on food products: consumermotivation, understanding and use. Food Policy 44, 177–189.
Harper, G.C., Makatouni, A., 2002. Consumer perception of organic food production andfarm animal welfare. Br. Food J. 104, 287–299.
Heller, M.C., Keoleian, G.A., 2014. Greenhouse gas emission estimates of U.S. dietarychoices and food loss. J. Ind. Ecol. http://dx.doi.org/10.1111/jiec.12174.
Lambin, E.F., Meyfroidt, P., 2011. Global land use change, economic globalization, and thelooming land scarcity. Proc. Natl. Acad. Sci. 108, 3465–3472.
Leach, A.M., Galloway, J.N., Bleeker, A., Erisman, J.W., Kohn, R., Kitzes, J., 2012. A nitrogenfootprint model to help consumers understand their role in nitrogen losses to theenvironment. Environ. Dev. 1, 40–66.
Leach, A.M., Emery, K.A., Gephart, J.A., Davis, K.F., Erisman, J.W., Leip, A., Pace, M.L.,D'Odorico, P., Carr, J., Noll, L. Cattell, Castner, E., Galloway, J.N., 2016. Environmentalimpact food labels combining carbon, nitrogen, and water footprints. Food Policy(in revision).
MacLeod, M., Gerber, P., Mottet, A., Tempio, G., Falcucci, A., Opio, C., Vellinga, T.,Henderson, B., Steinfeld, H., 2013. Greenhouse Gas Emissions From Pig and ChickenSupply Chains — A Global Life Cycle Assessment. FAO, Rome.
McCluskey, J.J., Loureiro, M.L., 2003. Consumer preferences and willingness to pay for foodlabeling: a discussion of empirical studies. J. Food Distrib. Res. 34, 95–102.
Mekonen, M.M., Hoekstra, A.Y., 2010a. The green, blue and grey water footprint of cropsand derived crop products. Value of Water Research Report Series No. 47, UNESCO-IHE, Delft, the Netherlands.
Mekonen, M.M., Hoekstra, A.Y., 2010b. The green, blue and grey water footprint of farmanimals and animal products. Value of Water Research Report Series No. 47,UNESCO-IHE, Delft, the Netherlands.
Mekonnen, M.M., Hoekstra, A.Y., 2011. The green, blue and grey water footprint of cropsand derived crop products. Hydrol. Earth Syst. Sci. 15, 1577–1600.
Mekonnen, M.M., Hoekstra, A.Y., 2012. A global assessment of the water footprint of farmanimal products. Ecosystems 15, 401–415.
Olivier, J.G.J., Van Aardenne, J.A., Dentener, F.J., Pagliari, V., Ganzeveld, L.N., Peters,J.A.H.W., 2005. Recent trends in global greenhouse gas emissions: regional trends1970–2000 and spatial distribution of key sources in 2000. Environ. Sci. 2 (2–3),81–99.
Opio, C., Gerber, P., Mottet, A., Falcucci, A., Tempio, G., MacLeod, M., Vellinga, T.,Henderson, B., Steinfeld, H., 2013. Greenhouse Gas Emissions From Ruminant SupplyChains — A Global Life Cycle Assessment. FAO, Rome.
Pahlow, M., van Oel, P.R., Mekonnen, M.M., Hoekstra, A.Y., 2015. Increasing pressure onfreshwater resources due to terrestrial feed ingredients for aquaculture production.Sci. Total Environ. 356, 847–857.
Popkin, B.M., Adair, L.S., Ng, S.W., 2012. Now and then: the global nutrition transition: thepandemic of obesity in developing countries. Nutr. Rev. 70, 3–21.
Röös, E., Tjärnemo, H., 2011. Challenges of carbon labelling of food products: a consumerresearch perspective. Br. Food J. 113, 982–996.
Stigler, G.J., 1945. The cost of subsistence. J. Farm Econ. 27 (2), 303–314.Tacon, A.G.J., Hasan, M., Metian, M., 2011. Demand and Supply of Feed Ingredients for
Farmed Fish and Crustaceans, Rome, Italy.Tilman, D., Clark, M., 2014. Global diets link environmental sustainability and human
health. Nature 515, 518–522.Tobler, C., Visschers, V.H.M., Siegrist, M., 2011. Eating green. Consumers' willingness to
adopt ecological food consumption behaviors. Appetite 57, 674–682.Turner, B.L., Lambin, E.F., Reenberg, A., 2007. The emergence of land change science
for global environmental change and sustainability. Proc. Natl. Acad. Sci. 104,20666–20671.
U.S. Department of Agriculture, Agricultural Research Service, 2013i. USDA NationalNutrient Database for Standard Reference, Release 26. Nutrient Data LaboratoryHome Page http://www.ars.usda.gov/ba/bhnrc/ndl.
U.S. Department of Agriculture and U.S. Department of Health and Human Services,2010t. Dietary Guidelines for Americans. seventh ed. Government Printing Office,Washington, DC: U.S. (December 2010).
U.S. Department of Agriculture and U.S. Department of Health and Human Services,2015t. Comments Submitted to the Federal Government on the Scientific Report ofthe 2015 Dietary Guidelines Advisory Committee. (Available at: http://health.gov/dietaryguidelines/dga2015/comments/readComments.aspx [accessed September 15,2015]).
United Nations, 2013. World population prospects: the 2012 revision. United NationsPopulation Division Department of Economic and Social Affairs.
Vanham, D., Mekonnen, M.M., Hoekstra, A.Y., 2013. The water footprint of the EU fordifferent diets. Ecol. Indic. 32, 1–8. http://dx.doi.org/10.1016/j.ecolind.2013.02.020.
Verbeke, M., 2006. Functional foods: consumer willingness to compromise on taste forhealth? Food Qual. Prefer. 17, 126–131.
Verdegem, M.C.J., Bosma, R.H., 2009. Water withdrawal for brackish and inland aquacul-ture, and options to producemore fish in ponds with present water use. Water Policy11 (S1), 52.