Embed Size (px)
Citation preview

Science MissionDirectorate
Weather Focus Area
Jeffrey Halverson for Ramesh Kakar January 4, 2006

2
History & Background
Since the early days of spaceage, NASA has been at the forefront of using the vantage point of space for observing how the weather systems develop
The Space Act of 1958, as amended, assigns NASA the responsibility for expanding human knowledge of the Earth and of phenomena in the atmosphere and space and cooperating with interested U.S. agencies to avoid unnecessary duplication of effort
The origin of almost all instruments that have ever flown on NOAA satellites can be traced back to the NASA programs
3
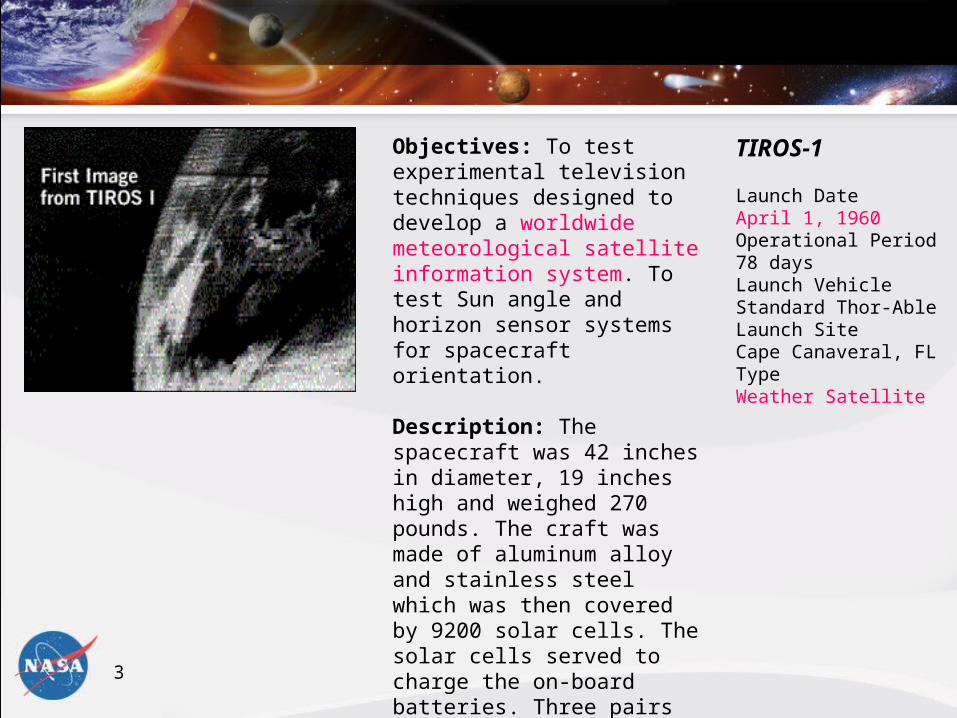
Objectives: To test experimental television techniques designed to develop a worldwide meteorological satellite information system. To test Sun angle and horizon sensor systems for spacecraft orientation.
Description: The spacecraft was 42 inches in diameter, 19 inches high and weighed 270 pounds. The craft was made of aluminum alloy and stainless steel which was then covered by 9200 solar cells. The solar cells served to charge the on-board batteries. Three pairs of solid-propellant spin rockets were mounted on the base plate.
TIROS-1
Launch Date April 1, 1960 Operational Period 78 days Launch Vehicle Standard Thor-Able Launch Site Cape Canaveral, FL Type Weather Satellite

4
Nimbus-5
Objectives: Continuation of research, development and testing of new meteorological sensors, systems and systems configurations to measure atmospheric temperature, water vapor and ozone. Those sensors which could be used in operational weather analysis and prediction were to be added to the NOAA operational weather satellite program.
Description: New experiments included an electrically scanning microwave radiometer, an infrared temperature profile radiometer, a microwave spectrometer, and a surface composition mapping radiometer. Improved versions of the chopper radiometer and the temperature, humidity and infrared radiometer were also flown.
Nimbus-5
Launch Date December 10, 1972 Operational Period Over 10 years until it was deactivated on March 29, 1983 Launch Vehicle Delta 900 Launch Site Vandenberg Air Force Base, CA Type Weather Satellite Photo: Nimbus-5 undergoes final checks
prior to shipment to the test range.

5Directly addressed by Weather Focus Area
Variability
Forcing
Response
Consequence
Prediction
Precipitation, evaporation &
cycling of water changing?
Global ocean circulation
varying?
Global ecosystems changing?
Stratospheric ozone changing?
Ice cover mass changing?
Earth surface transformation?
Atmospheric constituents &
solar radiation on climate?
Changes in land cover & land use?
Motions of the Earth and Earth’s
interior?
Clouds & surface hydrological processes on
climate?
Ecosystem, land cover &
biogeochemical responses?
Changes in global ocean circulation?
Atmospheric trace constituents responses?
Sea level affected by Earth system change?
Weather variation related to climate variation?
Consequences of land cover & land use?
Coastal region impacts?
Weather forecasting
improvement?
Improve predic-tion of climate variability &
change?
Ozone, climate & air quality impacts
of atmospheric composition?
Carbon cycle and ecosystem change?
Science Questions from the Research Strategy
Regional air quality impacts?
Predict & mitigate natural hazards
from Earth surface change?
Change in water cycle dynamics?
6
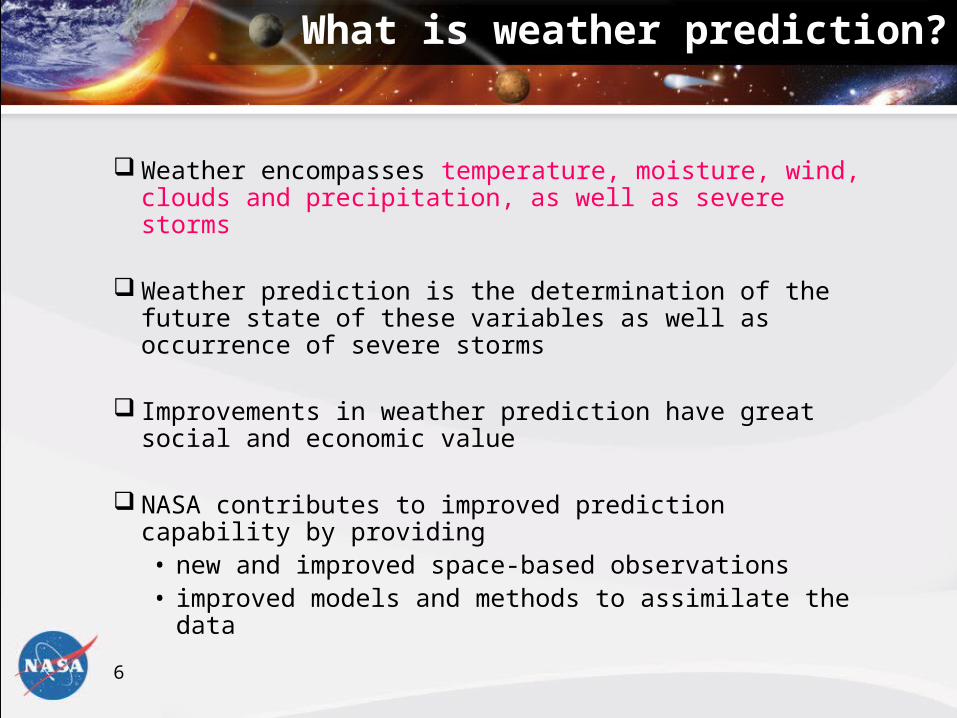
What is weather prediction?
Weather encompasses temperature, moisture, wind, clouds and precipitation, as well as severe storms
Weather prediction is the determination of the future state of these variables as well as occurrence of severe storms
Improvements in weather prediction have great social and economic value
NASA contributes to improved prediction capability by providing • new and improved space-based observations• improved models and methods to assimilate the data

7 Systematic measurements of atmosphere, ocean, and land surface parameters
How Can Weather Forecast Duration and Reliability Be Improved By New Space-Based Observations, Assimilation, and Modeling?
By 2015:
Weather and severe storm forecasting improve-ments:
•Hurricane landfall accuracy improved for evacuation decisions;
•Winter storm hazards predicted for appropriate mitigation;
•Improved regional nowcasting of severe weather to enable life-saving actions, reducing false alarms;
•Quantitative precipitation forecasts accurate for economic decisions
NASA/NOAA collaborative centers
Steady, evolutionary improvement in weather prediction accuracy due to ongoing model refinement in operational agencies, finer-scale model resolution, improved use of probabilistic and statistical forecasting aided by multiple-component ensemble initializations, and incorporation of radar and aircraft-measurements
Kn
ow
led
ge
Bas
e
2002 200720062005 2010 20112003 2012 2013 2014 2015 2008 2009
Weather satellite
sensor and technique
development; used by NOAA
Improvements require:
• Focused validation experiments
• New technology
• Impact assessments
Observations of tropical rainfall/energy release
High-resolution global measurements of temperature, moisture, cloud properties, and aerosols (EOS instruments)
Global tropospheric winds
Satellite-derived localized heating inputs leading to better physical understanding and modeling of precipitating systems.
Realistic and accelerated use by NOAA of new NASA knowledge, measurements, and data assimilation techniques.
Better description of atmospheric dynamics, cloud distributions for radiation modeling, aerosol concentrations for air quality projection, and better imagery of snow/ice cover and severe weather phenomena like hurricanes and floods.
Significant forecast improvements
Funded
Unfunded
TT
Global Precipitation
GEO : Lightning, ir & microwave sounding
Forecast Forecast improvementimprovement
Improved physical & Improved physical & dynamical processesdynamical processes
= Field Campaign
Severe Severe weather weather forecastsforecasts
Global monitoring of water, energy, clouds, and air quality – Operational prototype mission
Soil MoistureTT Improved weather, Improved weather, flood forecastsflood forecasts
2004

8
Key Roadmap Elements
Modeling and Computing: Increased computing speed and advanced numerical models are required to complement increased resolution and accuracy of new observations
Wind Lidar: Simulation experiments show that tropospheric wind profiles would provide a significant improvement to general and severe weather forecast accuracy
Precipitation and Clouds: These observations are required to mitigate deficiencies in model physics and high synergy with wind measurements

9
Key Roadmap Elements (contd.)
Geosynchronous Observations (especially microwave): Advanced imaging and sounding is required to complement advanced polar orbit observations with time resolution necessary to fully observe/understand weather scale processes
Active Sounding (T, q, clouds): Next sounding breakthrough will be fine vertical resolution for boundary layer/ near surface information, accurate definitions of fronts and tropopause, and determination of cloud layers in order to interface with finer-scale models

10
Key Linkages
Measurement of temperature, moisture (precipitation, clouds, soil moisture) and wind fields with enhanced temporal and spatial resolution is useful to the objectives of other focus areas (e.g. Climate, Water and Energy Cycle)
Goals are jointly worked with other agencies via USWRP and other interagency activities • NOAA/NASA/NAVY/Air Force Joint Center for Satellite Data
Assimilation• Short-term Prediction Research and Transition (SPoRT) - a
NASA-NOAA-University collaborationNASA strives to transition knowledge, data,
techniques and models to operational weather agencies in U.S. (NOAA, DoD) and across the world (through WMO)
Solar System Mission within SMD

11
National Weather Forecast Improvement Goals
TODAY:• Reliable 3-day forecasts of
non-extreme weather • 13-hour winter storm forecast• 3-day severe local storm
forecast with low-moderate confidence
• 16-minute thunderstorm advanced warning
• Tornado lead time 12 min• Hurricane landfall tracking:
+/- 240 km at 2-3 days• Inconsistent hurricane
intensity forecasts• Air quality day-by-day
GOALS for 2015:• Reliable 5-day forecasts of
non-extreme weather• 24-hour winter storm forecast• 5-day severe local storm
forecast with moderate confidence
• 30-minute thunderstorm advanced warning
• Tornado lead time 20 min• Hurricane landfall tracking:
+/- 160 km at 2-3 days• Dependable hurricane
intensity, precip forecasts• Air quality forecast at 2 days

12
Figure: 500hPa Z Anomaly Correlations with (Ops.+AIRS) and without (Ops.) AIRS data, Northern hemisphere, January 2004
N. Hemisphere 500 mb AC Z 20N - 80N Waves 1-20
1 Jan - 27 Jan '04
0.6
0.65
0.7
0.75
0.8
0.85
0.9
0.95
1
0 1 2 3 4 5 6 7
Forecast [days]
Anomaly Correlation
Ops
Ops+AIRS
“Experimental weather forecasts at the Joint Center for Satellite Data Assimilation using AIRS radiance data indicate significant improvements in global forecast skill compared to the operational system without AIRS data. The improvement in forecast skill at 6 days is equivalent to gaining an extension of forecast capability of several hours. While this may seem small, it is quite significant when compared to the rate of general forecast improvement over the last decade. A several hour increase in forecast range at 5 or 6 days normally takes several years to achieve at operational weather centers.”
Impact of AIRS on Global Forecast Skill
13
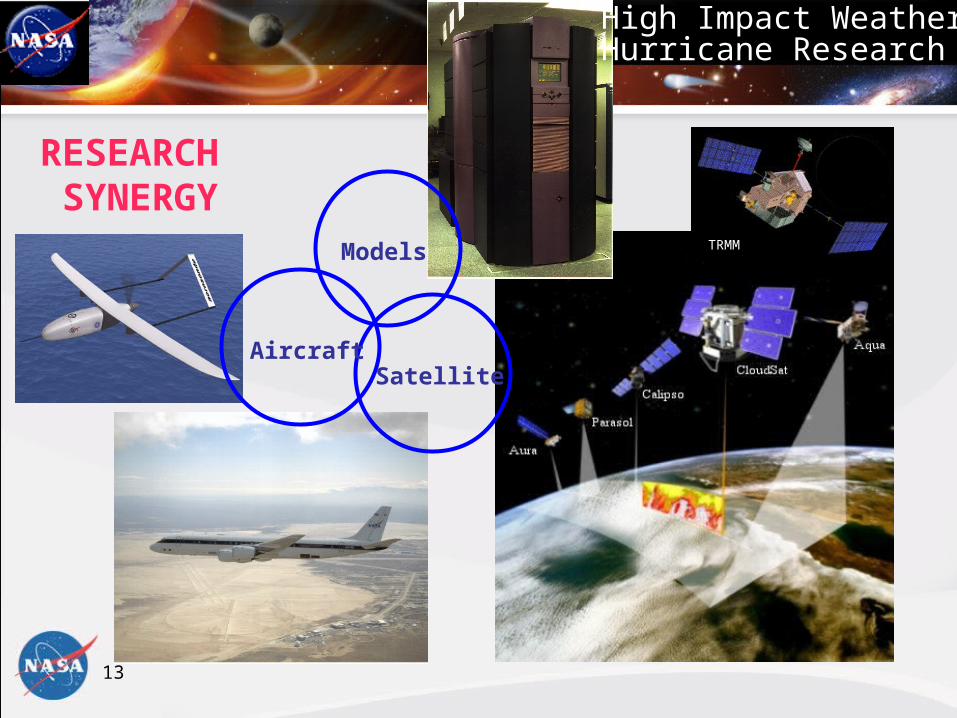
TRMMModels
SatelliteAircraft
RESEARCH SYNERGY
High Impact Weather:Hurricane Research
14
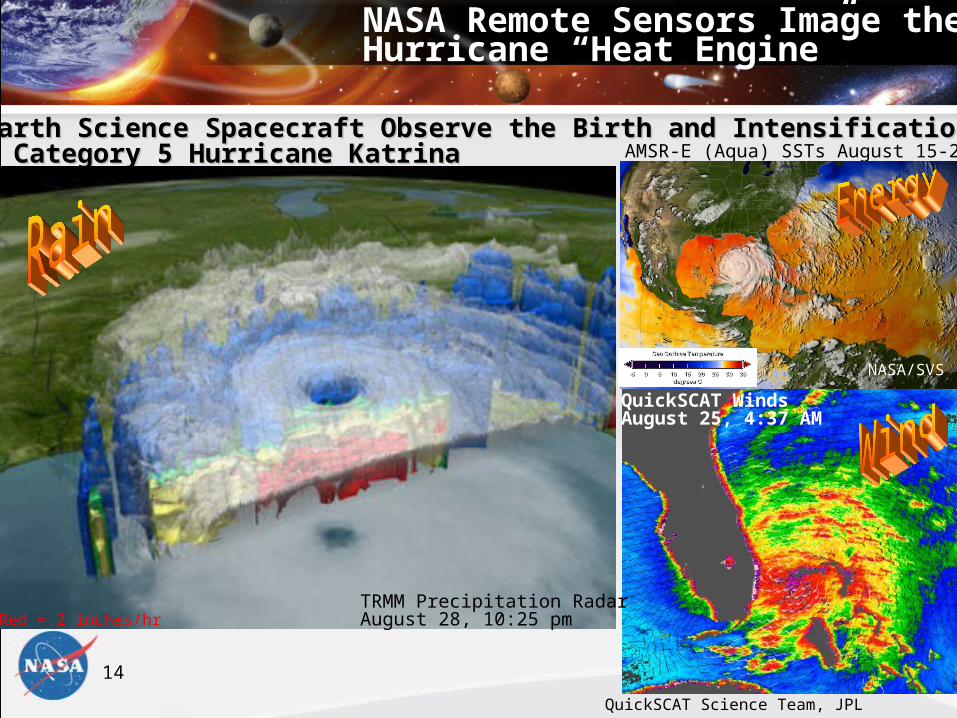
NASA Earth Science Spacecraft Observe the Birth and Intensification of NASA Earth Science Spacecraft Observe the Birth and Intensification of Deadly Category 5 Hurricane KatrinaDeadly Category 5 Hurricane Katrina
QuickSCAT Science Team, JPL
TRMM Precipitation RadarAugust 28, 10:25 pm
AMSR-E (Aqua) SSTs August 15-27
QuickSCAT WindsAugust 25, 4:37 AM
Red = 2 inches/hr
NASA/SVS
NASA Remote Sensors Image theHurricane “Heat Engine”

15
FSU Super Ensemble model is enhanced with data from TRMM, QuickSCAT and CAMEX
16
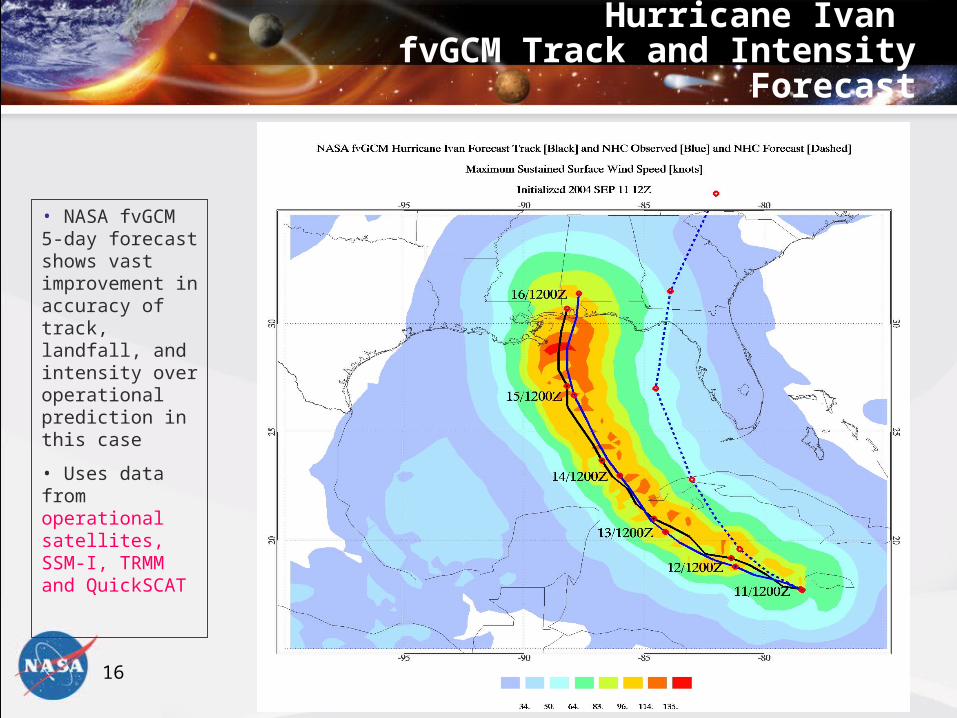
Hurricane Ivan fvGCM Track and Intensity Forecast
• NASA fvGCM 5-day forecast shows vast improvement in accuracy of track, landfall, and intensity over operational prediction in this case
• Uses data from operational satellites, SSM-I, TRMM and QuickSCAT

17
NASA’s Heritage of HurricaneResearch Field Programs
• Joint partnership with NOAA HRD• Blending of in situ and satellite data sets• Improved parameterization of models• Data assimilation to improve models• Technology testbed (i.e. ER-2 dropsonde, Aerosonde)
CAMEX-3•Inner core dynamics•Synoptic flow environment•Landfalling intensity change•Genesis environment
CAMEX-4•Rapid intensification•Storm movement•Structure and dynamics•Scale interactions•Remote sensing techniques
TCSP•Genesis in EPAC, GOMEX, ATL•Rapid intensification•Easterly wave dynamics•Satellite cal/val

18 AMSR-E
PrecipitationRadar
LightningImaging SensorMODIS
TRMMMicrowaveImager
ER-2 Doppler Radar
NASA ER-2:Virtual Satellite
Tropical Cloud Systems & Processes (TCSP) - 2005
Tropical cyclogenesis Mesoscale Convective Systems Tropical Tropopause Layer dynamics Anvil cloud moisture and radiative feedbacks Adaptive/targeted observations for improved tropical cyclone prediction
QuickTime™ and aTIFF (LZW) decompressor
are needed to see this picture.
Advanced MicrowavePrecipitation Radiometer

19
MAS: MODIS Airborne Simulator
tcsp.msfc.nasa.gov

20 trmm.gsfc.nasa.gov
TRMM: Near-Real Time Vertical Rain Structure in Tropical Cyclones
TRMM (ongoing now for 7+ years) provides highly detailed horizontal and vertical structure of rainfall inside tropical cyclonesUsed operationally to identify eye location, especially when obscured by cloudEarly detection of tall cloud towers which are associated w/ rapid intensification
21
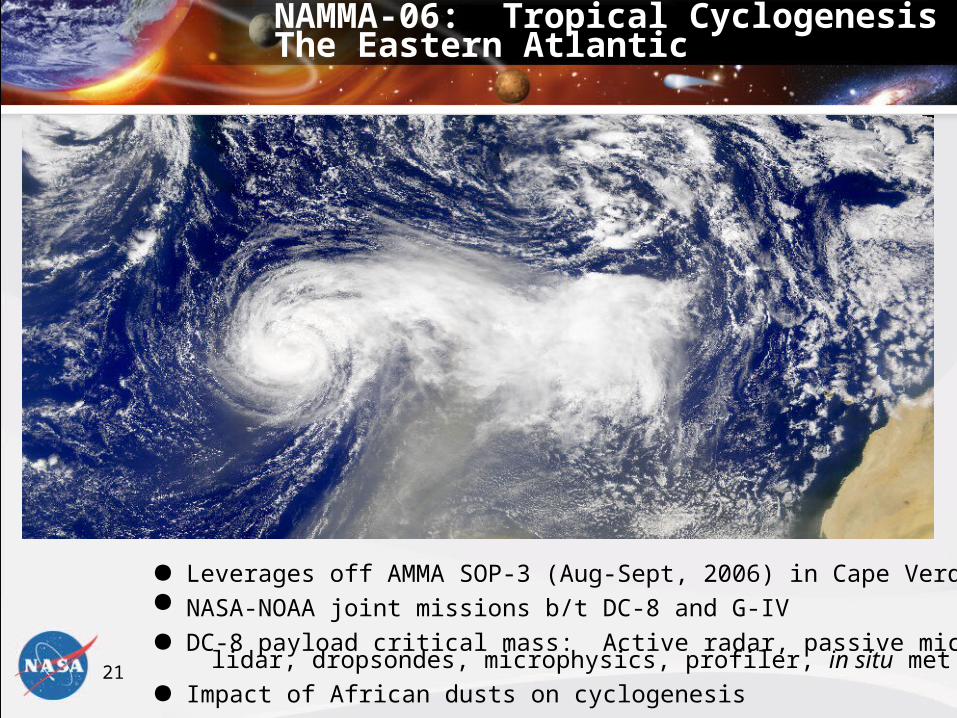
Leverages off AMMA SOP-3 (Aug-Sept, 2006) in Cape Verde NASA-NOAA joint missions b/t DC-8 and G-IV
DC-8 payload critical mass: Active radar, passive microwave, lidar, dropsondes, microphysics, profiler, in situ met obs
Impact of African dusts on cyclogenesis
NAMMA-06: Tropical Cyclogenesis inThe Eastern Atlantic

22
TRMM-Based Multi-satellite Precipitation Analysis
Timely, accurate, fine-scale rainfall estimate for a variety of global applicationsNear-real time, 3-hourly rainfall estimates at 0.25º grid spacing from 50° N to 50° STRMM is the calibrator of a combined microwave/IR sensor web (SSM/I, AMSR, AMSU)Automatic identification of potential flood regions on timescales of 1-, 3- and 7 daysUtilized by NOAA NESDIS, CPC and international agencies i.e. UN and Australian BMRCThe MPA sensor web is a precursor to the Global Precipitation Mission (GPM)
trmm.gsfc.nasa.gov
23
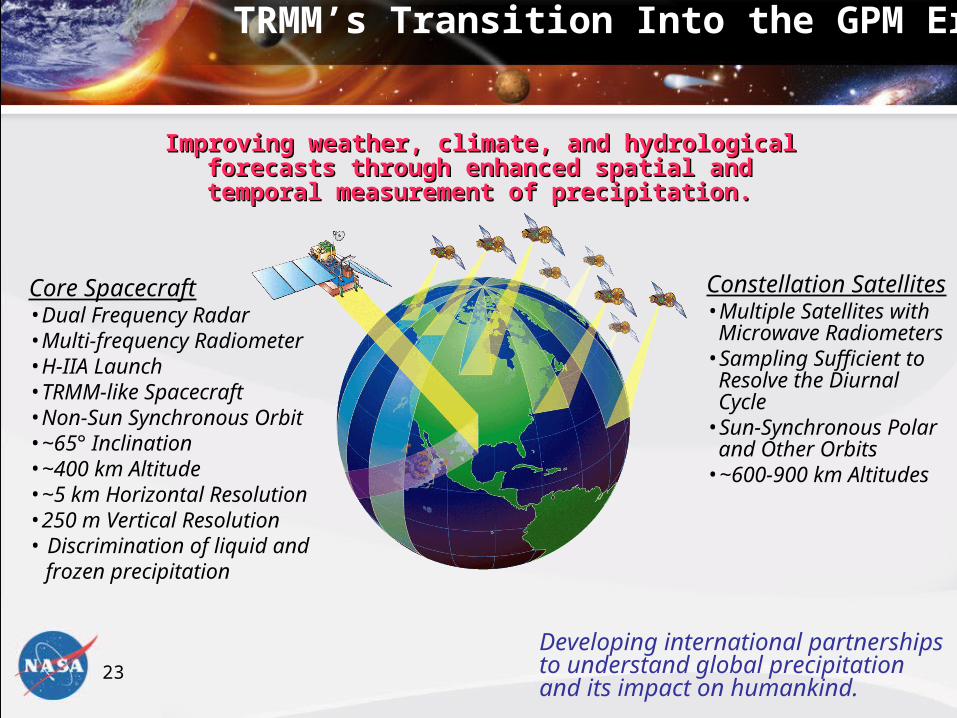
TRMM’s Transition Into the GPM Era
Improving weather, climate, and hydrological forecasts Improving weather, climate, and hydrological forecasts through enhanced spatial and temporal measurement of through enhanced spatial and temporal measurement of
precipitation.precipitation.
Core Spacecraft•Dual Frequency Radar•Multi-frequency Radiometer
•H-IIA Launch•TRMM-like Spacecraft•Non-Sun Synchronous Orbit
•~65° Inclination•~400 km Altitude•~5 km Horizontal Resolution
•250 m Vertical Resolution
• Discrimination of liquid and
frozen precipitation
Constellation Satellites
•Multiple Satellites with Microwave Radiometers
•Sampling Sufficient to Resolve the Diurnal Cycle
•Sun-Synchronous Polar and Other Orbits
•~600-900 km Altitudes
Developing international partnershipsto understand global precipitationand its impact on humankind.

24
Summary
New science instruments developed by NASA are precursors to the development of operational satellite instrumentation. Technology for new needed space-based observations can only be developed and flight-proven by NASA.
Research by NASA scientists on how to use new space-based observations is essential element for demonstrating utility and leading to their operational use. Without this research, most satellite observations would not be used effectively.
NASA observations and their use by operational agencies has and continues to save human lives and mitigate economic losses.
Components of the NASA global cloud-resolving model being developed for weather and climate will be directly applicable to the atmospheres of other planets like MARS, and will provide a unique weather prediction capability that is required for the safety of astronauts and assets on these planets.

![Note: This sheet is applicable for uploading the ... · RAJESH SITARAM KAKAR SITARAM KAKAR 10-A, NIDHIVAN NR HOL-INN,, UMRA [N], ATHWA LINES,, , SURAT GUJARAT INDIAINDIA Gujarat Surat](https://img.pdfslide.us/doc/110x75/5e5f5ef67de8a313be4065e2/note-this-sheet-is-applicable-for-uploading-the-rajesh-sitaram-kakar-sitaram.jpg)