Embed Size (px)
Citation preview
USGSscience for a changing world
Comparison of Water-Quality Samples Collected by Siphon Samplers and Automatic Samplers in WisconsinIntroduction
In small streams, flow and water-quality concentrations often change quickly in response to meteorological events. Hydrologists, field technicians, or locally hired stream ob servers involved in water-data collection are often unable to reach streams quickly enough to observe or measure these rapid changes. Therefore, in hydrologic studies designed to describe changes in water quality, a combination of manual and automated sampling methods have commonly been used manual methods when flow is relatively stable and automated methods when flow is rapidly changing. Auto mated sampling, which makes use of equipment programmed to collect samples in response to changes in stage and flow of a stream, has been shown to be an effective method of sampling to describe the rapid changes in water quality (Graczyk and others, 1993). Because of the high cost of automated sampling, however, especially for studies exam ining a large number of sites, alternative methods have been considered for collecting samples during rapidly changing stream conditions. One such method employs the siphon sampler (fig. 1). also referred to as the "single-stage sam pler." Siphon samplers are inexpensive to build (about $25- $50 per sampler), operate, and maintain, so they are cost effective to use at a large number of sites. Their ability to collect samples representing the average quality of water passing though the entire cross section of a stream, however, has not been fully demonstrated for many types of stream sites.
The Inter-Agency Committee on Water Resources, Sub committee on Sedimentation (ICWR-SS) developed and tested siphon samplers under laboratory conditions and con cluded that siphon samplers are able to collect a sample representative of near-surface water quality during rising stages. ICWR-SS (1961) developed several models of sam plers to collect representative samples for distinct ranges of stream velocity, water-surface surge, water temperature, and sediment size. The study concluded that siphon samplers are useful when sediment concentrations near the water surface are of value and sampling by other, possibly more accurate methods is not practical or feasible. Edwards and Glysson (1988) outlined some of the limitations of siphon samplers. The primary limitation was that, because samples are col lected near the water surface at one point in the stream, adjustments may be needed to describe the vertical and horizontal distributions in water quality, especially if the stream transports large sand-size particles. This is also a limitation for automatic samplers because automatic sam-
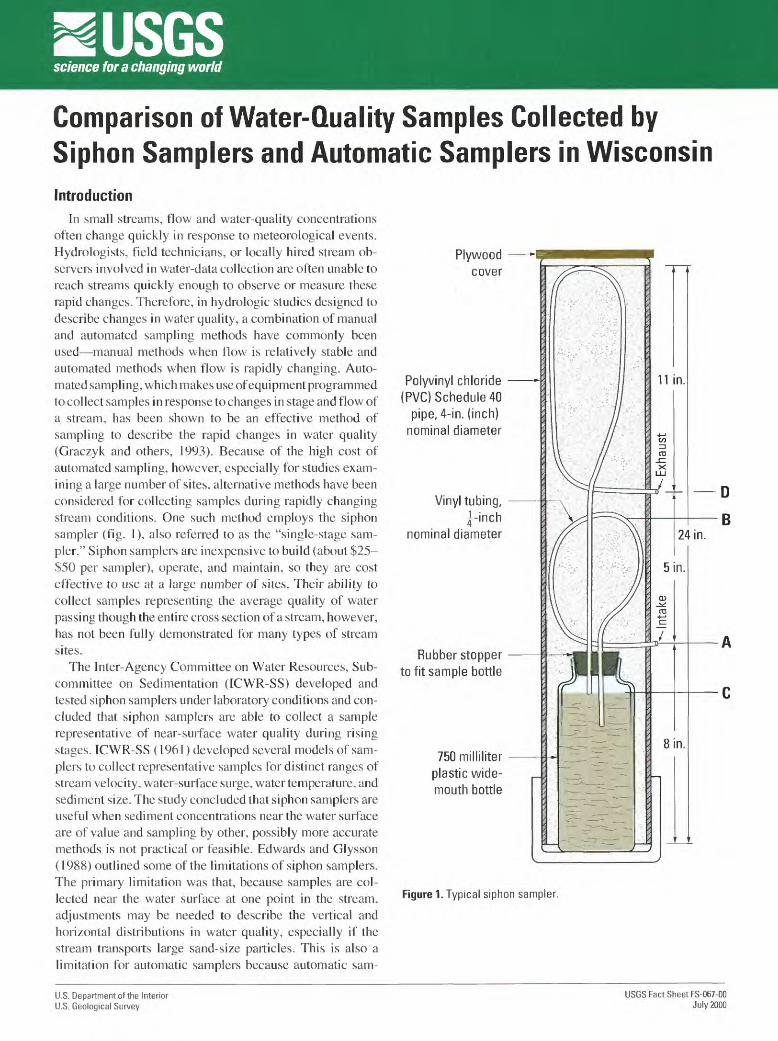
Plywood cover
Polyvinyl chloride(PVC) Schedule 40
pipe, 4-in. (inch)nominal diameter
Vinyl tubing,1-inch
nominal diameter
Rubber stopper to fit sample bottle
750 milliliter plastic wide- mouth bottle
Figure 1. Typical siphon sampler.
U.S. Department of the Interior U.S. Geological Survey
USGS Fact Sheet FS-067-00 July 2000
piers collect a sample at a fixed horizontal and vertical location in the stream cross section.
The U.S. Geological Survey (USGS) and Wisconsin Depart ment of Natural Resources (WDNR) are currently monitor ing the water quality of several streams with a combination of manual and automated sampling methods. Future studies are aimed at describing changes in water quality at many sites; therefore, siphon samplers are being con sidered as a means to augment manual sampling and minimize sampling costs. Siphon samplershave had limited use in Wisconsin but have not been thor oughly tested to determine their ability to collect representa tive samples in Wisconsin streams. This fact sheet describes how successfully siphon samplers can be used to collect representative samples at selected stream sites in Wisconsin. Concentrations of suspended sediment, total phosphorus, and ammonia nitrogen in samples collected by siphon sam plers in three streams in southwestern Wisconsin are com pared with those collected with the more thoroughly inves tigated stage-change-activated automated samplers (Krug andGoddard, 1986).
Siphon-Sampler Design and OperationThe design of the siphon sampler used in this study is
similar to that described by the ICWR-SS (1961) and by Edwards and Glysson (1988) and shown in figure 1. The operation of a siphon sampler during an event with increased stage and flow is simple. As the stream stage rises to the elevation of the intake level A (fig. 1), water enters the 1/4- inch-diameter plastic tube. As the stream continues to rise, water continues to move up the intake tube until the stream
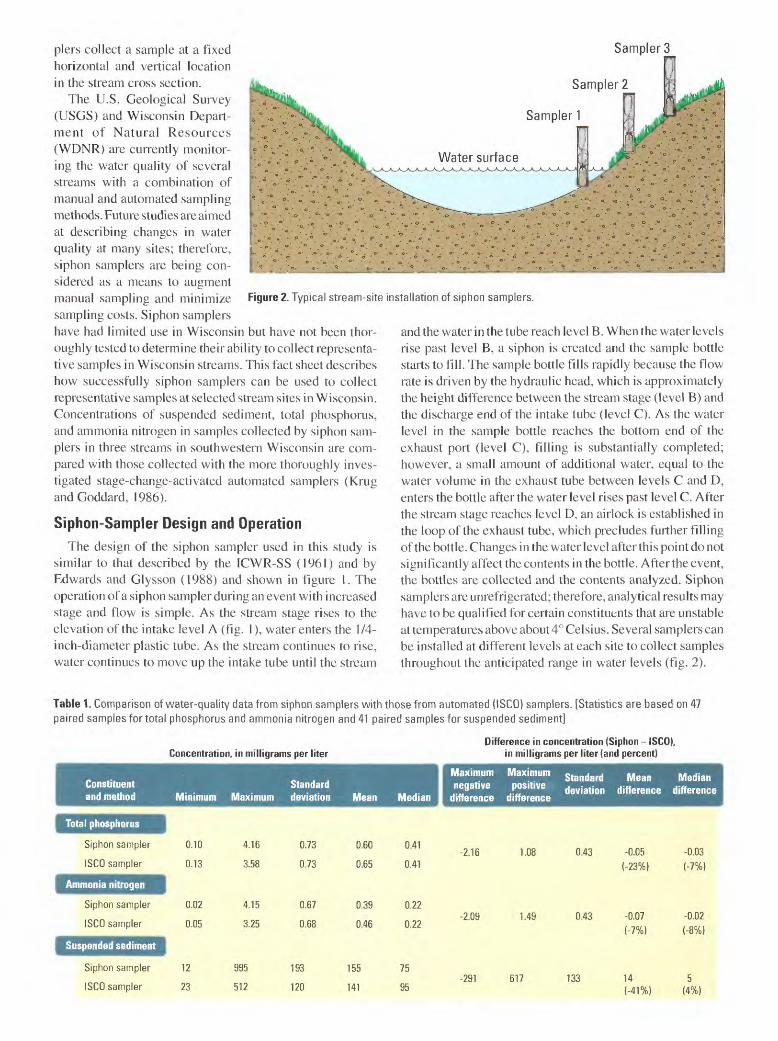
Samplers
Sampler 1
Sampler 2
Figure 2. Typical stream-site installation of siphon samplers.
and the water in the tube reach level B. When the water levels rise past level B, a siphon is created and the sample bottle starts to fill. The sample bottle fills rapidly because the flow rate is driven by the hydraulic head, which is approximately the height difference between the stream stage (level B) and the discharge end of the intake tube (level C). As the water level in the sample bottle reaches the bottom end of the exhaust port (level C), filling is substantially completed; however, a small amount of additional water, equal to the water volume in the exhaust tube between levels C and D, enters the bottle after the water level rises past level C. After the stream stage reaches level D, an airlock is established in the loop of the exhaust tube, which precludes further filling of the bottle. Changes in the water level after this point do not significantly affect the contents in the bottle. After the event, the bottles are collected and the contents analyzed. Siphon samplers are unrefrigerated; therefore, analytical results may have to be qualified for certain constituents that are unstable at temperatures above about 4° Celsius. Several samplers can be installed at different levels at each site to collect samples throughout the anticipated range in water levels (fig. 2).
Table 1. Comparison of water-quality data from siphon samplers with those from automated (ISCO) samplers. [Statistics are based on 47 paired samples fortotal phosphorus and ammonia nitrogen and 41 paired samples for suspended sediment]
Concentration, in milligrams per literDifference in concentration (Siphon - ISCO),
in milligrams per liter (and percent)
Constituent and method
Total phosphorus
Siphon sampler
ISCO sampler
Ammonia nitrogen
Siphon sampler
ISCO sampler
Suspended sediment
Siphon sampler
ISCO sampler
^^^^^^^^^^ Standard I negative positive Minimum Maximum deviation Mean Median I difference difference
0.10
0.13
0.02
0.05
12
23
SlaodatA Mean Merfjan deviation <««e«*nce difference
4.16
3.58
4.15
3.25
0.73
0.73
0.67
0.68
0.60
0.65
0.39
0.46
995
512
193
120
155
141
0.41
0.41
0.22
0.22
75
95
-2.16
-2.09
-291
1.08
1.49
0.43
0.43
617 133
-0.05 (-23%)
-0.07
(-7%)
14 (-41%)
-0.03
(-7%)
-0.02 (-8%)
5 (4%)

1,000
0 0.5 1.0 1.5 2.0 2.5 3.0 3.5 4.0 4.5
4.5
4.0
3.5
3.0
2.5
2.0
1.5
1.0
0.5
0
1 ' I ' ' ''I ' ' ' ' I ' ' ' 'I ' ' ' ' I ' ' ' ' I ' ' ' I ' '' ' I ' ' 'X
'- Total phosphorus
0 0.5 1.0 1.5 2.0 2.5 3.0 3.5 4.0 4.5
CONCENTRATION, IN MILLIGRAMS PER LITER, IN SAMPLES COLLECTED BY ISCO SAMPLER
Figure 3. Concentrations of suspended sediment and chemical constituents in samples collected by the siphon sampler and ISCO sampler.
Sampling SitesSiphon samplers were installed at three sites near USGS
offices in Middleton, Wis.: North Fork of Pheasant Branch Creek (North Fork) and Pheasant Branch Creek at Highway 1 2 (Pheasant Branch), which are perennial streams; and South Fork of Pheasant Branch Creek (South Fork), an ephemeral stream. A USGS streamflow-gaging station was operational at each site, along with an automated water-quality sampler (ISCO) programmed to collect samples during runoff events. The drainage area above the North Fork site, 9.8 mi2 (square miles), is primarily agricultural, whereas the drainage area above the South Fork site (5.7 mi2) is predominantly urban. The drainage area above Pheasant Branch (18.3 mi 2), which is downstream from both the North and South Forks, encom passes both agriculture and urban development. Historical data from samples collected at Pheasant Branch indicate that most suspended-sediment particles were silt- and clay-sized (par ticles < 0.062 millimeters).
At each site, siphon samplers were installed at three distinct elevations to sample different stages and times during an episode of increasing streamflow (fig. 2). The samplers were placed so that the first sample would be collected when the water stage rose approximately 0.2 feet. The second sample would be collected approximately 0.3-0.5 feet above where the first sample was collected, and the third sample would be collected 0.4-0.6 feet above where the second was collected. A fence post was driven into the stream bottom, and each siphon sampler was attached to the post by a large hose clamp. The intake nozzles of the samplers were oriented perpendicular to the direction of streamflow to minimize the likelihood of the nozzles being clogged with sediment or debris. The automated ISCO samplers at each site were programmed to collect discrete samples at the stages and times similar to those for the siphon samplers.
Samples were removed from both the automated refrigerated samplers and siphon samplers as soon as possible after each runoff event and preserved by either chilling (for suspended- sediment analyses) or chilling and acidifying (for total phos phorus and ammonia nitrogen analyses). After sample removal, each sampler was cleaned by flushing the intakes with streamwater and distilled water. Suspended-sediment analyses were done by the USGS sediment laboratory in Iowa City, Iowa, and total phosphorus and ammonia nitrogen analyses were done by the Wisconsin State Laboratory of Hygiene in Madison. Wis. All samples were analyzed by use of standard methods (American Public Health Association, 1995; Guy, 1969).
Water-Quality ComparisonPairs of samples (ISCO and siphon) were collected from the
three sites over a range of flows and water-quality conditions and were aggregated into one data set for the statistical analy ses. Forty-seven pairs of samples were analyzed for total phosphorus and ammonia nitrogen and 41 pairs for suspended sediment. As is evident from table 1. constituent concentrations in the paired samples were similar, but the ranges in values were slightly smaller in the samples collected with the ISCO sam plers than in those collected with the siphon samplers.

No systematic biases are evident in the distribution of data points about the 1:1 line (the line of equal concentra tions) in the graphs shown in figure 3. The mean concentra tions of the total phosphorus and ammonia nitrogen in the 47 sample pairs were within 0.07 mg/L (milligrams per liter) of each other, although the mean percentage difference for total phosphorus was almost 23 percent. The mean concentrations of suspended sediment were within 14 mg/L of each other, with a mean percentage difference of 41 percent. Differences between medians were even smaller. The median total phos phorus and ammonia nitrogen concentrations were identical, with the median percentage difference about 8 percent. The median difference in suspended-sediment concentrations was 5 mg/L and the median percentage difference was 4 percent.
A nonparametric Wilcoxon signed-rank test (Conover, 1980) applied to the data indicated no statistically significant differences in the constituent concentrations between the samples collected by the two types of samplers. The null hypotheses of the tests performed were that there were no differences between the constituent concentrations using either sampler. At the 5-percent significance level (P < 0.05), there were no statistically significant differences found in concentrations between the sampling methods for any of the constituents. Therefore the null hypotheses were not rejected.
In general, the constituent concentrations of samples collected with automated samplers (ISCO) have been shown to be similar to those of manually collected, cross-section- ally integrated water-quality samples (Krug and Goddard, 1986). Therefore, the similarity found in the means and medians for each of the three water-quality constituents indicates that siphon samplers also collect representative water samples over the range of sampled flow conditions for the type of streams examined. It follows that samples col lected with siphon samplers typically should have about the same accuracy (bias) as automated samplers; however, indi vidual measurements may be less precise (as seen in the variance around the 1:1 lines in fig. 3). Part of the scatter around the 1:1 line of equal concentrations may have re sulted from the pair of samples not being collected exactly at the same time and, therefore, may have been samples of water of different concentrations. Additional work is needed to determine if this variability between data sets is caused by sampler performance or by slight differences in sample- collection timing.
Use of trade names in this report is for identification purposes only and does not constitute endorsement by the U.S. Geological Survey.
Information
ConclusionsSiphon samplers are low-cost alternatives to automatic
samplers that have been traditionally used to collect represen tative water-quality samples. Siphon samplers can be used to augment manual sampling of "flashy" streams and remote streams by collecting samples during rapidly increasing stream stage a generally impractical condition to be sampled ad equately with a manual sampling program. Siphon samplers would also be a cost-effective alternative to automatic sam plers if samples need to be collected at numerous sites. Siphon samplers do not collect water samples when the stream stage is decreasing; therefore, manual samples still need to be collected during this period. Decreases in stage, however, are generally more protracted than increases in stage and com monly can be manually sampled by a field person dispatched at the beginning of the event. Additional studies may help to determine the reason for the variability between individual constituent concentrations of samples collected with an auto mated sampler and the siphon sampler as demonstrated by the scatter around the 1:1 lines in figure 3.
References
American Public Health Association, 1995, Standard meth ods for examination of water and wastewater (19th ed.): Washington, D.C. variously paged.
Conover. W.J.. 1980, Practical Nonparametric Statistics, Second Edition: John Wiley and Sons, New York, 493 p.
Edwards, T.K., and Glysson, G.D., 1988, Field methods for measurement of fluvial sediment: U.S. Geological Survey Open-File Report 86-531, 118 p.
Inter-Agency Committee on Water Resources, Subcommit tee on Sedimentation, 1961, The single-stage sampler for suspended sediment: Minneapolis, Minnesota, St. Anthony Falls Hydraulics Laboratory, Report 13, 105 p.
Graczyk, D.J., Walker, J.F., Greb, S.R., and Owens, D.W., 1993, Evaluation of non-point contamination, Wisconsin- Selected data for 1992 water year: U.S. Geological Survey Open-File Report 93-630, 48 p.
Guy, H.P., 1969, Laboratory theory and methods for sediment analysis: U. S. Geological Survey Techniques of Water- Resources Investigations; book 5. chap. Cl, 58 p.
Krug. W. R.. and Goddard, G. L., 1986, Effects of urbaniza tion on streamflow, sediment loads, and chemical morphol ogy in Pheasant Branch Basin near Middleton, Wisconsin: U.S. Geological Survey Water-Resources Investigations Report 85-4068, 82 p.
For information on USGS programs in Wisconsin, contact: District Chief U.S. Geological Survey 8505 Research Way Middleton, Wl 53562 (608)828-9901 http://wi.water.usgs.gov/
Authors: David J. Graczyk, Dale M. Robertson, William J. Rose and Jeffrey J. Steuer
Layout and illustrations: Michelle Greenwood and Aaron Konkol
^R Printed on recycled paper