Embed Size (px)
Citation preview
DOCUMENTATION REPORT
Science ASSISTments: Creation of Engaging Visual Objects for Microworlds
An Interactive Qualifying Project Report
Submitted to the Faculty
of the
Worcester Polytechnic Institute
In partial fulfillment of the requirements for the
Degree of Bachelor of Science
By:
_________________________________________
David Embree
June 2, 2009
Approved By:
___________________________
Professor Janice Gobert
This report represents the work of one or more WPI undergraduate students submitted to the faculty as
evidence of completion of a degree requirement. WPI routinely publishes these reports on its web site
without editorial or peer review
2 | P a g e
Abstract
This document describes programming effort and instructional documentation contributing to
the goals of the Science ASSISTments project. An existing spreadsheet containing past MCAS test
question numbers was updated with an improved system for viewing the questions in the ASSISTments
server. New graphics for a Microworld under development were created, and a detailed tutorial was
written to assist future efforts in visual object construction.
Table of Contents
1.0.0 Introduction 3
2.0.0 My Role in the Project 6
2.1.0 MCAS Problem Classification 6
2.2.0 Development of Visual Objects 6
3.0.0 Materials Development 7
3.1.0 MCAS Problem Classification 7
3.2.0 Development of Visual Objects 10
3.3.0 Expected Pedagogical Utilization 12
3.3.1 Strand 1: Hypothesizing and Forming Predictions 12
3.3.2 Strand 2: Designing and Conducting Experiments 12
3.3.3 Strand 3: Representing and Analyzing Data 13
3.3.4 Strand 4: Abstraction and Mathematical Modeling 14
3.3.5 Strand 5: Communicating and Defending Ideas 14
3.4.0 Documentation for Future Development of Microworlds 15
3.5.0 Concluding Remarks 15
Appendix A - Documentation for Future Development of Microworlds 16
References 25
3 | P a g e
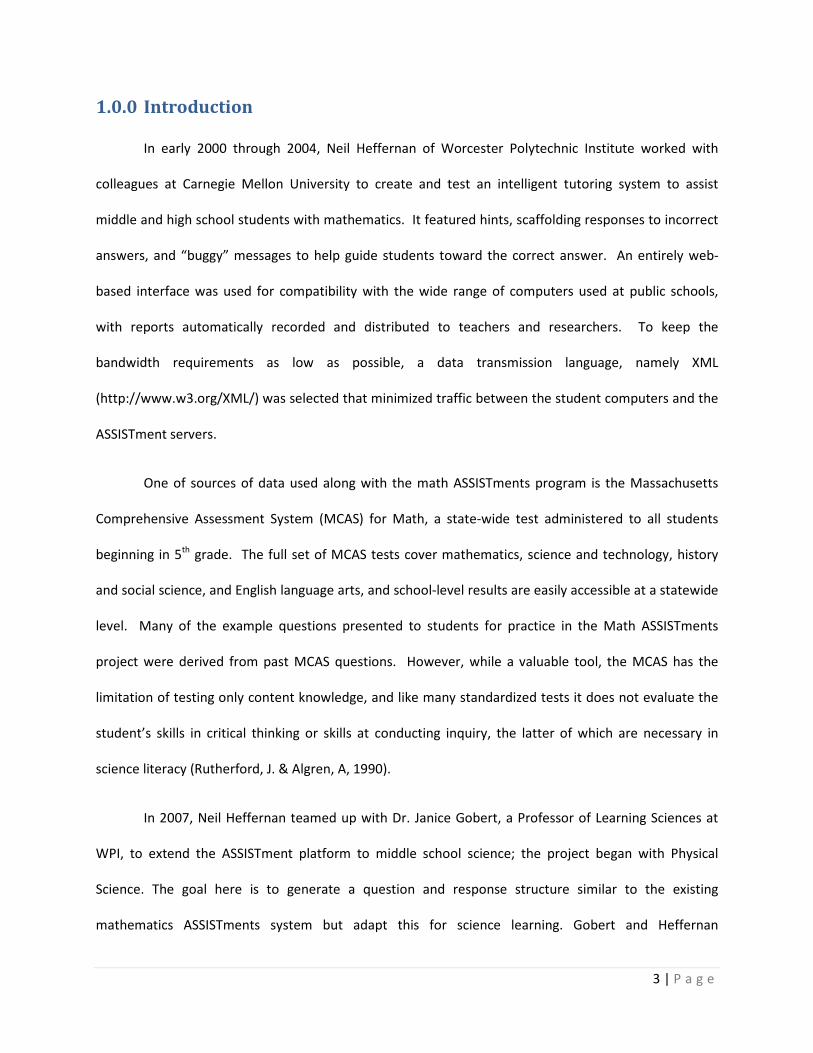
1.0.0 Introduction
In early 2000 through 2004, Neil Heffernan of Worcester Polytechnic Institute worked with
colleagues at Carnegie Mellon University to create and test an intelligent tutoring system to assist
middle and high school students with mathematics. It featured hints, scaffolding responses to incorrect
answers, and “buggy” messages to help guide students toward the correct answer. An entirely web-
based interface was used for compatibility with the wide range of computers used at public schools,
with reports automatically recorded and distributed to teachers and researchers. To keep the
bandwidth requirements as low as possible, a data transmission language, namely XML
(http://www.w3.org/XML/) was selected that minimized traffic between the student computers and the
ASSISTment servers.
One of sources of data used along with the math ASSISTments program is the Massachusetts
Comprehensive Assessment System (MCAS) for Math, a state-wide test administered to all students
beginning in 5th grade. The full set of MCAS tests cover mathematics, science and technology, history
and social science, and English language arts, and school-level results are easily accessible at a statewide
level. Many of the example questions presented to students for practice in the Math ASSISTments
project were derived from past MCAS questions. However, while a valuable tool, the MCAS has the
limitation of testing only content knowledge, and like many standardized tests it does not evaluate the
student’s skills in critical thinking or skills at conducting inquiry, the latter of which are necessary in
science literacy (Rutherford, J. & Algren, A, 1990).
In 2007, Neil Heffernan teamed up with Dr. Janice Gobert, a Professor of Learning Sciences at
WPI, to extend the ASSISTment platform to middle school science; the project began with Physical
Science. The goal here is to generate a question and response structure similar to the existing
mathematics ASSISTments system but adapt this for science learning. Gobert and Heffernan
4 | P a g e
acknowledged that learning science had a critically different ingredient compared to Math, namely,
inquiry. Thus, the system requires the development of interactive microworlds so that students can
conduct scientific inquiry. Regarding inquiry, students need to learn how to formulate a meaningful
question, propose a possible solution, develop and conduct an experiment, and determine what the
results mean in relation to their question (National Research Council, 1996). Thus, the focus of the
tutoring system in Science ASSISTments is to focus primarily on teaching inquiry skills, rather than simply
covering science content.
Working with graduate and undergraduate students, Dr. Gobert successfully created a simple
physics simulation, i.e., the ramp environment, in which students could test ideas, record data, and
respond with their conclusions (cf. Gobert, J., Beck, J., Sao Pedro, M., Heffernan, N., & Richardson, J.,
2008). The ramp environment consists of a pair of ramps on which balls roll, and the student chooses
from a variety of different options, i.e., variables, such as ramp steepness, run length, ramp surface, and
ball type. Students are allowed to change as many of the variables listed above as they wish at first, but
the system gradually guides them to implement an experiment using the “control for variables” strategy,
namely, keeping all variables constant while manipulating only one. Initial pilot testing was conducted
in a set of middle school classes; some items were revised and then data were collected with an
additional set of 5 classes using the ASSISTments system. The results of this study and others were
promising regarding the efficacy of teaching students inquiry strategies (cf. Gobert, J., Beck, J., Sao
Pedro, M., Heffernan, N., & Richardson, J., 2008). Subsequent to this study, Dr. Gobert was awarded an
additional research grant to expand the project from Physical Science to additional domains of the
middle school science curriculum, namely Life Science and Earth Science (Gobert, Heffernan, Koedinger,
& Beck, 2009).
5 | P a g e
While inquiry instruction and assessment remain the primary focus of the Science ASSISTments
project, the science topics of study can and are being used to reinforce material tested by the MCAS.
The MCAS Science and Technology portion is divided into a variety of subcategories, depending on the
grade level of the individual exam. Fifth through eighth grade level exams each have the categories
Earth and Space Science, Life Science, Physical Science, and Technology/Engineering. The high school
level exams have similar topics, but with a much higher level of detail. The origin of these topics is the
Massachusetts Curricular Framework (MCF henceforth), a state sanctioned document that outlines all
the content knowledge students should possess by the time they graduate high school. While this is a
noble goal, many students only learn how to memorize facts and procedures, and do not learn how to
use their knowledge to solve new problems. This issue extends all the way up to the national level, with
the National Science Education Standards (NSES), from which the MCF inherited some of its science
curriculum.
This issue has not gone without notice; many people have voiced concerns and proposed
additions to the NSES to address the issue of scientific inquiry in the classroom. The trouble is that
inquiry is very difficult to quantify and evaluate in an affordable manner in public schools. Current
recognized tests for inquiry utilize short answer responses or a report (cf., Gotwals & Songer), which
must be individually hand graded by scientific education professionals for accurate results. Even more
accurate assessment can be accomplished with a hands-on experiment, since all aspects of the student’s
skills can be observed (Baxter and Shavelson, 1994; Ruiz-Primo and Shavelson, 1996).Unfortunately,
these exams are prohibitively expensive, and tend to be non-standardized. The Science ASSISTments
project is an attempt to solve this dilemma using a virtual environment in which students are provided
rich interactive Microworlds to experiment with, while the system records their actions; these tasks
serve as performance assessments of student’s inquiry skills. Given combinations of variable selections,
they can set up and run trials, gather data, and make conclusions. Carefully designed algorithms will
6 | P a g e
then be developed to analyze students’ strategies and in turn will suggest alternatives to hone their
inquiry strategies with the goal of both supporting student’ acquisition of content knowledge and
inquiry skills. Assessment results regarding students’ inquiry skills are sent to teachers, and any students
having trouble will be flagged and will receive individualized help within the ASSISTments system and,
hopefully by the teacher as well.
2.0.0 My roles in the project
2.1.0 Classification of past items on the Mass. Curricular Framework
Since the MCAS exam is a very important part of the evaluation process, questions issued from
Mass. Dept. of Education from previous exams are excellent practice for the students. Hundreds of
questions have been entered into the ASSISTments system, and a detailed list of them has been created
in a Google Doc spreadsheet by students under the direction of Cristina Heffernan, a project manager
for the ASSISTments project. Some very basic information about the question was included in this
matrix, but it did not allow for easy browsing of questions by topic. Since all of the questions are
derived from the MCF, I was charged with creating a classification system for the problems out of the
MCF itself, so that problems matching particular requirements could be easily queried. This feature is
important to future analyses by the Science ASSISTments team so that they may easily select and
aggregate items to test for transfer of knowledge from what they learned in the Science ASSISTment
system to the content being evaluated by the MCAS science test.
2.2.0 Development of Graphical Elements for the Phase Change Microworld
Dr. Gobert’s Ph.D. student Mike Sao Pedro and Masters student, Nate Krach, spearheaded the
technical aspects and general design parameters of the Phase Change Microworld. Mike’s previous
experience with the design of the ramp microworld provided an excellent starting point for the
7 | P a g e
application structure of the phase change microworld. As the science behind the Phase Change
Microworld was a bit more complex than the ramp microworld, Nate focused on developing the
necessary equations and the overall flow of the pedagogical structure. It was my duty to translate
Nate’s designs into graphics that responded to Mike’s programming system. I also wrote a document
describing in great detail the process of creating objects in Laszlo, which will be used in all future
microworlds constructed for this project.
3.0.0 Materials Development
3.1.0 MCAS Problem classification
As mentioned before, the MCAS exam questions from previous years are available freely on the
official MCAS website (http://www.doe.mass.edu/mcas/). So far, the last five years of exam questions
are entered into the Science ASSISTments question database, in both the fifth and eighth grade
categories. Unfortunately, these questions are only identified by a number in the database, which
makes it relatively useless to search through when looking for a particular problem. To help organize
the problems within the database, an online spreadsheet was created to associate each problem’s
ASSISTment number with a variety of other associated data; namely the problem’s answer, the testing
year it belonged to, the original problem number within the year’s set, and the subject matter of the
problem.
While the MCAS website was a little more useful than randomly opening and looking through a
list of numbers, it still required users to look for a number on a page with over 200 problem numbers
listed. In page searching (ctrl+f in most browsers) helps of course, but still takes extra time and effort.
Ideally, users should be able to view the question content on the spreadsheet in a little popup next to
each number, but the programming functions were not available to accomplish this. The next best thing
8 | P a g e
was to have a link that opens a new webpage with a preview of the problem. This was implemented
using the GoogleDocs built in function hyperlink(link_address, display_text). Fortuitously, the preview
address for any problem in the ASSISTments system begins with the same address, and only the ending
number distinguishes one problem from another. By concatenating this string with the value of problem
number column in the spreadsheet, it was very easy to add a new column next to the problem numbers
with a working link to the problem. The final result is that viewing a problem whose number you see on
the spreadsheet requires holding the “ctrl” key and clicking the “view” link next to the problem, rather
than navigating for upwards of 30 or more seconds on the ASSISTments problem listings page.
While this is a marked improvement, it still does not differentiate problems; in the near future
researchers and programmers will need to find problems relating to very specific science content, and
the current basic topics associated with each problem are much too varied to be useful. The
Massachusetts Curricular Framework (MCF) governs the content for all problems in the MCAS exam, and
thus is the perfect problem classification system, complete with detailed descriptions for each
requirement. The MCF for grades 6-8 is divided into 4 main topics, each with a varying number of
branching subcategories. The complete framework documentation is longer than this report, but can
easily be viewed in PDF and Word doc format at http://www.doe.mass.edu/frameworks/current.html.
To make these standards useful to the spreadsheet, each standard was assigned a code. The
first set of character in the code signified to which of the four primary topics the standard belonged;
PS = Physical Science, ESS = Earth and Space Science, LS = Life Science, and ET = Engineering/Technology.
Each subcategory within these primary topics is assigned a number, and so are naturally the next two
characters in the code. The last single character exists in case the subcategory needs to be further
subdivided; this occurs almost exclusively for the Engineering/Technology topic. Once I had established
the coding system, I began assigning a code to each problem to classify it within the MCF.
9 | P a g e
� Question #29436:
o Ms. Bristol measured the mass of a closed beaker containing several ice cubes. The mass
was 100 g. An hour later after the ice cubes had melted, Ms. Bristol measured the mass of
the beaker again. What was the mass of the beaker of water the second time?
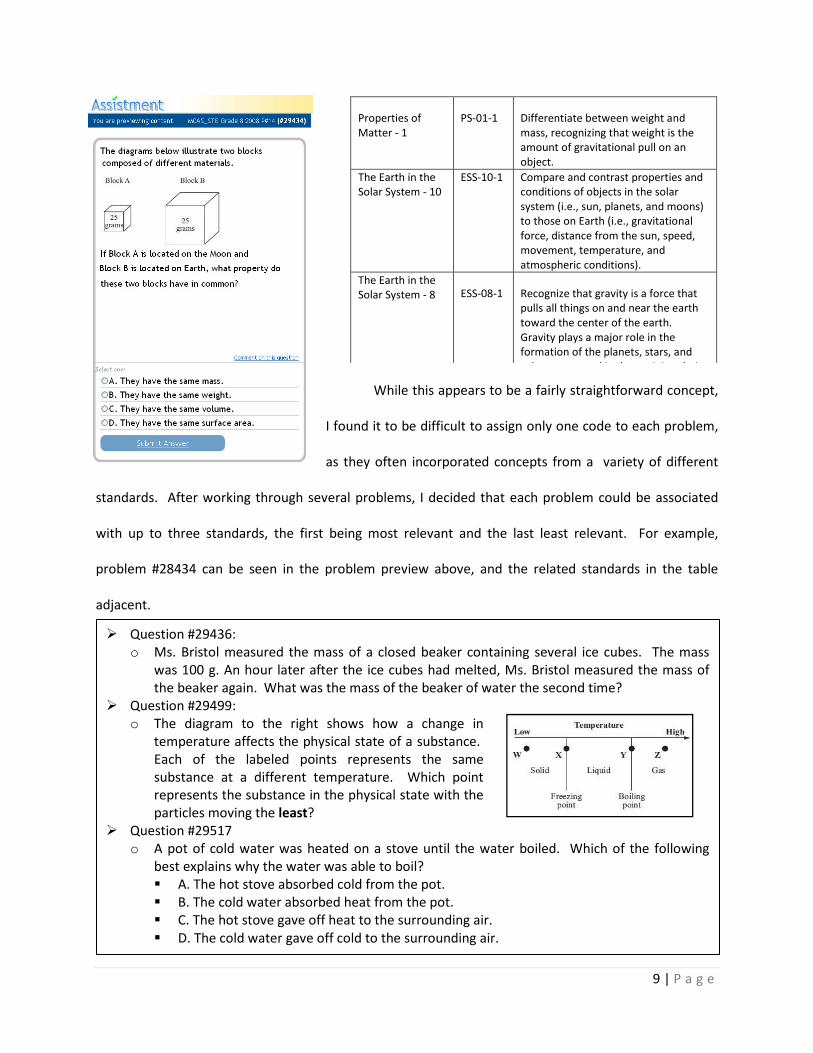
� Question #29499:
o The diagram to the right shows how a change in
temperature affects the physical state of a substance.
Each of the labeled points represents the same
substance at a different temperature. Which point
represents the substance in the physical state with the
particles moving the least?
� Question #29517
o A pot of cold water was heated on a stove until the water boiled. Which of the following
best explains why the water was able to boil?
� A. The hot stove absorbed cold from the pot.
� B. The cold water absorbed heat from the pot.
� C. The hot stove gave off heat to the surrounding air.
� D. The cold water gave off cold to the surrounding air.
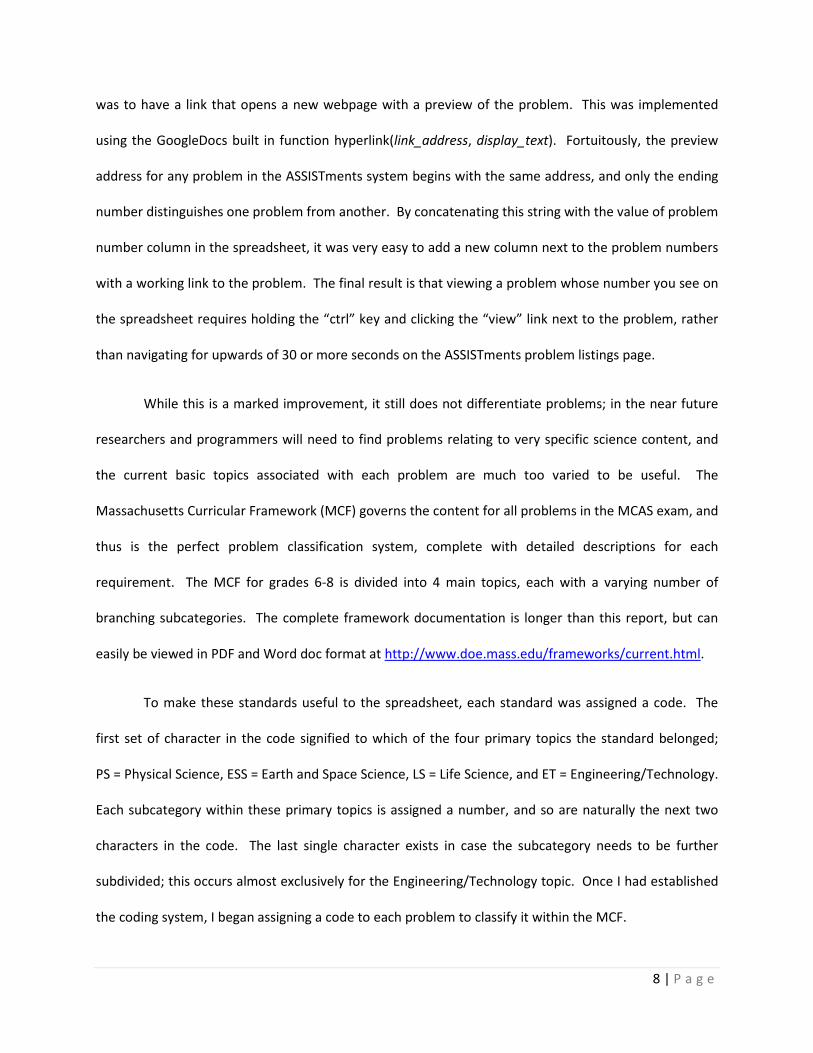
While this appears to be a fairly straightforward concept,
I found it to be difficult to assign only one code to each problem,
as they often incorporated concepts from a variety of different
standards. After working through several problems, I decided that each problem could be associated
with up to three standards, the first being most relevant and the last least relevant. For example,
problem #28434 can be seen in the problem preview above, and the related standards in the table
adjacent.
Properties of
Matter - 1
PS-01-1 Differentiate between weight and
mass, recognizing that weight is the
amount of gravitational pull on an
object.
The Earth in the
Solar System - 10
ESS-10-1 Compare and contrast properties and
conditions of objects in the solar
system (i.e., sun, planets, and moons)
to those on Earth (i.e., gravitational
force, distance from the sun, speed,
movement, temperature, and
atmospheric conditions).
The Earth in the
Solar System - 8 ESS-08-1 Recognize that gravity is a force that
pulls all things on and near the earth
toward the center of the earth.
Gravity plays a major role in the
formation of the planets, stars, and
solar system and in determining their
10 | P a g e
Once all problems have been classified with this system, researchers will be able to locate all
programs related to one or more standards very quickly. This will allow them to select a set of problems
that will be very relevant to a particular topic, specifically the content or subjects relevant to a
microworld. For example, some problems relating to the phase state of a material: (These were found
simply by checking problems listed as Physical Science from 2008). In sum, this table can be used to
easily identify assessment items that can be used to evaluate the transfer of knowledge from our
microworlds to MCAS questions.
3.2.0 Phase Change Microworld graphical development
When I began development of the graphical aspects of the phase change microworld, Mike had
a skeleton microworld for me to work with (change capitalization throughout doc—it should not be
capitalized). It had a few basic graphics for me to use as a starting point, as well as a number of
variables that controlled various physical properties such container size and amount of ice. I began by
embellishing the existing variables in both the microworld and the drawing objects so that additional
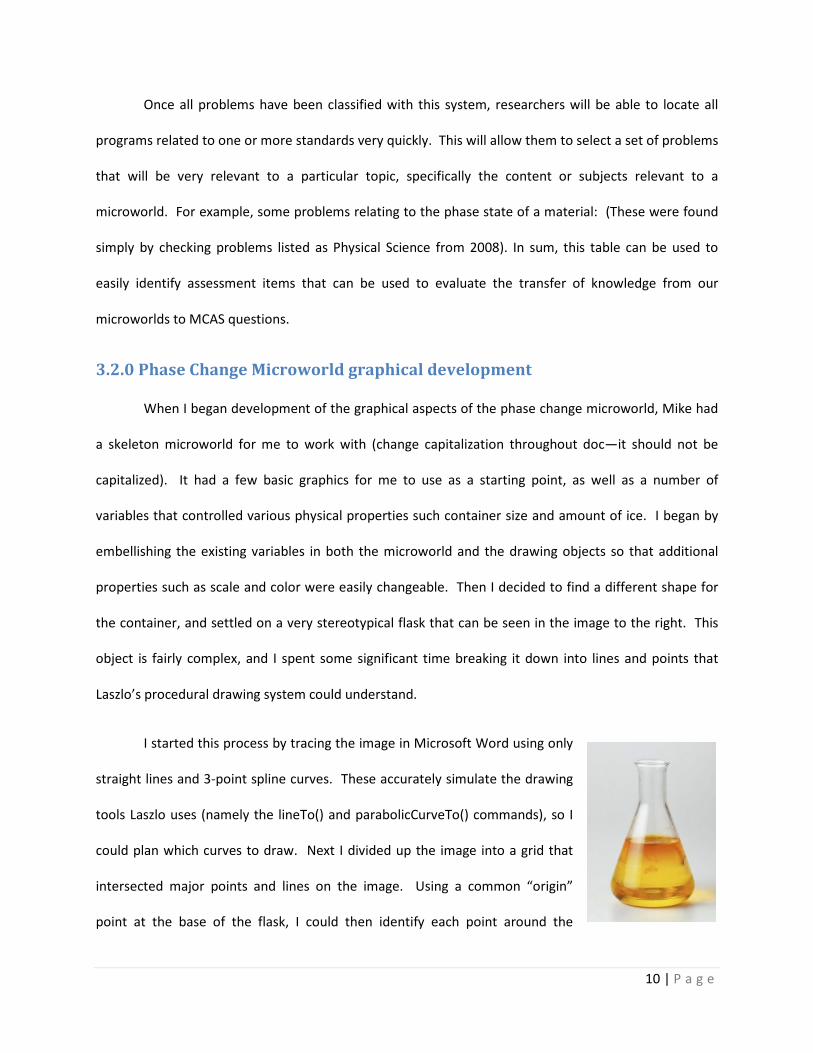
properties such as scale and color were easily changeable. Then I decided to find a different shape for
the container, and settled on a very stereotypical flask that can be seen in the image to the right. This
object is fairly complex, and I spent some significant time breaking it down into lines and points that
Laszlo’s procedural drawing system could understand.
I started this process by tracing the image in Microsoft Word using only
straight lines and 3-point spline curves. These accurately simulate the drawing
tools Laszlo uses (namely the lineTo() and parabolicCurveTo() commands), so I
could plan which curves to draw. Next I divided up the image into a grid that
intersected major points and lines on the image. Using a common “origin”
point at the base of the flask, I could then identify each point around the
11 | P a g e
perimeter like a “connect-the-dots” drawing. By using only fractional relationships between the
positions, I could scale the image by changing only the height and width variables while managing to
keep the proportions realistic. This whole procedure is detailed in the last section of this paper. While
an outline serves as a good representation of the object, additional details improve the visual appeal of
the Microworld. I added details around the lip of the flask, and created a partially transparent gradient
to give it some depth. To increase the flexibility of the shape, I also added some variables that control
the neck width and height.
The next shape I created was the ice, for which I made into a cylinder that would just fit through
the neck of the flask. While this might seem an unrealistic shape for ice to take, it greatly simplified the
animation of melting since the ice will only melt on the bottom, thus requiring only a change in the
height. Cubes floating would require more movement and complex changes in two dimensions. The
height of the ice is set by a slider the student sets before the experiment begins. Its position and width
is driven entirely by the Flask object, and additional calculations assure that the correct volume of ice is
displayed. This means that the ice height is also influenced by the width of the flask neck in relation to
the overall width. However, scaling factors have been added so that the ice volume is not impacted by
changes to the Microworld scale. As a final touch, once the ice height has been lowered all the way, the
remaining “disk” of ice is erased.
To simulate the liquid water in the flask, I created a copy of the flask object. All the lines are
identical, but have been made transparent. The purpose was to create a “container” for another
gradient, this one much more complex and animated. By adding a few extra colors near the “surface”, I
created a fairly convincing meniscus layer. Unfortunately, the gradient is linear, and looks a little
strange in a simulated 3D flask. I originally intended to use an oval gradient, but Laszlo has not fully
12 | P a g e
implemented this function and only purely circular gradients are rendered. Further work using curves
may create a more realistic liquid.
Lastly, I migrated three control sliders from the previous ball-ramp Microworld. I reassigned
their values to attributes relevant to the phase change Microworld, namely flame strength, substance
volume and container volume. I experimented with different values, and selected a range for each that
made reasonable changes to the objects. For example, I found a maximal value of ice so it went almost
to the top of the flask, and a minimal value that still filled enough of the flask to cover the base when
melted. Now that the code is integrated and working, additional controls can easily be added to control
any attribute in the Microworld.
3.3.0 Expected Pedagogical Utilization of Phase Change Microworld
National Science Education Standards have several “strands” of inquiry development. By
combining them with the Mass Curricular Frameworks for grades 6-8, we can effectively tutor both
inquiry development and scientific content. The detailed record of choices made by each student as
they design and conduct experiments provides an accurate measure of their inquiry skills. The following
sections explain in detail how each of the NSES Inquiry Strands are implemented within the Phase
Change Microworld.
3.3.1 Strand 1: Hypothesizing and Forming Predictions
In a preliminary exercise, students will be given a graph, with data points in a linear trend, and
will be asked to predict the value of the next several points. For example, they may have a temperature
versus time graph of ice as it is heated. The first couple of data points show that temperature of the ice
is steadily rising as energy as added over time. Once the temp reaches 0 degrees Celsius however, the
students will be asked if the temperature will continue to rise at the same rate, a slower rate, or remain
constant at 0 degrees until all the ice is melted. By choosing one of these options, the student has
13 | P a g e
effectively established a hypothesis that will then need to be supported or refuted by the experiment
within the microworld.
3.3.2 Strand 2: Designing and Conducting Experiments
Now that students know the overall topic, and what they are trying to prove, they need to
choose an experimental set up. This involves setting parameters such as heating strength, amount of
ice, volume of container, and so on. At first, the students can set these values to whatever they want
and run a trial of the experiment. If the hypothesis was something easy (e.g. “If I heat ice, its
temperature will rise at a constant rate until it evaporates”), then a single trial will be enough to refute
the theory. If it is more complex (e.g. “If I use different flame strengths to heat water, then the time
from complete melting to the point of boiling will be directly proportional”), many trials will be
necessary. Additionally, students will need to identify explicitly which variables are dependent, and
independent, i.e., those that need to remain constant for the experiment to be valid. If the student is
not using an appropriate Controls for Variables Strategy (CVS), the system will begin to ask prompting
questions and eventually disable controls on variables that need to remain constant for a valid
experiment.
After each trial, the student will be required to create a spreadsheet of relevant data, namely
measurements of various physical properties in the microworld. If data needs to be collected over time
during a trial, they may be prompted to setup a data recording widget. Alternatively, they could pause
the experiment at different times and manually record various data points. A variety of extraneous data
will most likely be available, and the students will need to record only the data that is relevant to their
particular hypothesis. It will be up to the student to determine when enough trials have been
completed, so that the next phase of the experiment can begin.
14 | P a g e
3.3.3 Strand 3: Representing and Analyzing Data
Once the student has completed enough trials and collected some valid data, they will need to
perform graphical and numerical analysis of their data. This could mean constructing a plot of their data
on a graph, creating a table of their data, or predicting new data. Students will be expected to recognize
trends, both visually on graphical plots and numerically by examining data. They will also be expected to
notice whether or not new data supports predictions that are based on older data, thereby supporting a
trend across trials. If their predictions or theories were incorrect, responses in open response format
will be collected in order to be able to characterize their reasoning associated with their interpretations.
3.3.4 Strand 4: Abstraction and Mathematical Modeling
Once initial observable trends are determined and it is verified that enough data has been
collected, more rigorous statistical calculations and abstract reasoning will be required. This may
involve calculating the slope of a linear trend, or comparing the trends of different trials as a variable
such as heat strength was varied.
3.3.5 Strand 5: Communicating and Defending Ideas
Traditionally, the NSES Inquiry Strand requirement calls for this section be written entirely in
open response format, and is intended to show the student’s skill at defending or refuting their original
hypothesis, using the collected data as evidence. Unfortunately, this approach makes this section the
most difficult to evaluate with an autonomous system such as ASSISTments. Although there are some
natural language processing systems available, they are not suitable for our data, nor is an auto-scoring
feature of students’ open response data within the scope of the Science ASSISTments project. Instead,
some sort of basic “fill-in-the-blank” analogue to the hypothesis creator used back in Strand 1 may be
possible, and that would allow for rudimentary evaluation of the student’s overall correctness.
However, the bulk of the final analysis of the student’s skill in this strand will need to be hand scored, as
15 | P a g e
was done in the IQP project by Patrick Sebuwufu (Sebuwufu, 2009), also supervised by Dr. Janice
Gobert.
3.4.0 Documentation for future Development of Microworlds
Following the wisdom of the old saying “Give a man a fish, feed him for a day… Teach a man to
fish, feed him forever”, I began documenting the work and techniques I used to create the basic shapes
and objects used in the Phase Change Microworld. This document is intended for anyone who needs to
create a visual object in Laszlo within an established Microworld. Very little previous programming
knowledge is necessary to create basic shapes, and even advanced animations can be achieved with a
little help from the senior software writers. The full text can be read in Appendix A.
4.3.0 Concluding Remarks
By the end of the Science ASSISTments project, at least five different Microworlds will be
created. Initial topics and a basic layout of a few are already being designed and developed. Further
work on the Ball-Ramp Microworld and of course the Phase Change Microworld will continue, and new
ways to challenge students within the Microworld frameworks will be developed so that more complex
inquiry opportunities can be explored. The extensive logging capabilities will provide a rigorous and
large dataset, which the project researchers can analyze to determine the effectiveness of different
methods of tutoring inquiry. With the highly scalable nature of the ASSISTments system, eventually any
school interested in tutoring or evaluating inquiry could simply sign up online and begin using it.
16 | P a g e
Appendix A: Guide for creating visual objects in Laszlo
Laszlo (http://www.openlaszlo.org/) is a language that was written to proceduralize the process
of creating animated graphics on a website. What this means is that nearly any aspect of a drawing can
be animated independently from the other parts, and the animation parameters themselves can be
driven from entirely customized equations. Traditional methods of animation have limited control over
movement, allowing some options in speed, start/stop accelerations, and path. Laszlo can assign any
equation to the motion, so that Newtonian physics and other laws of motion can be used. This
document was written to aid in the creation of new Microworld graphical objects by anyone working on
the Science ASSISTments project, regardless of their programming background. It will also standardize
the minimum basic attributes that every object must have so that animation algorithms can be
simplified and reused.
A.1.0: Creating Basic Shapes:
Laszlo uses a “canvas” system to draw the objects it displays. This canvas is a grid of pixels, each
with an X and Y coordinate. These coordinates can be negative, allowing for objects to go out of the
visual area. Avisual object is usually represented by a series of points, much like a “connect-the-dots”
picture from a children’s book. The lines between the points can be modified in a variety of ways, so
that different types of curves are possible. Once the points return to the first position, the area
enclosed by the lines can be “filled in” with colors, either solid or a wide range of gradients. Both the
lines and the fill colors have controls for transparency as well.
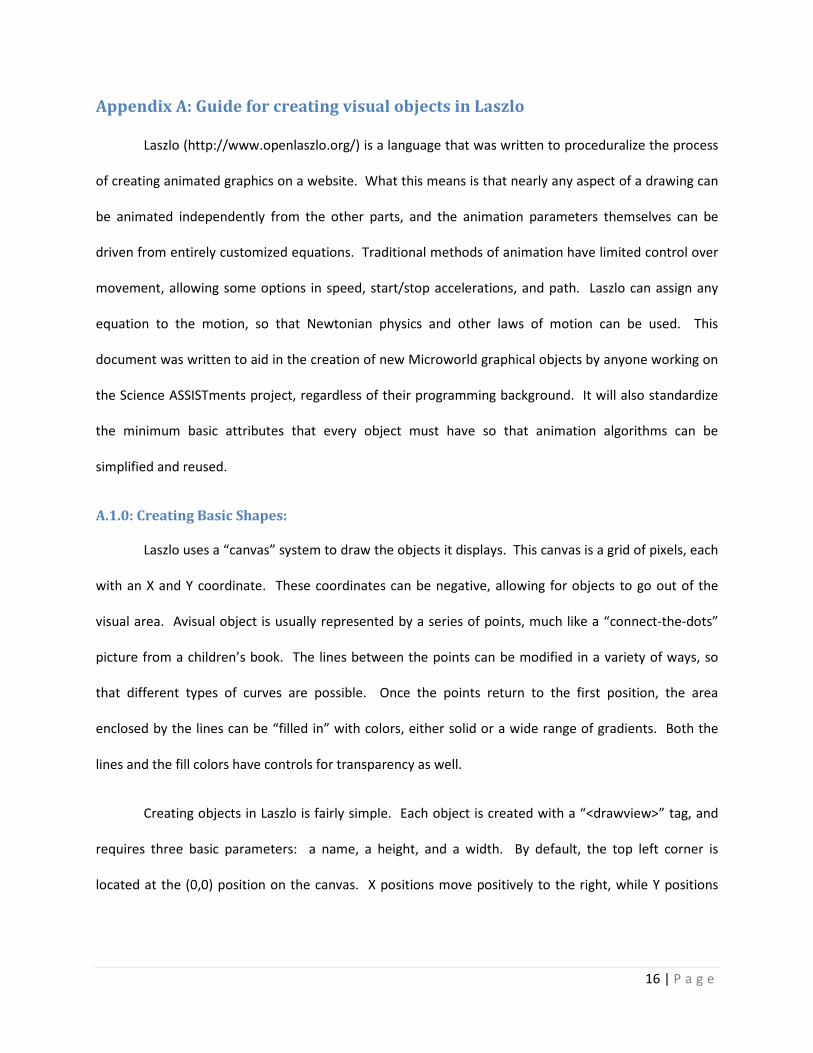
Creating objects in Laszlo is fairly simple. Each object is created with a “<drawview>” tag, and
requires three basic parameters: a name, a height, and a width. By default, the top left corner is
located at the (0,0) position on the canvas. X positions move positively to the right, while Y positions
17 | P a g e
move positively downward. This means that if you want to draw a triangle with specific points in a
Cartesian coordinate system, you must think of it as being upside down. While this might seem like a
simple concept, it can be far more complicated for complex shapes involving large numbers of points. I
have found that when drawing using lines in a computer system, it is advantageous to use as few
numerically assigned values as possible. When building a Microworld, the graphics you are creating
usually represent the properties selected by the end user, and the size, shape, color, and a variety of
other characteristics will influence what is being drawn. This means that there will be properties in the
Microworld class that your drawing object will need to access in order to be correctly dimensioned or
colored.
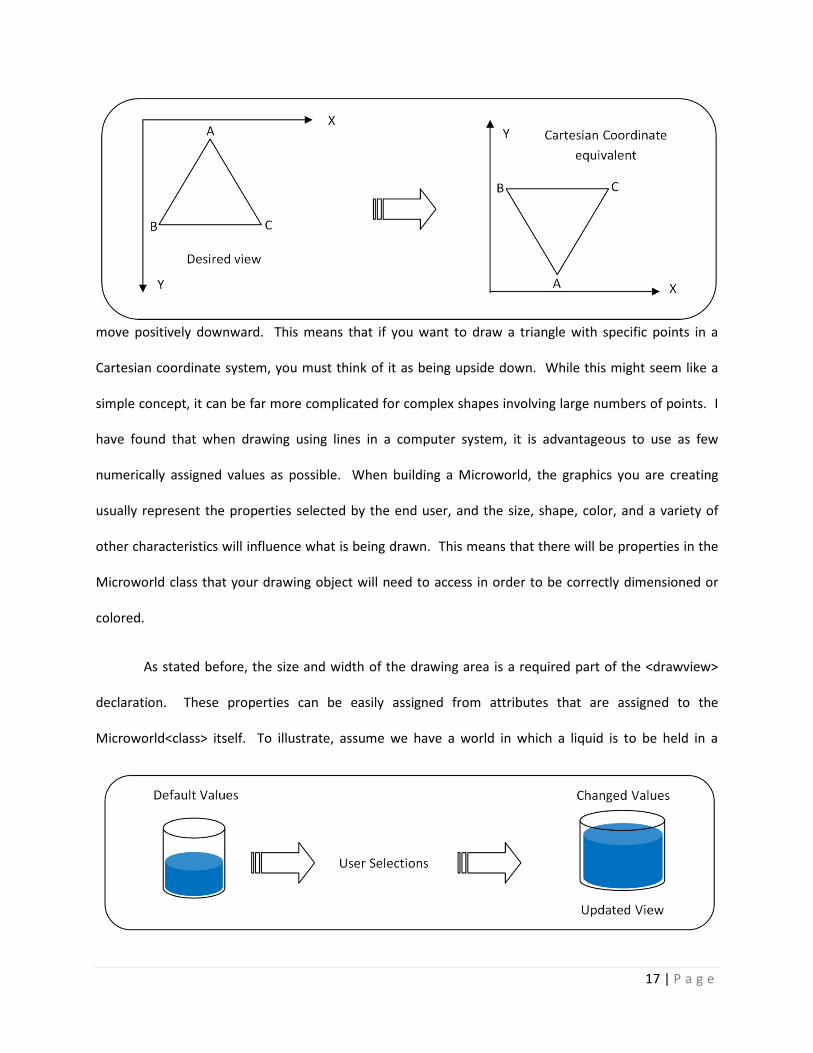
As stated before, the size and width of the drawing area is a required part of the <drawview>
declaration. These properties can be easily assigned from attributes that are assigned to the
Microworld<class> itself. To illustrate, assume we have a world in which a liquid is to be held in a
18 | P a g e
container. The user selects how much liquid and what size of container, and the “world” stores these
values in its attributes. It then activates a drawing update, and re-draws your object; in this case the
container and the liquid.
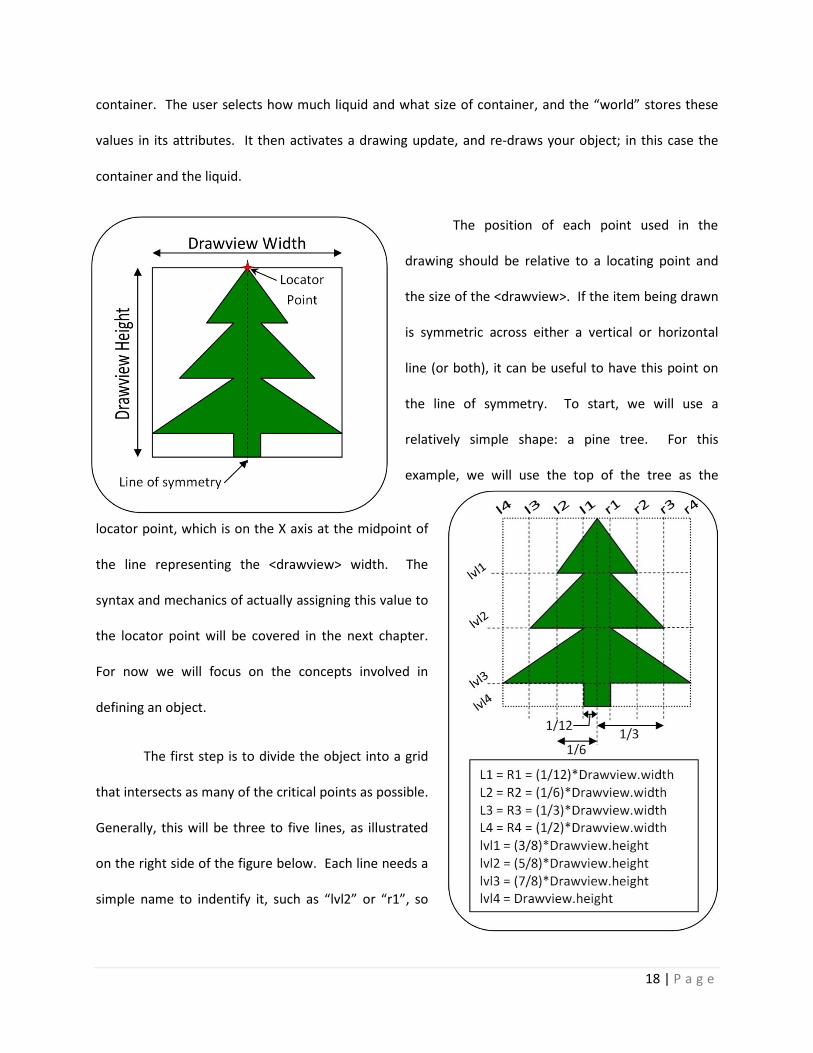
The position of each point used in the
drawing should be relative to a locating point and
the size of the <drawview>. If the item being drawn
is symmetric across either a vertical or horizontal
line (or both), it can be useful to have this point on
the line of symmetry. To start, we will use a
relatively simple shape: a pine tree. For this
example, we will use the top of the tree as the
locator point, which is on the X axis at the midpoint of
the line representing the <drawview> width. The
syntax and mechanics of actually assigning this value to
the locator point will be covered in the next chapter.
For now we will focus on the concepts involved in
defining an object.
The first step is to divide the object into a grid
that intersects as many of the critical points as possible.
Generally, this will be three to five lines, as illustrated
on the right side of the figure below. Each line needs a
simple name to indentify it, such as “lvl2” or “r1”, so
19 | P a g e
that when assigning values to points you can keep everything organized. The next step is to estimate
the ratio of the space between each line to the width of the draw view, so that relative distances can be
determined. Either decimal or fractional values can be used, and they can be adjusted later quite easily.
These ratios are going to be added or subtracted from the locator point’s X or Y value.
A.2.0: Recommended Variables
Generally, when assigning variable names to each of the lines you drew, you want to keep them
short and simple. The syntax for variable declaration is quite easy;
“varvariable_name=variable_value;”. The variable value can be just about anything, but for our
purposes numbers are generally the most useful. Since the locator point is going to be the crux of all
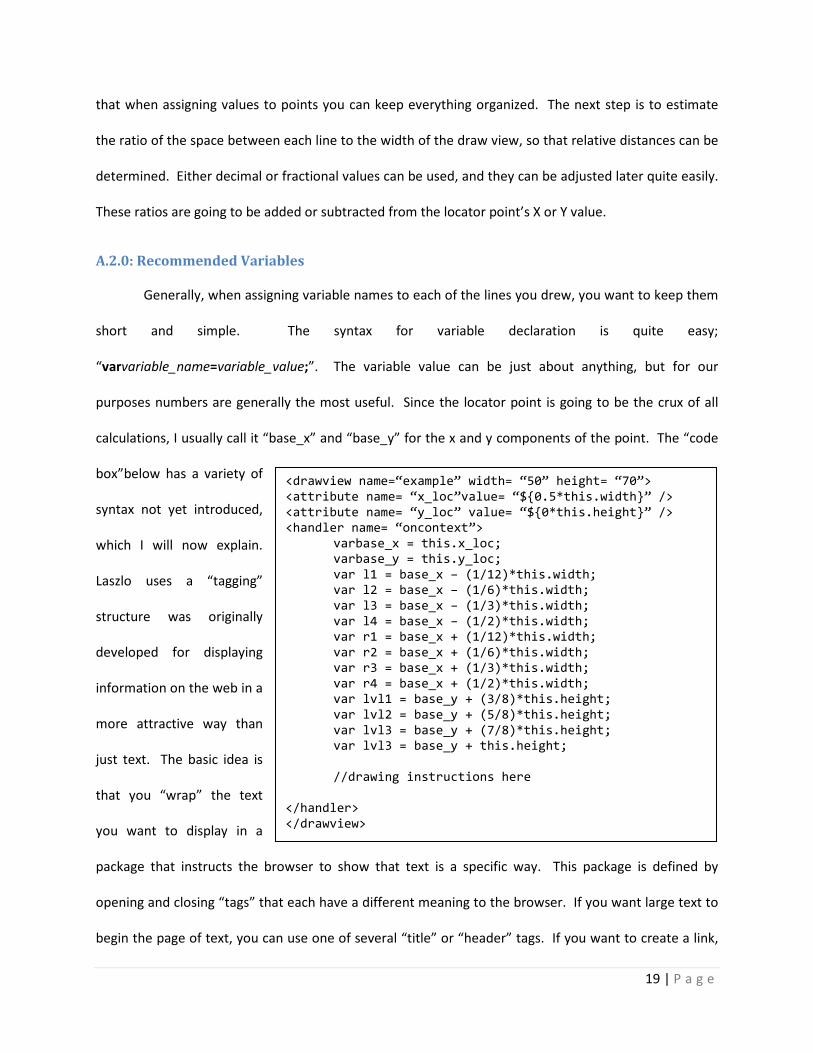
calculations, I usually call it “base_x” and “base_y” for the x and y components of the point. The “code
box”below has a variety of
syntax not yet introduced,
which I will now explain.
Laszlo uses a “tagging”
structure was originally
developed for displaying
information on the web in a
more attractive way than
just text. The basic idea is
that you “wrap” the text
you want to display in a
package that instructs the browser to show that text is a specific way. This package is defined by
opening and closing “tags” that each have a different meaning to the browser. If you want large text to
begin the page of text, you can use one of several “title” or “header” tags. If you want to create a link,
<drawview name=“example” width= “50” height= “70”>
<attribute name= “x_loc”value= “${0.5*this.width}” />
<attribute name= “y_loc” value= “${0*this.height}” />
<handler name= “oncontext”>
varbase_x = this.x_loc;
varbase_y = this.y_loc;
var l1 = base_x – (1/12)*this.width;
var l2 = base_x – (1/6)*this.width;
var l3 = base_x – (1/3)*this.width;
var l4 = base_x – (1/2)*this.width;
var r1 = base_x + (1/12)*this.width;
var r2 = base_x + (1/6)*this.width;
var r3 = base_x + (1/3)*this.width;
var r4 = base_x + (1/2)*this.width;
var lvl1 = base_y + (3/8)*this.height;
var lvl2 = base_y + (5/8)*this.height;
var lvl3 = base_y + (7/8)*this.height;
var lvl3 = base_y + this.height;
//drawing instructions here
</handler>
</drawview>
20 | P a g e
there is a special “a” tag. Within each tag itself, a variety of properties can be set, such as font size, the
link destination, or simply a name to allow for in-page navigation. In the case of Laszlo, these tags
define instructions for the system to execute when the page is loaded.
The <attribute> tag defines just that: an attribute within the <drawview> object that can be
animated and accessed by any other functions. It is similar in essence to a “var” variable, but var’s can
only be defined in and accessed by their own tags. The tags that can contain code (including the
declaration of “vars”) can be either a <handler> or a <method>. A <handler> is basically that: it handles
changes or events within the <drawview>. The name is very important, and every <drawview> must
have one <handler> with the name “oncontext”. This is executed once, when the rendering system first
runs through your code. The <method> tag is more of a general purpose function container, and while it
is not a necessary part of a <drawview> object, it can be very useful for dividing up independent
operations you want your <drawview> to do.
As I mentioned before, the purpose of tags is to wrap up the enclosed text, and the last few
items above are called “close tags”, and are easily identified by the leading ‘/’ within the tag. Every tag
must have a closing tag, and just like preparing a bunch of items for shipping, each tag should be closed
before the preceding tag is closed. It wouldn’t make much sense to seal up the main container while the
smaller boxes inside are still wide open can spill and mix up. Just like the recipient trying to sort out the
mess, the program that reads your code will be very confused. To further the analogy, you can’t close
the smaller boxes once you’ve sealed the main container either. As can be seen with the <attribute>
tags, you can also close the tag by ending the declaration with a ‘/’. This is like putting an index card
with information in the shipping box; it has value on its own without actually holding anything within.
There are some important and easily overlooked details in the code box that should be noted
and explained. First, when writing code within a <handler> or <method> tag, every instruction must be
21 | P a g e
terminated by a semi-colon (‘;’). This notifies the system when each instruction is finished, and when
the next instruction starts. It is theoretically possible to write your whole program on one line, but that
would make it a little difficult to read or edit. Next, when I declared the “x_loc” variable, the “value”
property had some odd characters mixed in. Namely the “${ … }” characters. This little “sub-wrapper”
(for lack of a better term) instructs the system to evaluate any variable and mathematic operations
contained within the curly brackets. This must be used whenever assigning values within a tag
declaration. These are NOT needed between the opening and closing tags of a <handler> or a
<method>. Note that in the declaration of the <drawview>, the height and width properties simply use
quotes with the numeric values inside. While you could use the evaluation “${ … }” sub-wrapper for
everything, it helps with the speed of displaying the object if you use it as sparingly as possible.
Especially for animations, when it has to evaluate every variable hundreds or thousands of times per
second.
The “this.____” syntax is important for calling the various functions and variables associated
with the object within the <handler> and when using the evaluation sub-wrapper. It originates from
java and java-script, the foundation of Laszlo’s architecture. Every function you will be using needs to
have an object of some sort associated with it, either to act on or to originate from. Commands can’t
come from nowhere, and either the <drawview> or some object within it needs to be attached to each
instruction. When referring to <attributes> of the <drawview>, simply using a “this.” plus the attribute’s
name will resolve to the “value” of the <attribute>. While it is possible to assign a different value to the
attribute using the this.attrubute_name notation within a <handler> or <method>, it is better practice to
vary the value with an animator, and simply use the value as is within your functions.
22 | P a g e
A.3.0: Stroke Functions and Modifiers
Getting back to the connect-the-dots analogy, when you want to draw the lines, first you have
to choose something to draw with. Similarly, we have to tell the system what kind of line to display as it
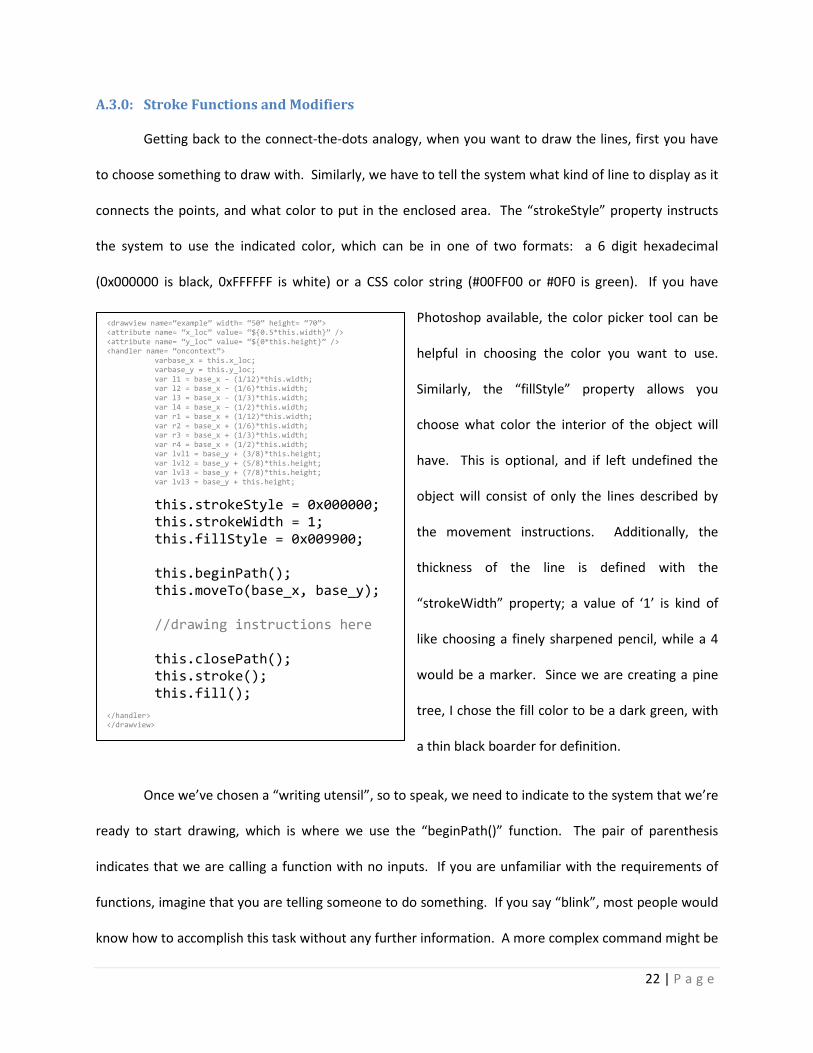
connects the points, and what color to put in the enclosed area. The “strokeStyle” property instructs
the system to use the indicated color, which can be in one of two formats: a 6 digit hexadecimal
(0x000000 is black, 0xFFFFFF is white) or a CSS color string (#00FF00 or #0F0 is green). If you have
Photoshop available, the color picker tool can be
helpful in choosing the color you want to use.
Similarly, the “fillStyle” property allows you
choose what color the interior of the object will
have. This is optional, and if left undefined the
object will consist of only the lines described by
the movement instructions. Additionally, the
thickness of the line is defined with the
“strokeWidth” property; a value of ‘1’ is kind of
like choosing a finely sharpened pencil, while a 4
would be a marker. Since we are creating a pine
tree, I chose the fill color to be a dark green, with
a thin black boarder for definition.
Once we’ve chosen a “writing utensil”, so to speak, we need to indicate to the system that we’re
ready to start drawing, which is where we use the “beginPath()” function. The pair of parenthesis
indicates that we are calling a function with no inputs. If you are unfamiliar with the requirements of
functions, imagine that you are telling someone to do something. If you say “blink”, most people would
know how to accomplish this task without any further information. A more complex command might be
<drawview name=“example” width= “50” height= “70”> <attribute name= “x_loc” value= “${0.5*this.width}” />
<attribute name= “y_loc” value= “${0*this.height}” /> <handler name= “oncontext”>
varbase_x = this.x_loc; varbase_y = this.y_loc;
var l1 = base_x – (1/12)*this.width; var l2 = base_x – (1/6)*this.width;
var l3 = base_x – (1/3)*this.width;
var l4 = base_x – (1/2)*this.width; var r1 = base_x + (1/12)*this.width;
var r2 = base_x + (1/6)*this.width; var r3 = base_x + (1/3)*this.width;
var r4 = base_x + (1/2)*this.width; var lvl1 = base_y + (3/8)*this.height;
var lvl2 = base_y + (5/8)*this.height; var lvl3 = base_y + (7/8)*this.height;
var lvl3 = base_y + this.height;
this.strokeStyle = 0x000000; this.strokeWidth = 1;
this.fillStyle = 0x009900; this.beginPath();
this.moveTo(base_x, base_y); //drawing instructions here
this.closePath(); this.stroke();
this.fill();
</handler> </drawview>
23 | P a g e
“go”; the person would want to know where you wanted them to go, and just stare at you blankly as a
response. “Go… to your room” would be more likely to be understood and executed. This is why the
command following “beginPath()”, namely “moveTo(base_x, base_y)” has the variables for the x and y
components of the locator point you defined before as “arguments”. It tells the system that you want
to move the “tip” of your “drawing utensil” to this point, without actually making a line. By default, the
system starts drawing at the point (0, 0), in the upper left corner of the canvas.
To finish explaining the last new commands in the code box, “closePath()” instructs the system
to “close” the last object it drew. Operationally, this means it draws a line back to the first position from
which it started drawing. While this command is not a requirement for the system to draw the lines, it
must be used if you want to fill the object with a color, even if you have returned to the starting point
with your drawing instructions. “stroke()” signifies that you are finished drawing the shape, and it
should render the lines on the canvas, and “fill()” instructs the system to fill the interior of the shape
with whatever color you set with the “fillStyle” property.
A.3.1: lineTo( x , y );
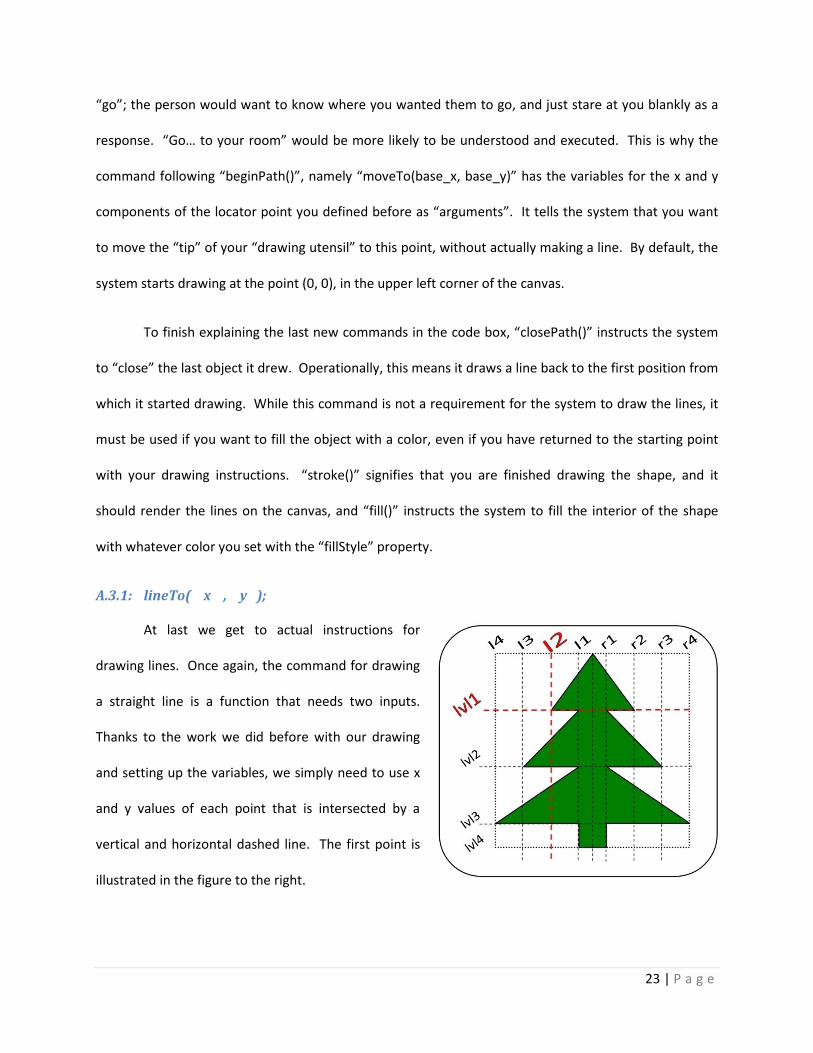
At last we get to actual instructions for
drawing lines. Once again, the command for drawing
a straight line is a function that needs two inputs.
Thanks to the work we did before with our drawing
and setting up the variables, we simply need to use x
and y values of each point that is intersected by a
vertical and horizontal dashed line. The first point is
illustrated in the figure to the right.
24 | P a g e
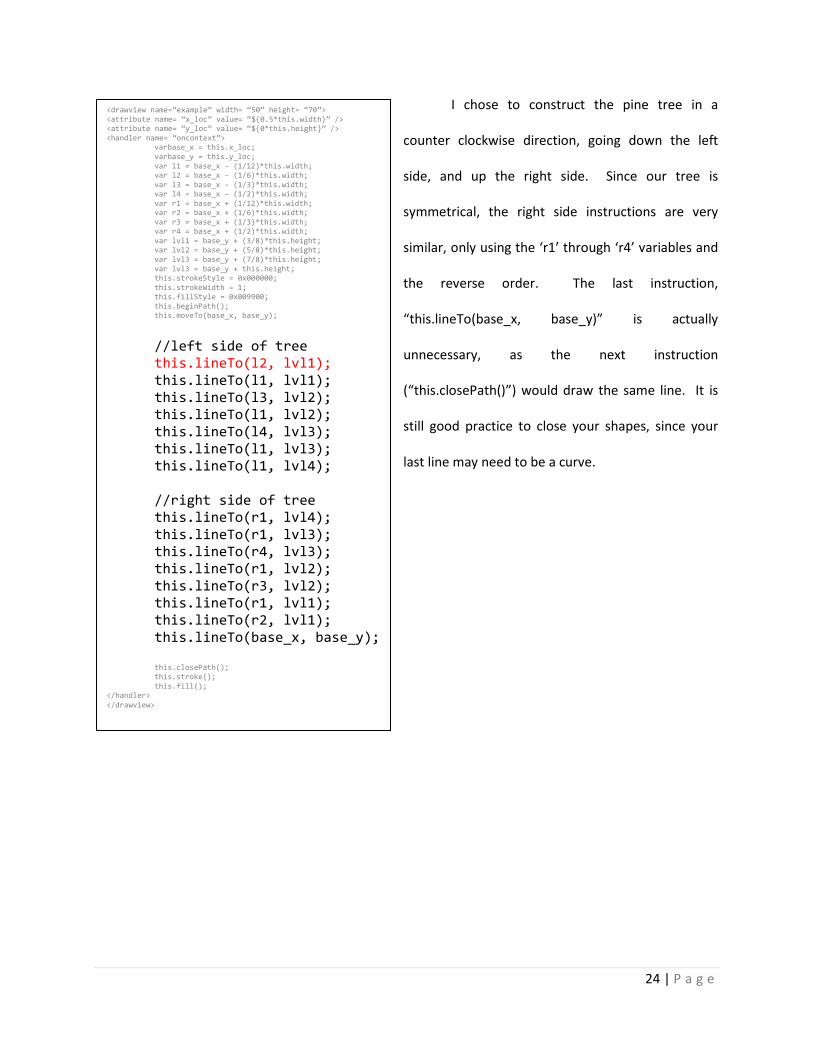
I chose to construct the pine tree in a
counter clockwise direction, going down the left
side, and up the right side. Since our tree is
symmetrical, the right side instructions are very
similar, only using the ‘r1’ through ‘r4’ variables and
the reverse order. The last instruction,
“this.lineTo(base_x, base_y)” is actually
unnecessary, as the next instruction
(“this.closePath()”) would draw the same line. It is
still good practice to close your shapes, since your
last line may need to be a curve.
<drawview name=“example” width= “50” height= “70”>
<attribute name= “x_loc” value= “${0.5*this.width}” /> <attribute name= “y_loc” value= “${0*this.height}” />
<handler name= “oncontext”> varbase_x = this.x_loc;
varbase_y = this.y_loc;
var l1 = base_x – (1/12)*this.width; var l2 = base_x – (1/6)*this.width;
var l3 = base_x – (1/3)*this.width; var l4 = base_x – (1/2)*this.width;
var r1 = base_x + (1/12)*this.width; var r2 = base_x + (1/6)*this.width;
var r3 = base_x + (1/3)*this.width; var r4 = base_x + (1/2)*this.width;
var lvl1 = base_y + (3/8)*this.height; var lvl2 = base_y + (5/8)*this.height;
var lvl3 = base_y + (7/8)*this.height;
var lvl3 = base_y + this.height; this.strokeStyle = 0x000000;
this.strokeWidth = 1; this.fillStyle = 0x009900;
this.beginPath(); this.moveTo(base_x, base_y);
//left side of tree this.lineTo(l2, lvl1);
this.lineTo(l1, lvl1); this.lineTo(l3, lvl2); this.lineTo(l1, lvl2);
this.lineTo(l4, lvl3); this.lineTo(l1, lvl3); this.lineTo(l1, lvl4);
//right side of tree this.lineTo(r1, lvl4);
this.lineTo(r1, lvl3); this.lineTo(r4, lvl3); this.lineTo(r1, lvl2);
this.lineTo(r3, lvl2); this.lineTo(r1, lvl1); this.lineTo(r2, lvl1);
this.lineTo(base_x, base_y); this.closePath();
this.stroke();
this.fill(); </handler>
</drawview>
25 | P a g e
References
Alonzo, A. &Aschbacher, P.R. Value Added? Long assessment of students’ scientific inquiry skills.
Presented at the Annual Meeting of the American Educational Research Association. San Diego,
CA, April.
Baxter, G. P., &Shavelson, R. J. (1994). Science performance assessments: Benchmarks and surrogates.
International Journal of Educational Research, 21, 279-298.
Gobert, J., Beck, J., Sao Pedro, M., Heffernan, N., & Richardson, J. (2008).Scaffolding and Logging
Students’ Scientific Inquiry within Science ASSISTments program. To be presented at the
International Conference of the Learning Sciences. June 23-28th, Utrecht, The Netherlands.
Gotwals, Amelia W. and Songer, N.B. (2005). The Symbiosis of Cognition, Observation, and
Interpretation in an Assessment System for BioKIDS. In S. Barab and K. Hay (Eds.) The
Proceedings of the International Conference of the Learning Sciences.
Klahr, D., & Nigam, M. (2004). The equivalence of learning paths in early science instruction: Effects of
direct instruction and discovery learning. Psychological Science, 15(10), 661-667.
Kuhn, D. (2005). Education for thinking. Harvard University Press, Cambridge, MA.
National Committee on Science Education Standards and Assessment (1996). National Education
Standards, Washington, DC: National Academy Press.
National Research Council (US). (1996). National Science Education Standards. Washington, DC:
National Academy Press.
Ruiz-Primo, M.A. &Furtak, E. (2004).Informal assessment of students’ understanding of scientific
inquiry. A paper presented at the American Education Research Association annual meeting, San
Diego, CA.
Rutherford, J.F. and A. Ahlgren. (1990). Science for All Americans. New York: Oxford University Press.
Schunn, C., Raghavan, K., & Cho, NB. (2007). Domain-general Learning Accelerators in Middle-School
Science.Paper to be presented at the annual meeting of the American Educational Research
Association, Chicago, IL. April 9-13.
Sebuwufu, Patrick, S. (2009). Science ASSISTments Coding Scheme for Open Response Items. Interactive
Qualifying Paper, Worcester Polytechnic Institute, Worcester, MA.