Embed Size (px)
Citation preview
Fiscal Year 2013 annual report on Form 10-KS C I E N C E A P P L I C A T I O N S I N T E R N A T I O N A L C O R P O R A T I O N

A.Thomas YoungFormer Executive Vice President,Lockheed Martin Corporation
France A. CórdovaPresident Emerita,Purdue University
John P. JumperChairman of the Board,President and Chief Executive Officer
Thomas F. Frist, IIIPrincipal,Frist Capital LLC
Lawrence C. NussdorfLead Director, President and Chief Operating Officer, Clark Enterprises, Inc.
Miriam E. JohnFormer Vice President,Sandia National Laboratories
Jere A. DrummondFormer Vice Chairman,BellSouth Corporation
Harry M.J. Kraemer, Jr.Executive Partner, Madison Dearborn Partners, LLC
John J. HamreChief Executive Officer and President,Center for Strategic &International Studies
Edward J. Sanderson, Jr.Former Executive Vice President, Oracle Corporation
Anita K. JonesUniversity Professor Emerita,University of Virginia
Directors

A major change for SAIC this past year was the announcement of our intent to separate into two independent, publicly traded companies by the end of calendar year 2013. One of these companies will focus on technical, engineering and enterprise information technology services and will be known as Science Applications International Corporation (SAIC). The other will focus on delivering science and technology solutions primarily in the areas of national security, engineering and health and is expected to be named Leidos. As the executive team has emphasized, this move is not a simple division of our company into two parts; it is a catalyst for widespread change with clear purpose.
We are crafting two new companies from the ground up, each designed to be even more competitive in its individual markets from day one. We have made great strides in the past year to position both companies for enhanced performance across all spectrums and to create renewed momentum.
Our employees continue to be the core of our success. Our senior executives have invested considerable time and effort reaching out across the corporation by engaging in dialogue with employees, sharing the vision of our collective futures, and helping plant the seeds for a bright future for both companies.
While we have been taking bold steps in our markets, we have continued our unwavering commitment to deliver for our existing and future customers. I am excited to share a few key highlights of SAIC’s performance in FY13.
Our strong performance and growth in commercial markets was led by our health-care organization, which benefitted from the acquisition of MaxIT in the past year. SAIC now ranks as the largest third-party electronic health record implementation and optimization provider in the nation, with demand for electronic health records continuing to surge.
SAIC also won 42 contracts valued at more than $100 million each — a record number for us, up from 40 in FY12 and 26 in FY11. This growing trend reflects our increasing focus on strategic pursuits, our proven track record of program performance and execution, and our targeted investments in research and development.
In addition, I’m pleased to note that we returned stockholder value with regular quarterly dividends totaling 48 cents a share for the year. This action by our Board of Directors further demonstrates our commitment to provide returns to our stockholders whenever prudent.
Since I joined SAIC as CEO a little more than a year ago, we have accomplished a number of critical actions to position ourselves to execute well in these dynamic times. We have a strong and dedicated team of 40,000 highly talented employees who will be essential in making the next stage of our journey a success.
John P. JumperChairman of the Board and Chief Executive Officer
Fiscal year 2013 was a year of dynamic change for SAIC. I am proud to report that the breadth
and depth of talent and our employees’ passion for contributing to a more secure world
has enabled SAIC to weather the changes and emerge stronger, with a renewed focus on
performance and dedication to serving our customers and their missions.
Dear Fellow Stockholders,
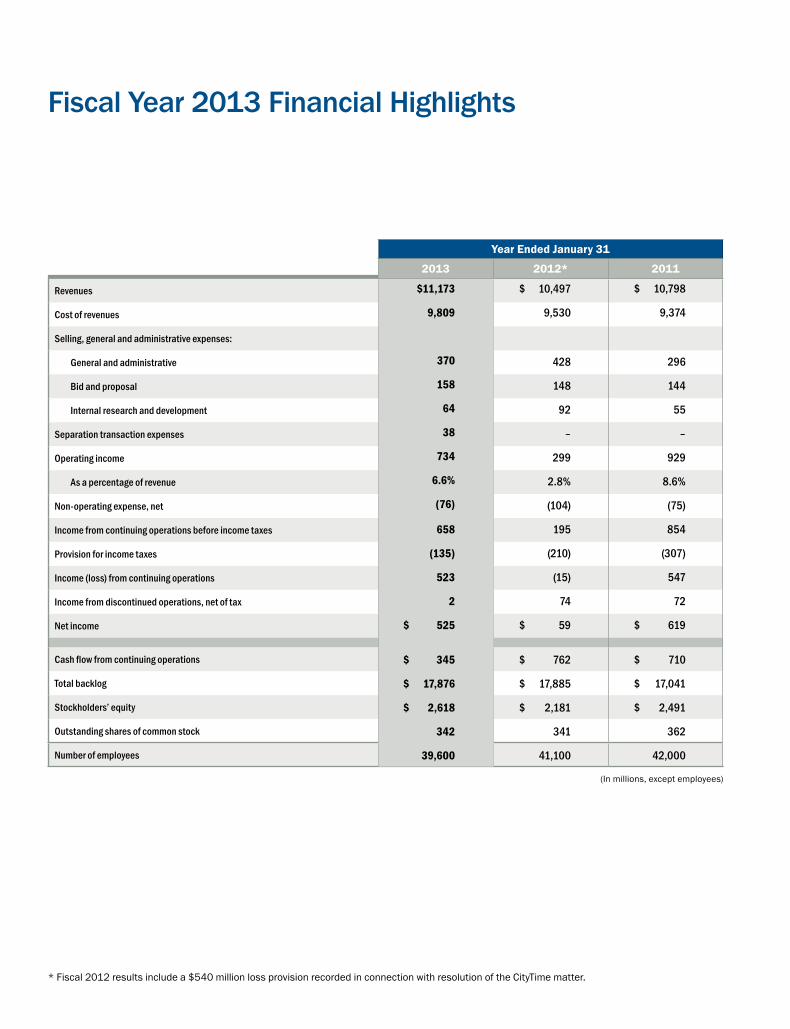
(In millions, except employees)
Year Ended January 31
2013 2012* 2011
Revenues
Cost of revenues
Selling, general and administrative expenses:
General and administrative
Bid and proposal
Internal research and development
Separation transaction expenses
Operating income
As a percentage of revenue
Non-operating expense, net
Income from continuing operations before income taxes
Provision for income taxes
Income (loss) from continuing operations
Income from discontinued operations, net of tax
Net income
Cash flow from continuing operations
Total backlog
Stockholders’ equity
Outstanding shares of common stock
Number of employees
$ 10,798
9,374
296
144
55
–
929
8.6%
(75)
854
(307)
547
72
$ 619
$ 710
$ 17,041
$ 2,491
362
42,000
$ 10,497
9,530
428
148
92
–
299
2.8%
(104)
195
(210)
(15)
74
$ 59
$ 762
$ 17,885
$ 2,181
341
41,100
$11,173
9,809
370
158
64
38
734
6.6%
(76)
658
(135)
523
2
$ 525
$ 345
$ 17,876
$ 2,618
342
39,600
Fiscal Year 2013 Financial Highlights
* Fiscal 2012 results include a $540 million loss provision recorded in connection with resolution of the CityTime matter.

UNITED STATESSECURITIES AND EXCHANGE COMMISSION
Washington, D.C. 20549
Form 10-K(Mark One)È ANNUAL REPORT PURSUANT TO SECTION 13 OR 15(d) OF THE SECURITIES EXCHANGE ACT OF 1934
For the fiscal year ended January 31, 2013or
‘ TRANSITION REPORT PURSUANT TO SECTION 13 OR 15(d) OF THE SECURITIES EXCHANGE ACT OF 1934For the transition period from to
CommissionFile Number
Exact Name of Registrant as Specified in its Charter,Address of Principal Executive Offices and Telephone Number
State orjurisdiction ofIncorporation
I.R.S. EmployerIdentification
No.
001-33072 SAIC, Inc. Delaware 20-35628681710 SAIC Drive, McLean, Virginia 22102
(703) 676-4300000-12771
Science ApplicationsInternational Corporation
Delaware 95-3630868
1710 SAIC Drive, McLean, Virginia 22102(703) 676-4300
Securities registered pursuant to Section 12(b) of the Act:Title of each class Name of each exchange on which registered
SAIC, Inc. Common Stock, Par Value $.0001 Per Share New York Stock ExchangeSecurities registered pursuant to Section 12(g) of the Act:
None
Indicate by check mark if the registrant is a well-known seasoned issuer, as defined in Rule 405 of the Securities Act.SAIC, Inc. Yes È No ‘Science Applications International Corporation Yes È No ‘
Indicate by check mark if the registrant is not required to file reports pursuant to Section 13 or Section 15(d) of the Act.SAIC, Inc. Yes ‘ No ÈScience Applications International Corporation Yes ‘ No È
Indicate by check mark whether the registrant (1) has filed all reports required to be filed by Section 13 or 15(d) of the Securities ExchangeAct of 1934 during the preceding 12 months (or for such shorter period that the registrant was required to file such reports), and (2) hasbeen subject to such filing requirements for the past 90 days.
SAIC, Inc. Yes È No ‘Science Applications International Corporation Yes È No ‘
Indicate by check mark whether the registrant has submitted electronically and posted on its corporate website, if any, every InteractiveData File required to be submitted and posted pursuant to Rule 405 of Regulation S-T (§232.405 of this chapter) during the preceding 12months (or for such shorter period that the registrant was required to submit and post such files).
SAIC, Inc. Yes È No ‘Science Applications International Corporation Yes È No ‘
Indicate by check mark if disclosure of delinquent filers pursuant to Item 405 of Regulation S-K (§229.405 of this chapter) is not containedherein, and will not be contained, to the best of registrant’s knowledge, in definitive proxy or information statements incorporated byreference in Part III of this Form 10-K or any amendment to this Form 10-K. ÈIndicate by check mark whether the registrant is a large accelerated filer, an accelerated filer, a non-accelerated filer, or a smaller reportingcompany. See the definitions of “large accelerated filer,” “accelerated filer” and “smaller reporting company” in Rule 12b-2 of theExchange Act.SAIC, Inc. Large accelerated filer È Accelerated filer ‘ Non-accelerated filer ‘ Smaller reporting company ‘
Science ApplicationsInternational Corporation Large accelerated filer ‘ Accelerated filer ‘ Non-accelerated filer È Smaller reporting company ‘Indicate by check mark whether the registrant is a shell company (as defined in Rule 12b-2 of the Act).
SAIC, Inc. Yes ‘ No ÈScience Applications International Corporation Yes ‘ No È
As of July 31, 2012, the aggregate market value of SAIC, Inc. common stock (based upon the closing price of the stock on the New YorkStock Exchange) held by non-affiliates of the registrant was $3,314,483,629The number of shares issued and outstanding of each registrant’s classes of common stock as of March 8, 2013 was as follows:
SAIC, Inc. 341,917,569 shares of common stock ($.0001 par value per share)Science ApplicationsInternational Corporation 5,000 shares of common stock ($.01 par value per share) held by SAIC, Inc.
DOCUMENTS INCORPORATED BY REFERENCEPortions of SAIC, Inc.’s definitive Proxy Statement for the 2013 Annual Meeting of Stockholders are incorporated by reference in Part III ofthis Annual Report on Form 10-K.

Explanatory Note
This Annual Report on Form 10-K is a combined report being filed by SAIC, Inc. (“SAIC”) and ScienceApplications International Corporation (“Science Applications”). SAIC is a holding company and ScienceApplications is a direct, 100%-owned subsidiary of SAIC. Each of SAIC and Science Applications is filing on itsown behalf all of the information contained in this report that relates to such company. Where information or anexplanation is provided that is substantially the same for each company, such information or explanation hasbeen combined in this report. Where information or an explanation is not substantially the same for eachcompany, separate information and explanation has been provided. In addition, separate consolidated financialstatements for each company, along with combined notes to the consolidated financial statements, areincluded in this report. Unless indicated otherwise, references in this report to the “Company”, “we”, “us” and“our” refer collectively to SAIC, Science Applications and its consolidated subsidiaries.

SAIC, INC.
SCIENCE APPLICATIONS INTERNATIONAL CORPORATION
FORM 10-K
TABLE OF CONTENTS
Page
Part I
Item 1. Business 1
Item 1A. Risk Factors 8
Item 1B. Unresolved Staff Comments 21
Item 2. Properties 21
Item 3. Legal Proceedings 22
Item 4. Mine Safety Disclosures 22
Executive and Other Key Officers of the Registrant 23
Part II
Item 5. Market for Registrant’s Common Equity, Related Stockholder Matters and IssuerPurchases of Equity Securities 26
Item 6. Selected Financial Data 28
Item 7. Management’s Discussion and Analysis of Financial Condition and Results of Operations 29
Item 7A. Quantitative and Qualitative Disclosures About Market Risk 44
Item 8. Financial Statements and Supplementary Data 45
Item 9. Changes in and Disagreements with Accountants on Accounting and Financial Disclosure 45
Item 9A. Controls and Procedures 45
Item 9B. Other Information 49
Part III
Item 10. Directors, Executive Officers and Corporate Governance 50
Item 11. Executive Compensation 50
Item 12. Security Ownership of Certain Beneficial Owners and Management and RelatedStockholder Matters 50
Item 13. Certain Relationships and Related Transactions, and Director Independence 51
Item 14. Principal Accounting Fees and Services 51
Part IV
Item 15. Exhibits, Financial Statement Schedules 52
Signatures 56
Index to Consolidated Financial Statements F-1


PART I
Item 1. Business
The Company
SAIC is a holding company. Its principal operating company, Science Applications, was formed in 1969. In October 2006, inconnection with SAIC becoming a publicly-traded company, Science Applications completed a reorganization merger inwhich it became a 100%-owned subsidiary of SAIC, after which SAIC completed an initial public offering of its commonstock.
We use the terms “Company,” “we,” “us,” and “our” to refer to SAIC, Science Applications and its consolidated subsidiaries.Unless otherwise noted, references to years are for fiscal years ended January 31. For example, we refer to the fiscal yearended January 31, 2013 as “fiscal 2013”.
We are a provider of scientific, engineering, systems integration and technical services and solutions in the areas of defense,health, energy, infrastructure, intelligence, surveillance, reconnaissance and cybersecurity to agencies of the U.S.Department of Defense (DoD), the intelligence community, the U.S. Department of Homeland Security (DHS), and other U.S.Government civil agencies, state and local government agencies, foreign governments and customers in select commercialmarkets. Our business is focused on using deep domain knowledge to solve problems of vital importance to the nation andthe world, in the areas of national security, energy and the environment, critical infrastructure and health. We are focusing ourinvestments in our strategic growth areas including: intelligence, surveillance and reconnaissance; cybersecurity; logistics,readiness and sustainment; energy and environment; and health information technology. In each of the last three fiscal years,we generated over 85% of our total revenues from contracts with the U.S. Government, either as a prime contractor or as asubcontractor to other contractors engaged in work for the U.S. Government.
In August 2012, we announced that our board of directors authorized management to pursue a plan to separate into twoindependent, publicly traded companies: (i) a company focused on technical, engineering and enterprise informationtechnology services; and (ii) a company focused on delivering science and technology solutions primarily in the areas ofnational security, engineering and health. The proposed separation is intended to take the form of a tax-free spin-off of thetechnical, engineering and enterprise information technology services business. The separation transaction is expected tooccur in the latter half of calendar year 2013, subject to final approval of the board of directors and certain other customaryconditions, including receipt of an opinion from tax counsel and a ruling from the Internal Revenue Service (IRS) as to the taxfree nature of the transaction. Management is continuing to develop detailed plans on capital structure, management,governance and other significant matters. Although we expect that the separation of our businesses will be completed, therecan be no assurance that a separation will ultimately occur. Upon completion of the separation transaction, the operatingresults of the separated business will be included in discontinued operations. See “Item 1A—Risk Factors” contained in thisAnnual Report on Form 10-K for certain risk factors relating to the proposed separation transaction.
For additional discussion and analysis related to recent business developments, see “Business Environment and Trends” inManagement’s Discussion and Analysis of Financial Condition and Results of Operations” in Part II of this Annual Report onForm 10-K.
Reportable Segments
Our business is aligned into four reportable segments: Defense Solutions; Health, Energy and Civil Solutions; Intelligence andCybersecurity Solutions; and Corporate and Other. While each reportable segment is organized around the markets servedand the nature of the products and services provided to customers in those markets as described in the segmentdescriptions below, we provide a wide array of scientific, engineering, systems integration and technical services andsolutions across these reportable segments, but which are performed specifically to meet the needs of the market andcustomers served in a particular segment. These services and solutions include:
• Systems Engineering and Integration. We provide systems engineering and implementation services and solutions tohelp our customers design and integrate complex network processes and infrastructure. These services and solutionsinclude designing, installing, testing, repairing, maintaining and upgrading systems and processes.
• Software Development. We provide software development services and solutions to help our customers maximize valueby extending and renovating critical systems through software capabilities. These services include automating codegeneration, managing computer resources, and merging and evaluating large amounts of data.
• Cybersecurity. We provide services and solutions to help our customers prepare for, protect against, and respond to awide array of cybersecurity threats. These services and solutions include designing comprehensive cyber-riskmanagement programs to identify and neutralize cyber attacks, integrating and managing information security servicesto protect customers’ mission-critical data, identifying and advising in connection with the selection of disaster recoveryplans and performing tests to certify that information technology (IT) systems operate in accordance with designrequirements.
SAIC, Inc. Annual Report 1
PART I
• Secure Information Sharing and Collaboration. We provide services and solutions to help our customers shareinformation and resources, including designing and developing information systems that access, process and analyzevast amounts of data from various sources to facilitate timely information sharing, collaboration and decision making.
• Communication Systems and Infrastructure. We provide services and solutions to help our customers design andimplement state-of-the-art communication systems. These services and solutions include designing, installing, testing,repairing and maintaining voice, data and video communication systems and infrastructures.
• Research and Development. We conduct leading-edge research and development of new technologies withapplications in areas such as national security, intelligence and life sciences.
• Securing Critical Infrastructure. We provide customers with services and solutions to protect critical infrastructure fromacts of terrorism and natural disasters as well as from threats due to error, maliciousness, wear and tear, planningoversights and previously unforeseen vulnerabilities. These services and solutions include risk management (vulnerabilityassessments and threat identification), training exercises and simulations, awareness programs, physical security,protection and detection systems and critical infrastructure continuity and contingency planning as well as casualty anddamage assessment tools and disaster recovery services.
• Modeling and Simulation. We provide applied research and technology and modeling and simulation services andsolutions to the U.S. military, space and intelligence communities, including support related to mission preparation,launch and execution.
• Enterprise Information Solutions. We provide a comprehensive set of IT service offerings including enterprise informationtechnology optimization, business intelligence, enterprise resource planning maintenance and staff augmentationservices.
In preparation for the proposed separation transaction which is expected to occur in the latter half of calendar year 2013,effective February 1, 2013, we transferred certain business operations primarily focused on providing enterprise informationtechnology services to federal civilian agencies of the U.S. Government from the Health, Engineering, and Civil Solutionssegment to the Defense Solutions segment. We also transferred certain business operations primarily focused on providingcommand, control, communications, and computer solutions to the DoD from the Defense Solutions segment to theIntelligence and Cybersecurity Solutions segment. As a result, our operating segments for fiscal 2014 will be reflective of thisnew business alignment, and one of our operating segments will represent the entirety of the technical, engineering andenterprise information services business that will be included in the separation transaction.
Defense Solutions
Defense Solutions provides systems engineering and specialized technical services and solutions in support of command andcontrol, communications, modeling and simulation, logistics, readiness and sustainment and network operations to a broadcustomer base within the defense industry. Defense Solutions helps design and implement advanced, networked commandand control systems to enable U.S. and allied defense customers to plan, direct, coordinate and control forces and operationsat strategic, operational and tactical levels. Defense Solutions also provides a wide range of logistics, product support andforce modernization solutions, including supply chain management, demand forecasting, distribution, sustaining engineering,maintenance and training services, to enhance the readiness and operational capability of U.S. military personnel and theirweapons and support systems. Major customers of Defense Solutions include most branches of the U.S. military. DefenseSolutions represented 42%, 40% and 43% of total revenues for fiscal 2013, 2012 and 2011, respectively.
Health, Energy and Civil Solutions
Health, Energy and Civil Solutions provides services and solutions in the areas of critical infrastructure, homeland security,safety and mission assurance, training, environmental assessments and restoration, engineering design, construction,electronic health record implementations and other sophisticated IT services across a broad federal and commercialcustomer base. These services and solutions range from engineering, design and construction services, energymanagement, renewables and energy distribution/smart-grid, to healthcare IT, data management and analytics, healthinfrastructure and biomedical support and research. Health, Energy and Civil Solutions also provides integrated securitysolutions and training expertise in the detection of chemical, biological, radiological, nuclear and explosive threats anddesigns and develops products and applied technologies that aid anti-terrorism and homeland security efforts, includingborder, port and security inspection systems and checked baggage explosive detection systems. Major customers of Health,Energy and Civil Solutions primarily include the U.S. federal government, state and local governmental agencies, foreigngovernments and commercial enterprises in various industries. Health, Energy and Civil Solutions represented 25%, 26%and 25% of total revenues for fiscal 2013, 2012 and 2011, respectively.
Intelligence and Cybersecurity Solutions
Intelligence and Cybersecurity Solutions provides systems and services focused on intelligence, surveillance, reconnaissanceand cybersecurity across a broad spectrum of national security programs. Intelligence and Cybersecurity Solutions provides
2 SAIC, Inc. Annual Report

PART I
quick reaction, manned and unmanned airborne, maritime, space and ground-based surveillance systems which leverage anunderstanding of the underlying physics of operating in space, weight and power-constrained environments. Intelligence andCybersecurity Solutions also provides intelligence collection, processing, exploitation, and dissemination solutions, includingsystems designed to optimize decision-making in high rate, large volume, and complex data environments. Intelligence andCybersecurity Solutions provides cybersecurity technology and information management solutions, analytics and forensics,accreditation and testing services, and products that protect data, applications, and modern information technologyinfrastructures from advanced and persistent threats as well as mission support in the geospatial, intelligence analysis,technical operations, and linguistics domains. Major customers of Intelligence and Cybersecurity Solutions include nationaland military intelligence agencies, and other federal, civilian and commercial customers in the national security complex.Intelligence and Cybersecurity Solutions represented 33%, 34% and 32% of total revenues for fiscal 2013, 2012 and 2011,respectively.
Corporate and Other
Corporate and Other includes the operations of our internal real estate management subsidiary, various corporate activities,certain corporate expense items that are not reimbursed by our U.S. Government customers and certain other revenue andexpense items excluded from a reportable segment’s performance.
For additional information regarding our reportable segments, see “Management’s Discussion and Analysis of FinancialCondition and Results of Operations” in Part II and Note 15 of the combined notes to consolidated financial statementscontained within this Annual Report on Form 10-K.
Acquisitions
The acquisition of businesses is part of our growth strategy to provide new or enhance existing capabilities and offerings tocustomers and to establish new or enhance existing relationships with customers. During the last five fiscal years, we havecompleted 14 acquisitions, most notably:
• In fiscal 2013, we acquired maxIT Healthcare Holdings, Inc., a provider of clinical, business and information technologyservices primarily to commercial hospital groups and other medical delivery organizations. This acquisition by ourHealth, Energy and Civil Solutions segment expanded our commercial consulting practice in electronic health record(EHR) implementation and optimization and strengthened our capabilities to provide these services to our federalhealthcare customers as those customers migrate to commercial off-the-shelf EHR applications.
• In fiscal 2012, we acquired Vitalize Consulting Solutions, Inc., a provider of clinical, business and information technologyservices for healthcare enterprises. This acquisition by our Health, Energy and Civil Solutions segment expanded ourcapabilities in both federal and commercial markets to help customers better address EHR implementation andoptimization demand.
• In fiscal 2011, we acquired Cloudshield Technologies, Inc., a provider of cybersecurity and management servicessolutions. This acquisition by our Intelligence and Cybersecurity Solutions segment enhanced our cybersecurity offeringsand positioned us to bring to market deep packet inspection solutions for high speed networks, enabling us to bettermeet emerging customer requirements. We also acquired Reveal Imaging Technologies, Inc., a provider of threatdetection products and services. This acquisition by our Health, Energy and Civil Solutions segment enhanced ourhomeland security solutions portfolio by adding U.S. Transportation Security Administration certified explosive detectionsystems for checked baggage screening to our passenger and cargo inspections systems product offerings.
• In fiscal 2010, we acquired R.W. Beck Group, Inc., a provider of business, engineering, energy and infrastructureconsulting services. This acquisition by our Health, Energy and Civil Solutions segment both enhanced our existingcapabilities and offerings in the areas of energy and infrastructure consulting services and provided new capabilities andofferings in disaster preparedness and recovery services. We also acquired Science, Engineering and TechnologyAssociates Corporation, a provider of intelligence, surveillance and reconnaissance information technologies. Thisacquisition by our Intelligence and Cybersecurity Solutions segment enhanced our service offerings and capabilities byadding information technologies that detect human behaviors to identify human-borne suicide bombers.
• In fiscal 2009, we acquired SM Consulting, Inc., a provider of language translation, interpretation and training, and otherconsulting services to federal, state and local governments and commercial customers. While this acquisition by ourIntelligence and Cybersecurity Solutions segment enhanced our existing capabilities and offerings, it also expanded ourrelationships with DoD customers in adjacent markets for these services. We also acquired Icon Systems, Inc., aprovider of laser-based systems and products for military training and testing. This acquisition by our Defense Solutionssegment enhanced our wireless live training offerings.
SAIC, Inc. Annual Report 3
PART I
Divestitures
From time to time, we divest non-strategic components of our business. During the last five fiscal years, our most notabledivestitures included:
• In fiscal 2013, we completed the sale of certain components of our business, which were historically included in ourHealth, Energy and Civil Solutions segment, primarily focused on providing operational test and evaluation services toU.S. Government customers.
• In fiscal 2012, we completed the sale of certain components of our business which were historically included in ourHealth, Energy and Civil Solutions segment, primarily focused on providing information technology services tointernational oil and gas companies.
Key Customers
Substantially all of our revenues and tangible long-lived assets are generated by or owned by entities located in theUnited States. In each of fiscal 2013, 2012 and 2011, over 85% of our total revenues were attributable to prime contractswith the U.S. Government or to subcontracts with other contractors engaged in work for the U.S. Government. Wegenerated more than 10% of our total revenues during each of the last three fiscal years from each of the U.S. Army andU.S. Navy. Each of these customers has a number of subsidiary agencies which have separate budgets and procurementfunctions. Our contracts may be with the highest level of these agencies or with the subsidiary agencies of these customers.
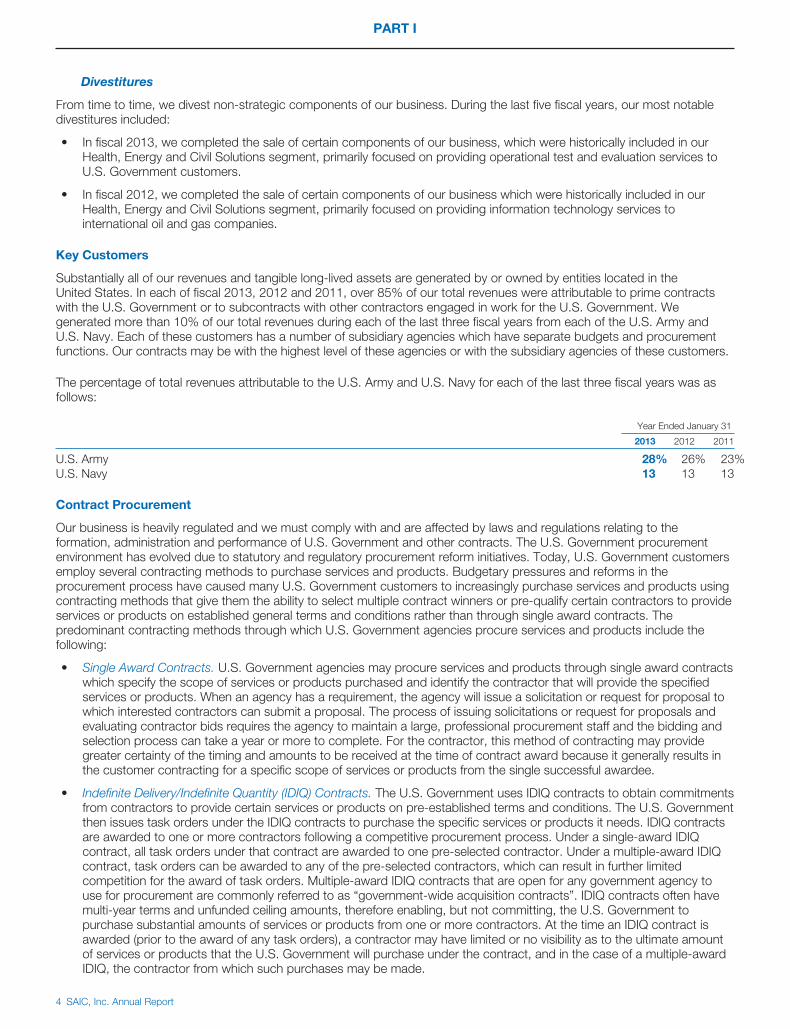
The percentage of total revenues attributable to the U.S. Army and U.S. Navy for each of the last three fiscal years was asfollows:
Year Ended January 31
2013 2012 2011
U.S. Army 28% 26% 23%U.S. Navy 13 13 13
Contract Procurement
Our business is heavily regulated and we must comply with and are affected by laws and regulations relating to theformation, administration and performance of U.S. Government and other contracts. The U.S. Government procurementenvironment has evolved due to statutory and regulatory procurement reform initiatives. Today, U.S. Government customersemploy several contracting methods to purchase services and products. Budgetary pressures and reforms in theprocurement process have caused many U.S. Government customers to increasingly purchase services and products usingcontracting methods that give them the ability to select multiple contract winners or pre-qualify certain contractors to provideservices or products on established general terms and conditions rather than through single award contracts. Thepredominant contracting methods through which U.S. Government agencies procure services and products include thefollowing:
• Single Award Contracts. U.S. Government agencies may procure services and products through single award contractswhich specify the scope of services or products purchased and identify the contractor that will provide the specifiedservices or products. When an agency has a requirement, the agency will issue a solicitation or request for proposal towhich interested contractors can submit a proposal. The process of issuing solicitations or request for proposals andevaluating contractor bids requires the agency to maintain a large, professional procurement staff and the bidding andselection process can take a year or more to complete. For the contractor, this method of contracting may providegreater certainty of the timing and amounts to be received at the time of contract award because it generally results inthe customer contracting for a specific scope of services or products from the single successful awardee.
• Indefinite Delivery/Indefinite Quantity (IDIQ) Contracts. The U.S. Government uses IDIQ contracts to obtain commitmentsfrom contractors to provide certain services or products on pre-established terms and conditions. The U.S. Governmentthen issues task orders under the IDIQ contracts to purchase the specific services or products it needs. IDIQ contractsare awarded to one or more contractors following a competitive procurement process. Under a single-award IDIQcontract, all task orders under that contract are awarded to one pre-selected contractor. Under a multiple-award IDIQcontract, task orders can be awarded to any of the pre-selected contractors, which can result in further limitedcompetition for the award of task orders. Multiple-award IDIQ contracts that are open for any government agency touse for procurement are commonly referred to as “government-wide acquisition contracts”. IDIQ contracts often havemulti-year terms and unfunded ceiling amounts, therefore enabling, but not committing, the U.S. Government topurchase substantial amounts of services or products from one or more contractors. At the time an IDIQ contract isawarded (prior to the award of any task orders), a contractor may have limited or no visibility as to the ultimate amountof services or products that the U.S. Government will purchase under the contract, and in the case of a multiple-awardIDIQ, the contractor from which such purchases may be made.
4 SAIC, Inc. Annual Report

PART I
• U.S. General Services Administration (GSA) Schedule Contracts. The GSA maintains listings of approved suppliers ofservices and products with agreed-upon prices for use throughout the U.S. Government. In order for a company toprovide services under a GSA Schedule contract, a company must be pre-qualified and awarded a contract by theGSA. When an agency uses a GSA Schedule contract to meet its requirements, the agency, or the GSA on behalf ofthe agency, conducts the procurement. The user agency, or the GSA on its behalf, evaluates the user agency’srequirements and initiates a competition limited to GSA Schedule qualified contractors. GSA Schedule contracts aredesigned to provide the user agency with reduced procurement time and lower procurement costs. Similar to IDIQcontracts, at the time a GSA Schedule contract is awarded, a contractor may have limited or no visibility as to theultimate amount of services or products that the U.S. Government will purchase under the contract.
We often team with other parties, including our competitors, to submit bids for large U.S Government procurements or otheropportunities where we believe that the combination of services and products that we can provide as a team will help us winand perform the contract. Our relationships with our teammates, including whether we serve as the prime contractor or as asubcontractor, vary with each contract opportunity and typically depend on the program, contract or customerrequirements, as well as the relative size, qualifications, capabilities, customer relationships and experience of our companyand our teammates.
Contracting with the U.S. Government also subjects us to substantial regulation and unique risks, including the U.S.Government’s ability to cancel any contract at any time through a termination for the convenience of the U.S. Government.Most of our contracts have cancellation terms that would permit us to recover all or a portion of our incurred costs and feesfor work performed where the U.S. Government issues a termination for convenience. These regulations and risks aredescribed in more detail below under “Business–Regulation” and “Risk Factors” in this Annual Report on Form 10-K.
Contract Types
Generally, the type of contract for our services and products is determined by or negotiated with the U.S. Government andmay depend on certain factors, including the type and complexity of the work to be performed, degree and timing of theresponsibility to be assumed by the contractor for the costs of performance, the extent of price competition and the amountand nature of the profit incentive offered to the contractor for achieving or exceeding specified standards or goals. Wegenerate revenues under several types of contracts, including the following:
• Cost-reimbursement contracts provide for reimbursement of our direct contract costs and allocable indirect costs, plusa fee. This type of contract is generally used when uncertainties involved in contract performance do not permit costs tobe estimated with sufficient accuracy to use a fixed-price contract. Cost-reimbursement contracts generally subject usto lower risk, but generally require us to use our best efforts to accomplish the scope of the work within a specified timeand amount of costs.
• Time-and-materials (T&M) contracts typically provide for negotiated fixed hourly rates for specified categories of directlabor plus reimbursement of other direct costs. This type of contract is generally used when there is uncertainty of theextent or duration of the work to be performed by the contractor at the time of contract award or it is not possible toanticipate costs with any reasonable degree of confidence. On T&M contracts, we assume the risk of providingappropriately qualified staff to perform these contracts at the hourly rates set forth in the contracts over the period ofperformance of the contracts.
• Fixed-price-level-of-effort (FP-LOE) contracts are substantially similar to T&M contracts except they require a specifiedlevel of effort over a stated period of time on work that can be stated only in general terms. This type of contract isgenerally used when the contractor is required to perform an investigation or study in a specific research anddevelopment area and to provide a report showing the results achieved based on the level of effort. Payment is basedon the effort expended rather than the results achieved.
• Firm-fixed-price (FFP) contracts provide for a fixed price for specified products, systems and/or services. This type ofcontract is generally used when the government acquires products and services on the basis of reasonably definitivespecifications and which have a determinable fair and reasonable price. These contracts offer us potential increasedprofits if we can complete the work at lower costs than planned. While FFP contracts allow us to benefit from costsavings, these contracts also increase our exposure to the risk of cost overruns.
Our earnings and profitability may vary materially depending on changes in the proportionate amount of revenues derivedfrom each type of contract, the nature of services or products provided, as well as the achievement of performanceobjectives and the stage of performance at which the right to receive fees, particularly under incentive and award feecontracts, is finally determined. Cost reimbursement and T&M contracts generally have lower profitability than FFP contracts.For the proportionate amount of revenues derived from each type of contract for fiscal 2013, 2012 and 2011, see “KeyPerformance Measures—Contract Types” in “Management’s Discussion and Analysis of Financial Condition and Results ofOperations” in Part II of this Annual Report on Form 10-K.
SAIC, Inc. Annual Report 5

PART I
Backlog
Backlog represents the estimated amount of future revenues to be recognized under negotiated contracts as work isperformed. Our backlog consists of funded backlog and negotiated unfunded backlog, each of which are described in“Management’s Discussion and Analysis of Financial Condition and Results of Operations” in Part II of this Annual Report onForm 10-K. We expect to recognize a substantial portion of our funded backlog as revenues within the next 12 months.However, the U.S. Government may cancel any contract at any time through a termination for the convenience of the U.S.Government. In addition, certain contracts with commercial customers include provisions that allow the customer to cancelat any time. Most of our contracts have cancellation terms that would permit us to recover all or a portion of our incurredcosts and fees for work performed. For additional discussion and analysis of backlog, see “Key Performance Measures—Bookings and Backlog” in “Management’s Discussion and Analysis of Financial Condition and Results of Operations” in PartII of this Annual Report on Form 10-K.
Competition
Competition for contracts is intense and we often compete against a large number of established multinational corporationswhich may have greater name recognition, financial resources and larger technical staffs than we do. We also competeagainst smaller, more specialized companies that concentrate their resources on particular areas, as well as the U.S.Government’s own capabilities and federal non-profit contract research centers. As a result of the diverse requirements ofthe U.S. Government and our commercial customers, we frequently collaborate with other companies to compete for largecontracts, and bid against these same companies in other situations. We believe that our principal competitors currentlyinclude the following companies:
• the engineering and technical services divisions of large defense contractors which provide U.S. Government IT servicesin addition to other hardware systems and products, including companies such as The Boeing Company, GeneralDynamics Corporation, Lockheed Martin Corporation, Northrop Grumman Corporation, BAE Systems plc, L-3Communications Corporation and Raytheon Company;
• contractors focused principally on technical services, including U.S. Government IT services, such as Battelle MemorialInstitute, Booz Allen Hamilton Inc., Engility Holdings, Inc., CACI International Inc, ManTech International Corporation,Serco Group plc and SRA International, Inc.;
• diversified commercial and U.S. Government IT providers, such as Accenture plc, Computer Sciences Corporation, HPEnterprise Services, International Business Machines Corporation and Unisys Corporation;
• contractors who provide engineering, consulting, design and construction services, such as Jacobs Engineering Group,URS Corporation, KBR, Inc. and CH2M Hill Companies Ltd.; and
• contractors focused on supplying homeland security product solutions, including American Science and Engineering,Inc., OSI Systems, Inc., L-3 Communications Corporation, General Electric Company and Smiths Group plc andcontractors providing supply chain management and other logistics services, including Agility Logistics Corp.
We compete on various factors, including our technical expertise and qualified professional and/or security-clearedpersonnel, our ability to deliver innovative cost-effective solutions in a timely manner, successful program execution, ourreputation and standing with customers, pricing and the size and geographic presence of our company.
The U.S. Government has indicated that it intends to increase industry competition for future procurement of products andservices, which has led to fewer sole source awards and more emphasis on cost competitiveness and affordability. Inaddition, procurement initiatives to improve efficiency, refocus priorities and enhance best practices could result in fewer newopportunities for our industry as a whole, which would intensify competition within the industry as companies compete for amore limited set of new programs.
Patents and Proprietary Information
Our technical services and products are not generally dependent upon patent protection, although we do selectively seekpatent protection. We claim a proprietary interest in certain of our products, software programs, methodologies and know-how. This proprietary information is protected by copyrights, trade secrets, licenses, contracts and other means. Weselectively pursue opportunities to license or transfer our technologies to third parties.
In connection with the performance of services, the U.S. Government has certain rights to inventions, data, software codesand related material that we develop under U.S. Government-funded contracts and subcontracts. Generally, the U.S.Government may disclose or license such information to third parties, including, in some instances, our competitors. In thecase of some subcontracts that we perform, the prime contractor may also have certain rights to the programs and productsthat we develop under the subcontract.
6 SAIC, Inc. Annual Report

PART I
Research and Development
We conduct research and development activities under customer-funded contracts and with company-funded internalresearch and development (IR&D) funds. IR&D efforts consist of projects involving basic research, applied research,development, and systems and other concept formulation studies. IR&D expenses are included in selling, general andadministrative expenses and are generally allocated to U.S. Government contracts. In fiscal 2013, 2012 and 2011, ourcompany-funded IR&D expense was $64 million, $92 million and $55 million, respectively. We charge expenses for researchand development activities performed under customer contracts directly to cost of revenues for those contracts.
Seasonality
The U.S. Government’s fiscal year ends on September 30 of each year. It is not uncommon for U.S. Government agenciesto award extra tasks or complete other contract actions in the timeframe leading up to the end of its fiscal year in order toavoid the loss of unexpended fiscal year funds, which may favorably impact our third fiscal quarter ending October 31. Inaddition, as a result of the cyclical nature of the U.S. Government budget process and a greater number of holidays in ourfourth fiscal quarter ending January 31, as compared to our third fiscal quarter ending October 31, we typically experiencesequentially higher revenues in our third fiscal quarter and lower revenues in our fourth fiscal quarter. For selected quarterlyfinancial data, see Note 19 of the combined notes to consolidated financial statements contained within this Annual Reporton Form 10-K.
Regulation
We are heavily regulated in most of the fields in which we operate. We provide services and products to numerous U.S.Government agencies and entities, including to the DoD, the intelligence community and DHS. When working with these andother U.S. Government agencies and entities, we must comply with various laws and regulations relating to the formation,administration and performance of contracts. U.S. Government contracts generally are subject to the Federal AcquisitionRegulation (FAR), which sets forth policies, procedures and requirements for the acquisition of goods and services by theU.S. Government, agency-specific regulations that implement or supplement FAR, such as the DoD’s Defense FederalAcquisition Regulation Supplement (DFARS) and other applicable laws and regulations. These regulations impose a broadrange of requirements, many of which are unique to government contracting, including various procurement, import andexport, security, contract pricing and cost, contract termination and adjustment, and audit requirements. Among otherthings, these laws and regulations:
• require certification and disclosure of all cost and pricing data in connection with certain contract negotiations;
• define allowable and unallowable costs and otherwise govern our right to reimbursement under various cost-based U.S.Government contracts;
• require reviews by the Defense Contract Audit Agency (DCAA), Defense Contract Management Agency (DCMA) andother U.S. Government agencies of compliance with government standards for a contractor’s business systems;
• restrict the use and dissemination of information classified for national security purposes and the export of certainproducts and technical data; and
• require us not to compete for work if an organizational conflict of interest, as defined by these laws and regulations,related to such work exists and/or cannot be appropriately mitigated.
The U.S. Government may revise its procurement practices or adopt new contract rules and regulations at any time. In orderto help ensure compliance with these complex laws and regulations, all of our employees are required to complete ethicstraining and other compliance training relevant to their position.
Some of our operations and service offerings involve access to and use by us of personally identifiable information and/orprotected health information, which activities are regulated by extensive federal and state privacy and data security lawsrequiring organizations to provide certain privacy protections and security safeguards for such information.
Internationally, we are subject to special U.S. Government laws and regulations, local government laws and regulations andprocurement policies and practices (including laws and regulations relating to bribery of foreign government officials, import-export control, investments, exchange controls and repatriation of earnings) and varying currency, political and economicrisks.
Environmental Matters
Our operations are subject to various foreign, federal, state and local environmental protection and health and safety lawsand regulations. In addition, our operations may become subject to future laws and regulations, including those related toclimate change and environmental sustainability. Failure to comply with these laws and regulations could result in civil,
SAIC, Inc. Annual Report 7

PART I
criminal, regulatory, administrative or contractual sanctions, including fines, penalties or suspension or debarment fromcontracting with the U.S. Government, or could cause us to incur costs to change, upgrade, remediate and/or close some ofour operations or properties. Some environmental laws hold current or previous owners or operators of businesses and realproperty liable for hazardous substance releases, even if they did not know of and were not responsible for the releases. Ourservices and operations involve the assessment or remediation of environmental hazards, as well as using, handling ordisposing of hazardous substances. Environmental laws may impose liability on any person who disposes, transports, orarranges for the disposal or transportation of hazardous substances to any site. In addition, we may face liability for personalinjury, property damage and natural resource damages relating to hazardous substance releases for which we are otherwiseliable or relating to exposure to or the mishandling of hazardous substances in connection with our current and formeroperations or services, including our current and prior ownership of properties. Although we do not currently anticipate thatthe costs of complying with, or the liabilities associated with, environmental laws will materially and adversely affect us, wecannot ensure that we will not incur material costs or liabilities in the future.
Employees and Consultants
As of January 31, 2013, we employed approximately 40,000 full and part-time employees. We also utilize consultants toprovide specialized technical and other services on specific projects.
The highly technical and complex services and products that we provide are dependent upon the availability of professional,administrative and technical personnel having high levels of training and skills and, in many cases, security clearances. Dueto the increased competition for qualified personnel, it has become more difficult to retain employees and meet all of ourneeds for employees in a timely manner, which has affected and may to continue to affect our growth. We intend to continueto devote significant resources to recruit, develop and retain qualified employees.
Company Website and Information
Our website can be accessed at www.saic.com. The website contains information about our company and operations.Through a link on the Investor Relations section of our website, copies of each of our filings with the Securities and ExchangeCommission (SEC) on Form 10-K, Form 10-Q and Form 8-K, and all amendments to those reports, can be viewed anddownloaded free of charge as soon as reasonably practicable after the reports and amendments are electronically filed withor furnished to the SEC. The information on our website is not incorporated by reference into and is not a part of this AnnualReport on Form 10-K.
You may request a copy of the materials identified in the preceding paragraph, at no cost, by writing or telephoning us at ourcorporate headquarters at the following:
SAIC, Inc.1710 SAIC DriveMcLean, VA 22102Attention: Corporate SecretaryTelephone: (703) 676-4300
Item 1A. Risk Factors
In your evaluation of our company and business, you should carefully consider the risks and uncertainties described below,together with information included elsewhere in this Annual Report on Form 10-K and other documents we file with the SEC.The risks and uncertainties described below are those that we have identified as material, but are not the only risks anduncertainties facing us. If any of these risks or uncertainties actually occurs, our business, financial condition or operatingresults could be materially harmed and the price of our stock could decline. Our business is also subject to general risks anduncertainties that affect many other companies, such as our ability to collect receivables, overall U.S. and global economicand industry conditions, geopolitical events, changes in laws or accounting rules, fluctuations in interest and exchange rates,terrorism, international conflicts, major health concerns, climate change or other disruptions of expected economic andbusiness conditions. Additional risks and uncertainties not currently known to us or that we currently believe are immaterialalso may materially harm our business, financial condition or operating results and result in a decline in the price of our stock.
Risks Relating to Our Business
We depend on government agencies as our primary customer and if our reputation or relationships with theseagencies were harmed, our future revenues and growth prospects would be adversely affected.
We generated over 85% of our total revenues during each of the last three fiscal years from contracts with the U.S.Government (including all branches of the U.S. military), either as a prime contractor or a subcontractor to other contractorsengaged in work for the U.S. Government. We generated more than 10% of our total revenues during each of the last threefiscal years from each of the U.S. Army and U.S. Navy. We expect to continue to derive most of our revenues from work
8 SAIC, Inc. Annual Report

PART I
performed under U.S. Government contracts. Our reputation and relationship with the U.S. Government, and in particularwith the agencies of the DoD and the U.S. intelligence community, are key factors in maintaining and growing our revenues.Negative press reports or publicity, which could pertain to employee or subcontractor misconduct, conflicts of interest, poorcontract performance, deficiencies in services, reports, products or other deliverables, information security breaches or otheraspects of our business, regardless of accuracy, could harm our reputation, particularly with these agencies. If our reputationis negatively affected, or if we are suspended or debarred from contracting with government agencies for any reason, theamount of business with government and other customers would decrease and our future revenues and growth prospectswould be adversely affected.
A decline in the U.S. Government defense budget, changes in spending or budgetary priorities or delays incontract awards may significantly and adversely affect our future revenues and limit our growth prospects.
Revenues under contracts with the DoD, either as a prime contractor or subcontractor to other contractors, representedapproximately 70% of our total revenues in fiscal 2013. Levels of DoD spending are difficult to predict and subject tosignificant risk. Our operating results could be adversely affected by spending caps or changes in the budgetary priorities ofthe U.S. Government or the DoD, as well as delays in program starts or the award of contracts or task orders undercontracts. Current U.S. Government spending levels for defense-related programs may not be sustained and futurespending and program authorizations may not increase or may decrease or shift to programs in areas in which we do notprovide services or are less likely to be awarded contracts. Such changes in spending authorizations and budgetary prioritiesmay occur as a result of the rapid growth of the federal budget deficit, increasing political pressure and legislation, includingthe Budget Control Act of 2011, designed to reduce overall levels of government spending, including through sequestration,shifts in spending priorities from defense-related programs as a result of competing demands for federal funds, the numberand intensity of military conflicts or other factors.
The Budget Control Act of 2011 enacted 10-year discretionary spending caps which are expected to generate over$1 trillion in savings for the U.S. Government, a substantial portion of which comes from DoD baseline spending reductions.In addition, the Budget Control Act of 2011 provides for additional automatic spending cuts (referred to as sequestration)totaling $1.2 trillion over nine years which are being implemented beginning in the current U.S. Government fiscal yearending September 30, 2013 (GFY13). These reduction targets will further reduce DoD and other federal agency budgets.Although the Office of Management and Budget has recently provided guidance to agencies on implementing sequestrationcuts, there remains much uncertainty about how exactly sequestration cuts will be implemented and the impact those cutswill have on contractors supporting the government. In light of the current uncertainty, we are not able to predict the impactof budget cuts, including sequestration, on our company or our financial results. However, we expect that budgetaryconstraints and concerns related to the national debt will continue to place downward pressure on DoD spending levels andthat implementation of the automatic spending cuts without change will reduce, delay or cancel funding for certain of ourcontracts – particularly those with unobligated balances—and programs and could adversely impact our operations, financialresults and growth prospects.
The U.S. Government also conducts periodic reviews of U.S. defense strategies and priorities, which may shift DoDbudgetary priorities, reduce overall U.S. Government spending or delay contract or task order awards for defense-relatedprograms, including programs from which we expect to derive a significant portion of our future revenues. In addition,changes to the DoD acquisition system and contracting models could affect whether and how we pursue certainopportunities and the terms under which we are able to do so. A significant decline in overall U.S. Government spending,including in the areas of national security, intelligence and homeland security, a significant shift in its spending priorities, thesubstantial reduction or elimination of particular defense-related programs or significant delays in contract or task orderawards for large programs could adversely affect our future revenues and limit our growth prospects.
Because we depend on U.S. Government contracts, a delay in the completion of the U.S. Government’s budgetprocess could delay procurement of the products, services and solutions we provide and have an adverse effecton our future revenues.
The funding of U.S. Government programs is subject to an annual congressional budget authorization and appropriationprocess. In years when the U.S. Government does not complete its budget process before the end of its fiscal year onSeptember 30, government operations are typically funded pursuant to a “continuing resolution,” which allows federalgovernment agencies to operate at spending levels approved in the previous budget cycle, but does not authorize newspending initiatives. When the U.S. Government operates under a continuing resolution, delays can occur in the procurementof the products, services and solutions that we provide and may result in new initiatives being cancelled. We have from timeto time experienced a decline in revenues in our fourth quarter ending January 31 and beyond as a result of this annualbudget cycle, and we could experience similar declines in revenues from future delays in the budget process. Certainagencies of the U.S. Government do not have approved GFY13 spending bills and are operating under a continuingresolution through September 30, 2013. The continuing resolution contains standard restrictions, including no new programstarts and no program increases beyond current service levels which could adversely impact our future revenues and growthprospects. In years when the U.S. Government fails to complete its budget process or to provide for a continuing resolution,
SAIC, Inc. Annual Report 9
PART I
a federal government shutdown may result. A federal government shutdown could in turn result in our incurrence ofsubstantial labor or other costs without reimbursement under customer contracts, or the delay or cancellation of keyprograms, which could have a negative effect on our cash flows and adversely affect our future results. In addition, whensupplemental appropriations are required to operate the U.S. Government or fund specific programs and passage oflegislation needed to approve any supplemental appropriation bill is delayed, the overall funding environment for our businesscould be adversely affected.
Our failure to comply with a variety of complex procurement rules and regulations could result in our beingliable for penalties, including termination of our U.S. Government contracts, disqualification from bidding onfuture U.S. Government contracts and suspension or debarment from U.S. Government contracting.
We must comply with laws and regulations relating to the formation, administration and performance of U.S. Governmentcontracts, which affect how we do business with our customers and may impose added costs on our business. Somesignificant statutes and regulations that affect us include:
• the FAR and supplements, which regulate the formation, administration and performance of U.S. Governmentcontracts;
• the Truth in Negotiations Act, which requires certification and disclosure of cost and pricing data in connection withcertain contract negotiations;
• the Procurement Integrity Act, which regulates access to competitor bid and proposal information and governmentsource selection information, and our ability to provide compensation to certain former government officials;
• the Civil False Claims Act, which provides for substantial civil penalties for violations, including for submission of a falseor fraudulent claim to the U.S. Government for payment or approval; and
• the U.S. Government Cost Accounting Standards, which impose accounting requirements that govern our right toreimbursement under certain cost-based U.S. Government contracts.
The FAR and many of our U.S. Government contracts contain organizational conflict of interest clauses that may limit ourability to compete for or perform certain other contracts or other types of services for particular customers. Organizationalconflicts of interest arise when we engage in activities that may make us unable to render impartial assistance or advice tothe U.S. Government, impair our objectivity in performing contract work, or provide us with an unfair competitive advantage.A conflict of interest issue that precludes our competition for or performance on a significant program or contract could harmour prospects.
The U.S. Government may adopt new contract rules and regulations or revise its procurement practices in amanner adverse to us at any time.
Our industry has experienced, and we expect it will continue to experience, significant changes to business practices as aresult of an increased focus on affordability, efficiencies, and recovery of costs, among other items. U.S. Governmentagencies may face restrictions or pressure regarding the type and amount of services that they may obtain from privatecontractors. Legislation, regulations and initiatives dealing with procurement reform, mitigation of potential conflicts of interestand environmental responsibility or sustainability, as well as any resulting shifts in the buying practices of U.S. Governmentagencies, such as increased usage of fixed price contracts, multiple award contracts and small business set-aside contracts,could have adverse effects on government contractors, including us. Any of these changes could impair our ability to obtainnew contracts or renew our existing contracts when those contracts are recompeted. Any new contracting requirements orprocurement methods could be costly or administratively difficult for us to implement and could adversely affect our futurerevenues, profitability and prospects.
Our business is subject to reviews, audits and cost adjustments by the U.S. Government, which, if resolvedunfavorably to us, could adversely affect our profitability, cash position or growth prospects.
U.S. Government agencies, including the DCAA, DCMA and others, routinely audit and review a contractor’s performanceon government contracts, indirect rates and pricing practices, and compliance with applicable contracting and procurementlaws, regulations and standards. They also review the adequacy of the contractor’s compliance with government standardsfor its business systems, including: a contractor’s accounting system, earned value management system, estimating system,materials management and accounting system, property management system and purchasing system.
Both contractors and the U.S. Government agencies conducting these audits and reviews have come under increasedscrutiny. As a result, the current audits and reviews have become more rigorous and the standards to which we are held arebeing more strictly interpreted, increasing the likelihood of an audit or review resulting in an adverse outcome. During thecourse of its current audits, the DCAA is closely examining and questioning several of our long established and disclosedpractices that it had previously audited and accepted, increasing the uncertainty as to the ultimate conclusion that will bereached.
10 SAIC, Inc. Annual Report

PART I
A finding of significant control deficiencies in our system audits or other reviews can result in decremented billing rates to ourU.S. Government customers until the control deficiencies are corrected and our remediations are accepted by DCMA.Government audits and reviews may conclude that our practices are not consistent with applicable laws and regulations andresult in adjustments to contract costs and mandatory customer refunds. Such adjustments can be applied retroactively,which could result in significant customer refunds. Our receipt of adverse audit findings or the failure to obtain an “approved”determination of our various business systems from the responsible U.S. Government agency could significantly andadversely affect our business, including our ability to bid on new contracts and our competitive position in the biddingprocess. A determination of non-compliance with applicable contracting and procurement laws, regulations and standardscould also result in the U.S. Government imposing penalties and sanctions against us, including withholding of payments,suspension of payments and increased government scrutiny that could delay or adversely affect our ability to invoice andreceive timely payment on contracts, perform contracts or compete for contracts with the U.S. Government.
Our indirect cost audits by the DCAA have not been completed for fiscal 2006 and subsequent fiscal years. Although wehave recorded contract revenues subsequent to fiscal 2005 based upon our estimate of costs that we believe will beapproved upon final audit or review, we do not know the outcome of any ongoing or future audits or reviews andadjustments and, if future adjustments exceed our estimates, our profitability would be adversely affected.
Our business is subject to governmental review and investigation which could adversely affect our financialposition, operating results and growth prospects.
We are routinely subject to governmental investigations relating to compliance with various laws and regulations with respectto our role as a contractor to federal, state and local government customers and in connection with performing services incountries outside the United States. If a review or investigation identifies improper or illegal activities, we may be subject tocivil or criminal penalties or administrative sanctions, including the termination of contracts, forfeiture of profits, the triggeringof price reduction clauses, suspension of payments, fines and suspension or debarment from doing business withgovernmental agencies. We may suffer harm to our reputation if allegations of impropriety are made against us, which wouldimpair our ability to win new contract awards or receive contract renewals. Penalties and sanctions are not uncommon in ourindustry. If we incur a material penalty or administrative sanction or otherwise suffer harm to our reputation, our revenues,profitability, cash position and future prospects could be adversely affected. More generally, increases in scrutiny andinvestigations from government organizations, legislative bodies or agencies into business practices and into major programssupported by contractors may lead to increased legal costs and may harm our reputation, revenues, profitability and growthprospects.
Misconduct of employees, subcontractors, agents and business partners could cause us to lose existingcontracts or customers and adversely affect our ability to obtain new contracts and customers and could have asignificant adverse impact on our business and reputation.
Misconduct could include fraud or other improper activities such as falsifying time or other records and violations of laws,including the Anti-Kickback Act. Other examples could include the failure to comply with our policies and procedures or withfederal, state or local government procurement regulations, regulations regarding the use and safeguarding of classified orother protected information, legislation regarding the pricing of labor and other costs in government contracts, laws andregulations relating to environmental, health or safety matters, bribery of foreign government officials, import-export control,lobbying or similar activities, and any other applicable laws or regulations. Any data loss or information security lapsesresulting in the compromise of personal information or the improper use or disclosure of sensitive or classified informationcould result in claims, remediation costs, regulatory sanctions against us, loss of current and future contracts and seriousharm to our reputation. Although we have implemented policies, procedures and controls to prevent and detect theseactivities, these precautions may not prevent all misconduct, and as a result, we could face unknown risks or losses. Ourfailure to comply with applicable laws or regulations or misconduct by any of our employees, subcontractors, agents orbusiness partners could damage our reputation and subject us to fines and penalties, restitution or other damages, loss ofsecurity clearance, loss of current and future customer contracts and suspension or debarment from contracting withfederal, state or local government agencies, any of which would adversely affect our business, reputation and our futureresults.
Due to the competitive process to obtain contracts and the likelihood of bid protests, we may be unable toachieve or sustain revenue growth and profitability.
We expect that a majority of the business that we seek in the foreseeable future will be awarded through a competitivebidding process. The U.S. Government has increasingly relied on contracts that are subject to a competitive biddingprocess, including IDIQ, GSA Schedule and other multi-award contracts, which has resulted in greater competition andincreased pricing pressure. For example, during fiscal 2013, we were not awarded the successor contract to the DISNGlobal Solutions (DGS) program with the Defense Information Systems Agency. In fiscal 2013, we recognized approximately$425 million in revenue on this program. Revenues from the DSG program are expected to be approximately $40 millionover the first half of fiscal 2014 as the activity transitions to the successor contractor. The competitive bidding processinvolves substantial costs and a number of risks, including significant cost and managerial time to prepare bids andproposals for contracts that may not be awarded to us, or that may be awarded but for which we do not receive meaningful
SAIC, Inc. Annual Report 11
PART I
task orders, and to the risk of inaccurately estimating the resources and costs that will be required to fulfill any contract wewin. Following contract award, we may encounter significant expense, delay, contract modifications or even contract loss asa result of our competitors protesting the award of contracts to us in competitive bidding. Any resulting loss or delay of startup and funding of work under protested contract awards may adversely affect our revenues and/or profitability. In addition,multi-award contracts require that we make sustained post-award efforts to obtain task orders under the contract. As aresult, we may not be able to obtain these task orders or recognize revenues under these multi-award contracts. Our failureto compete effectively in this procurement environment would adversely affect our revenues and/or profitability.
The U.S. Government may terminate, cancel, modify or curtail our contracts at any time prior to their completionand, if we do not replace them, we may be unable to achieve or sustain revenue growth and may suffer adecline in revenues and profitability.
Many of the U.S. Government programs in which we participate as a contractor or subcontractor extend for several yearsand include one or more base years and one or more option years. These programs are normally funded on an annual basis.Under our contracts, the U.S. Government generally has the right not to exercise options to extend or expand our contractsand may otherwise terminate, cancel, modify or curtail our contracts at its convenience. Any decisions by the U.S.Government not to exercise contract options or to terminate, cancel, modify or curtail our major programs or contractswould adversely affect our revenues, revenue growth and profitability.
We have experienced and continue to experience periodic performance issues under certain of our contracts. Some of ourcontracts involve the development of complex systems and products to achieve challenging customer goals in a competitiveprocurement environment. As a result, we sometimes experience technological or other performance difficulties, which havein the past and may in the future result in delays, cost overruns and failures in our performance of these contracts. If agovernment customer terminates a contract for default, we may be exposed to liability, including for excess costs incurredby the customer in procuring undelivered services and products from another source. Depending on the nature and value ofthe contract, a performance issue or termination for default could cause our actual results to differ from those anticipatedand could harm our reputation.
We face aggressive competition that can impact our ability to obtain contracts and therefore affect our futurerevenues and growth prospects.
Our business is highly competitive and we compete with larger companies that have greater name recognition, financialresources and larger technical staffs. We also compete with smaller, more specialized companies that are able toconcentrate their resources on particular areas. Additionally, we compete with the U.S. Government’s own capabilities andfederal non-profit contract research centers.
The markets in which we operate are characterized by rapidly changing technology and the needs of our customers changeand evolve regularly. Accordingly, our success depends on our ability to develop services and products that address thesechanging needs and to provide people and technology needed to deliver these services and products. To remaincompetitive, we must consistently provide superior service, technology and performance on a cost-effective basis to ourcustomers. Our competitors may be able to provide our customers with different or greater capabilities or technologies orbetter contract terms than we can provide, including technical qualifications, past contract experience, geographic presence,price and the availability of qualified professional personnel. In addition, our competitors may consolidate or establishteaming or other relationships among themselves or with third parties to increase their ability to address customers’ needs.Accordingly, we anticipate that larger or new competitors or alliances among competitors may emerge which may adverselyaffect our ability to compete.
A failure to attract, train and retain skilled employees, including our management team, would adversely affectour ability to execute our strategy and may disrupt our operations.
Our business involves the development of tailored solutions for our customers, a process that relies heavily upon theexpertise and services of our employees. Our continued success depends on our ability to recruit and retain highly trainedand skilled engineering, technical and professional personnel. Competition for skilled personnel is intense and competitorsaggressively recruit key employees. In addition, many U.S. Government programs require contractors to have securityclearances. Depending on the level of required clearance, security clearances can be difficult and time-consuming to obtainand personnel with security clearances are in great demand. Particularly in highly specialized areas, it has become moredifficult to retain employees and meet all of our needs for employees in a timely manner, which may affect our growth.Although we intend to continue to devote significant resources to recruit, train and retain qualified employees, we may not beable to attract, effectively train and retain these employees. Any failure to do so could impair our ability to perform ourcontractual obligations efficiently and timely meet our customers’ needs and win new business, which could adversely affectour future results. Additionally, we are concurrently completing the relocation of our corporate functions and the plannedseparation transaction, which has resulted in higher than typical employee turnover and will result in the transfer of
12 SAIC, Inc. Annual Report

PART I
personnel to the technical, engineering and enterprise information technology services business. While we are hiring andtraining replacement personnel, there is little redundancy or overlap of responsibilities in our corporate functions and loss ofkey personnel in critical functions could lead to lack of business continuity or disruptions in our operations, financial reportingor control processes.
In addition to attracting and retaining qualified engineering, technical and professional personnel, we believe that our successwill also depend on the continued employment of a highly qualified and experienced senior management team and its abilityto retain existing business and generate new business. Our senior management team is important to our business becausepersonal reputations and individual business relationships are a critical element of retaining and obtaining customer contractsin our industry, particularly with agencies performing classified operations. Our inability to retain appropriately qualified andexperienced senior executives could cause us to lose customers or new business opportunities.
We may not realize as revenues the full amounts reflected in our backlog, which could adversely affect ourexpected future revenues and growth prospects.
As of January 31, 2013 our total backlog was $17.9 billion including $5.4 billion in funded backlog. Due to the U.S.Government’s ability to not exercise contract options or to terminate, modify or curtail our programs or contracts and therights of our non-U.S. Government customers to cancel contracts and purchase orders in certain circumstances, we mayrealize less than expected or in some cases never realize revenues from some of the contracts that are included in ourbacklog. Our unfunded backlog, in particular, contains management’s estimate of amounts expected to be realized onunfunded contract work that may never be realized as revenues. If we fail to realize as revenues amounts included in ourbacklog, our future revenues, profitability and growth prospects could be adversely affected.
Our earnings and profitability may vary based on the mix of our contracts and may be adversely affected by ourfailure to accurately estimate and manage costs, time and resources.
We generate revenues under various types of contracts, which include cost reimbursement, T&M, FP-LOE and FFPcontracts. Our earnings and profitability may vary materially depending on changes in the proportionate amount of revenuesderived from each type of contract, the nature of services or products provided, as well as the achievement of performanceobjectives and the stage of performance at which the right to receive fees, particularly under incentive and award feecontracts, is finally determined. Cost reimbursement and T&M contracts are generally less profitable than FFP contracts. Ouroperating results in any period may also be affected, positively or negatively, by customer’s variable purchasing patterns ofour more profitable proprietary products.
Our profitability is adversely affected when we incur contract costs that we cannot bill to our customers. To varying degrees,each of our contract types involves some risk that we could underestimate the costs and resources necessary to fulfill thecontract. While FFP contracts allow us to benefit from cost savings, these contracts also increase our exposure to the risk ofcost overruns. Revenues from FFP contracts represented approximately 29% of our total revenues for fiscal 2013. Whenmaking proposals on these types of contracts, we rely heavily on our estimates of costs and timing to complete theassociated projects, as well as assumptions regarding technical issues. In each case, our failure to accurately estimate costsor the resources and technology needed to perform our contracts or to effectively manage and control our costs duringperformance could result, and in some instances has resulted, in reduced profits or in losses. More generally, any increasedor unexpected costs or unanticipated delays in the performance of our contracts, including costs and delays caused bycontractual disputes or other factors outside of our control, such as performance failures of our subcontractors, naturaldisasters or other force majeure events, could make our contracts less profitable than expected or unprofitable.
We use estimates in recognizing revenues and if we make changes to estimates used in recognizing revenues,our profitability may be adversely affected.
Revenues from our contracts are primarily recognized using the percentage-of-completion method or on the basis of partialperformance towards completion. These methodologies require estimates of total costs at completion, fees earned on thecontract, or both. This estimation process, particularly due to the technical nature of the services performed and the long-term nature of certain contracts, is complex and involves significant judgment. Adjustments to original estimates are oftenrequired as work progresses, experience is gained and additional information becomes known, even though the scope of thework required under the contract may not change. Any adjustment as a result of a change in estimate is recognized asevents become known. Changes in the underlying assumptions, circumstances or estimates could result in adjustments thatmay adversely affect our future financial results.
Our failure to comply with the terms of our deferred prosecution agreement or our administrative agreementwould have a material adverse effect on our business and future prospects.
In connection with the resolution of certain investigations related to our CityTime contract, we entered into a three yeardeferred prosecution agreement with the U.S. Attorney’s Office for the Southern District of New York. We also entered into afive year administrative agreement with the Army on behalf of the U.S. Government in order to confirm our continuing
SAIC, Inc. Annual Report 13
PART I
eligibility to enter into and perform contracts with the U.S. Government. Our compliance with the terms and conditions ofboth the deferred prosecution agreement and the administrative agreement, including the appointment of an independentmonitor, will require significant resources and management involvement. If we fail to comply with the deferred prosecutionagreement, including its ongoing legal and regulatory compliance obligations, the U.S. Attorney’s Office may extend the termof the deferred prosecution agreement or independent monitor or we could face criminal prosecution, additional damagesand penalties. If we fail to comply with the administrative agreement, the Army may extend the term of the administrativeagreement or initiate suspension or debarment proceedings against us. The CityTime investigations received adversepublicity and we are required to disclose information concerning the deferred prosecution agreement in certain proposals forcontracts, which may make it more difficult to compete effectively and may adversely affect our revenues and growthprospects. In addition, we continue to be subject to risks in connection with government reviews and investigations andother legal disputes unrelated to the CityTime matter, which may subject us to civil or criminal penalties or administrativesanctions, including the termination of contracts, forfeiture of profits, the triggering of price reduction clauses, suspension ofpayments, fines and suspension or debarment from doing business with governmental agencies.
Legal disputes could require us to pay potentially large damage awards and could be costly to defend, whichwould adversely affect our cash balances and profitability, and could damage our reputation.
We are subject to a number of lawsuits and claims described in “Legal Proceedings” in Part 1 of this Annual Report on Form10-K, as may be updated in our future filings with the SEC, including our Quarterly Reports on Form 10-Q. We are alsosubject to, and may become a party to, a variety of other litigation or claims and suits that arise from time to time in theordinary course of our business. Adverse judgments or settlements in some or all of these legal disputes may result insignificant monetary damages, penalties or injunctive relief against us. Any claims or litigation could be costly to defend, andeven if we are successful or if fully indemnified or insured, could damage our reputation and make it more difficult to competeeffectively or obtain adequate insurance in the future. Litigation and other claims, including those described in “LegalProceedings,” are subject to inherent uncertainties and management’s view of these matters may change in the future.
Our business and operations expose us to numerous legal and regulatory requirements and any violation ofthese requirements could harm our business.
We are subject to numerous federal, state and foreign legal requirements on matters as diverse as data privacy andprotection, employment and labor relations, immigration, taxation, anticorruption, import/export controls, trade restrictions,internal and disclosure control obligations, securities regulation and anti-competition. Compliance with diverse and changinglegal requirements is costly, time-consuming and requires significant resources. For example, the SEC’s adoption of acomplicated new rule requiring certain disclosures about “conflict minerals” in certain products increases our compliancecosts, requires management attention and could reduce our profitability and expose us to additional risk. We are alsofocused on expanding our business in certain identified growth areas, such as health information technology, energy andenvironment, which are highly regulated and may expose us to increased compliance risk. Violations of one or more of thesediverse legal requirements in the conduct of our business could result in significant fines and other damages, criminalsanctions against us or our officers, prohibitions on doing business and damage to our reputation. Violations of theseregulations or contractual obligations related to regulatory compliance in connection with the performance of customercontracts could also result in liability for significant monetary damages, fines and/or criminal prosecution, unfavorablepublicity and other reputational damage, restrictions on our ability to compete for certain work and allegations by ourcustomers that we have not performed our contractual obligations.
Our business and financial results could be negatively affected by cyber or other security threats.
As a U.S. Government contractor and a provider of information technology services operating in multiple regulated industriesand geographies, we handle sensitive information. Therefore, we are continuously exposed to cyber attacks and othersecurity threats, including physical break-ins. Any electronic or physical break-in or other security breach or compromisemay jeopardize security of information stored or transmitted through our information technology systems and networks. Thiscould lead to disruptions in mission-critical systems, unauthorized release of confidential or otherwise protected informationand corruption of data. Although we have implemented policies, procedures and controls to protect against, detect andmitigate these threats, we face advanced and persistent attacks on our information systems and attempts by others to gainunauthorized access to our information technology systems are becoming more sophisticated. These attempts includecovertly introducing malware to our computers and networks and impersonating authorized users, among others, and maybe perpetrated by well funded organized crime or state sponsored efforts. We seek to detect and investigate all securityincidents and to prevent their occurrence or recurrence. We continue to invest in and improve our threat protection,detection and mitigation policies, procedures and controls. In addition, we work with other companies in the industry andgovernment participants on increased awareness and enhanced protections against cybersecurity threats. However,because of the evolving nature and sophistication of these security threats, which can be difficult to detect, there can be noassurance that our policies, procedures and controls have or will detect or prevent any of these threats and we cannotpredict the full impact of any such past or future incident. We may experience similar security threats to the information
14 SAIC, Inc. Annual Report

PART I
technology systems that we develop, install or maintain under customer contracts. Although we work cooperatively with ourcustomers and other business partners to seek to minimize the impacts of cyber and other security threats, we must rely onthe safeguards put in place by those entities. Any remedial costs or other liabilities related to cyber or other security threatsmay not be fully insured or indemnified by other means. Occurrence of any of these security threats could expose us toclaims, contract terminations and damages and could adversely affect our reputation, ability to work on sensitive U.S.Government contracts, business operations and financial results.
Internal system or service failures could disrupt our business and impair our ability to effectively provide ourservices and products to our customers, which could damage our reputation and adversely affect our revenuesand profitability.
Any system or service disruptions, including those caused by ongoing projects to improve our information technologysystems and the delivery of services, as well as projects to separate our information technology infrastructure in connectionwith the planned separation transaction, whether through our shared services organization or outsourced services, if notanticipated and appropriately mitigated, could have a material adverse effect on our business including, among other things,an adverse effect on our ability to bill our customers for work performed on our contracts, collect the amounts that havebeen billed and produce accurate financial statements in a timely manner. We are also subject to systems failures, includingnetwork, software or hardware failures, whether caused by us, third-party service providers, cybersecurity threats, naturaldisasters, power shortages, terrorist attacks or other events, which could cause loss of data and interruptions or delays inour business, cause us to incur remediation costs, subject us to claims and damage our reputation. In addition, the failure ordisruption of our communications or utilities could cause us to interrupt or suspend our operations or otherwise adverselyaffect our business. Our property and business interruption insurance may be inadequate to compensate us for all lossesthat may occur as a result of any system or operational failure or disruption and, as a result, our future results could beadversely affected.
Customer systems failures could damage our reputation and adversely affect our revenues and profitability.
Many of the systems and networks that we develop, install and maintain for our customers involve managing and protectingpersonal information and information relating to national security and other sensitive government functions. While we haveprograms designed to comply with relevant privacy and security laws and restrictions, if a system or network that wedevelop, install or maintain were to fail or experience a security breach or service interruption, whether caused by us, third-party service providers, cybersecurity threats or other events, we may experience loss of revenue, remediation costs or faceclaims for damages or contract termination. Any such event could cause serious harm to our reputation and prevent us fromhaving access to or being eligible for further work on such systems and networks. Our errors and omissions liabilityinsurance may be inadequate to compensate us for all of the damages that we may incur and, as a result, our future resultscould be adversely affected.
We have contracts with the U.S. Government that are classified, which may limit investor insight into portions ofour business.
We derive a portion of our revenues from programs with the U.S. Government that are subject to security restrictions(classified programs), which preclude the dissemination of information that is classified for national security purposes. We arelimited in our ability to provide information about these classified programs, their risks or any disputes or claims relating tosuch programs. As a result, investors have less insight into our classified programs than our other businesses and thereforeless ability to fully evaluate the risks related to our classified business.
We have made and continue to make acquisitions, investments, joint ventures and divestitures that involvenumerous risks and uncertainties.
We selectively pursue strategic acquisitions, investments and joint ventures. These transactions require significant investmentof time and resources and may disrupt our business and distract our management from other responsibilities. Even ifsuccessful, these transactions could reduce earnings for a number of reasons, including the amortization of intangibleassets, impairment charges, acquired operations that are not yet profitable or the payment of additional consideration underearn-out arrangements if an acquisition performs better than expected. Acquisitions, investments and joint ventures posemany other risks that could adversely affect our reputation, operations or financial results, including:
• we may not be able to identify, compete effectively for or complete suitable acquisitions and investments at prices weconsider attractive;
• we may not be able to accurately estimate the financial effect of acquisitions and investments on our business and wemay not realize anticipated synergies or acquisitions may not result in improved operating performance;
• we may encounter performance problems with acquired technologies, capabilities and products, particularly withrespect to those that are still in development when acquired;
SAIC, Inc. Annual Report 15

PART I
• we may have trouble retaining key employees and customers of an acquired business or otherwise integrating suchbusinesses, such as incompatible accounting, information management, or other control systems, which could result inunforeseen difficulties;
• we may assume material liabilities that were not identified as part of our due diligence or for which we are unable toreceive a purchase price adjustment or reimbursement through indemnification;
• we may assume legal or regulatory risks, particularly with respect to smaller businesses that have immature businessprocesses and compliance programs;
• acquired entities or joint ventures may not operate profitably, which could adversely affect our operating income oroperating margins and we may be unable to recover investments in any such acquisitions;
• acquisitions, investments and joint ventures may require us to spend a significant amount of cash or to issue capitalstock, resulting in dilution of ownership; and
• we may not be able to effectively influence the operations of our joint ventures or we may be exposed to certainliabilities if our joint venture partners do not fulfill their obligations.
If our acquisitions, investments or joint ventures fail, perform poorly or their value is otherwise impaired for any reason,including contractions in credit markets and global economic conditions, our business and financial results could beadversely affected.
In addition, we periodically divest businesses, including businesses that are no longer a part of our ongoing strategic plan.These divestitures similarly require significant investment of time and resources, may disrupt our business, distractmanagement from other responsibilities and may result in losses on disposal or continued financial involvement in thedivested business, including through indemnification, guarantee or other financial arrangements, for a period of time followingthe transaction, which would adversely affect our financial results.
Goodwill and other intangible assets represent approximately 40% of our total assets and any impairment ofthese assets could negatively impact our results of operations.
Intangible assets, including goodwill, are tested for impairment annually or whenever events or changes in circumstancesindicate that the carrying value may not be recoverable. Examples of events or changes in circumstances indicating that thecarrying value of intangible assets may not be recoverable could include a significant adverse change in legal factors or in thebusiness climate, an adverse action or assessment by a regulator, unanticipated competition, loss of key personnel, or amore-likely-than-not expectation that a reporting unit or a significant portion of a reporting unit will be sold or otherwisedisposed of. We face continued uncertainty in our business environment due to the substantial fiscal and economicchallenges facing the U.S. Government, such as the manner in which budget cuts are implemented, including sequestration,and issues related to the nation’s debt ceiling. Any future impairment of goodwill or other intangible assets would have anegative impact on our profitability and financial results.
We depend on our teaming arrangements and relationships with other contractors and subcontractors. If we arenot able to maintain these relationships, or if these parties fail to satisfy their obligations to us or the customer,our revenues, profitability and growth prospects could be adversely affected.
We rely on our teaming relationships with other prime contractors and subcontractors in order to submit bids for largeprocurements or other opportunities where we believe the combination of services and products provided by us and theother companies will help us to win and perform the contract. Our future revenues and growth prospects could be adverselyaffected if other contractors eliminate or reduce their contract relationships with us, or if the U.S. Government terminates orreduces these other contractors’ programs, does not award them new contracts or refuses to pay under a contract.Companies that do not have access to U.S. Government contracts may perform services as our subcontractor and thatexposure could enhance such companies’ prospect of securing a future position as a prime U.S. Government contractorwhich could increase competition for future contracts and impair our ability to perform on contracts.
We may have disputes with our subcontractors arising from, among other things, the quality and timeliness of workperformed by the subcontractor, customer concerns about the subcontractor, our failure to extend existing task orders orissue new task orders under a subcontract, our hiring of a subcontractor’s personnel or the subcontractor’s failure to complywith applicable law. Current uncertain economic conditions heighten the risk of financial stress of our subcontractors, whichcould adversely impact their ability to meet their contractual requirements to us. If any of our subcontractors fail to timelymeet their contractual obligations or have regulatory compliance or other problems, our ability to fulfill our obligations as aprime contractor or higher tier subcontractor may be jeopardized. Significant losses could arise in future periods andsubcontractor performance deficiencies could result in our termination for default. A termination for default could eliminate arevenue source, expose us to liability and have an adverse effect on our ability to compete for future contracts and taskorders, especially if the customer is an agency of the U.S. Government.
16 SAIC, Inc. Annual Report
PART I
We provide professional engineering and other services, including engineering-procurement-construction,design build, project delivery and commissioning, in connection with complex projects that involve significantrisks and may require long-term capital.
In connection with certain projects, we may commit to a specific completion date or performance standards, which mayexpose us to significant additional costs and reputational damage if we miss the completion date or fail to achieve theperformance standards, including agreed upon financial damages. Project performance can be affected by a number offactors beyond our control, including delays from governmental inaction, public opposition, inability to obtain financing,weather, unavailability of materials, changes in project scope, accidents, environmental hazards, labor disruptions and otherfactors. If we assume risks related to these events, such risks may not be insurable or may only be insurable onunacceptable terms. If these events occur, the total project costs could exceed our estimates and we could experiencereduced profits or, in some cases, incur a loss on a project, which may reduce or eliminate overall profitability and have anadverse effect on our financial position and cash flows.
In some projects, we may commit substantial resources before receiving payments, either because of project cash flowtiming or because we agree to delay payment for services until after project completion. We may also provide interim orother financing before the project is completed or otherwise secures capital from other sources. If a project is not successful,if a customer is unable to repay us, or if any source of financing does not provide its anticipated capital, we could incurlosses, including amounts relating to work performed prior to execution of a customer contract or in connection withfinancing we provided, which would have an adverse effect on our financial position and cash flows. Tight credit or equitymarkets could increase this risk, as customers or other financing sources may be unable to secure funds.
Our services and operations sometimes involve using, handling or disposing of hazardous substances, whichcould expose us to potentially significant liabilities.
Some of our services and operations involve the assessment or remediation of environmental hazards, as well as the use,handling or disposal of hazardous substances. These activities and our operations generally subject us to extensive foreign,federal, state and local environmental protection and health and safety laws and regulations, which, among other things,require us to incur costs to comply with these regulations and could impose liability on us for handling or disposing ofhazardous substances. Furthermore, failure to comply with these environmental protection and health and safety laws andregulations could result in civil, criminal, regulatory, administrative or contractual sanctions, including fines, penalties orsuspension or debarment from contracting with the U.S. Government. Our current and previous ownership and operation ofreal property also subjects us to environmental protection laws, some of which hold current or previous owners or operatorsof businesses and real property liable for hazardous substance releases, even if they did not know of and were notresponsible for the releases. If we have any violations of, or incur liabilities pursuant to, these laws or regulations, our financialcondition and operating results could be adversely affected.
We could incur significant liabilities and suffer negative publicity if our inspection or detection systems fail todetect bombs, explosives, weapons, contraband or other threats.
We design, develop, manufacture, sell, service and maintain various inspection systems that are designed to assist in thedetection of bombs, explosives, weapons, contraband or other threats. In some instances, we also train operators of suchsystems. Many of these systems utilize software algorithms that are probabilistic in nature and subject to significant technicallimitations. Many of these systems are also dependent on the performance of their operators. There are many factors, someof which are beyond our control, which could result in the failure of our products to help detect the presence of bombs,explosives, weapons, contraband or other threats. Some of these factors could include operator error, inherent limitations inour systems, and misuse or malfunction of our systems. The failure of our systems to help detect the presence of any ofthese dangerous materials could lead to injury, death and extensive property damage and may lead to product liability,professional liability, or other claims against us. Further, if our systems fail to, or are perceived to have failed to help detect athreat, the negative publicity from such incident could have a material adverse effect on our business.
Our insurance may be insufficient to protect us from product and other liability claims or losses.
We maintain insurance coverage with third-party insurers as part of our overall risk management strategy and because someof our contracts require us to maintain specific insurance coverage limits. However, not every risk or liability is or can beprotected by insurance, and, for those risks we insure, the limits of coverage we purchase or that are reasonably obtainablein the market may not be sufficient to cover all actual losses or liabilities incurred. If any of our third-party insurers fail, cancelour coverage or otherwise are unable to provide us with adequate insurance coverage, then our overall risk exposure andour operational expenses would increase and the management of our business operations would be disrupted. Ourinsurance may be insufficient to protect us from significant product and other liability claims or losses. Moreover, there is arisk that commercially available liability insurance will not continue to be available to us at a reasonable cost, if at all. If liabilityclaims or losses exceed our current or available insurance coverage, our business, financial position, operating results and
SAIC, Inc. Annual Report 17
PART I
prospects may be harmed. Regardless of the adequacy of our liability insurance coverages, any significant claim may havean adverse effect on our industry and market reputation, leading to a substantial decrease in demand for our products andservices and reduced revenues.
We face risks associated with our international business.
Our international business operations may be subject to additional and different risks than our U.S. business. Failure tocomply with U.S. Government laws and regulations applicable to international business, such as the Foreign CorruptPractices Act or U.S. export control regulations, could have an adverse impact on our business with the U.S. Governmentand could expose us to administrative, civil or criminal penalties. Additionally, these risks relating to international operationsmay expose us to potentially significant contract losses.
In some countries, there is an increased chance for economic, legal or political changes that may adversely affect theperformance of our services, sale of our products or repatriation of our profits. International transactions can also involveincreased financial and legal risks arising from foreign exchange rate variability, imposition of tariffs or additional taxes,restrictive trade policies and differing legal systems. We provide services and products in support of U.S. Governmentcustomers in countries with governments that may be or may become unstable, which increases the risk of an incidentresulting in injury or loss of life, or damage or destruction of property, or inability to meet our contractual obligations.Although our international operations have historically generated a small proportion of our revenues, we do not know theimpact that these regulatory, geopolitical and other factors may have on our business in the future and any of these factorscould adversely affect our business.
Our financial results may be adversely affected by our underfunded United Kingdom pension plan.
Our financial results may be adversely impacted by the expense amount that we record for a pension plan that we sponsorin the United Kingdom for plan participants that primarily performed services on an expired customer contract. While benefitsare no longer accruing under this plan, we have continuing defined benefit pension obligations with respect to certain planparticipants.
We recognize all net actuarial gains or losses in excess of 10% of the greater of the market-related value of plan assets orthe plans’ projected benefit obligation (which is referred to as the “corridor”) annually in continuing operations in the fourthquarter of each fiscal year and whenever a plan is remeasured, which may cause our pension expense in our fourth quarterto be volatile and our financial results to fluctuate, potentially adversely. Our pension plan expense and the amount andtiming of required contributions may also be affected by economic factors, such as the level of return on pension plan assetsand changes in interest rates, legislation and other government regulatory changes.
We have only a limited ability to protect our intellectual property rights, which are important to our success. Ourfailure to adequately protect our proprietary information and intellectual property rights could adversely affectour competitive position.
We rely principally on trade secrets to protect much of our intellectual property in cases where we do not believe that patentprotection is appropriate or obtainable. However, trade secrets are difficult to protect. Although our employees are subject toconfidentiality obligations, this protection may be inadequate to deter or prevent misappropriation of our confidentialinformation. We may be unable to detect unauthorized use of our intellectual property or otherwise take appropriate steps toenforce our rights. Failure to obtain or maintain trade secret protection could adversely affect our competitive businessposition. If we are unable to prevent third parties from infringing or misappropriating our copyrights, trademarks or otherproprietary information, our competitive position could be adversely affected. In addition, in connection with the performanceof services, the U.S. Government has certain rights to inventions, data, software codes and related material that we developunder government-funded contracts and subcontracts, which means that U.S. Government may disclose or license ourinformation to third parties, including, in some instances, our competitors.
In the course of conducting our business, we may inadvertently infringe the intellectual property rights of others, resulting inclaims against us or our customers. Our contracts generally indemnify our customers for third-party claims for intellectualproperty infringement by the services and products we provide. The expense of defending these claims may adversely affectour financial results.
Business disruptions caused by natural disasters and other crises could adversely affect our profitability and ouroverall financial position.
We have significant operations located in regions of the United States that may be exposed to damaging storms and othernatural disasters, such as hurricanes, tornadoes, blizzards, flooding, wildfires or earthquakes. Our business could also bedisrupted by pandemics and other national or international crises. Although preventative measures may help mitigate thedamage from such occurrences, the damage and disruption to our business resulting from any of these events may be
18 SAIC, Inc. Annual Report

PART I
significant. If our insurance and other risk mitigation mechanisms are not sufficient to recover all costs, including loss ofrevenues from sales to customers, we could experience a material adverse effect on our financial position and results ofoperations. Performance failures and disruptions by our subcontractors due to these types of events may also adverselyaffect our ability to perform our obligations on a prime contract, which could reduce our profitability due to damages or othercosts that may not be fully recoverable from the subcontractor or the customer and could result in a termination of the primecontract and have an adverse effect on our ability to compete for future contracts.
Our financial results may vary significantly from period-to-period.
Our financial results may fluctuate as a result of a number of factors, many of which are outside of our control. For thesereasons, comparing our operating results on a period-to-period basis may not be meaningful, and you should not rely on ourpast results as an indication of our future performance. Our financial results may be negatively affected by any of the riskfactors listed in this “Risk Factors” section and other matters described elsewhere in this Annual Report on Form 10-K.
Risks Relating to the Proposed Separation Transaction
We are pursuing a plan to spin-off our technical, engineering and enterprise information technology servicesbusiness into a new, independent publicly traded company. We are incurring significant costs in connectionwith this transaction, which also requires significant time and attention of our management and we may not beable to complete the transaction or, if the transaction is completed, realize the anticipated benefits.
In August 2012, we announced a plan to separate into two independent public companies through a spin-off of ourtechnical, engineering and enterprise information technology services business. Completion of the transaction will becontingent upon the approval of our board of directors, our receipt of an opinion from tax counsel and a ruling from the IRSas to the tax-free nature of the transaction, the effectiveness of a Registration Statement on Form 10 and certain otherconditions. Additionally, our ability to complete the spin-off in a timely manner, if at all, could be affected by several factors,including but not limited to:
• our ability to obtain any necessary financing for the newly-created entity on acceptable terms;
• our ability to obtain any necessary consents or approvals;
• changes in governmental regulations;
• changes in the underlying businesses, contracts, or customers; and
• political and economic conditions at the time of the transaction.
For these and other reasons, we may not be able to complete the spin-off within the expected time frame or at all. Even if thetransaction is completed, we may not realize some or all of the anticipated benefits from the spin-off, including additionalrevenues as a result of removing certain organizational conflicts of interest and a reduced cost structure. Moreover, we haveincurred and will continue to incur significant costs in connection with this transaction, which has and will affect ourprofitability and operating results through completion of the transaction. Executing the proposed spin-off also requiressignificant time and attention from management, which could distract them from other tasks in operating our business andexecuting our other strategic initiatives.
The proposed spin-off of our technical, engineering and enterprise information technology services businesscould result in substantial tax liability to us and our stockholders.
Among the conditions to completing the spin-off will be our receipt of a private letter ruling from the IRS and an opinion of taxcounsel substantially to the effect that, for U.S. federal income tax purposes, the spin-off and certain related transactions willqualify for tax-free treatment under certain sections of the Internal Revenue Code. However, if the factual assumptions orrepresentations made in the private letter ruling request or the opinion are inaccurate or incomplete in any material respect,including those relating to the past and future conduct of our business, we will not be able to rely on the ruling or the opinion.Furthermore, the opinion will cover certain matters on which the IRS does not rule and will not be binding on the IRS or thecourts. Accordingly, the IRS or the courts may challenge the conclusions stated in the opinion and such challenge could prevail.
If, notwithstanding receipt of the private letter ruling and opinion, the spin-off and certain related transactions are determinedto be taxable, we would be subject to a substantial tax liability. In addition, if the spin-off transaction is taxable, each holderof our common stock who receives shares of the new company would generally be treated as receiving a taxable distributionof property in an amount equal to the fair market value of the shares received, thereby potentially increasing such holder’stax liability.
Even if the spin-off otherwise qualifies as a tax-free transaction, the distribution could be taxable to us (but not to ourstockholders) in certain circumstances if future significant acquisitions of our stock or the stock of the new technical,engineering and enterprise information technology services company are deemed to be part of a plan or series of relatedtransactions that include the spin-off. In this event, the resulting tax liability could be substantial. In connection with the spin-
SAIC, Inc. Annual Report 19

PART I
off, we expect to enter into a tax matters agreement with the new company, under which it will agree not to enter into anytransaction without our consent that could cause any portion of the spin-off to be taxable to us and to indemnify us for anytax liabilities resulting from such transactions. These obligations and potential tax liabilities may discourage, delay or preventa change of control of us or of the technical, engineering and enterprise information technology services business.
Risks Relating to SAIC’s Stock
We cannot assure you that we will continue to pay dividends on SAIC common stock.
In March 2012, our board of directors approved the initiation of a quarterly dividend program. The timing, declaration,amount and payment of any future dividends fall within the discretion of our board of directors and will depend on manyfactors, including our available cash, estimated cash needs, earnings, financial condition, operating results, capitalrequirements, as well as limitations in our contractual agreements, applicable law, regulatory constraints, industry practiceand other business considerations that our board of directors considers relevant. A change in our dividend program couldhave an adverse effect on the market price of SAIC common stock.
Provisions in SAIC’s charter documents and under Delaware law could delay or prevent transactions that manystockholders may favor.
Some provisions of SAIC’s certificate of incorporation and bylaws may have the effect of delaying, discouraging orpreventing a merger or acquisition that our stockholders may consider favorable, including transactions in whichstockholders might receive a premium for their shares. These restrictions, which may also make it more difficult for ourstockholders to elect directors not endorsed by our current directors and management, include the following:
• SAIC’s certificate of incorporation provides that its bylaws and certain provisions of its certificate of incorporation maybe amended by only two-thirds or more voting power of all of the outstanding shares entitled to vote. Thesesupermajority voting requirements could impede our stockholders’ ability to make changes to SAIC’s certificate ofincorporation and bylaws.
• SAIC’s certificate of incorporation contains certain supermajority voting provisions, which generally provide that mergersand certain other business combinations between SAIC and a related person be approved by the holders of securitieshaving at least 80% of SAIC’s outstanding voting power, as well as by the holders of a majority of the voting power ofsuch securities that are not owned by the related person.
• SAIC’s stockholders may not act by written consent. As a result, a holder, or holders, controlling a majority of SAIC’scapital stock are limited in their ability to take certain actions other than in connection with its annual stockholders’meeting or a special meeting called at the request of qualified stockholders as provided in SAIC’s certificate ofincorporation and bylaws.
• SAIC’s board of directors may issue, without stockholder approval, shares of undesignated preferred stock. The abilityto authorize undesignated preferred stock makes it possible for SAIC’s board of directors to issue preferred stock withvoting or other rights or preferences that could impede the success of any attempt to acquire us.
As a Delaware corporation, SAIC is also subject to certain restrictions on business combinations. Under Delaware law, acorporation may not engage in a business combination with any holder of 15% or more of its capital stock unless the holderhas held the stock for three years, or among other things, SAIC’s board of directors has approved the business combinationor the transaction pursuant to which such person became a 15% holder prior to the time the person became a 15% holder.
Forward-Looking Statement Risks
You may not be able to rely on forward-looking statements.
This Annual Report on Form 10-K contains forward-looking statements that are based on our management’s belief andassumptions about the future in light of information currently available to our management. In some cases, you can identifyforward-looking statements by words such as “may,” “will,” “should,” “expects,” “intends,” “plans,” “anticipates,” “believes,”“estimates,” “predicts,” “potential,” “continue,” and similar words or phrases or the negative of these words or phrases.These statements relate to future events or our future financial performance, and involve known and unknown risks,uncertainties and other factors that may cause our actual results, levels of activity, performance or achievements to bematerially different from any future results, levels of activity, performance or achievements expressed or implied by theseforward-looking statements. Although we believe that the expectations reflected in the forward-looking statements arereasonable when made, we cannot guarantee future results, levels of activity, performance or achievements. There are anumber of important factors that could cause our actual results to differ materially from those results anticipated by ourforward-looking statements, which include, but are not limited to:
• developments in the U.S. Government defense budget, including budget reductions, sequestration, implementation ofspending limits or changes in budgetary priorities, or delays in the U.S. Government budget process or approval ofraising the debt ceiling;
20 SAIC, Inc. Annual Report

PART I
• delays in the U.S. Government contract procurement process or the award of contracts and delays or loss of contractsas a result of competitor protests;
• changes in U.S. Government procurement rules, regulations, and practices;
• our compliance with various U.S. Government and other government procurement rules and regulations;
• governmental reviews, audits and investigations of our company;
• our ability to effectively compete and win contracts with the U.S. Government and other customers;
• our ability to attract, train and retain skilled employees, including our management team, and to obtain securityclearances for our employees;
• our ability to accurately estimate costs associated with our firm-fixed-price and other contracts;
• our ability to comply with certain agreements entered into in connection with the CityTime matter;
• resolution of legal and other disputes with our customers and others or legal or regulatory compliance issues;
• cybersecurity, data security or other security threats, system failures or other disruptions of our business;
• our ability to effectively acquire businesses and make investments;
• our ability to maintain relationships with prime contractors, subcontractors and joint venture partners;
• our ability to manage performance and other risks related to customer contracts, including complex engineering ordesign build projects;
• the failure of our inspection or detection systems to detect threats;
• the adequacy of our insurance programs designed to protect us from significant product or other liability claims;
• our ability to manage risks associated with our international business;
• our ability to declare future dividends based on our earnings, financial condition, capital requirements and other factors,including compliance with applicable law and our agreements;
• risks associated with the proposed spin-off of our technical, engineering and enterprise information technology servicesbusiness, such as disruption to business operations, unanticipated expenses, significant transaction costs and/orunknown liabilities, the timing of the spin-off or a failure to complete the proposed spin-off or realize the expectedbenefits of the proposed spin-off; and
• our ability to execute our business plan and long-term management initiatives effectively and to overcome these andother known and unknown risks that we face.
We do not undertake any obligation to update or revise any of the forward-looking statements to reflect events,circumstances, changes in expectations, or the occurrence of unanticipated events after the date of those statements or toconform these statements to actual results.
Item 1B. Unresolved Staff Comments
None.
Item 2. Properties
As of January 31, 2013, we conducted our operations in approximately 386 offices located in 45 states, the District ofColumbia and various foreign countries. We consider our facilities suitable and adequate for our present needs. We occupyapproximately 9.2 million square feet of floor space. Of this amount, we own approximately 2.1 million square feet, and theremaining balance is leased. Our major locations are in the Washington, D.C. and San Diego, California metropolitan areas,where we occupy approximately 2.8 million square feet of floor space and 0.6 million square feet of floor space, respectively.
SAIC, Inc. Annual Report 21
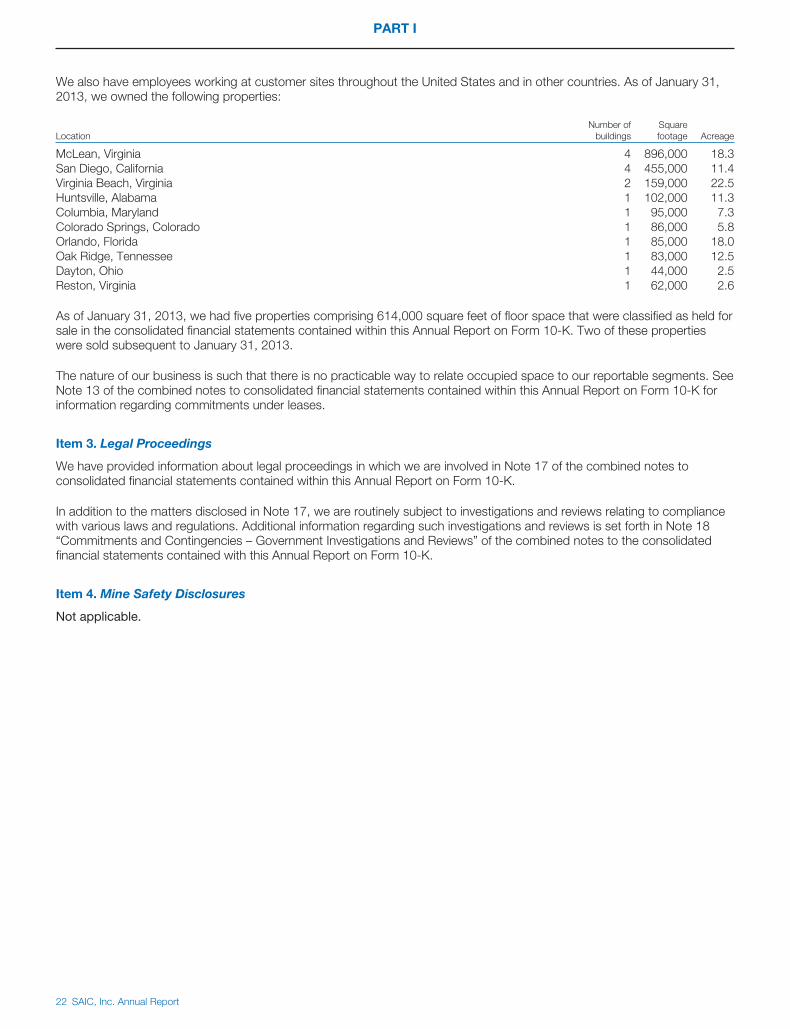
PART I
We also have employees working at customer sites throughout the United States and in other countries. As of January 31,2013, we owned the following properties:
LocationNumber of
buildingsSquarefootage Acreage
McLean, Virginia 4 896,000 18.3San Diego, California 4 455,000 11.4Virginia Beach, Virginia 2 159,000 22.5Huntsville, Alabama 1 102,000 11.3Columbia, Maryland 1 95,000 7.3Colorado Springs, Colorado 1 86,000 5.8Orlando, Florida 1 85,000 18.0Oak Ridge, Tennessee 1 83,000 12.5Dayton, Ohio 1 44,000 2.5Reston, Virginia 1 62,000 2.6
As of January 31, 2013, we had five properties comprising 614,000 square feet of floor space that were classified as held forsale in the consolidated financial statements contained within this Annual Report on Form 10-K. Two of these propertieswere sold subsequent to January 31, 2013.
The nature of our business is such that there is no practicable way to relate occupied space to our reportable segments. SeeNote 13 of the combined notes to consolidated financial statements contained within this Annual Report on Form 10-K forinformation regarding commitments under leases.
Item 3. Legal Proceedings
We have provided information about legal proceedings in which we are involved in Note 17 of the combined notes toconsolidated financial statements contained within this Annual Report on Form 10-K.
In addition to the matters disclosed in Note 17, we are routinely subject to investigations and reviews relating to compliancewith various laws and regulations. Additional information regarding such investigations and reviews is set forth in Note 18“Commitments and Contingencies – Government Investigations and Reviews” of the combined notes to the consolidatedfinancial statements contained with this Annual Report on Form 10-K.
Item 4. Mine Safety Disclosures
Not applicable.
22 SAIC, Inc. Annual Report

PART I
Executive and Other Key Officers of the Registrant
The following is a list of the names and ages (as of March 26, 2013) of our executive and other key officers, indicating allpositions and offices held by each such person and each such person’s business experience during at least the past fiveyears. Except as otherwise noted, each of the persons listed below has served in his or her present capacity for us for atleast the past five years. All such persons have been elected to serve until their successors are elected and qualified or untiltheir earlier resignation or removal. Science Applications became a 100%-owned subsidiary of SAIC in October 2006through a reorganization merger in connection with SAIC’s initial public offering and listing on the New York Stock Exchange.Accordingly, in the following biographical information, references to terms of service as an officer that begin or continue afterthe reorganization merger refer to service for both companies, while service prior to the reorganization merger refers toservice for Science Applications only.
Name of officer Age Position(s) with the company and prior business experience
Amy E. Alving 50 Chief Technology Officer and Senior Vice President since 2007. Dr. Alving heldvarious positions with us since 2005, including serving as Chief Scientist fromJune 2007 to December 2007. Prior to joining us, Dr. Alving served as theDirector of the Special Projects Office with Defense Advanced Research ProjectsAgency from 2001 to 2005 and was a White House fellow at the Department ofCommerce from 1997 to 1998.
Thomas G. Baybrook* 68 Group Chief of Administration and Operations since February 2013. Mr. Baybrookpreviously served as Group President (Acting) from October 2011 to January2013. He held various positions with us since joining in 1999, including serving asGeneral Manager of the Defense and Maritime Solutions business unit from May2005 to October 2011, and Deputy Business Unit Manager of the Defense andMaritime Solutions business unit from January 2005 to May 2005. Upon joiningus, Mr. Baybrook led U.S. Navy and Marine Corps marketing efforts for the thenSystems Engineering group. Prior to joining us, Mr. Baybrook held variouspositions with Intergraph Corporation and he is retired from the U.S. Army.
Joseph W. Craver III* 54 Sector President, Health and Engineering, since February 2013. Mr. Craver alsoserved in this same role as Group President since 2007. Mr. Craver previously heldvarious positions with us since 1989, including serving in successive line managerialpositions from 1997 to 2007. Prior to joining us, Mr. Craver held various positionswith the U.S. Navy nuclear submarine program from 1981 to 1989.
James E. Cuff* 53 Executive Vice President for Corporate Development since 2010. Mr. Cuff hasheld various positions with us since 1991, including Senior Vice President andGeneral Manager of our Logistics and Engineering Solutions business unit fromApril 2001 to August 2010. Prior to joining us through our acquisition of LogisticsSystems Architects in 1991, Mr. Cuff served four years in several senior positions,and seven years in the private sector systems integration business, serving in avariety of management and business development positions.
Steven P. Fisher 52 Treasurer and Senior Vice President since 2001. Mr. Fisher has held variouspositions with us since 1988, including serving as Assistant Treasurer andCorporate Vice President for Finance from 1997 to 2001 and Vice President from1995 to 1997.
John R. Hartley* 47 Senior Vice President and Corporate Controller since 2005. Mr. Hartley has heldvarious positions within our finance organization since 2001. For 12 years prior tothat, Mr. Hartley was with the accounting firm currently known as Deloitte &Touche LLP.
Deborah L. James* 54 Sector President, Technical and Engineering, of the Government Solutions Groupsince February 2013. Ms. James served as Executive Vice President forCommunications and Government Affairs from August 2010 to January 2013 andas Business Unit General Manager for the Command, Control, Communications,Computers, and Information Technology business unit from March 2005 toAugust 2010. Immediately prior to joining us in 2002, Ms. James was theExecutive Vice President and Chief Operating Officer of the Business Executivesfor National Security. She has served in senior homeland and national securitymanagement, policy and program positions in government and the private sectorfor more than 25 years.
SAIC, Inc. Annual Report 23

PART I
Name of officer Age Position(s) with the company and prior business experience
John P. Jumper* 68 Chair of the Board since June 2012, Chief Executive Officer and President sinceMarch 2012 and Director since 2007. General Jumper retired from the UnitedStates Air Force in 2005 after nearly 40 years of service. From September 2001 toNovember 2005, he was the Chief of Staff of the United States Air Force, serving asthe senior uniformed Air Force officer responsible for the organization, training andequipping of 750,000 active-duty, Air National Guard, Air Force Reserve and civilianforces serving around the world. As a member of the Joint Chiefs of Staff, GeneralJumper functioned as a military advisor to the Secretary of Defense, NationalSecurity Council and the President. General Jumper currently serves as anindependent director on the boards of NACCO Industries, Inc., and Hyster-YaleMaterials Handling, Inc., both publicly traded companies. He previously served onthe boards of Goodrich Corporation, Jacobs Engineering Group, Inc., WESCOAircraft Holdings, Inc., Somanetics Corporation, and Tech Team Global, Inc.
Brian F. Keenan* 56 Executive Vice President for Human Resources since 2007. Mr. Keenanpreviously held various positions with us since 2000, including serving as VicePresident and Director of U.S. Human Resource operations from 2004 to 2007.Prior to joining us, Mr. Keenan held various positions with Mobil and ExxonMobilfrom 1985 to 2000.
Vincent A. Maffeo* 62 Executive Vice President and General Counsel since 2010. Prior to joining us inJune 2010, from 1977 to 2009, Mr. Maffeo was with ITT Corporation, a high-technology engineering and manufacturing company, where he served as SeniorVice President and General Counsel from 1995 until 2009. He held various otherincreasingly responsible legal positions at ITT Corporation in thetelecommunications, defense and automotive businesses, and at the EuropeanHeadquarters of ITT Europe, before becoming General Counsel.
Anthony J. Moraco* 53 Group President, Government Solutions, since February 2013. Mr. Moracopreviously served as Group President, Intelligence, Surveillance andReconnaissance, from March 2012 to February 2013. Mr. Moraco served asExecutive Vice President for Operations and Performance Excellence from August2010 to March 2012 and as Business Unit General Manager and deputy of theSpace and Geospatial Intelligence business unit from February 2006 to August2010. Prior to joining us in 2006, Mr. Moraco was with the Boeing Company from2000 to 2006 and served as the Deputy General Manager of Mission Systems inthe Space & Intelligence Systems organization and also the Director of HomelandSecurity Technology Integration.
K. Stuart Shea* 56 Chief Operating Officer since March 2012. Mr. Shea also served as GroupPresident from 2007 to March 2012 and as Senior Vice President and BusinessUnit General Manager from 2005 to 2007. Prior to joining us, Mr. Shea served asVice President and Executive Director of Northrop Grumman Corporation’s TASCSpace and Intelligence operating unit from 1999 to 2005, and led otherorganizations from 1987 to 1999. Mr. Shea held positions with PAR TechnologyCorporation from 1982 to 1987.
Mark W. Sopp* 47 Executive Vice President and Chief Financial Officer since 2005. Prior to joiningus, Mr. Sopp served as Senior Vice President, Chief Financial Officer andTreasurer of Titan Corporation, a defense and intelligence contractor, from April2001 to July 2005 and Vice President and Chief Financial Officer of Titan SystemsCorporation, a subsidiary of Titan Corporation, from 1998 to 2001.
24 SAIC, Inc. Annual Report
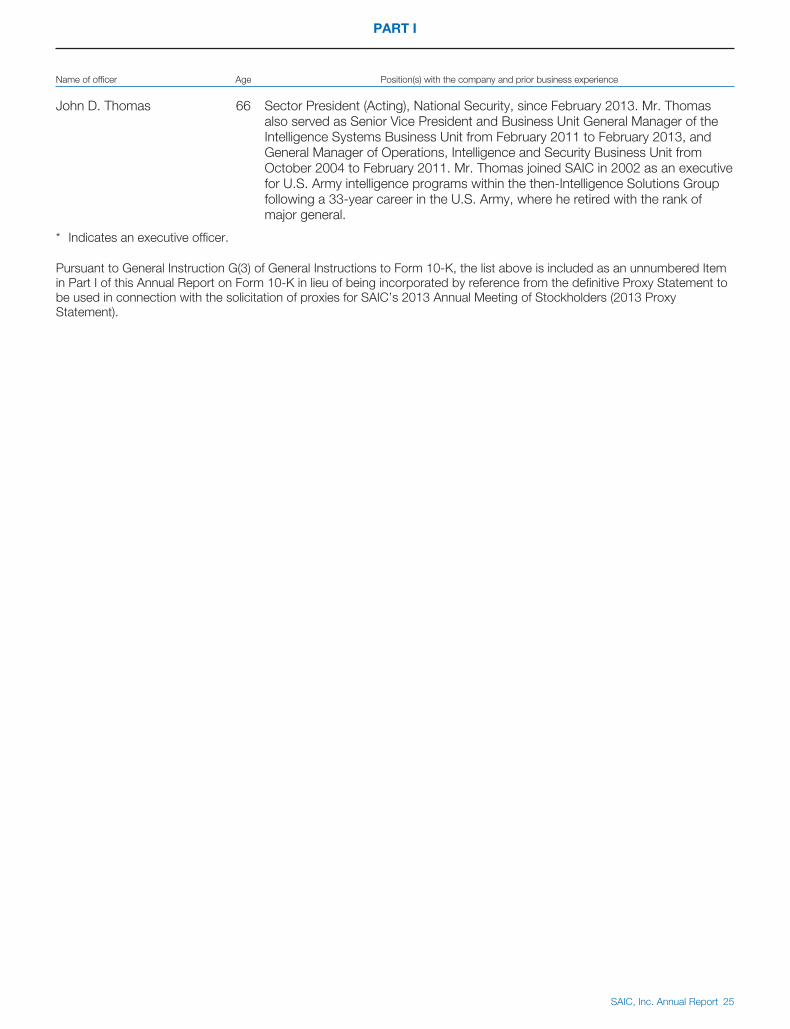
PART I
Name of officer Age Position(s) with the company and prior business experience
John D. Thomas 66 Sector President (Acting), National Security, since February 2013. Mr. Thomasalso served as Senior Vice President and Business Unit General Manager of theIntelligence Systems Business Unit from February 2011 to February 2013, andGeneral Manager of Operations, Intelligence and Security Business Unit fromOctober 2004 to February 2011. Mr. Thomas joined SAIC in 2002 as an executivefor U.S. Army intelligence programs within the then-Intelligence Solutions Groupfollowing a 33-year career in the U.S. Army, where he retired with the rank ofmajor general.
* Indicates an executive officer.
Pursuant to General Instruction G(3) of General Instructions to Form 10-K, the list above is included as an unnumbered Itemin Part I of this Annual Report on Form 10-K in lieu of being incorporated by reference from the definitive Proxy Statement tobe used in connection with the solicitation of proxies for SAIC’s 2013 Annual Meeting of Stockholders (2013 ProxyStatement).
SAIC, Inc. Annual Report 25
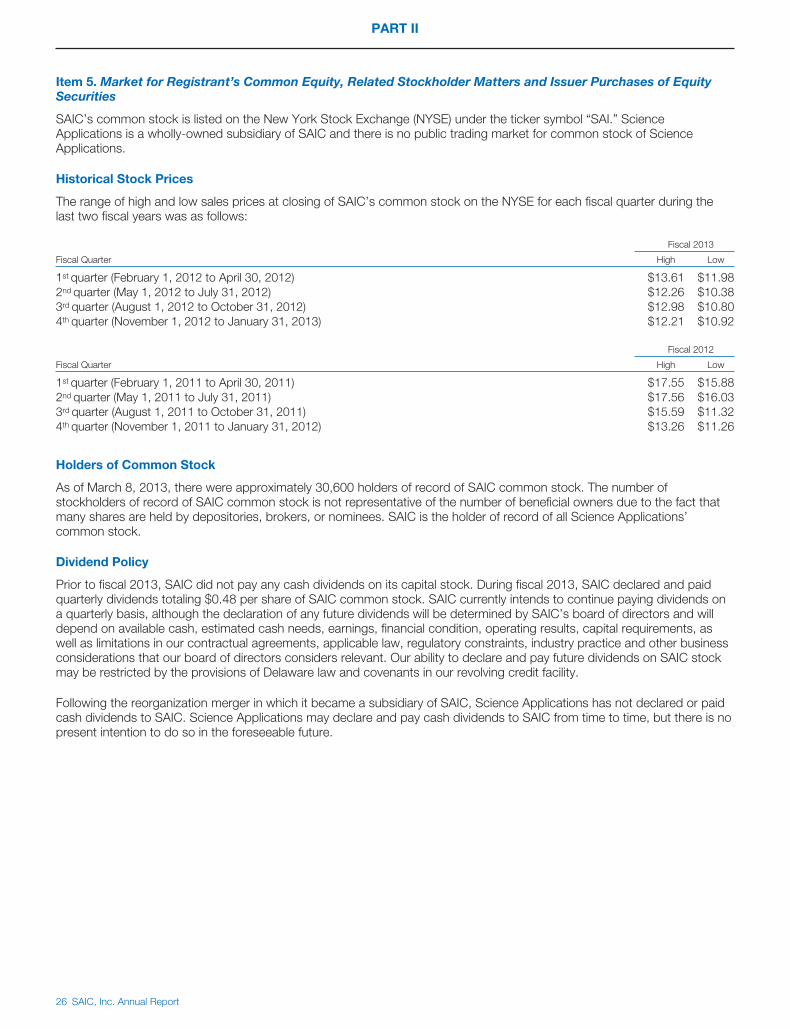
PART II
Item 5. Market for Registrant’s Common Equity, Related Stockholder Matters and Issuer Purchases of EquitySecurities
SAIC’s common stock is listed on the New York Stock Exchange (NYSE) under the ticker symbol “SAI.” ScienceApplications is a wholly-owned subsidiary of SAIC and there is no public trading market for common stock of ScienceApplications.
Historical Stock Prices
The range of high and low sales prices at closing of SAIC’s common stock on the NYSE for each fiscal quarter during thelast two fiscal years was as follows:
Fiscal 2013
Fiscal Quarter High Low
1st quarter (February 1, 2012 to April 30, 2012) $13.61 $11.982nd quarter (May 1, 2012 to July 31, 2012) $12.26 $10.383rd quarter (August 1, 2012 to October 31, 2012) $12.98 $10.804th quarter (November 1, 2012 to January 31, 2013) $12.21 $10.92
Fiscal 2012
Fiscal Quarter High Low
1st quarter (February 1, 2011 to April 30, 2011) $17.55 $15.882nd quarter (May 1, 2011 to July 31, 2011) $17.56 $16.033rd quarter (August 1, 2011 to October 31, 2011) $15.59 $11.324th quarter (November 1, 2011 to January 31, 2012) $13.26 $11.26
Holders of Common Stock
As of March 8, 2013, there were approximately 30,600 holders of record of SAIC common stock. The number ofstockholders of record of SAIC common stock is not representative of the number of beneficial owners due to the fact thatmany shares are held by depositories, brokers, or nominees. SAIC is the holder of record of all Science Applications’common stock.
Dividend Policy
Prior to fiscal 2013, SAIC did not pay any cash dividends on its capital stock. During fiscal 2013, SAIC declared and paidquarterly dividends totaling $0.48 per share of SAIC common stock. SAIC currently intends to continue paying dividends ona quarterly basis, although the declaration of any future dividends will be determined by SAIC’s board of directors and willdepend on available cash, estimated cash needs, earnings, financial condition, operating results, capital requirements, aswell as limitations in our contractual agreements, applicable law, regulatory constraints, industry practice and other businessconsiderations that our board of directors considers relevant. Our ability to declare and pay future dividends on SAIC stockmay be restricted by the provisions of Delaware law and covenants in our revolving credit facility.
Following the reorganization merger in which it became a subsidiary of SAIC, Science Applications has not declared or paidcash dividends to SAIC. Science Applications may declare and pay cash dividends to SAIC from time to time, but there is nopresent intention to do so in the foreseeable future.
26 SAIC, Inc. Annual Report

PART II
Stock Performance Graph
The following graph compares the total cumulative five-year return on SAIC common stock through our fiscal year endedJanuary 31, 2013 to two indices: (i) the Standard & Poor’s 500 Composite Stock Index and (ii) the Standard & Poor’s NorthAmerican Technology-Services Index (formerly known as the Goldman Sachs Technology-Services Index). As of January 31,2013, SAIC common stock was a component of each of the comparison indices. The graph assumes an initial investment of$100 on February 1, 2008 and that dividends, if any, have been reinvested. The comparisons in the graph are required bythe SEC, based upon historical data and are not intended to forecast or be indicative of possible future performance of SAICcommon stock.
SAIC Stock Price
S&P 500 Composite Index
S&P North AmericanTech - Svcs Index
100
100
100
104
61
72
97
82
106
88
100
126
1/31/2008 1/31/2009 1/31/2010 1/31/2011 1/31/2012 1/31/2013
68
104
141
67
121
173
Inde
x V
alue
406080
100
180
120140160
1/31/091/31/08 1/31/10 1/31/121/31/11 1/31/13
Purchases of Equity Securities
In March 2012, our board of directors authorized a stock repurchase program (2012 Stock Repurchase Program) underwhich we may repurchase up to 40 million shares of SAIC common stock. Stock repurchases may be made on the openmarket or in privately negotiated transactions with third parties. Whether repurchases are made and the timing and actualnumber of shares repurchased depends on a variety of factors including price, corporate capital requirements, other marketconditions and regulatory requirements.
The following table presents repurchases of SAIC’s common stock during the quarter ended January 31, 2013:
Period
(a)Total Number of
Shares(or Units)
Purchased (1)
(b)Average Price
Paid per Share(or Unit)
(c)Total Number of
Shares (orUnits) Purchased as
Part of PubliclyAnnounced
Repurchase Plansor Programs (2)
(d)Maximum Number
(or ApproximateDollar Value) of
Shares (or Units)that May Yet Be
Purchased Underthe Plans orPrograms (2)
November 1, 2012 – November 30, 2012 9,549 $11.05 — 40,000,000December 1, 2012 – December 31, 2012 34,325 $11.52 — 40,000,000January 1, 2013 – January 31, 2013 4,156 $11.99 — 40,000,000
Total 48,030 $11.47 —
(1) Includes shares of SAIC common stock purchased as follows:
November December January
Upon surrender by stockholders of previously owned shares to satisfy statutory taxwithholding obligations related to vesting of stock awards 9,549 34,325 4,156
(2) We may repurchase up to 40 million shares of SAIC common stock under the 2012 Stock Repurchase Program, which waspublicly announced in March 2012.
SAIC, Inc. Annual Report 27

PART II
Item 6. Selected Financial Data
The selected financial data set forth below is derived from our consolidated financial statements for each of the fiscal years inthe five year period ended January 31, 2013. As SAIC is a holding company and it consolidates Science Applications forfinancial statement purposes, the following financial data relates to both companies, except where otherwise indicated.Science Application’s revenues and expenses comprise 100% of SAIC’s revenues and operating expenses. In addition,Science Applications comprises approximately the entire balance of SAIC’s assets, liabilities and operating cash flows,except for an interest-bearing note between Science Applications and SAIC.
This information should be read in conjunction with “Management’s Discussion and Analysis of Financial Condition andResults of Operations” in Part II and our consolidated financial statements and the combined notes thereto contained withinthis Annual Report on Form 10-K.
Year Ended January 31
2013 2012(1) 2011 2010 2009
(in millions, except per share data)
Consolidated Statement of Income Data:SAIC:Revenues $11,173 $10,497 $10,798 $10,445 $9,635Operating income 734 299 929 816 731Income (loss) from continuing operations 523 (15) 547 467 418Income from discontinued operations 2 74 72 29 28Net income 525 59 619 496 446Earnings per share:
Basic:Income (loss) from continuing operations $ 1.54 $ (.04) $ 1.46 $ 1.17 $ 1.03Income from discontinued operations — .22 .19 .08 .07
$ 1.54 $ .18 $ 1.65 $ 1.25 $ 1.10
Diluted:Income (loss) from continuing operations $ 1.54 $ (.04) $ 1.45 $ 1.16 $ 1.01Income from discontinued operations — .22 .19 .07 .07
$ 1.54 $ .18 $ 1.64 $ 1.23 $ 1.08
Cash dividend per common share $ .48 — — — —
Science Applications:Revenues $11,173 $10,497 $10,798 $10,455 $9,635Operating income 734 299 929 816 731Income (loss) from continuing operations 524 (18) 539 453 391Income from discontinued operations 2 74 72 29 28Net income 526 56 611 482 419
January 31
2013 2012 2011 2010 2009
(in millions)
Consolidated Balance Sheet Data:Total assets $ 5,875 $ 6,667 $ 6,223 $ 5,295 $5,048Notes payable and long-term debt, including current portion 1,298 1,852 1,852 1,106 1,116Other long-term liabilities 168 162 135 195 180
(1) Fiscal 2012 results include a $540 million loss provision recorded in connection with resolution of the CityTime matterdescribed in Note 17 of the combined notes to consolidated financial statements contained within this Annual Report onForm 10-K.
28 SAIC, Inc. Annual Report
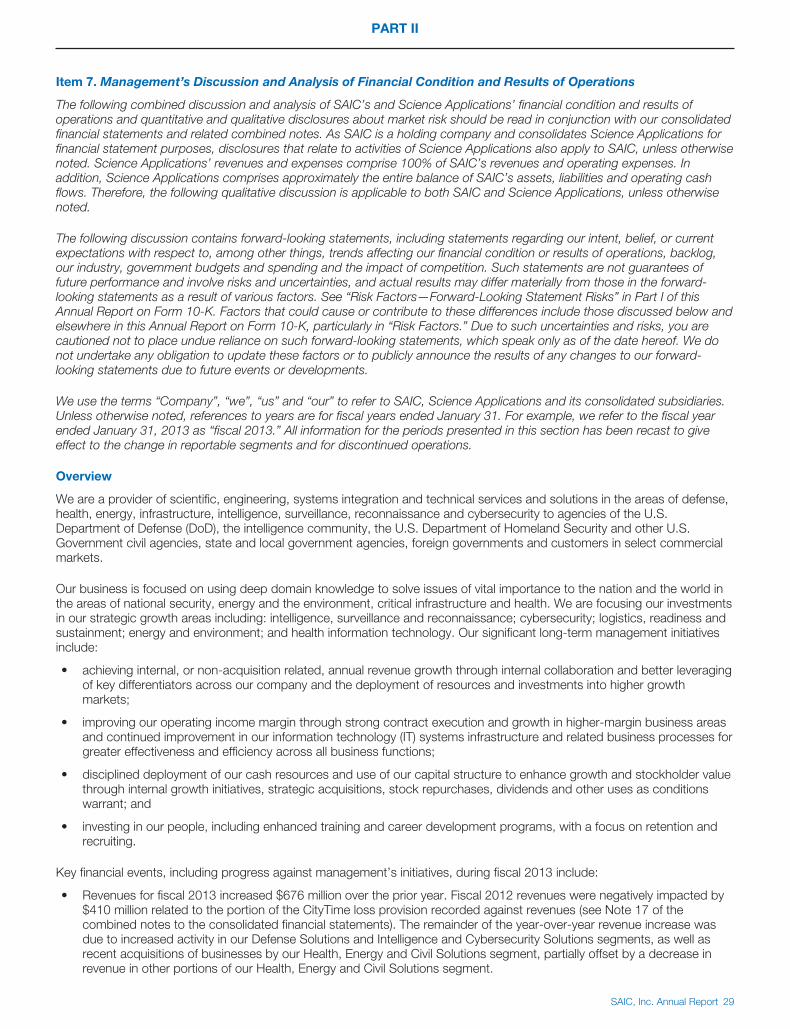
PART II
Item 7. Management’s Discussion and Analysis of Financial Condition and Results of Operations
The following combined discussion and analysis of SAIC’s and Science Applications’ financial condition and results ofoperations and quantitative and qualitative disclosures about market risk should be read in conjunction with our consolidatedfinancial statements and related combined notes. As SAIC is a holding company and consolidates Science Applications forfinancial statement purposes, disclosures that relate to activities of Science Applications also apply to SAIC, unless otherwisenoted. Science Applications’ revenues and expenses comprise 100% of SAIC’s revenues and operating expenses. Inaddition, Science Applications comprises approximately the entire balance of SAIC’s assets, liabilities and operating cashflows. Therefore, the following qualitative discussion is applicable to both SAIC and Science Applications, unless otherwisenoted.
The following discussion contains forward-looking statements, including statements regarding our intent, belief, or currentexpectations with respect to, among other things, trends affecting our financial condition or results of operations, backlog,our industry, government budgets and spending and the impact of competition. Such statements are not guarantees offuture performance and involve risks and uncertainties, and actual results may differ materially from those in the forward-looking statements as a result of various factors. See “Risk Factors—Forward-Looking Statement Risks” in Part I of thisAnnual Report on Form 10-K. Factors that could cause or contribute to these differences include those discussed below andelsewhere in this Annual Report on Form 10-K, particularly in “Risk Factors.” Due to such uncertainties and risks, you arecautioned not to place undue reliance on such forward-looking statements, which speak only as of the date hereof. We donot undertake any obligation to update these factors or to publicly announce the results of any changes to our forward-looking statements due to future events or developments.
We use the terms “Company”, “we”, “us” and “our” to refer to SAIC, Science Applications and its consolidated subsidiaries.Unless otherwise noted, references to years are for fiscal years ended January 31. For example, we refer to the fiscal yearended January 31, 2013 as “fiscal 2013.” All information for the periods presented in this section has been recast to giveeffect to the change in reportable segments and for discontinued operations.
Overview
We are a provider of scientific, engineering, systems integration and technical services and solutions in the areas of defense,health, energy, infrastructure, intelligence, surveillance, reconnaissance and cybersecurity to agencies of the U.S.Department of Defense (DoD), the intelligence community, the U.S. Department of Homeland Security and other U.S.Government civil agencies, state and local government agencies, foreign governments and customers in select commercialmarkets.
Our business is focused on using deep domain knowledge to solve issues of vital importance to the nation and the world inthe areas of national security, energy and the environment, critical infrastructure and health. We are focusing our investmentsin our strategic growth areas including: intelligence, surveillance and reconnaissance; cybersecurity; logistics, readiness andsustainment; energy and environment; and health information technology. Our significant long-term management initiativesinclude:
• achieving internal, or non-acquisition related, annual revenue growth through internal collaboration and better leveragingof key differentiators across our company and the deployment of resources and investments into higher growthmarkets;
• improving our operating income margin through strong contract execution and growth in higher-margin business areasand continued improvement in our information technology (IT) systems infrastructure and related business processes forgreater effectiveness and efficiency across all business functions;
• disciplined deployment of our cash resources and use of our capital structure to enhance growth and stockholder valuethrough internal growth initiatives, strategic acquisitions, stock repurchases, dividends and other uses as conditionswarrant; and
• investing in our people, including enhanced training and career development programs, with a focus on retention andrecruiting.
Key financial events, including progress against management’s initiatives, during fiscal 2013 include:
• Revenues for fiscal 2013 increased $676 million over the prior year. Fiscal 2012 revenues were negatively impacted by$410 million related to the portion of the CityTime loss provision recorded against revenues (see Note 17 of thecombined notes to the consolidated financial statements). The remainder of the year-over-year revenue increase wasdue to increased activity in our Defense Solutions and Intelligence and Cybersecurity Solutions segments, as well asrecent acquisitions of businesses by our Health, Energy and Civil Solutions segment, partially offset by a decrease inrevenue in other portions of our Health, Energy and Civil Solutions segment.
SAIC, Inc. Annual Report 29

PART II
• Operating income increased $435 million to $734 million (6.6% as a percentage of revenues) for fiscal 2013 from$299 million (2.8% as a percentage of revenues) for fiscal 2012. The increase in operating income is primarily due to theloss provision ($540 million) recorded in fiscal 2012 in connection with the CityTime matter partially offset by separationtransaction expenses ($38 million) incurred in fiscal 2013.
• Income (loss) from continuing operations for fiscal 2013 increased $538 million as compared to fiscal 2012 primarily dueto the increase in operating income, as well as a decrease in interest expense and a significantly lower effective tax rateas a result of a change in the estimated tax deductible amount of the CityTime loss provision.
• Diluted earnings per share from continuing operations for fiscal 2013 increased $1.58 per share to $1.54 per share ascompared to fiscal 2012 primarily due to the increase in income (loss) from continuing operations.
• Cash and cash equivalents decreased $856 million during fiscal 2013, primarily due to cash used to settle notespayable at maturity of $550 million, acquire a business for $483 million, net of cash acquired, and pay dividends of$165 million, partially offset by cash generated from operations of $345 million.
• Net bookings (as defined in “Key Performance Measures—Bookings and Backlog”) were approximately $11.1 billion forfiscal 2013, as compared to $11.7 billion in the prior year. Total backlog was $17.9 billion at January 31, 2013 and2012.
Subsequent to the end of fiscal 2013, in addition to the declaration of a regular quarterly cash dividend of $0.12 per share ofSAIC common stock payable on April 30, 2013, our board of directors declared a special cash dividend of $1.00 per shareof SAIC common stock payable on June 28, 2013.
Planned Separation Transaction
In August 2012, we announced that our board of directors authorized management to pursue a plan to separate into twoindependent, publicly traded companies: (i) a company focused on technical, engineering and enterprise informationtechnology services; and (ii) a company focused on delivering science and technology solutions primarily in the areas ofnational security, engineering and health.
The proposed separation is intended to take the form of a tax-free spin-off of the technical, engineering and enterpriseinformation technology services business. The technical, engineering, and information technology services business hadrevenues of $4.7 billion for fiscal 2012. The separation transaction is expected to occur in the latter half of calendar year2013, subject to final approval of the board of directors and certain other customary conditions. The separation transactiondoes not require a vote of the stockholders of SAIC.
In connection with the proposed separation transaction and in order to align our cost structure for greater competitiveness,we expect to take actions to reduce our real estate footprint by vacating facilities that are not necessary for our futurerequirements. We expect these actions will result in an aggregate of approximately $70 million in lease termination and facilityconsolidation costs over fiscal 2014 and fiscal 2015, which is expected to generate annualized cost savings of approximately$70 million. We also expect to incur additional separation transaction expenses of approximately $40 million in fiscal 2014,as well as approximately $10 million of incremental severance costs related to organizational streamlining.
Management is continuing to develop detailed plans on capital structure, management, governance and other significantmatters. In addition, the completion of the separation transaction will be subject to certain customary conditions, includingimplementation of intercompany agreements, filing of required documents with the U.S. Securities and ExchangeCommission and receipt of an opinion from tax counsel and a ruling from the Internal Revenue Service (IRS) as to the tax-free nature of the transaction. Although we expect that the separation of our businesses will be consummated, there can beno assurance that a separation will ultimately occur. Upon completion of the separation transaction, the operating results ofthe separated business will be included in discontinued operations. See “Risk Factors” in Part 1 of this Annual Report for onForm 10-K, which includes certain risk factors relating to the proposed separation transaction.
Business Environment and Trends
In fiscal 2013, we generated approximately 87% of our total revenues from contracts with the U.S. Government, either as aprime contractor or a subcontractor to other contractors engaged in work for the U.S. Government. Revenues undercontracts with the DoD, including subcontracts under which the DoD is the ultimate purchaser, represented approximately70% of our total revenues in fiscal 2013. Accordingly, our business performance is affected by the overall level of U.S.Government spending, especially national security, including defense, homeland security, and intelligence spending, and thealignment of our service and product offerings and capabilities with current and future budget priorities of the U.S.Government. As an example, we expect to see a reduction in revenue of approximately $250 million from fiscal 2013 to fiscal2014 on our contract to provide logistics services for tactical mine resistant ambush protected vehicles largely as a result ofthe drawdown of forces in the Middle East.
30 SAIC, Inc. Annual Report

PART II
While we believe that national security, including defense, homeland security, and intelligence spending will continue to be apriority, the U.S. Government budget deficit and the national debt has created increasing pressure to examine and reducespending across all federal agencies. Baseline spending for the DoD for the next 10 years has been reduced and there maybe further reductions. The Budget Control Act of 2011 increased the U.S. Government’s debt ceiling and enacted 10-yeardiscretionary spending caps expected to generate over $1 trillion in savings for the U.S. Government. According to the Officeof Management and Budget, these savings include $487 billion in DoD baseline spending reductions over the next 10 years.In addition, the Budget Control Act of 2011 provides for additional automatic spending cuts (referred to as sequestration)totaling $1.2 trillion over nine years, which are being implemented beginning in the current U.S. Government fiscal yearending September 30, 2013 (GFY13). Although the Office of Management and Budget has recently provided guidance toagencies on implementing sequestration cuts, there remains much uncertainty about how exactly sequestration cuts will beimplemented and the impact it will have on contractors supporting the U.S. Government. The continuing threat of spendingcuts and associated government guidance and planning activities are causing delays in government contracting actions. Wecontinue to evaluate the potential impact of budget cuts and sequestration on our business, and while the ultimate effect onour business is uncertain, the amount and nature of these federal budget spending reductions could adversely impact ouroperations, future revenues and growth prospects in those markets.
The U.S. Government has funding measures in place through September 30, 2013. These funding measures includeindividual spending bills for certain government agencies, including DoD and DHS, and implement $85 billion ofsequestration cuts for GFY13. Agencies and departments not covered by these individual spending bills will continue tooperate under a continuing resolution with standard restrictions, including no new program starts and no program increasesbeyond current service levels, which could adversely impact our future revenues and growth prospects.
Trends in the U.S. Government contracting process, including a shift towards multiple-awards contracts (in which certaincontractors are preapproved using indefinite-delivery/indefinite-quantity (IDIQ) and U.S. General Services Administration (GSA)contract vehicles) and awarding contracts on a low price, technically acceptable basis, have increased competition for U.S.Government contracts and increased pricing pressure. For example, during fiscal 2013, we were not awarded the successorcontract to the DISN Global Solutions (DGS) program with the Defense Information Systems Agency. In fiscal 2013, werecognized approximately $425 million in revenue on this program. Revenues from the DGS program are expected to beapproximately $40 million over the first half of fiscal 2014 as the activity transitions to the successor contractor. We expect thata majority of the business that we seek in the foreseeable future will be awarded through a competitive bidding process. Formore information on these risks and uncertainties, see “Risk Factors” in Part I of this Annual Report on Form 10-K.
Reportable Segments
Our business is aligned into four reportable segments: Defense Solutions; Health, Energy and Civil Solutions; Intelligence andCybersecurity Solutions; and Corporate and Other. Except with respect to “Results of Operations—Discontinued Operations”and “—Net Income,” and “—Diluted EPS,” all amounts in this “Management’s Discussion and Analysis of Financial Conditionand Results of Operations” are presented for our continuing operations. For additional information regarding our reportablesegments, see “Business” in Part I and Note 15 of the combined notes to consolidated financial statements contained withinthis Annual Report on Form 10-K.
Key Performance Measures
The primary financial performance measures we use to manage our business and monitor results of operations are revenue,operating income and cash flows from operations. We also believe that bookings and backlog are useful measures formanagement and investors to evaluate our potential future revenues. In addition, we consider measures such as contracttypes and revenue mix to be useful measures to management and investors evaluating our operating income and marginperformance.
Bookings and Backlog. We had net bookings worth an estimated $11.1 billion and $11.7 billion during fiscal 2013 and fiscal2012, respectively. Net bookings represent the estimated amount of revenue to be earned in the future from funded andunfunded contract awards that were received during the year, net of any adjustments to previously awarded backlogamounts. We calculate net bookings as the year’s ending backlog plus the year’s revenues (excluding the portion of theCityTime loss provision of $410 million recorded against revenues during fiscal 2012 because such loss did not impact netbookings) less the prior year’s ending backlog and less the backlog obtained in acquisitions during the year.
Backlog represents the estimated amount of future revenues to be recognized under negotiated contracts as work isperformed. We segregate our backlog into two categories as follows:
• Funded Backlog. Funded backlog for contracts with government agencies primarily represents contracts for whichfunding is appropriated less revenues previously recognized on these contracts, and does not include the unfundedportion of contracts where funding is incrementally appropriated or authorized on a quarterly or annual basis by the U.S.Government and other customers, even though the contract may call for performance over a number of years. Funded
SAIC, Inc. Annual Report 31

PART II
backlog for contracts with non-government agencies represents the estimated value on contracts, which may covermultiple future years, under which we are obligated to perform, less revenues previously recognized on these contracts.
• Negotiated Unfunded Backlog. Negotiated unfunded backlog represents estimated amounts of revenue to be earned inthe future from (1) negotiated contracts for which funding has not been appropriated or otherwise authorized and(2) unexercised priced contract options. Negotiated unfunded backlog does not include any estimate of future potentialtask orders expected to be awarded under IDIQ, GSA Schedule, or other master agreement contract vehicles.
The estimated value of our total backlog as of the end of the last two fiscal years was as follows:
January 31
2013 2012
(in millions)
Defense Solutions:Funded backlog $ 1,972 $ 2,143Negotiated unfunded backlog 4,400 4,961
Total Defense Solutions backlog $ 6,372 $ 7,104
Health, Energy and Civil Solutions:Funded backlog $ 1,740 $ 2,057Negotiated unfunded backlog 2,654 3,238
Total Health, Energy and Civil Solutions backlog $ 4,394 $ 5,295
Intelligence and Cybersecurity Solutions:Funded backlog $ 1,649 $ 1,317Negotiated unfunded backlog 5,461 4,169
Total Intelligence and Cybersecurity Solutions backlog $ 7,110 $ 5,486
Total:Funded backlog $ 5,361 $ 5,517Negotiated unfunded backlog 12,515 12,368
Total backlog $17,876 $17,885
Bookings and backlog fluctuate from period to period depending on our success rate in winning contracts and the timing ofcontract awards, renewals, modifications and cancellations. Contract awards continue to be negatively impacted by ongoingindustry-wide delays in procurement decisions, which have resulted in an increase in the value of our submitted proposalsawaiting decision. Contract awards may also be negatively impacted by budget cuts, including sequestration, by the U.S.Government as discussed in “Business Environment and Trends” in this Annual Report on Form 10-K.
We expect to recognize a substantial portion of our funded backlog as revenues within the next 12 months. However, theU.S. Government may cancel any contract at any time through a termination for the convenience of the U.S. Government. Inaddition, certain contracts with commercial customers include provisions that allow the customer to cancel at any time. Mostof our contracts have cancellation terms that would permit us to recover all or a portion of our incurred costs and fees forwork performed.
Contract Types. Our earnings and profitability may vary materially depending on changes in the proportionate amount ofrevenues derived from each type of contract. For a discussion of the types of contracts under which we generate revenue,see “Business—Contract Types” in Part I of this Annual Report on Form 10-K. The following table summarizes revenues bycontract type as a percentage of total revenues for the last three fiscal years:
Year Ended January 31
2013 2012 2011
Cost-reimbursement 42% 46% 47%Time and materials (T&M) and fixed-price-level-of-effort (FP-LOE) 29 27 29Firm-fixed-price (FFP) 29 27 24
Total 100% 100% 100%
The reduction in the percentage of revenues generated from cost reimbursement contracts since fiscal 2011 is primarilyattributable to the conclusion of certain contracts, including the U.S. Army Brigade Combat Team Modernization contract,and reduced activity on certain U.S. federal civilian agency contracts. The percentage of revenues from T&M and FP-LOEcontracts for fiscal 2012 was impacted downward by 4% due to the portion of the CityTime loss provision of $410 millionrecorded against revenues. The increase in the percentage of revenues generated from FFP contracts since fiscal 2011 was
32 SAIC, Inc. Annual Report

PART II
primarily due to increased revenues from increased deliveries under certain logistics, readiness and sustainment contracts,increased design and construction services and increased activity on a program to operate and maintain the enterprisenetwork IT infrastructure for the U.S. Department of State.
Revenue Mix. We generate revenues under our contracts from (1) the efforts of our technical staff, which we refer to aslabor-related revenues, and (2) the materials provided on a contract and efforts of our subcontractors, which we refer to asM&S revenues. M&S revenues are generated primarily from large, multi-year systems integration contracts and contracts inour logistics, readiness and sustainment business area, as well as through sales of our proprietary products, such as ourborder, port and mobile security products and our checked baggage explosive detection systems. While our proprietaryproducts are more profitable, these products represent a small percentage of our M&S revenues and the majority of ourM&S revenues generally have lower margins than our labor-related revenues. The following table presents changes in labor-related revenues and M&S revenues for the last three fiscal years:
Year Ended January 31
2013Percentchange 2012
Percentchange 2011
(dollars in millions)
Labor-related revenues $6,008 (2)% $6,099 —% $6,125As a percentage of revenues 54% 58% 57%
M&S revenues 5,165 17 4,398 (6) 4,673As a percentage of revenues 46% 42% 43%
In fiscal 2012, M&S revenues declined primarily due to the portion of the CityTime loss provision recorded against revenues($410 million, or 4%). In recent years, there have been increases in relative proportion of M&S revenues as compared tolabor-related revenues primarily due to increased activity as a prime contractor on large programs involving significantsubcontracted efforts and increased volume of material deliveries under certain programs primarily with DoD customers.
Geographic Location. Substantially all of our revenues and tangible long-lived assets are generated by or owned by entitieslocated in the United States.
Results of Operations
The following table summarizes our results of operations for the last three fiscal years:
Year Ended January 31
2013Percentchange 2012
Percentchange 2011
(dollars in millions)
Revenues $11,173 6% $10,497 (3)% $10,798Cost of revenues 9,809 3 9,530 2 9,374Selling, general and administrative expenses:
General and administrative (G&A) 370 (14) 428 45 296Bid and proposal (B&P) 158 7 148 3 144Internal research and development (IR&D) 64 (30) 92 67 55
Separation transaction expenses 38 100 — — —
Operating income 734 145 299 (68) 929As a percentage of revenues 6.6% 2.8% 8.6%
Non-operating expense, net (76) (104) (75)
Income from continuing operations before income taxes 658 237 195 (77) 854Provision for income taxes (135) (36) (210) (32) (307)
Income (loss) from continuing operations 523 — (15) — 547Income from discontinued operations, net of tax 2 74 72
Net income $ 525 790 $ 59 (90) $ 619
We classify indirect costs incurred within or allocated to our U.S. Government customers as overhead (included in cost ofrevenues) and G&A expenses in the same manner as such costs are defined in our disclosure statements under U.S.Government Cost Accounting Standards. Effective in fiscal 2012, one of our subsidiaries adopted our more prevalentdisclosure statement resulting in $25 million in costs previously classified as G&A in fiscal 2011 being classified as cost ofrevenues in subsequent fiscal years on a prospective basis. Total operating costs were not affected by this change.
Reportable Segment Results. Effective February 1, 2012, certain operations were transferred between the Company’sreportable segments. Prior year amounts have been recasted for consistency with the current year’s presentation.
SAIC, Inc. Annual Report 33
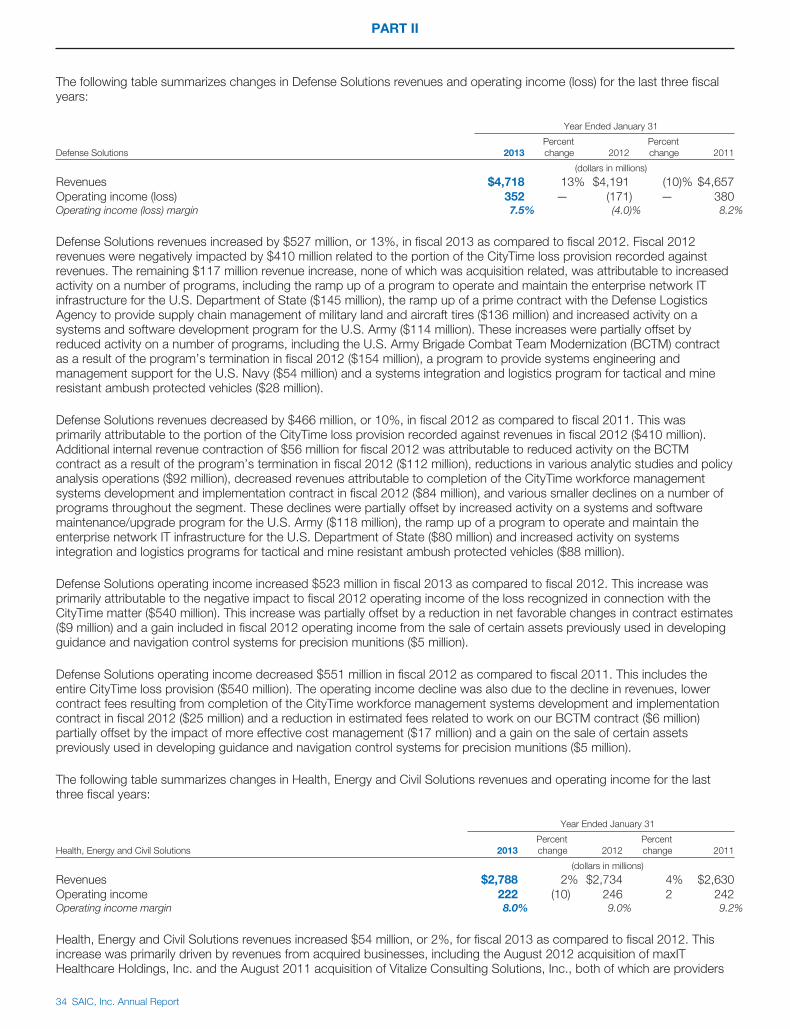
PART II
The following table summarizes changes in Defense Solutions revenues and operating income (loss) for the last three fiscalyears:
Year Ended January 31
Defense Solutions 2013Percentchange 2012
Percentchange 2011
(dollars in millions)
Revenues $4,718 13% $4,191 (10)% $4,657Operating income (loss) 352 — (171) — 380Operating income (loss) margin 7.5% (4.0)% 8.2%
Defense Solutions revenues increased by $527 million, or 13%, in fiscal 2013 as compared to fiscal 2012. Fiscal 2012revenues were negatively impacted by $410 million related to the portion of the CityTime loss provision recorded againstrevenues. The remaining $117 million revenue increase, none of which was acquisition related, was attributable to increasedactivity on a number of programs, including the ramp up of a program to operate and maintain the enterprise network ITinfrastructure for the U.S. Department of State ($145 million), the ramp up of a prime contract with the Defense LogisticsAgency to provide supply chain management of military land and aircraft tires ($136 million) and increased activity on asystems and software development program for the U.S. Army ($114 million). These increases were partially offset byreduced activity on a number of programs, including the U.S. Army Brigade Combat Team Modernization (BCTM) contractas a result of the program’s termination in fiscal 2012 ($154 million), a program to provide systems engineering andmanagement support for the U.S. Navy ($54 million) and a systems integration and logistics program for tactical and mineresistant ambush protected vehicles ($28 million).
Defense Solutions revenues decreased by $466 million, or 10%, in fiscal 2012 as compared to fiscal 2011. This wasprimarily attributable to the portion of the CityTime loss provision recorded against revenues in fiscal 2012 ($410 million).Additional internal revenue contraction of $56 million for fiscal 2012 was attributable to reduced activity on the BCTMcontract as a result of the program’s termination in fiscal 2012 ($112 million), reductions in various analytic studies and policyanalysis operations ($92 million), decreased revenues attributable to completion of the CityTime workforce managementsystems development and implementation contract in fiscal 2012 ($84 million), and various smaller declines on a number ofprograms throughout the segment. These declines were partially offset by increased activity on a systems and softwaremaintenance/upgrade program for the U.S. Army ($118 million), the ramp up of a program to operate and maintain theenterprise network IT infrastructure for the U.S. Department of State ($80 million) and increased activity on systemsintegration and logistics programs for tactical and mine resistant ambush protected vehicles ($88 million).
Defense Solutions operating income increased $523 million in fiscal 2013 as compared to fiscal 2012. This increase wasprimarily attributable to the negative impact to fiscal 2012 operating income of the loss recognized in connection with theCityTime matter ($540 million). This increase was partially offset by a reduction in net favorable changes in contract estimates($9 million) and a gain included in fiscal 2012 operating income from the sale of certain assets previously used in developingguidance and navigation control systems for precision munitions ($5 million).
Defense Solutions operating income decreased $551 million in fiscal 2012 as compared to fiscal 2011. This includes theentire CityTime loss provision ($540 million). The operating income decline was also due to the decline in revenues, lowercontract fees resulting from completion of the CityTime workforce management systems development and implementationcontract in fiscal 2012 ($25 million) and a reduction in estimated fees related to work on our BCTM contract ($6 million)partially offset by the impact of more effective cost management ($17 million) and a gain on the sale of certain assetspreviously used in developing guidance and navigation control systems for precision munitions ($5 million).
The following table summarizes changes in Health, Energy and Civil Solutions revenues and operating income for the lastthree fiscal years:
Year Ended January 31
Health, Energy and Civil Solutions 2013Percentchange 2012
Percentchange 2011
(dollars in millions)
Revenues $2,788 2% $2,734 4% $2,630Operating income 222 (10) 246 2 242Operating income margin 8.0% 9.0% 9.2%
Health, Energy and Civil Solutions revenues increased $54 million, or 2%, for fiscal 2013 as compared to fiscal 2012. Thisincrease was primarily driven by revenues from acquired businesses, including the August 2012 acquisition of maxITHealthcare Holdings, Inc. and the August 2011 acquisition of Vitalize Consulting Solutions, Inc., both of which are providers
34 SAIC, Inc. Annual Report

PART II
of healthcare IT consulting services to commercial clients. Internal revenues contracted $123 million, or 4%, reflectingdeclines in various federal civilian programs ($139 million) and program completions with federal health informationtechnology customers, particularly with DoD military health system customers ($86 million). These declines were partiallyoffset by increases in healthcare IT consulting services with commercial clients ($88 million) and increased design-buildactivity related to various renewable energy power plant construction projects ($25 million).
Health, Energy and Civil Solutions revenues increased $104 million, or 4%, including internal revenue contraction of 1% forfiscal 2012 as compared to fiscal 2011. Internal revenue contraction reflects a reduction in delivery of checked baggageexplosive detection systems ($50 million) from a business acquired in fiscal 2011 and reduced activity on certain U.S. federalcivilian agency programs, including various programs in support of National Aeronautics and Space Administration($66 million), and certain programs with the DoD ($41 million). These decreases were partially offset by net increased volumeon large design-build programs primarily related to renewable energy power plant construction ($53 million), increases inhealthcare IT consulting services with commercial customers ($30 million) and expanded scope on new and existingprograms with our DoD military health system customers ($12 million).
Health, Energy and Civil Solutions operating income decreased $24 million for fiscal 2013 as compared to fiscal 2012. Thedecline in operating income was primarily due to a net unfavorable change in contract estimates ($9 million) primarily relatedto certain energy and construction projects compared to a net positive change in contract estimates ($9 million) in the prioryear period, increased intangible asset amortization expense ($8 million), increased severance expense ($4 million), and thecosts related to the exit and sublease of an underutilized production and office facility associated with a past acquisition($3 million). This decrease was partially offset by the loss provision related to a data privacy litigation matter ($9 million) in theprior year period, which is discussed in Note 17 of the combined notes to the consolidated financial statements, and areduction in research and development expense ($20 million) resulting from the advancement through the productdevelopment lifecycle of new non-intrusive inspection system offerings.
Health, Energy and Civil Solutions operating income remained relatively constant for fiscal 2012 as compared to fiscal 2011.Operating income was favorably impacted by increased revenue volume in design-build and healthcare IT programs andfrom increased deliveries of our higher margin non-intrusive cargo inspection systems, as well as from favorable program feeperformance and efficiency actions to reduce indirect expenses across the segment. These increases were offset byincreased investment in research and development activities ($19 million) primarily related to the development of newhomeland security products offerings and smart grid technologies, the loss provision related to a data privacy litigationmatter ($9 million) and increased amortization expense ($8 million) related to acquisition activities in the fiscal 2012 and prioryears.
The following table summarizes changes in Intelligence and Cybersecurity Solutions revenues and operating income for thelast three fiscal years:
Year Ended January 31
Intelligence and Cybersecurity Solutions 2013Percentchange 2012
Percentchange 2011
(dollars in millions)
Revenues $3,672 3% $3,574 3% $3,460Operating income 264 (5) 279 (4) 292Operating income margin 7.2% 7.8% 8.4%
Intelligence and Cybersecurity Solutions revenues increased $98 million, or 3%, all of which was internal revenue growth, forfiscal 2013 as compared to fiscal 2012. Internal revenue growth was primarily attributable to increased activity on twoairborne surveillance programs ($108 million), a geospatial intelligence program ($41 million), a new intelligence analysissolution program ($25 million) and a new intelligence systems integration program for the U.S. Army ($22 million). Theseincreases were offset by reduced activity on a processing, exploitation and dissemination program for the U.S. Army($60 million), a decline in sales of proprietary products ($34 million) and an intelligence analysis contract that concluded in thecurrent year ($26 million).
Intelligence and Cybersecurity Solutions revenues increased $114 million, or 3%, substantially all of which was internalrevenue growth, for fiscal 2012 as compared to fiscal 2011. Internal revenue growth was primarily attributable to increasedactivity on airborne surveillance programs ($121 million), increased material deliveries and services under processing,exploitation and dissemination contracts ($55 million), increased activity on cybersecurity programs ($27 million) andincreased activity on intelligence analysis contracts ($26 million). These increases were partially offset by a decline inrevenues due to the conclusion of a forward operating base integrated security equipment supply contract ($22 million) andrevenue decreases from reductions in scope on various other existing intelligence, surveillance and reconnaissanceprograms.
SAIC, Inc. Annual Report 35

PART II
Intelligence and Cybersecurity Solutions operating income decreased $15 million for fiscal 2013 as compared to fiscal 2012.The decrease in operating income was primarily attributable to a relative increase in the proportion of M&S revenues, whichgenerally have lower profit margins than labor-related revenues, due to increased activity as a prime contractor on largesystem integration programs. Fiscal 2013 operating income was negatively impacted by reduced sales of our higher-marginproprietary products ($12 million). These decreases were partially offset by lower intangible asset impairment charges($6 million), lower intangible asset amortization expense ($5 million), and an increase in net favorable change in contractestimates ($6 million).
Intelligence and Cybersecurity Solutions operating income decreased $13 million for fiscal 2012 as compared to fiscal 2011.The decrease in operating income was primarily attributable to impairment charges on acquired intangible assets associatedwith the fiscal 2011 acquisition of Cloudshield Technologies Inc. ($19 million), increased investment in research anddevelopment activities ($15 million) and higher bid and proposal expenses ($5 million) partially offset by increased recovery inour indirect rates and increased sales of higher-margin proprietary products ($11 million).
The following table summarizes changes in Corporate and Other revenues and operating income (loss) for the last three fiscalyears:
Year Ended January 31
Corporate and Other 2013 2012 2011
(dollars in millions)
Revenues $ — $ 2 $58Operating income (loss) (104) (55) 15
Corporate and Other operating loss represents corporate costs that are unallowable under U.S. Government CostAccounting Standards and the net effect of various items that are not directly related to the operating performance of thereportable segments. Corporate and Other operating loss for fiscal 2013 increased by $49 million as compared to fiscal2012, primarily due to the non-severance portion of costs associated with the planned separation transaction ($26 million)and the relocation and severance charges for the transition of certain corporate functions to our McLean, Virginiaheadquarters and other locations ($18 million).
Corporate and Other operating loss for fiscal 2012 increased by $70 million as compared to fiscal 2011, as the result of a$22 million charge related to the settlement of a litigation matter involving work performed at the National Center for CriticalInformation Processing and Storage, a $13 million reduction in internal rental income of our real estate managementsubsidiary in fiscal 2012 as compared to fiscal 2011 and increased legal expenses partially offset by gains on the sale of realestate of $28 million. In addition, Corporate and Other revenues and operating income for fiscal 2011 includes a $56 millionroyalty payment received in connection with the resolution of a patent infringement matter.
Non-Operating Expense. Non-operating expense for fiscal 2013 decreased $28 million as compared to fiscal 2012. Thisdecrease was primarily attributable to a decrease in interest expense of $21 million primarily due to the payment of$550 million in July 2012 to settle our 6.25% notes at maturity.
Non-operating expense for fiscal 2012 increased $29 million as compared to fiscal 2011. This increase was primarilyattributable to an increase in interest expense of $35 million primarily due to the issuance of $750 million of senior unsecurednotes in December 2010.
As more fully described in “Quantitative and Qualitative Disclosures About Market Risk” contained within this Annual Reporton Form 10-K, we are currently exposed to interest rate risks and foreign currency risks that are inherent in the financialinstruments and contracts arising from transactions entered into in the normal course of business. From time to time, we usederivative instruments to manage these risks.
Provision for Income Taxes. Our provision for income taxes as a percentage of income from continuing operations beforeincome taxes was 20.5%, 107.7% and 35.9% in fiscal 2013, 2012 and 2011, respectively. The lower effective income taxrate for fiscal 2013 as compared to fiscal 2012 was primarily due to a $96 million reduction in the provision for income tax asa result of our entering into an issue resolution agreement with the IRS with respect to the tax deductible portion of theCityTime payment. The fiscal 2013 effective tax rate also benefitted from the tax deductibility ($9 million of benefit) ofquarterly dividends paid on shares held by the SAIC Retirement Plan (an employee stock ownership plan) and thereinstatement with retroactive effect to December 31, 2011 of the federal research and development tax credit.
The effective tax rate for fiscal 2012 was negatively impacted by the estimated non-deductible portion of the CityTime lossprovision.
36 SAIC, Inc. Annual Report

PART II
The lower effective income tax rate for fiscal 2011 compared to the statutory tax rates was primarily due to the reversal of$7 million in accruals for unrecognized tax benefits as a result of the settlement of federal and state tax audits.
We file income tax returns in the United States and various state and foreign jurisdictions and have effectively settled with theIRS for fiscal years prior to and including fiscal 2008. We also settled fiscal 2011 and 2012 as a result of our participation inthe IRS Compliance Assurance Process (CAP) beginning in fiscal 2011. As part of CAP, we endeavor to agree with the IRSon the treatment of all tax positions prior to the filing of the tax return, thereby greatly reducing the period of time betweenreturn submission and settlement with the IRS.
Diluted Earnings (Loss) per Share (EPS) from Continuing Operations. Diluted EPS from continuing operations increased$1.58 per share to $1.54 per share for fiscal 2013 as compared to fiscal 2012 primarily due to a $538 million increase inincome from continuing operations primarily attributable to the impact of the CityTime loss provision in fiscal 2012. DilutedEPS from continuing operations decreased $1.49 per share to $(0.04) per share for fiscal 2012 as compared to fiscal 2011primarily due to a $562 million decrease in income from continuing operations primarily due to the CityTime loss provision($540 million) recorded in fiscal 2012.
Discontinued Operations. In fiscal 2013, in order to better align our business portfolio with our strategy, we sold certaincomponents of our business, which were historically included in the Health, Energy and Civil Solutions segment, primarilyfocused on providing operational test and evaluation services to U.S. Government customers. In fiscal 2012, we sold certaincomponents of our business, which were historically included in our Health, Energy and Civil Solutions segment, primarilyfocused on providing information technology services to international oil and gas companies. Pursuant to the definitive saleagreement, we retained the assets and obligations of a defined benefit pension plan in the United Kingdom. We haveclassified the operating results of these business components, including the pension activity through the date of sale, asdiscontinued operations for all periods presented.
The pre-sale operating results of the business components that we sold over the last three fiscal years were as follows:
Year Ended January 31
2013 2012 2011
Revenues $56 $160 $319Costs and expenses:
Cost of revenues 50 131 258Selling, general and administrative expenses 3 13 31
Operating income $ 3 $ 16 $ 30
In fiscal 2013, we received net proceeds of $51 million from the sale of the business referenced above resulting in a gain onsale before income taxes of $17 million. In fiscal 2012, we received net proceeds of $167 million resulting in a gain on salebefore income taxes of $111 million. In fiscal 2011, discontinued operations included pre-tax net gains of $77 millionprimarily related to the settlement of an arbitration proceeding brought against Telkom South Africa by our former subsidiaryand resolution of other contingencies related to the sale of this former subsidiary. Income from discontinued operations alsoincludes other activity that is immaterial and therefore not described above.
Liquidity and Capital Resources
We had $736 million in cash and cash equivalents at January 31, 2013, which were primarily comprised of cash held ininvestments in several large institutional money market funds that invest primarily in bills, notes and bonds issued by theU.S. Treasury, U.S. Government guaranteed repurchase agreements fully collateralized by U.S. Treasury obligations,U.S. Government guaranteed securities and investment-grade corporate securities that have original maturities of threemonths or less. We anticipate our principal sources of liquidity for the next 12 months and beyond will be our existing cashand cash equivalents and cash flows from operations. We may also borrow under our $750 million revolving credit facility.Our revolving credit facility is backed by a number of financial institutions, matures in fiscal 2017 and, by its terms, can beaccessed on a same-day basis. We anticipate our principal uses of cash for the next 12 months and beyond will be foroperating expenses, expenses related to the planned separation transaction, capital expenditures, acquisitions ofbusinesses, stock repurchases and dividends. We anticipate that our operating cash flows, existing cash and cashequivalents, which have no restrictions on withdrawal, and borrowing capacity under our revolving credit facility will besufficient to meet our anticipated cash requirements for at least the next 12 months.
SAIC, Inc. Annual Report 37

PART II
Historical Trends
Cash and cash equivalents was $736 million and $1.6 billion at January 31, 2013 and 2012, respectively. The following tablesummarizes cash flow information for the last three fiscal years:
Year Ended January 31
2013 2012 2011
(in millions)
Total cash flows provided by operating activities of continuing operations $ 345 $ 762 $ 710Total cash flows used in investing activities of continuing operations (527) (203) (445)Total cash flows provided by (used in) financing activities of continuing operations (722) (449) 187Increase in cash and cash equivalents from discontinued operations 48 114 55Effect of foreign currency exchange rate changes on cash and cash equivalents — 1 (1)
Total increase (decrease) in cash and cash equivalents $(856) $ 225 $ 506
Cash Provided by Operating Activities of Continuing Operations. Cash flows from operating activities of continuing operationsdecreased $417 million in fiscal 2013 as compared to fiscal 2012. Fiscal 2013 cash flows from operating activities ofcontinuing operations were negatively impacted by a $500 million cash settlement payment related to the CityTime matter,partially offset by a reduction in the average time to collect accounts receivable. The average time to collect accountsreceivable in fiscal 2013 benefitted from the U.S. Government’s accelerated payment initiative that encouraged agencies tomore timely pay contractors. As this initiative was discontinued in fiscal 2014, the Company’s cash flows from operatingactivities of continuing operations are expected to be negatively impacted as a result of an estimated increase in the averagetime to collect accounts receivable of three to six days.
Cash flows from operating activities of continuing operations increased $52 million in fiscal 2012 as compared to fiscal 2011.Cash flows from operating activities of continuing operations were favorably impacted by a decline in cash paid for incometaxes of continuing operations ($91 million) partially offset by other working capital requirements.
Cash Used in Investing Activities of Continuing Operations. We used $527 million of cash in support of investing activities ofcontinuing operations in fiscal 2013, including $483 million (net of cash acquired) to acquire maxIT Healthcare Holdings, Inc.and $48 million to purchase property, plant and equipment.
We used $203 million of cash in support of investing activities of continuing operations in fiscal 2012, including $218 million(net of cash acquired) to acquire two businesses and $65 million to purchase property, plant and equipment partially offsetby $85 million of proceeds from the sale of real estate and other assets.
We used $445 million of cash in support of investing activities of continuing operations in fiscal 2011, including $382 million(net of cash acquired) to acquire three businesses and $73 million to purchase property, plant and equipment.
Cash Provided by (Used in) Financing Activities of Continuing Operations. We used $722 million of cash from financingactivities of continuing operations in fiscal 2013, including $550 million to settle a note payable at maturity, $165 million topay dividends on SAIC stock and $22 million to repurchase shares of SAIC stock, partially offset by $19 million in proceedsfrom the sale of stock under our employee stock purchase plan (ESPP).
We used $449 million of cash from financing activities of continuing operations in fiscal 2012, including $471 million torepurchase shares of SAIC stock partially offset by $27 million in proceeds from the sale of stock under our ESPP andexercises of stock options.
We generated $187 million of cash from financing activities of continuing operations in fiscal 2011, including $742 million ofnet proceeds from the issuance of debt, $38 million in proceeds from the sale of stock under our ESPP and exercises ofstock options and $11 million in excess tax benefits associated with stock-based compensation partially offset by$601 million to repurchase shares of SAIC stock.
Cash Flows from Discontinued Operations. Cash flows from discontinued operations for fiscal 2013 included net proceeds of$51 million from the sale of certain components of our business. Cash flows from discontinued operations for fiscal 2012included net proceeds of $167 million from the sale of certain components of our business. Cash flows from discontinuedoperations for fiscal 2011 included proceeds of $89 million from the settlement of an arbitration proceeding brought againstTelkom South Africa by our former subsidiary, Telcordia Technologies, Inc., in addition to the cash flows generated from theoperations of the components of our business sold, partially offset by payments of $54 million to Telcordia and taxingauthorities in connection with the settlement.
38 SAIC, Inc. Annual Report

PART II
Science Applications’ Cash Flows. Any differences in cash flows from operating activities of continuing operations forScience Applications as compared to SAIC are primarily attributable to changes in interest payments (which reduce cashflows from operating activities of Science Applications) made by Science Applications on its note to SAIC and changes inexcess tax benefits related to stock-based compensation (which reduce cash flows from operating activities for SAIC).
Science Applications used cash in financing activities of continuing operations of $722 million in fiscal 2013, includingrepayments on its note with SAIC of $411 million partially offset by proceeds from the note of $244 million. In addition,Science Applications used $550 million in cash to settle a third-party note payable at maturity (as described above in SAIC’scash used in financing activities of continuing operations). Science Applications used cash in financing activities of$446 million in fiscal 2012, including repayments on its note payable with SAIC of $1.079 billion, partially offset by proceedsfrom the note payable of $638 million. Science Applications generated cash from financing activities of $184 million in fiscal2011, including proceeds from the issuance of third-party debt of $742 million and proceeds from its note with SAIC of$1.298 billion, partially offset by repayments on the note with SAIC of $1.853 billion.
Stock Repurchase Program
In March 2012, our board of directors authorized a stock repurchase program under which we may repurchase up to40 million shares of SAIC common stock. Stock repurchases may be made on the open market or in privately negotiatedtransactions with third parties. Whether repurchases are made and the timing and actual number of shares repurchaseddepends on a variety of factors including price, corporate capital requirements, other market conditions and regulatoryrequirements.
Outstanding Indebtedness
Notes Payable and Long-term Debt. Our outstanding notes payable and long-term debt consisted of the following:
January 31
Statedinterest rate
Effectiveinterest rate 2013 2012
($ in millions)
SAIC senior unsecured notes:$450 million notes issued in fiscal 2011, which mature in December 2020 4.45% 4.53% $ 449 $ 449$300 million notes issued in fiscal 2011, which mature in December 2040 5.95% 6.03% 300 300
Science Applications senior unsecured notes:$550 million notes issued in fiscal 2003, which matured in July 2012 6.25% 6.50% — 550$250 million notes issued in fiscal 2003, which mature in July 2032 7.13% 7.43% 248 248$300 million notes issued in fiscal 2004, which mature in July 2033 5.50% 5.78% 297 296
Other notes payable due on various dates through fiscal 2017 0%-2.5% Various 4 9
Total notes payable and long-term debt 1,298 1,852Less current portion 2 553
Total notes payable and long-term debt, net of current portion $1,296 $1,299
We paid $550 million to settle the 6.25% notes at maturity in July 2012.
The notes payable outstanding as of January 31, 2013 contain financial covenants and customary restrictive covenants,including, among other things, restrictions on our ability to create liens and enter into sale and leaseback transactions. Wewere in compliance with all covenants as of January 31, 2013. For additional information on our notes payable and long-termdebt, see Note 7 of the combined notes to consolidated financial statements contained within this Annual Report on Form10-K.
Credit Facility. SAIC has a revolving credit facility, which is fully and unconditionally guaranteed by Science Applications,providing for up to $750 million in unsecured borrowing capacity at interest rates determined, at SAIC’s option, based oneither LIBOR plus a margin or a defined base rate. During fiscal 2013, we extended the maturity date of the credit facility forone additional year, to March 2016, as provided for in the terms of the credit facility. As of January 31, 2013 and 2012, therewere no borrowings outstanding under the credit facility, and we had $750 million of available borrowing capacity. The creditfacility contains financial covenants and customary restrictive covenants. As of January 31, 2013, we were in compliancewith all covenants under the credit facility. A failure to meet the financial covenants in the future would reduce and couldeliminate our borrowing capacity under the credit facility. For additional information on our credit facility, see Note 6 of thecombined notes to consolidated financial statements contained within this Annual Report on Form 10-K.
SAIC, Inc. Annual Report 39

PART II
Off-Balance Sheet Arrangements
We have outstanding performance guarantees and cross-indemnity agreements in connection with certain of ourunconsolidated joint venture investments. We also have letters of credit outstanding principally related to guarantees oncontracts with foreign government customers and surety bonds outstanding principally related to performance and paymentbonds as described in Note 18 of the combined notes to consolidated financial statements contained within this AnnualReport on Form 10-K. These arrangements have not had, and management does not believe it is likely that they will in thefuture have, a material effect on our liquidity, capital resources, operations or financial condition. We have also entered intoan agreement with a variable interest entity (VIE) in connection with a renewable energy project as described in Note 18 ofthe combined notes to consolidated financial statements contained within this Annual Report on Form 10-K.
Contractual Obligations
The following table summarizes, as of January 31, 2013, our obligations to make future payments pursuant to certaincontracts or arrangements and provides an estimate of the fiscal years in which these obligations are expected to be satisfied:
Payments Due by Fiscal Year
Total 20142015-2016
2017-2018
2019 andThereafter
(in millions)
Contractual obligations:Long-term debt (including current portion) (1) $2,648 $ 72 $146 $144 $2,286Operating lease obligations (2) 572 121 208 133 110Capital lease obligations 4 2 1 1 —Estimated purchase obligations (3) 77 61 13 2 1Other long-term liabilities (4) 143 35 29 16 63
Total contractual obligations $3,444 $291 $397 $296 $2,460
(1) Includes total interest payments on our outstanding debt of $72 million in fiscal 2014, $144 million in fiscal 2015-2016,$144 million in fiscal 2017-2018 and $986 million in fiscal 2019 and thereafter.
(2) Excludes $21 million related to an operating lease on a contract with the Greek government as we are not obligated to makethe lease payments to the lessee if our customer defaults on payments to us.
(3) Includes estimated obligations to transfer funds under legally enforceable agreements for fixed or minimum amounts orquantities of goods or services at fixed or minimum prices. Excludes purchase orders for services or products to be deliveredpursuant to U.S. Government contracts under which we have full recourse under normal contract termination clauses.
(4) Other long-term liabilities were allocated by fiscal year as follows: a liability for our foreign defined benefit pension plan is basedupon the expected near-term contributions to the plan (for a discussion of potential changes in these pension obligations, seeNote 9 of the combined notes to consolidated financial statements contained within this Annual Report on Form 10-K); liabilitiesunder deferred compensation arrangements are based upon the average annual payments in prior years upon termination ofemployment by participants; liabilities for uncertain tax positions are based upon the fiscal year that the statute of limitations iscurrently expected to expire; a liability to reimburse a customer for cash advances on a contract that is periodically renewed isbased upon the fiscal year that the most recent contract renewal is ending; and other liabilities are based on the fiscal year thatthe liabilities are expected to be realized.
Commitments and Contingencies
We are subject to a number of reviews, investigations, claims, lawsuits and other uncertainties related to our business. For adiscussion of these items, see Notes 17 and 18 of the combined notes to the consolidated financial statements containedwithin this Annual Report on Form 10-K.
Critical Accounting Policies
Our discussion and analysis of our financial condition and results of operations are based upon our consolidated financialstatements, which are prepared in accordance with accounting principles generally accepted in the United States of America(GAAP). The preparation of these financial statements in accordance with GAAP requires management to make estimatesand assumptions that affect the reported amounts of assets and liabilities and the disclosure of contingencies at the date ofthe financial statements, as well as the reported amounts of revenues and expenses during the reporting periods.Management evaluates these estimates and assumptions on an ongoing basis. Our estimates and assumptions have beenprepared by management on the basis of the most current reasonably available information. The results of these estimatesform the basis for making judgments about the carrying values of assets and liabilities that are not readily apparent fromother sources. Actual results could differ from these estimates under different assumptions and conditions.
40 SAIC, Inc. Annual Report

PART II
We have several critical accounting policies that are both important to the portrayal of our financial condition and results ofoperations and require management’s most difficult, subjective and complex judgments. Typically, the circumstances thatmake these judgments difficult, subjective and complex have to do with making estimates about the effect of matters thatare inherently uncertain. Our critical accounting policies are described below.
Revenue Recognition. We generate our revenues from various types of contracts, which include firm-fixed-price, time-and-materials, fixed-price-level-of-effort, cost-plus-fixed-fee, cost-plus-award-fee and cost-plus-incentive-fee contracts.
Firm-fixed-price contracts—Revenues and fees on these contracts that are system integration or engineering in nature areprimarily recognized using the percentage-of-completion method of accounting utilizing the cost-to-cost method.
Time-and-materials contracts—Revenue is recognized on time-and-materials contracts with the U.S. Government using thepercentage-of-completion method of accounting utilizing an output measure of progress. Revenue is recognized on time-and-materials contracts with non-U.S. Government customers using a proportional performance method. Under both ofthese methods, revenue is recognized based on the hours provided in performance under the contract multiplied by thenegotiated contract billing rates, plus the negotiated contract billing rate of any allowable material and subcontract costs andout-of-pocket expenses.
Fixed-price-level-of-effort contracts (FP-LOE)—These contracts are substantially similar to time-and-materials contractsexcept they require a specified level of effort over a stated period of time. Accordingly, we recognize revenue on FP-LOEcontracts with the U.S. Government in a manner similar to time-and-materials contracts in which we measure progresstoward completion based on the hours provided in performance under the contract multiplied by the negotiated contractbilling rates, plus the negotiated contract billing rate of any allowable material costs and out-of-pocket expenses.
Cost-plus-fixed-fee contracts—Revenue is recognized on cost-plus-fixed-fee contracts with the U.S. Government on thebasis of partial performance equal to costs incurred, plus an estimate of applicable fees earned as we become contractuallyentitled to reimbursement of costs and the applicable fees.
Cost-plus-award-fee/cost-plus-incentive fee contracts—Revenues and fees on these contracts with the U.S. Governmentare primarily recognized using the percentage-of-completion method of accounting, most often based on the cost-to-costmethod. We include an estimate of the ultimate incentive or award fee to be received on the contract in the estimate ofcontract revenues for purposes of applying the percentage-of-completion method of accounting.
Revenues from services and maintenance contracts, notwithstanding contract type, are recognized over the term of therespective contracts as the services are performed and revenue is earned. Revenues from unit-priced contracts arerecognized as transactions are processed based on objective measures of output. Revenues from the sale of manufacturedproducts are recorded upon passage of title and risk of loss to the customer, which is generally upon delivery, provided thatall other requirements for revenue recognition have been met.
We also use the efforts-expended method of percentage-of-completion using measures such as labor dollars for measuringprogress toward completion in situations in which this approach is more representative of the progress on the contract. Forexample, the efforts-expended method is utilized when there are significant amounts of materials or hardware procured forthe contract that is not representative of progress on the contract. Additionally, we utilize the units-of-delivery method underpercentage-of-completion on contracts where separate units of output are produced. Under the units-of-delivery method,revenue is generally recognized when the units are delivered to the customer, provided that all other requirements forrevenue recognition have been met.
We also evaluate contracts for multiple elements, and when appropriate, separate the contracts into separate units ofaccounting for revenue recognition.
We provide for anticipated losses on contracts by recording an expense during the period in which the losses aredetermined. Amounts billed and collected but not yet recognized as revenues under certain types of contracts are deferred.Contract costs incurred for U.S. Government contracts, including indirect costs, are subject to audit and adjustment throughnegotiations between us and government representatives. Revenues on U.S. Government contracts have been recorded inamounts that are expected to be realized upon final settlement.
Contract claims are unanticipated additional costs incurred but not provided for in the executed contract price that we seekto recover from the customer. Such costs are expensed as incurred. Additional revenue related to contract claims isrecognized when the amounts are awarded by the customer.
SAIC, Inc. Annual Report 41

PART II
In certain situations, primarily where we are not the primary obligor on certain elements of a contract such as the provision ofadministrative oversight and/or management of government-owned facilities or logistical support services related to othervendors’ products, we recognize as revenues the net management fee associated with the services and exclude from ourincome statement the gross sales and costs associated with the facility or other vendors’ products.
Changes in Estimates on Contracts. Changes in estimates related to certain types of contracts accounted for using thepercentage of completion method of accounting are recognized in the period in which such changes are made for theinception-to-date effect of the changes. Changes in these estimates can routinely occur over the contract performanceperiod for a variety of reasons, including changes in contract scope, changes in contract cost estimates due to unanticipatedcost growth or retirements of risk for amounts different than estimated, and changes in estimated incentive or award fees.Aggregate changes in contract estimates increased operating income by $18 million ($0.03 per diluted share), $37 million($0.07 per diluted share) and $44 million ($0.08 per diluted share) for fiscal 2013, fiscal 2012 and fiscal 2011, respectively.
Receivables. Our accounts receivable include unbilled receivables, which consist of costs and fees billable upon contractcompletion or the occurrence of a specified event, the majority of which is expected to be billed and collected within oneyear. Unbilled receivables are stated at estimated realizable value. Contract retentions are billed when we have negotiatedfinal indirect rates with the U.S. Government and, once billed, are subject to audit and approval by governmentrepresentatives. Consequently, the timing of collection of retention balances is outside our control. Based on our historicalexperience, the majority of retention balances are expected to be collected beyond one year and write-offs of retentionbalances have not been significant. We have extended deferred payment terms with original contractual maturities that mayexceed one year to commercial customers related to certain construction projects. As of January 31, 2013, we hadoutstanding receivables from these customers with deferred payment terms of $104 million, which are expected to becollected in fiscal 2014 when the customers have obtained financing. When events or conditions indicate that amountsoutstanding from customers may become uncollectible, an allowance is estimated and recorded.
Business Combinations and Goodwill and Intangible Assets Impairment. We have engaged and expect to continue toengage in business acquisition activity. The accounting for business combinations requires management to make judgmentsand estimates of the fair value of assets acquired, including the identification and valuation of intangible assets, as well as theliabilities and contingencies assumed. Such judgments and estimates directly impact the amount of goodwill recognized inconnection with each acquisition.
Goodwill is assessed for impairment at least annually and whenever events or circumstances indicate that the carrying valuemay not be recoverable. We perform our annual goodwill impairment assessment as of the beginning of the fourth quarter.The goodwill impairment test is a two-step process performed at the reporting unit level. The first step consists of estimatingthe fair values of each of the reporting units based a market approach and an income approach. Fair value computed usingthese two methods is determined using a number of factors, including projected future operating results and business plans,economic projections, anticipated future cash flows, comparable market data based on industry grouping, and the cost ofcapital. The estimated fair values are compared with the carrying values of the reporting units, which include the allocatedgoodwill. If the fair value is less than the carrying value of a reporting unit, which includes the allocated goodwill, a secondstep is performed to compute the amount of the impairment by determining an implied fair value of goodwill. The implied fairvalue of goodwill is the residual fair value derived by deducting the fair value of a reporting unit’s identifiable assets andliabilities from its estimated fair value calculated in the first step. The impairment expense represents the excess of thecarrying amount of the reporting unit’s goodwill over the implied fair value of the reporting unit’s goodwill. The goodwillimpairment test process requires management to make significant judgments and assumptions, including revenue, profit andcash flow forecasts, about the business units to which goodwill is assigned. Our goodwill impairment tests performed forfiscal 2013, 2012 and 2011 did not result in any impairment of goodwill since the fair value was in excess of the carryingvalue. The carrying value of goodwill as of January 31, 2013 was $2.2 billion. We face continued uncertainty in our businessenvironment due to the substantial fiscal and economic challenges facing the U.S. Government, our primary customer.Adverse changes in fiscal and economic conditions, such as the implementation of budget cuts, sequestration, and issuesrelated to the nation’s debt ceiling, could adversely impact our future revenues and profitability. These circumstances couldresult in an impairment of goodwill.
Intangible assets with finite lives are assessed for impairment whenever events or changes in circumstances indicate that thecarrying value may not be recoverable. In fiscal 2013 and 2012, we recognized impairment losses on intangible assets of$13 million and $19 million, respectively. We did not recognize any impairment losses on intangible assets in fiscal 2011. Thecarrying value of intangible assets as of January 31, 2013 was $190 million.
Income Taxes. We account for income taxes under the asset and liability method of accounting, which requires the recognitionof deferred tax assets and liabilities for the expected future tax consequences of temporary differences between the carryingamounts and the tax bases of assets and liabilities. Under this method, changes in tax rates and laws are recognized inincome in the period such changes are enacted. The provision for federal, state, foreign and local income taxes is calculated
42 SAIC, Inc. Annual Report

PART II
on income before income taxes based on current tax law and includes the cumulative effect of any changes in tax rates fromthose used previously in determining deferred tax assets and liabilities. Such provision differs from the amounts currentlypayable because certain items of income and expense are recognized in different reporting periods for financial reportingpurposes than for income tax purposes. Recording our provision for income taxes requires management to make significantjudgments and estimates for matters whose ultimate resolution may not become known until the final resolution of anexamination by the IRS or state agencies. Additionally, recording liabilities for uncertain tax positions involves significantjudgment in evaluating our tax positions and developing our best estimate of the taxes ultimately expected to be paid.
We record net deferred tax assets to the extent we believe these assets will more likely than not be realized. In making suchdetermination, we consider all available positive and negative evidence, including future reversals of existing taxabletemporary differences, projected future taxable income, tax planning strategies and recent results of operations. If we wereto determine that we would be able to realize our deferred income tax assets in the future in excess of their net recordedamount or would no longer be able to realize our deferred income tax assets in the future as currently recorded, we wouldmake an adjustment to the valuation allowance which would decrease or increase the provision for income taxes.
We also recognize liabilities for uncertain tax positions when it is more likely than not that a tax position will not be sustainedupon examination and settlement with various taxing authorities. Liabilities for uncertain tax positions are measured basedupon the largest amount of benefit that is greater than 50% likely of being realized upon ultimate settlement. We haveexperienced years when liabilities for uncertain tax positions were settled for amounts different from recorded amounts asdescribed in Note 11 of the combined notes to the consolidated financial statements contained within this Annual Report onForm 10-K.
Stock-Based Compensation. We account for stock-based compensation in accordance with the accounting standard forstock compensation. Under the fair value recognition provisions of this standard, share-based compensation cost ismeasured at the grant date based on the fair value of the award and is recognized as expense over the requisite serviceperiod, which is generally the vesting period, net of an estimated forfeiture rate. The estimation of stock option fair valuerequires management to make complex estimates and judgments about, among other things, employee exercise behavior,forfeiture rates, and the volatility of SAIC common stock. These judgments directly affect the amount of compensationexpense that will ultimately be recognized. The expected term for all awards granted is derived from our historicalexperience, except for awards granted to our outside directors, for which the expected term of awards granted is derivedutilizing the “simplified” method presented in SEC Staff Accounting Bulletin Nos. 107 and 110, “Share-Based Payment”.Expected volatility is based on an average of the historical volatility of SAIC stock and the implied volatility from tradedoptions on SAIC stock. We assumed weighted average volatilities of 24.5%, 23.4% and 25.1% for fiscal 2013, 2012 and2011, respectively. If other assumptions are held constant, an increase or decrease by 10% in our fiscal 2013 volatilityassumption would have changed the grant-date fair value of our fiscal 2013 option awards by approximately 50%.
Non-GAAP Financial Measures
In this Annual Report on Form 10-K, we refer to internal revenue growth (contraction) percentage, which is a non-GAAPfinancial measure that we reconcile to the most directly comparable GAAP financial measure. We calculate our internalrevenue growth (contraction) percentage by comparing our reported revenue for the current year to the revenue for the prioryear adjusted to include the actual revenue of acquired businesses for the comparable prior year before acquisition. Thiscalculation has the effect of adding revenue for the acquired businesses for the comparable prior year to our prior yearreported revenue.
We use internal revenue growth (contraction) percentage as an indicator of how successful we are at growing our basebusiness and how successful we are at growing the revenues of the businesses that we acquire. Our integration of acquiredbusinesses allows our current management to leverage business development capabilities, drive internal resourcecollaboration, utilize access to markets and qualifications, and refine strategies to realize synergies, which benefits bothacquired and existing businesses. As a result, the performance of the combined enterprise post-acquisition is an importantmeasurement. In addition, as a means of rewarding the successful integration and growth of acquired businesses, and notacquisitions themselves, incentive compensation for our senior management is based, in part, on achievement of revenuetargets linked to internal revenue growth.
The limitation of this non-GAAP financial measure as compared to the most directly comparable GAAP financial measure isthat internal revenue growth (contraction) percentage is one of two components of the total revenue growth (contraction)percentage, which is the most directly comparable GAAP financial measure. We address this limitation by presenting thetotal revenue growth (contraction) percentage next to or near disclosures of internal revenue growth (contraction)percentage. This financial measure is not meant to be considered in isolation or as a substitute for comparable GAAPmeasures and should be read only in conjunction with our consolidated financial statements prepared in accordance with
SAIC, Inc. Annual Report 43

PART II
GAAP. The method that we use to calculate internal revenue growth (contraction) percentage is not necessarily comparableto similarly titled financial measures presented by other companies. Internal revenue growth (contraction) percentages forfiscal 2013 and 2012 were calculated as follows:
Year Ended January 31
2013 2012
(dollars in millions)
Defense Solutions:Prior fiscal year’s revenues, as reported $ 4,191 $ 4,657Revenues of acquired businesses for the comparable prior year period — 5
Prior fiscal year’s revenues, as adjusted $ 4,191 $ 4,662Current fiscal year’s revenues, as reported 4,718 4,191
Internal revenue growth (contraction) $ 527 $ (471)
Internal revenue growth (contraction) percentage 13% (10)%
Health, Energy and Civil Solutions:Prior fiscal year’s revenues, as reported $ 2,734 $ 2,630Revenues of acquired businesses for the comparable prior year period 177 132
Prior fiscal year’s revenues, as adjusted $ 2,911 $ 2,762Current fiscal year’s revenues, as reported 2,788 2,734
Internal revenue contraction $ (123) $ (28)
Internal revenue contraction percentage (4)% (1)%
Intelligence and Cybersecurity Solutions:Prior fiscal year’s revenues, as reported $ 3,574 $ 3,460Revenues of acquired businesses for the comparable prior year period — 5
Prior fiscal year’s revenues, as adjusted $ 3,574 $ 3,465Current fiscal year’s revenues, as reported 3,672 3,574
Internal revenue growth $ 98 $ 109
Internal revenue growth percentage 3% 3%
Total*:Prior fiscal year’s revenues, as reported $10,497 $10,798Revenues of acquired businesses for the comparable prior year period 177 142
Prior fiscal year’s revenues, as adjusted $10,674 $10,940Current fiscal year’s revenues, as reported 11,173 10,497
Internal revenue growth (contraction) $ 499 $ (443)
Internal revenue growth (contraction) percentage 5% (4)%
* Total revenues include amounts related to Corporate and Other and intersegment eliminations.
Recently Adopted and Issued Accounting Pronouncements
For additional information regarding recently adopted and issued accounting pronouncements, see Note 1 of the combinednotes to consolidated financial statements contained within this Annual Report on Form 10-K.
Effects of Inflation
Approximately 40% of our revenues are derived from cost-reimbursement type contracts, which are generally completedwithin one year. Bids for longer-term FFP and T&M and FP-LOE contracts typically include sufficient provisions for labor andother cost escalations to cover anticipated cost increases over the period of performance. As a result, our revenues andcosts have generally both increased commensurate with inflation and net income as a percentage of total revenues has notbeen significantly affected.
Item 7A. Quantitative and Qualitative Disclosures About Market Risk
We are exposed to certain market risks in the normal course of business. Our current market risk exposures are primarilyrelated to interest rates and foreign currency fluctuations. The following information about our market sensitive financialinstruments contains forward-looking statements.
Interest Rate Risk. Our exposure to market risk for changes in interest rates relates primarily to our cash equivalents andlong-term debt obligations. We have established an investment policy to protect the safety, liquidity and after-tax yield of
44 SAIC, Inc. Annual Report

PART II
invested funds. This policy establishes guidelines regarding acceptability of instruments and maximum maturity dates andrequires diversification in the investment portfolios by establishing maximum amounts that may be invested in designatedinstruments and issuers. We do not authorize the use of derivative instruments in our managed short-term investmentportfolios. Our policy authorizes, with board of directors’ approval, the limited use of derivative instruments only to hedgespecific interest rate risks.
The table below provides information about our financial instruments at January 31, 2013 that are sensitive to changes ininterest rates. For debt obligations and short-term investments, the table presents principal cash flows in U.S. dollars andrelated weighted average interest rates by expected maturity dates.
2014 2015 2016 2017 2018 Thereafter Total
Estimated FairValue as of
January 31, 2013
(dollars in millions)
Assets:Cash and cash equivalents $736 $ — $ — $ — $— $ — $ 736 $ 736Average interest rate —% — — — — —
Liabilities:Short-term and long-term debt:
Variable interest rate $ — $ 1 $ 1 $ 1 $— $ — $ 3 $ 3Weighted average interest rate —% 2.5% 2.5% 2.5% —% —
Fixed rate $ 2 $ 1 $ — $ — $— $1,300 $1,303 $1,387Weighted average interest rate 3.8% 3.2% —% —% —% 5.6%
At January 31, 2013 and 2012, our cash and cash equivalents included investments in several large institutional moneymarket funds that invest primarily in bills, notes and bonds issued by the U.S. Treasury, U.S. Government guaranteedrepurchase agreements fully collateralized by U.S. Treasury obligations, U.S. Government guaranteed securities andinvestment-grade corporate securities that had original maturities of three months or less. A 10% unfavorable interest ratemovement would not materially impact the value of the holdings and would have a negligible impact on interest income atcurrent market interest rates.
Foreign Currency Risk. Although the majority of our transactions are denominated in U.S. dollars, some of our transactionsare denominated in foreign currencies. Our foreign currency exchange rate risk relates to receipts from customers, paymentsto suppliers and certain intercompany transactions denominated in currencies other than our (or one of our subsidiaries’)functional currency.
Item 8. Financial Statements and Supplementary Data
See our consolidated financial statements attached hereto and listed on the Index to Consolidated Financial Statements setforth on page F-1 of this Annual Report on Form 10-K.
Item 9. Changes in and Disagreements With Accountants on Accounting and Financial Disclosure
None.
Item 9A. Controls and Procedures
Evaluation of Disclosure Controls and Procedures
Our management, with the participation of our principal executive officer (our Chief Executive Officer) and principal financialofficer (our Executive Vice President and Chief Financial Officer), has evaluated the effectiveness of SAIC’s and ScienceApplications’ disclosure controls and procedures (as defined in Rules 13a-15(e) or 15d-15(e) under the Securities ExchangeAct of 1934) as of January 31, 2013, and our principal executive officer and principal financial officer have concluded that ourdisclosure controls and procedures are effective to ensure that information required to be disclosed by us in the reports thatwe file or submit under the Securities Exchange Act of 1934 is recorded, processed, summarized and reported within thetime periods specified in the rules and forms of the U.S. Securities Exchange Commission. These disclosure controls andprocedures include, without limitation, controls and procedures designed to ensure that information required to be disclosedby us in the reports that we file or submit under the Securities Exchange Act of 1934 is accumulated and communicated toour management, including our principal executive officer and our principal financial officer, as appropriate to allow timelydecisions regarding required disclosure.
SAIC, Inc. Annual Report 45

PART II
Changes in Internal Control Over Financial Reporting
There have been no changes in our internal control over financial reporting that occurred in the quarterly period covered bythis report that materially affected, or are reasonably likely to materially affect, our internal control over financial reporting.
Management’s Report On Internal Control Over Financial Reporting
Our management is responsible for establishing and maintaining adequate internal control over financial reporting. Internalcontrol over financial reporting is a process designed to provide reasonable assurance regarding the reliability of financialreporting and the preparation of financial statements for external purposes in accordance with accounting principlesgenerally accepted in the United States of America.
Our management, with the participation of our principal executive officer and principal financial officer, has evaluated theeffectiveness of SAIC’s and Science Application’s internal control over financial reporting as of January 31, 2013 based onthe framework established in Internal Control—Integrated Framework issued by the Committee of Sponsoring Organizationsof the Treadway Commission. Our management has assessed in its evaluation the effectiveness of our internal control overfinancial reporting as of January 31, 2013 and has concluded that our internal control over financial reporting as of that datewas effective.
Deloitte & Touche LLP, an independent registered public accounting firm, audited our consolidated financial statementsincluded in this Annual Report on Form 10-K and our internal control over financial reporting, and that firm’s reports on ourinternal control over financial reporting are set forth below.
46 SAIC, Inc. Annual Report

PART II
REPORT OF INDEPENDENT REGISTERED PUBLIC ACCOUNTING FIRM
To the Board of Directors and Stockholders ofSAIC, Inc.McLean, Virginia
We have audited the internal control over financial reporting of SAIC, Inc. and subsidiaries (the “Company”) as of January 31,2013, based on criteria established in Internal Control—Integrated Framework issued by the Committee of SponsoringOrganizations of the Treadway Commission. The Company’s management is responsible for maintaining effective internalcontrol over financial reporting and for its assessment of the effectiveness of internal control over financial reporting, includedin the accompanying Management’s Report on Internal Control over Financial Reporting. Our responsibility is to express anopinion on the Company’s internal control over financial reporting based on our audit.
We conducted our audit in accordance with the standards of the Public Company Accounting Oversight Board(United States). Those standards require that we plan and perform the audit to obtain reasonable assurance about whethereffective internal control over financial reporting was maintained in all material respects. Our audit included obtaining anunderstanding of internal control over financial reporting, assessing the risk that a material weakness exists, testing andevaluating the design and operating effectiveness of internal control based on the assessed risk, and performing such otherprocedures as we considered necessary in the circumstances. We believe that our audit provides a reasonable basis for ouropinion.
A company’s internal control over financial reporting is a process designed by, or under the supervision of, the company’sprincipal executive and principal financial officers, or persons performing similar functions, and effected by the company’sboard of directors, management, and other personnel to provide reasonable assurance regarding the reliability of financialreporting and the preparation of financial statements for external purposes in accordance with generally acceptedaccounting principles. A company’s internal control over financial reporting includes those policies and procedures that(1) pertain to the maintenance of records that, in reasonable detail, accurately and fairly reflect the transactions anddispositions of the assets of the company; (2) provide reasonable assurance that transactions are recorded as necessary topermit preparation of financial statements in accordance with generally accepted accounting principles, and that receiptsand expenditures of the company are being made only in accordance with authorizations of management and directors ofthe company; and (3) provide reasonable assurance regarding prevention or timely detection of unauthorized acquisition,use, or disposition of the company’s assets that could have a material effect on the financial statements.
Because of the inherent limitations of internal control over financial reporting, including the possibility of collusion or impropermanagement override of controls, material misstatements due to error or fraud may not be prevented or detected on a timelybasis. Also, projections of any evaluation of the effectiveness of the internal control over financial reporting to future periodsare subject to the risk that the controls may become inadequate because of changes in conditions, or that the degree ofcompliance with the policies or procedures may deteriorate.
In our opinion, the Company maintained, in all material respects, effective internal control over financial reporting as ofJanuary 31, 2013, based on the criteria established in Internal Control—Integrated Framework issued by the Committee ofSponsoring Organizations of the Treadway Commission.
We have also audited, in accordance with the standards of the Public Company Accounting Oversight Board (United States),the consolidated financial statements as of and for the year ended January 31, 2013 of the Company and our report datedMarch 26, 2013, expressed an unqualified opinion on those financial statements.
/s/ DELOITTE & TOUCHE LLP
McLean, VirginiaMarch 26, 2013
SAIC, Inc. Annual Report 47

PART II
REPORT OF INDEPENDENT REGISTERED PUBLIC ACCOUNTING FIRM
To the Board of Directors and Stockholder ofScience Applications International CorporationMcLean, Virginia
We have audited the internal control over financial reporting of Science Applications International Corporation andsubsidiaries (the “Company”) as of January 31, 2013, based on criteria established in Internal Control—IntegratedFramework issued by the Committee of Sponsoring Organizations of the Treadway Commission. The Company’smanagement is responsible for maintaining effective internal control over financial reporting and for its assessment of theeffectiveness of internal control over financial reporting, included in the accompanying Management’s Report on InternalControl over Financial Reporting. Our responsibility is to express an opinion on the Company’s internal control over financialreporting based on our audit.
We conducted our audit in accordance with the standards of the Public Company Accounting Oversight Board(United States). Those standards require that we plan and perform the audit to obtain reasonable assurance about whethereffective internal control over financial reporting was maintained in all material respects. Our audit included obtaining anunderstanding of internal control over financial reporting, assessing the risk that a material weakness exists, testing andevaluating the design and operating effectiveness of internal control based on the assessed risk, and performing such otherprocedures as we considered necessary in the circumstances. We believe that our audit provides a reasonable basis for ouropinion.
A company’s internal control over financial reporting is a process designed by, or under the supervision of, the company’sprincipal executive and principal financial officers, or persons performing similar functions, and effected by the company’sboard of directors, management, and other personnel to provide reasonable assurance regarding the reliability of financialreporting and the preparation of financial statements for external purposes in accordance with generally acceptedaccounting principles. A company’s internal control over financial reporting includes those policies and procedures that(1) pertain to the maintenance of records that, in reasonable detail, accurately and fairly reflect the transactions anddispositions of the assets of the company; (2) provide reasonable assurance that transactions are recorded as necessary topermit preparation of financial statements in accordance with generally accepted accounting principles, and that receiptsand expenditures of the company are being made only in accordance with authorizations of management and directors ofthe company; and (3) provide reasonable assurance regarding prevention or timely detection of unauthorized acquisition,use, or disposition of the company’s assets that could have a material effect on the financial statements.
Because of the inherent limitations of internal control over financial reporting, including the possibility of collusion or impropermanagement override of controls, material misstatements due to error or fraud may not be prevented or detected on a timelybasis. Also, projections of any evaluation of the effectiveness of the internal control over financial reporting to future periodsare subject to the risk that the controls may become inadequate because of changes in conditions, or that the degree ofcompliance with the policies or procedures may deteriorate.
In our opinion, the Company maintained, in all material respects, effective internal control over financial reporting as ofJanuary 31, 2013, based on the criteria established in Internal Control—Integrated Framework issued by the Committee ofSponsoring Organizations of the Treadway Commission.
We have also audited, in accordance with the standards of the Public Company Accounting Oversight Board (United States),the consolidated financial statements as of and for the year ended January 31, 2013, of the Company and our report datedMarch 26, 2013, expressed an unqualified opinion on those financial statements.
/s/ DELOITTE & TOUCHE LLP
McLean, VirginiaMarch 26, 2013
48 SAIC, Inc. Annual Report

PART II
Item 9B. Other Information
On March 22, 2013, the SAIC board of directors adopted amendments to SAIC’s bylaws to:
• change the first day of SAIC’s fiscal year from February 1 to the day after the Friday closest to January 31 in each year;and
• provide that (i) only the board of directors may elect principal and other officers of SAIC, and (ii) officers other thanprincipal officers may be removed by the chief executive officer (or someone to whom the chief executive officer hasdelegated this authority).
On March 22, 2013, the Science Applications board of directors adopted amendments to Science Applications’ bylaws to:
• change the first day of Science Applications’ fiscal year from February 1 to the day after the Friday closest to January 31in each year; and
• provide that (i) only the board of directors may elect principal and other officers of Science Applications, and (ii) officersother than principal officers may be removed by the chief executive officer (or someone to whom the chief executiveofficer has delegated this authority).
Since the change in fiscal year for SAIC and Science Applications is from the last day of the month to a 52 – 53 week fiscalyear commencing within seven days of the month end and the new fiscal year will commence with the end of the old fiscalyear, the change is not deemed a change in fiscal year for the purposes of reporting subject to Rule 13a-10 or 15d-10 of theSecurities Exchange Act of 1934. As a result SAIC and Science Applications will not be filing a separate transition report.
The above summary of the bylaw amendments is subject to and qualified in its entirety by reference to the text of SAIC’s andScience Applications’ restated bylaws, which are included as Exhibit 3.2 and Exhibit 3.4, respectively, to this Annual Reporton Form 10-K.
The above information is being disclosed under this Item 9B in lieu of disclosure on Form 8-K, Item 5.03.
SAIC, Inc. Annual Report 49

PART III
Item 10. Directors, Executive Officers and Corporate Governance
For certain information required by Item 10 with respect to executive officers, see “Executive and Other Key Officers of theRegistrant” at the end of Part I of this Annual Report on Form 10-K. For additional information required by Item 10 withrespect to executive officers and directors, including audit committee and audit committee financial experts, procedures bywhich stockholders may recommend nominees to the board of directors, and compliance with Section 16(a) of the SecuritiesExchange Act of 1934, see the information set forth under the captions “Proposal 1–Election of Directors,” “CorporateGovernance” and “Other Information” appearing in the 2013 Proxy Statement, which required information is incorporated byreference into this Annual Report on Form 10-K.
We have adopted a code of business ethics that applies to our principal executive officer and our senior financial officers. Acopy of our Code of Ethics for Principal Executive Officer and Senior Financial Officers is available on the Investor Relationssection of our website free of charge at www.saic.com by clicking on the links entitled “Investors” then “CorporateGovernance” and then “Code of Conduct.” We intend to post on our website any material changes to or waivers from ourcode of business ethics. The information on our website is not incorporated by reference into and is not a part of this AnnualReport on Form 10-K.
Item 11. Executive Compensation
For information required by Item 11 with respect to executive compensation and director compensation, see the informationset forth under the captions “Compensation Discussion and Analysis,” “Executive Compensation” and “CorporateGovernance” in the 2013 Proxy Statement, which required information is incorporated by reference into this Annual Reporton Form 10-K.
For information required by Item 11 with respect to compensation committee interlocks and insider participation, see theinformation set forth under the caption “Corporate Governance” in the 2013 Proxy Statement, which required information isincorporated by reference into this Annual Report on Form 10-K.
Item 12. Security Ownership of Certain Beneficial Owners and Management and Related Stockholder Matters
For information required by Item 12 with respect to the security ownership of certain beneficial owners and management,see the information set forth under the caption “Other Information” in the 2013 Proxy Statement, which required informationis incorporated by reference into this Annual Report on Form 10-K.
Information with respect to our equity compensation plans as of January 31, 2013 is set forth below:
Plan Category
(a)Number of securities
to be issued uponexercise of
outstanding options,warrants and rights
(b)Weighted-average
exercise price ofoutstanding
options, warrantsand rights
(c)Number of securities
remaining availablefor future issuance
under equitycompensation
plans (excludingsecurities reflected
in column (a))
Equity compensation plans approved by security holders (1) 20,899,623(2) $16.81(3) 56,588,650(4)
Equity compensation plans not approved by security holders (5) — — —(5)
Total 20,899,623 $16.81(3) 56,588,650
(1) The following equity compensation plans approved by security holders are included in this plan category: the 2006 EquityIncentive Plan and the 2006 Employee Stock Purchase Plan.
(2) Represents 1,239,260 shares of SAIC common stock reserved for future issuance for the expected number of shares of stockto be issued for performance-based and other stock awards under the 2006 Equity Incentive Plan and 19,660,363 shares ofSAIC common stock reserved for future issuance upon the exercise of outstanding options awarded under the 2006 EquityIncentive Plan. Does not include shares to be issued pursuant to purchase rights under the 2006 Employee Stock PurchasePlan.
(3) Does not include shares to be issued for performance-based and other stock awards, which will not require any payment uponissuance of those shares.
(4) Represents 38,591,353 shares of SAIC common stock under the 2006 Employee Stock Purchase Plan and 17,997,297 sharesof SAIC common stock under the 2006 Equity Incentive Plan. The maximum number of shares initially available for issuanceunder the 2006 Employee Stock Purchase Plan was 9 million. The 2006 Employee Stock Purchase Plan provides for anautomatic increase to the share reserve on the first day of each fiscal year beginning on February 1, 2007 in an amount equal tothe lesser of (i) 9 million shares, (ii) two percent of the number of shares of SAIC common stock outstanding on the last day ofthe immediately preceding fiscal year or (iii) a number determined by the compensation committee of the board of directors.The 2006 Equity Incentive Plan was amended in June 2012 to provide that the maximum number of shares available for
50 SAIC, Inc. Annual Report

PART III
issuance thereunder is 50 million. Those shares (i) that are issued under the 2006 Equity Incentive Plan that are forfeited orrepurchased at the original purchase price or less or that are issuable upon exercise of awards granted under the plan thatexpire or become unexercisable for any reason after their grant date without having been exercised in full, (ii) that are withheldfrom an option or stock award pursuant to a Company-approved net exercise provision, or (iii) that are not delivered to or areaward shares surrendered by a holder in consideration for applicable tax withholding will continue to be available for issuanceunder the plan.
(5) The Stock Compensation Plan and the Management Stock Compensation Plan have not been approved by security holdersand are included in this plan category. These plans do not provide for a maximum number of shares available for futureissuance.
Some of the principal features of the Stock Compensation Plan and the Management Stock Compensation Plan, togetherreferred to as the Stock Compensation Plans, are summarized below, which summary is qualified in its entirety by the fulltext of the Stock Compensation Plans. Stockholder approval of the Stock Compensation Plans was not required.
Summary of the Stock Compensation Plans
The Stock Compensation Plans have been adopted to provide a long-term incentive to key employees by making deferredawards of shares of SAIC stock. All officers and employees are eligible to receive awards under the Stock CompensationPlan. However, only a select group of management and highly compensated senior employees are eligible to receive awardsunder the Management Stock Compensation Plan. We intend to limit participants of the Management Stock CompensationPlan to individuals that would permit the plan to be treated as a “top hat” plan under applicable Internal Revenue Service andDepartment of Labor Regulations.
The awarding authority (as appointed by our board of directors) designates those key employees receiving awards and thenumber of share units to be awarded. Each share unit generally corresponds to one share of stock, but the employeereceiving an award of share units will not have a direct ownership interest in the shares of stock represented by the shareunits. We have established a trust which enables us to transfer shares of SAIC stock into the trust for purposes of fundingthe Stock Compensation Plans’ obligations. The trust, which is maintained by Vanguard Fiduciary Trust Company as trusteeunder a trust agreement between the trustee and us, is a special type of trust known as a rabbi trust. In order to avoidcurrent taxation of awards under the Stock Compensation Plans, the trust must permit our creditors to reach the assets ofthe trust in the event of our bankruptcy or insolvency.
The awarding authority will establish a vesting schedule of not more than seven years for each award. Awards will generallyvest 100% at the end of the fourth year following the date of award. The death of a participant or a change in control of uswill result in full vesting of an award. A participant will forfeit any unvested portions of the account if the participant’semployment terminates for any reason other than death. We receive the benefit of forfeited amounts to satisfy future awardsunder the Stock Compensation Plans.
Participants of the Stock Compensation Plan receive a lump sum distribution of their awards in shares of stock once theybecome vested while participants of the Management Stock Compensation Plan receive a distribution of their awards inshares of stock following termination or retirement. Participants will be taxed on the value of any amounts distributed fromthe Stock Compensation Plans at the time of the distribution.
The day-to-day administration of the Stock Compensation Plans is provided by the nonqualified plans committee appointedby our board of directors. We have the right to amend or terminate the Stock Compensation Plans at any time and for anyreason.
Item 13. Certain Relationships and Related Transactions, and Director Independence
For information required by Item 13 with respect to certain relationships and related transactions and the independence ofdirectors and nominees, see the information set forth under the caption “Corporate Governance” in the 2013 ProxyStatement, which required information is incorporated by reference into this Annual Report on Form 10-K.
Item 14. Principal Accounting Fees and Services
For information required by Item 14 with respect to principal accounting fees and services, see the information set forthunder the caption “Audit Matters” in the 2013 Proxy Statement, which required information is incorporated by reference intothis Annual Report on Form 10-K.
SAIC, Inc. Annual Report 51

PART IV
Item 15. Exhibits, Financial Statement Schedules
(a) Documents filed as part of the report:
1. Financial Statements
Our consolidated financial statements are attached hereto and listed on the Index to Consolidated Financial Statements setforth on page F-1 of this Annual Report on Form 10-K.
2. Financial Statement Schedules
Financial statement schedules are omitted because they are not applicable or the required information is shown in ourconsolidated financial statements or the notes thereto.
3. Exhibits
ExhibitNumber Description of Exhibit
3.1 Restated Certificate of Incorporation of SAIC, Inc. Incorporated by reference to Exhibit 3.1 to SAIC, Inc.’s CurrentReport on Form 8-K as filed on June 22, 2011 with the SEC.
3.2 Restated Bylaws of SAIC, Inc.
3.3 Restated Certificate of Incorporation of Science Applications International Corporation. Incorporated by referenceto Exhibit 3.3 to Science Applications International Corporation’s Form S-4 RegistrationStatement No. 333-176896 filed on September 19, 2011 with the SEC.
3.4 Restated Bylaws of Science Applications International Corporation.
4.1 Indenture dated June 28, 2002 between Science Applications International Corporation and JPMorgan ChaseBank, as trustee. Incorporated by reference to Exhibit 4.2 to Science Applications International Corporation’sCurrent Report on Form 8-K as filed on July 3, 2002 with the SEC. (SEC File No. 000-12771)
4.2 First Supplemental Indenture, dated October 13, 2006, by and among Science Applications InternationalCorporation, SAIC, Inc. and The Bank of New York Trust Company, N.A., as successor trustee to JPMorganChase Bank, N.A. Incorporated by reference to Exhibit 4.2 to SAIC, Inc.’s Current Report on Form 8-K as filed onOctober 17, 2006 with the SEC. (SEC File No. 001-33072)
4.3 Indenture dated as of December 20, 2010, among SAIC, Inc., Science Applications International Corporation andThe Bank of New York Mellon Trust Company, N.A. as Trustee. Incorporated by reference to Exhibit 4.1 to SAIC,Inc.’s Current Report on Form 8-K as filed on December 22, 2010 with the SEC.
10.1* SAIC, Inc.’s 2006 Equity Incentive Plan (as amended and restated June 15, 2012). Incorporated by reference toExhibit 10.1 to our Quarterly Report on Form 10-Q for the quarterly period ended July 31, 2012 as filed onAugust 31, 2012 with the SEC.
10.2* Science Applications International Corporation’s Stock Compensation Plan, as amended and restated effectiveJanuary 1, 2005, as further amended. Incorporated by reference to Exhibit 10.1 to SAIC, Inc.’s Quarterly Reporton Form 10-Q for the quarterly period ended October 31, 2009 as filed on December 9, 2009 with the SEC.
10.3* Amendment No. Two to Science Applications International Corporation’s Stock Compensation Plan. Incorporatedby reference to Exhibit 10.1 to our Quarterly Report on Form 10-Q for the quarterly period ended April 30, 2012as filed on June 1, 2012 with the SEC.
10.4* Science Applications International Corporation’s Management Stock Compensation Plan, as amended andrestated effective January 1, 2005, as further amended. Incorporated by reference to Exhibit 10.2 to SAIC, Inc.’sQuarterly Report on Form 10-Q for the quarterly period ended October 31, 2009 as filed on December 9, 2009with the SEC.
10.5* Amendment No. Two to Science Applications International Corporation’s Management Stock CompensationPlan. Incorporated by reference to Exhibit 10.2 to our Quarterly Report on Form 10-Q for the quarterly periodended April 30, 2012 as filed on June 1, 2012 with the SEC.
10.6* Science Applications International Corporation’s Keystaff Deferral Plan, as amended and restated effectiveJanuary 1, 2005, as further amended. Incorporated by reference to Exhibit 10.3 to SAIC, Inc.’s Quarterly Reporton Form 10-Q for the quarterly period ended October 31, 2009 as filed on December 9, 2009 with the SEC.
52 SAIC, Inc. Annual Report

PART IV
ExhibitNumber Description of Exhibit
10.7* Amendment No. Two to Science Applications International Corporation’s Keystaff Deferral Plan. Incorporated byreference to Exhibit 10.3 to our Quarterly Report on Form 10-Q for the quarterly period ended April 30, 2012 asfiled on June 1, 2012 with the SEC.
10.8* Science Applications International Corporation’s Key Executive Stock Deferral Plan, as amended and restatedeffective January 1, 2005, as further amended. Incorporated by reference to Exhibit 10.4 to SAIC, Inc.’s QuarterlyReport on Form 10-Q for the quarterly period ended October 31, 2009 as filed on December 9, 2009 with theSEC.
10.9* Amendment No. Four to Science Applications International Corporation’s Key Executive Stock Deferral Plan.Incorporated by reference to Exhibit 10.4 to our Quarterly Report on Form 10-Q for the quarterly period endedApril 30, 2012 as filed on June 1, 2012 with the SEC.
10.10* SAIC, Inc.’s 2006 Employee Stock Purchase Plan, as amended and restated effective July 1, 2010. Incorporatedby reference to Exhibit 10.1 to SAIC, Inc.’s Quarterly Report on Form 10-Q for the quarterly period ended July 31,2010 as filed on September 3, 2010 with the SEC.
10.11* Amendment No. Two to SAIC Inc.’s 2006 Employee Stock Purchase Plan. Incorporated by reference toExhibit 10.5 to our Quarterly Report on Form 10-Q for the quarterly period ended April 30, 2012 as filed onJune 1, 2012 with the SEC.
10.12* Science Applications International Corporation’s 401(k) Excess Deferral Plan (effective as of January 1, 2011).Incorporated by reference to Exhibit 10.9 to SAIC, Inc.’s Annual Report on Form 10-K for the fiscal year endedJanuary 31, 2011 as filed on March 25, 2011 with the SEC.
10.13* Form of Stock Award Agreement of SAIC, Inc.’s 2006 Equity Incentive Plan. Incorporated by reference toExhibit 10.5 to SAIC, Inc.’s Quarterly Report on Form 10-Q for the quarterly period ended October 31, 2009 asfiled on December 9, 2009 with the SEC.
10.14* Form of Stock Award Agreement (Non-Employee Directors) of SAIC, Inc.’s 2006 Equity Incentive Plan.Incorporated by reference to Exhibit 10.7 to SAIC, Inc.’s Quarterly Report on Form 10-Q for the quarterly periodended October 31, 2009 as filed on December 9, 2009 with the SEC.
10.15* Form of Nonstatutory Stock Option Agreement of SAIC, Inc.’s 2006 Equity Incentive Plan. Incorporated byreference to Exhibit 10.6 to SAIC, Inc.’s Quarterly Report on Form 10-Q for the quarterly period endedOctober 31, 2009 as filed on December 9, 2009 with the SEC.
10.16* Form of Nonstatutory Stock Option Agreement of SAIC, Inc.’s 2006 Equity Incentive Plan (covering optionsgranted after February 18, 2011). Incorporated by reference to Exhibit 10.12 to SAIC, Inc.’s Annual Report onForm 10-K for the fiscal year ended January 31, 2011 as filed on March 25, 2011 with the SEC.
10.17* Form of Nonstatutory Stock Option Agreement (Non-Employee Directors) of SAIC, Inc.’s 2006 Equity IncentivePlan. Incorporated by reference to Exhibit 10.8 to SAIC, Inc.’s Quarterly Report on Form 10-Q for the quarterlyperiod ended October 31, 2009 as filed on December 9, 2009 with the SEC.
10.18* Form of Nonstatutory Stock Option Agreement (Non-Employee Directors) of SAIC, Inc.’s 2006 Equity IncentivePlan (covering options granted after February 18, 2011). Incorporated by reference to Exhibit 10.15 to SAIC,Inc.’s Annual Report on Form 10-K for the fiscal year ended January 31, 2011 as filed on March 25, 2011 withthe SEC.
10.19* Form of Performance Share Award Agreement of SAIC, Inc.’s 2006 Equity Incentive Plan. Incorporated byreference to Exhibit 10.2 to SAIC, Inc.’s Quarterly Report on Form 10-Q for the quarterly period ended April 30,2011 as filed on June 3, 2011 with the SEC.
10.20* Form of Amendment to Performance Share Award Agreement of SAIC, Inc.’s 2006 Equity Incentive Plan (forPerformance Share Award Agreements entered into prior to March 22, 2012). Incorporated by reference toExhibit 10.10 to our Quarterly Report on Form 10-Q for the quarterly period ended April 30, 2012 as filed onJune 1, 2012 with the SEC.
10.21* Form of Performance Share Award Agreement of SAIC, Inc.’s 2006 Equity Incentive Plan (covering performanceshare awards after March 22, 2012). Incorporated by reference to Exhibit 10.9 to our Quarterly Report onForm 10-Q for the quarterly period ended April 30, 2012 as filed on June 1, 2012 with the SEC.
10.22* Form of Restricted Unit Award Agreement of SAIC, Inc.’s 2006 Equity Incentive Plan. Incorporated by referenceto Exhibit 10.6 to our Quarterly Report on Form 10-Q for the quarterly period ended April 30, 2012 as filed onJune 1, 2012 with the SEC.
SAIC, Inc. Annual Report 53

PART IV
ExhibitNumber Description of Exhibit
10.23* Form of Restricted Unit Award Agreement (Non-Employee Directors) of SAIC, Inc.’s 2006 Equity Incentive Plan.Incorporated by reference to Exhibit 10.7 to our Quarterly Report on Form 10-Q for the quarterly period endedApril 30, 2012 as filed on June 1, 2012 with the SEC.
10.24* Form of Restricted Unit Award Agreement (Management) of SAIC, Inc.’s 2006 Equity Incentive Plan. Incorporatedby reference to Exhibit 10.8 to our Quarterly Report on Form 10-Q for the quarterly period ended April 30, 2012as filed on June 1, 2012 with the SEC.
10.25* Form of Restricted Unit Award Agreement of SAIC, Inc.’s 2006 Equity Incentive Plan (Four-Year Cliff Vesting).
10.26* Form of Recoupment Policy and Non-Solicitation Acknowledgment and Agreement. Incorporated by reference toExhibit 10.1 to SAIC, Inc.’s Quarterly Report on Form 10-Q for the quarterly period ended April 30, 2010 as filedon June 4, 2010 with the SEC.
10.27 Amended and Restated Four Year Credit Agreement, dated March 11, 2011, among SAIC, Inc., as borrower,Science Applications International Corporation, as guarantor, Citibank, N.A., as administrative agent, Bank ofAmerica, N.A., as syndication agent, Morgan Stanley Bank, N.A., The Bank of Nova Scotia and Wells FargoBank, National Association, as co-documentation agents, and the other lenders party thereto. Incorporated byreference to Exhibit 10.1 to SAIC, Inc.’s Current Report on Form 8-K as filed on March 15, 2011 with the SEC.
10.28* Form of Indemnification Agreement. Incorporated by reference to Exhibit 10.1 to SAIC, Inc.’s Quarterly Report onForm 10-Q for the quarterly period ended April 30, 2007 as filed on June 7, 2007 with the SEC(SEC File No. 001-33072).
10.29* Form of Severance Protection Agreement. Incorporated by reference to Exhibit 10.19 to our Annual Report onForm 10-K for the fiscal year ended January 31, 2012 as filed on March 27, 2012 with the SEC.
10.30* Employment Letter Agreement between Science Applications International Corporation and Mark Sopp, dated asof November 17, 2005. Incorporated by reference to Exhibit 10.1 to Science Applications InternationalCorporation’s Current Report on Form 8-K as filed on November 28, 2005 with the SEC.(SEC File No. 001-12771)
10.31* Stock Offer Letter dated November 14, 2005 to Mark Sopp from Science Applications International Corporation.Incorporated by reference to Exhibit 10.2 to Science Applications International Corporation’s Current Report onForm 8-K as filed on November 28, 2005 with the SEC. (SEC File No. 001-12771)
10.32* Employment Letter Agreement dated February 29, 2012, to John P. Jumper. Incorporated by reference toExhibit 10.1 to SAIC, Inc.’s Current Report on Form 8-K/A as filed on March 2, 2012 with the SEC.
10.33* Stock Offer Letter dated February 29, 2012 to John P. Jumper. Incorporated by reference to Exhibit 10.2 toSAIC, Inc.’s Current Report on Form 8-K/A as filed on March 2, 2012 with the SEC.
10.34 Deferred Prosecution Agreement between Science Applications and the U.S. Attorney’s Office for the SouthernDistrict of New York effective March 14, 2012. Incorporated by reference to Exhibit 10.1 to our Current Report onForm 8-K filed on March 14, 2012 with the SEC.
10.35 Administrative Agreement between Science Applications International Corporation and the United States Army onbehalf of the U.S. Government, dated August 21, 2012. Incorporated by reference to Exhibit 10.1 to our CurrentReport on Form 8-K filed on August 21, 2012 with the SEC.
21 Subsidiaries of Registrants.
23.1 Consent of Independent Registered Public Accounting Firm, Deloitte & Touche LLP.
31.1 Certification of Chief Executive Officer pursuant to Section 302 of the Sarbanes-Oxley Act of 2002.
31.2 Certification of Chief Financial Officer pursuant to Section 302 of the Sarbanes-Oxley Act of 2002.
32.1 Certification of Chief Executive Officer pursuant to 18 U.S.C. Section 1350, as adopted pursuant to Section 906of the Sarbanes-Oxley Act of 2002.
32.2 Certification of Chief Financial Officer pursuant to 18 U.S.C. Section 1350, as adopted pursuant to Section 906 ofthe Sarbanes-Oxley Act of 2002.
99.1 Patent License and Assignment Agreement dated as of August 12, 2005 between Science ApplicationsInternational Corporation and VirnetX, Inc. Incorporated by reference to Exhibit 99.1 to SAIC, Inc.’s Annual Reporton Form 10-K as filed on April 1, 2010 with the SEC.
54 SAIC, Inc. Annual Report

PART IV
ExhibitNumber Description of Exhibit
99.2 † Amendment No. 1 dated as of November 2, 2006 to Patent License and Assignment Agreement betweenScience Applications International Corporation and VirnetX, Inc. Incorporated by reference to Exhibit 99.2 toSAIC, Inc.’s Annual Report on Form 10-K as filed on April 1, 2010 with the SEC.
99.3 Amendment No. 2 dated as of March 12, 2008 to Patent License and Assignment Agreement between ScienceApplications International Corporation and VirnetX, Inc. Incorporated by reference to Exhibit 99.3 to SAIC, Inc.’sAnnual Report on Form 10-K as filed on April 1, 2010 with the SEC.
99.4 † Professional Services Contract effective September 7, 1999 between Science Applications InternationalCorporation and In-Q-Tel, Inc. (f/k/a In-Q-It, Inc.). Incorporated by reference to Exhibit 99.4 to SAIC, Inc.’s AnnualReport on Form 10-K as filed on April 1, 2010 with the SEC.
101 Interactive Data File.
* Executive Compensation Plans and Arrangements
† Confidential treatment has been granted with respect to certain portions of these exhibits.
SAIC, Inc. Annual Report 55

SIGNATURES
Pursuant to the requirements of Section 13 or 15(d) of the Securities Exchange Act of 1934, each registrant has duly causedthis report to be signed on its behalf by the undersigned, thereunto duly authorized.
SAIC, Inc.
By /s/ Mark W. SoppMark W. Sopp
Executive Vice President and Chief Financial Officer
Dated: March 26, 2013
Science Applications International Corporation
By /s/ Mark W. SoppMark W. Sopp
Executive Vice President and Chief Financial Officer
Dated: March 26, 2013
Pursuant to the requirements of the Securities Exchange Act of 1934, this report has been signed below by the followingpersons on behalf of each of SAIC, Inc. and Science Applications International Corporation, in the capacities and on thedates indicated.
Signature Title Date
/s/ John P. JumperJohn P. Jumper
Principal Executive Officer andChair of the Board
March 26, 2013
/s/ Mark W. SoppMark W. Sopp
Principal Financial Officer March 26, 2013
/s/ John R. HartleyJohn R. Hartley
Principal Accounting Officer March 26, 2013
/s/ France A. CórdovaFrance A. Córdova
Director March 26, 2013
/s/ Jere A. DrummondJere A. Drummond
Director March 26, 2013
/s/ Thomas F. Frist IIIThomas F. Frist, III
Director March 26, 2013
/s/ John J. HamreJohn J. Hamre
Director March 26, 2013
/s/ Miriam E. JohnMiriam E. John
Director March 26, 2013
/s/ Anita K. JonesAnita K. Jones
Director March 26, 2013
/s/ Harry M. J. Kraemer, Jr.Harry M. J. Kraemer, Jr.
Director March 26, 2013
/s/ Lawrence C. NussdorfLawrence C. Nussdorf
Director March 26, 2013
/s/ Edward J. Sanderson, Jr.Edward J. Sanderson, Jr.
Director March 26, 2013
/s/ A. Thomas YoungA. Thomas Young
Director March 26, 2013
56 SAIC, Inc. Annual Report

SAIC, INC.SCIENCE APPLICATIONS INTERNATIONAL CORPORATION
INDEX TO CONSOLIDATED FINANCIAL STATEMENTS
Page
CONSOLIDATED FINANCIAL STATEMENTS
SAIC, Inc.
Report of Independent Registered Public Accounting Firm F-2
Consolidated Statements of Income for each of the three years in the period ended January 31, 2013 F-3
Consolidated Statements of Comprehensive Income for each of the three years in the period ended January 31, 2013 F-4
Consolidated Balance Sheets as of January 31, 2013 and 2012 F-5
Consolidated Statements of Stockholders’ Equity for each of the three years in the period ended January 31, 2013 F-6
Consolidated Statements of Cash Flows for each of the three years in the period ended January 31, 2013 F-7
Science Applications International Corporation
Report of Independent Registered Public Accounting Firm F-8
Consolidated Statements of Income for each of the three years in the period ended January 31, 2013 F-9
Consolidated Statements of Comprehensive Income for each of the three years in the period ended January 31, 2013 F-10
Consolidated Balance Sheets as of January 31, 2013 and 2012 F-11
Consolidated Statements of Stockholder’s Equity for each of the three years in the period ended January 31, 2013 F-12
Consolidated Statements of Cash Flows for each of the three years in the period ended January 31, 2013 F-13
SAIC, Inc. and Science Applications International Corporation
Combined Notes to Consolidated Financial Statements F-14
Financial statement schedules are omitted because they are not applicable or the required information is presented in theconsolidated financial statements or the notes thereto.
SAIC, Inc. Annual Report F-1

SAIC, INC.REPORT OF INDEPENDENT REGISTERED PUBLIC ACCOUNTING FIRM
To the Board of Directors and Stockholders ofSAIC, Inc.McLean, Virginia
We have audited the accompanying consolidated balance sheets of SAIC, Inc. and subsidiaries (the “Company”) as ofJanuary 31, 2013 and 2012, and the related consolidated statements of income, comprehensive income, stockholders’equity, and cash flows for each of the three years in the period ended January 31, 2013. These financial statements are theresponsibility of the Company’s management. Our responsibility is to express an opinion on these financial statements basedon our audits.
We conducted our audits in accordance with the standards of the Public Company Accounting Oversight Board(United States). Those standards require that we plan and perform the audit to obtain reasonable assurance about whetherthe financial statements are free of material misstatement. An audit includes examining, on a test basis, evidence supportingthe amounts and disclosures in the financial statements. An audit also includes assessing the accounting principles used andsignificant estimates made by management, as well as evaluating the overall financial statement presentation. We believethat our audits provide a reasonable basis for our opinion.
In our opinion, such consolidated financial statements present fairly, in all material respects, the financial position of SAIC,Inc. and subsidiaries as of January 31, 2013 and 2012, and the results of their operations and their cash flows for each ofthe three years in the period ended January 31, 2013, in conformity with accounting principles generally accepted in theUnited States of America.
We have also audited, in accordance with the standards of the Public Company Accounting Oversight Board (United States),the Company’s internal control over financial reporting as of January 31, 2013, based on the criteria established in InternalControl—Integrated Framework issued by the Committee of Sponsoring Organizations of the Treadway Commission and ourreport dated March 26, 2013, expressed an unqualified opinion on the Company’s internal control over financial reporting.
/s/ DELOITTE & TOUCHE LLP
McLean, VirginiaMarch 26, 2013
F-2 SAIC, Inc. Annual Report

SAIC, INC.CONSOLIDATED STATEMENTS OF INCOME
Year Ended January 31
2013 2012 2011
(in millions, except pershare amounts)
Revenues $11,173 $10,497 $10,798Costs and expenses:
Cost of revenues 9,809 9,530 9,374Selling, general and administrative expenses 592 668 495Separation transaction expenses 38 — —
Operating income 734 299 929Non-operating income (expense):
Interest income 9 5 2Interest expense (93) (114) (79)Other income, net 8 5 2
Income from continuing operations before income taxes 658 195 854Provision for income taxes (135) (210) (307)
Income (loss) from continuing operations 523 (15) 547Discontinued operations (Note 16):
Income from discontinued operations before income taxes 17 129 107Provision for income taxes (15) (55) (35)
Income from discontinued operations 2 74 72
Net income $ 525 $ 59 $ 619
Earnings per share (Note 2):Basic:
Income (loss) from continuing operations $ 1.54 $ (.04) $ 1.46Income from discontinued operations — .22 .19
$ 1.54 $ .18 $ 1.65
Diluted:Income (loss) from continuing operations $ 1.54 $ (.04) $ 1.45Income from discontinued operations — .22 .19
$ 1.54 $ .18 $ 1.64
Cash dividend per common share $ .48 $ — $ —
See accompanying combined notes to consolidated financial statements.
SAIC, Inc. Annual Report F-3

SAIC, INC.CONSOLIDATED STATEMENTS OF COMPREHENSIVE INCOME
Year Ended January 31
2013 2012 2011
(in millions)
Net income $525 $ 59 $619Other comprehensive income (loss), net of tax:
Foreign currency translation adjustments (1) 8 —Deferred taxes 1 (4) —
Foreign currency translation adjustments, net of tax — 4 —
Reclassification of realized loss on settled derivative instruments to net income — 1 1Deferred taxes — (1) —
Reclassification of realized loss on settled derivative instruments to net income, net of tax — — 1
Pension liability adjustments 14 (13) 12Deferred taxes (5) 5 (3)
Pension liability adjustments, net of tax 9 (8) 9
Total other comprehensive income (loss), net of tax 9 (4) 10
Comprehensive income $534 $ 55 $629
See accompanying combined notes to consolidated financial statements.
F-4 SAIC, Inc. Annual Report

SAIC, INC.CONSOLIDATED BALANCE SHEETS
January 31
2013 2012
(in millions)
ASSETSCurrent assets:
Cash and cash equivalents $ 736 $1,592Receivables, net 1,889 2,164Inventory, prepaid expenses and other current assets 454 439Assets of discontinued operations — 36
Total current assets 3,079 4,231Property, plant and equipment, net 318 348Intangible assets, net 190 176Goodwill 2,195 1,800Deferred income taxes 14 37Other assets 79 75
$5,875 $6,667
LIABILITIES AND STOCKHOLDERS’ EQUITYCurrent liabilities:
Accounts payable and accrued liabilities $1,249 $1,961Accrued payroll and employee benefits 542 504Notes payable and long-term debt, current portion 2 553Liabilities of discontinued operations — 7
Total current liabilities 1,793 3,025Notes payable and long-term debt, net of current portion 1,296 1,299Other long-term liabilities 168 162Commitments and contingencies (Notes 13, 17 and 18)Stockholders’ equity:
Preferred stock, $.0001 par value, 10 million shares authorized and no shares issued and outstanding atJanuary 31, 2013 and 2012 — —
Common stock, $.0001 par value, 2 billion shares authorized, 342 million and 341 million shares issued andoutstanding at January 31, 2013 and 2012, respectively — —
Additional paid-in capital 2,110 2,028Retained earnings 510 164Accumulated other comprehensive loss (2) (11)
Total stockholders’ equity 2,618 2,181
$5,875 $6,667
See accompanying combined notes to consolidated financial statements.
SAIC, Inc. Annual Report F-5

SAIC, INC.CONSOLIDATED STATEMENTS OF STOCKHOLDERS’ EQUITY
Shares Additionalpaid-incapital
Retainedearnings
Accumulatedother
comprehensiveloss Total
Commonstock
Preferredstock
(in millions)
Balance at January 31, 2010 388 — $2,096 $ 212 $(17) $2,291Net income — — — 619 — 619Other comprehensive income, net of tax — — — — 10 10Issuances of stock 9 — 83 — — 83Repurchases of stock (35) — (202) (423) — (625)Adjustments for income tax benefits from stock-based
compensation — — 11 — — 11Stock-based compensation — — 102 — — 102
Balance at January 31, 2011 362 — 2,090 408 (7) 2,491Net income — — — 59 — 59Other comprehensive income, net of tax — — — — (4) (4)Issuances of stock 8 — 44 — — 44Repurchases of stock (29) — (175) (303) — (478)Adjustments for income tax benefits from stock-based
compensation — — (16) — — (16)Stock-based compensation — — 85 — — 85
Balance at January 31, 2012 341 — 2,028 164 (11) 2,181Net income — — — 525 — 525Other comprehensive income, net of tax — — — — 9 9Issuances of stock 2 — 24 — — 24Repurchases of stock (1) — (10) (12) — (22)Cash dividend of $0.48 per common share — — — (167) — (167)Adjustments for income tax benefits from stock-based
compensation — — (16) — — (16)Stock-based compensation — — 84 — — 84
Balance at January 31, 2013 342 — $2,110 $ 510 $ (2) $2,618
See accompanying combined notes to consolidated financial statements.
F-6 SAIC, Inc. Annual Report

SAIC, INC.CONSOLIDATED STATEMENTS OF CASH FLOWS
Year Ended January 31
2013 2012 2011
(in millions)
Cash flows from operating activities of continuing operations:Net income $ 525 $ 59 $ 619Income from discontinued operations (2) (74) (72)Adjustments to reconcile net income to net cash provided by continuing operations:
Depreciation and amortization 113 114 110Stock-based compensation 84 83 99Excess tax benefits from stock-based compensation — — (11)Impairment losses 13 19 4Net gain on sales and disposals of assets (6) (31) (5)Other items 4 (1) 1Increase (decrease) in cash and cash equivalents, net of effects of acquisitions and divestitures,
resulting from changes in:Receivables 325 (51) (18)Inventory, prepaid expenses and other current assets (64) (93) (29)Deferred income taxes 72 (9) 9Other assets (5) (22) (2)Accounts payable and accrued liabilities (744) 757 (16)Accrued payroll and employee benefits 36 1 24Income taxes payable — 5 6Other long-term liabilities (6) 5 (9)
Total cash flows provided by operating activities of continuing operations 345 762 710Cash flows from investing activities of continuing operations:
Expenditures for property, plant and equipment (48) (65) (73)Acquisitions of businesses, net of cash acquired of $9, $5 and $10 in fiscal 2013, 2012 and 2011,
respectively (483) (218) (382)Net proceeds (payments) for purchase price adjustments related to prior year acquisitions 1 (4) —Proceeds from sale of assets 3 85 10Other — (1) —
Total cash flows used in investing activities of continuing operations (527) (203) (445)Cash flows from financing activities of continuing operations:
Issuance of long-term debt, net of offering costs — — 742Payments on notes payable and long-term debt (554) (3) (3)Sales of stock and exercises of stock options 19 27 38Dividends payments (165) — —Repurchases of stock (22) (471) (601)Excess tax benefits from stock-based compensation — — 11Other — (2) —
Total cash flows (used in) provided by financing activities of continuing operations (722) (449) 187
(Decrease) increase in cash and cash equivalents from continuing operations (904) 110 452
Cash flows from discontinued operations:Cash (used in) provided by operating activities of discontinued operations (2) (52) 4Cash provided by investing activities of discontinued operations 50 166 51
Increase in cash and cash equivalents from discontinued operations 48 114 55
Effect of foreign currency exchange rate changes on cash and cash equivalents — 1 (1)
Total (decrease) increase in cash and cash equivalents (856) 225 506
Cash and cash equivalents at beginning of year 1,592 1,367 861
Cash and cash equivalents at end of year $ 736 $1,592 $1,367
See accompanying combined notes to consolidated financial statements.
SAIC, Inc. Annual Report F-7

SCIENCE APPLICATIONS INTERNATIONAL CORPORATIONREPORT OF INDEPENDENT REGISTERED PUBLIC ACCOUNTING FIRM
To the Board of Directors and Stockholder ofScience Applications International CorporationMcLean, Virginia
We have audited the accompanying consolidated balance sheets of Science Applications International Corporation andsubsidiaries (the “Company”) as of January 31, 2013 and 2012, and the related consolidated statements of income,comprehensive income, stockholder’s equity, and cash flows for each of the three years in the period ended January 31,2013. These financial statements are the responsibility of the Company’s management. Our responsibility is to express anopinion on these financial statements based on our audits.
We conducted our audits in accordance with the standards of the Public Company Accounting Oversight Board(United States). Those standards require that we plan and perform the audit to obtain reasonable assurance about whetherthe financial statements are free of material misstatement. An audit includes examining, on a test basis, evidence supportingthe amounts and disclosures in the financial statements. An audit also includes assessing the accounting principles used andsignificant estimates made by management, as well as evaluating the overall financial statement presentation. We believethat our audits provide a reasonable basis for our opinion.
In our opinion, such consolidated financial statements present fairly, in all material respects, the financial position of ScienceApplications International Corporation and subsidiaries as of January 31, 2013 and 2012, and the results of their operationsand their cash flows for each of the three years in the period ended January 31, 2013, in conformity with accountingprinciples generally accepted in the United States of America.
We have also audited, in accordance with the standards of the Public Company Accounting Oversight Board (United States),the Company’s internal control over financial reporting as of January 31, 2013, based on the criteria established in InternalControl—Integrated Framework issued by the Committee of Sponsoring Organizations of the Treadway Commission and ourreport dated March 26, 2013, expressed an unqualified opinion on the Company’s internal control over financial reporting.
/s/ DELOITTE & TOUCHE LLP
McLean, VirginiaMarch 26, 2013
F-8 SAIC, Inc. Annual Report

SCIENCE APPLICATIONS INTERNATIONAL CORPORATIONCONSOLIDATED STATEMENTS OF INCOME
Year Ended January 31
2013 2012 2011
(in millions, except pershare amounts)
Revenues $11,173 $10,497 $10,798Costs and expenses:
Cost of revenues 9,809 9,530 9,374Selling, general and administrative expenses 592 668 495Separation transaction expenses 38 — —
Operating income 734 299 929Non-operating income (expense):
Interest income 10 5 2Interest expense (93) (119) (94)Other income, net 8 5 2
Income from continuing operations before income taxes 659 190 839Provision for income taxes (135) (208) (300)
Income (loss) from continuing operations 524 (18) 539Discontinued operations (Note 16):
Income from discontinued operations before income taxes 17 129 107Provision for income taxes (15) (55) (35)
Income from discontinued operations 2 74 72
Net income $ 526 $ 56 $ 611
See accompanying combined notes to consolidated financial statements.
SAIC, Inc. Annual Report F-9

SCIENCE APPLICATIONS INTERNATIONAL CORPORATIONCONSOLIDATED STATEMENTS OF COMPREHENSIVE INCOME
Year Ended January 31
2013 2012 2011
(in millions)
Net income $526 $ 56 $611Other comprehensive income (loss), net of tax:
Foreign currency translation adjustments (1) 8 —Deferred taxes 1 (4) —
Foreign currency translation adjustments, net of tax — 4 —
Reclassification of realized loss on settled derivative instruments to net income — 1 1Deferred taxes — (1) —
Reclassification of realized loss on settled derivative instruments to net income, net of tax — — 1
Pension liability adjustments 14 (13) 12Deferred taxes (5) 5 (3)
Pension liability adjustments, net of tax 9 (8) 9
Total other comprehensive income (loss), net of tax 9 (4) 10
Comprehensive income $535 $ 52 $621
See accompanying combined notes to consolidated financial statements.
F-10 SAIC, Inc. Annual Report

SCIENCE APPLICATIONS INTERNATIONAL CORPORATIONCONSOLIDATED BALANCE SHEETS
January 31
2013 2012
(in millions)
ASSETSCurrent assets:
Cash and cash equivalents $ 736 $1,592Receivables, net 1,889 2,164Inventory, prepaid expenses and other current assets 454 439Assets of discontinued operations — 36
Total current assets 3,079 4,231Property, plant and equipment, net 318 348Intangible assets, net 190 176Goodwill 2,195 1,800Deferred income taxes 14 37Other assets 79 75
$5,875 $6,667
LIABILITIES AND STOCKHOLDER’S EQUITYCurrent liabilities:
Accounts payable and accrued liabilities $1,249 $1,961Accrued payroll and employee benefits 542 504Notes payable and long-term debt, current portion 2 553Liabilities of discontinued operations — 7
Total current liabilities 1,793 3,025Notes payable and long-term debt, net of current portion 1,296 1,299Note payable to SAIC, Inc. 22 120Other long-term liabilities 168 162Commitments and contingencies (Notes 13, 18 and 19)Stockholder’s equity:
Common stock, $.01 par value, 10,000 shares authorized, 5,000 shares issued and outstanding atJanuary 31, 2013 and 2012 — —
Additional paid-in capital 233 233Retained earnings 2,365 1,839Accumulated other comprehensive loss (2) (11)
Total stockholder’s equity 2,596 2,061
$5,875 $6,667
See accompanying combined notes to consolidated financial statements.
SAIC, Inc. Annual Report F-11
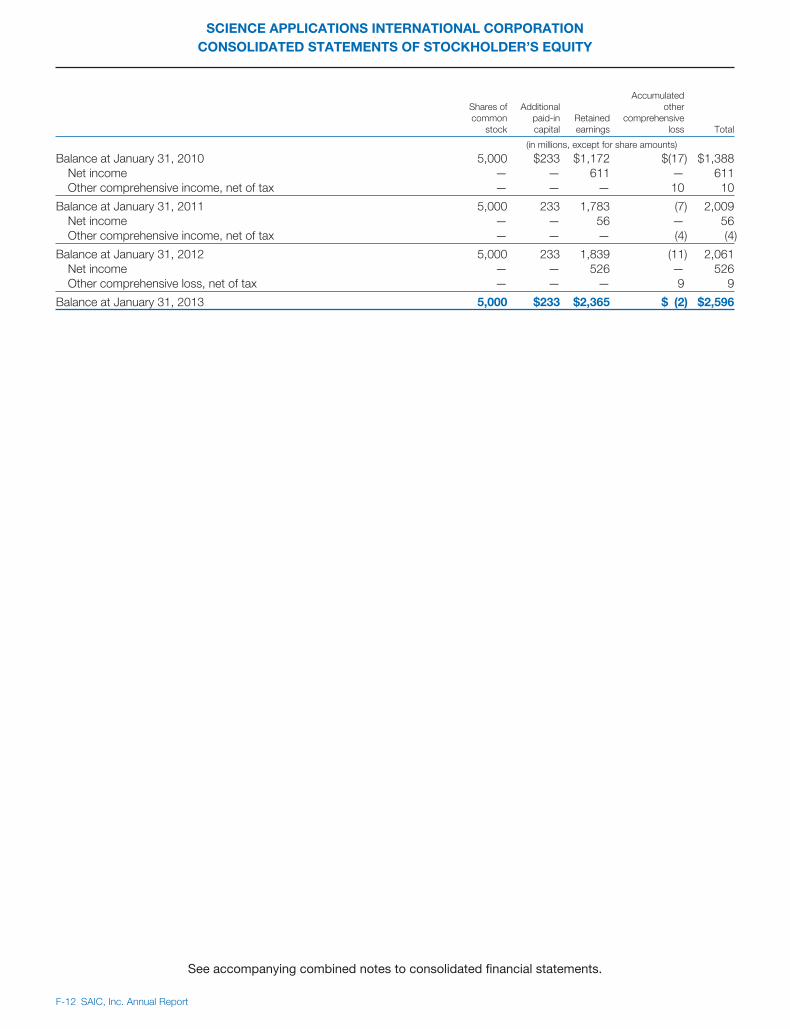
SCIENCE APPLICATIONS INTERNATIONAL CORPORATIONCONSOLIDATED STATEMENTS OF STOCKHOLDER’S EQUITY
Shares ofcommon
stock
Additionalpaid-incapital
Retainedearnings
Accumulatedother
comprehensiveloss Total
(in millions, except for share amounts)
Balance at January 31, 2010 5,000 $233 $1,172 $(17) $1,388Net income — — 611 — 611Other comprehensive income, net of tax — — — 10 10
Balance at January 31, 2011 5,000 233 1,783 (7) 2,009Net income — — 56 — 56Other comprehensive income, net of tax — — — (4) (4)
Balance at January 31, 2012 5,000 233 1,839 (11) 2,061Net income — — 526 — 526Other comprehensive loss, net of tax — — — 9 9
Balance at January 31, 2013 5,000 $233 $2,365 $ (2) $2,596
See accompanying combined notes to consolidated financial statements.
F-12 SAIC, Inc. Annual Report

SCIENCE APPLICATIONS INTERNATIONAL CORPORATIONCONSOLIDATED STATEMENTS OF CASH FLOWS
Year Ended January 31
2013 2012 2011
(in millions)
Cash flows from operating activities of continuing operations:Net income $ 526 $ 56 $ 611Income from discontinued operations (2) (74) (72)Adjustments to reconcile net income to net cash provided by continuing operations:
Depreciation and amortization 113 114 110Stock-based compensation 84 83 99Impairment losses 13 19 4Net gain on sales and disposals of assets (6) (31) (5)Other items 3 (1) 1Increase (decrease) in cash and cash equivalents, net of effects of acquisitions and divestitures,
resulting from changes in:Receivables 325 (51) (18)Inventory, prepaid expenses and other current assets (64) (93) (29)Deferred income taxes 72 (9) 9Other assets (5) (22) (2)Accounts payable and accrued liabilities (744) 757 (16)Accrued payroll and employee benefits 36 1 24Income taxes payable — 5 6Other long-term liabilities (6) 5 (9)
Total cash flows provided by operating activities of continuing operations 345 759 713Cash flows from investing activities of continuing operations:
Expenditures for property, plant and equipment (48) (65) (73)Acquisitions of businesses, net of cash acquired of $9, $5 and $10 in fiscal 2013, 2012 and 2011,
respectively (483) (218) (382)Net proceeds (payments) for purchase price adjustments related to prior year acquisitions 1 (4) —Proceeds from sale of assets 3 85 10Other — (1) —
Total cash flows used in investing activities of continuing operations (527) (203) (445)Cash flows from financing activities of continuing operations:
Issuance of long-term debt, net of offering costs — — 742Proceeds from note with SAIC, Inc. 244 638 1,298Payments on note with SAIC, Inc. (411) (1,079) (1,853)Payments on notes payable and long-term debt (554) (3) (3)Dividend payments (1) — —Other — (2) —
Total cash flows (used in) provided by financing activities of continuing operations (722) (446) 184
(Decrease) increase in cash and cash equivalents from continuing operations (904) 110 452
Cash flows from discontinued operations:Cash used in operating activities of discontinued operations (2) (52) 4Cash provided by investing activities of discontinued operations 50 166 51
Increase in cash and cash equivalents from discontinued operations 48 114 55
Effect of foreign currency exchange rate changes on cash and cash equivalents — 1 (1)
Total (decrease) increase in cash and cash equivalents (856) 225 506
Cash and cash equivalents at beginning of year 1,592 1,367 861
Cash and cash equivalents at end of year $ 736 $ 1,592 $ 1,367
See accompanying combined notes to consolidated financial statements.
SAIC, Inc. Annual Report F-13
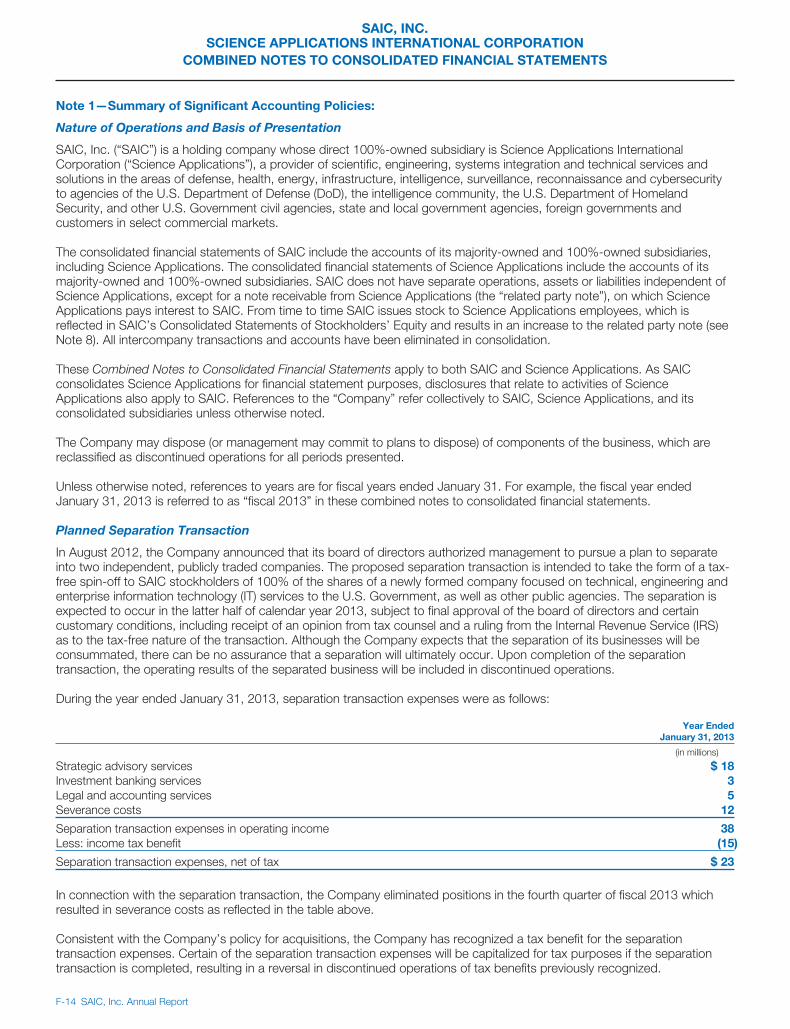
SAIC, INC.SCIENCE APPLICATIONS INTERNATIONAL CORPORATION
COMBINED NOTES TO CONSOLIDATED FINANCIAL STATEMENTS
Note 1—Summary of Significant Accounting Policies:
Nature of Operations and Basis of Presentation
SAIC, Inc. (“SAIC”) is a holding company whose direct 100%-owned subsidiary is Science Applications InternationalCorporation (“Science Applications”), a provider of scientific, engineering, systems integration and technical services andsolutions in the areas of defense, health, energy, infrastructure, intelligence, surveillance, reconnaissance and cybersecurityto agencies of the U.S. Department of Defense (DoD), the intelligence community, the U.S. Department of HomelandSecurity, and other U.S. Government civil agencies, state and local government agencies, foreign governments andcustomers in select commercial markets.
The consolidated financial statements of SAIC include the accounts of its majority-owned and 100%-owned subsidiaries,including Science Applications. The consolidated financial statements of Science Applications include the accounts of itsmajority-owned and 100%-owned subsidiaries. SAIC does not have separate operations, assets or liabilities independent ofScience Applications, except for a note receivable from Science Applications (the “related party note”), on which ScienceApplications pays interest to SAIC. From time to time SAIC issues stock to Science Applications employees, which isreflected in SAIC’s Consolidated Statements of Stockholders’ Equity and results in an increase to the related party note (seeNote 8). All intercompany transactions and accounts have been eliminated in consolidation.
These Combined Notes to Consolidated Financial Statements apply to both SAIC and Science Applications. As SAICconsolidates Science Applications for financial statement purposes, disclosures that relate to activities of ScienceApplications also apply to SAIC. References to the “Company” refer collectively to SAIC, Science Applications, and itsconsolidated subsidiaries unless otherwise noted.
The Company may dispose (or management may commit to plans to dispose) of components of the business, which arereclassified as discontinued operations for all periods presented.
Unless otherwise noted, references to years are for fiscal years ended January 31. For example, the fiscal year endedJanuary 31, 2013 is referred to as “fiscal 2013” in these combined notes to consolidated financial statements.
Planned Separation Transaction
In August 2012, the Company announced that its board of directors authorized management to pursue a plan to separateinto two independent, publicly traded companies. The proposed separation transaction is intended to take the form of a tax-free spin-off to SAIC stockholders of 100% of the shares of a newly formed company focused on technical, engineering andenterprise information technology (IT) services to the U.S. Government, as well as other public agencies. The separation isexpected to occur in the latter half of calendar year 2013, subject to final approval of the board of directors and certaincustomary conditions, including receipt of an opinion from tax counsel and a ruling from the Internal Revenue Service (IRS)as to the tax-free nature of the transaction. Although the Company expects that the separation of its businesses will beconsummated, there can be no assurance that a separation will ultimately occur. Upon completion of the separationtransaction, the operating results of the separated business will be included in discontinued operations.
During the year ended January 31, 2013, separation transaction expenses were as follows:
Year EndedJanuary 31, 2013
(in millions)
Strategic advisory services $ 18Investment banking services 3Legal and accounting services 5Severance costs 12
Separation transaction expenses in operating income 38Less: income tax benefit (15)
Separation transaction expenses, net of tax $ 23
In connection with the separation transaction, the Company eliminated positions in the fourth quarter of fiscal 2013 whichresulted in severance costs as reflected in the table above.
Consistent with the Company’s policy for acquisitions, the Company has recognized a tax benefit for the separationtransaction expenses. Certain of the separation transaction expenses will be capitalized for tax purposes if the separationtransaction is completed, resulting in a reversal in discontinued operations of tax benefits previously recognized.
F-14 SAIC, Inc. Annual Report

SAIC, INC.SCIENCE APPLICATIONS INTERNATIONAL CORPORATION
COMBINED NOTES TO CONSOLIDATED FINANCIAL STATEMENTS
Operating Cycle
The Company’s operating cycle for long-term contracts may be greater than one year and is measured by the average timeintervening between the inception and the completion of those contracts. Contract-related assets and liabilities are classifiedas current assets and current liabilities.
Use of Estimates
The preparation of financial statements in conformity with accounting principles generally accepted in the United States ofAmerica (GAAP) requires management to make estimates and assumptions that affect the reported amounts of assets andliabilities and the disclosure of contingencies at the date of the financial statements, as well as the reported amounts ofrevenues and expenses during the reporting periods. Management evaluates these estimates and assumptions on an ongoingbasis, including those relating to allowances for doubtful accounts, inventories, fair value and impairment of intangible assetsand goodwill, income taxes, estimated profitability of long-term contracts, pension benefits, stock-based compensationexpense, contingencies and litigation. Estimates and assumptions have been prepared by management on the basis of themost current and best available information at the time of estimation and actual results could differ from those estimates.
Revenue Recognition
The Company’s revenues are generated primarily from contracts with the U.S. Government, commercial customers, andvarious international, state and local governments or from subcontracts with other contractors engaged in work with suchcustomers. The Company performs under various types of contracts, which include firm-fixed-price, time-and-materials,fixed-price-level-of-effort, cost-plus-fixed-fee, cost-plus-award-fee and cost-plus-incentive-fee contracts.
Firm-fixed-price contracts—Revenues and fees on these contracts that are system integration or engineering in nature areprimarily recognized using the percentage-of-completion method of accounting utilizing the cost-to-cost method.
Time-and-materials contracts—Revenue is recognized on time-and-materials contracts with the U.S. Government using thepercentage-of-completion method of accounting utilizing an output measure of progress. Revenue is recognized on time-and-materials contracts with non-U.S. Government customers using a proportional performance method. Under both ofthese methods, revenue is recognized based on the hours provided in performance under the contract multiplied by thenegotiated contract billing rates, plus the negotiated contract billing rate of any allowable material and subcontract costs andout-of-pocket expenses.
Fixed-price-level-of-effort contracts (FP-LOE)—These contracts are substantially similar to time-and-materials contractsexcept they require a specified level of effort over a stated period of time. Accordingly, the Company recognizes revenue onFP-LOE contracts with the U.S. Government in a manner similar to time-and-materials contracts in which the Companymeasures progress toward completion based on the hours provided in performance under the contract multiplied by thenegotiated contract billing rates, plus the negotiated contract billing rate of any allowable material costs and out-of-pocketexpenses.
Cost-plus-fixed-fee contracts—Revenue is recognized on cost-plus-fixed-fee contracts with the U.S. Government on thebasis of partial performance equal to costs incurred, plus an estimate of applicable fees earned as the Company becomescontractually entitled to reimbursement of costs and the applicable fees.
Cost-plus-award-fee/cost-plus-incentive fee contracts—Revenues and fees on these contracts with the U.S. Governmentare primarily recognized using the percentage-of-completion method of accounting, most often based on the cost-to-costmethod. The Company includes an estimate of the ultimate incentive or award fee to be received on the contract in theestimate of contract revenues for purposes of applying the percentage-of-completion method of accounting.
Revenues from services and maintenance contracts, notwithstanding contract type, are recognized over the term of therespective contracts as the services are performed and revenue is earned. Revenues from unit-priced contracts arerecognized as transactions are processed based on objective measures of output. Revenues from the sale of manufacturedproducts are recorded upon passage of title and risk of loss to the customer, which is generally upon delivery, provided thatall other requirements for revenue recognition have been met.
The Company also uses the efforts-expended method of percentage-of-completion using measures such as labor dollars formeasuring progress toward completion in situations in which this approach is more representative of the progress on thecontract. For example, the efforts-expended method is utilized when there are significant amounts of materials or hardwareprocured for the contract that is not representative of progress on the contract. Additionally, the Company utilizes the units-of-delivery method under percentage-of-completion on contracts where separate units of output are produced. Under the
SAIC, Inc. Annual Report F-15
SAIC, INC.SCIENCE APPLICATIONS INTERNATIONAL CORPORATION
COMBINED NOTES TO CONSOLIDATED FINANCIAL STATEMENTS
units-of-delivery method, revenue is generally recognized when the units are delivered to the customer, provided that allother requirements for revenue recognition have been met.
The Company evaluates its contracts for multiple elements, and when appropriate, separates the contracts into separateunits of accounting for revenue recognition.
The Company provides for anticipated losses on contracts by recording an expense during the period in which the lossesare determined. Amounts billed and collected but not yet recognized as revenues under certain types of contracts aredeferred. Contract costs incurred for U.S. Government contracts, including indirect costs, are subject to audit andadjustment through negotiations between the Company and government representatives. The Company has agreed uponand settled indirect contract costs through fiscal 2005. Revenues on U.S. Government contracts have been recorded inamounts that are expected to be realized upon final settlement.
Contract claims are unanticipated additional costs incurred but not provided for in the executed contract price that theCompany seeks to recover from the customer. Such costs are expensed as incurred. Additional revenue related to contractclaims is recognized when the amounts are awarded by the customer.
In certain situations, primarily where the Company is not the primary obligor on certain elements of a contract such as theprovision of administrative oversight and/or management of government-owned facilities or logistical support services relatedto other vendors’ products, the Company recognizes as revenue the net management fee associated with the services andexcludes from its income statement the gross sales and costs associated with the facility or other vendors’ products.
Changes in Estimates on Contracts
Changes in estimates related to certain types of contracts accounted for using the percentage of completion method ofaccounting are recognized in the period in which such changes are made for the inception-to-date effect of the changes.Changes in these estimates can routinely occur over the contract performance period for a variety of reasons, includingchanges in contract scope, changes in contract cost estimates due to unanticipated cost growth or retirements of risk foramounts different than estimated, and changes in estimated incentive or award fees. Aggregate changes in contractestimates increased operating income by $18 million ($0.03 per diluted share), $37 million ($0.07 per diluted share) and$44 million ($0.08 per diluted share) for fiscal 2013, fiscal 2012 and fiscal 2011, respectively.
Receivables
The Company’s accounts receivable include unbilled receivables, which consist of costs and fees billable upon contractcompletion or the occurrence of a specified event, substantially all of which is expected to be billed and collected within one year.Unbilled receivables are stated at estimated realizable value. Since the Company’s receivables are primarily with the U.S.Government, the Company does not have a material credit risk exposure. Contract retentions are billed when the Company hasnegotiated final indirect rates with the U.S. Government and, once billed, are subject to audit and approval by governmentrepresentatives. Consequently, the timing of collection of retention balances is outside the Company’s control. Based on theCompany’s historical experience, the majority of retention balances are expected to be collected beyond one year and write-offsof retention balances have not been significant.
The Company has extended deferred payment terms with original contractual maturities that may exceed one year to commercialcustomers related to certain construction projects. As of January 31, 2013, the Company had outstanding receivables from thesecustomers with deferred payment terms of $104 million, which are expected to be collected in fiscal 2014 when the customershave obtained financing. When events or conditions indicate that amounts outstanding from customers may becomeuncollectible, an allowance is estimated and recorded.
Discontinued Operations
From time-to-time, the Company may dispose (or management may commit to plans to dispose) of non-strategiccomponents of the business, which are reclassified as discontinued operations for all periods presented.
Pre-contract Costs
Costs incurred on projects as pre-contract costs are deferred as assets (inventory, prepaid expenses and other currentassets) when the Company has been requested by the customer to begin work under a new arrangement prior to contractexecution and it is probable that the Company will recover the costs through the issuance of a contract. When the formalcontract has been executed, the costs are recorded to the contract and revenue is recognized.
Financial Instruments
The Company is exposed to certain market risks which are inherent in certain transactions entered into during the normalcourse of business. These transactions include sales contracts denominated in foreign currencies, investments in equity
F-16 SAIC, Inc. Annual Report
SAIC, INC.SCIENCE APPLICATIONS INTERNATIONAL CORPORATION
COMBINED NOTES TO CONSOLIDATED FINANCIAL STATEMENTS
securities and exposure to changing interest rates. The Company uses a risk management policy to assess and managecash flow and fair value exposures. The policy permits the use of derivative instruments with certain restrictions. TheCompany does not hold derivative instruments for trading or speculative purposes.
Fair Value of Financial Instruments
The accounting standard for fair value measurements establishes a three-tier value hierarchy, which prioritizes the inputsused in measuring fair value as follows: observable inputs such as quoted prices in active markets (Level 1); inputs other thanthe quoted prices in active markets that are observable either directly or indirectly (Level 2); and unobservable inputs in whichthere is little or no market data, which requires the Company to develop its own assumptions (Level 3). The Company utilizesLevel 2 and Level 3 inputs in testing assets for recoverability upon events or changes in circumstances that indicate thecarrying value of those assets may not be recoverable.
The fair value of financial instruments is determined based on quoted market prices, if available, or management’s bestestimate. It is management’s belief that the carrying amounts of the Company’s financial instruments, which include cashequivalents and long-term investments in private equity securities, are reasonable estimates of their related fair values. Cashequivalents are recorded at historical cost which equals fair value based on quoted market prices (Level 1 input).Management evaluates its investments for other-than-temporary impairment at each balance sheet date. When testing long-term investments for recovery of carrying value, the fair value of long-term investments in private equity securities isdetermined using various valuation techniques and factors, such as market prices of comparable companies (Level 2 input),discounted cash flow models (Level 3 input) and recent capital transactions of the portfolio companies being valued (Level 3input). If management determines that an other-than-temporary decline in the fair value of an investment has occurred, animpairment loss is recognized to reduce the investment to its estimated fair value (Level 2 input). The fair value of long-termdebt (see Note 7) is determined based on current interest rates available for debt with terms and maturities similar to theCompany’s existing debt arrangements (Level 2 and 3 inputs).
Cash and Cash Equivalents
The Company’s cash equivalents were primarily comprised of investments in several large institutional money market fundsthat invest primarily in bills, notes and bonds issued by the U.S. Treasury, U.S. Government guaranteed repurchaseagreements fully collateralized by U.S. Treasury obligations, U.S. Government guaranteed securities and investment-gradecorporate securities that have original maturities of three months or less. There are no restrictions on the withdrawal of theCompany’s cash and cash equivalents.
Restricted Cash
The Company has restricted cash balances, primarily representing advances from a customer, that are restricted as to usefor certain expenditures related to that customer’s contract.
Concentration of Credit Risk
Financial instruments that potentially subject the Company to concentrations of credit risk primarily consist of cashequivalents and accounts receivable. At January 31, 2013, the Company’s cash and cash equivalents bear both fixed andvariable interest rates. Although credit risk is limited, the Company’s receivables are concentrated with its principalcustomers, which are the various agencies of the U.S. Government and customers engaged in work for the U.S.Government.
Investments
Investments in entities and corporate joint ventures where the Company has a noncontrolling ownership interest representingless than 50% and over which the Company has the ability to exercise significant influence, are accounted for under theequity method of accounting whereby the Company recognizes its proportionate share of the entities’ net income or loss anddoes not consolidate the entities’ assets and liabilities. Equity investments in entities over which the Company does not havethe ability to exercise significant influence and whose securities do not have a readily determinable fair value are carried atcost or cost net of other-than-temporary impairments.
Variable Interest Entities
The Company occasionally forms joint ventures and/or enters into arrangements with special purpose limited liabilitycompanies for the purpose of bidding and executing on specific projects. The Company analyzes each such arrangement todetermine whether it represents a variable interest entity (VIE). If the arrangement is determined to be a VIE, the Companyassesses whether it is the primary beneficiary of the VIE and is consequently required to consolidate the VIE.
SAIC, Inc. Annual Report F-17
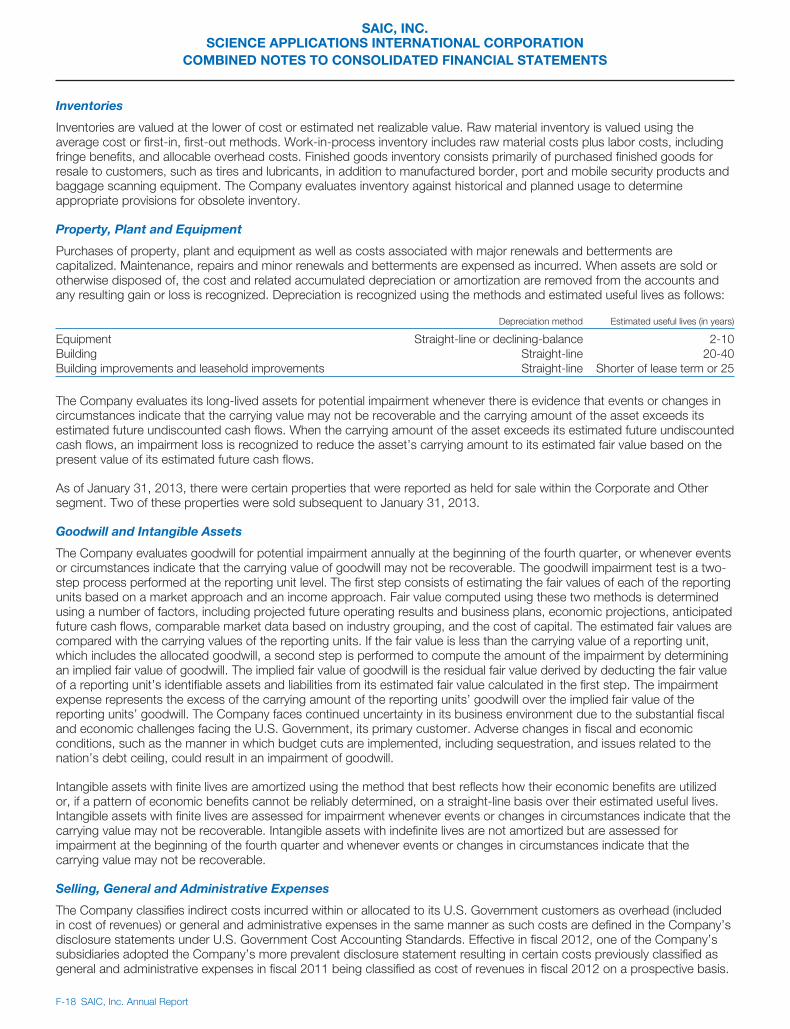
SAIC, INC.SCIENCE APPLICATIONS INTERNATIONAL CORPORATION
COMBINED NOTES TO CONSOLIDATED FINANCIAL STATEMENTS
Inventories
Inventories are valued at the lower of cost or estimated net realizable value. Raw material inventory is valued using theaverage cost or first-in, first-out methods. Work-in-process inventory includes raw material costs plus labor costs, includingfringe benefits, and allocable overhead costs. Finished goods inventory consists primarily of purchased finished goods forresale to customers, such as tires and lubricants, in addition to manufactured border, port and mobile security products andbaggage scanning equipment. The Company evaluates inventory against historical and planned usage to determineappropriate provisions for obsolete inventory.
Property, Plant and Equipment
Purchases of property, plant and equipment as well as costs associated with major renewals and betterments arecapitalized. Maintenance, repairs and minor renewals and betterments are expensed as incurred. When assets are sold orotherwise disposed of, the cost and related accumulated depreciation or amortization are removed from the accounts andany resulting gain or loss is recognized. Depreciation is recognized using the methods and estimated useful lives as follows:
Depreciation method Estimated useful lives (in years)
Equipment Straight-line or declining-balance 2-10Building Straight-line 20-40Building improvements and leasehold improvements Straight-line Shorter of lease term or 25
The Company evaluates its long-lived assets for potential impairment whenever there is evidence that events or changes incircumstances indicate that the carrying value may not be recoverable and the carrying amount of the asset exceeds itsestimated future undiscounted cash flows. When the carrying amount of the asset exceeds its estimated future undiscountedcash flows, an impairment loss is recognized to reduce the asset’s carrying amount to its estimated fair value based on thepresent value of its estimated future cash flows.
As of January 31, 2013, there were certain properties that were reported as held for sale within the Corporate and Othersegment. Two of these properties were sold subsequent to January 31, 2013.
Goodwill and Intangible Assets
The Company evaluates goodwill for potential impairment annually at the beginning of the fourth quarter, or whenever eventsor circumstances indicate that the carrying value of goodwill may not be recoverable. The goodwill impairment test is a two-step process performed at the reporting unit level. The first step consists of estimating the fair values of each of the reportingunits based on a market approach and an income approach. Fair value computed using these two methods is determinedusing a number of factors, including projected future operating results and business plans, economic projections, anticipatedfuture cash flows, comparable market data based on industry grouping, and the cost of capital. The estimated fair values arecompared with the carrying values of the reporting units. If the fair value is less than the carrying value of a reporting unit,which includes the allocated goodwill, a second step is performed to compute the amount of the impairment by determiningan implied fair value of goodwill. The implied fair value of goodwill is the residual fair value derived by deducting the fair valueof a reporting unit’s identifiable assets and liabilities from its estimated fair value calculated in the first step. The impairmentexpense represents the excess of the carrying amount of the reporting units’ goodwill over the implied fair value of thereporting units’ goodwill. The Company faces continued uncertainty in its business environment due to the substantial fiscaland economic challenges facing the U.S. Government, its primary customer. Adverse changes in fiscal and economicconditions, such as the manner in which budget cuts are implemented, including sequestration, and issues related to thenation’s debt ceiling, could result in an impairment of goodwill.
Intangible assets with finite lives are amortized using the method that best reflects how their economic benefits are utilizedor, if a pattern of economic benefits cannot be reliably determined, on a straight-line basis over their estimated useful lives.Intangible assets with finite lives are assessed for impairment whenever events or changes in circumstances indicate that thecarrying value may not be recoverable. Intangible assets with indefinite lives are not amortized but are assessed forimpairment at the beginning of the fourth quarter and whenever events or changes in circumstances indicate that thecarrying value may not be recoverable.
Selling, General and Administrative Expenses
The Company classifies indirect costs incurred within or allocated to its U.S. Government customers as overhead (includedin cost of revenues) or general and administrative expenses in the same manner as such costs are defined in the Company’sdisclosure statements under U.S. Government Cost Accounting Standards. Effective in fiscal 2012, one of the Company’ssubsidiaries adopted the Company’s more prevalent disclosure statement resulting in certain costs previously classified asgeneral and administrative expenses in fiscal 2011 being classified as cost of revenues in fiscal 2012 on a prospective basis.
F-18 SAIC, Inc. Annual Report

SAIC, INC.SCIENCE APPLICATIONS INTERNATIONAL CORPORATION
COMBINED NOTES TO CONSOLIDATED FINANCIAL STATEMENTS
This change caused a net increase in reported cost of revenues and a net decrease in reported selling, general andadministrative expenses for fiscal 2013 and 2012 as compared to fiscal 2011 and prior years; however, total operating costswere not affected by this change. Selling, general and administrative expenses include general and administrative, bid andproposal and internal research and development expenses.
Income Taxes
The Company accounts for income taxes under the asset and liability method in accordance with the accounting standardfor income taxes. The asset and liability method requires the recognition of deferred tax assets and liabilities for the expectedfuture tax consequences of temporary differences between the carrying amounts and tax bases of assets and liabilities.Under this method, changes in tax rates and laws are recognized in income in the period such changes are enacted.
The Company records net deferred tax assets to the extent that it believes these assets will more likely than not be realized.In making such determination, the Company considers all available positive and negative evidence, including future reversalsof existing taxable temporary differences, projected future taxable income, tax planning strategies and recent results ofoperations. If the Company were to determine that it would be able to realize its deferred income tax assets in the future inexcess of their net recorded amount or would no longer be able to realize its deferred income tax assets in the future ascurrently recorded, the Company would make an adjustment to the valuation allowance which would decrease or increasethe provision for income taxes.
The provision for federal, state, foreign and local income taxes is calculated on income before income taxes based oncurrent tax law and includes the cumulative effect of any changes in tax rates from those used previously in determiningdeferred tax assets and liabilities. Such provision differs from the amounts currently payable because certain items of incomeand expense are recognized in different reporting periods for financial reporting purposes than for income tax purposes.
The Company recognizes liabilities for uncertain tax positions when it is more likely than not that a tax position will not besustained upon examination and settlement with various taxing authorities. Liabilities for uncertain tax positions are measuredbased upon the largest amount of benefit that is greater than 50% likely of being realized upon ultimate settlement. TheCompany recognizes interest and penalties related to uncertain tax positions in its income tax expense.
Stock-Based Compensation
The Company recognizes the fair value of all stock-based awards, including stock options, granted to employees anddirectors in exchange for services as compensation expense over the requisite service period, which is typically the vestingperiod, net of an estimated forfeiture rate.
Foreign Currency
The financial statements of consolidated international subsidiaries, for which the functional currency is not the U.S. dollar, aretranslated into U.S. dollars using the exchange rate at each balance sheet date for assets and liabilities and a weightedaverage exchange rate over the reporting period for revenues, expenses, gains and losses. Translation adjustments arerecorded as accumulated other comprehensive income (loss) in stockholders’ equity. Transaction gains and losses arerecognized in the statement of income.
Accounting Standards Updates Adopted
During the fiscal years presented, the Company adopted various accounting standards issued by the Financial AccountingStandards Board (FASB), none of which had a material effect on the Company’s consolidated financial position and resultsof operations.
Accounting Standards Updates Issued But Not Yet Adopted
In February 2013, the FASB issued an update to Comprehensive Income. This update requires the presentation anddisclosure of reclassification adjustments out of accumulated other comprehensive income in a single note or on the face ofthe financial statements. This update is effective for the Company beginning February 1, 2013, and will be appliedprospectively.
Other accounting standards and updates issued but not effective for the Company until after January 31, 2013, are notexpected to have a material effect on the Company’s consolidated financial position or results of operations.
Note 2—Earnings Per Share (EPS):
The Company is required to allocate a portion of its earnings to its unvested stock awards containing nonforfeitable rights todividends or dividend equivalents (participating securities) in calculating EPS using the two-class method.
SAIC, Inc. Annual Report F-19

SAIC, INC.SCIENCE APPLICATIONS INTERNATIONAL CORPORATION
COMBINED NOTES TO CONSOLIDATED FINANCIAL STATEMENTS
Unvested stock awards granted prior to fiscal 2013 are participating securities requiring application of the two-class method.In fiscal 2013, the Company began issuing unvested stock awards that have forfeitable rights to dividends or dividendequivalents. These stock awards are not participating securities requiring application of the two-class method but are dilutivecommon share equivalents subject to the treasury stock method. Basic EPS is computed by dividing income less earningsallocable to participating securities by the basic weighted average number of shares outstanding. Diluted EPS is computedsimilar to basic EPS, except the weighted average number of shares outstanding is increased to include the dilutive effect ofoutstanding stock options and other stock-based awards.
A reconciliation of the income used to compute basic and diluted EPS for the years presented was as follows:
Year Ended January 31
2013 2012 2011
(in millions)
Basic EPS:Income (loss) from continuing operations, as reported $523 $(15) $547
Less: allocation of distributed and undistributed earnings to participating securities (11) — (17)
Income (loss) from continuing operations, for computing basic EPS $512 $(15) $530
Net income, as reported $525 $ 59 $619Less: allocation of distributed and undistributed earnings to participating securities (11) — (20)
Net income, for computing basic EPS $514 $ 59 $599
Diluted EPS:Income (loss) from continuing operations, as reported $523 $(15) $547
Less: allocation of distributed and undistributed earnings to participating securities (11) — (17)
Income (loss) from continuing operations, for computing diluted EPS $512 $(15) $530
Net income, as reported $525 $ 59 $619Less: allocation of distributed and undistributed earnings to participating securities (11) — (20)
Net income, for computing diluted EPS $514 $ 59 $599
A reconciliation of the weighted average number of shares outstanding used to compute basic and diluted EPS for the yearspresented was as follows:
Year Ended January 31
2013 2012 2011
(in millions)
Basic weighted average number of shares outstanding 333 336 364Dilutive common share equivalents—stock options and other stock awards — — 2
Diluted weighted average number of shares outstanding 333 336 366
Basic and diluted EPS for the years presented was as follows:
Year Ended January 31
2013 2012 2011
Basic:Income (loss) from continuing operations $1.54 $(.04) $1.46Income from discontinued operations — .22 .19
$1.54 $ .18 $1.65
Diluted:Income (loss) from continuing operations $1.54 $(.04) $1.45Income from discontinued operations — .22 .19
$1.54 $ .18 $1.64
F-20 SAIC, Inc. Annual Report
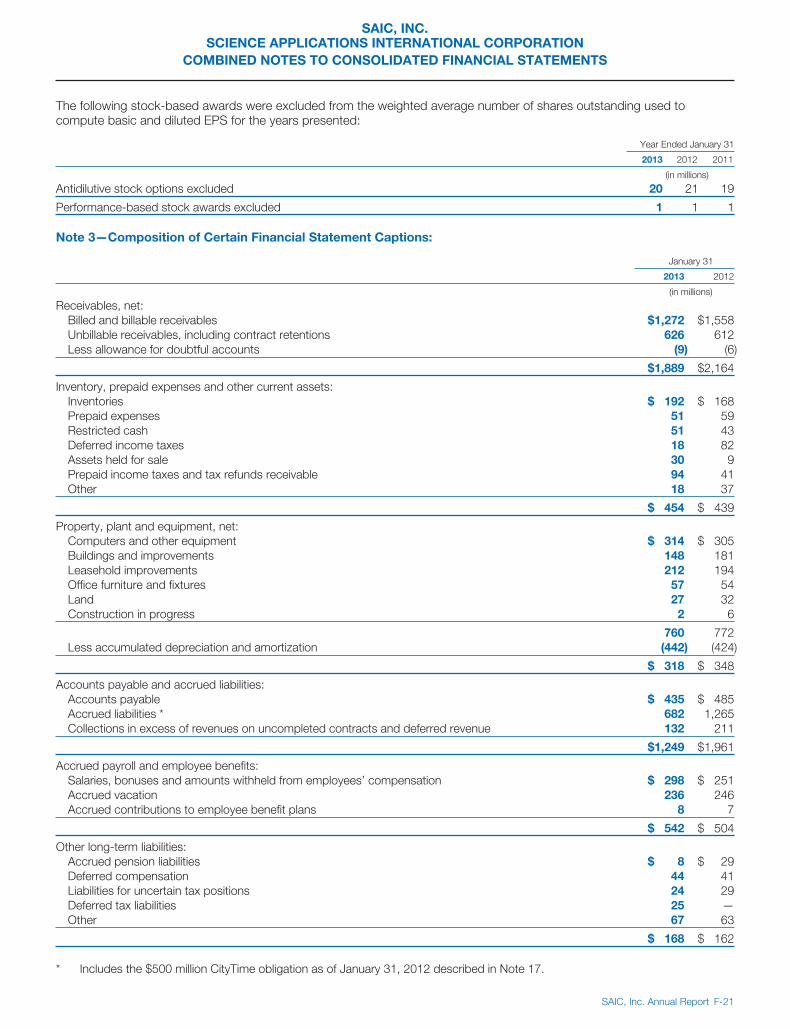
SAIC, INC.SCIENCE APPLICATIONS INTERNATIONAL CORPORATION
COMBINED NOTES TO CONSOLIDATED FINANCIAL STATEMENTS
The following stock-based awards were excluded from the weighted average number of shares outstanding used tocompute basic and diluted EPS for the years presented:
Year Ended January 31
2013 2012 2011
(in millions)
Antidilutive stock options excluded 20 21 19
Performance-based stock awards excluded 1 1 1
Note 3—Composition of Certain Financial Statement Captions:
January 31
2013 2012
(in millions)
Receivables, net:Billed and billable receivables $1,272 $1,558Unbillable receivables, including contract retentions 626 612Less allowance for doubtful accounts (9) (6)
$1,889 $2,164
Inventory, prepaid expenses and other current assets:Inventories $ 192 $ 168Prepaid expenses 51 59Restricted cash 51 43Deferred income taxes 18 82Assets held for sale 30 9Prepaid income taxes and tax refunds receivable 94 41Other 18 37
$ 454 $ 439
Property, plant and equipment, net:Computers and other equipment $ 314 $ 305Buildings and improvements 148 181Leasehold improvements 212 194Office furniture and fixtures 57 54Land 27 32Construction in progress 2 6
760 772Less accumulated depreciation and amortization (442) (424)
$ 318 $ 348
Accounts payable and accrued liabilities:Accounts payable $ 435 $ 485Accrued liabilities * 682 1,265Collections in excess of revenues on uncompleted contracts and deferred revenue 132 211
$1,249 $1,961
Accrued payroll and employee benefits:Salaries, bonuses and amounts withheld from employees’ compensation $ 298 $ 251Accrued vacation 236 246Accrued contributions to employee benefit plans 8 7
$ 542 $ 504
Other long-term liabilities:Accrued pension liabilities $ 8 $ 29Deferred compensation 44 41Liabilities for uncertain tax positions 24 29Deferred tax liabilities 25 —Other 67 63
$ 168 $ 162
* Includes the $500 million CityTime obligation as of January 31, 2012 described in Note 17.
SAIC, Inc. Annual Report F-21

SAIC, INC.SCIENCE APPLICATIONS INTERNATIONAL CORPORATION
COMBINED NOTES TO CONSOLIDATED FINANCIAL STATEMENTS
Note 4—Acquisitions:
The Company acquires businesses as part of its growth strategy to provide new or enhance existing capabilities andofferings to customers. The Company completed acquisitions during each of the years presented, which individually and inthe aggregate were not considered significant business combinations in the year acquired.
Acquisition information for the years presented was as follows:
Year Ended January 31
2013 2012 2011
($ in millions)
Number of acquisitions 1 2 3Cash consideration (paid and accrued) $505 $223 $389
Purchase price (preliminary or final) allocations for the years presented were as follows ($ in millions):
2013 2012 2011
Purchase price allocations:Goodwill:
Tax deductible goodwill $ — $ 30 $ 16Non-tax deductible goodwill 395 135 223
Identifiable intangible assets:Customer relationships (finite-lived) $ 62 $ 28 $ 9Software and technology (finite-lived) — — 110Other (finite-lived) 10 1 —In-process research and development (indefinite-lived) — — 27
Weighted average lives of finite-lived intangibles:Customer relationships 5 years 5 years 2 yearsSoftware and technology — — 8 yearsOther 1 year 3 years —All finite-lived intangible assets 4 years 5 years 7 years
In August 2012, the Company acquired 100% of the stock of maxIT Healthcare Holdings, Inc. (maxIT), a provider of clinical,business and information technology services primarily to commercial hospital groups and other medical deliveryorganizations. This acquisition expands the Company’s commercial consulting practice in electronic health record (EHR)implementation and optimization and strengthens the Company’s capabilities to provide these services to its federalhealthcare customers as those customers migrate to commercial off-the-shelf EHR applications. This acquisition was in theHealth, Energy and Civil Solutions segment.
The preliminary estimated fair values of the maxIT assets acquired and liabilities assumed at the date of acquisition were asfollows (in millions):
Cash $ 9Receivables 50Other assets 24Accounts payable, accrued liabilities and accrued payroll and employee benefits (21)Deferred tax liabilities, net (24)
Total identifiable net assets acquired 38Goodwill 395Intangible assets 72
Total preliminary purchase price (including accrued acquisition payments of $13 million) $505
The estimated fair values of the maxIT assets acquired and liabilities assumed are preliminary for income tax related mattersand certain liabilities assumed. From the date of acquisition of maxIT through January 31, 2013, the Company recognizedrevenues of $133 million and operating income of $4 million related to this acquisition.
The Company’s acquisitions in fiscal 2012 included Vitalize Consulting Solutions, Inc. and Patrick Energy Services, Inc. in theHealth, Energy and Civil Solutions segment. Vitalize Consulting Solutions, Inc. is a provider of clinical, business and
F-22 SAIC, Inc. Annual Report

SAIC, INC.SCIENCE APPLICATIONS INTERNATIONAL CORPORATION
COMBINED NOTES TO CONSOLIDATED FINANCIAL STATEMENTS
information technology services for healthcare enterprises. This acquisition expanded the Company’s capabilities in bothfederal and commercial markets to help customers better address EHR implementation and optimization demand. PatrickEnergy Services, Inc. is a provider of performance-based transmission and distribution power system solutions. Thisacquisition enhanced the Company’s energy and smart grid services portfolio by adding additional transmission anddistribution engineering services to its existing capabilities.
The most notable acquisitions in fiscal 2011 included Cloudshield Technologies, Inc. in the Intelligence and CybersecuritySolutions segment and Reveal Imaging Technologies, Inc. in the Health, Energy and Civil Solutions segment. CloudshieldTechnologies, Inc. is a provider of cybersecurity and management services solutions. This acquisition enhanced theCompany’s cybersecurity offerings and positioned the Company to bring to market deep packet inspection solutions for highspeed networks, enabling the Company to better meet emerging customer requirements. Reveal Imaging Technologies, Inc.is a provider of threat detection products and services. This acquisition enhanced the Company’s homeland securitysolutions portfolio by adding U.S. Transportation Security Administration certified explosive detection systems for checkedbaggage screening to the Company’s passenger and cargo inspection systems product offerings.
Note 5—Goodwill and Intangible Assets:
As discussed in Note 15 — Business Segment Information, the Company has the following reportable segments:Defense Solutions (DS); Health, Energy and Civil Solutions (HECS); and Intelligence and Cybersecurity Solutions (ICS).Corporate reorganizations occurred in fiscal 2013 resulting in transfers of certain operations between the Company’sreportable segments as well as a change in the aggregation of business units in the ICS reportable segment.
The balance and changes in the carrying amount of goodwill by segment were as follows:
DS HECS ICS Total
(in millions)
Balance at January 31, 2011 $405 $ 608 $625 $1,638Acquisitions — 165 — 165Adjustments 5 (14) 6 (3)
Balance at January 31, 2012 410 759 631 1,800Acquisitions — 395 — 395Adjustments — (10) 10 —
Balance at January 31, 2013 $410 $1,144 $641 $2,195
The carrying value of goodwill by segment at January 31, 2011 has been recast to give effect to the change in reportablesegments and for discontinued operations ($26 million for discontinued operations occurring in fiscal 2013).
Goodwill adjustments in fiscal 2013 and 2012 resulted from the finalization of purchase price allocations related to prior yearacquisitions and the transfer of certain operations between reportable segments. There were no goodwill impairments duringfiscal 2013, 2012 and 2011.
Intangible assets, including those arising from preliminary estimates of assets acquired relating to acquisitions, consisted ofthe following:
January 31
2013 2012
Grosscarrying
valueAccumulatedamortization
Netcarrying
value
Grosscarrying
valueAccumulatedamortization
Netcarrying
value
(in millions)
Finite-lived intangible assets:Customer relationships $175 $ (73) $102 $120 $ (62) $ 58Software and technology 127 (57) 70 148 (48) 100Other 2 (1) 1 2 (1) 1
Total finite-lived intangible assets 304 (131) 173 270 (111) 159Indefinite-lived intangible assets:
In-process research and development 13 — 13 13 — 13Trade names 4 — 4 4 — 4
Total indefinite-lived intangible assets 17 — 17 17 — 17
Total intangible assets $321 $(131) $190 $287 $(111) $176
SAIC, Inc. Annual Report F-23

SAIC, INC.SCIENCE APPLICATIONS INTERNATIONAL CORPORATION
COMBINED NOTES TO CONSOLIDATED FINANCIAL STATEMENTS
Finite-lived intangible assets with a gross carrying value of $25 million and $37 million became fully amortized in fiscal 2013and 2012, respectively, and are no longer reflected in the gross carrying value after becoming fully amortized. Amortizationexpense related to amortizable intangible assets was $45 million, $45 million and $40 million for the fiscal years endedJanuary 31, 2013, 2012 and 2011, respectively.
During fiscal 2013 and 2012, the Company determined that certain intangible assets consisting of software and technologyand customer relationships, mainly associated with the acquisitions of Cloudshield Technologies, Inc. in fiscal 2011 andScience, Engineering and Technology Associates Corporation in fiscal 2010, were not recoverable due to lower projectedrevenue levels from the associated products and customers. As a result, the Intelligence and Cybersecurity Solutionsreportable segment recognized impairment losses within selling, general and administrative expenses of $13 million and$19 million in fiscal 2013 and 2012, respectively, to reduce the carrying amount of these intangible assets to their estimatedfair values. There were no impairments of intangible assets for fiscal 2011. Fair value was estimated using the incomeapproach based on management’s forecast of future cash flows to be derived from the assets’ use (Level 3 under theaccounting standard for fair value measurement).
The estimated annual amortization expense related to finite-lived intangible assets as of January 31, 2013 was as follows:
Year Ending January 31
(in millions)
2014 $ 442015 352016 322017 272018 182019 and thereafter 17
$173
Actual amortization expense in future periods could differ from these estimates as a result of future acquisitions, divestitures,impairments, the outcome and timing of completion of in-process research and development projects (the assets of whichwill become amortizable upon completion and placement into service, or will be impaired if abandoned), adjustments topreliminary valuations of intangible assets and other factors.
Note 6—Revolving Credit Facility:
In fiscal 2012, SAIC amended and restated its revolving credit facility. The amended and restated revolving credit facilityexecuted by SAIC and fully and unconditionally guaranteed by Science Applications provides for up to $750 million inunsecured borrowing capacity at interest rates determined, at SAIC’s option, based on either LIBOR plus a margin or adefined base rate. During fiscal 2013, the Company extended the maturity date of the credit facility for one additional year, toMarch 2016, as provided for in the terms of the credit facility. As of January 31, 2013 and 2012, there were no borrowingsoutstanding under the credit facility.
The revolving credit facility contains certain customary representations and warranties, as well as certain affirmative andnegative covenants. The financial covenants contained in the credit facility require that, for a period of four trailing fiscalquarters, the Company maintains a ratio of consolidated funded debt, including borrowings under this credit facility, toearnings before interest, taxes, depreciation and amortization (EBITDA) adjusted for other items as defined in the creditfacility of not more than 3.0 to 1.0 and a ratio of EBITDA adjusted for other items as defined in the credit facility to interestexpense of greater than 3.5 to 1.0. The Company was in compliance with these financial covenants as of January 31, 2013.A failure by the Company to meet these financial covenants in the future would reduce and could eliminate the Company’sborrowing capacity under the credit facility.
Other covenants restrict certain of the Company’s activities, including among other things, its ability to create liens, disposeof certain assets and merge or consolidate with other entities. The credit facility also contains certain customary events ofdefault, including, among others, defaults based on certain bankruptcy and insolvency events, nonpayment, cross-defaultsto other debt, breach of specified covenants, Employee Retirement Income Security Act (ERISA) events, material monetaryjudgments, change of control events and the material inaccuracy of the Company’s representations and warranties.
F-24 SAIC, Inc. Annual Report

SAIC, INC.SCIENCE APPLICATIONS INTERNATIONAL CORPORATION
COMBINED NOTES TO CONSOLIDATED FINANCIAL STATEMENTS
Note 7—Notes Payable and Long-Term Debt:
The Company’s notes payable and long-term debt consisted of the following for the years presented:
January 31
Statedinterest rate
Effectiveinterest
rate 2013 2012
($ in millions)
SAIC senior unsecured notes:$450 million notes issued in fiscal 2011, which mature in December 2020 4.45% 4.53% $ 449 $ 449$300 million notes issued in fiscal 2011, which mature in December 2040 5.95% 6.03% 300 300
Science Applications senior unsecured notes:$550 million notes issued in fiscal 2003, which matured in July 2012 6.25% 6.50% — 550$250 million notes issued in fiscal 2003, which mature in July 2032 7.13% 7.43% 248 248$300 million notes issued in fiscal 2004, which mature in July 2033 5.50% 5.78% 297 296
Other notes payable due on various dates through fiscal 2017 0%-2.5% Various 4 9
Total notes payable and long-term debt 1,298 1,852Less current portion 2 553
Total notes payable and long-term debt, net of current portion $ 1,296 $ 1,299
Fair value of notes payable and long-term debt $ 1,390 $ 2,011
The Company paid $550 million to settle the 6.25% notes at maturity in July 2012.
Interest is payable on the Company’s senior unsecured notes on a semi-annual basis with principal payments due onmaturity. The note discounts, issuance costs and the loss on the settlement of related treasury lock contracts are amortizedto interest expense, which results in an effective interest rate that is higher than the stated interest rate of the notes. Thesenior unsecured notes contain customary restrictive covenants, including, among other things, restrictions on theCompany’s ability to create liens and enter into sale and leaseback transactions. The Company was in compliance with allcovenants as of January 31, 2013.
Maturities of notes payable and long-term debt are as follows:
Year Ending January 31 Total
(in millions)
2014 $ 22015 22016 12017 12018 —2019 and thereafter 1,300
Total principal payments 1,306Less unamortized discount 8
$1,298
Note 8—Related Party Transactions:
Science Applications has fully and unconditionally guaranteed the obligations of SAIC under its $450 million 4.45% notes and$300 million 5.95% notes. These notes have been reflected as debt of Science Applications in these consolidated financialstatements. Science Applications has fully and unconditionally guaranteed any borrowings under SAIC’s amended andrestated revolving credit facility maturing in fiscal 2017. SAIC has fully and unconditionally guaranteed the obligations ofScience Applications under its $300 million 5.5% notes and $250 million 7.13% notes.
SAIC and Science Applications have a related party note in connection with a loan of cash between the entities, which isadjusted to reflect issuances of stock by SAIC to employees of Science Applications and its subsidiaries and ScienceApplications’ payment of certain obligations on behalf of SAIC. The related party note bears interest based on LIBOR plus amarket-based premium. Portions of the related party note may be repaid at any time prior to its maturity date in November2013. This maturity date will be automatically extended for successive one-year periods unless either SAIC or ScienceApplications provides prior notice to the other party.
SAIC, Inc. Annual Report F-25
SAIC, INC.SCIENCE APPLICATIONS INTERNATIONAL CORPORATION
COMBINED NOTES TO CONSOLIDATED FINANCIAL STATEMENTS
Note 9—Retirement Plans:
Defined Contribution Plans
The Company sponsors several defined contribution plans, including the SAIC Retirement Plan (SRP) which is both a 401(k)plan and an employee stock ownership plan, in which most employees are eligible to participate. These plans allow eligibleparticipants to contribute a portion of their income through payroll deductions and the Company may also makediscretionary contributions. Company contributions expensed for defined contribution plans were $145 million, $150 millionand $157 million in fiscal 2013, 2012 and 2011, respectively.
Deferred Compensation Plans
The Company maintains two deferred compensation plans, the Keystaff Deferral Plan (KDP) and the Key Executive StockDeferral Plan (KESDP), for the benefit of certain management or highly compensated employees or directors and allowseligible participants to elect to defer all or a portion of their annual bonus, sign-on bonus or certain other bonuses. Directorsmay also elect to defer their director fees. The Company makes no contributions to the KDP but maintains participantaccounts for deferred amounts and interest earned. Interest is accrued based on the Moody’s Seasoned Corporate BondRate (3.1% to 4.1% during fiscal 2013). Deferred balances are generally paid upon retirement or termination. Under theKESDP, eligible participants may elect to defer in share units all or a portion of their bonus awards granted under the 2006Equity Incentive Plan (see Note 10) and prior plans. The Company makes no contributions to the accounts of KESDPparticipants. Benefits from the KESDP are payable in shares of SAIC’s stock that may be held in a trust for the purpose offunding benefit payments to KESDP participants. Deferred balances will generally be paid upon retirement or termination.
Beginning in fiscal 2012, the Company sponsored a 401(k) Excess Deferral Plan (Excess Plan) for the benefit of certainmanagement or highly compensated employees that allows participants to elect to defer up to 20% of their eligible salaryonce the participant has met the contribution limit imposed on the SAIC Retirement Plan. The Company makes matchingcontributions to participants who have received a reduced Company contribution in the SAIC Retirement Plan due to theparticipant’s deferral of salary into the Excess Plan.
Defined Benefit Plans
The Company sponsors a defined benefit pension plan in the United Kingdom for plan participants that primarily performedservices on an expired customer contract. While benefits are no longer accruing under the plan, the Company hascontinuing defined benefit pension obligations with respect to certain plan participants. In fiscal 2012, the Company soldcertain components of its business, including the component of its business that contained this pension and employed thepension plan participants. The Company has classified the operating results of this business component, including pensionexpense through the date of sale, as discontinued operations for all periods presented. Pursuant to the definitive saleagreement, the Company retained the assets and obligations of this defined benefit pension plan. As a result of retaining thepension obligation, the remaining components of ongoing pension expense, primarily interest costs and assumed return onplan assets subsequent to the sale, are recorded in continuing operations.
In fiscal 2013, certain plan participants in the Company’s defined benefit pension plan, who previously transferred theiremployment to a successor contractor upon the expiration of the customer contract, elected to transfer, and the Companytransferred, $46 million of pension plan assets to that successor contractor’s plan and settled $63 million of related pensionplan obligations. As a result of the transfer, the Company recorded an immaterial settlement gain in selling, general andadministrative expenses in fiscal 2013.
In the fourth quarter of each fiscal year and whenever the plan assets and liabilities are remeasured, the Company evaluatesand recognizes, when appropriate, the net actuarial gains or losses in excess of the 10 percent of the greater of the market-related value of plan assets or the plan’s projected benefit obligation (which is referred to as the “corridor”).
F-26 SAIC, Inc. Annual Report

SAIC, INC.SCIENCE APPLICATIONS INTERNATIONAL CORPORATION
COMBINED NOTES TO CONSOLIDATED FINANCIAL STATEMENTS
Funded Status. The following tables set forth the funded status and amounts recognized in the consolidated balance sheetsfor this plan.
Year Ended January 31
2013 2012
(in millions)
Change in projected benefit obligation:Projected benefit obligation at beginning of year $149 $131Interest cost 4 7Actuarial loss 3 15Benefits paid (2) (2)Prior service costs — 1Settlements (63) —Foreign exchange rate changes 3 (3)
Projected benefit obligation at end of year $ 94 $149
Change in plan assets:Fair value of plan assets at beginning of year $120 $111Actual return on plan assets 7 6Settlements (46) —Company contributions 5 8Benefits paid (2) (2)Foreign exchange rate changes 2 (3)
Fair value of plan assets at end of year $ 86 $120
Funded status at end of year $ (8) $ (29)
January 31
2013 2012
(in millions)
Accumulated benefit obligation $94 $149Amounts included in the consolidated balance sheets consist of:
Accrued pension liability (other long-term liabilities) $ (8) $ (29)Amounts included in accumulated other comprehensive loss consist of:
Net actuarial (gain) loss (pretax) $ (1) $ 13
The components of the Company’s net periodic benefit cost for this plan were as follows:
Year Ended January 31
2013 2012 2011
(in millions)Service cost $— $— $ 1Interest cost 4 7 7Expected return on plan assets (5) (5) (7)Prior service costs — 1 —Contractual termination benefits — — 1
$ (1) $ 3 $ 2
Actuarial Assumptions. The weighted-average assumptions used in determining the benefit obligations and the net periodicbenefit cost of pension were as follows:
January 31
2013 2012
Assumptions used to determine benefit obligations at the plan’s measurement date:Discount rate 4.7% 4.4%Rate of compensation increase 0.0 3.8
SAIC, Inc. Annual Report F-27
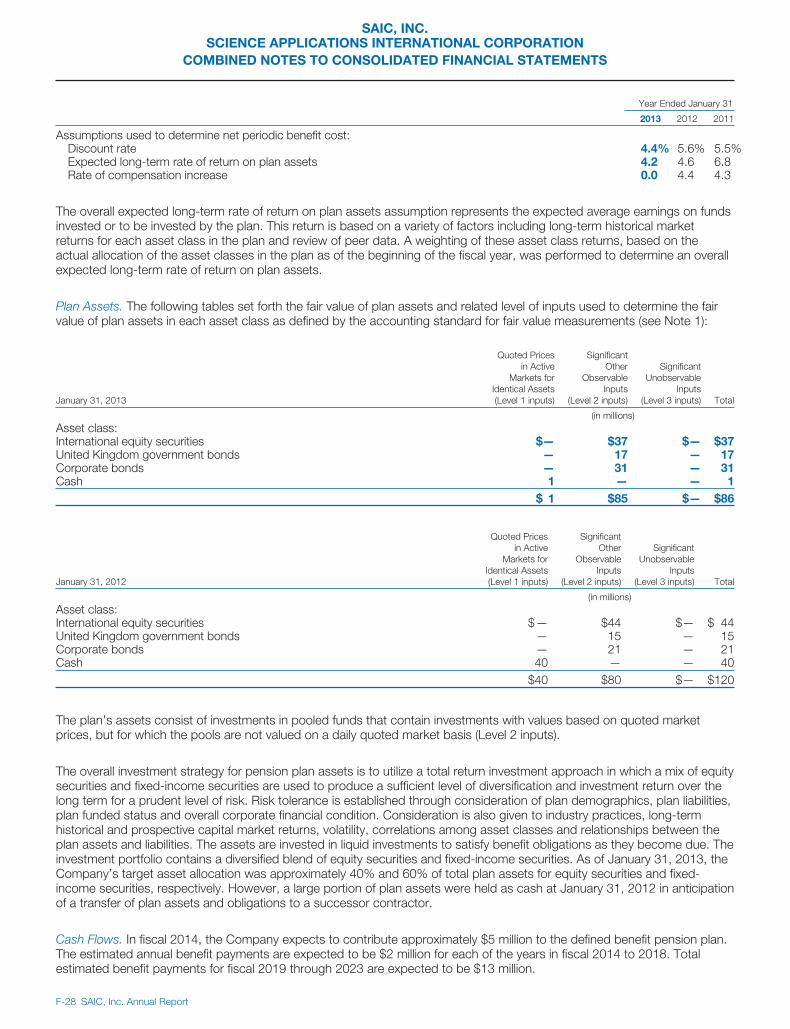
SAIC, INC.SCIENCE APPLICATIONS INTERNATIONAL CORPORATION
COMBINED NOTES TO CONSOLIDATED FINANCIAL STATEMENTS
Year Ended January 31
2013 2012 2011
Assumptions used to determine net periodic benefit cost:Discount rate 4.4% 5.6% 5.5%Expected long-term rate of return on plan assets 4.2 4.6 6.8Rate of compensation increase 0.0 4.4 4.3
The overall expected long-term rate of return on plan assets assumption represents the expected average earnings on fundsinvested or to be invested by the plan. This return is based on a variety of factors including long-term historical marketreturns for each asset class in the plan and review of peer data. A weighting of these asset class returns, based on theactual allocation of the asset classes in the plan as of the beginning of the fiscal year, was performed to determine an overallexpected long-term rate of return on plan assets.
Plan Assets. The following tables set forth the fair value of plan assets and related level of inputs used to determine the fairvalue of plan assets in each asset class as defined by the accounting standard for fair value measurements (see Note 1):
January 31, 2013
Quoted Pricesin Active
Markets forIdentical Assets(Level 1 inputs)
SignificantOther
ObservableInputs
(Level 2 inputs)
SignificantUnobservable
Inputs(Level 3 inputs) Total
(in millions)Asset class:International equity securities $— $37 $— $37United Kingdom government bonds — 17 — 17Corporate bonds — 31 — 31Cash 1 — — 1
$ 1 $85 $— $86
January 31, 2012
Quoted Pricesin Active
Markets forIdentical Assets(Level 1 inputs)
SignificantOther
ObservableInputs
(Level 2 inputs)
SignificantUnobservable
Inputs(Level 3 inputs) Total
(in millions)Asset class:International equity securities $— $44 $— $ 44United Kingdom government bonds — 15 — 15Corporate bonds — 21 — 21Cash 40 — — 40
$40 $80 $— $120
The plan’s assets consist of investments in pooled funds that contain investments with values based on quoted marketprices, but for which the pools are not valued on a daily quoted market basis (Level 2 inputs).
The overall investment strategy for pension plan assets is to utilize a total return investment approach in which a mix of equitysecurities and fixed-income securities are used to produce a sufficient level of diversification and investment return over thelong term for a prudent level of risk. Risk tolerance is established through consideration of plan demographics, plan liabilities,plan funded status and overall corporate financial condition. Consideration is also given to industry practices, long-termhistorical and prospective capital market returns, volatility, correlations among asset classes and relationships between theplan assets and liabilities. The assets are invested in liquid investments to satisfy benefit obligations as they become due. Theinvestment portfolio contains a diversified blend of equity securities and fixed-income securities. As of January 31, 2013, theCompany’s target asset allocation was approximately 40% and 60% of total plan assets for equity securities and fixed-income securities, respectively. However, a large portion of plan assets were held as cash at January 31, 2012 in anticipationof a transfer of plan assets and obligations to a successor contractor.
Cash Flows. In fiscal 2014, the Company expects to contribute approximately $5 million to the defined benefit pension plan.The estimated annual benefit payments are expected to be $2 million for each of the years in fiscal 2014 to 2018. Totalestimated benefit payments for fiscal 2019 through 2023 are expected to be $13 million.
F-28 SAIC, Inc. Annual Report

SAIC, INC.SCIENCE APPLICATIONS INTERNATIONAL CORPORATION
COMBINED NOTES TO CONSOLIDATED FINANCIAL STATEMENTS
Other
The Company also sponsors a defined benefit pension plan for employees working on one U.S. Government contract. Aspart of the contractual agreement, the customer reimburses the Company for contributions made to the plan that areallowable under government contract cost accounting requirements. If the Company were to cease being the contractor as aresult of a recompetition process, this defined benefit pension plan and related plan assets and liabilities would transfer to thenew contractor. If the contract expires or is terminated with no transfer of the plan to a successor contractor, any amount bywhich plan liabilities exceed plan assets, as of that date, will be reimbursed by the U.S. Government customer. Since theCompany is not responsible for the current or future funded status of this plan, no assets or liabilities arising from its fundedstatus are recorded in the Company’s consolidated financial statements and no amounts associated with this plan areincluded in the defined benefit plan disclosures above.
Note 10—Stock-Based Compensation:
Plan Summaries. At January 31, 2013, the Company had stock-based compensation awards outstanding under thefollowing plans: the 2006 Equity Incentive Plan, the Management Stock Compensation Plan, the Stock Compensation Planand the 2006 Employee Stock Purchase Plan (ESPP). SAIC issues new shares upon the issuance of stock awards orexercise of stock options under these plans.
The 2006 Equity Incentive Plan provides the Company’s and its affiliates’ employees, directors and consultants theopportunity to receive various types of stock-based compensation and cash awards. As of January 31, 2013, the Companyhas issued stock options, vested stock awards, restricted stock awards including restricted stock units, performance-basedawards and cash awards under this plan. The 2006 Equity Incentive Plan provides that in the event of the Company’smerger with or into another corporation, a sale of substantially all of its assets or the transfer of more than 50% of SAIC’soutstanding shares by tender offer or similar transaction, the successor entity may assume or substitute all outstandingawards. If the successor entity does not assume or substitute all outstanding awards, the vesting of all awards will accelerateand any repurchase rights on awards will terminate. If a successor entity assumes or substitutes all awards and a participantis involuntarily terminated by the successor entity for any reason other than death, disability or cause within 18 monthsfollowing the change of control, all outstanding awards of the terminated participant will immediately vest and be exercisablefor a period of six months following termination. In the event of a change of control, the vesting of all awards held by non-employee directors of the Company will accelerate. Stock awards granted under the plan generally vest or becomeexercisable 20%, 20%, 20%, and 40% after one, two, three and four years, respectively. As of January 31, 2013, 18 millionshares of SAIC’s stock were reserved for future issuance under the 2006 Equity Incentive Plan.
The Company has a Management Stock Compensation Plan and a Stock Compensation Plan, together referred to as theStock Compensation Plans. The board of directors may at any time amend or terminate the Stock Compensation Plans. TheStock Compensation Plans provide for awards in share units to eligible employees. Benefits from these plans are payable inshares of SAIC’s stock that are held in a trust for the purpose of funding benefit payments to the plans’ participants. The fairvalue of the awards granted under the Stock Compensation Plans, which are vesting share unit awards, is based on the fairvalue of the award on the date of grant. Compensation expense is measured at grant date and generally recognized over thevesting period of four or seven years depending upon the initial date of grant. For awards granted prior to January 1, 2006,participants’ interests in these share units vest on a seven year schedule at the rate of one-third at the end of each of thefifth, sixth and seventh years following the date of the award. Awards granted on or after January 1, 2006 vest 100% afterfour years following the date of the award. Upon a change in control of the Company (as defined by the StockCompensation Plans), participant accounts will become fully vested and shares of SAIC stock held in the accounts will beimmediately distributed. The Stock Compensation Plans do not provide for a maximum number of shares available for futureissuance.
The Company has an ESPP which allows eligible employees to purchase shares of SAIC’s stock at a discount of up to 15%of the fair market value on the date of purchase. During the three years ended January 31, 2013, the discount was 5% of thefair market value on the date of purchase thereby resulting in the ESPP being non-compensatory. As of January 31, 2013,39 million shares of SAIC’s stock were authorized and reserved for future issuance under the ESPP.
SAIC, Inc. Annual Report F-29

SAIC, INC.SCIENCE APPLICATIONS INTERNATIONAL CORPORATION
COMBINED NOTES TO CONSOLIDATED FINANCIAL STATEMENTS
Stock-Based Compensation and Related Tax Benefits Recognized. Stock-based compensation and related tax benefitsrecognized under all plans were as follows:
Year Ended January 31
2013 2012 2011
(in millions)
Stock-based compensation expense:Stock options $13 $17 $19Vesting stock awards 69 70 74Vested stock awards — 1 1Performance-based stock awards 2 (5) 5
Total stock-based compensation expense recorded in continuing operations $84 $83 $99
Total stock-based compensation expense recorded in discontinued operations $— $ 2 $ 3
Tax benefits recognized from stock-based compensation $33 $33 $40
Vested stock issued as settlement of annual bonus accruals $ 2 $ 3 $ 4
Stock Options. Stock options may be granted with exercise prices no less than the fair value of SAIC’s common stock onthe date of grant and for terms not greater than ten years. Prior to January 31, 2011, stock options granted under the 2006Equity Incentive Plan have a term of five years and a vesting period of four years, except for stock options granted to theCompany’s outside directors, which have a vesting period of one year. Subsequent to January 31, 2011, stock optionsgranted under the 2006 Equity Incentive Plan have a term of seven years. Stock options were granted with exercise pricesequal to fair value on the date of grant.
The fair value of the Company’s stock option awards is estimated on the date of grant using the Black-Scholes-Mertonoption-pricing model. The fair value of the Company’s stock option awards is generally expensed on a straight-line basisover the vesting period of four years, except for stock options granted to the Company’s outside directors, which isrecognized over the vesting period of one year. The expected term of all awards granted is derived from the Company’shistorical experience except for awards granted to the Company’s outside directors, for which the expected term of awardsgranted is derived utilizing the “simplified” method presented in SEC Staff Accounting Bulletin Nos. 107 and 110, “Share-Based Payment”. Expected volatility is based on an average of the historical volatility of SAIC’s stock and the implied volatilityfrom traded options on SAIC’s stock. The risk-free interest rate is based on the yield curve of a zero-coupon U.S. Treasurybond with a maturity equal to the expected term of the stock option on the date of grant. The Company uses historical datato estimate forfeitures.
The weighted average grant-date fair value and assumptions used to determine fair value of stock options granted for eachof the three years ended January 31, 2013 were as follows:
Year Ended January 31
2013 2012 2011
Weighted average grant-date fair value $1.81 $4.21 $3.96Expected term (in years) 5.0 4.9 3.8Expected volatility 24.5% 23.4% 25.1%Risk-free interest rate 1.0% 2.2% 2.1%Dividend yield 3.7% 0% 0%
F-30 SAIC, Inc. Annual Report
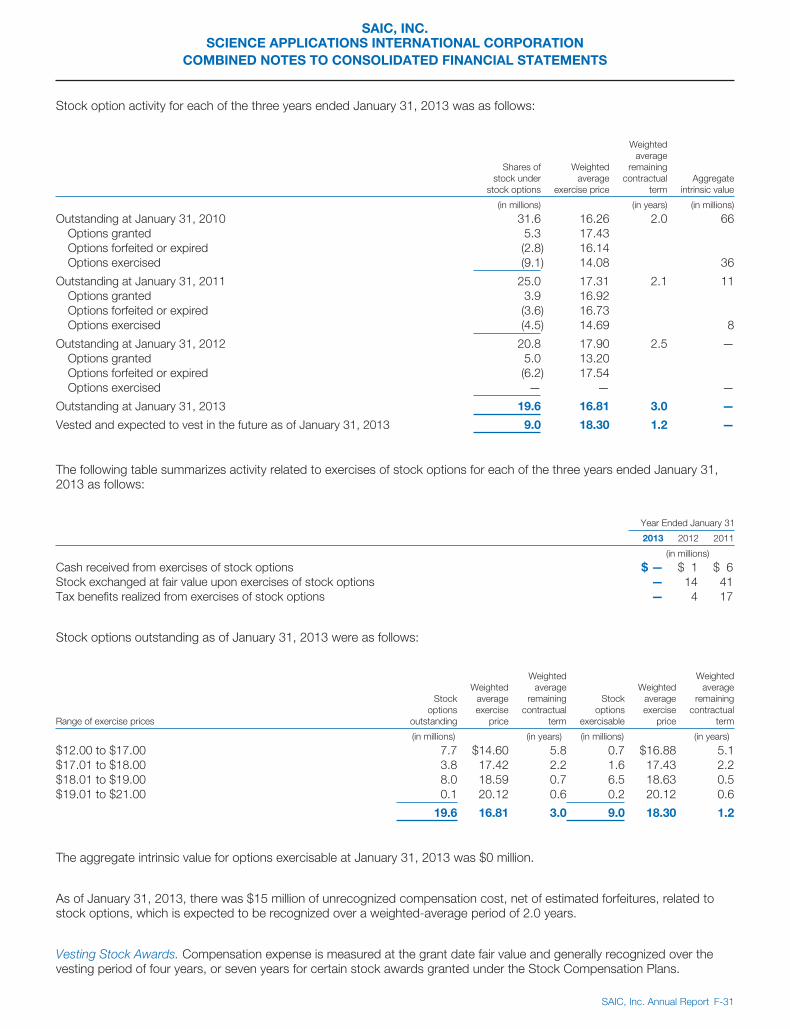
SAIC, INC.SCIENCE APPLICATIONS INTERNATIONAL CORPORATION
COMBINED NOTES TO CONSOLIDATED FINANCIAL STATEMENTS
Stock option activity for each of the three years ended January 31, 2013 was as follows:
Shares ofstock under
stock options
Weightedaverage
exercise price
Weightedaverage
remainingcontractual
termAggregate
intrinsic value
(in millions) (in years) (in millions)
Outstanding at January 31, 2010 31.6 16.26 2.0 66Options granted 5.3 17.43Options forfeited or expired (2.8) 16.14Options exercised (9.1) 14.08 36
Outstanding at January 31, 2011 25.0 17.31 2.1 11Options granted 3.9 16.92Options forfeited or expired (3.6) 16.73Options exercised (4.5) 14.69 8
Outstanding at January 31, 2012 20.8 17.90 2.5 —Options granted 5.0 13.20Options forfeited or expired (6.2) 17.54Options exercised — — —
Outstanding at January 31, 2013 19.6 16.81 3.0 —
Vested and expected to vest in the future as of January 31, 2013 9.0 18.30 1.2 —
The following table summarizes activity related to exercises of stock options for each of the three years ended January 31,2013 as follows:
Year Ended January 31
2013 2012 2011
(in millions)
Cash received from exercises of stock options $ — $ 1 $ 6Stock exchanged at fair value upon exercises of stock options — 14 41Tax benefits realized from exercises of stock options — 4 17
Stock options outstanding as of January 31, 2013 were as follows:
Range of exercise prices
Stockoptions
outstanding
Weightedaverageexercise
price
Weightedaverage
remainingcontractual
term
Stockoptions
exercisable
Weightedaverageexercise
price
Weightedaverage
remainingcontractual
term
(in millions) (in years) (in millions) (in years)
$12.00 to $17.00 7.7 $14.60 5.8 0.7 $16.88 5.1$17.01 to $18.00 3.8 17.42 2.2 1.6 17.43 2.2$18.01 to $19.00 8.0 18.59 0.7 6.5 18.63 0.5$19.01 to $21.00 0.1 20.12 0.6 0.2 20.12 0.6
19.6 16.81 3.0 9.0 18.30 1.2
The aggregate intrinsic value for options exercisable at January 31, 2013 was $0 million.
As of January 31, 2013, there was $15 million of unrecognized compensation cost, net of estimated forfeitures, related tostock options, which is expected to be recognized over a weighted-average period of 2.0 years.
Vesting Stock Awards. Compensation expense is measured at the grant date fair value and generally recognized over thevesting period of four years, or seven years for certain stock awards granted under the Stock Compensation Plans.
SAIC, Inc. Annual Report F-31
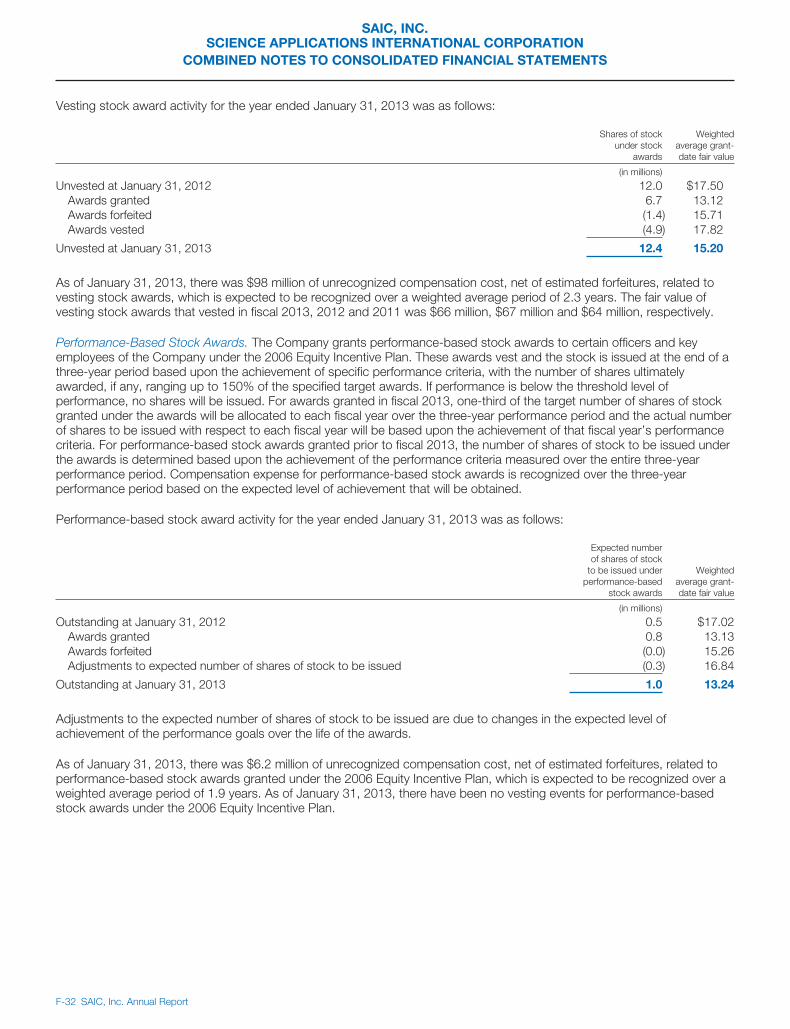
SAIC, INC.SCIENCE APPLICATIONS INTERNATIONAL CORPORATION
COMBINED NOTES TO CONSOLIDATED FINANCIAL STATEMENTS
Vesting stock award activity for the year ended January 31, 2013 was as follows:
Shares of stockunder stock
awards
Weightedaverage grant-date fair value
(in millions)
Unvested at January 31, 2012 12.0 $17.50Awards granted 6.7 13.12Awards forfeited (1.4) 15.71Awards vested (4.9) 17.82
Unvested at January 31, 2013 12.4 15.20
As of January 31, 2013, there was $98 million of unrecognized compensation cost, net of estimated forfeitures, related tovesting stock awards, which is expected to be recognized over a weighted average period of 2.3 years. The fair value ofvesting stock awards that vested in fiscal 2013, 2012 and 2011 was $66 million, $67 million and $64 million, respectively.
Performance-Based Stock Awards. The Company grants performance-based stock awards to certain officers and keyemployees of the Company under the 2006 Equity Incentive Plan. These awards vest and the stock is issued at the end of athree-year period based upon the achievement of specific performance criteria, with the number of shares ultimatelyawarded, if any, ranging up to 150% of the specified target awards. If performance is below the threshold level ofperformance, no shares will be issued. For awards granted in fiscal 2013, one-third of the target number of shares of stockgranted under the awards will be allocated to each fiscal year over the three-year performance period and the actual numberof shares to be issued with respect to each fiscal year will be based upon the achievement of that fiscal year’s performancecriteria. For performance-based stock awards granted prior to fiscal 2013, the number of shares of stock to be issued underthe awards is determined based upon the achievement of the performance criteria measured over the entire three-yearperformance period. Compensation expense for performance-based stock awards is recognized over the three-yearperformance period based on the expected level of achievement that will be obtained.
Performance-based stock award activity for the year ended January 31, 2013 was as follows:
Expected numberof shares of stock
to be issued underperformance-based
stock awards
Weightedaverage grant-date fair value
(in millions)
Outstanding at January 31, 2012 0.5 $17.02Awards granted 0.8 13.13Awards forfeited (0.0) 15.26Adjustments to expected number of shares of stock to be issued (0.3) 16.84
Outstanding at January 31, 2013 1.0 13.24
Adjustments to the expected number of shares of stock to be issued are due to changes in the expected level ofachievement of the performance goals over the life of the awards.
As of January 31, 2013, there was $6.2 million of unrecognized compensation cost, net of estimated forfeitures, related toperformance-based stock awards granted under the 2006 Equity Incentive Plan, which is expected to be recognized over aweighted average period of 1.9 years. As of January 31, 2013, there have been no vesting events for performance-basedstock awards under the 2006 Equity Incentive Plan.
F-32 SAIC, Inc. Annual Report

SAIC, INC.SCIENCE APPLICATIONS INTERNATIONAL CORPORATION
COMBINED NOTES TO CONSOLIDATED FINANCIAL STATEMENTS
Note 11—Income Taxes:
Substantially all of the Company’s income from continuing operations before income taxes for the three years endedJanuary 31, 2013 was earned in the United States. The provision for income taxes related to continuing operations for eachof the three years ended January 31, 2013 included the following:
Year Ended January 31
2013 2012 2011
(in millions)
Current:Federal and foreign $ 39 $218 $254State 24 23 47
Deferred:Federal and foreign 61 (20) 9State 11 (11) (3)
Total $135 $210 $307
A reconciliation of the provision for income taxes to the amount computed by applying the statutory federal income tax rateto income from continuing operations before income taxes for each of the three years ended January 31, 2013 follows:
Year Ended January 31
2013 2012 2011
(in millions)
Amount computed at the statutory federal income tax rate (35%) $ 230 $ 68 $ 299State income taxes, net of federal tax benefit 22 8 28Change in accruals for uncertain tax positions — 1 (7)CityTime uncertain tax liability (96) 96 —Research and development credits (10) (7) (8)Dividends paid to employee stock ownership plan (9) — —U.S. manufacturing activity benefit (2) (5) (5)Non-deductible penalties — 49 —
Total $ 135 $ 210 $ 307
Effective income tax rate 20.5% 107.7% 35.9%
The Company’s lower effective income tax rate for fiscal 2013 when compared to fiscal 2012 was primarily due to a $96million reduction in the provision for income tax as the result of an issue resolution agreement with the IRS with respect tothe tax deductible portion of the CityTime payment which is described in Note 17. The fiscal 2013 effective tax rate alsobenefitted from the tax deductibility of quarterly dividends paid on shares held by the SAIC Retirement Plan (an employeestock ownership plan) and the reinstatement with retroactive effect to December 31, 2011 of the federal research anddevelopment tax credit. The effective income tax rate for fiscal 2012 was negatively impacted by estimated non-deductibleportion of the CityTime loss provision. The fiscal 2011 provision for income taxes included the reversal of $7 million inaccruals for unrecognized tax benefits as a result of the settlement of federal and state tax audits.
SAIC, Inc. Annual Report F-33

SAIC, INC.SCIENCE APPLICATIONS INTERNATIONAL CORPORATION
COMBINED NOTES TO CONSOLIDATED FINANCIAL STATEMENTS
Deferred income taxes are recorded for differences in the basis of assets and liabilities for financial reporting purposes andtax reporting purposes. Deferred tax assets (liabilities) were comprised of the following:
January 31
2013 2012
(in millions)
Accrued vacation and bonuses $ 83 $ 88Investments 5 8Deferred compensation 52 54Vesting stock awards 54 61Credits and net operating losses carryovers 34 35Employee benefit contributions 1 6CityTime loss provision — 63Other 33 32
Total deferred tax assets 262 347
Valuation allowance (7) (2)
Deferred revenue (79) (68)Fixed asset basis differences (14) (25)Purchased intangible assets (155) (133)
Total deferred tax liabilities (248) (226)
Net deferred tax assets $ 7 $ 119
Net deferred tax assets were as follows:
January 31
2013 2012
(in millions)
Net current deferred tax assets $ 18 $ 82Net non-current deferred tax (liabilities) assets (11) 37
Total net deferred tax assets $ 7 $119
At January 31, 2013, the Company had $41 million of federal net operating loss (NOL) carryforwards, which will expire infiscal 2023 to 2030. The Company expects to fully utilize these NOL carryforwards. The Company also has various stateNOL carryforwards. The Company has established a valuation allowance for those state NOL carryforwards which it doesnot expect to utilize. The Company also had $12 million of state tax credits at January 31, 2013, which expire in fiscal 2018to fiscal 2027. The Company expects to utilize $10 million of these state tax credits.
The Company’s unrecognized tax benefits are primarily related to certain recurring deductions customary for the Company’sindustry. The changes in the unrecognized tax benefits, excluding accrued interest and penalties, were as follows:
Year Ended January 31
2013 2012 2011
(in millions)
Unrecognized tax benefits at beginning of year $ 129 $ 23 $ 44Additions for tax positions related to current year — 102 1Additions for tax positions related to prior years 2 10 1Reductions for tax positions related to prior years (107) (4) (8)Settlements with taxing authorities (1) — (12)Lapse of statute of limitations (2) (2) (3)
Unrecognized tax benefits at end of year $ 21 $129 $ 23
Unrecognized tax benefits that, if recognized, would affect the effective income tax rate $ 17 $115 $ 17
In fiscal 2013, the Company’s unrecognized tax benefits decreased primarily due to the issue resolution agreement with theIRS with respect to the CityTime loss provision recorded in fiscal 2012. In fiscal 2011, the Company’s unrecognized taxbenefits decreased primarily due to the resolution of certain tax contingencies with the tax authorities, including $7 millionthat was recognized as an income tax benefit in fiscal 2012.
F-34 SAIC, Inc. Annual Report

SAIC, INC.SCIENCE APPLICATIONS INTERNATIONAL CORPORATION
COMBINED NOTES TO CONSOLIDATED FINANCIAL STATEMENTS
At each of January 31, 2013 and 2012, accrued interest and penalties totaled $3 million. A negligible amount of interest andpenalties were recognized in the consolidated statements of income in fiscal 2013, 2012 and 2011.
At January 31, 2013, the balance of unrecognized tax benefits included liabilities for uncertain tax positions of $24 million, allof which is classified as other long-term liabilities on the consolidated balance sheet. The balance of unrecognized taxbenefits at January 31, 2012 included liabilities for uncertain tax positions of $132 million, $29 million of which were classifiedas other long-term liabilities on the consolidated balance sheet.
The Company files income tax returns in the United States and various state and foreign jurisdictions and is subject to routinecompliance reviews by the IRS and other taxing authorities. The Company has effectively settled with the IRS for fiscal yearsprior to and including fiscal 2008. The Company also settled fiscal 2011 and 2012 as a result of the Company’s participationin the IRS Compliance Assurance Process (CAP) beginning in fiscal 2011. As part of the CAP, the Company and the IRSendeavor to agree on the treatment of all tax positions prior to the tax return being filed, thereby greatly reducing the periodof time between tax return submission and settlement with the IRS.
During the next 12 months, it is reasonably possible that resolution of reviews by taxing authorities, both domestic andinternational, could be reached with respect to $16 million of the Company’s unrecognized tax benefits, including a negligibleamount of previously accrued interest, depending on the timing of ongoing examinations, any litigation and expiration ofstatute of limitations, either because the Company’s tax positions are sustained or because the Company agrees to theirdisallowance and pays the related income tax. The resolution of the tax matters could result in a $14 million reduction inincome tax expense in fiscal 2014. While the Company believes it has adequate accruals for uncertain tax positions, the taxauthorities may determine that the Company owes taxes in excess of recorded accruals or the recorded accruals may be inexcess of the final settlement amounts agreed to by tax authorities.
Note 12—Accumulated Other Comprehensive Loss:
The components of accumulated other comprehensive loss were as follows:
January 31
2013 2012
(in millions)
Foreign currency translation adjustments, net of taxes of $(1) and $(2) million as of January 31, 2013 and 2012,respectively $ 2 $ 2
Unrecognized net loss on settled derivative instruments associated with outstanding debt, net of taxes of $3 million asof January 31, 2013 and 2012 (5) (5)
Unrecognized gain (loss) on defined benefit plan, net of taxes of $0 million and $5 million as of January 31, 2013 and2012, respectively 1 (8)
Total accumulated other comprehensive loss, net of taxes of $2 million and $6 million as of January 31, 2013 and2012, respectively $(2) $(11)
As of January 31, 2013, there is less than $1 million of the unrealized net loss on settled derivative instruments (pre-tax) to beamortized and recognized as interest expense during the next 12 months.
Note 13—Leases:
The Company occupies most of its facilities under operating leases. Most of the leases require the Company to paymaintenance and operating expenses such as taxes, insurance and utilities and also contain renewal options to extend thelease and provisions for periodic rate escalations to reflect inflationary increases. Certain equipment is leased under short-term or cancelable operating leases. Rental expense for facilities and equipment related to continuing operations for each ofthe three fiscal years ended January 31, 2013 were as follows:
Year Ended January 31
2013 2012 2011
(in millions)
Gross rental expense $170 $177 $173Less lease and sublease income (5) (17) (23)
Net rental expense $165 $160 $150
SAIC, Inc. Annual Report F-35
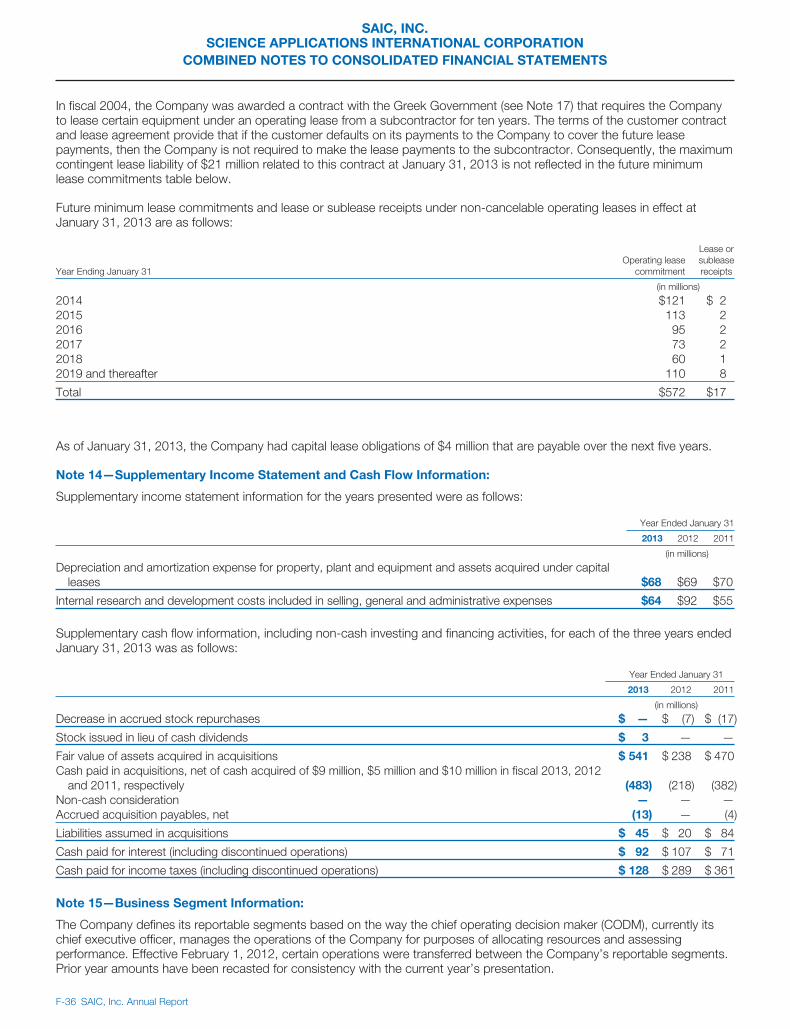
SAIC, INC.SCIENCE APPLICATIONS INTERNATIONAL CORPORATION
COMBINED NOTES TO CONSOLIDATED FINANCIAL STATEMENTS
In fiscal 2004, the Company was awarded a contract with the Greek Government (see Note 17) that requires the Companyto lease certain equipment under an operating lease from a subcontractor for ten years. The terms of the customer contractand lease agreement provide that if the customer defaults on its payments to the Company to cover the future leasepayments, then the Company is not required to make the lease payments to the subcontractor. Consequently, the maximumcontingent lease liability of $21 million related to this contract at January 31, 2013 is not reflected in the future minimumlease commitments table below.
Future minimum lease commitments and lease or sublease receipts under non-cancelable operating leases in effect atJanuary 31, 2013 are as follows:
Year Ending January 31Operating lease
commitment
Lease orsubleasereceipts
(in millions)
2014 $121 $ 22015 113 22016 95 22017 73 22018 60 12019 and thereafter 110 8
Total $572 $17
As of January 31, 2013, the Company had capital lease obligations of $4 million that are payable over the next five years.
Note 14—Supplementary Income Statement and Cash Flow Information:
Supplementary income statement information for the years presented were as follows:
Year Ended January 31
2013 2012 2011
(in millions)
Depreciation and amortization expense for property, plant and equipment and assets acquired under capitalleases $68 $69 $70
Internal research and development costs included in selling, general and administrative expenses $64 $92 $55
Supplementary cash flow information, including non-cash investing and financing activities, for each of the three years endedJanuary 31, 2013 was as follows:
Year Ended January 31
2013 2012 2011
(in millions)
Decrease in accrued stock repurchases $ — $ (7) $ (17)
Stock issued in lieu of cash dividends $ 3 — —
Fair value of assets acquired in acquisitions $ 541 $ 238 $ 470Cash paid in acquisitions, net of cash acquired of $9 million, $5 million and $10 million in fiscal 2013, 2012
and 2011, respectively (483) (218) (382)Non-cash consideration — — —Accrued acquisition payables, net (13) — (4)
Liabilities assumed in acquisitions $ 45 $ 20 $ 84
Cash paid for interest (including discontinued operations) $ 92 $ 107 $ 71
Cash paid for income taxes (including discontinued operations) $ 128 $ 289 $ 361
Note 15—Business Segment Information:
The Company defines its reportable segments based on the way the chief operating decision maker (CODM), currently itschief executive officer, manages the operations of the Company for purposes of allocating resources and assessingperformance. Effective February 1, 2012, certain operations were transferred between the Company’s reportable segments.Prior year amounts have been recasted for consistency with the current year’s presentation.
F-36 SAIC, Inc. Annual Report
SAIC, INC.SCIENCE APPLICATIONS INTERNATIONAL CORPORATION
COMBINED NOTES TO CONSOLIDATED FINANCIAL STATEMENTS
Defense Solutions provides systems engineering and specialized technical services and solutions in support of commandand control, communications, modeling and simulation, logistics, readiness and sustainment and network operations to abroad customer base within the defense industry. Defense Solutions helps design and implement advanced, networkedcommand and control systems to enable U.S. and allied defense customers to plan, direct, coordinate and control forcesand operations at strategic, operational and tactical levels. Defense Solutions also provides a wide range of logistics, productsupport and force modernization solutions, including supply chain management, demand forecasting, distribution, sustainingengineering, maintenance and training services, to enhance the readiness and operational capability of U.S. militarypersonnel and their weapons and support systems. Major customers of Defense Solutions include most branches of theU.S. military.
Health, Energy and Civil Solutions provides services and solutions in the areas of critical infrastructure, homeland security,safety and mission assurance, training, environmental assessments and restoration, engineering design, construction,electronic health record implementations and other sophisticated IT services across a broad federal and commercialcustomer base. These services and solutions range from engineering, design and construction services, energymanagement, renewables and energy distribution/smart-grid, to healthcare IT, data management and analytics, healthinfrastructure and biomedical support and research. Health, Energy and Civil Solutions also provides integrated securitysolutions and training expertise in the detection of chemical, biological, radiological, nuclear and explosive threats anddesigns and develops products and applied technologies that aid anti-terrorism and homeland security efforts, includingborder, port and security inspection systems and checked baggage explosive detection systems. Major customers of Health,Energy and Civil Solutions primarily include the U.S. federal government, state and local governmental agencies, foreigngovernments and commercial enterprises in various industries.
Intelligence and Cybersecurity Solutions provides systems and services focused on intelligence, surveillance, reconnaissanceand cybersecurity across a broad spectrum of national security programs. Intelligence and Cybersecurity Solutions providesquick reaction, manned and unmanned airborne, maritime, space and ground-based surveillance systems which leverage anunderstanding of the underlying physics of operating in space, weight and power-constrained environments. Intelligence andCybersecurity Solutions also provides intelligence collection, processing, exploitation, and dissemination solutions, includingsystems designed to optimize decision-making in high rate, large volume, and complex data environments. Intelligence andCybersecurity Solutions provides cybersecurity technology and information management solutions, analytics and forensics,accreditation and testing services, and products that protect data, applications, and modern information technologyinfrastructures from advanced and persistent threats as well as mission support in the geospatial, intelligence analysis,technical operations, and linguistics domains. Major customers of Intelligence and Cybersecurity Solutions include nationaland military intelligence agencies, and other federal, civilian and commercial customers in the national security complex.
Corporate and Other includes the operations of the Company’s internal real estate management subsidiary, variouscorporate activities, certain corporate expense items that are not reimbursed by the Company’s U.S. Government customersand certain revenue and expense items excluded from the CODM’s evaluation of a reportable segment’s performance.
SAIC, Inc. Annual Report F-37

SAIC, INC.SCIENCE APPLICATIONS INTERNATIONAL CORPORATION
COMBINED NOTES TO CONSOLIDATED FINANCIAL STATEMENTS
The following tables summarize business segment information for each of the three years ended January 31, 2013:
Year Ended January 31
2013 2012 2011
(in millions)
Revenues:Defense Solutions $ 4,718 $ 4,191 $ 4,657Health, Energy and Civil Solutions 2,788 2,734 2,630Intelligence and Cybersecurity Solutions 3,672 3,574 3,460Corporate and Other — 2 58Intersegment elimination (5) (4) (7)
Total revenues $11,173 $10,497 $10,798
Operating income (loss):Defense Solutions $ 352 $ (171) $ 380Health, Energy and Civil Solutions 222 246 242Intelligence and Cybersecurity Solutions 264 279 292Corporate and Other (104) (55) 15
Total operating income $ 734 $ 299 $ 929
Amortization of intangible assets:Defense Solutions $ 2 $ 5 $ 7Health, Energy and Civil Solutions 32 24 16Intelligence and Cybersecurity Solutions 11 16 17
Total amortization of intangible assets $ 45 $ 45 $ 40
Asset information by segment is not a key measure of performance used by the CODM. Interest income, interest expenseand provision for income taxes, as reported in the consolidated financial statements, are not part of operating income andare primarily recorded at the corporate level. Under U.S. Government Cost Accounting Standards, indirect costs includingdepreciation expense are collected in numerous indirect cost pools which are then collectively allocated out to theCompany’s reportable segments based on a representative causal or beneficial relationship of the costs in the pool to thecosts in the base. While depreciation expense is a component of the allocated costs, the allocation process precludesdepreciation expense from being specifically identified by the Company’s individual reportable segments. For this reason,depreciation expense by reportable segment has not been reported above.
In preparation for the proposed separation transaction, effective February 1, 2013, the Company transferred certain businessoperations primarily focused on providing enterprise information technology services to federal civilian agencies of the U.S.Government from the Health, Engineering, and Civil Solutions segment to the Defense Solutions segment. The Companyalso transferred certain business operations primarily focused on providing command, control, communications, andcomputer solutions to the DoD from the Defense Solutions segment to the Intelligence and Cybersecurity Solutionssegment. As a result, the Company’s operating segments for fiscal 2014 will be reflective of this new business alignment, thesegment results will be recasted to reflect these changes in historical periods, and one of the Company’s operatingsegments will represent the entirety of the business that will be included in the separation transaction.
Substantially all of the Company’s revenues and tangible long-lived assets are generated by or owned by entities located inthe United States. As such, the financial information by geographic location is not presented.
The Company’s total revenues are largely attributable to prime contracts with the U.S. Government or to subcontracts withother contractors engaged in work for the U.S. Government. The percentages of total revenues for the U.S. Government, itsagencies and other customers comprising more than 10% of total revenues for each of the three years ended January 31,2013 were as follows:
Year Ended January 31
2013 2012 2011
U.S. Government 87% 93% 91%U.S. Army 28% 26% 23%U.S. Navy 13% 13% 13%
F-38 SAIC, Inc. Annual Report
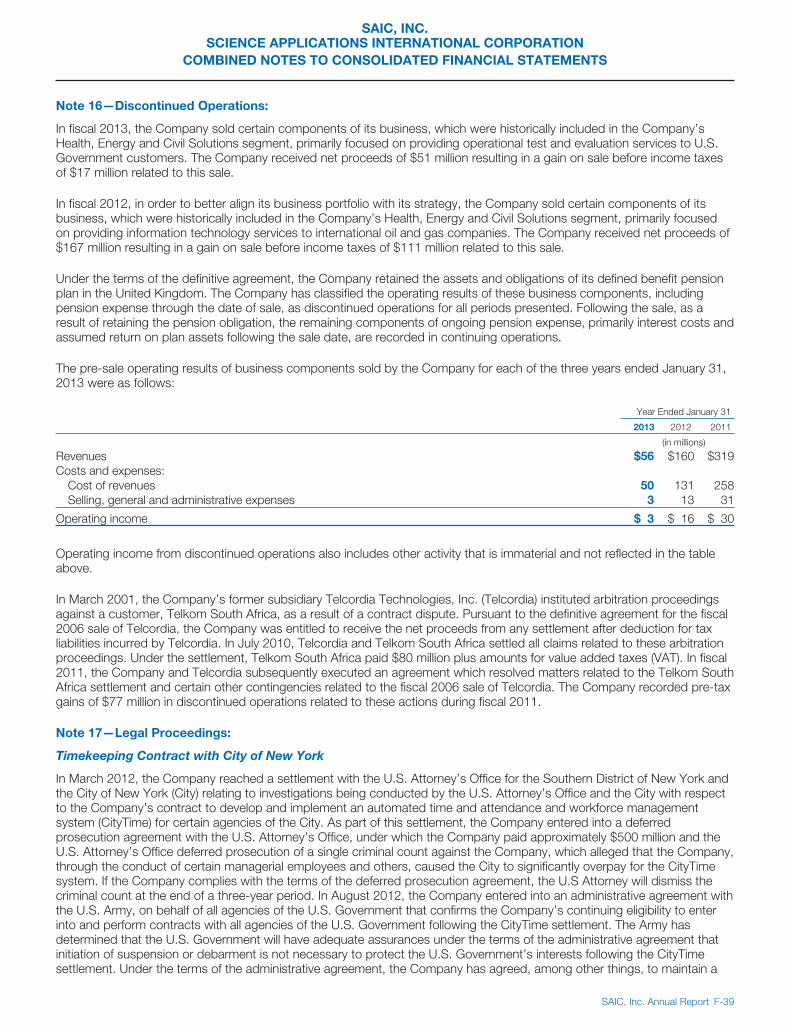
SAIC, INC.SCIENCE APPLICATIONS INTERNATIONAL CORPORATION
COMBINED NOTES TO CONSOLIDATED FINANCIAL STATEMENTS
Note 16—Discontinued Operations:
In fiscal 2013, the Company sold certain components of its business, which were historically included in the Company’sHealth, Energy and Civil Solutions segment, primarily focused on providing operational test and evaluation services to U.S.Government customers. The Company received net proceeds of $51 million resulting in a gain on sale before income taxesof $17 million related to this sale.
In fiscal 2012, in order to better align its business portfolio with its strategy, the Company sold certain components of itsbusiness, which were historically included in the Company’s Health, Energy and Civil Solutions segment, primarily focusedon providing information technology services to international oil and gas companies. The Company received net proceeds of$167 million resulting in a gain on sale before income taxes of $111 million related to this sale.
Under the terms of the definitive agreement, the Company retained the assets and obligations of its defined benefit pensionplan in the United Kingdom. The Company has classified the operating results of these business components, includingpension expense through the date of sale, as discontinued operations for all periods presented. Following the sale, as aresult of retaining the pension obligation, the remaining components of ongoing pension expense, primarily interest costs andassumed return on plan assets following the sale date, are recorded in continuing operations.
The pre-sale operating results of business components sold by the Company for each of the three years ended January 31,2013 were as follows:
Year Ended January 31
2013 2012 2011
(in millions)
Revenues $56 $160 $319Costs and expenses:
Cost of revenues 50 131 258Selling, general and administrative expenses 3 13 31
Operating income $ 3 $ 16 $ 30
Operating income from discontinued operations also includes other activity that is immaterial and not reflected in the tableabove.
In March 2001, the Company’s former subsidiary Telcordia Technologies, Inc. (Telcordia) instituted arbitration proceedingsagainst a customer, Telkom South Africa, as a result of a contract dispute. Pursuant to the definitive agreement for the fiscal2006 sale of Telcordia, the Company was entitled to receive the net proceeds from any settlement after deduction for taxliabilities incurred by Telcordia. In July 2010, Telcordia and Telkom South Africa settled all claims related to these arbitrationproceedings. Under the settlement, Telkom South Africa paid $80 million plus amounts for value added taxes (VAT). In fiscal2011, the Company and Telcordia subsequently executed an agreement which resolved matters related to the Telkom SouthAfrica settlement and certain other contingencies related to the fiscal 2006 sale of Telcordia. The Company recorded pre-taxgains of $77 million in discontinued operations related to these actions during fiscal 2011.
Note 17—Legal Proceedings:
Timekeeping Contract with City of New York
In March 2012, the Company reached a settlement with the U.S. Attorney’s Office for the Southern District of New York andthe City of New York (City) relating to investigations being conducted by the U.S. Attorney’s Office and the City with respectto the Company’s contract to develop and implement an automated time and attendance and workforce managementsystem (CityTime) for certain agencies of the City. As part of this settlement, the Company entered into a deferredprosecution agreement with the U.S. Attorney’s Office, under which the Company paid approximately $500 million and theU.S. Attorney’s Office deferred prosecution of a single criminal count against the Company, which alleged that the Company,through the conduct of certain managerial employees and others, caused the City to significantly overpay for the CityTimesystem. If the Company complies with the terms of the deferred prosecution agreement, the U.S Attorney will dismiss thecriminal count at the end of a three-year period. In August 2012, the Company entered into an administrative agreement withthe U.S. Army, on behalf of all agencies of the U.S. Government that confirms the Company’s continuing eligibility to enterinto and perform contracts with all agencies of the U.S. Government following the CityTime settlement. The Army hasdetermined that the U.S. Government will have adequate assurances under the terms of the administrative agreement thatinitiation of suspension or debarment is not necessary to protect the U.S. Government’s interests following the CityTimesettlement. Under the terms of the administrative agreement, the Company has agreed, among other things, to maintain a
SAIC, Inc. Annual Report F-39

SAIC, INC.SCIENCE APPLICATIONS INTERNATIONAL CORPORATION
COMBINED NOTES TO CONSOLIDATED FINANCIAL STATEMENTS
contractor responsibility program having the specific elements described in the administrative agreement, including retaininga monitor and providing certain reports to the U.S. Army. The administrative agreement will continue in effect for five years,provided that the Company may request earlier termination after three years.
Data Privacy Litigation
The Company is a defendant in a putative class action, In Re: Science Applications International Corporation (SAIC) BackupTape Data Theft Litigation, a Multidistrict Litigation (MDL), in the U.S. District Court for the District of Columbia. The MDLaction consolidates for pretrial proceedings the following seven individual putative class action lawsuits filed against theCompany from October 2011 through March 2012: (1) Richardson, et al. v. TRICARE Management Activity, ScienceApplications International Corporation, United States Department of Defense, et al. in U.S. District Court for the District ofColumbia; (2) Arellano, et al. v. SAIC, Inc. in U.S. District Court for the Western District of Texas; (3) Biggerman, et al. v.TRICARE Management Activity, Science Applications International Corporation, United States Department of Defense, et al.in U.S. District Court for the District of Columbia; (4) Moskowitz, et al. v. TRICARE Management Activity, ScienceApplications International Corporation, United States Department of Defense, et al. in U.S. District Court for the District ofColumbia; (5) Palmer, et al. v. TRICARE Management Activity, Science Applications International Corporation, United StatesDepartment of Defense, et al., in U.S. District Court for the District of Columbia; (6) Losack, et al. v. SAIC, Inc. in U.S. DistrictCourt for the Southern District of California; and (7) Deatrick v. Science Applications International Corporation in U.S. DistrictCourt for the Northern District of California. The lawsuits were filed following the theft of computer backup tapes from avehicle of a Company employee. The employee was transporting the backup tapes between federal facilities under an ITservices contract the Company was performing in support of TRICARE, the health care program for members of the military,retirees and their families. The tapes contained personally identifiable and protected health information of approximately fivemillion military clinic and hospital patients. There is no evidence that any of the data on the backup tapes has actually beenaccessed or viewed by an unauthorized person. In order for an unauthorized person to access or view the data on thebackup tapes, it would require knowledge of and access to specific hardware and software and knowledge of the systemand data structure. The Company has notified potentially impacted persons by letter and has offered one year of creditmonitoring services to those who request these services and in certain circumstances, one year of identity restorationservices.
In October 2012, plaintiffs filed a consolidated amended complaint in the MDL action, which supersedes all previously filedcomplaints in the individual lawsuits. The consolidated amended complaint includes allegations of negligence, breach ofcontract, breach of implied-in-fact contract, invasion of privacy by public disclosure of private facts and statutory violations ofthe Texas Deceptive Trade Practices Act, the California Confidentiality of Medical Information Act, California data breachnotification requirements, the California Unfair Competition Law, various state consumer protection or deceptive practicesstatutes, state privacy statutes, the Fair Credit Reporting Act and the Privacy Act of 1974. The consolidated amendedcomplaint seeks monetary relief, including unspecified actual damages, punitive damages, statutory damages of $1,000 foreach class member and attorneys’ fees, as well as injunctive and declaratory relief.
The Company intends to vigorously defend itself against the claims made in the class action lawsuits. In November 2012, theCompany filed a motion to dismiss all claims against the Company alleged in the consolidated amended complaint. Thecourt has not yet ruled on the Company’s motion. The Company has insurance coverage against judgments or settlementsrelating to the claims being brought in these lawsuits, with a $10 million deductible. The insurance coverage also covers theCompany’s defense costs, subject to the same deductible. As of January 31, 2013, the Company has recorded a lossprovision of $10 million related to these lawsuits, representing the low end of the Company’s estimated gross loss. TheCompany believes that, if any loss is experienced by the Company in excess of its estimate, such a loss would not exceedthe Company’s insurance coverage. As these lawsuits progress, many factors will affect the amount of the ultimate lossresulting from these claims being brought against the Company, including the outcome of any motions to dismiss, the resultsof any discovery, the outcome of any pretrial motions and the courts’ rulings on certain legal issues.
The Company has been informed that the Office for Civil Rights (OCR) of the Department of Health and Human Services(HHS) is investigating matters related to the incident. OCR is the division of HHS charged with enforcement of the HealthInsurance Portability and Accountability Act of 1996, as amended (HIPAA) and the privacy, security and data breach ruleswhich implement HIPAA. OCR may, among other things, require a corrective action plan and impose civil monetary penaltiesagainst the data owner (Department of Defense) and, in certain situations, against the data owners’ contractors, such as theCompany. The Company is cooperating with TRICARE in responding to the OCR investigation.
Derivative and Securities Litigation
Between February and April 2012, six stockholder derivative lawsuits were filed, each purportedly on the Company’s behalf.Two cases have been withdrawn and the four remaining cases were consolidated in the U.S. District Court for the Southern
F-40 SAIC, Inc. Annual Report

SAIC, INC.SCIENCE APPLICATIONS INTERNATIONAL CORPORATION
COMBINED NOTES TO CONSOLIDATED FINANCIAL STATEMENTS
District of New York in In re SAIC, Inc. Derivative Litigation. The consolidated derivative complaint asserts claims against theCompany’s directors and against varying groups of the Company’s current and former officers, including the chief executiveofficer, two former chief executive officers, the chief financial officer, a former group president, the former program managerof the CityTime program, and the former chief systems engineer of the CityTime program. The consolidated derivativecomplaint claims that the defendants breached their fiduciary duties to the Company with respect to the CityTime contractfor various reasons, including failure to supervise the adequacy of the Company’s internal controls, allowing the Company toissue misleading financial statements, and failure to exercise their oversight responsibilities to ensure that the Companycomplied with applicable laws, rules and regulations. The complaint further claims that the defendants are liable to theCompany under theories of unjust enrichment, gross mismanagement, abuse of control, and violation of Section 14(a) of theSecurities Exchange Act. The Company has filed a motion to dismiss the consolidated complaint because the respectiveplaintiffs did not serve a pre-suit demand before filing the derivative complaints. The Company has also received twostockholder demand letters related to CityTime (one of which is also related to the TRICARE matter described above), whichan independent committee of the Company’s board of directors reviewed. The Company’s lead director has notified bothstockholders’ attorneys, on behalf of the board of directors, that the Company has decided not to pursue the claims outlinedin their demand letters.
Between February and April 2012, alleged stockholders filed three putative securities class actions. One case was withdrawnand two cases were consolidated in the U.S. District Court for the Southern District of New York in In re SAIC, Inc. SecuritiesLitigation. The consolidated securities complaint names as defendants the Company, its chief financial officer, two formerchief executive officers, a former group president, and the former program manager on the CityTime program, and was filedpurportedly on behalf of all purchasers of SAIC’s common stock from April 11, 2007 through September 1, 2011. Theconsolidated securities complaint asserts claims under Sections 10(b) and 20(a) of the Securities Exchange Act of 1934based on allegations that the Company and individual defendants made misleading statements or omissions about theCompany’s revenues, operating income, and internal controls in connection with disclosures relating to the CityTime project.The plaintiffs seek to recover from the Company and the individual defendants an unspecified amount of damages classmembers allegedly incurred by buying SAIC’s stock at an inflated price. The Company intends to vigorously defend againstthese claims and has filed a motion to dismiss the consolidated securities complaint.
The Company currently believes that a loss relating to the above-described stockholder matters is reasonably possible, butthe Company cannot reasonably estimate the range of loss in light of the fact that these matters are in their early stages.
Greek Government Contract
In May 2003, the Company entered into a firm-fixed-price contract with the Hellenic Republic of Greece (the Customer) toprovide a Command, Control, Communications, Coordination and Integration System (the System) to support the 2004Athens Summer Olympic Games (the Olympics) and to serve as the security system for the Customer’s public orderdepartments following completion of the Olympics.
In November 2008, the Customer accepted the System in writing pursuant to the requirements of the contract. At the time,the Customer determined that the System substantially complied with the terms of the contract and accepted the Systemwith certain alleged minor omissions and deviations. Upon System acceptance, the Company invoiced the Customer forapproximately $19 million, representing the undisputed portion of the contract balance owed to the Company. The Customerhas not paid this final invoice.
In June 2009, the Company initiated arbitration before the International Chamber of Commerce against the Customerseeking damages for breaches of contract by the Customer. The Company seeks (i) aggregate damages in excess of$94 million for payment of amounts owed and other claims and damages, (ii) recovery of advance payment and performancebond amounts totaling $26 million and (iii) costs and expenses associated with the arbitration. The Customer filed an answerto the complaint denying liability on various grounds and a supplementary answer asserting set-off claims against amountssought by the Company. The arbitration hearing was held in May 2012, and the Company filed a final brief in July 2012. Dueto the complex nature of the legal and factual issues involved, the outcome of the arbitration is uncertain.
As a result of the significant uncertainties on this contract, the Company converted to the completed-contract method ofaccounting and ceased recognizing revenues for the System development portion of this contract in fiscal 2006. No profitsor losses were recorded on the Greek contract during the fiscal years ended January 31, 2013, 2012 and 2011. As ofJanuary 31, 2013, the Company has recorded $123 million of losses under the Greek contract, reflecting the Company’sestimated total cost to complete the System, assuming the Greek contract value was limited to the cash received to date.Based on the complex nature of this contractual situation and the difficulties encountered to date, significant uncertaintiesexist and the Company is unable to reliably estimate the ultimate outcome. The Company may reverse a portion of the lossesfrom the Greek contract if it receives future payments as required under the modified Greek contract.
SAIC, Inc. Annual Report F-41

SAIC, INC.SCIENCE APPLICATIONS INTERNATIONAL CORPORATION
COMBINED NOTES TO CONSOLIDATED FINANCIAL STATEMENTS
As of January 31, 2013, the Company has $16 million of receivables relating to value added tax (VAT) that the Company haspaid and believes it is entitled to recover either as a refund from the taxing authorities or as a payment under the Greekcontract. The Company has invoiced the Customer for $34 million for VAT and the Customer has failed to make payment. Ifthe Customer fails to pay the outstanding VAT amounts or the Company is unable to recover the amount as a refund fromthe taxing authorities, the Company’s total losses on the Greek contract could increase.
The Company has met certain advance payment and performance bonding requirements through the issuance of euro-denominated standby letters of credit. As of January 31, 2013, there were $3 million in standby letters of credit outstandingrelating to the support and maintenance of the System. The Company is seeking recovery of amounts drawn by theCustomer in fiscal 2011 on the standby letters of credit in the ongoing arbitration. The principal subcontractor has providedto the Company euro-denominated standby letters of credit in the amount of $23 million as of January 31, 2013, of which$20 million relates to the delivery of the System. The Company may draw on the subcontractor’s standby letters of creditunder certain circumstances by providing a statement to the responsible bank that the subcontractor has not fulfilled itsobligations under the subcontract.
Nuclear Regulatory Commission
The U.S. Department of Justice filed a lawsuit against the Company in September 2004 in U.S. District Court for the Districtof Columbia alleging civil False Claims Act violations and breach of contract by the Company on two contracts that theCompany had with the Nuclear Regulatory Commission (NRC). The complaint alleges that the Company’s performance ofseveral subcontracts on separate U.S. Department of Energy (DOE) programs, the participation of a Company employee inan industry trade association, and certain other alleged relationships created organizational conflicts of interest under the twoNRC contracts. The Company disputes that the work performed on the DOE programs and the alleged relationships raisedby the government created organizational conflicts of interest. In July 2008, the jury found in favor of the government on thebreach of contract and two False Claims Act counts. The jury awarded a nominal amount of $78 in damages for breach ofcontract and $2 million in damages for the False Claims Act claims. The judge entered the judgment in October 2008,trebling the False Claims Act damages and awarding a total of $585,000 in civil penalties. The Company appealed to theU.S. Court of Appeals for the District of Columbia Circuit. In December 2010, the Court of Appeals affirmed the DistrictCourt’s judgment as to both liability and damages of $78 on the breach of contract count and rescinded the judgment onthe False Claims Act counts, including the aggregate damages and penalties. The Court of Appeals sent the False ClaimsAct counts back to the District Court for further proceedings. The Company has recorded a liability for an immaterial amountrelated to this matter as of January 31, 2013 based on its assessment of the likely outcome of this matter.
Other
The Company is also involved in various claims and lawsuits arising in the normal conduct of its business, none of which, inthe opinion of the Company’s management, based upon current information, will likely have a material adverse effect on theCompany’s consolidated financial position, results of operations or cash flows.
Note 18—Other Commitments and Contingencies:
VirnetX, Inc.
In fiscal 2007, the Company transferred several patents to VirnetX Inc., a subsidiary of VirnetX Holding Corp. In considerationof this transfer, the Company received certain license rights and the right to receive a percentage of the considerationreceived in patent infringement or enforcement claims against third parties. In November 2012, a jury found that AppleCorporation infringed two of the patents that the Company previously transferred to VirnetX and awarded approximately$368 million to VirnetX. Under its agreements with VirnetX, the Company would receive 25% of the proceeds obtained byVirnetX in this lawsuit against Apple after reduction for attorneys’ fees and costs incurred in litigating those claims. InFebruary 2013, the judge entered judgment against Apple consistent with the jury verdict; however, the judgment may beappealed. Therefore, no assurances can be given when or if the Company will receive any proceeds in connection with thisjury award. In addition, if the Company receives any proceeds under its agreements with VirnetX, the Company is required topay a royalty on the proceeds received to the customer who paid for the development of the technology. The Companydoes not have any assets or liabilities recorded in connection with this matter as of January 31, 2013.
Government Investigations and Reviews
The Company is routinely subject to investigations and reviews relating to compliance with various laws and regulations withrespect to its role as a contractor to federal, state and local government customers and in connection with performingservices in countries outside of the United States. The Company is in discussions with the government on variousinvestigations and reviews, including investigations arising under the Civil False Claims Act. As of January 31, 2013, theCompany had recorded loss provisions aggregating approximately $15 million relating to such matters. We believe that the
F-42 SAIC, Inc. Annual Report

SAIC, INC.SCIENCE APPLICATIONS INTERNATIONAL CORPORATION
COMBINED NOTES TO CONSOLIDATED FINANCIAL STATEMENTS
probability is remote that the outcome of any current investigation will have a material adverse effect on the Company as awhole, notwithstanding that the unfavorable resolution of any matter may have a material impact on our net income in anyparticular reporting period.
U.S. Government agencies, including the Defense Contract Audit Agency (DCAA), Defense Contract Management Agency(DCMA) and others, routinely audit and review a contractor’s performance on government contracts, indirect rates andpricing practices, and compliance with applicable contracting and procurement laws, regulations and standards. They alsoreview the adequacy of the contractor’s compliance with government standards for its business systems, including: acontractor’s accounting system, earned value management system, estimating system, materials management andaccounting system, property management system and purchasing system. Both contractors and the U.S. Governmentagencies conducting these audits and reviews have come under increased scrutiny. As a result, audits and reviews havebecome more rigorous and the standards to which the Company is held are being more strictly interpreted, increasing thelikelihood of an audit or review resulting in an adverse outcome. During the course of its current audits, the DCAA is closelyexamining and questioning several of the Company’s long established and disclosed practices that it had previously auditedand accepted, increasing the uncertainty as to the ultimate conclusion that will be reached.
The Company changed its indirect rate structure used in its indirect cost system and its direct labor bid structure used for itsestimating system for fiscal 2011 and future years. The DCAA is performing reviews of these changes and the Company’scompliance with certain other U.S. Government Cost Accounting Standards. A finding of significant control deficiencies inthe Company’s system audits or other reviews can result in decremented billing rates to its U.S. Government customers untilthe control deficiencies are corrected and their remediation is accepted by the DCMA.
The Company’s indirect cost audits by the DCAA have not been completed for fiscal 2006 and subsequent fiscal years.Although the Company has recorded contract revenues subsequent to fiscal 2005 based upon an estimate of costs that theCompany believes will be approved upon final audit or review, the Company does not know the outcome of any ongoing orfuture audits or reviews and adjustments, and if future adjustments exceed the Company’s estimates, its profitability wouldbe adversely affected. As of January 31, 2013, the Company has recorded a liability of $37 million for its current bestestimate of net amounts to be refunded to customers for potential adjustments from such audits or reviews of contractcosts.
DS&S Joint Venture
In March 2006, the Company sold its interest in DS&S, a joint venture in which the Company owned a 50% interest. As partof the sale, the Company agreed to indemnify the purchaser or DS&S for certain legal costs and expenses, including thoserelated to a government investigation involving DS&S and any litigation resulting from that investigation. The Company haddeferred the potential gain on this sale pending resolution of the government investigation involving DS&S. This matter wasresolved in fiscal 2013 and the Company recorded a gain of $4 million in other income, net, and paid DS&S $4 million insatisfaction of its indemnification obligation.
Other Joint Ventures
The Company has a guarantee that relates only to claims brought by the sole customer of its joint venture, Bechtel SAICCompany, LLC, for specific contractual nonperformance of the joint venture. The Company also has a cross-indemnityagreement with the joint venture partner, pursuant to which the Company will only be ultimately responsible for the portion ofany losses incurred under the guarantee equal to its ownership interest of 30%. As of January 31, 2013, the joint venturehad completed performance requirements on the customer contract and was in the process of completing contract close-out activities. Based on current conditions, the Company believes the likelihood of having to make any future paymentrelated to the guarantee is remote.
In conjunction with a contract award to one of the Company’s joint ventures, Research and Development Solutions, LLC(RDS), each of the three joint venture partners were required to sign a performance guarantee agreement with the U.S.Government. Under this agreement, the Company unconditionally guarantees all of RDS’s obligations to the U.S.Government under the contract award. The Company also has a cross-indemnity agreement with each of the other two jointventure partners to protect it from liabilities for any U.S. Government claims resulting from the actions of the other two jointventure partners and to limit the Company’s liability to its share of the contract work. As of January 31, 2013, the jointventure had completed performance requirements on the customer contract and was in the process of completing contract
SAIC, Inc. Annual Report F-43
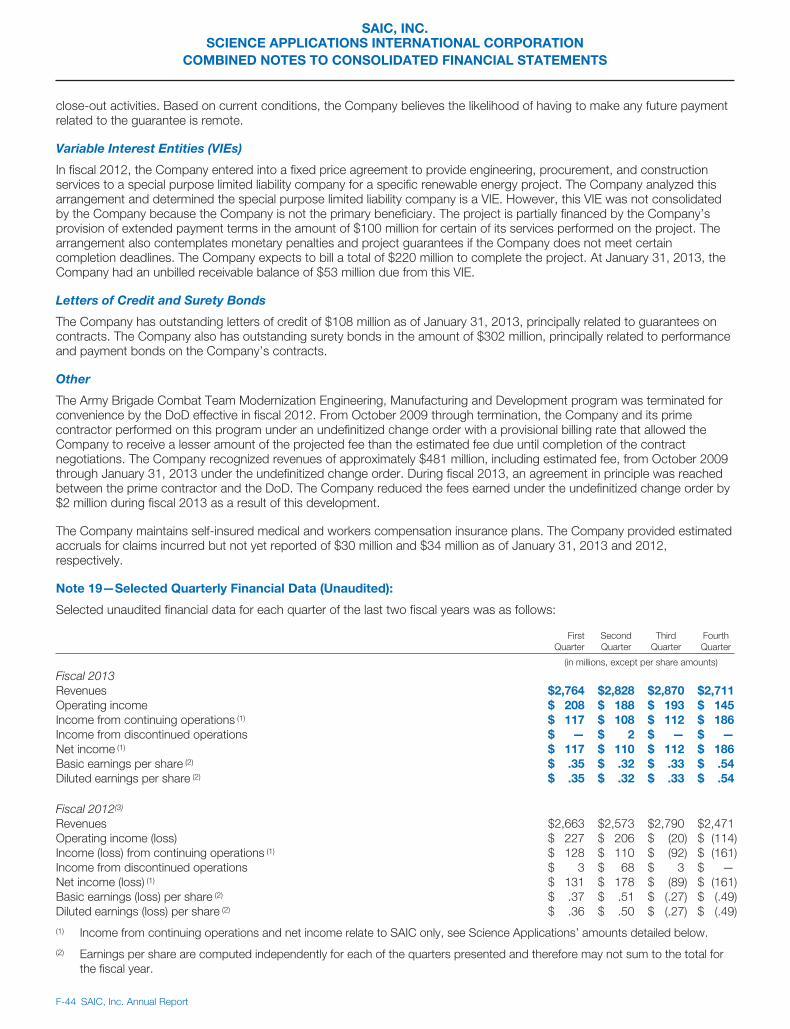
SAIC, INC.SCIENCE APPLICATIONS INTERNATIONAL CORPORATION
COMBINED NOTES TO CONSOLIDATED FINANCIAL STATEMENTS
close-out activities. Based on current conditions, the Company believes the likelihood of having to make any future paymentrelated to the guarantee is remote.
Variable Interest Entities (VIEs)
In fiscal 2012, the Company entered into a fixed price agreement to provide engineering, procurement, and constructionservices to a special purpose limited liability company for a specific renewable energy project. The Company analyzed thisarrangement and determined the special purpose limited liability company is a VIE. However, this VIE was not consolidatedby the Company because the Company is not the primary beneficiary. The project is partially financed by the Company’sprovision of extended payment terms in the amount of $100 million for certain of its services performed on the project. Thearrangement also contemplates monetary penalties and project guarantees if the Company does not meet certaincompletion deadlines. The Company expects to bill a total of $220 million to complete the project. At January 31, 2013, theCompany had an unbilled receivable balance of $53 million due from this VIE.
Letters of Credit and Surety Bonds
The Company has outstanding letters of credit of $108 million as of January 31, 2013, principally related to guarantees oncontracts. The Company also has outstanding surety bonds in the amount of $302 million, principally related to performanceand payment bonds on the Company’s contracts.
Other
The Army Brigade Combat Team Modernization Engineering, Manufacturing and Development program was terminated forconvenience by the DoD effective in fiscal 2012. From October 2009 through termination, the Company and its primecontractor performed on this program under an undefinitized change order with a provisional billing rate that allowed theCompany to receive a lesser amount of the projected fee than the estimated fee due until completion of the contractnegotiations. The Company recognized revenues of approximately $481 million, including estimated fee, from October 2009through January 31, 2013 under the undefinitized change order. During fiscal 2013, an agreement in principle was reachedbetween the prime contractor and the DoD. The Company reduced the fees earned under the undefinitized change order by$2 million during fiscal 2013 as a result of this development.
The Company maintains self-insured medical and workers compensation insurance plans. The Company provided estimatedaccruals for claims incurred but not yet reported of $30 million and $34 million as of January 31, 2013 and 2012,respectively.
Note 19—Selected Quarterly Financial Data (Unaudited):
Selected unaudited financial data for each quarter of the last two fiscal years was as follows:
FirstQuarter
SecondQuarter
ThirdQuarter
FourthQuarter
(in millions, except per share amounts)
Fiscal 2013Revenues $2,764 $2,828 $2,870 $2,711Operating income $ 208 $ 188 $ 193 $ 145Income from continuing operations (1) $ 117 $ 108 $ 112 $ 186Income from discontinued operations $ — $ 2 $ — $ —Net income (1) $ 117 $ 110 $ 112 $ 186Basic earnings per share (2) $ .35 $ .32 $ .33 $ .54Diluted earnings per share (2) $ .35 $ .32 $ .33 $ .54
Fiscal 2012(3)
Revenues $2,663 $2,573 $2,790 $2,471Operating income (loss) $ 227 $ 206 $ (20) $ (114)Income (loss) from continuing operations (1) $ 128 $ 110 $ (92) $ (161)Income from discontinued operations $ 3 $ 68 $ 3 $ —Net income (loss) (1) $ 131 $ 178 $ (89) $ (161)Basic earnings (loss) per share (2) $ .37 $ .51 $ (.27) $ (.49)Diluted earnings (loss) per share (2) $ .36 $ .50 $ (.27) $ (.49)
(1) Income from continuing operations and net income relate to SAIC only, see Science Applications’ amounts detailed below.
(2) Earnings per share are computed independently for each of the quarters presented and therefore may not sum to the total forthe fiscal year.
F-44 SAIC, Inc. Annual Report

SAIC, INC.SCIENCE APPLICATIONS INTERNATIONAL CORPORATION
COMBINED NOTES TO CONSOLIDATED FINANCIAL STATEMENTS
Science Applications:
Income from continuing operations and net income of Science Applications includes interest expense on the related partynote and associated income taxes, which relate solely to Science Applications and are not reflected in the consolidatedamounts above. Income from continuing operations and net income of Science Applications for each quarter of the last twofiscal years was as follows:
FirstQuarter
SecondQuarter
ThirdQuarter
FourthQuarter
(in millions)
Fiscal 2013Income from continuing operations $117 $108 $112 $ 187Net income $117 $110 $112 $ 187
Fiscal 2012(3)
Income (loss) from continuing operations $127 $110 $ (94) $(161)Net income (loss) $130 $178 $ (91) $(161)
(3) Includes loss provisions of $232 million and $308 million recorded in the third quarter and fourth quarter, respectively, inconnection with resolution of the CityTime matter described in Note 17.
Note 20—Subsequent Event:
In March 2013, SAIC’s Board of Directors declared a special cash dividend of $1.00 per share of SAIC common stockpayable on June 28, 2013 to stockholders of record on June 14, 2013.
SAIC, Inc. Annual Report F-45

[THIS PAGE INTENTIONALLY LEFT BLANK]

[THIS PAGE INTENTIONALLY LEFT BLANK]

Corporate HeadquartersSAIC, Inc.1710 SAIC Drive McLean, VA 22102703.676.4300Web site: saic.com
Stock ListingSAIC, Inc., common stock is traded on the New York Stock Exchange (NYSE) under the trading symbol SAI.
Transfer Agent and RegistrarComputershare480 Washington Blvd. Jersey City, NJ 07310866.400.SAIC (U.S.)201.680.6625 (International)Web site: www.computershare.com/us
Independent Registered Public Accounting FirmDeloitte & Touche LLP1750 Tysons Blvd. McLean, VA 22102
Annual MeetingSAIC, Inc.’s 2013 Annual Meeting of Stockholders is scheduled to be held on June 7, 2013, in the SAIC Conference Center, 1710 SAIC Drive, McLean, VA. The meeting will also be audio webcast on our web site (saic.com).
CertificationsThe CEO/CFO certifications required to be filed with the Securities and Exchange Commission pursuant to Section 302 of the Sarbanes-Oxley Act are included as Exhibits 31.1 and 31.2 on our Annual Report on Form 10-K. In addition, an annual CEO certification was submitted by the company’s CEO to the NYSE on July 10, 2012, in accordance with the NYSE’s listing standards.
Investor RelationsQuestions from stockholders, analysts, and others can be directed to:Paul E. Levi Senior Vice President, Investor RelationsSAIC1710 SAIC Drive McLean, VA [email protected] site: investors.saic.com
© Science Applications International Corporation. All rights reserved. The SAIC logo is a registered trademark of Science Applications International Corporation in the United States and/or other countries.Printed on recycled paper.
Stockholder Information

A.Thomas YoungFormer Executive Vice President,Lockheed Martin Corporation
France A. CórdovaPresident Emerita,Purdue University
John P. JumperChairman of the Board,President and Chief Executive Officer
Thomas F. Frist, IIIPrincipal,Frist Capital LLC
Lawrence C. NussdorfLead Director, President and Chief Operating Officer, Clark Enterprises, Inc.
Miriam E. JohnFormer Vice President,Sandia National Laboratories
Jere A. DrummondFormer Vice Chairman,BellSouth Corporation
Harry M.J. Kraemer, Jr.Executive Partner, Madison Dearborn Partners, LLC
John J. HamreChief Executive Officer and President,Center for Strategic &International Studies
Edward J. Sanderson, Jr.Former Executive Vice President, Oracle Corporation
Anita K. JonesUniversity Professor Emerita,University of Virginia
Directors

Fiscal Year 2013 annual report on Form 10-KS C I E N C E A P P L I C A T I O N S I N T E R N A T I O N A L C O R P O R A T I O N