Embed Size (px)
Citation preview

Science and Technology Competitiveness Rankings
of the Philippines(2012 – 2018)
Department of Science and Technology
November 2017
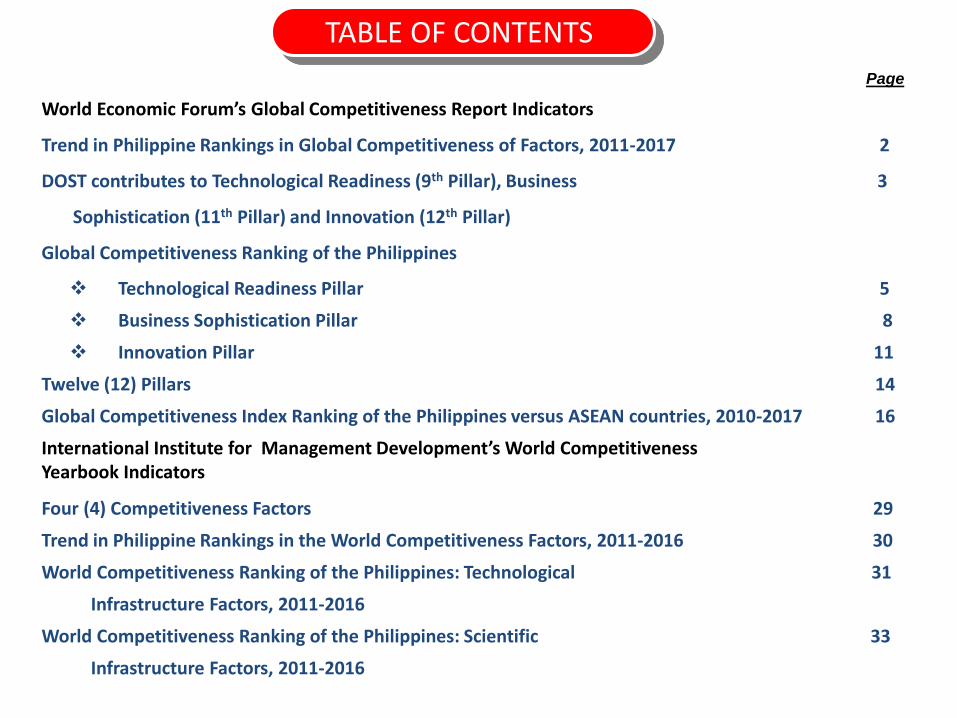
TABLE OF CONTENTS
World Economic Forum’s Global Competitiveness Report Indicators
Trend in Philippine Rankings in Global Competitiveness of Factors, 2011-2017 2
DOST contributes to Technological Readiness (9th Pillar), Business 3
Sophistication (11th Pillar) and Innovation (12th Pillar)
Global Competitiveness Ranking of the Philippines
Technological Readiness Pillar 5
Business Sophistication Pillar 8
Innovation Pillar 11
Twelve (12) Pillars 14
Global Competitiveness Index Ranking of the Philippines versus ASEAN countries, 2010-2017 16
International Institute for Management Development’s World Competitiveness Yearbook Indicators
Four (4) Competitiveness Factors 29
Trend in Philippine Rankings in the World Competitiveness Factors, 2011-2016 30
World Competitiveness Ranking of the Philippines: Technological 31
Infrastructure Factors, 2011-2016
World Competitiveness Ranking of the Philippines: Scientific 33
Infrastructure Factors, 2011-2016
Page

TABLE OF CONTENTS
World Economic Forum’s Global Competitiveness Report Indicators
Trend in Philippine Rankings in Global Competitiveness of Factors, 2011-2017
DOST contributes to Technological Readiness (9th Pillar), Business
Sophistication (11th Pillar) and Innovation (12th Pillar)
Global Competitiveness Ranking of the Philippines
Technological Readiness Pillar
Business Sophistication Pillar
Innovation Pillar
Twelve (12) Pillars
Global Competitiveness Index Ranking of the Philippines versus ASEAN countries, 2010-2017
International Institute for Management Development’s World Competitiveness Yearbook Indicators
Four (4) Competitiveness Factors
Trend in Philippine Rankings in the World Competitiveness Factors, 2011-2016
World Competitiveness Ranking of the Philippines: Technological
Infrastructure Factors, 2011-2016
World Competitiveness Ranking of the Philippines: Scientific
Infrastructure Factors, 2011-2016

World Economic Forum’sGlobal Competitiveness Report Indicators
1

Trend in Philippine Rankings in Global Competitiveness Factors, 2012-2018
Factor 2012-2013 2013-2014 2014-2015 2015-2016 2016-2017 2017-2018
Global Competitiveness Index Rank 65 59 52 47 57 56
1. Basic requirements 80 78 66 66 65 67
(a) Institutions 94 79 67 77 91 94
(b) Infrastructure 98 96 91 90 95 97(c) Macroeconomic
Environment36 40 26 24 20 22
(d) Health & primary education 98 96 92 86 81 82
2. Efficiency enhancers 61 58 58 51 58 61
(a) Higher education & training 64 67 64 63 58 55
(b) Goods Market efficiency 86 82 70 80 99 103
(c) Labor Market efficiency 103 100 91 82 86 84(d) Financial Market
Development 58 48 49 48 48 52
(d) Technological Readiness 79 77 69 68 83 83
(e) Market size 35 33 35 30 31 27
3. Innovation factors 64 58 48 47 53 61
(a) Business sophistication 49 49 46 42 52 58
(b) Innovation 94 69 52 48 62 65
Source: Global Competitiveness Report, World Economic Forum, 2012-2013, 2013-2014, 2014-2015, 2015-2016, 2016-2017, 2017-2018
2

DOST contributes to:
Technological Readiness (9thPillar),
Business Sophistication (11th Pillar)
and Innovation (12th Pillar)
3

Three of the 12 pillars relate to S&T, namely: Technological Readiness (9th pillar) underEfficiency Enhancers; the Business Sophistication (11th pillar) and Innovation (12th pillar) underInnovation and Sophistication Factors.
The Technological Readiness pillar is composed of 7 indicators, three of which are opinionsurvey questions (on availability of latest technologies, firm-level technology absorption, andFDI and technology transfer) among respondent CEOs whose perceptions determine thecountry’s ranking.
The other four indicators are on actual data on ICT (number of internet users, number of fixedbroadband subscribers, size of internet bandwidth, and number of mobile broadbandsubscribers) that are sourced from the “World Telecommunication ICT Indicators” beingcollated and published annually by the International Telecommunication Union (ITU).
The Business Sophistication pillar is composed of 9 indicators that are all based on opinionsurvey questions (on local supplier quantity, local supplier quality, state of clusterdevelopment, nature of competitive advantage, value chain breadth, control of internationaldistribution, production process sophistication, extent of marketing, and willingness todelegate authority) among respondent CEOs whose perceptions determine the country’sranking.
The Innovation pillar is composed of 7 indicators, all of which, except one, are based onperceptions of respondent CEOs when they rank the country on opinion survey questions (oncapacity for innovation, quality of scientific research institutions, company spending on R&D,university-industry collaboration, government procurement of advanced technology products,and availability of scientists and engineers).
4

1) Availability of latest technologies
56/144(5.2)
47/148(5.3)
58/144(5.1)
78/140(4.6)
77/138(4.5)
73/137(4.6)
TECHNOLOGICAL READINESS PILLAR, 2012-2018Indicator 2012-2013 2013-2014 2014-2015 2015-2016 2016-2017 2017-2018
Technological Readiness 79/144* 77/148* 69/144* 68/140* 83/138* 83/137*
Executive Opinion Survey with question asked: “To what extent are the latest technologies available in your country?”
Experts ranked 1 to 7 according to their perception on availability of technology giving a score of 1 as lowest to 7 as widely available
* Philippine rank over the number of countries
Source: Global Competitiveness Report, World Economic Forum, 2012-2013, 2013-2014, 2014-2015, 2015-2016, 2016-2017, 2017-2018
2) Firm-level technology absorption
46/144(5.2)
40/148(5.2)
41/144(5.1)
40/140(5.1)
54/138(4.7)
51/137(4.7)
Executive Opinion Survey with question asked: “To what extent do businesses in your country adopt new technology?”
Experts ranked the country from 1 to 7 with 1 as lowest or firm not absorbing technology to 7 as highest or aggressively absorbing technology
3) FDI and technology transfer
40/144(5.0)
42/148(4.9)
31/144(5.0)
42/140(4.8)
62/138(4.5)
63/137(4.5)
Executive Opinion Survey with question asked: “To what extent does foreign direct investment (FDI) bring new technology into your country?” (1–not at all; 7–to a great extent, FDI is a key source of new technology)
Experts ranked the country from 1 to 7 with 1 as lowest or no new technology to 7 as highest or a great extent of new technology
5

TECHNOLOGICAL READINESS PILLAR, 2012-2018Indicator 2012-2013 2013-2014 2014-2015 2015-2016 2016-2017 2017-2018
Technological Readiness 79/144* 77/148* 69/144* 68/140* 83/138* 83/137*
4) Internet Users 90/144(29.0)
87/148(36.2)
91/144(37.0)
89/140(39.7)
92/138(40.7)
74/137(55.5)
Data is about percentage of individuals using the internet (Internet user refers to people using the internet from any device including mobile phones in the last 12 months) National data are sourced from the International Telecommunication Union (ITU), World Bank Telecommunication / ICT Indicators
5) Broadband Internet Subscriptions
91/144(1.9)
97/148(2.2)
93/144(2.6)
37/140(23.2)
92/138(3.4)
87/137(5.5)
Data is about the number of fixed broadband Internet subscriptions per 100 population (This refers to total fixed (wired) broadband Internet subscriptions, that is, subscriptions to high-speed access to the public internet – a TCP/IP connection – at downstream speeds equal to or greater than 256 kb/s.) National data are sourced from the International Telecommunication Union (ITU), World Bank Telecommunication / ICT Indicators
* Philippine rank over the number of countries
Source: Global Competitiveness Report, World Economic Forum, 2012-2013, 2013-2014, 2014-2015, 2015-2016,2016-2017, 2017-2018
6) Internet bandwidth 75/144(12.4)
85/148(14.3)
46/144(57.6)
76/140(27.7)
72/138(37.4)
78/137(43.4)
Data is about the International Internet bandwidth (kb/s) per internet user (This refers to the sum of capacity of all internet exchanges offering international bandwidth measured in kilobits per second (kb/s)) National data are sourced from the International Telecommunication Union (ITU), World Bank Telecommunication / ICT Indicators
6

TECHNOLOGICAL READINESS PILLAR, 2012-2018Indicator 2012-2013 2013-2014 2014-2015 2015-2016 2016-2017 2017-2018
Technological Readiness 79/144* 77/148* 69/144* 68/140* 83/138* 83/137*
7) Mobile broadband subscriptions per 100 population
93/144(3.4)
104/148(3.8)
79/144(20.3)
92/140(28.0)
80/138(41.6)
89/137(46.3)
Data is about mobile broadband subscriptions per 100 population (This refers to active SIM cards or, on networks, connections accessing the Internet at consistent broadband speeds of over 512 kb/s, including cellular technologies; it also includes connections being used in any type of device able to access mobile broadband networks, including smartphones, USB modems, mobile hotspots and other mobile-broadband connected devices.) National data are sourced from the International Telecommunication Union (ITU), World Bank Telecommunication / ICT Indicators
* Philippine rank over the number of countries
Source: Global Competitiveness Report, World Economic Forum, 2012-2013, 2013-2014, 2014-2015, 2015-2016, 2016-2017, 2017-2018
7

BUSINESS SOPHISTICATION PILLAR, 2012-2018Indicator 2012-2013 2013-2014 2014-2015 2015-2016 2016-2017 2017-2018
Business Sophistication 49/144* 49/148* 46/144* 42/140* 52/138* 58/137*
1) Local supplier quantity 49/144(4.9)
54/148(4.8)
69/144(4.6)
64/140(4.6)
60/138(4.6)
49/137(4.7)
Executive Opinion Survey with question asked: “In your country, how numerous are local suppliers?” Experts ranked the country from 1 to 7 with 1 as lowest or non-existent local supplier and 7 as highest as
extremely numerous suppliers
2) Local supplier quality 68/144(4.5)
68/148(4.5)
65/144(4.4)
64/140(4.3)
74/138(4.2)
73/137(4.3)
Executive Opinion Survey with question asked: “In your country, how would you assess the quality of local suppliers?”
Experts ranked the country from 1 to 7 with 1 as lowest or extremely poor quality of local supplier and 7 as highest or extremely high quality of local suppliers
3) State of cluster development
38/144(4.1)
55/148(4.0)
51/144(4.0)
45/140(4.0)
66/138(3.7)
62/137(3.8)
Executive Opinion Survey with question asked: “In your country, how widespread are well-developed and deep clusters (geographic concentration of firms, suppliers, producers of related products and services, and specialized institutions in a particular field)?”
Experts ranked the country from 1 to 7 with 1 as lowest or non-existent of well-developed and deep clusters and 7 as highest or widespread in many fields
* Philippine rank over the number of countries
Source: Global Competitiveness Report, World Economic Forum, 2012-2013, 2013-2014, 2014-2015, 2015-2016, 2016-2017, 2017-20188

BUSINESS SOPHISTICATION PILLAR, 2012-2018Indicator 2012-2013 2013-2014 2014-2015 2015-2016 2016-2017 2017-2018
Business Sophistication 49/144* 49/148* 46/144* 42/140* 52/138* 58/137*
4) Nature of competitiveadvantage
58/144(3.6)
67/148(3.5)
77/144(3.4)
85/140(3.3)
83/138(3.2)
94/137(3.1)
Executive Opinion Survey with question asked: “What is the competitive advantage of your country’s companies in international markets based upon?”
Experts ranked the country from 1 to 7 with 1 as lowest or with low-cost labor or natural resources and 7 as highest or with unique products and processes
5) Value chain breadth 66/144(3.6)
60/148(3.8)
44/144(4.1)
39/140(4.2)
49/138(4.1)
53/137(4.0)
Executive Opinion Survey with question asked: “In your country, do companies have a narrow or broad presence in the value chain?”
Experts ranked the country from 1 to 7 with 1 as lowest or have companies w/ narrow, primarily involved in individual steps of the value chain [e.g. resource extraction or production]and 7 as highest or have companies w/ broad, present across the entire value chain [e.g. including production and marketing, distribution, design, etc.]
6) Control of international distribution
54/144(4.2)
41/148(4.3)
43/144(4.4)
44/140(4.1)
52/138(3.9)
60/137(3.8)
Executive Opinion Survey with question asked: “To what extent are international distribution and marketing from your country owned and controlled by domestic companies?”
Experts ranked the country from 1 to 7 with 1 as lowest or not at all – they take place through foreign companies and 7 as highest or to a great extent- they are primarily owned and controlled by domestic companies
* Philippine rank over the number of countries
Source: Global Competitiveness Report, World Economic Forum, 2012-2013, 2013-2014, 2014-2015, 2015-2016, 2016-2017, 2017-2018
9

BUSINESS SOPHISTICATION PILLAR, 2012-2018
Indicator 2012-2013 2013-2014 2014-2015 2015-2016 2016-2017 2017-2018
Business Sophistication 49/144* 49/148* 46/144* 42/140* 52/138* 58/137*
7) Production process sophistication
64/144(3.8)
57/148(4.0)
44/144(4.3)
50/140(4.1)
67/138(3.8)
80/137(3.6)
Executive Opinion Survey with question asked: “In your country, how sophisticated are production processes?” Experts ranked the country from 1 to 7 with 1 as lowest or not at all – labor intensive and 7 as highest or highly
technology and knowledge intensive
8) Extent of marketing 41/144(4.5)
41/148(4.6)
41/148(4.7)
31/140(4.8)
32/138(4.9)
36/137(4.8)
Executive Opinion Survey with question asked: “In your country, to what extent do companies use sophisticated marketing tools and techniques?”
Experts ranked the country from 1 to 7 with 1 as lowest or not at all use sophisticated marketing tools and techniques and 7 as highest or to a great extent use sophisticated tools and techniques
9) Willingness to delegate authority
27/144(4.5)
26/148(4.6)
24/148(4.7)
23/140(4.7)
23/138(4.7)
44/137(4.6)
Executive Opinion Survey with question asked: “In your country, how do you assess the willingness to delegate authority to subordinates?”
Experts ranked the country from 1 to 7 with 1 as lowest or not willing at all (senior management takes all important decisions) and 7 as highest or very willing (authority is most delegated to business unit heads & other lower level managers)
* Philippine rank over the number of countries
Source: Global Competitiveness Report, World Economic Forum, 2012-2013, 2013-2014, 2014-2015, 2015-2016, 2016-2017, 2017-201810

INNOVATION PILLAR, 2012-2018
Indicator 2012-2013 2013-2014 2014-2015 2015-2016 2016-2017 2017-2018
Innovation 94/144* 69/148* 52/144* 48/140* 62/138* 65/137*
1) Capacity for Innovation 86/144(2.9)
48/148 (3.8)
30/144 (4.5)
33/140 (4.6)
41/138 (4.4)
45/137 (4.5)
Executive Opinion Survey with question asked: “In your country, to what extent do companies have the capacity to innovate?”
Experts ranked the country from 1 to 7 with 1 as lowest or not all and 7 as the highest or to a great extent have the capacity to innovate
2) Quality of scientific research institutions
102/144(3.2)
91/148(3.4)
75/144(3.6)
69/140(3.7)
72/138(3.8)
75/137 (3.7)
Executive Opinion Survey with question asked: “In your country, how would you assess the quality of scientific research institutions?”
Experts ranked the country from 1 to 7 with 1 as lowest or extremely poor and 7 as highest or extremely good)
3) Company spending on R&D
58/144(3.2)
51/148(3.4)
42/144(3.5)
36/140(3.8)
44/138(3.7)
51/137 (3.5)
Executive Opinion Survey with question asked: “In your country, to what extent do companies spend on R&D?” Experts ranked the country from 1 to 7 with 1 as lowest or do not spend on R&D and 7 as highest or spend
heavily on R&D
* Philippine rank over the number of countries
Source: Global Competitiveness Report, World Economic Forum, 2012-2013, 2013-2014, 2014-2015, 2015-2016, 2016-2017, 2017-2018
11

INNOVATION PILLAR, 2012-2018
Indicator 2012-2013 2013-2014 2014-2015 2015-2016 2016-2017 2017-2018
Innovation 94/144* 69/148* 52/144* 48/140* 62/138* 65/137*
4) University-industry collaboration
79/144(3.5)
69/148(3.6)
55/144(3.8)
55/140(3.8)
61/138(3.5)
59/137(3.5)
Executive Opinion Survey with question asked: “In your country, to what extent do business and universities collaborate on R&D?”
Experts ranked the country from 1 to 7 with 1 as lowest or do not collaborate at all and 7 as highest or collaborate extensively
5) Government procurement of advanced technology products
107/144(3.1)
85/148(3.4)
53/144(3.7)
59/140(3.5)
74/138(3.1)
91/137(3.0)
Executive Opinion Survey with question asked: “In your country, to what extent do government purchasing decisions foster innovation?”
Experts ranked the country from 1 to 7 with 1 as lowest or no, not at all and 7 as highest or yes, to a great extent
6) Availability of scientists and engineers
91/144(3.7)
87/148(3.8)
71/144(4.0)
67/140(4.0)
78/138(3.8)
74/137(3.8)
Executive Opinion Survey with question asked: “In your country, to what extent are scientists and engineers available?”
Experts ranked the country from 1 to 7 with 1 as lowest or not at all and 7 as highest or widely available
* Philippine rank over the number of countries
Source: Global Competitiveness Report, World Economic Forum, 2012-2013, 2013-2014, 2014-2015 , 2015-2016, 2016-2017, 2017-2018
12

INNOVATION PILLAR, 2012-2018
Indicator 2012-2013 2013-2014 2014-2015 2015-2016 2016-2017 2017-2018
Innovation 94/144* 69/148* 48/144* 48/140* 62/138* 65/137*
7) PCT applications per million population
83/144(0.3)
84/148(0.3)
86/144(0.3)
85/140(0.3)
86/138(0.3)
83/137(0.4)
Data is about the number of PCT applications per million population (Sourced from WIPO and USPTO)
* Philippine rank over the number of countries
* * Utility patents per million population
Source: Global Competitiveness Report, World Economic Forum, 2012-2013 , 2013-2014, 2014-2015, 2015-2016, 2016-2017, 2017-2018
13

World Economic Forum’sGlobal Competitiveness Ranking
The WEF’s Global Competitiveness Index is measured based on the following 12 pillars organized into three subindexes, each critical to a particular stage of development:
A. Basic requirements
1. Institutions – is the first pillar determined by the legal and administrative framework within which individuals, firms, and governments interact to generate wealth.
2. Infrastructure – is the second pillar critical for ensuring the effective functioning of the economy, as it is an important factor determining the location of economic activity and the kinds of activities or sectors that can develop in a particular instance.
3. Macroeconomic environment – is the third pillar important for business and, therefore, is important for the overall competitiveness of a country.
4. Health and primary education – is the fourth pillar vital to a country’s competitiveness and productivity. This pillar takes into account the quantity and quality of the basic education received by the population, which is increasingly important in today’s economy. Basic education increases the efficiency of each individual worker.
B. Efficiency enhancers
5. Higher Education and Training – is the fifth pillar which is crucial for economies that want to move up the value chain beyond simple production processes and products.
14

6. Goods Market Efficiency – is the sixth pillar in which countries with efficient goods markets are well positioned to produce the right mix of products and services given their particular supply-and-demand conditions.
7. Labor Market Efficiency – is the seventh pillar which is critical for ensuring that workers are allocated to their most efficient use in the economy and provided with incentives to give their best effort in their jobs.
8. Financial Market Development – is the eight pillar in which an efficient financial sector allocates the resources saved by a nation’s citizens.
9. Technological Readiness – is the ninth pillar which measures the agility with which an economy adopts existing technologies to enhance the productivity of its industries, with specific emphasis on its capacity to fully leverage information and communication technologies (ICT) in daily activities and production processes for increased efficiency and competitiveness.
10. Market size – is the tenth pillar which affects productivity since large markets allow firms to exploit economies of scale.
C. Innovation and Sophistication factors
11. Business Sophistication – is the eleventh pillar which is conducive to higher efficiency in the production of goods and services. It concerns the quality of a country’s overall business networks and individual firms’ operations and strategies.
12. Innovation – is the final pillar which is important for economies as they approach the frontiers of knowledge and the possibility of integrating and adapting exogenous technologies tends to disappear.
15

Global Competitiveness Index Ranking
of the PHILIPPINES versus ASEAN Countries
(2011-2018)
16

METHODOLOGY
An Executive Opinion Survey was conducted yearly to complement the statistics being used from international, national and regional sources. Whereas the Hard Data shows how competitiveness is measured over a specific period of time, the Survey Data measures competitiveness as it is perceived.
The Executive Opinion Survey is sent to executives in top and middle management in all of the economies.
The survey responses reflect present and future perceptions of competitiveness by business executives who are dealing with international business situations.
Experts ranked the country from 1 to 7 with 1 as lowest and 7 as highest
17

2011 2014
TECHNOLOGICAL READINESS PILLAR RANKINGRANK
1
20
40
80
90
100
10
30
60
50
70
110
120
130
140
2012 20152013 2016
BRU
CAM
INDO
MA
SG
THAI
VIET
MYAN 150
BRU
BRU
BRU
CAM
CAM
CAM
CAM CAM
INDO
INDO
INDO INDO
INDO
LAO LAO
LAO
MA
MA MA
MA
MA
MYAN
MYAN
SG
SG SG SG
SG
THAI THAI
THAI
THAI
THAI
VIET
VIET
VIET
VIET
VIET
2017
PH 8379 77
83
6869
PH 83
18
BRU
MA
SG
THAI
INDO VIET
CAM
LAO
LAO

BUSINESS SOPHISTICATION PILLAR RANKINGRANK
1
20
40
80
90
100
10
30
60
50
70
110
120
130
140
2011 2012 2014 20152013 2016
INDO
MYAN 150
BRU
BRU
BRU
CAM
CAM
CAM
CAM
CAM
INDO
INDO INDO
INDO
LAO LAO
LAO
MA MA MA
MA MA
MYAN
MYAN
SG SG SG SG
SG
THAI THAI
THAI THAI
THAI
VIET
VIET
VIET
VIET
VIET
2017
42
4946
PH 57
52
CAM
BRU
INDO
LAO
MA SG
THAI
VIET
19
49PH 58
SG MA
INDO
THAI
BRU
LAO
VIET
CAM

PH 108
BRU
CAM
INDO
MA
SG
THAI
VIET
BRU CAM
INDO
MA
SG
THAI VIET
BRU
CAM
INDO
MA
SG
THAI VIET
LAO
MYAN
1
20
40
60
80
100
120
140
CAM
INDO
MA
SG
THAI
VIET
LAO
MYAN
CAM
INDO
MA
SG
THAI
VIET
LAO
MYAN
RANK
2011 2012 2014 20152013 2016
69
52
48
INNOVATION PILLAR RANKING
2017
PH 65
BRU
CAM
INDO
LAO
MA
SG
THAI
VIET
20
SG
MA
INDO
THAI
VIET
BRU
CAM
LAO
62
94

CAPACITY FOR INNOVATION
BRU
CAM
INDO
MA
SG
THAI
VIET
BRU
CAM
INDO
MA SG
THAI VIET
BRU
CAM
INDO
MA
SG
THAI
VIET
1
20
40
80
90
100
10
30
60
50
70
110
120
130
140
2011 2012 2014 20152013 2016
LAO
CAM
INDO
MA
SG
THAI
VIET
MYAN
BRU
CAM
INDO
MA
SG
THAI VIET
MYAN
LAO
CAM
INDO
MA
SG
THAI
VIET
MYAN
LAO
RANK
2017
LAO
CAM
INDO
MA
SG
THAI
VIET PH 80
95
86
48
3033
PH 41
BRU
21

COMPANY SPENDING ON R&DRANK
1
20
40
80
90
100
10
30
60
50
70
110
120
130
140
2011 2012 2014 20152013 2016
CAM
INDO
MA
SG
THAI
VIET
BRU
CAM
INDO
MA
SG
THAI
VIET
BRU
CAM
INDO
MA
SG
THAI VIET
BRU
CAM
INDO
MA
SG
THAI VIET
LAO
MYAN
CAM
INDO
MA SG
THAI
VIET
LAO
MYAN
LAO
MYAN
2017
VIET
PH 85
5851
42
36
PH 51
BRU
CAM
INDO
MA
LAO
THAI
SG
22
44
MA SG
INDO
THAI
VIET
BRU
CAM
LAO

QUALITY OF SCIENTIFIC RESEARCH INSTITUTIONSRANK
1
20
40
80
90
100
10
30
60
50
70
110
120
130
140
2011 2012 2014 20152013 2016
PH 106
69
CAM
INDO
MA
SG
THAI
VIET
BRU CAM
INDO
MA
SG
THAI
VIET
BRU
CAM
INDO
MA
SG
THAI
VIET
BRU
CAM
INDO
MA
SG
THAI
VIET
LAO
MYAN
MYAN
CAM
INDO
MA
SG
THAI
VIET
LAO
LAO
MYAN
150
75
102
91
2017
BRU
PH 75
LAO
INDO
CAM
MA
SG
THAI
VIET
23
72
MA
SG
INDO
THAI
BRU LAO
CAM
VIET

UNIVERSITY-INDUSTRY COLLABORATION
2011 2014
1
20
40
80
90
100
10
30
60
50
70
110
120
130
1502012 20152013 2016
RANK
140
PH 83
PH 59
CAM
INDO
SG
THAI
VIET
BRU
CAM
INDO
MA
SG
THAI
VIET
BRU
CAM
INDO
MA
SG
THAI
VIET
BRU
CAM
INDO
MA
SG
THAI
VIET
LAO
MYAN
CAM
INDO
MA
SG
THAI
VIET
LAO
MYAN
LAO
MA
MYAN
79
55
69
2017
55
CAM
INDO
SG
THAI
VIET
LAO
MA
BRU
24

International Institute for Management Development’s
World Competitiveness Yearbook Indicators
28

International Institute for Management Development’sWorld Competitiveness Yearbook Ranking
The IMD’s World Competitiveness Ranking are based on each of the following
competitiveness factors, each highlighting different facets of competitiveness:
A. Economic Performance - refers to macro-economic evaluation of the domestic economy: domestic economy, international trade, international investment,employment and prices.
B. Government Efficiency – refers to extent to which government policies are conducive to competitiveness: public finance, fiscal policy, institutional framework, businesslegislation and societal framework.
C. Business efficiency - extent to which the national environment encourages enterprises to perform in an innovative, profitable and responsible manner: productivity and efficiency, labor market, finance, management ractices and attitudes and values.
D. Infrastructure - extent to which basic, technological, scientific and human resourcesmeet the needs of business: basic infrastructure, Technological Infrastructure, ScientificInfrastructure, Health and Environment and Education.
29

Factor 2011a 2012b 2013c 2014d 2015e 2016f 2017g
Overall Rank 41 43 38 42 41 42 41
1. Economic Performance 29 42 31 37 34 38 26
2. Government Efficiency 37 32 31 40 36 36 37
3. Business Efficiency 31 26 19 27 26 24 28
4. Infrastructure 57 55 57 59 57 55 54
(a) Basic infrastructure 57 56 54 55 58 57 57(b) Technological
infrastructure 32 46 40 45 36 41 42(c) Scientific
infrastructure 58 58 59 59 58 55 57(d) Health &
Environment 50 50 51 52 55 54 49
(e) Education 57 57 59 59 60 59 59Source:
a World Competitiveness Yearbook, International Institute for Management Development, 2011, (59 countries included in ranking)
b World Competitiveness Yearbook, International Institute for Management Development, 2012, (59 countries included in ranking)
c World Competitiveness Yearbook, International Institute for Management Development, 2013, (60 countries included in ranking)
d World Competitiveness Yearbook, International Institute for Management Development, 2014, (60 countries included in ranking)
e World Competitiveness Yearbook, International Institute for Management Development, 2015, (61 countries included in ranking)
f World Competitiveness Yearbook, International Institute for Management Development, 2016, (61 countries included in ranking)
g World Competitiveness Yearbook, International Institute for Management Development, 2017, (63 countries included in ranking)
Trend in Philippine Rankings in the World Competitiveness Factors, 2011-2017
30

FactorRanking (Raw Score/Data)
2011 2012 2013 2014 2015 2016 2017
Technological Infrastructure 32/59* 46/59* 40/60* 45/60* 36/61* 41/61* 42/63*
1. No. of internet users 58/59(146)
58/59(166)
59/60(190)
59/60(233)
57/61(311)
57/61(372)
58/63(397)
* Philippine rank over the number of countries
Source: World Competitiveness Yearbook, International Institute for Management Development, 2011, 2012, 2013, 2014, 2015, 2016, 2017
World Competitiveness Ranking of the Philippines: Technological Infrastructure Factors, 2011-2017
Data used are the number of internet users per 1000 people
2. Fixed Broadband tariffs 22/59(21.55)
25/59(21.95)
28/60(23.06)
29/60(23.44)
30/61(23.44)
not available
not available
3. Broadband Subscribers 55/59(18.68)
56/59(18.65)
57/60(19.13)
57/60(22.61)
58/61(22.61)
56/61(65)
57/63(94)
Data used are the number of subscribers per 1000 inhabitants
4. Internet bandwidth speed 43/59(8.39)
46/59(10.72)
49/60(12.36)
49/60(12.36)
50/61(12.36)
57/61(3.2)
62/63(4.5)
Data used are the capacities that backbone operators provide to carry internet traffic. These are measured in bits per second (per Internet users).
Data used are the monthly fees (residential), US$
31

FactorRanking (Raw Score/Data)
2011 2012 2013 2014 2015 2016 2017
Technological Infrastructure 32/59* 46/59* 40/60* 45/60* 36/61* 41/61* 42/63*
5. Development and application of technology
40/59(5.76)
39/59(5.67)
38/60(5.95)
48/60(5.27)
43/61(5.41)
46/61(5.46)
53/63(5.29)
* Philippine rank over the number of countries
Source: World Competitiveness Yearbook, International Institute for Management Development, 2011, 2012, 2013, 2014, 2015, 2016, 2017
World Competitiveness Ranking of the Philippines: Technological Infrastructure Factors, 2011-2017
Executive Opinion Survey with question asked: “In your country, to what extent is the development and application of technology hindered/supported by the legal environment?”
Experts answered the question on a scale of 1-6, with the response 1 indicating a negative perception and 6 indicating the most positive perception
6. Funding for technological development
44/59(4.32)
47/59(4.10)
40/60(4.88)
58/60(3.48)
46/61(4.31)
49/61(4.39)
50/63(4.46)
Executive Opinion Survey with question asked: “In your country, to what extent is the funding for technological development is not readily/readily available?”
Experts answered the question on a scale of 1-6, with the response 1 indicating a negative perception and 6 indicating the most positive perception
7. Technological regulation (hinders/supports business development and innovation)
41/59(5.61)
44/59(5.36)
36/60(5.81)
50/60(4.95)
41/61(5.31)
49/61(5.15)
54/63(4.89)
Executive Opinion Survey with question asked: “In your country, to what extent is the technological regulation hinders/supports business development and innovation?”
Experts answered the question on a scale of 1-6, with the response 1 indicating a negative perception and 6 indicating the most positive perception
32

FactorRanking (Raw Score/Data)
2011 2012 2013 2014 2015 2016 2017
Scientific Infrastructure 58/59* 58/59* 59/60* 59/60* 58/61* 55/61* 57/63*
1. Total expenditure on R&D(US$ millions)
55/59(166)
57/59(166)
58/60(166)
58/60(166)
57/61(278)
54/61(375)
53/63(375)
World Competitiveness Ranking of the Philippines:Scientific Infrastructure Factors, 2011-2017
Data used are total expenditures on research and development in US million dollars
2. Total expenditure on R&D (as percentage of GDP)
56/59(0.10)
56/59(0.10)
58/60(0.10)
58/60(0.10)
60/61(0.12)
58/61(0.14)
59/63(0.14)
Data used are total expenditures on research and development as percentage of GDP
3. Total expenditure on R&D per capita (US$ per capita)
56/59(1.8)
56/59(1.8)
58/60(1.8)
58/60(1.8)
60/61(3.0)
58/61(3.8)
59/63(3.8)
Data used are total expenditures on research and development in US$ per capita
4. Business expenditure on R&D (US$ millions)
51/59(88)
50/59(95)
52/60(95)
53/60(95)
52/61(169)
56/61(134)
54/63(134)
Data used are total business expenditures on research and development in US million dollars
* Philippine rank over the number of countries
Source: World Competitiveness Yearbook, International Institute for Management Development, 2011, 2012, 2013, 2014, 2015, 2016, 2017
33

6. Total R&D personnel nationwide(full-time work equivalent, thousands)
42/59(17.1)
42/59(17.1)
43/60(17.1)
43/60(17.1)
41/61(19.2)
36/61(36.5)
36/63(36.5)
FactorRanking (Raw Score/Data)
2011 2012 2013 2014 2015 2016 2017
Scientific Infrastructure 58/59* 58/59* 59/60* 59/60* 58/61* 55/61* 57/63*
Data used are total number of R&D personnel nationwide in full-time work equivalent (thousands)
7. Total R&D personnel nationwide per capita (full-time work equivalent per 1000 people)
50/59(0.19)
51/59(0.19)
52/60(0.19)
52/60(0.19)
53/61(0.20)
54/61(0.37)
55/63(0.37)
Data used are total number of R&D personnel nationwide in full-time work equivalent per 1000 people
8. Total R&D personnel in business enterprise (full-time work equivalent, thousands)
41/59(6.6)
40/59(6.6)
41/60(6.6)
39/60(6.6)
37/61(9.0)
29/61(22.3)
29/63(22.3)
Data used are total number of R&D personnel in business enterprise in full-time work equivalent (thousands)
World Competitiveness Ranking of the Philippines:Scientific Infrastructure Factors, 2011-2017
5. Business expenditure on R&D 52/59(0.05)
52/59(0.05)
53/60(0.05)
55/60(0.05)
55/61(0.08)
56/61(0.05)
58/63(0.05)
Data used are total business expenditures on research and development as percentage of GDP
* Philippine rank over the number of countries
Source: World Competitiveness Yearbook, International Institute for Management Development, 2011, 2012, 2013, 2014, 2015, 2016, 2017
34

World Competitiveness Ranking of the Philippines:Scientific Infrastructure Factors, 2011-2017
Data used are percentages of total first university degrees in science and engineering
11. Scientific articles 55/59(195)
55/59(223)
55/60(223)
55/60(241)
55/61(241)
55/61(916)
56/63(916)
Data used are number of scientific articles published by the origin of author
9. Total R&D personnel in business per capita (full-time work equivalent per 1000 people)
50/59(0.07)
49/59(0.07)
51/60(0.07)
51/60(0.07)
53/61(0.10)
52/61(0.23)
54/63(0.23)
Data used are total number of R&D personnel in business per capita in full-time work equivalent per 1000 people
10. Science degrees 46/59(24.73)
48/59(24.73)
48/60(24.73)
not available
47/61(24.62)
15/61(33.55)
7/63(40.29)
FactorRanking (Raw Score/Data)
2011 2012 2013 2014 2015 2016 2017
Scientific Infrastructure 58/59* 58/59* 59/60* 59/60* 58/61* 55/61* 57/63*
* Philippine rank over the number of countries
Source: World Competitiveness Yearbook, International Institute for Management Development, 2011, 2012, 2013, 2014, 2015, 2016, 2017
12. Patent applications 27/59(3,389)
52/60(298)
52/60(255)
52/60(255)
53/61(350)
46/61(608)
46/63(729)
Data used are number of patent applications filed for residents and non-residents
35

World Competitiveness Ranking of the Philippines:Scientific Infrastructure Factors, 2011-2017
FactorRanking (Raw Score/Data)
2011 2012 2013 2014 2015 2016 2017
Scientific Infrastructure 58/59* 58/59* 59/60* 59/60* 58/61* 55/61* 57/63*
13. Patent applications per capita 50/59(4)
49/59(4)
56/60-
58/60(0.27)
57/61(0.36)
58/61(0.61)
59/63(0.72)
Data used are number of patent applications filed by applicants per 100,000 inhabitants
14. Patents granted to residents 50/59(16)
51/59(24)
53/60(53)
54/60(58)
54/61(64)
55/61(80)
55/63(107)
Data used are number of patents granted by applicant’s origin
15. Number of patents in force 48/59(1.8)
35/59(56.9)
58/60(0.3)
59/60(0.3)
58/61(0.4)
58/61(0.5)
60/63(0.5)
Data used are number of patents in force by applicant’s origin per 100,000 inhabitants
16. Scientific research 56/59(3.03)
52/59(3.37)
39/60(4.08)
56/60(2.95)
51/61(3.33)
49/61(3.63)
48/63(3.71)
Executive Opinion Survey with question asked: “In your country, to what extent is scientific research (public and private) low or high by international standards?”
Experts answered the question on a scale of 1-6, with the response 1 indicating a negative perception and 6 indicating the most positive perception
* Philippine rank over the number of countries
Source: World Competitiveness Yearbook, International Institute for Management Development, 2011, 2012, 2013, 2014, 2015, 2016, 2017
36

World Competitiveness Ranking of the Philippines:Scientific Infrastructure Factors, 2011-2017
FactorRanking (Raw Score/Data)
2011 2012 2013 2014 2015 2016 2017
Scientific Infrastructure 58/59* 58/59* 59/60* 59/60* 58/61* 55/61* 57/63*
18. Scientific research legislation 52/59(3.53)
50/59(3.60)
43/60(4.11)
49/60(3.71)
49/61(3.66)
48/61(3.90)
54/63(3.61)
17. Researchers and scientists 45/59(3.04)
48/59(3.06)
39/60(3.64)
48/60(2.91)
49/61(3.08)
44/61(3.40)
49/63(3.21)
Executive Opinion Survey with question asked: “To what extent are the researchers and scientists not attracted or attracted to your country?”
Experts answered the question on a scale of 1-6, with the response 1 indicating a negative perception and 6 indicating the most positive perception
Executive Opinion Survey with question asked: “In your country, to what extent are the laws relating to scientific research do not encourage or encourage innovation?”
Experts answered the question on a scale of 1-6, with the response 1 indicating a negative perception and 6 indicating the most positive perception
* Philippine rank over the number of countries
Source: World Competitiveness Yearbook, International Institute for Management Development, 2011, 2012, 2013, 2014, 2015, 2016, 2017
37

20. Knowledge transfer 40/59(4.29)
40/59(4.34)
34/60(4.60)
33/60(4.44)
38/61(4.33)
36/61(4.45)
50/63(4.06)
World Competitiveness Ranking of the Philippines:Scientific Infrastructure Factors, 2011-2017
FactorRanking (Raw Score/Data)
2011 2012 2013 2014 2015 2016 2017
Scientific Infrastructure 58/59* 58/59* 59/60* 59/60* 58/61* 55/61* 57/63*
21. Innovative capacity 45/59(4.90)
39/59(5.02)
33/60(5.18)
46/60(4.58)
45/61(4.73)
37/61(5.26)
46/63(4.99)
Executive Opinion Survey with question asked: “In your country, to what extent is the knowledge transfer lacking or highly developed between companies and universities?”
Experts answered the question on a scale of 1-6, with the response 1 indicating a negative perception and 6 indicating the most positive perception
Executive Opinion Survey with question asked: “In your country, to what extent is the innovative capacity of firms to generate new products, processes and/or services low or high in your economy?”
Experts answered the question on a scale of 1-6, with the response 1 indicating a negative perception and 6 indicating the most positive perception
* Philippine rank over the number of countries
Source: World Competitiveness Yearbook, International Institute for Management Development, 2011, 2012, 2013, 2014, 2015, 2016, 2017
19. Intellectual property rights 53/59(3.88)
53/59(3.81)
54/60(4.17)
56/60(3.82)
52/61(4.17)
57/61(4.44)
53/63(4.73)
Executive Opinion Survey with question asked: “In your country, to what extent are the intellectual property rights adequately or not adequately enforced?”
Experts answered the question on a scale of 1-6, with the response 1 indicating a negative perception and 6 indicating the most positive perception
38

Prepared by:
S&T Resource Assessment and Evaluation Division (STRAED)Planning and Evaluation Service
DEPARTMENT OF SCIENCE AND TECHNOLOGYBicutan, Taguig City
Philippines