Embed Size (px)
Citation preview
Science and mathematics education, 14 –19
A ‘state of the nation’ report on the participation and attainment of 14–19 year olds in science and mathematics in the UK, 1996–2007
A ‘state of the nation’ report
2008
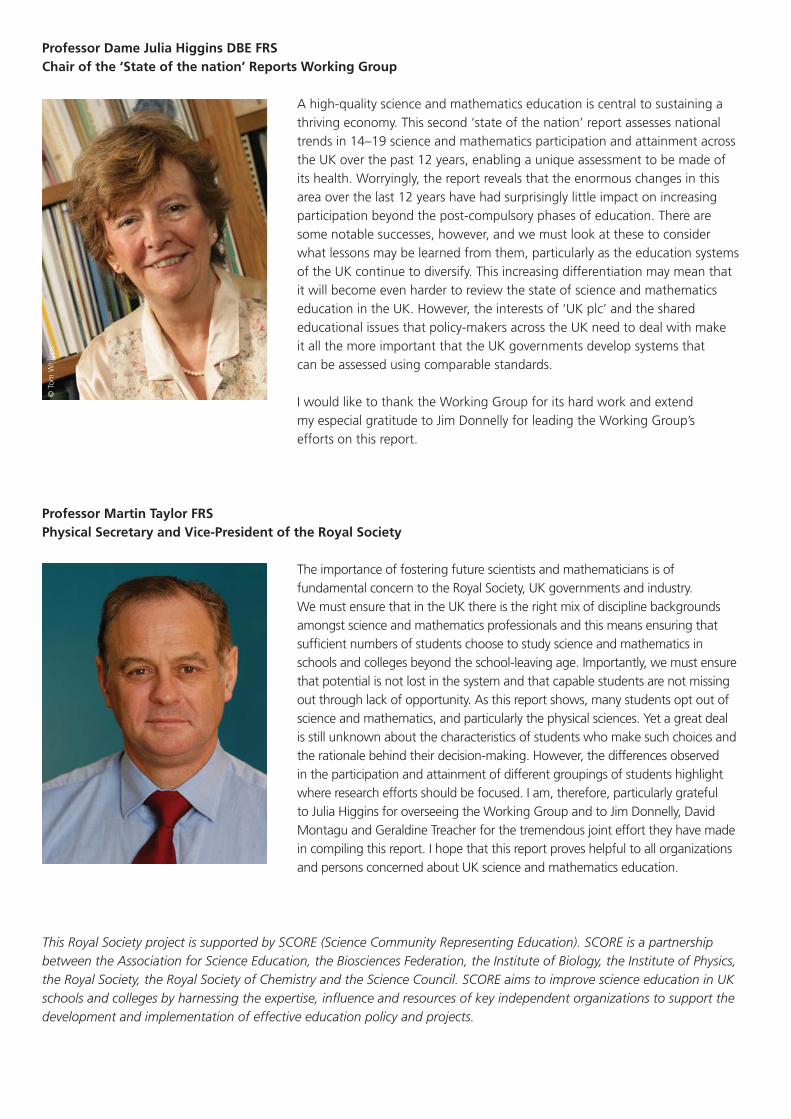
Professor Dame Julia Higgins DBE FRS Chair of the ‘State of the nation’ Reports Working Group
A high-quality science and mathematics education is central to sustaining a thriving economy. This second ‘state of the nation’ report assesses national trends in 14–19 science and mathematics participation and attainment across the UK over the past 12 years, enabling a unique assessment to be made of its health. Worryingly, the report reveals that the enormous changes in this area over the last 12 years have had surprisingly little impact on increasing participation beyond the post-compulsory phases of education. There are some notable successes, however, and we must look at these to consider what lessons may be learned from them, particularly as the education systems of the UK continue to diversify. This increasing differentiation may mean that it will become even harder to review the state of science and mathematics education in the UK. However, the interests of ‘UK plc’ and the shared educational issues that policy-makers across the UK need to deal with make it all the more important that the UK governments develop systems that can be assessed using comparable standards.
I would like to thank the Working Group for its hard work and extend my especial gratitude to Jim Donnelly for leading the Working Group’s efforts on this report.
Professor Martin Taylor FRSPhysical Secretary and Vice-President of the Royal Society
The importance of fostering future scientists and mathematicians is of fundamental concern to the Royal Society, UK governments and industry. We must ensure that in the UK there is the right mix of discipline backgrounds amongst science and mathematics professionals and this means ensuring that suffi cient numbers of students choose to study science and mathematics in schools and colleges beyond the school-leaving age. Importantly, we must ensure that potential is not lost in the system and that capable students are not missing out through lack of opportunity. As this report shows, many students opt out of science and mathematics, and particularly the physical sciences. Yet a great deal is still unknown about the characteristics of students who make such choices and the rationale behind their decision-making. However, the differences observed in the participation and attainment of different groupings of students highlight where research efforts should be focused. I am, therefore, particularly grateful to Julia Higgins for overseeing the Working Group and to Jim Donnelly, David Montagu and Geraldine Treacher for the tremendous joint effort they have made in compiling this report. I hope that this report proves helpful to all organizations and persons concerned about UK science and mathematics education.
This Royal Society project is supported by SCORE (Science Community Representing Education). SCORE is a partnership between the Association for Science Education, the Biosciences Federation, the Institute of Biology, the Institute of Physics, the Royal Society, the Royal Society of Chemistry and the Science Council. SCORE aims to improve science education in UK schools and colleges by harnessing the expertise, infl uence and resources of key independent organizations to support the development and implementation of effective education policy and projects.
© T
om W
hipp
s
‘State of the nation’ report I 1The Royal Society
Preface
This is the second in a series of reports from the Royal Society aimed at monitoring and supporting improvements to the quality of science and mathematics education in the UK across 5–19 education, and in particular raising participation and progression in these subjects.1
In order to fulfil these aims, we have:
identified, gathered and analysed key data on trends in participation and attainment in mainstream public examinations in i.science and mathematics taken by 14–19 year olds across the UK;
evaluated the quality of these data and made recommendations as to where the content, range and methodology of their ii.collection could be improved and inform future educational policy;
interpreted our findings in the context of current policy and practice so that they are relevant to and usable by a range of iii.policy-makers and policy-influencers; and
identified areas where new or further research is needed.iv.
In the course of achieving these aims, it is hoped this series of reports will become established as a key reference for the science and science education community, policy-makers and opinion-formers.
We intend to revisit the topic of this report at regular intervals over the years in order to maintain an up-to-date picture of participation, performance and progression in 14–19 science and mathematics, and thereby support those who, working together, may take positive action where it is required.
Feedback and further information
The Royal Society welcomes comments on the evidence and recommendation presented in this report.
Please email [email protected] or visit our website for more information about this and other reports.
royalsociety.org/education
1 The first report, on The UK’s science and mathematics teaching workforce, was published in December 2007.
2 I Science and mathematics education, 14–19 The Royal Society
ISBN: 978-0-85403-712-4© The Royal Society, 2008
Requests to reproduce all or part of this document should be submitted to:EducationThe Royal Society6–9 Carlton House TerraceLondon SW1Y 5AGtel +44 (0)20 7451 2500fax +44 (0)20 7930 2170email [email protected]
Design by Franziska Hinz, LondonLayout by Techset Composition, Salisbury, UK
‘State of the nation’ report I 3The Royal Society
Contents
Preface 1
Contents 3
Acknowledgements 16
Executive summary 171 Main findings 17
2 Overarching recommendations 19
3 Research needs 20
1 Introduction 211.1 What is the purpose of science and mathematics education? 21
1.2 The purpose of this report 22
1.3 The content of this report 22
2 The context of science and mathematics education in the UK 252.1 England and Wales 252.1.1 Looking back 252.1.2 The National Curriculum and GCSEs 262.1.3 A-levels 272.1.4 Ongoing reforms 28
2.2 Wales since the creation of the Welsh Assembly 282.2.1 Prior to 1999 282.2.2 Changes post-devolution – the Welsh Baccalaureate and curriculum change 29
2.3 Northern Ireland 292.3.1 Science 292.3.2 Mathematics 30
2.4 Scotland 302.4.1 Broadening provision – the introduction of Standard Grade 312.4.2 Improving progression – the Higher Still development programme 312.4.3 Ongoing reforms 32
2.5 In conclusion 32
3 Participation and attainment trends in science and mathematics examinations undertaken by 14–19 year olds across the UK between 1996 and 2007 33
3.1 Introduction 33
3.2 General data issues 333.2.1 The UK’s qualifications frameworks 34
3.3 A guide to reading the graphical content of this chapter 34
England 36(A) General Certificate of Secondary Education (GCSE) 363.4 Introduction 36
4 I Science and mathematics education, 14–19 The Royal Society
3.5 Numbers of pupils and participation in GCSE science and mathematics 36
3.6 DfES/DCSF data on GCSE results in England 373.6.1 The population of 15 year olds in England 38
3.7 Total participation and attainment in GCSE science and mathematics 403.7.1 Participation and attainment in GCSE double-award science 413.7.2 Participation and attainment in GCSEs in the separate sciences and triple science 433.7.3 Participation and attainment in GCSE single-award science 433.7.4 Participation and attainment in GCSE mathematics 473.7.5 Participation and attainment in vocational science: GNVQ science, and its successor,
GCSE applied science 493.7.5.1 Participation and attainment in GNVQ science 493.7.5.2 Participation and attainment in GCSE (double-award) applied science 50
(B) General Certificate of Education Advanced level qualifications 51
3.8 Introduction 51
3.9 Total participation and attainment in GCE Advanced Supplementary/Subsidiary level science and mathematics 51
3.10 Total participation and attainment in GCE A-level science and mathematics 513.10.1 Numbers of pupils and participation in GCE A-level science and mathematics 513.10.2 Participation and attainment in A-level biological sciences, chemistry and physics 523.10.3 Participation and attainment in GCE A-level ‘other sciences’ 543.10.4 Participation and attainment in GCE A-level psychology 553.10.5 Participation and attainment in GCE A-level mathematics and further mathematics 583.10.6 Participation and attainment in vocational A-levels and their equivalents 613.10.6.1 Participation and attainment in Advanced VCE single and double awards 61
Wales 673.11 Introduction 673.11.1 Data 673.11.2 Schools 673.11.3 Population 68
(A) General Certificate of Secondary Education (GCSE) 68
3.12 Participation and attainment in GCSE double-award science 68
3.13 Participation and attainment in GCSE single-award science 69
3.14 Participation and attainment in GCSE separate sciences and triple science 70
3.15 Participation and attainment in GCSE mathematics 71
(B) Advanced Supplementary/Advanced Subsidiary qualifications 75
(C) General Certificate of Education Advanced level qualifications 75
3.16 Participation and attainment in GCE A-level biological sciences, chemistry and physics 75
3.16.1 Biological sciences 753.16.2 Chemistry 773.16.3 Physics 78
3.17 Participation and attainment in GCE A-level mathematics and further mathematics 793.17.1 Disaggregated participation and attainment data for GCE A-level mathematics and
further mathematics 82
3.18 Participation and attainment in GCE A-level psychology 84
3.19 Participation and attainment in GCE A-level ‘other sciences’ 84
(D) Participation and attainment in vocational qualifications 85
‘State of the nation’ report I 5The Royal Society
Northern Ireland 863.20 Introduction 863.20.1 Notes on the data 87
(A) General Certificate of Secondary Education (GCSE) 87
3.21 Participation and attainment in GCSE double-award science 88
3.22 Participation and attainment in GCSE separate sciences and triple science 88
3.23 Participation and attainment in GCSE single-award science 93
3.24 Participation and attainment in GCSE mathematics 93
(B) GCE Advanced Subsidiary qualifications and GCE A-levels 93
3.25 AS-level data 93
3.26 A-level population size 93
3.27 Participation and attainment in GCE A-level biological sciences, chemistry and physics 95
3.28 Participation and attainment in GCE A-level mathematics and further mathematics 98
3.29 Participation and attainment in GCE A-level psychology 98
Scotland 1013.30 Scottish qualifications covered in this report 101
3.31 Population 101
3.32 Further notes concerning the Scottish credit and qualifications framework 1013.32.1 Standard Grade 1033.32.2 Access and Intermediate courses 1033.32.3 Highers 1043.32.4 Advanced Highers 1043.32.5 The equivalence of Scottish qualifications with GCSEs and A-levels 104
3.33 Participation and attainment in Scottish science and mathematics qualifications 1043.33.1 Standard Grade 1043.33.1.1 Participation and attainment in Standard Grade biology, chemistry and physics 1043.33.1.2 Participation and attainment in Standard Grade science 1053.33.1.3 Participation and attainment in Standard Grade mathematics 105
3.34 Intermediate 1 and 2 in science and mathematics 106
3.35 Highers 1073.35.1 Participation and attainment in Higher biology, human biology, chemistry and physics 1123.35.2 Participation and attainment in Higher mathematics 112
3.36 Advanced Highers in sciences and mathematics 117
Trans-UK qualifications 1203.37 BTEC and OCR Nationals 120
3.38 The IGCSE 121
3.39 The International Baccalaureate 121
3.40 The Cambridge Pre-U diploma 122
3.41 Widening choice: constraints and concerns 122
Comparing UK-wide data on participation and attainment in science and mathematics 122
3.42 Educational targets in science and mathematics education and the extent to which they have been met 122
6 I Science and mathematics education, 14–19 The Royal Society
3.42.1 England 1223.42.2 Educational targets in Northern Ireland, Scotland and Wales 124
3.43 Assessing the ‘state’ of the nation: comparing participation and attainment in secondary science and mathematics education within and across the UK 125
3.43.1 Comparing GCSE participation and attainment across England, Northern Ireland and Wales 1253.43.1.1 GCSE double-award science 1253.43.1.2 GCSE single-award science 1253.43.1.3 GCSE separate sciences and triple science 1253.43.1.4 GCSE mathematics 1263.43.2 Comparing GCSE participation and attainment in England, Northern Ireland
and Wales with participation and attainment in analogue qualifications in Scotland 1263.43.3 Comparing A-level participation and attainment in England, Northern Ireland and Wales 1303.43.3.1 Participation and attainment by GCE A-level subject 132
GCE A-level biological sciences 132GCE A-level chemistry 132GCE A-level physics 136GCE A-level mathematics 136
3.43.4 Comparing A-level participation and attainment in England, Northern Ireland and Waleswith participation and attainment in Scottish Highers 136
3.44 Interpreting the observed trends in participation and attainment 1373.44.1 Teachers and teaching 1383.44.2 School type and teachers 1393.44.3 Pupil/teacher ratios and class size 1403.44.4 Changes to curricular and course specifications 1413.44.5 Constraints on pupils 141
3.45 Summary conclusions and recommendations 141
4 What may be learnt from international comparative studies? 1434.1 Features of PISA and TIMSS and their differences 1444.1.1 Aims 1444.1.2 Age of students 1444.1.3 Definition of content areas 1444.1.4 Methodology, sampling procedures and criteria 1444.1.5 Form and content of test items 144
4.2 PISA 2003 145
4.3 PISA 2006 1454.3.1 Science 1454.3.2 Mathematics 147
4.4 TIMSS 2003 148
4.5 A caution about using international comparisons 149
4.6 Interpreting PISA and TIMSS 150
4.7 Conclusion 151
5 The impact of gender, socioeconomic status and ethnicity on participation and attainment in science and mathematics subjects in the UK 153
5.1 Gender 153
5.2 Socioeconomic status 160
5.3 Ethnicity 163
5.4 Progression: gender, socioeconomic status, ethnicity and other factors combined 164
‘State of the nation’ report I 7The Royal Society
5.5 Other evidence: available data for Northern Ireland, Scotland and Wales 168
5.6 Other research 1695.6.1 Setting and tiered entry and selectivity 1695.6.2 Parental and cultural attitudes 169
5.7 Summary and concluding thoughts 170
6 The evidence on attitudes towards science and mathematics for 14–19 year olds 171
6.1 Is there a problem? 171
6.2 Young people’s attitudes to science and mathematics 171
6.3 Science and mathematics in schools 1736.3.1 Teacher effects 1746.3.2 Gender effects 1756.3.3 Science and mathematics relative to other subjects 1756.3.4 The perceived difficulty of science and mathematics 175
6.4 Science and mathematics beyond school 1776.4.1 Views of scientists and jobs involving science 1776.4.2 Views on the importance of science 178
6.5 Concluding remarks 178
7 Conclusions 1817.1 Attainment and standards 181
7.2 Participation 184
7.3 Reforming the system 186
7.4 Looking to the future 188
7.5 In conclusion 189
Glossary 190
References 191
8 I Science and mathematics education, 14–19 The Royal Society
List of tables and figures
3 Participation and attainment trends in science and mathematics examinations undertaken by 14–19 year olds across the UK between 1996 and 2007 33
Table 3.1 Approximate equivalences of 14–19 qualifications in the UK’s qualification frameworks 34Table 3.2 School year groupings across the UK 35Figure 3.1 Exemplar figure illustrating the representation of participation and attainment parameters
in relation to a specific subject 35Figure 3.2 Exemplar figure illustrating how the actual numbers of entrants, and their performance,
compare as a percentage of the total population of similarly aged people within the national population 36
England 36Table 3.3 Percentage of GCSE entrants in England not aged 15 at the beginning of the academic year
(2002–2007) 37Figure 3.3 Number of 15-year-old pupils in all secondary schools in England (1996–2007) 38Table 3.4 Entries to the main science GCSEs, mathematics and English GCSE examinations in all
secondary schools in England (1996–2007) 39Table 3.5 Percentages of the total 15-year-old secondary school population taking double-award,
triple, single-award and double-award applied science GCSE examinations in England (1996–2007) 39
Table 3.6 Entries to single-award science and double-award applied science GCSE examinations in all secondary schools in England (1996–2007) 40
Figure 3.4 Distribution of entrants in single-award, double-award, triple science and double-award applied science across all secondary schools in England (1996–2007) 41
Figure 3.5 GCSE double-award science entries and attainment as a percentage of entries in all secondary schools in England (1996–2007) 42
Figure 3.6 GCSE double-award science entries and attainment as a percentage of the total numbers of 15 year olds in all secondary schools in England (1996–2007) 42
Table 3.7 Triple science entrants as a percentage of the 15-year-old population in all secondary schools in England (1996–2007) 43
Figure 3.7 GCSE biological sciences entries and attainment as a percentage of entries in all secondary schools in England (1996–2007) 44
Figure 3.8 GCSE biological sciences entries and attainment as a percentage of the numbers of 15 year olds in all secondary schools in England (1996–2007) 44
Figure 3.9 GCSE chemistry entries and attainment as a percentage of entries in all secondary schools in England (1996–2007) 45
Figure 3.10 GCSE chemistry entries and attainment as a percentage of the numbers of 15 year olds in all secondary schools in England (1996–2007) 45
Figure 3.11 GCSE physics entries and attainment as a percentage of entries in all secondary schools in England (1996–2007) 46
Figure 3.12 GCSE physics entries and attainment as a percentage of the numbers of 15 year olds in all secondary schools in England (1996–2007) 46
Figure 3.13 GCSE single-award science entries and attainment as a percentage of entries in all secondary schools in England (1996–2007) 47
Figure 3.14 GCSE single-award science entries and attainment as a percentage of the number of 15 year olds in all secondary schools in England (1996–2007) 48
Figure 3.15 GCSE mathematics entries and attainment as a percentage of entries in all secondary schools in England (1996−2007) 48
Figure 3.16 GCSE mathematics entries and attainment as a percentage of the 15-year-old population in all secondary schools in England (1996−2007) 49
‘State of the nation’ report I 9The Royal Society
Table 3.8 Numbers attaining GNVQ science in all secondary schools in England (2003–2007) 50Figure 3.17 GCSE applied science entries and attainment as a percentage of entries in all secondary
schools and colleges in England (1996–2007) 50Table 3.9 Entries and attainment in Advanced Supplementary courses in science and mathematics
across all secondary schools and FE sector colleges in England (1994–2000) 52Table 3.10 Entries and attainment in Advanced Subsidiary courses in science and mathematics across
all secondary schools and FE sector colleges in England (2001–2007) 53Figure 3.18 The total number of A-level (or eqivalent) candidates aged 16–18 in all secondary
schools and FE sector colleges in England at the beginning of the academic year in which they took their A-level (or equivalent) examinations compared with the size of the 17-year-old population in England 54
Table 3.11 Entrants from all secondary schools and FE sector colleges in England to A-levels in the traditional sciences between 1996 and 2007 as a percentage of the 17-year-old population 54
Table 3.12 Total entries in GCE A-level science subjects from all secondary schools and FE sector colleges in England compared with entries across all subjects in England (1996–2007) 55
Table 3.13 Contrast in the percentage of the 17-year-old population in England attaining grades A, A–C and A–E in the main science subjects at A-level between 1996 and 2007 55
Figure 3.19 A-level biological sciences entries and attainment as a percentage of entries among 16–18 year olds in all secondary schools and FE sector colleges in England (1996–2007) 56
Figure 3.20 A-level biological sciences entries and attainment as a percentage of the 17-year-old population in England (1996–2007) 56
Figure 3.21 A-level chemistry entries and attainment as a percentage of entries among 16–18 year olds in all secondary schools and FE sector colleges in England (1996–2007) 57
Figure 3.22 A-level chemistry entries and attainment as a percentage of the 17-year-old population in England (1996–2007) 57
Figure 3.23 A-level physics entries and attainment as a percentage of entries among 16–18 year olds in all secondary schools and FE sector colleges in England (1996–2007) 58
Figure 3.24 A-level physics entries and attainment as a percentage of the 17-year-old population in England (1996–2007) 59
Table 3.14 Total entries from all secondary schools and FE sector colleges in England in other sciences compared with total entries across all A-level subjects and the proportion of 17 year olds in the population taking examinations in these subjects (1996–2007) 59
Figure 3.25 A-level ‘other sciences’ entries and attainment as a percentage of entries in all secondary schools and FE sector colleges in England (1996–2007) 60
Table 3.15 Contrast between numbers of entries to ‘other sciences’ A-levels in England attaining A, A–C and A–E grades in 1996 and 2007 (%) 60
Table 3.16 Total entries in psychology A-level from all secondary schools and FE sector colleges in England compared with total entries across all A-level subjects and the proportion of 17 year olds in the population taking examinations in these subjects (1996–2007) 61
Table 3.17 Psychology entries attaining A, A–C and A–E grades between 1996 and 2007 as a percentage of all psychology entries (England, %) 61
Figure 3.26 A-level psychology entries and attainment as a percentage of entries in all secondary schools and FE sector colleges in England (1996–2007) 62
Figure 3.27 A-level psychology entries and attainment as a percentage of the 17-year-old population in England (1996–2007) 62
Table 3.18 Total entries in mathematics A-level from all secondary schools and FE sector colleges in England compared with total entries across all A-level subjects and the proportion of 17 year olds in the population taking examinations in these subjects (1996–2007) 63
Figure 3.28 A-level mathematics entries and attainment as a percentage of entries in all secondary schools and FE sector colleges in England (1996–2007) 63
Figure 3.29 Mathematics A-level entries and attainment as a percentage of the 17-year-old population in England (1996–2007) 64
Table 3.19 Percentage attainment rates (grades A–E) in selected AS-level subjects among 17 year olds in England (2001–2007) 64
Table 3.20 Percentage of mathematics A-level entries in all secondary schools and FE sector colleges in England attaining grades A, A–C and A–E (2001–2007) 64
10 I Science and mathematics education, 14–19 The Royal Society
Table 3.21 Total entries in further mathematics A-level from all secondary schools and FE sector colleges in England compared with total entries across all A-level subjects and the proportion of 17 year olds in the population taking examinations in this subject (1996–2007) 65
Table 3.22 Percentage of further mathematics A-level entries in all secondary schools and FE sector colleges in England attaining A, A–C and A–E grades (2001–2007) 65
Table 3.23 Entries and attainment in Advanced GNVQ science among 16–18 year olds in schools and colleges England (1998–2001) 65
Figure 3.30 A-level further mathematics entries and attainment as a percentage of entries in all secondary schools and FE sector colleges in England (1996–2007) 66
Table 3.24 Entries and attainment in single-award VCE science among 16–18 year olds in all secondary schools and FE sector colleges in England (2002–2007) 66
Table 3.25 Entries and attainment in double-award VCE science among 16–18 year olds in all secondary schools and FE sector colleges in England (2002–2007) 67
Wales 67Table 3.26 Numbers of 15 year olds in secondary schools in Wales (1996–2007) 67Figure 3.31 Entries to single, double-award and triple science in all secondary schools in Wales (1999–2007) 68Table 3.27 GCSE double-award science entries and attainment as a percentage of entries in all secondary
schools in Wales (1996–2007) 69Figure 3.32 Entries and attainment in GCSE double-award science as a percentage of the 15-year-old
school population in Wales (1996–2007) 69Table 3.28 GCSE single-award science entries and attainment as a percentage of entries in all
secondary schools in Wales (1996–2007) 70Figure 3.33 Entries and attainment in single-award science GSCE as a percentage of the population
of 15 year olds in all secondary schools in Wales (1996–2007) 70Table 3.29 Total entries to the separate sciences (including percentage equivalents) in all secondary
schools in respect of the size of the 15-year-old school population in Wales (1996−2007) 71Figure 3.34 GCSE biological sciences entries and attainment as a percentage of entries in all secondary
schools in Wales (1996–2007) 71Figure 3.35 GCSE biological sciences entries and attainment as a percentage of the 15-year-old school
population in Wales (1996–2007) 72Figure 3.36 GCSE chemistry entries and attainment as a percentage of entries in all secondary schools
in Wales (1996–2007) 72Figure 3.37 GCSE chemistry entries and attainment as a percentage of the 15-year-old school population
in Wales (1996–2007) 73Figure 3.38 GCSE physics entries and attainment as a percentage of entries in all secondary schools
in Wales (1996–2007) 73Figure 3.39 GCSE physics entries and attainment as a percentage of the 15-year-old school population
in Wales (1996–2007) 74Figure 3.40 GCSE mathematics entries and attainment as a percentage of entries in all secondary
schools in Wales (1996–2007) 74Figure 3.41 GCSE mathematics entries and attainment as a percentage of the 15-year-old school
population in Wales (1996–2007) 75Table 3.30 Entries and attainment in Advanced Supplementary and Advanced Subsidiary courses in science
and mathematics across all secondary schools and FE sector colleges in Wales (1996−2007) 76Table 3.31 Comparison of 17 year olds in the population with the number of 17-year-old students
in Wales (1996−2006) 77Figure 3.42 A-level biological sciences entries and attainment as a percentage of entries in all
secondary schools in Wales (1996–2007) 77Table 3.32 A-level biological sciences attainment as a percentage of entries in all secondary
schools in Wales (1996–2007) 78Figure 3.43 Entries and attainment in A-level biological sciences as a percentage of the 17-year-old
population in Wales (1996–2007) 78Table 3.33 A-level chemistry entries and attainment in all secondary schools in Wales (1996–2007) 79
‘State of the nation’ report I 11The Royal Society
Figure 3.44 A-level chemistry entries and attainment as a percentage of entries in all secondary schools in Wales (1996–2007) 79
Figure 3.45 Entries and attainment in A-level chemistry as a percentage of the 17-year-old population in Wales (1996–2007) 80
Table 3.34 A-level physics entries and attainment in all secondary schools in Wales (1996–2007) 80Figure 3.46 A-level physics entries and attainment as a percentage of entries in all secondary
schools in Wales (1996–2007) 81Figure 3.47 Entries and attainment in A-level physics as a percentage of the 17-year-old population
in Wales (1996–2007) 81Figure 3.48 Entries and attainment in A-level mathematics (and further mathematics) as a
percentage of entries in all secondary schools in Wales (1996–2007) 82Table 3.35 A-level mathematics (including further mathematics) entries and attainment in all
secondary schools in Wales (1996–2007) 82Figure 3.49 Entries and attainment in A-level mathematics (and further mathematics) as a
percentage of the 17-year-old population in Wales (1996–2007) 83Table 3.36 A-level mathematics entries and attainment in all secondary schools in Wales (1996–2007) 83Table 3.37 A-level further mathematics entries and attainment in all secondary schools in Wales
(1996–2007) 83Figure 3.50 A-level psychology entries and attainment as a percentage of entries in all secondary
schools in Wales (1996–2007) 84Table 3.38 A-level psychology entries and attainment in all secondary schools in Wales (1996–2007) 84Figure 3.51 Entries and attainment in A-level psychology as a percentage of the 17-year-old population
in Wales (1996–2007) 85Table 3.39 A-level ‘other sciences’ entries and attainment in all secondary schools in Wales (1996–2007) 85Figure 3.52 A-level ‘other sciences’ entries and attainment as a percentage of entries in all secondary
schools in Wales (1996–2007) 86Table 3.40 Total numbers of pupils in maintained schools in Wales awarded GNVQ science (1996–2007) 86
Northern Ireland 86Table 3.41 Numbers of 15-year-old pupils in all secondary schools in Northern Ireland
(1996/97–2007/08) compared with ONS population calendar year estimates of the numbers of 15 year olds in Northern Ireland’s population 87
Table 3.42 Entries to GCSEs in geology and environmental studies in all secondary schools in Northern Ireland (2004/05–2006/07) 87
Figure 3.53 Number of entrants in single-award, double-award and triple science in all secondary schools in Northern Ireland (2000–2007) 88
Figure 3.54 Entries and attainment in GCSE double-award science as a percentage of entries in all secondary schools in Northern Ireland (2000–2007) 89
Figure 3.55 Entries and attainment in GCSE double-award science as a percentage of the 15-year-oldcohort in Northern Ireland (2000–2007) 89
Figure 3.56 Biological sciences GCSE entries and attainment as a percentage of entries in all secondary schools in Northern Ireland (2000–2007) 90
Figure 3.57 Chemistry GCSE entries and attainment as a percentage of entries in all secondary schools in Northern Ireland (2000–2007) 90
Figure 3.58 Physics GCSE entries and attainment as a percentage of entries in all secondary schools in Northern Ireland (2000–2007) 91
Figure 3.59 Participation and performance in GCSE biological sciences in relation to the size of the 15-year-old population in Northern Ireland (2000–2007) 91
Figure 3.60 Participation and performance in GCSE chemistry in relation to the size of the 15-year-old population in Northern Ireland (2000–2007) 92
Figure 3.61 Participation and performance in GCSE physics in relation to the size of the 15-year-old population (Northern Ireland, 2000–2007) 92
Figure 3.62 GCSE single-award science entries and attainment as a percentage of entries in all secondary schools in Northern Ireland (2000–2007) 93
12 I Science and mathematics education, 14–19 The Royal Society
Figure 3.63 Participation and performance in GCSE single-award science in relation to the size of the 15-year-old population (Northern Ireland, 2000–2007) 94
Figure 3.64 GCSE mathematics entries and attainment as a percentage of entries in all secondary schools in Northern Ireland (2000−2007) 94
Figure 3.65 Participation and performance in GCSE mathematics in relation to the size of the 15-year-old population (Northern Ireland, 2000–2007) 95
Table 3.42 Comparison of 17 year olds in the population with the number of 17-year-old students in Northern Ireland (2001−2006) 95
Figure 3.66 A-level biological sciences entries and attainment as a percentage of entries in all secondary schools in Northern Ireland (2000–2007) 96
Figure 3.67 A-level biological sciences entries and attainment as a percentage of the 17-year-old population in Northern Ireland (2000–2007) 96
Figure 3.68 A-level chemistry entries and attainment as a percentage of entries in all secondary schools in Northern Ireland (2000–2007) 97
Figure 3.69 A-level chemistry entries and attainment as a percentage of the 17-year-old population in Northern Ireland (2000–2007) 97
Figure 3.70 A-level physics entries and attainment as a percentage of entries in all secondary schools in Northern Ireland (2000–2007) 98
Figure 3.71 A-level physics entries and attainment as a percentage of the 17-year-old population in Northern Ireland (2000–2007) 99
Figure 3.72 A-level mathematics entries and attainment as a percentage of entries in all secondary schools in Northern Ireland (2000–2007) 99
Figure 3.73 A-level mathematics entries and attainment as a percentage of the 17-year-old population in Northern Ireland (1996–2007) 100
Figure 3.74 A-level further mathematics entries and attainment as a percentage of entries in all secondary schools in Northern Ireland (2005–2007) 100
Figure 3.75 Participation and performance in further mathematics A-level in comparison to the 17-year-old population in Northern Ireland (2005–2007) 100
Scotland 101Table 3.43 Number of pupils in publicly funded Scottish secondary schools by stage of learning 101Table 3.44 Number of pupils in independent Scottish secondary schools by stage of learning 102Table 3.45 Secondary pupils in publicly funded schools in Scotland by age and stage, as at
31 December 2007 102Table 3.46 Secondary pupils in independent schools in Scotland by age and stage, as at
31 December 2007 102Table 3.47 The population of 15, 16 and 17 year olds in Scotland (1999−2007) 103Figure 3.76 Total presentations (entries) to Standard Grade biology, chemistry and physics in all
secondary schools in Scotland (1996−2007) 105Table 3.48 Entrants to Standard Grade biology, chemistry and physics by stage in all secondary
schools in Scotland (1996−2007) 106Figure 3.77 Levels of award gained by pupils below S5 taking Standard Grade biology, chemistry and
physics in all secondary schools in Scotland (1996–2007) 107Figure 3.78 Levels of award among pupils (<S5) taking Standard Grade science in all secondary
schools in Scotland (1996−2007) 108Figure 3.79 Entries and levels of award gained in Standard Grade mathematics among pupils (<S5)
in all secondary schools in Scotland (1996−2007) 108Table 3.49 Total presentations (entries at all stages) to Intermediate 1 and 2 biology, chemistry and
physics among all secondary schools in Scotland (2000−2007) 109Figure 3.80 Numbers and proportions of all entrants in all secondary schools in Scotland gaining
A−C grades across biology, chemistry and physics Intermediate 1 (2000−2007) 109Figure 3.81 Numbers and proportions of all entrants in all secondary schools in Scotland gaining
A−C grades across biology, chemistry and physics Intermediate 2 (2000−2007) 110Figure 3.82 Numbers and proportions of all entrants in all secondary schools in Scotland gaining
A−C grades in mathematics Intermediate 1 (2000−2007) 110
‘State of the nation’ report I 13The Royal Society
Figure 3.83 Numbers and proportions of all entrants in all secondary schools in Scotland gaining A−C grades in mathematics Intermediate 2 (2000−2007) 111
Table 3.50 Total numbers of presentations (entries) to Highers in biology, human biology, chemistry, physics and mathematics taken by pupils at different stages in all secondary schools in Scotland (1996−2007) 111
Figure 3.84 Higher biology entries and attainment for all entrants in all secondary schools in Scotland (1996−2007) 112
Figure 3.85 Higher biology entries and attainment among S5 entrants in all secondary schools as a percentage of the 16-year-old population in Scotland (1996−2007) 113
Figure 3.86 Higher human biology entries and attainment for all entrants in all secondary schools in Scotland (1996−2007) 113
Figure 3.87 Higher human biology entries and attainment among S5 entrants in all secondary schools as a percentage of the 16-year-old population in Scotland (1996−2007) 114
Figure 3.88 Higher chemistry entries and attainment for all entrants in all secondary schools in Scotland (1996−2007) 114
Figure 3.89 Higher chemistry entries and attainment among S5 entrants in all secondary schools as a percentage of the 16-year-old population in Scotland (1996−2007) 115
Figure 3.90 Higher physics entries and attainment for all entrants in all secondary schools in Scotland (1996−2007) 115
Figure 3.91 Higher physics entries and attainment among S5 entrants in all secondary schools as a percentage of the 16-year-old population in Scotland (1996−2007) 116
Figure 3.92 Higher mathematics entries and attainment for all entrants in all secondary schools in Scotland (1996−2007) 116
Figure 3.93 Higher mathematics entries and attainment among S5 entrants in all secondary schools as a percentage of the 16-year-old population in Scotland (1996−2007) 117
Figure 3.94 Certificate of Sixth Year Studies combined with Advanced Higher biology entries and attainment for entrants in all secondary schools in Scotland (1996−2007) 118
Figure 3.95 Certificate of Sixth Year Studies combined with Advanced Higher chemistry entries and attainment for entrants in all secondary schools in Scotland (1996−2007) 118
Figure 3.96 Certificate of Sixth Year Studies combined with Advanced Higher physics entries and attainment for entrants in all secondary schools in Scotland (1996−2007) 119
Figure 3.97 Certificate of Sixth Year Studies combined with Advanced Higher mathematics (including applied mathematics) entries and attainment for entrants in all secondary schools in Scotland (1996−2007) 119
Table 3.51 Changes in the A and A−C attainment rates among entrants taking Advanced Highers in science and mathematics in all secondary schools in Scotland (2001−2007) 120
Trans-UK qualifications 120Table 3.52 Candidates receiving certificates/awards in OCR science Nationals during 2006/07 121Table 3.53 Growth of the IB Diploma in the UK (1997–2007) 121Table 3.54 Growth of UK secondary schools adopting the IB Diploma programme (2000–2008) 122
Comparing UK-wide data on participation and attainment in science and mathematics 122
Table 3.55 Government Public Service Agreements relating to 14–19 education 123Figure 3.98 A-level entries from 2000 onwards and progress from 2004 entries in relation to the
2014 targets 124Table 3.56 Comparison of A*–C grades in English language GCSE across all schools in England,
Wales and Northern Ireland 126Figure 3.99 Entries to double-award science GCSE across England, Northern Ireland and Wales as
a percentage of the 15-year-old populations in these nations (2000−2007) 127Figure 3.100 Entries to single-award science GCSE across England, Northern Ireland and Wales as a
percentage of the 15-year-old populations in these nations (2000−2007) 127Figure 3.101 Entries to triple science GCSE (represented by physics) across England, Northern Ireland
and Wales as a percentage of the 15-year-old populations in these nations (2000−2007) 128
14 I Science and mathematics education, 14–19 The Royal Society
Figure 3.102 Entries to mathematics GCSE across England, Northern Ireland and Wales as a percentage of the 15-year-old populations in these nations (2000−2007) 128
Figure 3.103 Total participation among all secondary school entrants (<S5) in Scottish Standard Grade and Intermediates 1 and 2 biology, chemistry and physics (1996–2007) 129
Figure 3.104 Total participation among all secondary school entrants (<S5 and S5) in Scottish Standard Grade and Intermediates 1 and 2 biology, chemistry and physics (1996–2007) 129
Figure 3.105 Participation in Standard Grade biology among entrants (<S5) in all secondary schools in relation to the size of the 15-year-old population (Scotland, 1996–2007) 130
Figure 3.106 Participation in Standard Grade chemistry among entrants (<S5) in all secondary schools in relation to the size of the 15-year-old population (Scotland, 1996–2007) 131
Figure 3.107 Participation in Standard Grade physics in all secondary schools in relation to the size of the 15-year-old population (Scotland, 1996–2007) 131
Figure 3.108 Participation in Standard Grade mathematics in all secondary schools in relation to the size of the 15-year-old population (Scotland, 1996–2007) 132
Table 3.57 Participation and attainment by pupils at S5 and <S5 taking biology, chemistry and physics at Intermediate 2 in all secondary schools in Scotland (2000–2007) 133
Figure 3.109 Entries to biological sciences A-level across England, Northern Ireland and Wales as a percentage of the 17-year-old population in these nations (2000−2007) 134
Figure 3.110 Entries to chemistry A-level across England, Northern Ireland and Wales as a percentage of the 17-year-old population in these nations (2000−2007) 134
Figure 3.111 Entries to physics A-level across England, Northern Ireland and Wales as a percentage of the 17-year-old population in these nations (2000−2007) 135
Figure 3.112 Entries to mathematics A-level across England, Northern Ireland and Wales as a percentage of the 17-year-old population in these nations (2000−2007) 135
Table 3.58 Comparison of the percentages of the 16-year-old population in Scotland and the 17-year-old population in England, Northern Ireland and Wales taking science and mathematics Highers and A-levels (average across 2000–2007) 136
Table 3.59 Attainment (grades A–C) in Higher sciences and mathematics compared to A-level subject equivalents in England, Northern Ireland and Wales (2000–2007) 137
Figure 3.113 Total numbers of biology, chemistry, physics and mathematics first degrees awarded to UK-domiciled students (1998/99–2004/05) 139
Table 3.60 Pupil/teacher ratios in local authority maintained secondary schools across the UK (2000–2007) 140
4 What may be learnt from international comparative studies? 143Figure 4.1 UK attainment in science for each proficiency level relative to the OECD average (percentage
of students at each level), PISA 2006 146Table 4.1 Percentage of students at each proficiency level on the science scale (standard errors
in brackets) 146Figure 4.2 UK attainment in mathematics for each proficiency level relative to the OECD average
(percentage of students at each level) – also broken down for Scotland and Wales, PISA 2006 147Table 4.2 Percentage of students at each proficiency level on the mathematics scale (standard errors
in brackets) 148
5 The impact of gender, socioeconomic status and ethnicity on participation and attainment in science and mathematics subjects in the UK 153
Table 5.1 Rank of science subjects by gender within the top 10 most frequently entered O-level/GCSEs, England 154
Table 5.2 Rank of science subjects by gender within the top 10 most frequently entered A-levels, England 154
Table 5.3 Rank of science and mathematics subjects by gender within the top 10 most frequently entered O Grades/Standard Grades, Scotland 154
Table 5.4 Rank of science and mathematics subjects by gender within the top 10 most frequently entered Highers, Scotland 154
‘State of the nation’ report I 15The Royal Society
Table 5.5 Rank of science and mathematics subjects by gender within the top 10 most frequently entered CSYS/Advanced Highers, Scotland 155
Table 5.6 Attainment of A*–C in GCSE and SCQF Level 5 as a percentage of entrants in each gender in England, Northern Ireland, Wales and Scotland, 2006 156
Table 5.7 A-level and Highers participation in mathematics and sciences in the UK, 2006 157Figure 5.1 The percentages of pupils in maintained schools in England who go on to enter
A-level chemistry by gender and GCSE chemistry/double-award science grade 158Figure 5.2 The percentages of pupils in maintained schools in England who go on to enter A-level
physics by gender and GCSE physics/double-award science grade 158Figure 5.3 The percentages of pupils in maintained schools in England who go on to enter A-level
mathematics by gender and GCSE mathematics grade 159Table 5.8 Percentage of entrants in each gender attaining grades A–C in A-levels or Scottish
Highers, 2006 159Table 5.9 Key Stage 2 results 2007, percentage reaching Level 4 or above, England, by IDACI 160Table 5.10 Attainment of A*–C grades by FSM status and gender in science, mathematics and English,
and mean capped points score in all subjects, Key Stage 4 students in England, 2006 161Figure 5.4 The percentages of pupils in maintained schools in England who go on to take A-level
chemistry by FSM eligibility and GCSE chemistry/double-award science grades (A*–C) 161Figure 5.5 The percentages of pupils in maintained schools in England who go on to take A-level
physics by FSM eligibility and GCSE physics/double-award science grades (A*–C) 162Figure 5.6 The percentages of pupils in maintained schools in England who go on to take A-level
mathematics by FSM eligibility and GCSE mathematics grades (A*–C) 162Table 5.11 Relative participation of maintained students in England at A-level by low, middle and
high IDACI variable 163Table 5.12 Relative attainment of students at maintained schools in England at A level (A–C grades)
by low, middle and high IDACI variable 163Table 5.13 Attainment of grades A*–C by ethnicity in science, mathematics and English, and mean
capped points score in all subjects, Key Stage 4 students in England, 2006 163Figure 5.7 The percentages of pupils in maintained schools in England with grade A*/A at GCSE
chemistry/double-award science who go on to take A-level chemistry by ethnicity, 2006 164Figure 5.8 The percentages of pupils in maintained schools in England with grade A*/A at GCSE
physics/double-award science who go on to take A-level physics by ethnicity, 2006 165Figure 5.9 The percentages of pupils in maintained schools in England with grade A*/A at GCSE
mathematics who go on to take A-level mathematics by ethnicity, 2006 165Table 5.14 Attainment of A–C grades in A-level biological sciences, chemistry, physics and
mathematics as a percentage of the cohort by ethnicity, 2006, England 166Figure 5.10 Factors associated with chemistry A-level take-up among students in maintained schools
in England 167Figure 5.11 Factors associated with physics A-level take-up among students in maintained schools
in England 167Figure 5.12 Factors associated with mathematics A-level take-up among students in maintained
schools in England 168
6 The evidence on attitudes towards science and mathematics for 14–19 year olds 171
Table 6.1 Recent studies on 14–19 year old school students’ attitudes to science and mathematics 172Table 6.2 Students’ responses to the relative levels of difficulty of selected subjects 176Figure 6.1 Percentage of students in England achieving grades A*–C at GCSE in selected subjects 176Figure 6.2 Estimates of A-level subject difficulties by different methods 177Table 6.3 Working life additional net earnings by degree subject (compared to two or more A-levels) 178
16 I Science and mathematics education, 14–19 The Royal Society
Acknowledgements
The Secretariat and Working Group would like to thank the following individuals for their help in contributing to the preparation of this report:
Fiona Allan (ACME), Dr Robert Coe (University of Durham), Education Data Surveys Ltd, Sarah French (DCSF), Dr Simon Gallacher (Wellcome Trust), Professor Tony Gallagher (Queen’s University Belfast), Professor Stephen Gorard (University of Birmingham), Jenny Humphreys (NAW), Dr Ruth Jarman (Queen’s University Belfast), Alison Judd (DCSF), Gavin King (DENI), Janet Lauchlan (Scottish Government), John Noel (OCR), Mark Pearson (DCSF), Sarah Randell (SCIS), Alice Rogers (ACME), Dr Beng Huat See (University of Brimingham), Dr James Sinclair (Joint Council for Qualifications), Raymond Sloan (Scottish Government), Tom Spencer (Scottish Government), Charlie Stripp (Further Mathematics Network), Peter Thomas (ACME), Mark Wellington (NAW) and Susan Williamson (SQA).
Chapters 4, 5 and 6 are based on papers commissioned for this report prepared by, respectively, Professor Edgar Jenkins (University of Leeds), Professor Jo Boaler and Mr Geoffrey Kent (University of Sussex), and Professor Judith Bennett (University of York). Professor Bennett also contributed to chapter 3, §3.42.1. The views expressed in each of these chapters are, however, not necessarily those of these contributors.
Council Review Group
Professor Martin Taylor FRS (Chair, Vice-President of the Royal Society), School of Mathematics, University of Manchester
Professor Margaret Brown, Department of Education and Professional Studies, King’s College London
Professor Patricia Murphy, Department of Education, The Open University
Professor Adrian Smith FRS, Principal of Queen Mary, University of London
‘State of the nation’ Reports Working Group and Secretariat
Working Group
Professor Julia Higgins DBE FRS (chair), Professor of Polymer Science, Imperial College
Professor Jim Donnelly (14–19 subgroup chair), Centre for Studies in Science and Mathematics Education, University of Leeds
Dr Neville Evans
Dr Lucie Green, Dorothy Hodgkin Research Fellow, Mullard Space Science Laboratory, University College London
Dr Andrew Hughes, Admissions Tutor, Department of Chemistry, University of Durham
Professor Jack Jackson, Visiting Professor, Department of Curricular Studies, University of Strathclyde and formerly Assistant Chief Inspector of Schools, Scotland
Mr Roger McCune, Qualifications and Skills Accreditation and Policy Manager, Council for the Curriculum, Examinations and Assessment (CCEA)
Mr Roger Mitchell, Headteacher, Ripple Junior School, Barking, Essex
Ms Marian Morris, Principal Research Officer, National Foundation for Educational Research
Dr Colin Osborne, Education Manager, Royal Society of Chemistry
Professor Richard Pring, Oxford University Department of Educational Studies and Director, The Nuffield Review of 14–19 Education and Training
Professor Chris Robson, School of Mathematics, University of Leeds
Professor Bernard Silverman FRS, Master, St Peter’s College, Oxford
Ms Juliet Strang, Headteacher, Villiers High School, Southall, Middlesex
Professor John Wood, Principal, Faculty of Engineering, Imperial College
Secretariat
David Montagu, Assistant Manager, Education
Ginny Page, Senior Manager, Education
Professor Michael Reiss, Director, Education
Geraldine Treacher, Education Policy Officer, Education
‘State of the nation’ report I 17The Royal Society
Executive summary
This report examines and evaluates key trends in 14–19 science and mathematics education across the UK from 1996 to 2007. It shows that education in the UK is failing to provide the increases in the numbers of school-leavers with science and mathematics qualifications required by industry, business and the research community to assure the UK’s future economic competitiveness.
The proportion of the relevant population cohort taking A-levels in England, Northern Ireland and Wales or Scottish Higher examinations has fallen in chemistry, physics and mathematics between 1996 and 2007. This situation is worrying given (i) the needs of industry and business for STEM skills; (ii) the UK Government’s stated desire, in recognition of these needs, to increase the number of STEM graduates; and (iii) the need for more science and mathematics teachers, particularly in England.
The evidence available clearly suggests that the wave of recent educational reform has not yet had the effect of driving up participation to the desired extent. Ongoing educational reform, particularly in England, has made it very hard to discern with certainty the impact of any one initiative.
At a time when the education systems of the UK are becoming increasingly divergent, a common set of challenges faces our policy-makers. These include the need to:
provide science and mathematics education appropriate for students of all levels of attainment in an environment where more students remain in education post-16;
give a solid core grounding in science and mathematics to those who will probably not continue studying these subjects post-16;
create a system with academic and vocational study pathways that are each recognized as valuable and fit for purpose;
monitor standards without causing distortions in teaching and learning;
acknowledge the differences between science disciplines in terms of their different demands, traditions and motivational appeals for students.
A different approach to educational reform is needed. Instead of being geared to short-term political ends, educational reform should be driven by carefully considered and well-defined educational rationale, informed by evidence and advanced through a process of consultation, piloting and development.
1 Main findings
1.1 Participation and attainment trends in national science and mathematics examinations, 1996–2007
Participation and attainment up to age 16
There are different patterns in the uptake of GCSE science options in England, Northern Ireland and Wales. The highest proportion of double-award science entrants is in England. In contrast, single-award science has been taken by a much higher percentage of the population in Northern Ireland than in any other country. This may be because non-grammar schools in Northern Ireland often encourage high proportions of students to take single-award science and also because single-award science is sat by students wishing to focus on strengths in other areas of the curriculum. Separate sciences have been taken by the highest percentage of the population in Wales.
The pattern of science participation in Scotland, where the opportunity to specialize becomes possible from age 14, is similar to that evident in the other UK nations post-16, with biology being the most popular and physics the least popular science.
Across England, Northern Ireland and Wales there has been an overall increase in the proportion of entrants in each subject attaining grades A*–C in science (with the exception of single-award science), a measure given particular weight in Government performance tables in England. In contrast, the attainment rates of equivalent qualifications in Scotland, in either Intermediate 2 or Credit level at Standard Grade, have been relatively constant in chemistry, physics and mathematics, only increasing slightly in biology.
18 I Science and mathematics education, 14–19 The Royal Society
Post-16 participation and attainment
Across all major science subjects throughout the UK, post-16 participation is lowest in physics and highest in biology. Between 1996 and 2007 participation rates expressed as a percentage of the 17-year-old population in England, Northern Ireland and Wales have not exceeded 12% in biology or mathematics, 7% in chemistry and 6% in physics. Furthermore, they have decreased in chemistry, physics and mathematics in each UK nation. The 2007 figures show that physics participation in England, Northern Ireland and Wales is just 3.5%, 4.7% and 2.7%, respectively. This contrasts with the situation in Scotland, where 10% of 16 year olds sat Higher physics in 2007. Overall, post-16 participation in chemistry, physics and mathematics is highest in Scotland relative to other UK nations. This may reflect the fact that young people in Scotland have the opportunity to specialize in the separate sciences from age 14 and that Scotland has a healthier number and supply of teachers who are specialists in these subjects.
The percentage of 17 year olds attaining good grades at A-level has varied less than might be expected in England, Northern Ireland and Wales given the considerable changes that have occurred in the education systems of these countries. In biology and chemistry the percentages attaining grades A–C have increased very slightly, while they have decreased very slightly in physics and been generally constant in mathematics. The percentage of 16 year olds attaining grades A–C in Scottish Highers decreased between 1996 and 2007 in all science subjects (except human biology), with the largest decrease being in physics.
1.2 Inequalities in participation and attainment in science and mathematics subjects in the UK
Many factors influence participation and attainment in science and mathematics 14–19, some of which are more quantifiable than others. We have examined the available evidence concerning the impact of gender, socioeconomic status and ethnicity.
Gender
More female students participate in biology and fewer take physics and mathematics post-16. Participation in chemistry is comparatively balanced. There is no evidence that this variation stems from differences in ability; in fact, slightly more girls than boys attain ‘good’ grades at age 16 in mathematics and compulsory science subjects.
Research into attitudes towards science subjects and mathematics supports the argument that gendered participation is the result of broader patterns of subject preference and career aspirations due, at least in part, to societal assumptions about what is appropriate, respectively, for young women and young men.
Socioeconomic status
Subject-specific data for socioeconomic status in the UK are not published systematically. The available data, primarily from England, confirm a link between economic status and attainment differences in GCSE and A-level results in science and mathematics. Of those who attain highly at GCSE, students’ progression to A-level physics and mathematics occurs at much the same rate in these subjects, regardless of economic status.
Ethnicity and other factors
Clear patterns in both attainment and progression for different ethnic groupings emerge. In England, Chinese and Indian students attain higher proportions of A*–C grades in science and mathematics GCSEs and A-levels, while Caribbean students attain at much lower rates.
Of students with top GCSE sciences and mathematics grades, fewer Caribbean and White students progress to take chemistry and mathematics A-levels than other ethnic groups. Chinese students with top GCSE grades have the highest rates of progression to physics and mathematics, while Pakistani and Indian students also have high rates of progression in chemistry and mathematics.
Other factors linked to post-16 participation
Prior attainment is the single biggest predictor of progression to post-16 study in science and mathematics (although extensive research appears to have only been conducted in England). Such progression is linked to students’ attitudes and perceptions of their own ability and the extent to which their choices are constrained by their schools’ provision and their grades. There is some evidence that, other factors being equal, the study of separate sciences prior to 16 results in an increased likelihood of progressing in those subjects taken.
1.3 Inequity in the education system
The range of qualifications on the education market is growing. This widening provision appears to offer more choice and flexibility, but the availability of these qualifications is dependent on whether schools and colleges choose to embrace them. Inevitably, a patchwork of provision is developing.
‘State of the nation’ report I 19The Royal Society
This increasing range of qualifications available for a given level in the qualification system, quite apart from traditional ‘equity’ issues of differentiation in participation and/or attainment with respect to gender, socioeconomic status and ethnicity, opens up a whole new area of potential inequity that requires research in its own right.
1.4 International studies of student attainment
Large-scale international (comparative) studies indicate that the UK’s performance is comparable to that of other industrialized nations. The OECD’s Programme for International Student Assessment (PISA) 2006 suggests that the UK’s performance in science education is above the mean for OECD countries. The results of PISA 2006 also suggest that the UK’s performance is not significantly below the OECD mean in mathematics, but that there are relatively low proportions of students attaining at higher levels, a finding reinforced by the 2003 Trends in International Mathematics and Science Study (TIMSS).
These studies offer a certain independent measure of UK performance, although for reasons of design, focus and international cultural differences, it is not possible to use them to make well-grounded comparisons over time.
1.5 The evidence on attitudes towards science and mathematics for 14−19 year olds
Research indicates that attitudes to science and mathematics are less positive at the end of the compulsory years of secondary schooling than earlier and that this may influence the subject and career choices students make post-16. Although science is perceived as important, careers in science generally lack appeal, providing additional disincentive to the further study of science. The higher relative difficulty of physics, chemistry, biology and mathematics A-levels is also likely to have some impact on decision making.
The majority of this body of research fails to consider the link between students’ stated attitudes and their eventual actions. For this reason, findings must be treated with caution.
2 Overarching recommendations
2.1 Strengthening and using the evidence base
i. There should be greater collaboration between the education authorities in England, Northern Ireland and Wales to ensure that comparative data are collected and presented more consistently and coherently, in order to facilitate evaluation of participation and performance in public examinations.
ii. Across the UK, published annual education statistics should include much greater detail about patterns of socioeconomic and ethnic participation and attainment in science and mathematics.
iii. All commercial organizations with responsibility for administering 14−19 examinations should be obliged to make available specific subject-based data on examination participation and performance, which need not compromise their commercial viability.
iv. The provision of alternative 14–19 qualifications (eg the International Baccalaureate), beyond those that are most widely available, should be closely monitored so that the true choice available to young people in different localities, and the value of the extent of this choice, may be assessed and evaluated.
v. The UK Government should routinely draw on the evidence base it oversees, in consultation with its STEM partners, before committing to educational reform that could have unintentional effects on science and mathematics uptake and progression.
2.2 Overseeing and monitoring the education system
i. There should be a fully independent body responsible for curriculum reform in each of the UK nations.
ii. Each of the relevant agencies across the UK should have robust systems in place to monitor standards over time at key levels in its qualifications framework.
iii. The mapping of individual nations’ qualifications frameworks should continue to be updated and maintained, identifying comparable levels and the standards of attainment that are associated with those levels.
iv. The impact, in England, on progression to science post-16 of the ‘entitlement’ for certain students to study separate science GCSEs from 2008 should be monitored.
v. The impact, in England, of the move to two mathematics GCSEs on progression to mathematics qualifications post-16 should be monitored once these are introduced.
20 I Science and mathematics education, 14–19 The Royal Society
3 Research needs
Research is needed into:
the drop in science and mathematics participation post-16, with a particular focus on students’ decision-making and actions, i.and this should be conducted in a coordinated way across the UK.
patterns of socioeconomic and ethnic participation and attainment, making use of large-scale national datasets. ii.
the comparatively higher rates of attainment in science and mathematics by GCSE students in Northern Ireland, in order to iii.explore potential lessons that may be learned by other UK nations.
the greater participation in the separate sciences in Scotland, in order to explore potential lessons that may be learned by iv.other UK nations.
the differences between UK nations revealed in PISA 2006, in order to explore whether differences may be accounted for by v.socioeconomic status or whether other factors are involved.
the lower proportion of 15-year-old UK students attaining at the upper levels of difficulty in mathematics, as identified in vi.PISA 2006 and TIMSS 2003, and what might be done to achieve a level comparable to other industrialized countries.
schools with relatively high take-up of mathematics and science subjects post-16, using a sufficient number to take account vii.of variation in the student population, particularly in prior attainment, and the variation in school circumstances.
variation in schools’ policies concerning entry requirements to A-level sciences and mathematics and their equivalents viii.in Scotland, and in particular the options that are made available to pupils awarded B and C grades in their GCSEs who wish to continue studies in these subjects post-16.
The Royal Society ‘State of the nation’ report I 21
1 Introduction
1.1 What is the purpose of science and mathematics education?
Debates about the purpose of education are conducted from many points of view, including the philosophical, the economic and the political. It is not our intention here to examine all facets of this question of purpose, still less to offer to resolve it. The political philosopher Michael Oakeshott famously described education as being an initiation into ‘the conversation of mankind’ (Oakeshott 1962). The metaphor is a good one, not least because the conversation to which Oakeshott refers can take place in so many settings, including the workplace, political debate, our practical decision-making in everyday life and, not least, as a part of our unending intellectual and practical curiosity as human beings.
The purposes of science and mathematics education have tended to be articulated by Government as preparation for life in these four settings, but with a greater emphasis on skills for employment at a range of levels and therefore on the economic implications of education in these areas. The Nuffield Review has argued that, while the wider benefits of education receive some attention, these tend to be overshadowed by economic concerns (Nuffield Review of 14–19 Education and Training 2008). Science education has been focused on as a means to increase the number of scientists in order, first and foremost, to grow the amount of research, development and innovation in the UK. This is presented as an almost direct path to maintaining and improving a high-value economy and international competitiveness (DfES 2006a; HMTreasury 2006; DIUS 2007; Sainsbury 2007). The focus for mathematics has tended to be on attainment at more basic levels. The fundamentals of mathematics – often packaged with the fundamentals of language in the term ‘literacy and numeracy’ – have tended to be treated as a primary basic requirement for the overall population in order to raise productivity (DfES 2005; DIUS 2007).
This report is underpinned by a broad and pragmatic view of the purpose of science and mathematics education, which might be expressed as: to enable as many students as possible
to participate in the scientific and mathematical elements of the conversation of humankind, in as many settings as possible. Achieving this purpose will involve:
providing a broad, balanced and coherent science i.curriculum that, through the enthused teaching of specialist teachers, caters for all backgrounds, abilities and aspirations and enables students to achieve to their full potential;
providing a mathematics curriculum that, through the ii.enthused teaching of specialist teachers, caters for all backgrounds, abilities and aspirations, enabling students to achieve to their full potential and at the same time providing those studying science and other numerate disciplines pre- and post-16 with the solid mathematical grounding they require;
maximizing the opportunities and encouragement for all iii.young people to study science and mathematics beyond the end of compulsory schooling;
providing a science and mathematics education that is iv.sufficient to enable people to function in everyday life and engage in contemporary and future technological and scientific debates that arise in societies;
providing an education that is equitable, taking account v.and actively addressing the needs of all individuals regardless of gender, ethnicity and socioeconomic status.
In addressing these issues this report will not become deeply involved in debates about curriculum content or pedagogy, but focus on what is known about attainment, participation, progression and inclusion. It is of course clear that, in addressing the purposes identified above, questions of curriculum and pedagogy, some of which may be controversial, cannot ultimately be avoided. Nevertheless the report will focus on what may be learned from the outcomes of the present systems of science and mathematics education, as they are identified through our existing methods of monitoring and measurement. It will also seek to identify where those methods are not adequate.
22 I Science and mathematics education, 14–19 The Royal Society
1.2 The purpose of this report
The report focuses specifically on science and mathematics education for 14–19 year olds.2 In England, Northern Ireland and Wales this includes the first point at which pupils are able to exercise choice about what subjects are studied, as well as the end of compulsory education and the first years of voluntary education. While 14–19 therefore currently includes two quite different phases of education, it is increasingly being treated as one block in policy reviews, a pattern which looks set to be formalized with the introduction from 2008 of the new 14–19 Diplomas in England and with the age of compulsory education and training in England likely to be raised to 18 in 2015.3 Similar changes do not appear to be happening in Scotland, with 12–15 and 16–18 still being seen as separate phases of learning and recently announced proposals for reform likely to maintain these phases, but giving more flexibility in progression for individual students.
Our ongoing worries about the supply of British STEM (science, technology, engineering and mathematics) graduates and postgraduates have been articulated in the Royal Society reports A degree of concern? (Royal Society 2006a) and A higher degree of concern (Royal Society 2008a). These identify the importance of STEM graduates to the UK research base, the supply of STEM professionals and the mix of discipline backgrounds in the wider workforce. In Increasinguptake of science post-16 (Royal Society 2006b) we briefly considered, for England, the rates of progression to A-level biology, chemistry and physics in the light of the general decline in entrants in chemistry and physics.
As we shall see in chapter 3, a general decline since 1996 in chemistry, physics and mathematics participation is apparent in England, Northern Ireland, Wales and Scotland. While in some cases this decline in post-16 participation is showing signs of flattening out or even increasing, we remain concerned about the rates of participation post-16 and the implications these have for the number of students who are adequately prepared for higher education. These concerns are reinforced by the 2008 CBI education and skills survey, which found that 59% of the UK businesses surveyed were having difficulty recruiting STEM-skilled individuals, with 29% of firms being concerned about the shortage of STEM graduates (CBI 2008).
In response to the 1998 and 1999 consultations on the science National Curriculum for England and Wales the Royal Society held to the position that the number of 16 year olds taking at least two GCSEs in science should be maintained at approximately 80%. Taking two GCSEs translates to approximately 20% of curriculum time devoted to science. While the changes to science GCSEs in England and Wales mean that double-award science GCSE is now no longer
2 Most students turn 18 during their final year of schooling if they choose to stay on, with some being close to 19. Convention in most parts of the UK refers to post-16 schooling as 16–19.
3 See http://services.parliament.uk/bills/2007-08/educationandskills.html
available,4 and has been replaced instead by core, additional and additional applied science GCSEs, we still consider that the sciences cannot be adequately taught in less time than two GCSEs or their equivalents. It is difficult to apply the argument about time spent studying science to the Scottish education system due to differences in the curriculum and qualification structure. The Scottish curriculum simply requires the study of one of biology, chemistry, physics or general science at ages 14–16 (S3 and S4).5 The Scottish qualifications at that level, Standard Grade and Intermediate, were not conceived of as enabling full coverage of biology, chemistry and physics for all students. Pupils taking one science qualification spend around 13% of classroom time doing science, while those taking more than one science subject spend substantially more time than this on science.
Despite the differences between education systems in the UK, it remains important that the majority of students gain a good exposure to science, regardless of whether they are not going on to further study or else continuing their education in non-science subjects. This is because, as we indicated in §1.1,knowledge of science is a component of what it means to be educated and a grounding in science is important for handling many of the issues and debates people are likely to encounter in their daily lives in contemporary society. Similarly, for mathematics, we consider that a solid grounding for all in mathematics up to age 16 (Key Stage 4 or S4) and, for the majority, further study at a level beyond GCSE or Standard Grade/Intermediate is needed so that people can function effectively in their personal and professional lives.
As with the first ‘state of the nation’ report (Royal Society 2007), we seek here to bring together the available data on 14–19 year olds’ involvement in science and mathematics education, to evaluate those data in light of Government goals, and to ask, where possible, what the policy implications of the available data are. It appears to be particularly important to do this now given the amount of change that is either happening or scheduled to happen in science and mathematics education in 14–19 education. These changes are outlined in chapter 2.
1.3 The content of this report
This report examines participation, attainment and some aspects of progression in science and mathematics education for 14–19 year olds in the UK in the period since 1996. This timeframe begins at a point when the qualifications offered under the National Curriculum in England and Wales and the Northern Ireland Curriculum were well established and Standard Grade courses and associated revised Scottish Highers were similarly well established in Scotland.
4 Aside from double-award applied science. Note that CCEA in Northern Ireland has opted to retain traditional double-award science.
5 For more on the structure of the education systems operating in the UK, see table 3.2 in chapter 3 of this report.
‘State of the nation’ report I 23The Royal Society
The core part of the report, chapter 3, presents data for England, Northern Ireland, Scotland and Wales generally drawn either from publicly available data or from the information recorded by each of the four administrations. As we are interested in discerning overall patterns for the UK, the main focus is on the qualifications that the majority of 14–19 year olds take: namely GCSE and A-levels in England, Northern Ireland and Wales, and Standard Grade, Intermediate, Highers and Advanced Highers in Scotland. The focus for science subjects is on biology, chemistry and physics and on the combined science provision available mainly to 14–16 year olds (GCSE double-award science, GCSE single-award science and Standard Grade science). We have considered psychology and recorded participation in ‘other sciences’ where these appear to be significant. We have intentionally not sought to cover more widely the remaining subjects in the STEM grouping because we do not wish to distract from fundamental issues of 14–19 science and mathematics education. We have included a consideration of the main forms of vocational and applied science and mathematics education, but not examined them in great depth because, aside from difficulties with data availability, the extent of change and the great number of initiatives that have occurred since 1996 make it difficult to do justice to a consideration of this large and complicated area. Furthermore the participation rates in vocational science and mathematics are low compared to those in ‘academic’ qualifications.
Other chapters of the report are concerned largely with putting the participation and attainment data in context. Chapter 2 provides an outline of the recent history of the education systems in the four UK nations, including relevant qualification changes that have occurred in response both to increased centralization of the curriculum and to the broadening of participation in post-16 education. Chapter 4 considers the UK systems of assessment in light of data from international surveys on participation and attainment in science. Chapter 5 examines data on the ways that gender, ethnicity and socioeconomic status impact on participation, attainment and progression and draws on a selection of research that seeks to explain observed differences. Chapter 6 further attempts to explain observed patterns in participation by considering research on students’ attitudes towards science and mathematics education. The data presented for each of the four UK nations show similarities, but also a great deal of variation that is not easily synthesized. Finally, chapter 7 attempts to draw together these data in order to assess the current state of UK 14–19 science and mathematics education.

24 I Science and mathematics education, 14–19 The Royal Society
The Royal Society ‘State of the nation’ report I 25
There has been a great deal of change in the education sector in the UK, in each of England, Northern Ireland, Scotland and Wales during recent decades, and the pace of that change is accelerating. While the central focus of this report is on reporting and evaluating the changing patterns of participation and attainment, it is important to have an understanding of the institutional and policy context in which these patterns have occurred. This chapter reviews that context for each of the four nations, covering particularly the last decade but, where appropriate, discussing earlier developments. Particular attention is given to the changes over time in the intended participants in science and mathematics education, the pattern of institutions in which they are taught and the qualifications that are available to them (all of which have changed over time). Some more limited attention is also given to governance.
Since overall responsibility for the education systems in England, Northern Ireland and Wales lay with the UK Government until 1999, legislation, qualifications and curricula across these three nations have been relatively uniform. However, the differences between England and Wales were less great than those between these nations and Northern Ireland. Since devolution occurred in 1999, these differences have increased further. Scotland, having historically had a separate education system, provides a quite different context in terms of governance and, especially, the system of 14–19 qualifications.
The first section of this chapter considers England and Wales, although some of the key issues it refers to – notably the challenges of ‘comprehensivization’ and the extension of post-16 study – apply across most of the jurisdictions. The second section outlines those features of the Welsh system that differ from those in England, notably the introduction of the Welsh Baccalaureate. The third section is focused on Northern Ireland, while the fourth section describes the markedly different system and provision in Scotland.
2.1 England and Wales
2.1.1 Looking back
During the mid 20th century the science and mathematics curricula of grammar and public schools were designed for
those considered to be more able and who might be expected to progress further their studies in these disciplines. The system of O-level and A-level examinations, introduced in 1951, was meant for these students. The universities were influential in establishing this examination system, reflecting the fact that these qualifications were to a significant extent considered precursors to university education.
It is less clear what science and mathematics was taught in other secondary schools. Prior to World War II various forms of post-elementary and junior technical schools had existed, mainly for working-class children. A mapping of the curriculum and the assessment regime onto three ‘types’ of children had been encouraged by the Norwood Committee (Norwood 1943). Accordingly the so-called tripartite system established under the 1944 Education Act created three different types of school: grammar, secondary modern and technical. It was close to a formal Government policy that the curriculum and the modes of certification for the latter two were best determined locally. Their curriculum was often claimed to be focused on students’ everyday, workplace and other practical needs. In sum the three types of school were able to assume, not necessarily accurately, that they were each catering for children with relatively uniform needs. In broad outline these comments might also be applied to Northern Ireland.
This system began to be dismantled in the 1950s. A number of comprehensive schools were established in England and Wales as alternatives to grammar and secondary modern schools: they were intended to cater for students of all likely levels of attainment. Following a Labour Government Circular in 1965, most maintained schools were reorganized during the 1970s and 1980s, and the newly created comprehensives could not assume that students’ needs and aspirations were uniform. In 1972 the school-leaving age was raised from 15 to 16. Comprehensivization and a school-leaving age of 16 established key elements of the environment for secondary education that would last until the end of the century. During the early part of this period the Certificate of Secondary Education (CSE) was introduced, catering in principle for the 40% of the attainment range below O-level, in each subject. The situation was rendered more complex by a rapid decline in the labour market for unqualified school leavers from the late Seventies onwards, which created a need for reformed post-16 provision.
2 The context of science and mathematics education in the UK
In this chapter we present a brief overview of education system reform across the UK, covering the period from the mid 20th century to the present day, and focusing in particular on the effects that policy changes have had on educational establishments, qualifications and, wherever appropriate, science and mathematics education.
26 I Science and mathematics education, 14–19 The Royal Society
In England, though the system of comprehensive schools has largely remained, and there has been no wholesale shift to selection, several new school types with different governance, accountability and funding arrangements have been introduced in the last decade. Academies, originally called ‘City Academies’, were introduced by the Learning and Skills Act 2000. They are publicly funded independent schools intended to raise achievement in disadvantaged urban areas, generally built on the site of or taking over from failed maintained schools. To give them the flexibility to innovate and meet the needs of their students Academies are not required to follow the National Curriculum, although the majority still participate in Key Stage 3 tests and GCSE examinations.
The specialist schools programme, which grew out of the City Technology Colleges programme introduced by the Conservative Government in the Eighties, was expanded to include a wider range of subjects and increased in number from 245 schools in 1997 to 1000 in 2001.6 The purpose of these schools is to promote diversity in the education system: the raising of performance in one curriculum area is claimed to lead to improvements in the school as a whole, not least because of the process of bidding for specialist status.7,8 Such specialist schools must offer the full statutory curriculum. By June 2008 there were 351 schools with science as a first specialism and 31 with it as second specialism: a total of 382, or something over 12% of all maintained schools. Similarly there were 282 schools with mathematics and computing as a first specialism and 29 with it as a second specialism, a total of 311, or about 10% of all maintained schools.9
Of all A-level candidates in England in 2007, 20% were at sixth form colleges and 11% were at other FE sector colleges.10 The Further and Higher Education Act 1992 conceptualized FE and sixth form colleges as the site of provision of full-time education for 16–19 year olds in England and Wales, other than schools and City Technology Colleges (Evans 2007).11 In addition to the provision of vocational qualifications such as BTECs, FE colleges have
6 ‘History of the trust’, pages accessed March 2008. Specialist Schools and Academies Trust. (See http://www.specialistschools.org.uk/about/historyofthetrust/default.aspa)
7 Specialising in success, pages accessed March 2008. Specialist Schools and Academies Trust. (See http://www.specialistschools.org.uk/uploads/documents/specialising%20in%20success_100.pdf)
8 To achieve specialist status, schools seek private sponsorship for a capital project related to their specialism which is matched double by the Government begun by the Conservative Government in the late 1980s.
9 Sarah French, DCSF, personal communication, 19 June 2008.
10 Includes 16–18 year old GCE, VCE and applied A/AS-level candidates. Adapted from DCSF (2008).
11 Colleges of further education in their current form evolved from the locally administered technical colleges of the former part of the 20th century. See Evans (2007), p. 33.
reasonably high numbers of students doing GCSEs, A-levels and their vocational equivalents.12
2.1.2 The National Curriculum and GCSEs
The key policy shifts in secondary education during the closing decade of the last century were the introduction of a common system of 16 examinations – GCSEs (General Certificates of Secondary Education), from 1988, and the creation of a statutory National Curriculum (for maintained schools only) in 1989. They introduced a greater degree of institutional uniformity and centralization to the system. The GCSE, which replaced both O-level and CSE, was meant for a wider range of students and, despite being originally intended for the top 60% of the attainment range in each subject, became the preferred mode of summative assessment at 16 for nearly all students. This significance was determined in part by the growth of school performance tables, which in secondary schools were dominated by performance in the GCSE. The introduction of the National Curriculum, under the Education Reform Act 1988, gave the Government direct statutory authority over the curriculum and its intended outcomes, though ostensibly not over teaching methods. Maintained schools were required to teach specific subjects, cover specified areas of knowledge and assess them according to criteria-referenced standards. A system of attainment targets and programmes of study was created by Government to regulate this process.13
The performance tables were part of an increasing range of accountability measures to which schools were subject. These included National Curriculum tests in mathematics, English and science at Key Stages 1–3 (primary and early secondary), and GCSE examination results at Key Stage 4.14
The percentage of students attaining five ‘good’ GCSEs (A*–C) has become the key school performance measure at Key Stage 4 and has included English and mathematics since 2006. In 2007 the percentage of pupils attaining two or more ‘good’ science GCSEs was introduced as a separate indicator. These measures appear in the public domain and, therefore, they are seen by schools as extremely important. They strongly influence perceptions of school quality among parents and the local community, though it is less common for account to be taken of the attainment of students on entry to schools.
While the majority of GCSE examinations were originally offered in three tiers, all subjects apart from mathematics
12 For example, of the 556,400 16 and 17 year olds doing GCE and VCE A-levels, 56% were in maintained schools, 13% in independent schools, 19% in sixth form colleges and 12% in FE, tertiary and specialist colleges (DfES 2007a).
13 Prior to the Education Reform Act 1988 there were minimal statutory requirements on subjects taught and how they were covered. The 1944 Education Act only specified that religious education be taught, although in reality certain subjects were universal.
14 In England and Wales (and Northern Ireland) compulsory education is divided into four Key Stages (see table 3.2 in chapter 3 of this report).
‘State of the nation’ report I 27The Royal Society
were moved to the present two-tier system during the 1990s. The three-tier systems consisted of higher (grades A−C), intermediate (grades B−E) and basic (grades D−G), whereas the present system consists of Level 1, or foundation (grades C−G), and Level 2, or intermediate (grade C and above). Mathematics examinations continued to be a three-tier system until 2006, for first examination in 2007 or 2008. The A* grade was introduced for GCSEs in 1994 to differentiate the very top achievers. The levels just referred to formed part of the National Qualifications Framework (recently incorporated into the Qualifications and Credit Framework). Other jurisdictions, within and outside the UK, are developing such frameworks, and they provide a useful tool for purposes of comparison.
Double- and single-award GCSE science were first examined in 1992, largely replacing the separate science disciplines. This shift was the subject of some debate and controversy, particularly the ‘compression’ of the three separate main science disciplines into a double award and the introduction of single-award science at a time when schools were being encouraged to offer all students the equivalent of at least a double award. When single-award science was introduced it was sometimes suggested that it would be taken by a minority of high-attaining students who were unlikely to continue with science, choosing rather to focus on other areas. The pattern of examination results suggests, however, that single-award science was mainly adopted as a course and qualification for less highly attaining students.
Prior to the introduction of the National Curriculum, and double- and single-award science, there were marked gender differences in participation in the different science subjects at ages 14−16. It was hoped that double- and single-award science would address these differences and that, in doing so, participation at A-level would become more balanced. The change was successful at GCSE level, supported by the statutory authority of the National Curriculum, but it did not have the anticipated impact on A-level participation. We will discuss this issue at greater length in chapter 5.
The new century saw the introduction of a wider range of specifications in science. Double-award applied science, as one of the so-called ‘GCSEs in vocational subjects’, was introduced in 2002, for first examination in 2004. This was followed in 2006 with a radical reform of the science specifications available, patterned largely on the framework piloted within the Twenty-First Century Science project. Double-award science (with the exception of the applied science specification) does not now exist, and has been replaced by a range of single awards, including a single-award applied science. Schools and students are able to choose several different combinations of specifications. This offers the potential to adjust the Key Stage 4 curriculum more closely to students’ needs.
In addition to the various applied GCSEs, schools can offer other vocationally oriented qualifications such as BTEC and OCR Nationals. The evidence available from examination results suggests that these applied and vocational courses are
viewed by schools as not suitable for the most highly attaining students, or those expecting to follow the separate A-level sciences. Overall, the pattern of courses available to schools and their curriculum ‘offer’ has become increasingly complex and targeted. Many independent schools are adopting the International GCSE, although maintained schools are effectively debarred from offering it. The Government has also introduced targets to increase the uptake of the separate science disciplines, as a matter of policy. It encourages schools to offer them to all students attaining Level 6 at Key Stage 3, though it appears to have drawn back from making this a formal entitlement.
2.1.3 A-levels
There have been many changes in the detailed content of A-level sciences, and some innovative specifications (including the Nuffield Biology, Chemistry and Physics projects, Salters Chemistry, Salters–Nuffield Advanced Biology and Advancing Physics). In mathematics, several adjustments have been made, but there has been no major reform of content. A content core was established, compulsory for A-level science and mathematics courses. The most important systemic change at GCE level was the introduction of Curriculum 2000. A major review of 16−19 qualifications by Sir Ron Dearing led to this reform, which split the A-level qualification into Advanced Subsidiary (AS) and A2 examinations, and reinforced the modularization that had been emerging since around 1990. The other key change during the last three decades in post-16 education has been the increasingly broad participation in A-level study, and post-16 learning generally. This has been paralleled by a rise in the number of subject options available, including, for example, media studies and psychology. Participation in A-level education as a proportion of population more than doubled between the mid-1980s and mid-1990s.
The introduction of Curriculum 2000 had particular consequences for mathematics. The standard of AS mathematics proved too high for many candidates, primarily because of the amount of core content that needed to be covered in the AS year. To make AS more manageable the core was rearranged and the non-core material reduced, in September 2004. The increase of the core from one-half to two-thirds of the syllabus allowed for more extensive assessment of the core in the A2 year and revision of relevant GCSE mathematics in the AS year.
A-levels, like other public qualifications, remain under close scrutiny amidst concerns that standards may be falling. There have been increasing numbers of students attaining the highest grades in A-levels. The percentage of entrants achieving grade A rose from 16% in 1996 (DfES 2006a) to over 25% in 2007 (DCSF 2008a). To enable the differentiation of the very top students a new A* grade is to be introduced from 2010, echoing its introduction within GCSE in 1994.
The period since 1990 has also seen a growing emphasis on ‘vocational’ qualifications post-16, representing in part a
28 I Science and mathematics education, 14–19 The Royal Society
response to the reduced labour market for those wishing to leave school at 16. This process is widespread internationally (Lauglo & Maclean 2005). A Level 3 qualification, GNVQ, had been introduced in the early 1990s as a response to the increasing numbers of students remaining in full-time education. It was quickly adopted by schools and colleges for less highly attaining students and those seeking a ‘second chance’ alternative route into higher education. It has been successively replaced by the AVCE (from 2001) and Applied A-levels (from September 2005). In addition, some smaller mathematics units, called free-standing mathematics qualifications (FSMQs) were introduced from 2001 to blend in with these vocational courses. One of these, Additional Mathematics, takes the form of an accredited qualification in Northern Ireland. An AS qualification called ‘Use of Mathematics’ includes these FSMQs.
In England, as in the other three UK nations, the mechanisms of statutory control, accountability and inspection involve three broad institutional elements: a department of state (loosely speaking) with overall authority for policy and implementation (currently the DCSF in England); a semi-independent body which regulates qualifications and the curriculum (in England, this is the QCA, recently augmented by Ofqual, the ‘regulator of qualifications, tests and standards’); and an independent inspectorate for schools (Ofsted). While the relationship between these various bodies, the distribution of their responsibilities and their mode of operation all show significant variations from nation to nation, their core functions in aggregate cover the domains just identified.
2.1.4 Ongoing reforms
There are several recent and planned changes to the National Curriculum and science and mathematics qualifications which will doubtless have a major impact on the future 14−19 landscape. At GCSE level, the science specifications that began to be taught in September 2006 are based on a curriculum model that encourages students to take different routes depending on their interests, aptitudes and career intentions. The common core, to be taken by all students, is focused less on providing the next generation of scientists (though it contributes to this) than on helping to prepare all students for a life in which they will need to be scientifically literate so as to deal with the many issues that science raises. With the exception of applied science there is now no double-award science qualification: all are single awards and can be mixed as appropriate. However, many schools also take other Level 2 qualifications offered within BTEC or OCR Nationals. It will, of course, not be possible for several years to appreciate fully the impact of the new science GCSEs in England, Northern Ireland and Wales.
Mathematics at GCSE level is due to undergo substantial change. From 2010 it is expected that there will be two GCSEs in mathematics, to better reflect the substantial time and effort devoted to mathematics by students during their education. This report calls them simply GCSE Mathematics 1 and GCSE
Mathematics 2 since their official names have yet to be determined. At the same time as these are being introduced, the Government has also committed to introducing a new qualification called ‘functional mathematics’ at Level 2 (a level similar to that required to attain a C in GCSE), which will be separately certificated and will be a prerequisite for grade C or better in GCSE Mathematics 1.
There is little prospect of a period of stability in post-16 qualifications. The 2004 review undertaken by Mike (now Sir Mike) Tomlinson in England recommended an overarching ‘Diploma’ integrating vocational and academic qualifications (Tomlinson 2004). After initially responding by proposing a more limited range of Diplomas, the Government has gradually extended their scope, including an announcement in October 2007 that Diplomas in science, humanities and languages will be developed. The Government has appointed the committee which will develop the Science Diploma and produced a Green Paper to consult on a range of proposals related to its future development. Despite the planned widening of the Diplomas, their introduction represents a particular threat for mathematics because A-level mathematics at present is taken by students with wide-ranging interests, not simply by those with science backgrounds. One of the proposals for the future is that after the introduction of the Diplomas, applied A-levels will be withdrawn. Since the timeframe for these activities extends to 2013, and is for some proposals even longer, it is premature to discuss their impact. It is nevertheless clear that there remains a very extensive agenda for change.
2.2 Wales since the creation of the Welsh Assembly
The principal aim of this section is to review those developments in Wales which are distinctive, particularly since devolution and the inception of the Welsh National Assembly in 1999.
2.2.1 Prior to 1999
Until devolution, education, including science and mathematics education for 14−19 year olds in Wales followed a very similar trajectory to that in England. However, Wales differed significantly from England in one respect: the Welsh language was, and is, the medium of instruction across the curriculum in about 20% of secondary schools. The first specifically designated school of this type was opened in 1957. Secondary schools in Wales have been entirely comprehensive since 1977. Though the structure of the examination system has been very similar to that of England, year 11 pupils and post-16 students mainly sit the examinations of the Welsh Joint Education Committee (WJEC, established in 1949), though there is also considerable use of other examination boards. Significant numbers of English schools also take up WJEC specifications.
‘State of the nation’ report I 29The Royal Society
2.2.2 Changes post-devolution – the Welsh Baccalaureate and curriculum change
Following its inception in 1999, the National Assembly in Wales has issued a series of independent strategic documents, which have led to significant reforms. Between 1995 and 2000 the tests set at Key Stage 1, Key Stage 2 and Key Stage 3 were uniform across Wales and England. From 2001 there have been some differences of test items/questions and the performance tables have not named individual schools. From 2006 students were no longer required to sit National Curriculum tests at Key Stage 3, with only teacher assessment being used. A new curriculum (across all subjects) from the Foundation phase (under age 5) through to Key Stage 4 comes into effect in September 2008; the relevant documents were issued to schools in January 2008. This new curriculum gives greater prominence to skills and is less specific about subject coverage than in previous programmes of study of the National Curriculum. This reflects shifts that are occurring also in Northern Ireland and Scotland.
Changes to qualifications are also in train for 14−16 year olds and post-16 students. The Assembly’s policy of developing Learning Pathways means that schools and colleges will have considerable freedom to compose ‘individualized’ courses. Furthermore, in September 2002 piloting began for the Welsh Baccalaureate, a notable departure from what was happening in England. The Welsh Assembly Government aims to have 40% of students taking part in the qualification by 2010.15
While science continues to be a compulsory part of the curriculum at Key Stage 4, it is not a requirement for any of the levels of the Baccalaureate. The qualification – which can be taken at foundation, intermediate or advanced level – incorporates GCSEs, AS- and A-levels, though the subjects are not specified. The Baccalaureate also assesses a wider core curriculum that includes key skills, Welsh culture, Europe and the world, a foreign language, work-related education and personal and social education.
Wales is not adopting the Diploma arrangements being introduced in England. GCSE Mathematics 2 will take a different form from that in England, with a curriculum that goes beyond mathematics GCSE Mathematics 1. Functional mathematics is not going to be introduced as a certified examination as is planned for England.
2.3 Northern Ireland
Northern Ireland has historically had separate, but parallel, legislation to that of England and Wales, having been created as an administrative division of the UK in the 1920s. The Education Act (Northern Ireland) 1947 put in place the same tripartite system as seen elsewhere. In contrast to the rest of the UK, however, the practice of academic selection has been retained until very recently. Grammar schools are still widely established, although the test at age 11 (referred to as the
15 Welsh Assembly Government, accessed March 2008. (See http://www.wbq.org.uk/news/1503)
11-plus transfer test) for entrance to selective schools is due to be phased out in favour of other available data on students’ aptitudes, interests and needs. The last 11-plus tests will be sat in 2008. There are no City Technology Colleges or Academies in Northern Ireland, although a small-scale pilot of specialist schools was begun in 2006. The Northern Ireland Curriculum, with its statutory programmes of study, was implemented from 1990 following the Education Reform (Northern Ireland) Order 1989 and was very similar to that implemented in England and Wales under the 1988 Education Reform Act. The Northern Ireland Council for the Curriculum, Examinations and Assessment (CCEA) combines the functions of a regulatory body and awarding body. Since Northern Ireland shares a qualifications system with England and Wales, the qualifications developments outlined within the England/Wales sections of the chapter apply to Northern Ireland.
2.3.1 Science
Prior to the implementation of the Northern Ireland Curriculum schools were free to offer science courses that were considered appropriate to pupil ability. However, breadth, in terms of coverage of biology, chemistry and physics, was not required. This meant that many schools, particularly those which were selective, would offer a choice of the separate GCSE sciences, with pupils allowed to study all three or any combination. Where pupils were not likely to undertake science study post-16 they would often select one science at GCSE or not opt for any science. Subject selection was patterned along gendered lines, with girls tending to take biology and boys taking physics or physical sciences. The range of provision was often innovative, although the science offered to lower-achieving students was sometimes limited.
The introduction of statutory programmes of study for science across Key Stages 1−4 (for 4−16 year olds) provided a marked change in the curriculum. As in England and Wales, science provision was required to be both broad and balanced, through the inclusion of appropriate study of elements of biology, chemistry and physics. With this requirement GCSE choice changed substantially and the options available were limited to those that covered the whole curriculum, namely: separate sciences (with all three GCSEs required to be taken), double-award (two GCSEs incorporating elements of biology, chemistry and physics) or single-award (one GCSE including all three disciplines). Pupils in Northern Ireland have the option, potentially, of sitting examinations not only set by the CCEA but also AQA, Edexcel and OCR in England and WJEC in Wales.
In grammar schools, which traditionally favoured the separate sciences, there was an initial suspicion about double-award science. Indeed, a public debate occurred around 1993/94 as to whether the double-award science GCSE was an adequate preparation for GCE A-level sciences. Despite this, double-award science is now the main science provision in many schools, though, as will be seen in chapter 3, the percentage of the GCSE cohort taking double-award science, around 50%, remains low compared to England and Wales. One reason for
30 I Science and mathematics education, 14–19 The Royal Society
this has been the success of single-award science – taken by around 35% of the cohort. Single-award GCSE science is claimed to accommodate two distinct groups of 14–16 year olds: higher-attaining students, mainly in grammar schools, who do not wish to take science beyond 16, and lower-attaining pupils in secondary schools for whom the double award is considered too demanding.
In 1999, the year in which elections for devolved authorities took place in Northern Ireland, Scotland and Wales, the CCEA began a review of the curriculum. Following extensive consultation, proposals for restructuring of the curriculum were approved under the Education (Northern Ireland) Order 2006, with the new curriculum being phased in from September 2007. At Key Stage 4 the new curriculum is designed to increase flexibility through a reduced compulsory element. This includes learning for life and work, physical education, religious education and developing skills and capabilities but does not specify subject coverage.16 The biggest change is that detailed requirements for individual subjects are no longer specified in legislation; thus control of what is taught to 14−16 year olds is controlled through GCSE subject criteria. There will no longer be statutory assessments at Key Stages 1−3, but instead standardized annual reports called ‘pupil profiles’.
These changes to the statutory curriculum in Northern Ireland have had particular implications for science. The reduced curriculum and removal of subject programmes of study devolve decision-making on the Key Stage 4 curriculum to schools in far greater measure. Schools will be able to decide on the most appropriate courses and qualifications to offer at both Key Stage 4 and post-16 within the requirements set out by an ‘entitlement framework’ requiring the offer of a balance of general/academic and vocational/applied courses.17 Pupils’ decision making is to be supported by informed careers advice and guidance, and it is intended that continued participation in science is to be ensured through this avenue. Despite this expected support, there appears at face value to be a risk that with science no longer compulsory at Key Stage 4 participation at this level and post-16 could be reduced.
Like Wales, Northern Ireland is not yet adopting the Diploma arrangements being introduced in England. Within the CCEA there are no plans at present to remodel the double-award specifications toward a ‘core’ and option configuration, as has been done with the other UK awarding bodies, so many students in Northern Ireland will still have an opportunity to enter double-award science.
2.3.2 Mathematics
The introduction of statutory programmes of study for mathematics in 1990 was less challenging for schools than
16 ‘The revised Northern Ireland curriculum’, accessed March 2008. (See http://www.deni.gov.uk/index/80-curriculumandassessment_pg/80t-statutory-curriculum.htm)
17 ‘Entitlement framework’, accessed March 2008. (See http://www.deni.gov.uk/index/80-curriculumandassessment_pg/22-entitlement_framework.htm)
was the case with science, because mathematics was already firmly embedded in the curriculum in both primary and post-primary schools. The new curriculum did, however, place a minimum requirement for the breadth of mathematics to be taught in all schools. It is perhaps worth anticipating chapter 3 here by noting that the higher attainment of Northern Ireland pupils in mathematics than their counterparts in England and Wales may in part be related to the emphasis in primary schools on mathematics in preparation for the 11-plus tests for entrance to grammar school.
The GCSE provision in Northern Ireland is of interest as a further specification is offered and accredited – additional mathematics. A specification with this title was once available in England and Wales at what was called AO-level, but the title now applies only to a Free-Standing Mathematics Qualification. In Northern Ireland additional mathematics is taken by around 15% of the GCSE cohort. It is seen as an added support for students expected to progress to GCE mathematics. Pupils, mainly in grammar schools, will take additional mathematics either in parallel with GCSE mathematics or after taking the GCSE mathematics in one year. GCSE Mathematics 2 will take a different form that in England, with a curriculum that goes beyond GCSE Mathematics 1. As with Wales, functional mathematics is not going to be introduced as a certificated examination as is planned for England.
2.4 Scotland
Scotland differs from the other three nations discussed in this chapter in that its education system is not only governed separately (including before the establishment of the Scottish Executive, now the Scottish Government) but there has been very limited overlap between national policies and those elsewhere in the UK. This is particularly evident in the structure of the curriculum and the examinations system. Another significant institutional difference was in the more decisive removal of selection. By 1977, over 95% of all secondary pupils were being educated in comprehensive schools compared with about 50% in 1967.
Despite these differences, it is fair to say that the Scottish education system has found itself responding to similar issues to those needing to be addressed elsewhere in the UK, if sometimes earlier. Therefore the move towards comprehensive education in the 1960s necessitated a review of the school curriculum in order to meet a broader spectrum of pupil needs. This was particularly the case in the first two years of secondary education and the later years of secondary education for non-academic pupils. Curriculum paper 7 – Science for general education (Scottish Education Department 1969) – set out a curriculum for all early secondary pupils, and required the inclusion of the ‘science which would best contribute to their general education’. Broad aims included some knowledge of the physical world (but with reduced emphasis on retention of factual content), communicating in science, observing objectively, exposure to moral, ethical and cultural issues, and interest and enjoyment.
‘State of the nation’ report I 31The Royal Society
At that time, the only certificated courses available to students were Scottish Certificate of Education (SCE) Ordinary Grades (O Grades) and Higher Grades. O Grades were initially designed for around the top 35% of 14−16 year olds (the S3 and S4 cohort)18 and the intention was that the rest would follow a curriculum with a ‘vocational impulse’ including a range of non-certificated courses. Many pupils attempted O Grades and failed. The introduction of a banding system helped meet the needs of some of these pupils, but did not fully resolve the problem.
2.4.1 Broadening provision – the introduction of Standard Grade
The O Grade system did not meet the needs of the majority of pupils and, from 1984 onwards, following the Munn Report on the curriculum (Scottish Education Department 1977a) and the Dunning Report on assessment (Scottish Education Department 1977b), Standard Grade courses were introduced to replace O Grades. Standard Grades were designed to enable all pupils aged 14−16, regardless of their prior attainment, to follow suitable courses and gain externally recognized awards. Most Standard Grade courses, including mathematics, were written at three levels, namely Foundation, General and Credit, and pupils typically followed a course, and were presented, at two adjacent levels. There was an expectation that pupils would follow a broad and balanced programme of seven or eight Standard Grades with subjects being chosen from the eight curriculum modes identified in the Munn report. However, the separate sciences of biology, chemistry and physics were only developed at General and Credit levels and therefore were not accessible to lower achievers. An integrated science course was developed, firstly at Foundation level, then General and finally Credit. It was not conceived from the outset as a three-level course and therefore was never intended to meet the needs of high-achieving non-scientists. In practice, most higher-achieving pupils followed courses in the separate sciences leaving lower-achieving pupils to follow Standard Grade science. This only served to reinforce the divide between academic and non-academic students. When Standard Grade courses were being developed in the sciences, careful consideration was given to the design of courses in order to minimize the risk of gender and ethnic bias. The broad pattern of gender choices echoes that elsewhere in the UK. This issue will be discussed again in later chapters.
The introduction of Standard Grade courses necessitated some revision of Higher Grade and Certificate of Sixth Year Studies (CSYS) courses to allow better articulation when pupils were moving into S5 and S6. These revisions, which
18 Secondary education in Scotland is divided as follows:
S1: pupils aged 12–13 } Compulsory. Pupils receive general educationS2: pupils aged 13–14S3: pupils aged 14–15 } Compulsory. Pupils specialize to some extentS4: pupils aged 15–16S5: pupils aged 16–17 } Not compulsoryS6: pupils aged 17–18
took place in 1990, were quite modest. Whereas Standard Grade provided courses and certification for all, provision in S5 and S6 was still geared towards the needs of the academically more able. Pupils who had achieved Credit level awards at Standard Grade had clear progression routes to Higher Grade in S5 and CSYS in S6. These courses were externally set, marked and certificated by the Scottish Examination Board (SEB). For those who achieved awards at General and Foundation levels, the provision was more limited. The ‘vocational impulse’ referred to earlier was also retained. A review of Scottish Vocational Education Council (SCOTVEC) National Certificate science modules resulted in a framework of graded modules which were designed to articulate with SEB awards at earlier stages. These modules, many of which had been written for students in FE colleges, were internally assessed and externally moderated. In practice, few schools provided suitably coherent and appropriate progression routes from General and Foundation levels.
2.4.2 Improving progression – the Higher Still development programme
The Howie Report (Scottish Office 1992), provided a detailed analysis of 16−18 provision in Scotland. The report recommended that the present end-of-school examinations be replaced by a Baccalaureate type system. Although this recommendation was not adopted at the time,19 the report generated a major review of upper secondary education, which led to the Higher Still Development Programme. The outcome of this for science and mathematics was a range of National Courses offered at six levels, namely Access 2 (SCQF Level 2), Access 3 (SCQF Level 3), Intermediate 1 (SCQF Level 4), Intermediate 2 (SCQF Level 5), Higher (SCQF Level 6), and Advanced Higher (SCQF Level 7). National Courses were designed to be offered to post-16 learners in the upper school and in FE colleges. They aimed to introduce greater coherence into the post-16 system of qualifications, and to promote parity of esteem between vocational and academic qualifications. They provided more appropriate progression routes from Standard Grade for the increasing number of pupils staying on at school post-16, for whom study at Higher level was inappropriate.
The one year National Courses, which were introduced from 1999, were intended to provide qualifications with similar structures across a number of levels to suit all learners, including those studying both academic and vocational courses. At Access level, they provided certificated courses for those with additional support needs in both mainstream and special education. Intermediate 1 and 2 courses allowed progression from Foundation and General levels, respectively. Higher Grade remained, like A-levels elsewhere in the UK, the ‘gold standard’, while Advanced Higher replaced the CSYS. As well as offering courses at most levels in biology, chemistry,
19 On 5 June 2008, the Scottish Education Secretary announced the introduction of science and languages baccalaureates, which will be awarded for the first time in 2010 (http://www.scotland.gov.uk/News/Releases/2008/06/05095816).
32 I Science and mathematics education, 14–19 The Royal Society
physics, and mathematics, additional courses were produced in more applied areas of science including biotechnology, geology, managing environmental resources (MER), psychology and human biology. Uptake of the first three applied courses has been modest, perhaps due to pressure from other curriculum areas, whereas uptake of human biology and psychology has been quite substantial (although not on the scale of England for psychology). During this period of significant change, the Scottish Qualifications Authority (SQA) was formed in 1997, taking on the dual responsibilities of the SEB and SCOTVEC.
In Scotland, changes to the curriculum and assessment have been driven by the need to cater for a wider range of pupil needs within a comprehensive system, as well as the growing number of pupils staying on beyond the end of compulsory schooling. More recent changes have allowed schools greater flexibility in relation to the needs of individual pupils. Age and stage regulations have been relaxed and curriculum flexibility has been introduced. So, for example, some schools now offer Standard Grade courses one year earlier, and the majority have replaced the integrated Standard Grade science course with Intermediate 1 courses in one or more of the separate sciences. The range of more flexible arrangements has been gradually increasing.
2.4.3 Ongoing reforms
In 2002, a major reform was set in motion. The Scottish Executive (now the Scottish Government) undertook an extensive consultation on the state of school education through the National Debate on Education. Ministers established a Review Group in 2003, the purpose of which was to identify the purposes of education 3−18 and principles for the design of the curriculum. The initial report, A curriculum for excellence (Scottish Executive 2004) identified the values, purposes and principles which should underpin the entire curriculum from age 3 to 18. This review is still ongoing, with consequent reforms in science education likely to involve taking greater account of recent advances in science and providing increased emphasis on social, moral and ethical issues. The revised guidelines in numeracy and mathematics provide increased emphasis on the relevance of mathematics for life, and its application in practical contexts. Although the current phase of development focuses on 3−15, significant changes are likely for 16−18 science and mathematics courses in order to make them consistent with the earlier stages. Curriculum for Excellence will also require revised assessment arrangements. The Cabinet Secretary for Education and Lifelong Learning has recently proposed that Standard Grade and Intermediate courses will be replaced by a new general qualification, following a period of consultation.
2.5 In conclusion
This chapter has offered a brief and selective account of the policies and policy differences in secondary education across the four UK nations. These differences are more complex than this account can do justice to. Furthermore, in recent years,
particularly in the wake of English devolution, the differences between the systems in the UK nations have increased, and seem likely to continue to grow. But it is perhaps fair to suggest that the challenges which policymakers have been required to address, and in some cases the manner of their response, show a good deal of commonality. A list of these challenges might include:
providing an education that is appropriate for all students i.of all capabilities, and not merely the most highly attaining: this need was of course always present, but was brought into focus by comprehensivization and the raising of the school-leaving age;
providing for the increasing number of students who ii.chose to remain in education after the end of compulsory schooling, often with different attainments, needs and motivations from those who had traditionally ‘stayed on’;
creating a system that allowed both academic and iii.vocational lines of study and acknowledged both to be of value;
monitoring and improving standards of attainment, iv.particularly as one of the principal modes of accountability, without thereby causing the curriculum to be ruled by summative assessment and its demands;
for both science and mathematics, creating provision v.which acknowledges the needs of all students, including those who will probably not go on to study these subjects post-16 but, ideally, does not remove this possibility entirely for any student;
specifically for science, coming to terms with the tension vi.between science understood as a single curricular area and science as a set of distinct disciplines with different demands, traditions and motivational appeals for students.
Among the common characteristics of the response to these challenges across the nations, at least in recent years, is an increasing emphasis on individualizing the curriculum. There is a broad acknowledgement that this will require schools and teachers to be allowed greater freedom to develop flexible responses. There is also evidence of commonality in the reforms in science and mathematics curricula that have been implemented. An important development which has received little attention here is the creation of ‘qualifications frameworks’, which demonstrate clear progression routes. They are also useful in allowing comparison to be made across the UK nations and beyond. The 2005 document Qualifications can cross boundaries − a rough guide to comparing qualifications in the UK and Ireland provides a means of undertaking such a comparison, though it is already out of date and due to be replaced.20
The remainder of this report does not attempt to cover exhaustively the response to these many challenges. It focuses particularly on issues of progression and attainment. However, almost all of the issues identified above are relevant to, and illuminated by, the data and analyses presented.
20 See http://www.qualifications-across-boundaries.org/compare/uk_ireland
The Royal Society ‘State of the nation’ report I 33
3 Participation and attainment trends in science and mathematics examinations undertaken by 14–19 year olds across the UK between 1996 and 2007
3.1 Introduction
Examining the recorded trends in participation and performance in science and mathematics among 14–19 year olds across the UK provides the principal objective measure of the relative success of each of the UK’s education systems and the clearest means to evaluate the impact of national legislative reform. The 12 year timeframe from 1996 to 2007 enables established trends to be monitored and, potentially, new or emerging trends to be identified. Its beginning, in the mid-Nineties, marks a time when the National Curriculum had become firmly established in England, Northern Ireland and Wales since its introduction in 1989, and Standard Grade courses and associated revised Scottish Highers were similarly well established in Scotland.
Each country is considered separately. Cross-country comparisons are included at the end of the chapter to see whether, notwithstanding differences in UK qualifications’ provision, it is possible to detect some overall patterns.
A finer examination of the data, exploring gender and ethnicity differences in respect of variation in participation and performance, is provided in chapter 5.
3.2 General data issues
Undertaking a trans-UK review of participation and performance in 14–19 qualifications is complicated by three issues.
The fact that, as shown in chapter 2, the educational i.systems and curricula in England, Northern Ireland,
Scotland and Wales have become increasingly heterogeneous, a process that has accelerated in Northern Ireland and Wales since the establishment of the National Assemblies. Below we give more consideration to the two qualifications frameworks operating in the UK.
Intra-country inconsistencies in the collection of data ii.over time and inter-country differences in the way that data are collected, collated and published (more of which will be said later in this chapter). In this respect, it is worth noting that each statutory, publicly accountable authority with responsibility for collecting and making available educational statistics in the UK carries out its obligations in different ways. The DCSF (England), Welsh Assembly and Scottish Executive/Scottish Qualifications Authority make a certain amount of information freely available on their websites, the content of which varies in its depth, breadth and accessibility. They also offer a supplementary service that handles specific data requests. In Northern Ireland, by contrast, most data are only available upon request from DENI.
Mid-term estimates of the population at a particular iii.age in any year have had to be adjusted to take account of the academic year in which candidates took their examinations. Therefore, although the population of 17 year olds in England in 1996 was estimated by the ONS to number 588,407 individuals, the timing of this estimate requires that this figure be used to approximate the size of the pool of 17 year olds taking examinations in the 1996/97 academic year.
In this chapter we review major national trends in participation21 and attainment in mainstream science and mathematics examinations among 14–19 year olds across the UK from 1996 to 2007 (the latest year for which data are available), relating these where possible to the effects of the educational reforms referred to in chapter 2 and other plausible factors, some of which are discussed in greater depth in later chapters. The chapter concludes with an evaluation of the data and recommendations for future work and research.
21 In this chapter, and throughout the rest of this report, participation translates as the number of individuals taking a particular examination. Data constraints mean that we are unable to account for those who embark on a course of study, but for whatever reason fail to complete it.
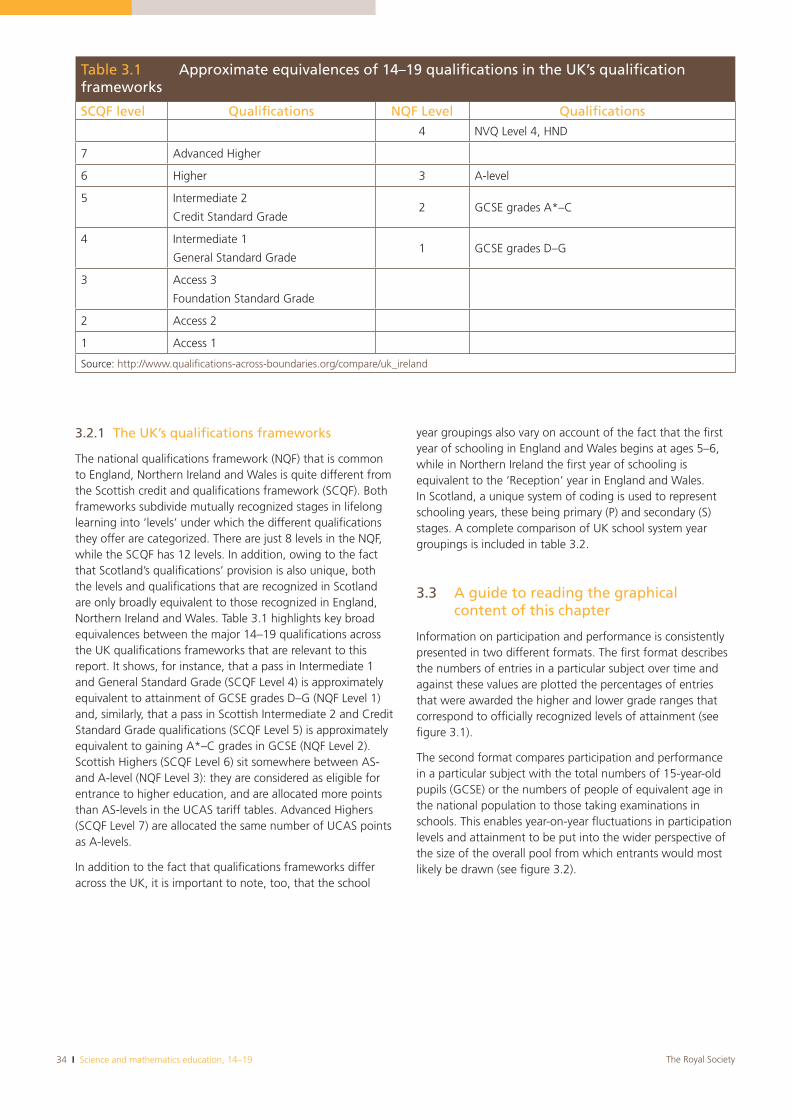
34 I Science and mathematics education, 14–19 The Royal Society
3.2.1 The UK’s qualifications frameworks
The national qualifications framework (NQF) that is common to England, Northern Ireland and Wales is quite different from the Scottish credit and qualifications framework (SCQF). Both frameworks subdivide mutually recognized stages in lifelong learning into ‘levels’ under which the different qualifications they offer are categorized. There are just 8 levels in the NQF, while the SCQF has 12 levels. In addition, owing to the fact that Scotland’s qualifications’ provision is also unique, both the levels and qualifications that are recognized in Scotland are only broadly equivalent to those recognized in England, Northern Ireland and Wales. Table 3.1 highlights key broad equivalences between the major 14–19 qualifications across the UK qualifications frameworks that are relevant to this report. It shows, for instance, that a pass in Intermediate 1 and General Standard Grade (SCQF Level 4) is approximately equivalent to attainment of GCSE grades D–G (NQF Level 1) and, similarly, that a pass in Scottish Intermediate 2 and Credit Standard Grade qualifications (SCQF Level 5) is approximately equivalent to gaining A*–C grades in GCSE (NQF Level 2). Scottish Highers (SCQF Level 6) sit somewhere between AS- and A-level (NQF Level 3): they are considered as eligible for entrance to higher education, and are allocated more points than AS-levels in the UCAS tariff tables. Advanced Highers (SCQF Level 7) are allocated the same number of UCAS points as A-levels.
In addition to the fact that qualifications frameworks differ across the UK, it is important to note, too, that the school
year groupings also vary on account of the fact that the first year of schooling in England and Wales begins at ages 5–6, while in Northern Ireland the first year of schooling is equivalent to the ‘Reception’ year in England and Wales. In Scotland, a unique system of coding is used to represent schooling years, these being primary (P) and secondary (S) stages. A complete comparison of UK school system year groupings is included in table 3.2.
3.3 A guide to reading the graphical content of this chapter
Information on participation and performance is consistently presented in two different formats. The first format describes the numbers of entries in a particular subject over time and against these values are plotted the percentages of entries that were awarded the higher and lower grade ranges that correspond to officially recognized levels of attainment (see figure 3.1).
The second format compares participation and performance in a particular subject with the total numbers of 15-year-old pupils (GCSE) or the numbers of people of equivalent age in the national population to those taking examinations in schools. This enables year-on-year fluctuations in participation levels and attainment to be put into the wider perspective of the size of the overall pool from which entrants would most likely be drawn (see figure 3.2).
Table 3.1 Approximate equivalences of 14–19 qualifications in the UK’s qualification frameworks
SCQF level Qualifications NQF Level Qualifications4 NVQ Level 4, HND
7 Advanced Higher
6 Higher 3 A-level
5 Intermediate 2
Credit Standard Grade2 GCSE grades A*–C
4 Intermediate 1
General Standard Grade1 GCSE grades D–G
3 Access 3
Foundation Standard Grade
2 Access 2
1 Access 1
Source: http://www.qualifications-across-boundaries.org/compare/uk_ireland
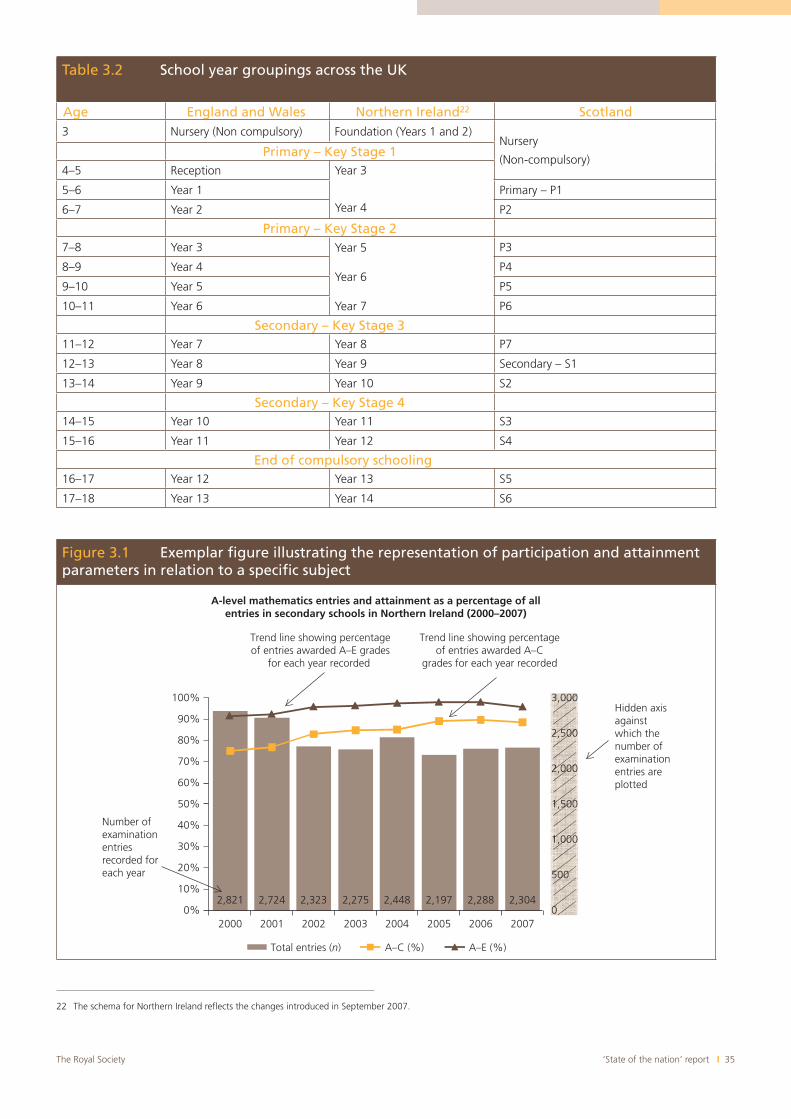
‘State of the nation’ report I 35The Royal Society
Table 3.2 School year groupings across the UK
3 Nursery (Non compulsory) Foundation (Years 1 and 2)Nursery
(Non-compulsory)Primary – Key Stage 1
4–5 Reception Year 3
Year 4
5–6 Year 1 Primary – P1
6–7 Year 2 P2
Primary – Key Stage 27–8 Year 3 Year 5
Year 6
Year 7
P3
8–9 Year 4 P4
9–10 Year 5 P5
10–11 Year 6 P6
Secondary – Key Stage 311–12 Year 7 Year 8 P7
12–13 Year 8 Year 9 Secondary – S1
13–14 Year 9 Year 10 S2
Secondary – Key Stage 414–15 Year 10 Year 11 S3
15–16 Year 11 Year 12 S4
End of compulsory schooling16–17 Year 12 Year 13 S5
17–18 Year 13 Year 14 S6
Figure 3.1 Exemplar figure illustrating the representation of participation and attainment parameters in relation to a specific subject
A-level mathematics entries and attainment as a percentage of all entries in secondary schools in Northern Ireland (2000–2007)
Hidden axis againstwhich the number of examinationentries are plotted
Trend line showing percentage of entries awarded A–E grades
for each year recorded
Trend line showing percentage of entries awarded A–C
grades for each year recorded
Number of examinationentriesrecorded for each year
2,821 2,724 2,323 2,275 2,448 2,197 2,288 2,3040
500
1,000
1,500
2,000
2,500
3,000
0%
10%
20%
30%
40%
50%
60%
70%
80%
90%
100%
2000 2001 2002 2003 2004 2005 2006 2007
Total entries (n) A–C (%) A–E (%)
Age England and Wales Northern Ireland22 Scotland
22 The schema for Northern Ireland reflects the changes introduced in September 2007.
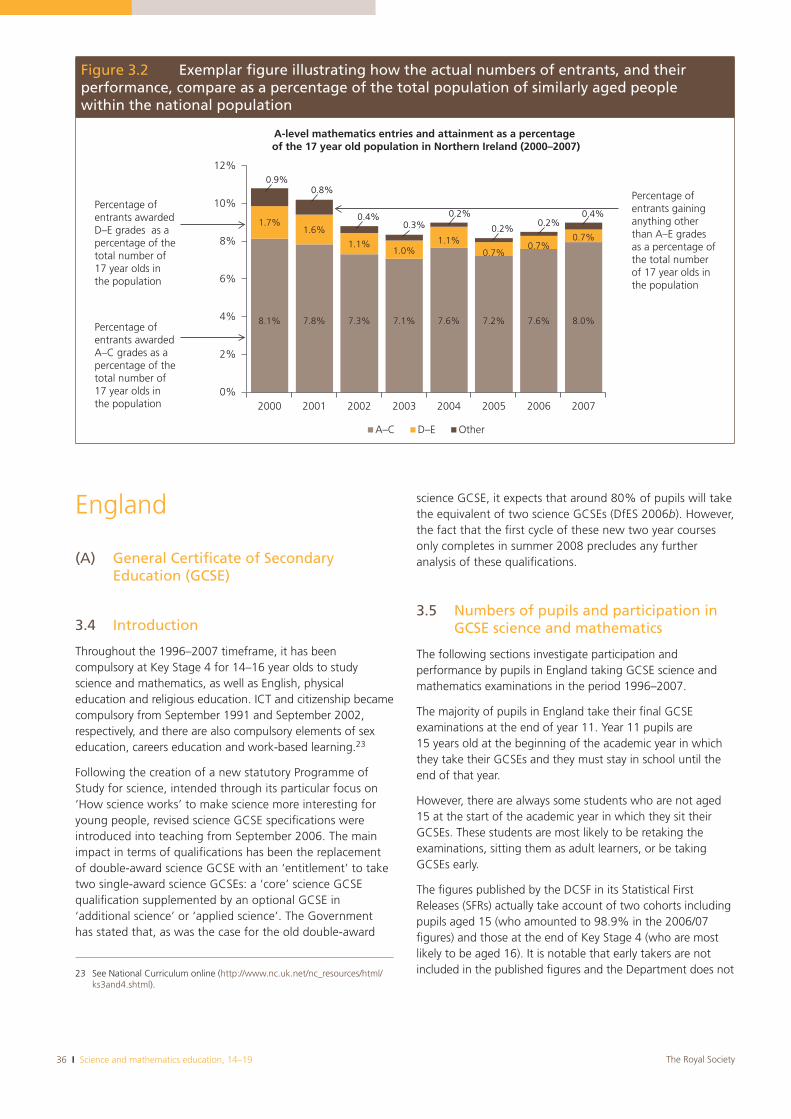
36 I Science and mathematics education, 14–19 The Royal Society
England
(A) General Certificate of Secondary Education (GCSE)
3.4 Introduction
Throughout the 1996–2007 timeframe, it has been compulsory at Key Stage 4 for 14–16 year olds to study science and mathematics, as well as English, physical education and religious education. ICT and citizenship became compulsory from September 1991 and September 2002, respectively, and there are also compulsory elements of sex education, careers education and work-based learning.23
Following the creation of a new statutory Programme of Study for science, intended through its particular focus on ‘How science works’ to make science more interesting for young people, revised science GCSE specifications were introduced into teaching from September 2006. The main impact in terms of qualifications has been the replacement of double-award science GCSE with an ‘entitlement’ to take two single-award science GCSEs: a ‘core’ science GCSE qualification supplemented by an optional GCSE in ‘additional science’ or ‘applied science’. The Government has stated that, as was the case for the old double-award
23 See National Curriculum online (http://www.nc.uk.net/nc_resources/html/ks3and4.shtml).
science GCSE, it expects that around 80% of pupils will take the equivalent of two science GCSEs (DfES 2006b). However, the fact that the first cycle of these new two year courses only completes in summer 2008 precludes any further analysis of these qualifications.
3.5 Numbers of pupils and participation in GCSE science and mathematics
The following sections investigate participation and performance by pupils in England taking GCSE science and mathematics examinations in the period 1996–2007.
The majority of pupils in England take their final GCSE examinations at the end of year 11. Year 11 pupils are 15 years old at the beginning of the academic year in which they take their GCSEs and they must stay in school until the end of that year.
However, there are always some students who are not aged 15 at the start of the academic year in which they sit their GCSEs. These students are most likely to be retaking the examinations, sitting them as adult learners, or be taking GCSEs early.
The figures published by the DCSF in its Statistical First Releases (SFRs) actually take account of two cohorts including pupils aged 15 (who amounted to 98.9% in the 2006/07 figures) and those at the end of Key Stage 4 (who are most likely to be aged 16). It is notable that early takers are not included in the published figures and the Department does not
Figure 3.2 Exemplar figure illustrating how the actual numbers of entrants, and their performance, compare as a percentage of the total population of similarly aged people within the national population
A-level mathematics entries and attainment as a percentage of the 17 year old population in Northern Ireland (2000–2007)
Percentage ofentrants awardedA–C grades as apercentage of thetotal number of17 year olds inthe population
Percentage ofentrants awardedD–E grades as apercentage of thetotal number of17 year olds inthe population
Percentage ofentrants gaininganything otherthan A–E gradesas a percentage ofthe total numberof 17 year olds inthe population
8.1% 7.8% 7.3% 7.1% 7.6% 7.2% 7.6% 8.0%
1.7%1.6%
1.1%1.0%
1.1%0.7%
0.7%0.7%
0.9%0.8%
0.4%0.3%
0.2%
0.2%0.2%
0.4%
0%
2%
4%
6%
8%
10%
12%
2000 2002 2003 2004 2005 2006 20072001
A–C D–E Other
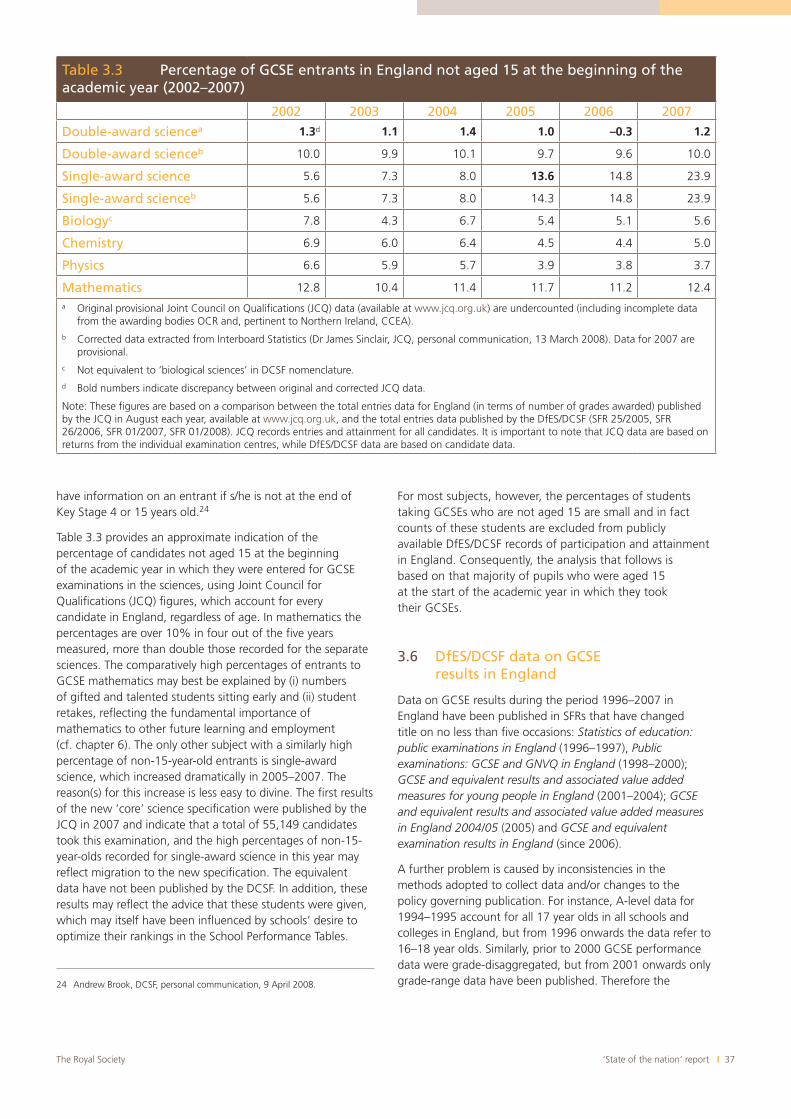
‘State of the nation’ report I 37The Royal Society
have information on an entrant if s/he is not at the end of Key Stage 4 or 15 years old.24
Table 3.3 provides an approximate indication of the percentage of candidates not aged 15 at the beginning of the academic year in which they were entered for GCSE examinations in the sciences, using Joint Council for Qualifications (JCQ) figures, which account for every candidate in England, regardless of age. In mathematics the percentages are over 10% in four out of the five years measured, more than double those recorded for the separate sciences. The comparatively high percentages of entrants to GCSE mathematics may best be explained by (i) numbers of gifted and talented students sitting early and (ii) student retakes, reflecting the fundamental importance of mathematics to other future learning and employment (cf. chapter 6). The only other subject with a similarly high percentage of non-15-year-old entrants is single-award science, which increased dramatically in 2005–2007. The reason(s) for this increase is less easy to divine. The first results of the new ‘core’ science specification were published by the JCQ in 2007 and indicate that a total of 55,149 candidates took this examination, and the high percentages of non-15-year-olds recorded for single-award science in this year may reflect migration to the new specification. The equivalent data have not been published by the DCSF. In addition, these results may reflect the advice that these students were given, which may itself have been influenced by schools’ desire to optimize their rankings in the School Performance Tables.
24 Andrew Brook, DCSF, personal communication, 9 April 2008.
For most subjects, however, the percentages of students taking GCSEs who are not aged 15 are small and in fact counts of these students are excluded from publicly available DfES/DCSF records of participation and attainment in England. Consequently, the analysis that follows is based on that majority of pupils who were aged 15 at the start of the academic year in which they took their GCSEs.
3.6 DfES/DCSF data on GCSE results in England
Data on GCSE results during the period 1996–2007 in England have been published in SFRs that have changed title on no less than five occasions: Statistics of education: public examinations in England (1996–1997), Publicexaminations: GCSE and GNVQ in England (1998–2000); GCSE and equivalent results and associated value added measures for young people in England (2001–2004); GCSEand equivalent results and associated value added measures in England 2004/05 (2005) and GCSE and equivalent examination results in England (since 2006).
A further problem is caused by inconsistencies in the methods adopted to collect data and/or changes to the policy governing publication. For instance, A-level data for 1994–1995 account for all 17 year olds in all schools and colleges in England, but from 1996 onwards the data refer to 16–18 year olds. Similarly, prior to 2000 GCSE performance data were grade-disaggregated, but from 2001 onwards only grade-range data have been published. Therefore the
Table 3.3 Percentage of GCSE entrants in England not aged 15 at the beginning of the academic year (2002–2007)
2002 2003 2004 2005 2006 2007
Double-award sciencea 1.3d 1.1 1.4 1.0 –0.3 1.2
Double-award scienceb 10.0 9.9 10.1 9.7 9.6 10.0
Single-award science 5.6 7.3 8.0 13.6 14.8 23.9
Single-award scienceb 5.6 7.3 8.0 14.3 14.8 23.9
Biologyc 7.8 4.3 6.7 5.4 5.1 5.6
Chemistry 6.9 6.0 6.4 4.5 4.4 5.0
Physics 6.6 5.9 5.7 3.9 3.8 3.7
Mathematics 12.8 10.4 11.4 11.7 11.2 12.4a Original provisional Joint Council on Qualifications (JCQ) data (available at www.jcq.org.uk) are undercounted (including incomplete data
from the awarding bodies OCR and, pertinent to Northern Ireland, CCEA).b Corrected data extracted from Interboard Statistics (Dr James Sinclair, JCQ, personal communication, 13 March 2008). Data for 2007 are
provisional.c Not equivalent to ‘biological sciences’ in DCSF nomenclature. d Bold numbers indicate discrepancy between original and corrected JCQ data.
Note: These figures are based on a comparison between the total entries data for England (in terms of number of grades awarded) published by the JCQ in August each year, available at www.jcq.org.uk, and the total entries data published by the DfES/DCSF (SFR 25/2005, SFR 26/2006, SFR 01/2007, SFR 01/2008). JCQ records entries and attainment for all candidates. It is important to note that JCQ data are based on returns from the individual examination centres, while DfES/DCSF data are based on candidate data.
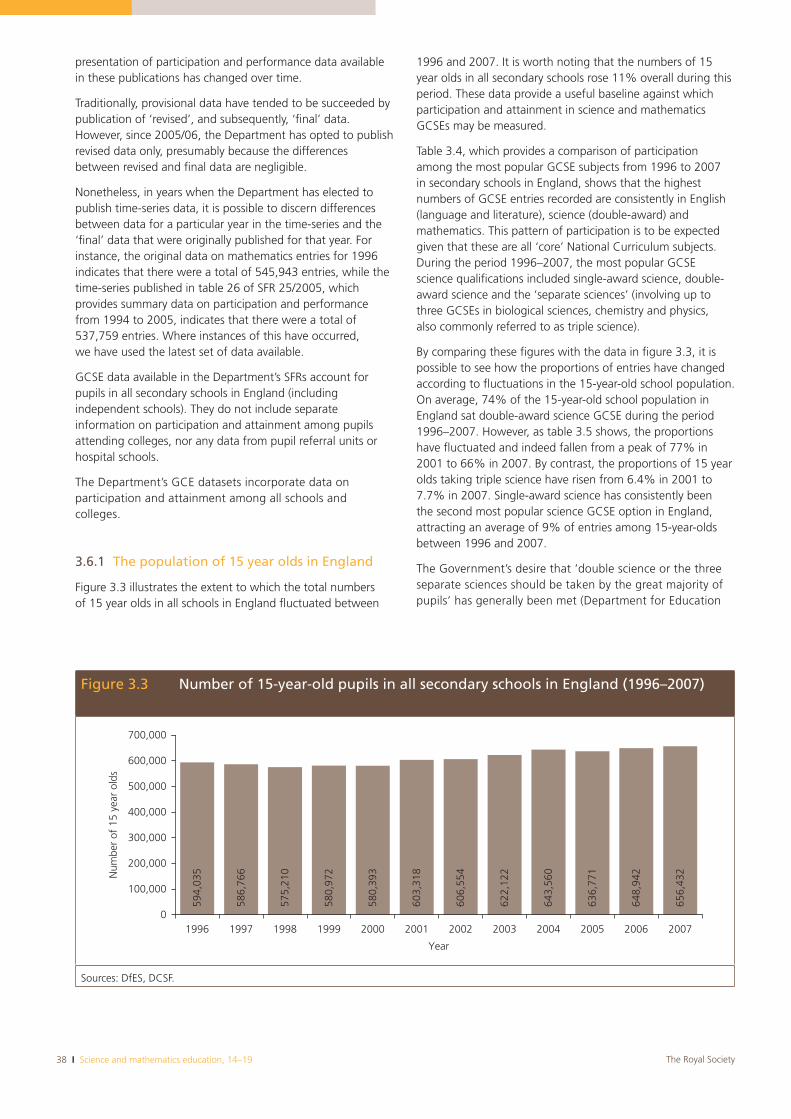
38 I Science and mathematics education, 14–19 The Royal Society
presentation of participation and performance data available in these publications has changed over time.
Traditionally, provisional data have tended to be succeeded by publication of ‘revised’, and subsequently, ‘final’ data. However, since 2005/06, the Department has opted to publish revised data only, presumably because the differences between revised and final data are negligible.
Nonetheless, in years when the Department has elected to publish time-series data, it is possible to discern differences between data for a particular year in the time-series and the ‘final’ data that were originally published for that year. For instance, the original data on mathematics entries for 1996 indicates that there were a total of 545,943 entries, while the time-series published in table 26 of SFR 25/2005, which provides summary data on participation and performance from 1994 to 2005, indicates that there were a total of 537,759 entries. Where instances of this have occurred, we have used the latest set of data available.
GCSE data available in the Department’s SFRs account for pupils in all secondary schools in England (including independent schools). They do not include separate information on participation and attainment among pupils attending colleges, nor any data from pupil referral units or hospital schools.
The Department’s GCE datasets incorporate data on participation and attainment among all schools and colleges.
3.6.1 The population of 15 year olds in England
Figure 3.3 illustrates the extent to which the total numbers of 15 year olds in all schools in England fluctuated between
1996 and 2007. It is worth noting that the numbers of 15 year olds in all secondary schools rose 11% overall during this period. These data provide a useful baseline against which participation and attainment in science and mathematics GCSEs may be measured.
Table 3.4, which provides a comparison of participation among the most popular GCSE subjects from 1996 to 2007 in secondary schools in England, shows that the highest numbers of GCSE entries recorded are consistently in English (language and literature), science (double-award) and mathematics. This pattern of participation is to be expected given that these are all ‘core’ National Curriculum subjects. During the period 1996–2007, the most popular GCSE science qualifications included single-award science, double-award science and the ‘separate sciences’ (involving up to three GCSEs in biological sciences, chemistry and physics, also commonly referred to as triple science).
By comparing these figures with the data in figure 3.3, it is possible to see how the proportions of entries have changed according to fluctuations in the 15-year-old school population. On average, 74% of the 15-year-old school population in England sat double-award science GCSE during the period 1996–2007. However, as table 3.5 shows, the proportions have fluctuated and indeed fallen from a peak of 77% in 2001 to 66% in 2007. By contrast, the proportions of 15 year olds taking triple science have risen from 6.4% in 2001 to 7.7% in 2007. Single-award science has consistently been the second most popular science GCSE option in England, attracting an average of 9% of entries among 15-year-olds between 1996 and 2007.
The Government’s desire that ‘double science or the three separate sciences should be taken by the great majority of pupils’ has generally been met (Department for Education
Figure 3.3 Number of 15-year-old pupils in all secondary schools in England (1996–2007)
594,
035
586,
766
575,
210
580,
972
580,
393
603,
318
606,
554
622,
122
643,
560
636,
771
648,
942
656,
432
0
100,000
200,000
300,000
400,000
500,000
600,000
700,000
1996 1997 1998 1999 2000 2001 2002 2003 2004 2005 2006 2007
Num
ber
of 1
5 ye
ar o
lds
Year
Sources: DfES, DCSF.
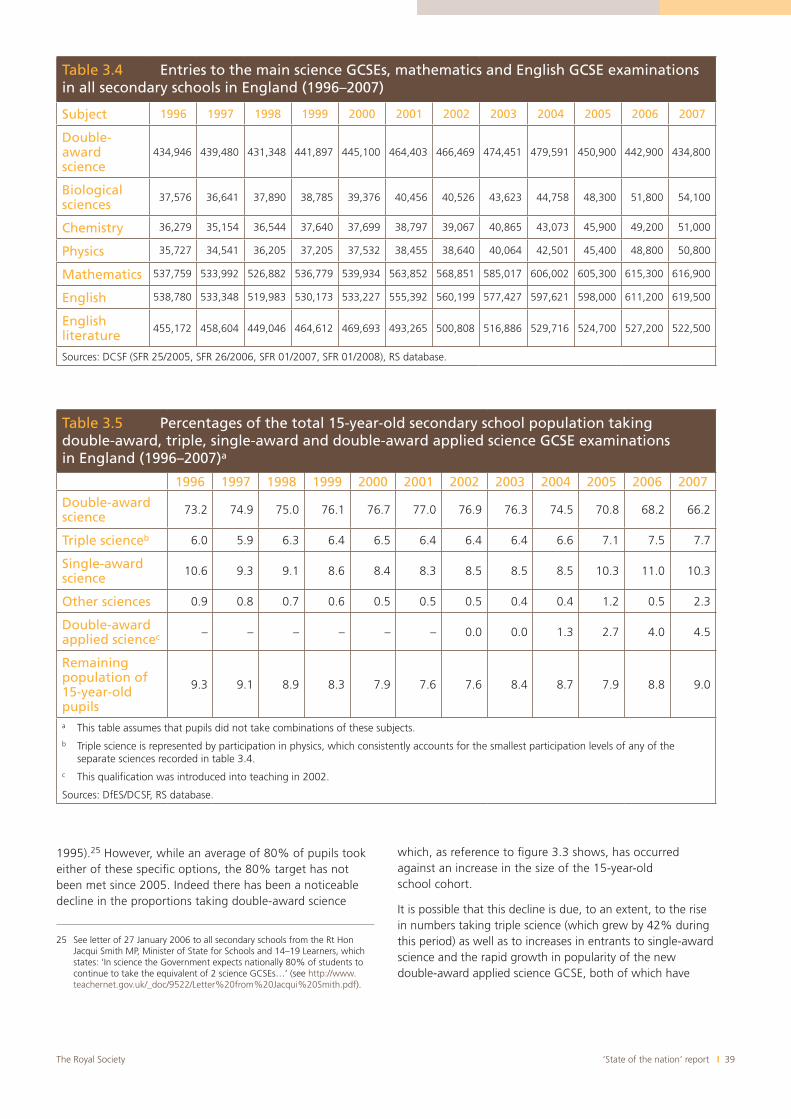
‘State of the nation’ report I 39The Royal Society
1995).25 However, while an average of 80% of pupils took either of these specific options, the 80% target has not been met since 2005. Indeed there has been a noticeable decline in the proportions taking double-award science
25 See letter of 27 January 2006 to all secondary schools from the Rt Hon Jacqui Smith MP, Minister of State for Schools and 14–19 Learners, which states: ‘In science the Government expects nationally 80% of students to continue to take the equivalent of 2 science GCSEs…’ (see http://www.teachernet.gov.uk/_doc/9522/Letter%20from%20Jacqui%20Smith.pdf).
which, as reference to figure 3.3 shows, has occurred against an increase in the size of the 15-year-old school cohort.
It is possible that this decline is due, to an extent, to the rise in numbers taking triple science (which grew by 42% during this period) as well as to increases in entrants to single-award science and the rapid growth in popularity of the new double-award applied science GCSE, both of which have
Table 3.4 Entries to the main science GCSEs, mathematics and English GCSE examinations in all secondary schools in England (1996–2007)
Subject 1996 1997 1998 1999 2000 2001 2002 2003 2004 2005 2006 2007
Double-awardscience
434,946 439,480 431,348 441,897 445,100 464,403 466,469 474,451 479,591 450,900 442,900 434,800
Biologicalsciences
37,576 36,641 37,890 38,785 39,376 40,456 40,526 43,623 44,758 48,300 51,800 54,100
Chemistry 36,279 35,154 36,544 37,640 37,699 38,797 39,067 40,865 43,073 45,900 49,200 51,000
Physics 35,727 34,541 36,205 37,205 37,532 38,455 38,640 40,064 42,501 45,400 48,800 50,800
Mathematics 537,759 533,992 526,882 536,779 539,934 563,852 568,851 585,017 606,002 605,300 615,300 616,900
English 538,780 533,348 519,983 530,173 533,227 555,392 560,199 577,427 597,621 598,000 611,200 619,500
Englishliterature
455,172 458,604 449,046 464,612 469,693 493,265 500,808 516,886 529,716 524,700 527,200 522,500
Sources: DCSF (SFR 25/2005, SFR 26/2006, SFR 01/2007, SFR 01/2008), RS database.
Table 3.5 Percentages of the total 15-year-old secondary school population taking double-award, triple, single-award and double-award applied science GCSE examinations in England (1996–2007)a
1996 1997 1998 1999 2000 2001 2002 2003 2004 2005 2006 2007
Double-awardscience 73.2 74.9 75.0 76.1 76.7 77.0 76.9 76.3 74.5 70.8 68.2 66.2
Triple scienceb 6.0 5.9 6.3 6.4 6.5 6.4 6.4 6.4 6.6 7.1 7.5 7.7
Single-awardscience 10.6 9.3 9.1 8.6 8.4 8.3 8.5 8.5 8.5 10.3 11.0 10.3
Other sciences 0.9 0.8 0.7 0.6 0.5 0.5 0.5 0.4 0.4 1.2 0.5 2.3
Double-awardapplied sciencec – – – – – – 0.0 0.0 1.3 2.7 4.0 4.5
Remainingpopulation of 15-year-old pupils
9.3 9.1 8.9 8.3 7.9 7.6 7.6 8.4 8.7 7.9 8.8 9.0
a This table assumes that pupils did not take combinations of these subjects.b Triple science is represented by participation in physics, which consistently accounts for the smallest participation levels of any of the
separate sciences recorded in table 3.4.c This qualification was introduced into teaching in 2002.
Sources: DfES/DCSF, RS database.
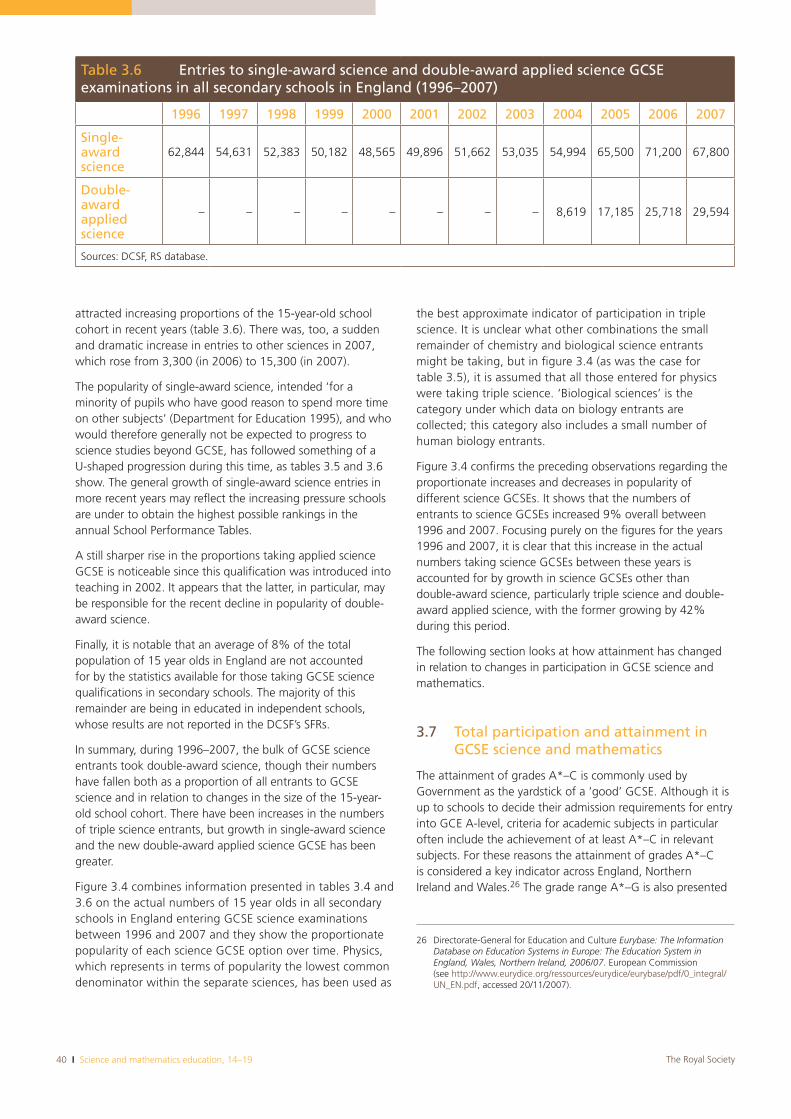
40 I Science and mathematics education, 14–19 The Royal Society
attracted increasing proportions of the 15-year-old school cohort in recent years (table 3.6). There was, too, a sudden and dramatic increase in entries to other sciences in 2007, which rose from 3,300 (in 2006) to 15,300 (in 2007).
The popularity of single-award science, intended ‘for a minority of pupils who have good reason to spend more time on other subjects’ (Department for Education 1995), and who would therefore generally not be expected to progress to science studies beyond GCSE, has followed something of a U-shaped progression during this time, as tables 3.5 and 3.6 show. The general growth of single-award science entries in more recent years may reflect the increasing pressure schools are under to obtain the highest possible rankings in the annual School Performance Tables.
A still sharper rise in the proportions taking applied science GCSE is noticeable since this qualification was introduced into teaching in 2002. It appears that the latter, in particular, may be responsible for the recent decline in popularity of double-award science.
Finally, it is notable that an average of 8% of the total population of 15 year olds in England are not accounted for by the statistics available for those taking GCSE science qualifications in secondary schools. The majority of this remainder are being in educated in independent schools, whose results are not reported in the DCSF’s SFRs.
In summary, during 1996–2007, the bulk of GCSE science entrants took double-award science, though their numbers have fallen both as a proportion of all entrants to GCSE science and in relation to changes in the size of the 15-year-old school cohort. There have been increases in the numbers of triple science entrants, but growth in single-award science and the new double-award applied science GCSE has been greater.
Figure 3.4 combines information presented in tables 3.4 and 3.6 on the actual numbers of 15 year olds in all secondary schools in England entering GCSE science examinations between 1996 and 2007 and they show the proportionate popularity of each science GCSE option over time. Physics, which represents in terms of popularity the lowest common denominator within the separate sciences, has been used as
the best approximate indicator of participation in triple science. It is unclear what other combinations the small remainder of chemistry and biological science entrants might be taking, but in figure 3.4 (as was the case for table 3.5), it is assumed that all those entered for physics were taking triple science. ‘Biological sciences’ is the category under which data on biology entrants are collected; this category also includes a small number of human biology entrants.
Figure 3.4 confirms the preceding observations regarding the proportionate increases and decreases in popularity of different science GCSEs. It shows that the numbers of entrants to science GCSEs increased 9% overall between 1996 and 2007. Focusing purely on the figures for the years 1996 and 2007, it is clear that this increase in the actual numbers taking science GCSEs between these years is accounted for by growth in science GCSEs other than double-award science, particularly triple science and double-award applied science, with the former growing by 42% during this period.
The following section looks at how attainment has changed in relation to changes in participation in GCSE science and mathematics.
3.7 Total participation and attainment in GCSE science and mathematics
The attainment of grades A*–C is commonly used by Government as the yardstick of a ‘good’ GCSE. Although it is up to schools to decide their admission requirements for entry into GCE A-level, criteria for academic subjects in particular often include the achievement of at least A*–C in relevant subjects. For these reasons the attainment of grades A*–C is considered a key indicator across England, Northern Ireland and Wales.26 The grade range A*–G is also presented
26 Directorate-General for Education and Culture Eurybase: The Information Database on Education Systems in Europe: The Education System in England, Wales, Northern Ireland, 2006/07. European Commission (see http://www.eurydice.org/ressources/eurydice/eurybase/pdf/0_integral/UN_EN.pdf, accessed 20/11/2007).
Table 3.6 Entries to single-award science and double-award applied science GCSE examinations in all secondary schools in England (1996–2007)
1996 1997 1998 1999 2000 2001 2002 2003 2004 2005 2006 2007
Single-awardscience
62,844 54,631 52,383 50,182 48,565 49,896 51,662 53,035 54,994 65,500 71,200 67,800
Double-awardappliedscience
– – – – – – – – 8,619 17,185 25,718 29,594
Sources: DCSF, RS database.
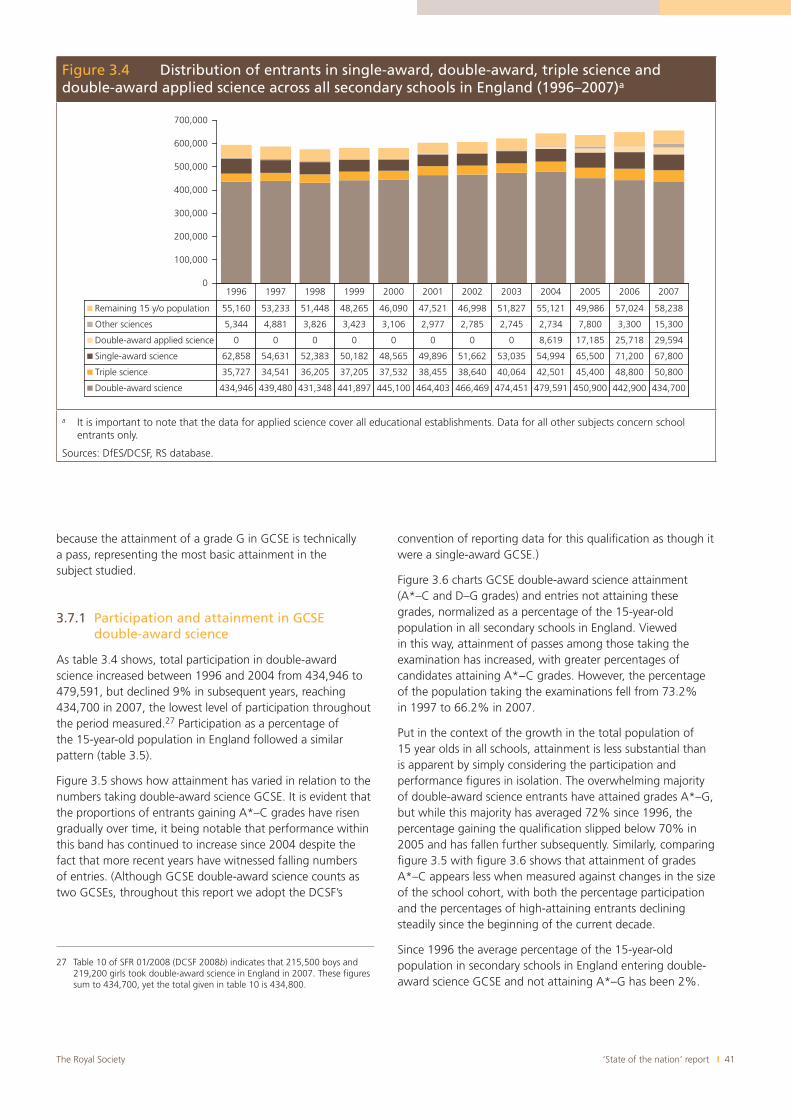
‘State of the nation’ report I 41The Royal Society
because the attainment of a grade G in GCSE is technically a pass, representing the most basic attainment in the subject studied.
3.7.1 Participation and attainment in GCSE double-award science
As table 3.4 shows, total participation in double-award science increased between 1996 and 2004 from 434,946 to 479,591, but declined 9% in subsequent years, reaching 434,700 in 2007, the lowest level of participation throughout the period measured.27 Participation as a percentage of the 15-year-old population in England followed a similar pattern (table 3.5).
Figure 3.5 shows how attainment has varied in relation to the numbers taking double-award science GCSE. It is evident that the proportions of entrants gaining A*–C grades have risen gradually over time, it being notable that performance within this band has continued to increase since 2004 despite the fact that more recent years have witnessed falling numbers of entries. (Although GCSE double-award science counts as two GCSEs, throughout this report we adopt the DCSF’s
27 Table 10 of SFR 01/2008 (DCSF 2008b) indicates that 215,500 boys and 219,200 girls took double-award science in England in 2007. These figures sum to 434,700, yet the total given in table 10 is 434,800.
convention of reporting data for this qualification as though it were a single-award GCSE.)
Figure 3.6 charts GCSE double-award science attainment (A*–C and D–G grades) and entries not attaining these grades, normalized as a percentage of the 15-year-old population in all secondary schools in England. Viewed in this way, attainment of passes among those taking the examination has increased, with greater percentages of candidates attaining A*−C grades. However, the percentage of the population taking the examinations fell from 73.2% in 1997 to 66.2% in 2007.
Put in the context of the growth in the total population of 15 year olds in all schools, attainment is less substantial than is apparent by simply considering the participation and performance figures in isolation. The overwhelming majority of double-award science entrants have attained grades A*–G, but while this majority has averaged 72% since 1996, the percentage gaining the qualification slipped below 70% in 2005 and has fallen further subsequently. Similarly, comparing figure 3.5 with figure 3.6 shows that attainment of grades A*–C appears less when measured against changes in the size of the school cohort, with both the percentage participation and the percentages of high-attaining entrants declining steadily since the beginning of the current decade.
Since 1996 the average percentage of the 15-year-old population in secondary schools in England entering double-award science GCSE and not attaining A*–G has been 2%.
Figure 3.4 Distribution of entrants in single-award, double-award, triple science and double-award applied science across all secondary schools in England (1996–2007)a
1996 1997 1998 1999 2000 2001 2002 2003 2004 2005 2006 2007
Remaining 15 y/o population 55,160 53,233 51,448 48,265 46,090 47,521 46,998 51,827 55,121 49,986 57,024 58,238
Other sciences 5,344 4,881 3,826 3,423 3,106 2,977 2,785 2,745 2,734 7,800 3,300 15,300
Double-award applied science 0 0 0 0 0 0 0 0 8,619 17,185 25,718 29,594
Single-award science 62,858 54,631 52,383 50,182 48,565 49,896 51,662 53,035 54,994 65,500 71,200 67,800
Triple science 35,727 34,541 36,205 37,205 37,532 38,455 38,640 40,064 42,501 45,400 48,800 50,800
Double-award science 434,946 439,480 431,348 441,897 445,100 464,403 466,469 474,451 479,591 450,900 442,900 434,700
0
100,000
200,000
300,000
400,000
500,000
600,000
700,000
a It is important to note that the data for applied science cover all educational establishments. Data for all other subjects concern school entrants only.
Sources: DfES/DCSF, RS database.
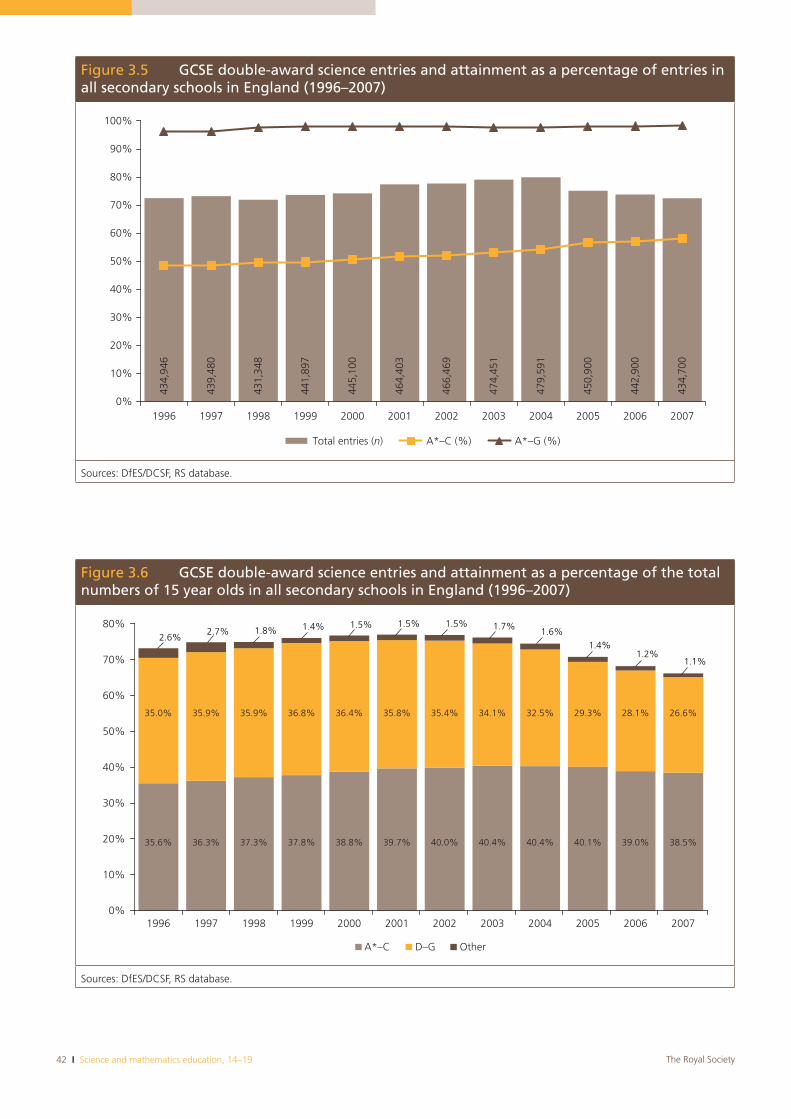
42 I Science and mathematics education, 14–19 The Royal Society
Figure 3.5 GCSE double-award science entries and attainment as a percentage of entries in all secondary schools in England (1996–2007)
649,434
084,934
843,134
798,144
001,544
304,464
964,664
154,474
195,974
009,054
009,244
007,434
0%
10%
20%
30%
40%
50%
60%
70%
80%
90%
100%
1996 1997 1998 1999 2000 2001 2002 2003 2004 2005 2006 2007
Total entries (n) A*–C (%) A*–G (%)
Sources: DfES/DCSF, RS database.
Figure 3.6 GCSE double-award science entries and attainment as a percentage of the total numbers of 15 year olds in all secondary schools in England (1996–2007)
35.6% 36.3% 37.3% 37.8% 38.8% 39.7% 40.0% 40.4% 40.4% 40.1% 39.0% 38.5%
35.0% 35.9% 35.9% 36.8% 36.4% 35.8% 35.4% 34.1% 32.5% 29.3% 28.1% 26.6%
2.6%2.7% 1.8% 1.4% 1.5% 1.5% 1.5% 1.7% 1.6%
1.4%1.2%
1.1%
0%
10%
20%
30%
40%
50%
60%
70%
80%
1996 1997 1998 1999 2000 2001 2002 2003 2004 2005 2006 2007
A*–C D–G Other
Sources: DfES/DCSF, RS database.
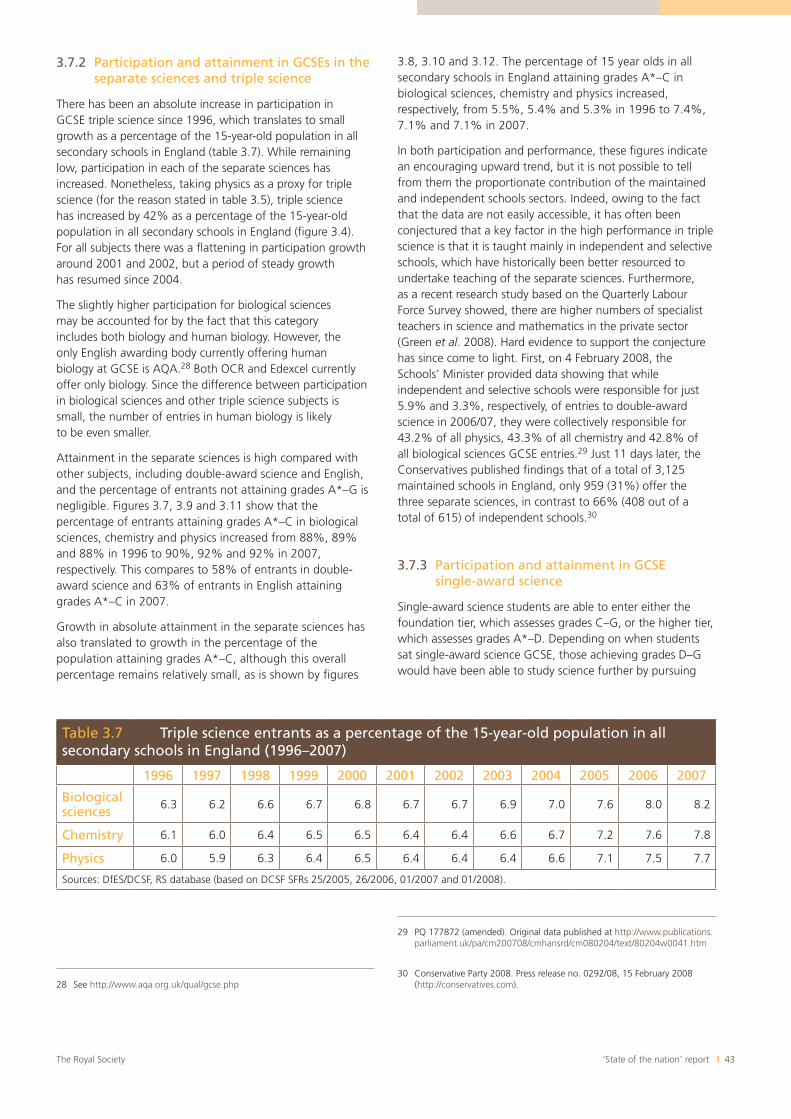
‘State of the nation’ report I 43The Royal Society
3.7.2 Participation and attainment in GCSEs in the separate sciences and triple science
There has been an absolute increase in participation in GCSE triple science since 1996, which translates to small growth as a percentage of the 15-year-old population in all secondary schools in England (table 3.7). While remaining low, participation in each of the separate sciences has increased. Nonetheless, taking physics as a proxy for triple science (for the reason stated in table 3.5), triple science has increased by 42% as a percentage of the 15-year-old population in all secondary schools in England (figure 3.4). For all subjects there was a flattening in participation growth around 2001 and 2002, but a period of steady growth has resumed since 2004.
The slightly higher participation for biological sciences may be accounted for by the fact that this category includes both biology and human biology. However, the only English awarding body currently offering human biology at GCSE is AQA.28 Both OCR and Edexcel currently offer only biology. Since the difference between participation in biological sciences and other triple science subjects is small, the number of entries in human biology is likely to be even smaller.
Attainment in the separate sciences is high compared with other subjects, including double-award science and English, and the percentage of entrants not attaining grades A*–G is negligible. Figures 3.7, 3.9 and 3.11 show that the percentage of entrants attaining grades A*–C in biological sciences, chemistry and physics increased from 88%, 89% and 88% in 1996 to 90%, 92% and 92% in 2007, respectively. This compares to 58% of entrants in double-award science and 63% of entrants in English attaining grades A*–C in 2007.
Growth in absolute attainment in the separate sciences has also translated to growth in the percentage of the population attaining grades A*–C, although this overall percentage remains relatively small, as is shown by figures
28 See http://www.aqa.org.uk/qual/gcse.php
3.8, 3.10 and 3.12. The percentage of 15 year olds in all secondary schools in England attaining grades A*–C in biological sciences, chemistry and physics increased, respectively, from 5.5%, 5.4% and 5.3% in 1996 to 7.4%, 7.1% and 7.1% in 2007.
In both participation and performance, these figures indicate an encouraging upward trend, but it is not possible to tell from them the proportionate contribution of the maintained and independent schools sectors. Indeed, owing to the fact that the data are not easily accessible, it has often been conjectured that a key factor in the high performance in triple science is that it is taught mainly in independent and selective schools, which have historically been better resourced to undertake teaching of the separate sciences. Furthermore, as a recent research study based on the Quarterly Labour Force Survey showed, there are higher numbers of specialist teachers in science and mathematics in the private sector (Green et al. 2008). Hard evidence to support the conjecture has since come to light. First, on 4 February 2008, the Schools’ Minister provided data showing that while independent and selective schools were responsible for just 5.9% and 3.3%, respectively, of entries to double-award science in 2006/07, they were collectively responsible for 43.2% of all physics, 43.3% of all chemistry and 42.8% of all biological sciences GCSE entries.29 Just 11 days later, the Conservatives published findings that of a total of 3,125 maintained schools in England, only 959 (31%) offer the three separate sciences, in contrast to 66% (408 out of a total of 615) of independent schools.30
3.7.3 Participation and attainment in GCSE single-award science
Single-award science students are able to enter either the foundation tier, which assesses grades C–G, or the higher tier, which assesses grades A*–D. Depending on when students sat single-award science GCSE, those achieving grades D–G would have been able to study science further by pursuing
29 PQ 177872 (amended). Original data published at http://www.publications.parliament.uk/pa/cm200708/cmhansrd/cm080204/text/80204w0041.htm
30 Conservative Party 2008. Press release no. 0292/08, 15 February 2008 (http://conservatives.com).
Table 3.7 Triple science entrants as a percentage of the 15-year-old population in all secondary schools in England (1996–2007)
1996 1997 1998 1999 2000 2001 2002 2003 2004 2005 2006 2007
Biologicalsciences 6.3 6.2 6.6 6.7 6.8 6.7 6.7 6.9 7.0 7.6 8.0 8.2
Chemistry 6.1 6.0 6.4 6.5 6.5 6.4 6.4 6.6 6.7 7.2 7.6 7.8
Physics 6.0 5.9 6.3 6.4 6.5 6.4 6.4 6.4 6.6 7.1 7.5 7.7
Sources: DfES/DCSF, RS database (based on DCSF SFRs 25/2005, 26/2006, 01/2007 and 01/2008).
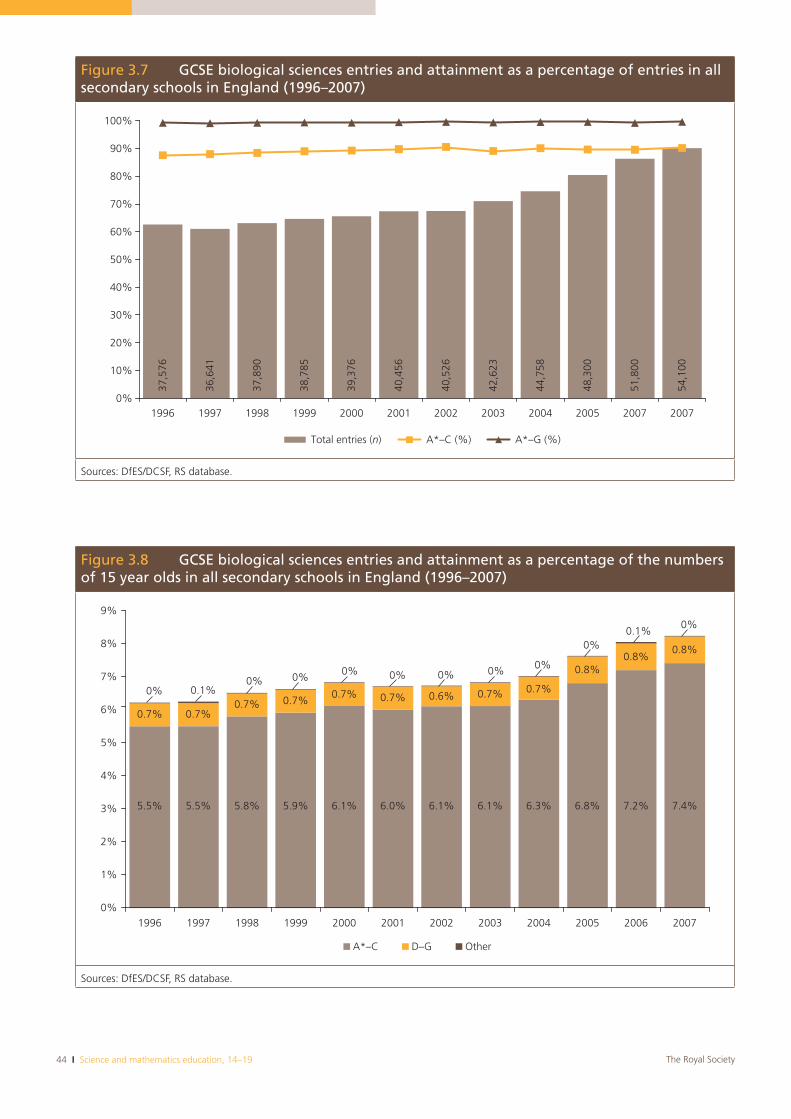
44 I Science and mathematics education, 14–19 The Royal Society
Figure 3.7 GCSE biological sciences entries and attainment as a percentage of entries in all secondary schools in England (1996–2007)
37,5
76
36,6
41
37,8
90
38,7
85
39,3
76
40,4
56
40,5
26
42,6
23
44,7
58
48,3
00
51,8
00
54,1
00
0%
10%
20%
30%
40%
50%
60%
70%
80%
90%
100%
1996 1997 1998 1999 2000 2001 2002 2003 2004 2005 2007 2007
Total entries (n) A*–C (%) A*–G (%)
Sources: DfES/DCSF, RS database.
Figure 3.8 GCSE biological sciences entries and attainment as a percentage of the numbers of 15 year olds in all secondary schools in England (1996–2007)
5.5% 5.5% 5.8% 5.9% 6.1% 6.0% 6.1% 6.1% 6.3% 6.8% 7.2% 7.4%
0.7% 0.7%0.7% 0.7%
0.7% 0.7% 0.6% 0.7% 0.7%
0.8%0.8%
0.8%
0% 0.1%0% 0%
0% 0% 0% 0% 0%
0%0.1%
0%
0%
1%
2%
3%
4%
5%
6%
7%
8%
9%
1996 1997 1998 1999 2000 2001 2002 2003 2004 2005 2006 2007
A*–C D–G Other
Sources: DfES/DCSF, RS database.
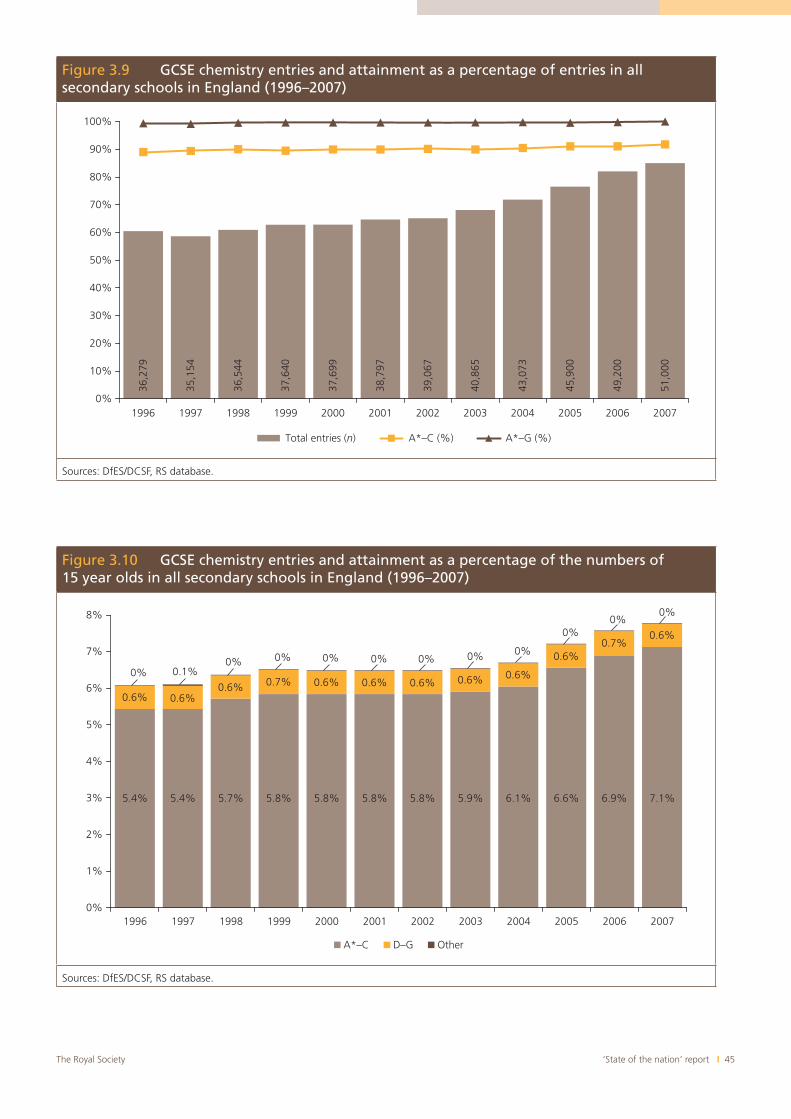
‘State of the nation’ report I 45The Royal Society
Figure 3.9 GCSE chemistry entries and attainment as a percentage of entries in all secondary schools in England (1996–2007)
36,2
79
35,1
54
36,5
44
37,6
40
37,6
99
38,7
97
39,0
67
40,8
65
43,0
73
45,9
00
49,2
00
51,0
00
0%
10%
20%
30%
40%
50%
60%
70%
80%
90%
100%
1996 1997 1998 1999 2000 2001 2002 2003 2004 2005 2006 2007
Total entries (n) A*–C (%) A*–G (%)
Sources: DfES/DCSF, RS database.
Figure 3.10 GCSE chemistry entries and attainment as a percentage of the numbers of 15 year olds in all secondary schools in England (1996–2007)
5.4% 5.4% 5.7% 5.8% 5.8% 5.8% 5.8% 5.9% 6.1% 6.6% 6.9% 7.1%
0.6% 0.6%0.6% 0.7% 0.6% 0.6% 0.6% 0.6% 0.6%
0.6%0.7%
0.6%
0% 0.1%0% 0% 0% 0% 0% 0% 0%
0%0%
0%
1%
2%
3%
4%
5%
6%
7%
8%
1996 1997 1998 1999 2000 2001 2002 2003 2004 2005 2006 2007
A*–C D–G Other
0%
Sources: DfES/DCSF, RS database.
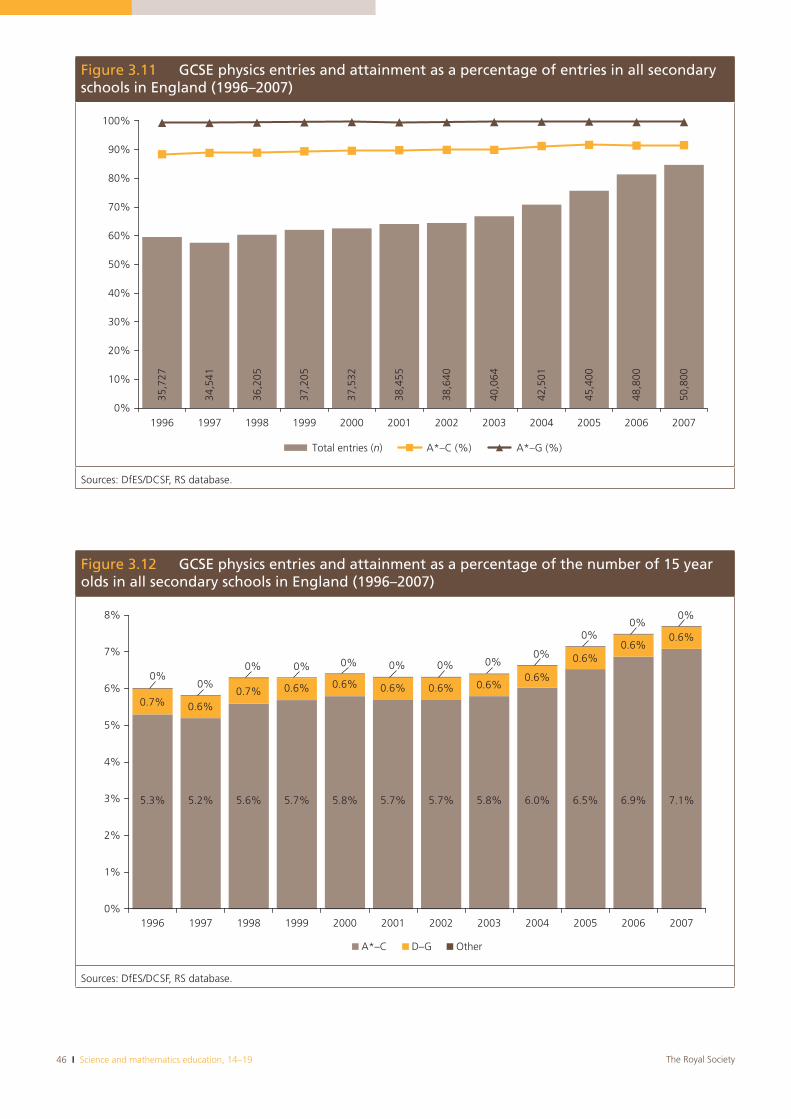
46 I Science and mathematics education, 14–19 The Royal Society
Figure 3.11 GCSE physics entries and attainment as a percentage of entries in all secondary schools in England (1996–2007)
35,7
27
34,5
41
36,2
05
37,2
05
37,5
32
38,4
55
38,6
40
40,0
64
42,5
01
45,4
00
48,8
00
50,8
00
0%
10%
20%
30%
40%
50%
60%
70%
80%
90%
100%
1996 1997 1998 1999 2000 2001 2002 2003 2004 2005 2006 2007
Total entries (n) A*–C (%) A*–G (%)
Sources: DfES/DCSF, RS database.
Figure 3.12 GCSE physics entries and attainment as a percentage of the number of 15 year olds in all secondary schools in England (1996–2007)
5.3% 5.2% 5.6% 5.8% 5.8% 6.0% 6.5% 6.9% 7.1%
0.7% 0.6%0.7% 0.6% 0.6% 0.6% 0.6% 0.6%
0.6%
0.6%0.6%
0.6%
0%0%
0% 0% 0% 0% 0% 0%0%
0%0%
0%
0%
1%
2%
3%
4%
5%
6%
7%
8%
1996 1997 1998 1999 2000 2001 2002 2003 2004 2005 2006 2007
A*–C D–G Other
5.7% 5.7% 5.7%
Sources: DfES/DCSF, RS database.
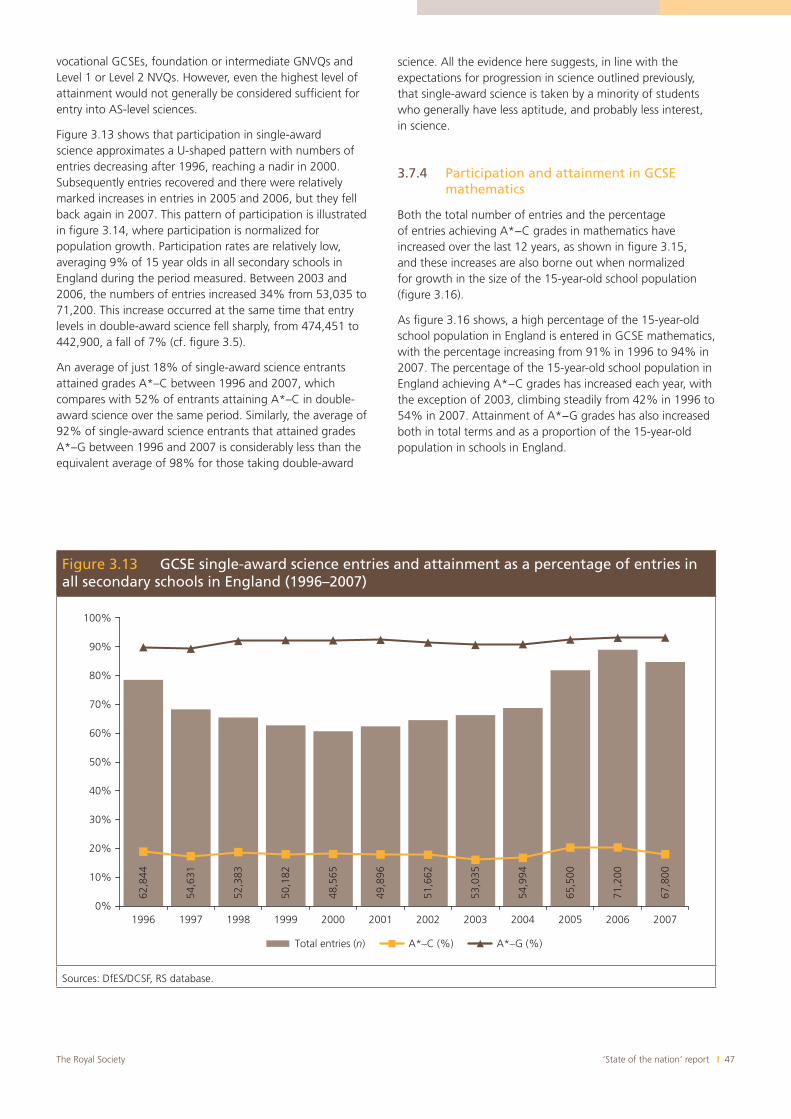
‘State of the nation’ report I 47The Royal Society
vocational GCSEs, foundation or intermediate GNVQs and Level 1 or Level 2 NVQs. However, even the highest level of attainment would not generally be considered sufficient for entry into AS-level sciences.
Figure 3.13 shows that participation in single-award science approximates a U-shaped pattern with numbers of entries decreasing after 1996, reaching a nadir in 2000. Subsequently entries recovered and there were relatively marked increases in entries in 2005 and 2006, but they fell back again in 2007. This pattern of participation is illustrated in figure 3.14, where participation is normalized for population growth. Participation rates are relatively low, averaging 9% of 15 year olds in all secondary schools in England during the period measured. Between 2003 and 2006, the numbers of entries increased 34% from 53,035 to 71,200. This increase occurred at the same time that entry levels in double-award science fell sharply, from 474,451 to 442,900, a fall of 7% (cf. figure 3.5).
An average of just 18% of single-award science entrants attained grades A*–C between 1996 and 2007, which compares with 52% of entrants attaining A*–C in double-award science over the same period. Similarly, the average of 92% of single-award science entrants that attained grades A*–G between 1996 and 2007 is considerably less than the equivalent average of 98% for those taking double-award
science. All the evidence here suggests, in line with the expectations for progression in science outlined previously, that single-award science is taken by a minority of students who generally have less aptitude, and probably less interest, in science.
3.7.4 Participation and attainment in GCSE mathematics
Both the total number of entries and the percentage of entries achieving A*−C grades in mathematics have increased over the last 12 years, as shown in figure 3.15, and these increases are also borne out when normalized for growth in the size of the 15-year-old school population (figure 3.16).
As figure 3.16 shows, a high percentage of the 15-year-old school population in England is entered in GCSE mathematics, with the percentage increasing from 91% in 1996 to 94% in 2007. The percentage of the 15-year-old school population in England achieving A*−C grades has increased each year, with the exception of 2003, climbing steadily from 42% in 1996 to 54% in 2007. Attainment of A*−G grades has also increased both in total terms and as a proportion of the 15-year-old population in schools in England.
Figure 3.13 GCSE single-award science entries and attainment as a percentage of entries in all secondary schools in England (1996–2007)
62,8
44
54,6
31
52,3
83
50,1
82
48,5
65
49,8
96
51,6
62
53,0
35
54,9
94
65,5
00
71,2
00
67,8
00
0%
10%
20%
30%
40%
50%
60%
70%
80%
90%
100%
1996 1997 1998 1999 2000 2001 2002 2003 2004 2005 2006 2007
Total entries (n) A*–C (%) A*–G (%)
Sources: DfES/DCSF, RS database.
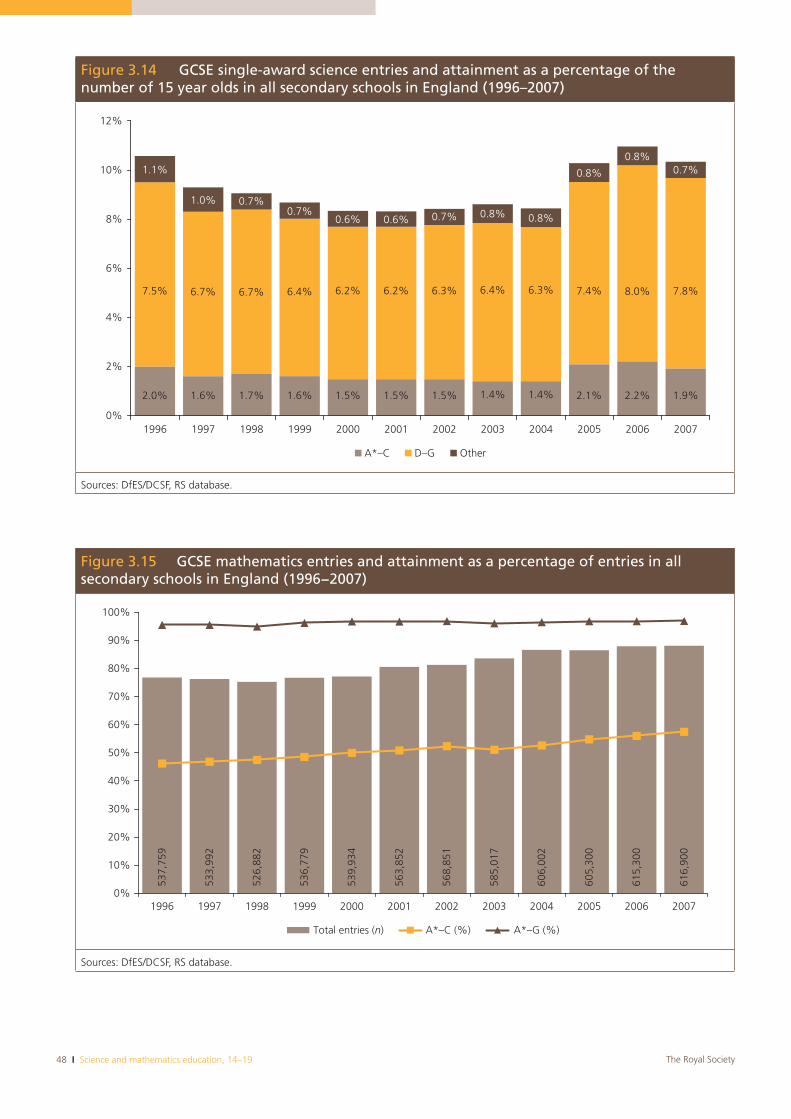
48 I Science and mathematics education, 14–19 The Royal Society
Figure 3.15 GCSE mathematics entries and attainment as a percentage of entries in all secondary schools in England (1996−2007)
537,
759
533,
992
526,
882
536,
779
539,
934
563,
852
568,
851
585,
017
606,
002
605,
300
615,
300
616,
900
0%
10%
20%
30%
40%
50%
60%
70%
80%
90%
100%
1996 1997 1998 1999 2000 2001 2002 2003 2004 2005 2006 2007
Total entries (n) A*–C (%) A*–G (%)
Sources: DfES/DCSF, RS database.
Figure 3.14 GCSE single-award science entries and attainment as a percentage of the number of 15 year olds in all secondary schools in England (1996–2007)
2.0% 1.6% 1.7% 1.6% 1.5% 1.5% 1.5% 1.4% 1.4% 2.1% 2.2% 1.9%
7.5% 6.7% 6.7% 6.4% 6.2% 6.2% 6.3% 6.4% 6.3% 7.4% 8.0% 7.8%
1.1%
1.0% 0.7%0.7%
0.6% 0.6% 0.7% 0.8% 0.8%
0.8%
0.8%0.7%
0%
2%
4%
6%
8%
10%
12%
1996 1997 1998 1999 2000 2001 2002 2003 2004 2005 2006 2007
A*–C D–G Other
Sources: DfES/DCSF, RS database.
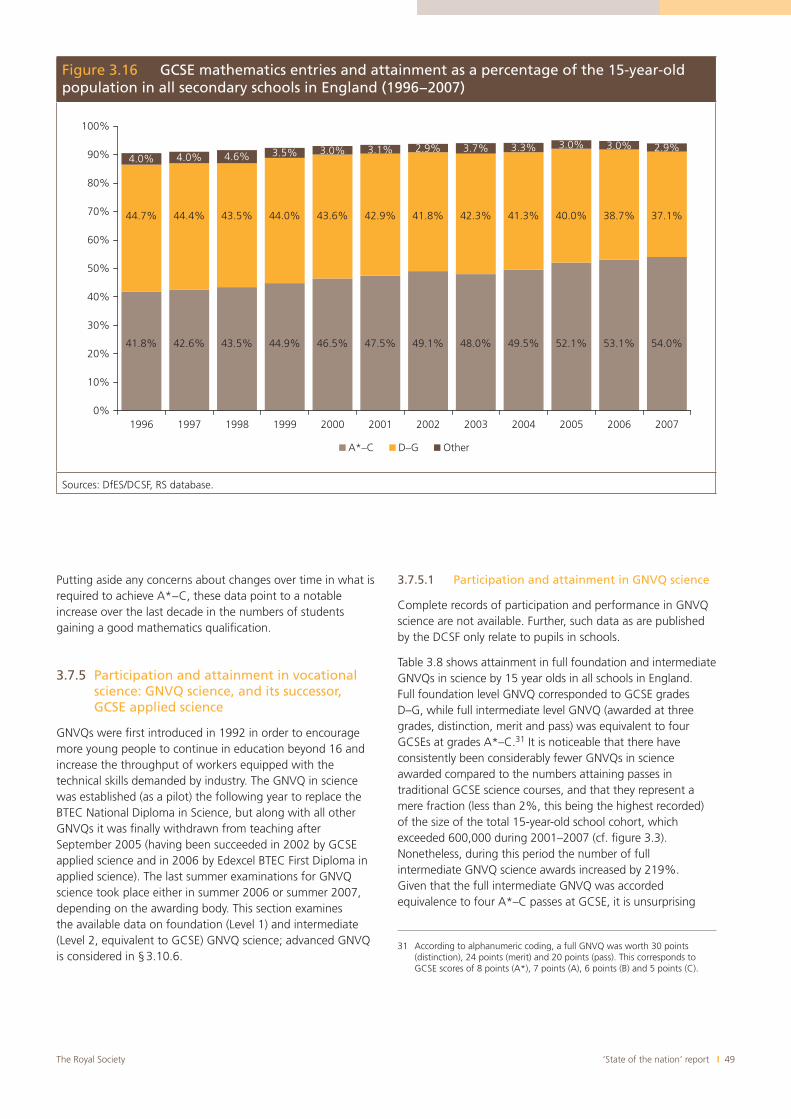
‘State of the nation’ report I 49The Royal Society
Putting aside any concerns about changes over time in what is required to achieve A*−C, these data point to a notable increase over the last decade in the numbers of students gaining a good mathematics qualification.
3.7.5 Participation and attainment in vocational science: GNVQ science, and its successor, GCSE applied science
GNVQs were first introduced in 1992 in order to encourage more young people to continue in education beyond 16 and increase the throughput of workers equipped with the technical skills demanded by industry. The GNVQ in science was established (as a pilot) the following year to replace the BTEC National Diploma in Science, but along with all other GNVQs it was finally withdrawn from teaching after September 2005 (having been succeeded in 2002 by GCSE applied science and in 2006 by Edexcel BTEC First Diploma in applied science). The last summer examinations for GNVQ science took place either in summer 2006 or summer 2007, depending on the awarding body. This section examines the available data on foundation (Level 1) and intermediate (Level 2, equivalent to GCSE) GNVQ science; advanced GNVQ is considered in §3.10.6.
3.7.5.1 Participation and attainment in GNVQ science
Complete records of participation and performance in GNVQ science are not available. Further, such data as are published by the DCSF only relate to pupils in schools.
Table 3.8 shows attainment in full foundation and intermediate GNVQs in science by 15 year olds in all schools in England. Full foundation level GNVQ corresponded to GCSE grades D–G, while full intermediate level GNVQ (awarded at three grades, distinction, merit and pass) was equivalent to four GCSEs at grades A*–C.31 It is noticeable that there have consistently been considerably fewer GNVQs in science awarded compared to the numbers attaining passes in traditional GCSE science courses, and that they represent a mere fraction (less than 2%, this being the highest recorded) of the size of the total 15-year-old school cohort, which exceeded 600,000 during 2001–2007 (cf. figure 3.3). Nonetheless, during this period the number of full intermediate GNVQ science awards increased by 219%. Given that the full intermediate GNVQ was accorded equivalence to four A*–C passes at GCSE, it is unsurprising
31 According to alphanumeric coding, a full GNVQ was worth 30 points (distinction), 24 points (merit) and 20 points (pass). This corresponds to GCSE scores of 8 points (A*), 7 points (A), 6 points (B) and 5 points (C).
Figure 3.16 GCSE mathematics entries and attainment as a percentage of the 15-year-old population in all secondary schools in England (1996−2007)
41.8% 42.6% 43.5% 44.9% 46.5% 47.5% 49.1% 48.0% 49.5% 52.1% 53.1% 54.0%
44.7% 44.4% 43.5% 44.0% 43.6% 42.9% 41.8% 42.3% 41.3% 40.0% 38.7% 37.1%
4.0% 4.0% 4.6% 3.5% 3.0% 3.1% 2.9% 3.7% 3.3% 3.0% 3.0% 2.9%
0%
10%
20%
30%
40%
50%
60%
70%
80%
90%
100%
1996 1997 1998 1999 2000 2001 2002 2003 2004 2005 2006 2007
A*–C D–G Other
Sources: DfES/DCSF, RS database.

50 I Science and mathematics education, 14–19 The Royal Society
that a number of commentators reported that schools were using the GNVQ as a vehicle to boost their results and performance table standings (Garner 2005; Cox 2006; Revell 2006; Blair 2007). Indeed, it is clear that the greatest leap in popularity followed QCA’s announcement of the withdrawal of GNVQs in December 2003.
3.7.5.2 Participation and attainment in GCSE (double-award) applied science
The national data available on participation and performance in double-award applied science GCSE cover all entrants in schools and colleges, described rather euphemistically in the SFRs as ‘educational establishments’.
GCSE applied science, along with GCSEs in other applied subjects, was introduced into teaching from September 2002 and first examined in summer 2004. In England it is now the only science GCSE that has double-award status (ie the award is equivalent to two GCSEs). GCSE additional applied science, which may be taken alongside or following the new GCSE science, was introduced into teaching from September 2006.
Since its introduction the total number of entries in GCSE applied science has increased by 243%, rising rapidly from 8,619 entries in 2004 to 29,594 entries in 2007 (though the pace of growth slowed between 2006 and 2007; figure 3.17).32 The numbers taking applied science in 2007 represent approximately 4.5% of the national cohort of 15 year olds in schools and colleges in England (cf. figure 3.3), which is more than double the share of the market achieved by GNVQ science.
Just as entries in GCSE applied science have increased, so there has been a steady growth in the percentage of A*A*–CC grades attained, from 25.5% in 2004 to 37.9% in 2007. This growth may result from schools refining their teaching of the curriculum by the second and third year of teaching. While these figures for A*A*–CC grades represent a substantial improvement in attainment, they are still relatively low compared to, for
32 Entries and attainment in this qualification are measured according to when entrants reached the end of their Key Stage 4 studies, so the figures quoted here may include a number of pupils who took the qualification early.
example, double-award science where 58% of entrants achieved grades A*A*–CC in 2007.
Bell & Donnelly (2006) found that schools choosing to adopt applied science are primarily attracted by its potential ‘as a reformed version of the science curriculum: there was less emphasis on the notion of vocational preparation’. Despite this, they found that the course was generally offered to students whose performance was lower, on average, than those offered entry into traditional double-award science. For schools offering applied science there were some interesting consequences for performance, with improved performance relative to Key Stage 3 attainment more likely to be displayed by students with lower attainment (Levels 2, 3 and 4) than by higher-attaining students (Levels 6 and 7) at Key Stage 3.
The attainment of grades A*A*–GG rose to 97% in 2007, broadly equivalent to the 98% of entrants achieving grades A*A*–GG in double-award science that same year.
Table 3.8 Numbers attaining GNVQ science in all secondary schools in England (2003–2007)
2003 2004 2005 2006 2007
Full foundation 386 258 343 498 402
Full intermediate 3,442 4,885 8,771 10,902 10,968
Sources: RS database, DCSF (SFRs 26/2006, 01/2007 and 01/2008).
Figure 3.17 GCSE applied science entries and attainment as a percentage of entries in all secondary schools and colleges in England (1996–2007)
8,61
9
17,1
85
25,7
18
29,5
94
0%
10%
20%
30%
40%
50%
60%
70%
80%
90%
100%
2004 2005 2006 2007
Total entries (n) A*A*–CC (%) A*A*–GG (%)
Sources: DfES/DCSF, RS database.
‘State of the nation’ report I 51The Royal Society
(B) General Certificate of Education Advanced level qualifications
3.8 Introduction
First introduced in 1951, Advanced-level qualifications (A-levels) were substantially reformed in 1987 when, in addition to the full A-level, a new Advanced Supplementary qualification equivalent in value to half an A-level was introduced. By providing a broader range of study options, a main aim of the new Advanced Supplementary courses was to incentivize more young people to continue in education beyond compulsory schooling. Subsequently the Curriculum 2000 reforms split A-levels into two qualifications, creating a new Advanced Subsidiary (AS) qualification (also equivalent in value to half an A-level) and A2 (the technical term applied to the second year of A-level studies).33
The AS-level alone may form a free-standing qualification if a student elects not to pursue the subject into the A2 year, with the points gained contributing half of the value of an A-level in the UCAS tariff points system used for entrance to university. A full-time A-level student will typically study four subjects at AS-level and proceed with three of these subjects at A2. The change was intended to give students greater flexibility in subject choice, but has tended to be used strategically by students to maximize their A-level grades by dropping their weakest subject(s).
The examination for A-levels became modularized with three AS-level modules for each subject usually sat at the end of the first year (generally year 11 in England) and a further three A2 modules taken at the end of the second year (generally year 12 in England).
3.9 Total participation and attainment in GCE Advanced Supplementary/Subsidiary level science and mathematics
Our 1996–2007 timeline incorporates the transition from Advanced Supplementary to Advanced Subsidiary qualifications. The two qualifications are not comparable. As the name suggests, Advanced Subsidiary qualifications are perceived as precursors to A-levels (they both share a modular structure), as well as qualifications in their own right, while the Advanced Supplementary qualifications were synoptic in form and considered to be more an extension of GCSE, an end in itself rather than necessarily a stepping stone to higher academic study in the subject(s) taken: in terms of academic progression, they were somewhat akin to educational cul-de-sacs. These crucial distinctions probably
33 The basic difference between the Advanced Supplementary and Advanced Subsidiary qualifications is that while the former covered a narrower range of topics than the full A-level, but to the same depth as the full A-level, the latter cover less ground than the full A-level, but topics are covered in less depth.
best explain the substantial differences in the recorded numbers of entries to science and mathematics courses for Advanced Supplementary and the new AS-levels. As tables 3.9 and 3.10 demonstrate, entries to these subjects at Advanced Supplementary level grew slowly after 1996, but never attracted anything like the numbers of entries that Advanced Subsidiary levels have witnessed. (Highest attainment at this level is measured by a grade A, and lowest attainment is measured by an E grade.)
However, even apart from the inconsistencies in the way that data were collected, these Advanced Subsidiary entry figures do not paint an accurate overall picture of AS-level participation, for there is a great deal of flexibility regarding sitting examinations for these qualifications. This flexibility arises from the fact that candidates do not have to take AS-levels at the completion of the academic year prior to embarking on their A2 modules. Indeed it is possible for the six modules that comprise a full A-level to be taken either progressively or all together at the end of their A2 year.34
Having initially been restricted to two attempts at any module prior to certification, there are now no restrictions to the numbers of times candidates are entitled to retake modules, and they may be encouraged to do so given that the better result will count towards the final award. Moreover, for as long as a specification is offered, it is possible for the entire qualification to be retaken more than once. It is impossible, therefore, to tease out from these data the numbers of entries that accord with each of these permeations.
3.10 Total participation and attainment in GCE A-level science and mathematics
3.10.1 Numbers of pupils and participation in GCE A-level science and mathematics
The total number of candidates aged 16–18 in schools and FE sector colleges at the beginning of the academic year in which they took their A-level (or equivalent) examinations increased by a modest 14% over the past 12 years, rising from 218,254 in 1996 to 249,552 in 2006/07 (figure 3.18). (However, it is also calculable that the number of candidates has also decreased by 7% since 2002/03.) Given that a full A-level normally takes two years to complete, and that most candidates progress to A-level studies aged 16 directly after having taken their GCSEs, it is most likely that the majority of candidates are aged 17 at the start of the academic year in which they take their A-levels. Given this assumption, figure 3.18 compares the candidate data with ONS figures for the number of 17 year olds in England, which increased
34 Revisions to A-levels effective from September 2008 will result in the number of modules for some subjects being reduced from six to four. However, biology, chemistry, physics and mathematics A-levels will continue to include six modules.
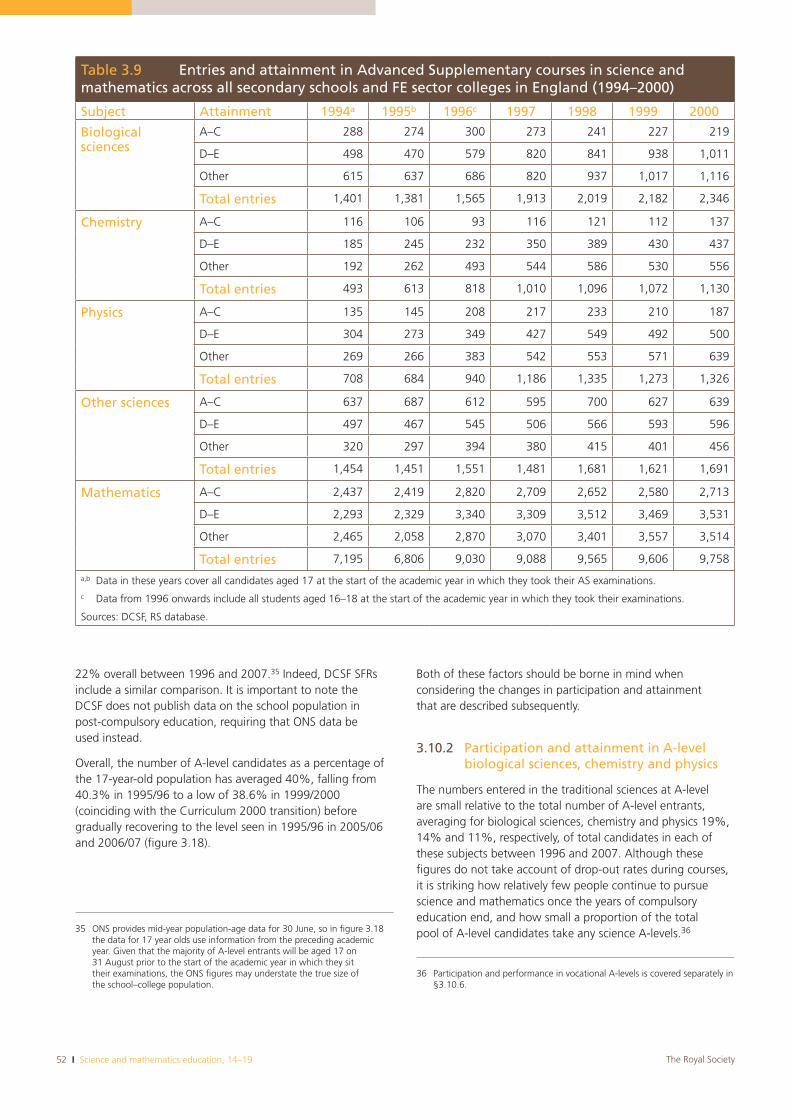
52 I Science and mathematics education, 14–19 The Royal Society
22% overall between 1996 and 2007.35 Indeed, DCSF SFRs include a similar comparison. It is important to note the DCSF does not publish data on the school population in post-compulsory education, requiring that ONS data be used instead.
Overall, the number of A-level candidates as a percentage of the 17-year-old population has averaged 40%, falling from 40.3% in 1995/96 to a low of 38.6% in 1999/2000 (coinciding with the Curriculum 2000 transition) before gradually recovering to the level seen in 1995/96 in 2005/06 and 2006/07 (figure 3.18).
35 ONS provides mid-year population-age data for 30 June, so in figure 3.18 the data for 17 year olds use information from the preceding academic year. Given that the majority of A-level entrants will be aged 17 on 31 August prior to the start of the academic year in which they sit their examinations, the ONS figures may understate the true size of the school–college population.
Both of these factors should be borne in mind when considering the changes in participation and attainment that are described subsequently.
3.10.2 Participation and attainment in A-level biological sciences, chemistry and physics
The numbers entered in the traditional sciences at A-level are small relative to the total number of A-level entrants, averaging for biological sciences, chemistry and physics 19%, 14% and 11%, respectively, of total candidates in each of these subjects between 1996 and 2007. Although these figures do not take account of drop-out rates during courses, it is striking how relatively few people continue to pursue science and mathematics once the years of compulsory education end, and how small a proportion of the total pool of A-level candidates take any science A-levels.36
36 Participation and performance in vocational A-levels is covered separately in §3.10.6.
Table 3.9 Entries and attainment in Advanced Supplementary courses in science and mathematics across all secondary schools and FE sector colleges in England (1994–2000)
Subject Attainment 1994a 1995b 1996c 1997 1998 1999 2000
Biologicalsciences
A–C 288 274 300 273 241 227 219
D–E 498 470 579 820 841 938 1,011
Other 615 637 686 820 937 1,017 1,116
Total entries 1,401 1,381 1,565 1,913 2,019 2,182 2,346
Chemistry A–C 116 106 93 116 121 112 137
D–E 185 245 232 350 389 430 437
Other 192 262 493 544 586 530 556
Total entries 493 613 818 1,010 1,096 1,072 1,130
Physics A–C 135 145 208 217 233 210 187
D–E 304 273 349 427 549 492 500
Other 269 266 383 542 553 571 639
Total entries 708 684 940 1,186 1,335 1,273 1,326
Other sciences A–C 637 687 612 595 700 627 639
D–E 497 467 545 506 566 593 596
Other 320 297 394 380 415 401 456
Total entries 1,454 1,451 1,551 1,481 1,681 1,621 1,691
Mathematics A–C 2,437 2,419 2,820 2,709 2,652 2,580 2,713
D–E 2,293 2,329 3,340 3,309 3,512 3,469 3,531
Other 2,465 2,058 2,870 3,070 3,401 3,557 3,514
Total entries 7,195 6,806 9,030 9,088 9,565 9,606 9,758
a,b Data in these years cover all candidates aged 17 at the start of the academic year in which they took their AS examinations.c Data from 1996 onwards include all students aged 16–18 at the start of the academic year in which they took their examinations.
Sources: DCSF, RS database.
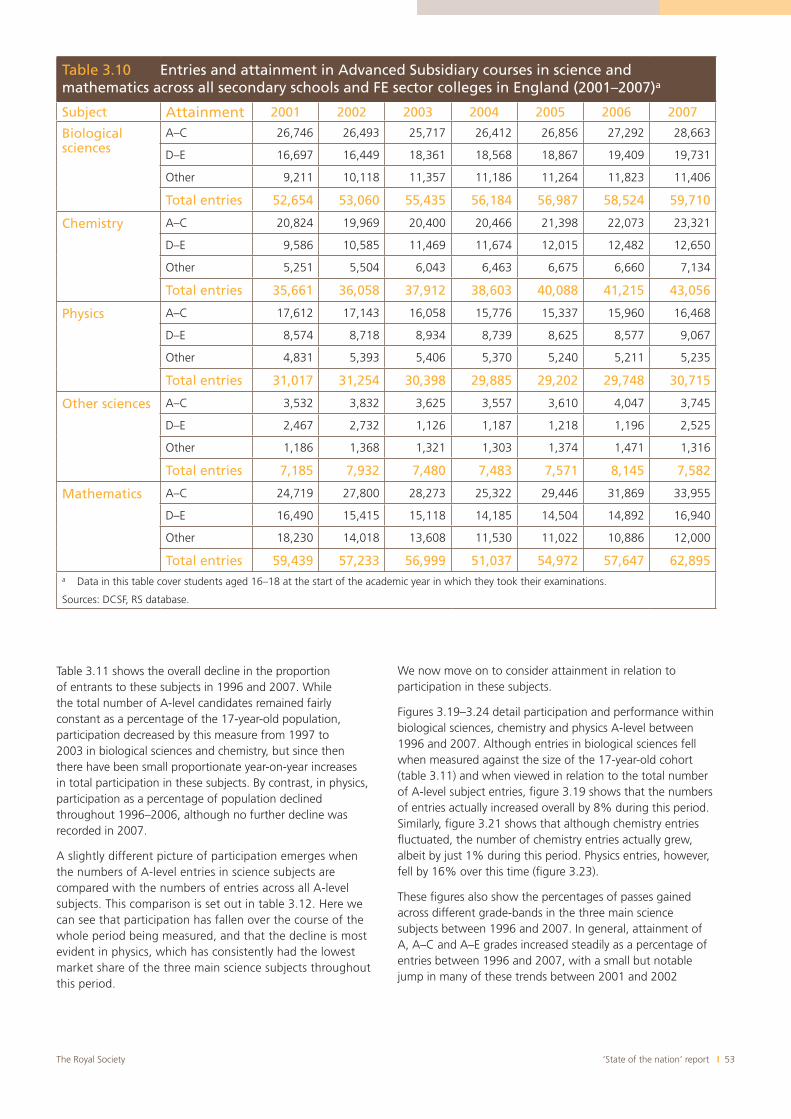
‘State of the nation’ report I 53The Royal Society
Table 3.11 shows the overall decline in the proportion of entrants to these subjects in 1996 and 2007. While the total number of A-level candidates remained fairly constant as a percentage of the 17-year-old population, participation decreased by this measure from 1997 to 2003 in biological sciences and chemistry, but since then there have been small proportionate year-on-year increases in total participation in these subjects. By contrast, in physics, participation as a percentage of population declined throughout 1996–2006, although no further decline was recorded in 2007.
A slightly different picture of participation emerges when the numbers of A-level entries in science subjects are compared with the numbers of entries across all A-level subjects. This comparison is set out in table 3.12. Here we can see that participation has fallen over the course of the whole period being measured, and that the decline is most evident in physics, which has consistently had the lowest market share of the three main science subjects throughout this period.
We now move on to consider attainment in relation to participation in these subjects.
Figures 3.19–3.24 detail participation and performance within biological sciences, chemistry and physics A-level between 1996 and 2007. Although entries in biological sciences fell when measured against the size of the 17-year-old cohort (table 3.11) and when viewed in relation to the total number of A-level subject entries, figure 3.19 shows that the numbers of entries actually increased overall by 8% during this period. Similarly, figure 3.21 shows that although chemistry entries fluctuated, the number of chemistry entries actually grew, albeit by just 1% during this period. Physics entries, however, fell by 16% over this time (figure 3.23).
These figures also show the percentages of passes gained across different grade-bands in the three main science subjects between 1996 and 2007. In general, attainment of A, A–C and A–E grades increased steadily as a percentage of entries between 1996 and 2007, with a small but notable jump in many of these trends between 2001 and 2002
Table 3.10 Entries and attainment in Advanced Subsidiary courses in science and mathematics across all secondary schools and FE sector colleges in England (2001–2007)a
Subject Attainment 2001 2002 2003 2004 2005 2006 2007
Biologicalsciences
A–C 26,746 26,493 25,717 26,412 26,856 27,292 28,663
D–E 16,697 16,449 18,361 18,568 18,867 19,409 19,731
Other 9,211 10,118 11,357 11,186 11,264 11,823 11,406
Total entries 52,654 53,060 55,435 56,184 56,987 58,524 59,710
Chemistry A–C 20,824 19,969 20,400 20,466 21,398 22,073 23,321
D–E 9,586 10,585 11,469 11,674 12,015 12,482 12,650
Other 5,251 5,504 6,043 6,463 6,675 6,660 7,134
Total entries 35,661 36,058 37,912 38,603 40,088 41,215 43,056
Physics A–C 17,612 17,143 16,058 15,776 15,337 15,960 16,468
D–E 8,574 8,718 8,934 8,739 8,625 8,577 9,067
Other 4,831 5,393 5,406 5,370 5,240 5,211 5,235
Total entries 31,017 31,254 30,398 29,885 29,202 29,748 30,715
Other sciences A–C 3,532 3,832 3,625 3,557 3,610 4,047 3,745
D–E 2,467 2,732 1,126 1,187 1,218 1,196 2,525
Other 1,186 1,368 1,321 1,303 1,374 1,471 1,316
Total entries 7,185 7,932 7,480 7,483 7,571 8,145 7,582
Mathematics A–C 24,719 27,800 28,273 25,322 29,446 31,869 33,955
D–E 16,490 15,415 15,118 14,185 14,504 14,892 16,940
Other 18,230 14,018 13,608 11,530 11,022 10,886 12,000
Total entries 59,439 57,233 56,999 51,037 54,972 57,647 62,895a Data in this table cover students aged 16–18 at the start of the academic year in which they took their examinations.
Sources: DCSF, RS database.
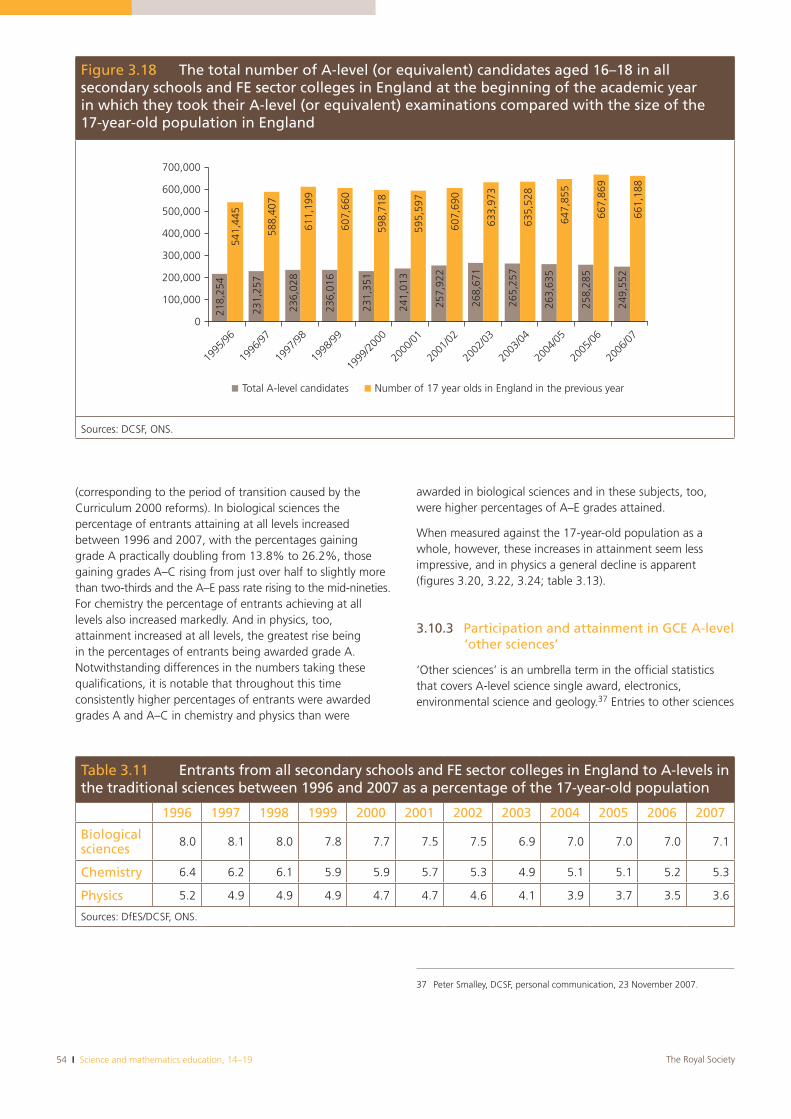
54 I Science and mathematics education, 14–19 The Royal Society
(corresponding to the period of transition caused by the Curriculum 2000 reforms). In biological sciences the percentage of entrants attaining at all levels increased between 1996 and 2007, with the percentages gaining grade A practically doubling from 13.8% to 26.2%, those gaining grades A–C rising from just over half to slightly more than two-thirds and the A–E pass rate rising to the mid-nineties. For chemistry the percentage of entrants achieving at all levels also increased markedly. And in physics, too, attainment increased at all levels, the greatest rise being in the percentages of entrants being awarded grade A. Notwithstanding differences in the numbers taking these qualifications, it is notable that throughout this time consistently higher percentages of entrants were awarded grades A and A–C in chemistry and physics than were
awarded in biological sciences and in these subjects, too, were higher percentages of A–E grades attained.
When measured against the 17-year-old population as a whole, however, these increases in attainment seem less impressive, and in physics a general decline is apparent (figures 3.20, 3.22, 3.24; table 3.13).
3.10.3 Participation and attainment in GCE A-level ‘other sciences’
‘Other sciences’ is an umbrella term in the official statistics that covers A-level science single award, electronics, environmental science and geology.37 Entries to other sciences
37 Peter Smalley, DCSF, personal communication, 23 November 2007.
Figure 3.18 The total number of A-level (or equivalent) candidates aged 16–18 in all secondary schools and FE sector colleges in England at the beginning of the academic year in which they took their A-level (or equivalent) examinations compared with the size of the 17-year-old population in England
700,000
600,000
500,000
400,000
300,000
100,000
0
1995
/96
1996
/97
1997
/98
1998
/99
1999
/200
0
2000
/01
2001
/02
2002
/03
2003
/04
2004
/05
2005
/06
2006
/07
200,000
Total A-level candidates Number of 17 year olds in England in the previous year
218,
254
231,
257
236,
028
236,
016
231,
351
241,
013
257,
922
268,
671
265,
257
263,
635
258,
285
249,
552
661,
188
667,
869
647,
855
635,
528
633,
973
607,
690
595,
597
598,
718
607,
660
611,
199
588,
407
541,
445
Sources: DCSF, ONS.
Table 3.11 Entrants from all secondary schools and FE sector colleges in England to A-levels in the traditional sciences between 1996 and 2007 as a percentage of the 17-year-old population
1996 1997 1998 1999 2000 2001 2002 2003 2004 2005 2006 2007
Biologicalsciences 8.0 8.1 8.0 7.8 7.7 7.5 7.5 6.9 7.0 7.0 7.0 7.1
Chemistry 6.4 6.2 6.1 5.9 5.9 5.7 5.3 4.9 5.1 5.1 5.2 5.3
Physics 5.2 4.9 4.9 4.9 4.7 4.7 4.6 4.1 3.9 3.7 3.5 3.6
Sources: DfES/DCSF, ONS.
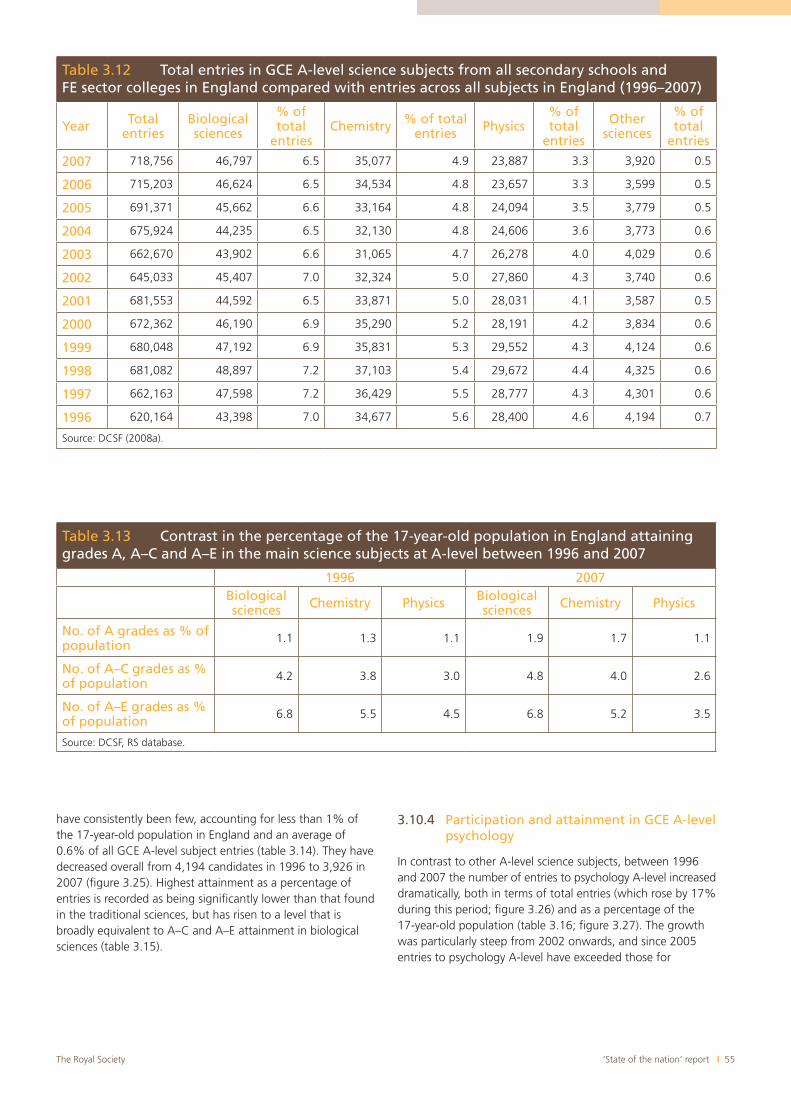
‘State of the nation’ report I 55The Royal Society
have consistently been few, accounting for less than 1% of the 17-year-old population in England and an average of 0.6% of all GCE A-level subject entries (table 3.14). They have decreased overall from 4,194 candidates in 1996 to 3,926 in 2007 (figure 3.25). Highest attainment as a percentage of entries is recorded as being significantly lower than that found in the traditional sciences, but has risen to a level that is broadly equivalent to A–C and A–E attainment in biological sciences (table 3.15).
3.10.4 Participation and attainment in GCE A-level psychology
In contrast to other A-level science subjects, between 1996 and 2007 the number of entries to psychology A-level increased dramatically, both in terms of total entries (which rose by 17% during this period; figure 3.26) and as a percentage of the 17-year-old population (table 3.16; figure 3.27). The growth was particularly steep from 2002 onwards, and since 2005 entries to psychology A-level have exceeded those for
Table 3.12 Total entries in GCE A-level science subjects from all secondary schools and FE sector colleges in England compared with entries across all subjects in England (1996–2007)
Year Total entries
Biologicalsciences
% of total
entriesChemistry % of total
entries Physics% of total
entries
Othersciences
% of total
entries
2007 718,756 46,797 6.5 35,077 4.9 23,887 3.3 3,920 0.5
2006 715,203 46,624 6.5 34,534 4.8 23,657 3.3 3,599 0.5
2005 691,371 45,662 6.6 33,164 4.8 24,094 3.5 3,779 0.5
2004 675,924 44,235 6.5 32,130 4.8 24,606 3.6 3,773 0.6
2003 662,670 43,902 6.6 31,065 4.7 26,278 4.0 4,029 0.6
2002 645,033 45,407 7.0 32,324 5.0 27,860 4.3 3,740 0.6
2001 681,553 44,592 6.5 33,871 5.0 28,031 4.1 3,587 0.5
2000 672,362 46,190 6.9 35,290 5.2 28,191 4.2 3,834 0.6
1999 680,048 47,192 6.9 35,831 5.3 29,552 4.3 4,124 0.6
1998 681,082 48,897 7.2 37,103 5.4 29,672 4.4 4,325 0.6
1997 662,163 47,598 7.2 36,429 5.5 28,777 4.3 4,301 0.6
1996 620,164 43,398 7.0 34,677 5.6 28,400 4.6 4,194 0.7
Source: DCSF (2008a).
Table 3.13 Contrast in the percentage of the 17-year-old population in England attaining grades A, A–C and A–E in the main science subjects at A-level between 1996 and 2007
1996 2007Biologicalsciences Chemistry Physics Biological
sciences Chemistry Physics
No. of A grades as % of population 1.1 1.3 1.1 1.9 1.7 1.1
No. of A–C grades as % of population 4.2 3.8 3.0 4.8 4.0 2.6
No. of A–E grades as % of population 6.8 5.5 4.5 6.8 5.2 3.5
Source: DCSF, RS database.
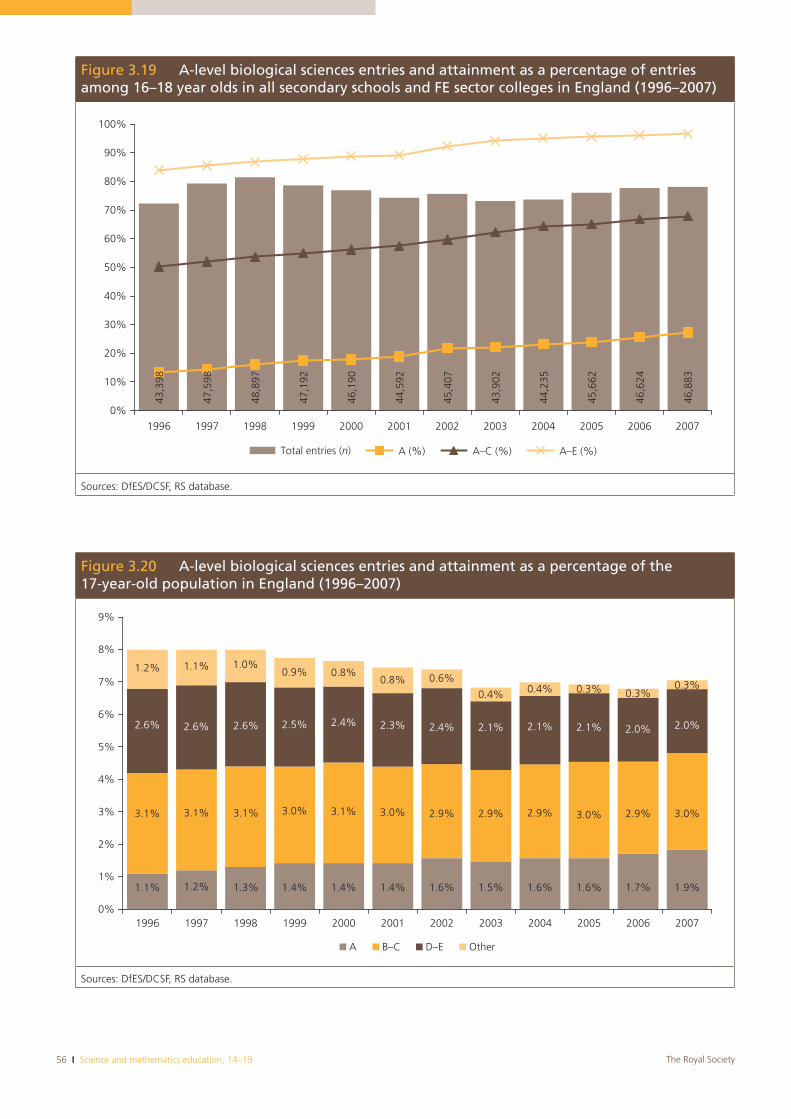
56 I Science and mathematics education, 14–19 The Royal Society
Figure 3.19 A-level biological sciences entries and attainment as a percentage of entries among 16–18 year olds in all secondary schools and FE sector colleges in England (1996–2007)
0%
10%
20%
30%
40%
50%
60%
70%
80%
90%
100%
1996 1997 1998 1999 2000 2001 2002 2003 2004 2005 2006 2007
Total entries (n) A (%) A–C (%) A–E (%)
43,3
98
47,5
98
48,8
97
47,1
92
46,1
90
44,5
92
45,4
07
43,9
02
44,2
35
45,6
62
46,6
24
46,8
83
Sources: DfES/DCSF, RS database.
Figure 3.20 A-level biological sciences entries and attainment as a percentage of the 17-year-old population in England (1996–2007)
1.1% 1.2% 1.3% 1.4% 1.4% 1.4% 1.6% 1.5% 1.6% 1.6% 1.7% 1.9%
3.1% 3.1% 3.1% 3.0% 3.1% 3.0% 2.9% 2.9% 2.9% 3.0% 2.9% 3.0%
2.6% 2.6% 2.6% 2.5% 2.4% 2.3% 2.4% 2.1% 2.1% 2.1% 2.0% 2.0%
1.2% 1.1% 1.0%0.9% 0.8%
0.8% 0.6%
0.4% 0.4% 0.3% 0.3%0.3%
0%
1%
2%
3%
4%
5%
6%
7%
8%
9%
1996 1997 1998 1999 2000 2001 2002 2003 2004 2005 2006 2007
A B–C D–E Other
Sources: DfES/DCSF, RS database.
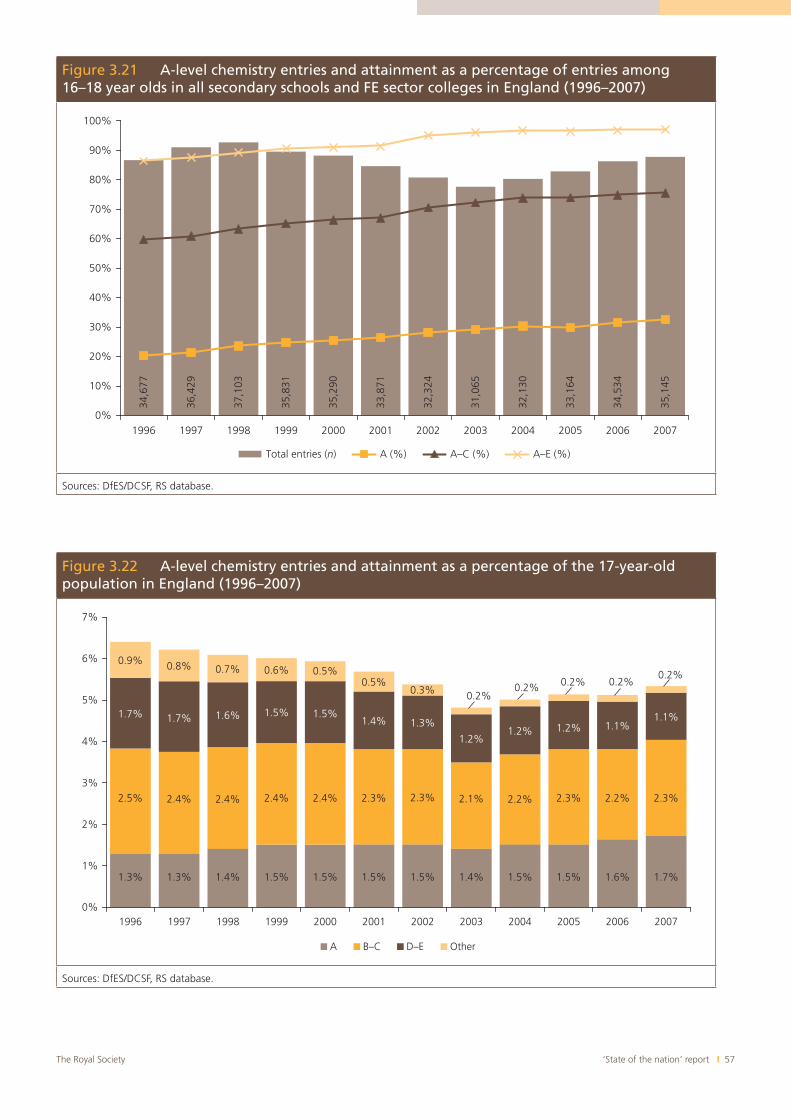
‘State of the nation’ report I 57The Royal Society
Figure 3.21 A-level chemistry entries and attainment as a percentage of entries among 16–18 year olds in all secondary schools and FE sector colleges in England (1996–2007)
34,6
77
36,4
29
37,1
03
35,8
31
35,2
90
33,8
71
32,3
24
31,0
65
32,1
30
33,1
64
34,5
34
35,1
45
0%
10%
20%
30%
40%
50%
60%
70%
80%
90%
100%
1996 1997 1998 1999 2000 2001 2002 2003 2004 2005 2006 2007
Total entries (n) A (%) A–C (%) A–E (%)
Sources: DfES/DCSF, RS database.
Figure 3.22 A-level chemistry entries and attainment as a percentage of the 17-year-old population in England (1996–2007)
1.3% 1.3% 1.4% 1.5% 1.5% 1.5% 1.5% 1.4% 1.5% 1.5% 1.6% 1.7%
2.5% 2.4% 2.4% 2.4% 2.4% 2.3% 2.3% 2.1% 2.2% 2.3% 2.2% 2.3%
1.7% 1.7% 1.6% 1.5% 1.5%1.4% 1.3%
1.2%1.2% 1.2% 1.1%
1.1%
0.9% 0.8% 0.7% 0.6% 0.5%0.5%
0.3% 0.2%0.2% 0.2% 0.2%
0.2%
0%
1%
2%
3%
4%
5%
6%
7%
1996 1997 1998 1999 2000 2001 2002 2003 2004 2005 2006 2007
A B–C D–E Other
Sources: DfES/DCSF, RS database.
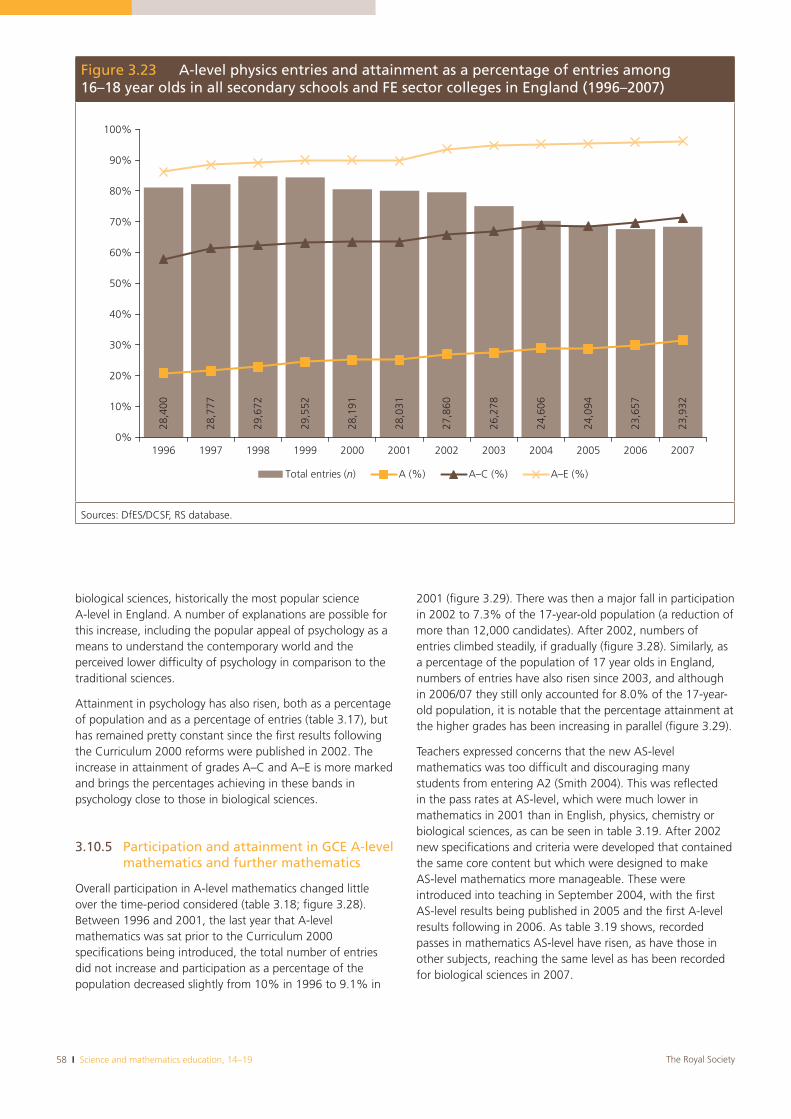
58 I Science and mathematics education, 14–19 The Royal Society
biological sciences, historically the most popular science A-level in England. A number of explanations are possible for this increase, including the popular appeal of psychology as a means to understand the contemporary world and the perceived lower difficulty of psychology in comparison to the traditional sciences.
Attainment in psychology has also risen, both as a percentage of population and as a percentage of entries (table 3.17), but has remained pretty constant since the first results following the Curriculum 2000 reforms were published in 2002. The increase in attainment of grades A–C and A–E is more marked and brings the percentages achieving in these bands in psychology close to those in biological sciences.
3.10.5 Participation and attainment in GCE A-level mathematics and further mathematics
Overall participation in A-level mathematics changed little over the time-period considered (table 3.18; figure 3.28). Between 1996 and 2001, the last year that A-level mathematics was sat prior to the Curriculum 2000 specifications being introduced, the total number of entries did not increase and participation as a percentage of the population decreased slightly from 10% in 1996 to 9.1% in
2001 (figure 3.29). There was then a major fall in participation in 2002 to 7.3% of the 17-year-old population (a reduction of more than 12,000 candidates). After 2002, numbers of entries climbed steadily, if gradually (figure 3.28). Similarly, as a percentage of the population of 17 year olds in England, numbers of entries have also risen since 2003, and although in 2006/07 they still only accounted for 8.0% of the 17-year-old population, it is notable that the percentage attainment at the higher grades has been increasing in parallel (figure 3.29).
Teachers expressed concerns that the new AS-level mathematics was too difficult and discouraging many students from entering A2 (Smith 2004). This was reflected in the pass rates at AS-level, which were much lower in mathematics in 2001 than in English, physics, chemistry or biological sciences, as can be seen in table 3.19. After 2002 new specifications and criteria were developed that contained the same core content but which were designed to make AS-level mathematics more manageable. These were introduced into teaching in September 2004, with the first AS-level results being published in 2005 and the first A-level results following in 2006. As table 3.19 shows, recorded passes in mathematics AS-level have risen, as have those in other subjects, reaching the same level as has been recorded for biological sciences in 2007.
Figure 3.23 A-level physics entries and attainment as a percentage of entries among 16–18 year olds in all secondary schools and FE sector colleges in England (1996–2007)
28,4
00
28,7
77
29,6
72
29,5
52
28,1
91
28,0
31
27,8
60
26,2
78
24,6
06
24,0
94
23,6
57
23,9
32
0%
10%
20%
30%
40%
50%
60%
70%
80%
90%
100%
1996 1997 1998 1999 2000 2001 2002 2003 2004 2005 2006 2007
Total entries (n) A (%) A–C (%) A–E (%)
Sources: DfES/DCSF, RS database.
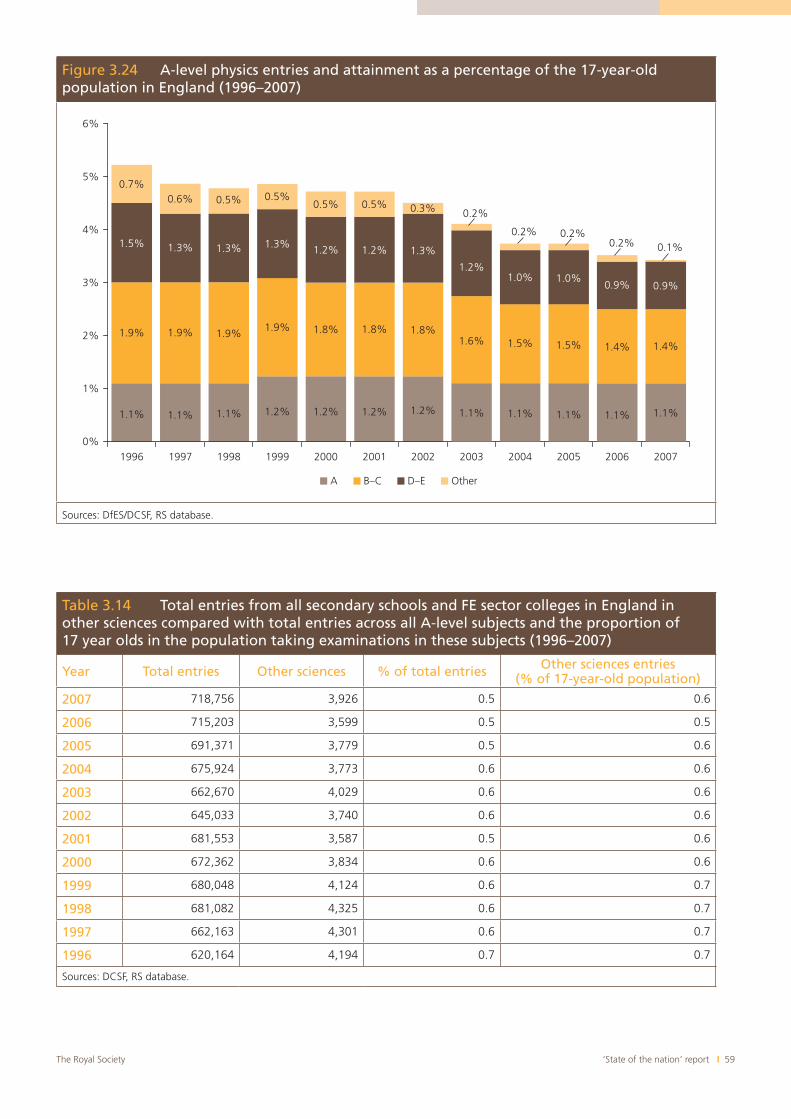
‘State of the nation’ report I 59The Royal Society
Figure 3.24 A-level physics entries and attainment as a percentage of the 17-year-old population in England (1996–2007)
1.1% 1.1% 1.1% 1.2% 1.2% 1.2% 1.2% 1.1% 1.1% 1.1% 1.1% 1.1%
1.9% 1.9% 1.9%1.9% 1.8% 1.8% 1.8%
1.6% 1.5% 1.5% 1.4% 1.4%
1.5% 1.3% 1.3% 1.3% 1.2% 1.2% 1.3%
1.2%1.0% 1.0%
0.9% 0.9%
0.7%0.6% 0.5% 0.5%
0.5% 0.5% 0.3% 0.2%
0.2% 0.2%0.2% 0.1%
0%
1%
2%
3%
4%
5%
6%
1996 1997 1998 1999 2000 2001 2002 2003 2004 2005 2006 2007
A B–C D–E Other
Sources: DfES/DCSF, RS database.
Table 3.14 Total entries from all secondary schools and FE sector colleges in England in other sciences compared with total entries across all A-level subjects and the proportion of 17 year olds in the population taking examinations in these subjects (1996–2007)
Year Total entries Other sciences % of total entries Other sciences entries (% of 17-year-old population)
2007 718,756 3,926 0.5 0.6
2006 715,203 3,599 0.5 0.5
2005 691,371 3,779 0.5 0.6
2004 675,924 3,773 0.6 0.6
2003 662,670 4,029 0.6 0.6
2002 645,033 3,740 0.6 0.6
2001 681,553 3,587 0.5 0.6
2000 672,362 3,834 0.6 0.6
1999 680,048 4,124 0.6 0.7
1998 681,082 4,325 0.6 0.7
1997 662,163 4,301 0.6 0.7
1996 620,164 4,194 0.7 0.7
Sources: DCSF, RS database.
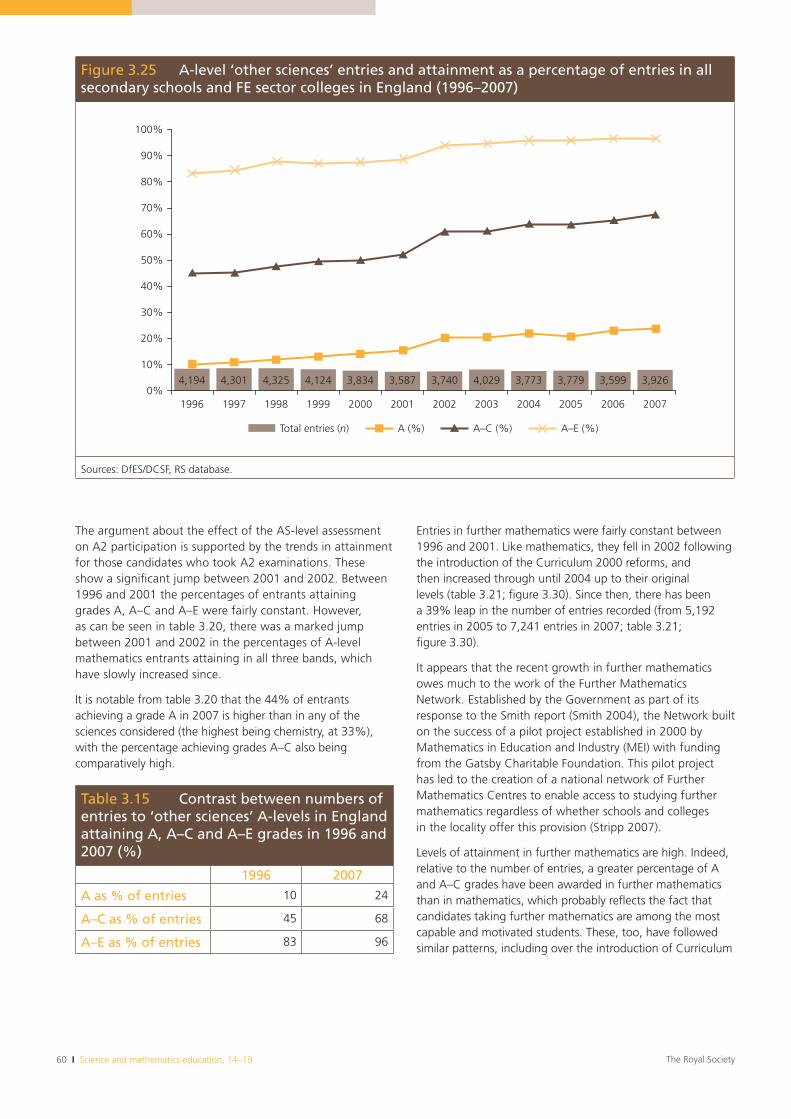
60 I Science and mathematics education, 14–19 The Royal Society
The argument about the effect of the AS-level assessment on A2 participation is supported by the trends in attainment for those candidates who took A2 examinations. These show a significant jump between 2001 and 2002. Between 1996 and 2001 the percentages of entrants attaining grades A, A–C and A–E were fairly constant. However, as can be seen in table 3.20, there was a marked jump between 2001 and 2002 in the percentages of A-level mathematics entrants attaining in all three bands, which have slowly increased since.
It is notable from table 3.20 that the 44% of entrants achieving a grade A in 2007 is higher than in any of the sciences considered (the highest being chemistry, at 33%), with the percentage achieving grades A–C also being comparatively high.
Entries in further mathematics were fairly constant between 1996 and 2001. Like mathematics, they fell in 2002 following the introduction of the Curriculum 2000 reforms, and then increased through until 2004 up to their original levels (table 3.21; figure 3.30). Since then, there has been a 39% leap in the number of entries recorded (from 5,192 entries in 2005 to 7,241 entries in 2007; table 3.21; figure 3.30).
It appears that the recent growth in further mathematics owes much to the work of the Further Mathematics Network. Established by the Government as part of its response to the Smith report (Smith 2004), the Network built on the success of a pilot project established in 2000 by Mathematics in Education and Industry (MEI) with funding from the Gatsby Charitable Foundation. This pilot project has led to the creation of a national network of Further Mathematics Centres to enable access to studying further mathematics regardless of whether schools and colleges in the locality offer this provision (Stripp 2007).
Levels of attainment in further mathematics are high. Indeed, relative to the number of entries, a greater percentage of A and A–C grades have been awarded in further mathematics than in mathematics, which probably reflects the fact that candidates taking further mathematics are among the most capable and motivated students. These, too, have followed similar patterns, including over the introduction of Curriculum
Table 3.15 Contrast between numbers of entries to ‘other sciences’ A-levels in England attaining A, A–C and A–E grades in 1996 and 2007 (%)
1996 2007
A as % of entries 10 24
A–C as % of entries 45 68
A–E as % of entries 83 96
Figure 3.25 A-level ‘other sciences’ entries and attainment as a percentage of entries in all secondary schools and FE sector colleges in England (1996–2007)
100%
90%
80%
70%
60%
50%
40%
30%
20%
10%
0%1996
4,194 4,301 4,325 4,124 3,834 3,587 3,740 4,029 3,773 3,779 3,599 3,926
1997 1998 1999 2000 2001 2002 2003 2004 2005 2006 2007
Total entries (n) A (%) A–C (%) A–E (%)
Sources: DfES/DCSF, RS database.
‘State of the nation’ report I 61The Royal Society
2000. However, in contrast to the increasing numbers of further mathematics entries since 2002, the percentages gaining a grade A have actually decreased from 63% to 57% (table 3.22; figure 3.30).
3.10.6 Participation and attainment in vocational A-levels and their equivalents
Advanced GNVQ qualifications were phased out in 2000, owing to poor completion rates, and were replaced by the new advanced vocational A-levels (VCEs). Table 3.23 records the levels of entry and attainment in Advanced GNVQ science from 1998 to 2001 (the last year for which results were
registered). (No equivalent mathematics qualification was offered.) The data show that, overall, levels of attainment (and failure) increased in line with year-on-year increases in the numbers of entries.
3.10.6.1 Participation and attainment in Advanced VCE single and double awards
The new Advanced VCE awards (offered as 3-, 6- and 12-module courses equivalent to AS-level, a single full A-level and two full A-levels, respectively) were introduced into teaching in September 2000. Tables 3.24–3.25 show published data on the participation and performance in VCE science since the first results became available in 2002.
Although entries to the single-award VCE science have risen by 60% over the past six years, the new qualification has not gained popularity (table 3.24). Nonetheless, performance has improved with consistent increases being seen in attainment at all levels.
The marginal success of the single-award VCE science has not, however, been replicated in the participation and performance figures available for the double-award equivalent. In fact, as table 3.25 shows, entries have fallen by 35% since 2002 and attainment has fallen at the higher levels and increased at the lower levels.
Table 3.16 Total entries in psychology A-level from all secondary schools and FE sector colleges in England compared with total entries across all A-level subjects and the proportion of 17 year olds in the population taking examinations in these subjects (1996–2007)
Year Psychologyentries
% of total entries across all A-level subjects (cf. table 3.14)
Psychology entries (% of 17-year-old population)
2007 48,603 6.8 7.4
2006 48,571 6.8 7.3
2005 46,023 6.7 7.1
2004 42,807 6.3 6.7
2003 37,897 5.7 6.0
2002 32,008 5.0 5.3
2001 26,683 3.9 4.5
2000 25,073 3.7 4.2
1999 23,809 3.5 3.9
1998 23,879 3.5 3.9
1997 22,262 3.4 3.8
1996 18,057 2.9 3.3
Sources: DCSF, RS database.
Table 3.17 Psychology entries attaining A, A–C and A–E grades between 1996 and 2007 as a percentage of all psychology entries (England, %)
1996 2007
A as % of entries 11 19
A–C as % of entries 47 67
A–E as % of entries 79 97
Sources: DCSF, RS database.
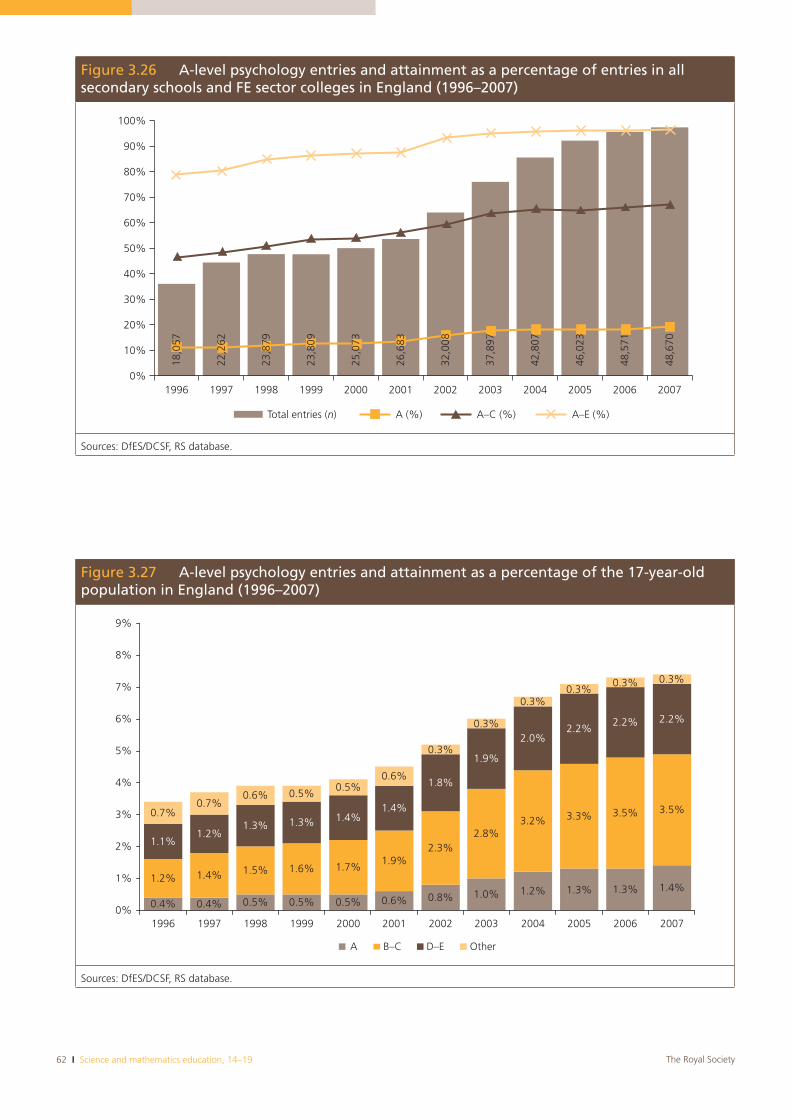
62 I Science and mathematics education, 14–19 The Royal Society
Figure 3.26 A-level psychology entries and attainment as a percentage of entries in all secondary schools and FE sector colleges in England (1996–2007)
100%
90%
80%
70%
60%
50%
40%
30%
20%
10%
0%1996
Total entries (n) A (%) A–C (%) A–E (%)
19981997 1999 2000 2001 2002 2003 2004 2005 2006 2007
18,0
57
22,2
62
23,8
79
23,8
09
25,0
73
26,6
83
32,0
08
37,8
97
42,8
07
46,0
23
48,5
71
48,6
70
Sources: DfES/DCSF, RS database.
Figure 3.27 A-level psychology entries and attainment as a percentage of the 17-year-old population in England (1996–2007)
0.4% 0.4% 0.5% 0.5% 0.5% 0.6% 0.8% 1.0% 1.2% 1.3% 1.3% 1.4%1.2% 1.4% 1.5% 1.6% 1.7%
1.9%2.3%
2.8%3.2% 3.3% 3.5% 3.5%
1.1%1.2%
1.3% 1.3% 1.4%1.4%
1.8%
1.9%
2.0%2.2%
2.2% 2.2%
0.7%0.7%
0.6% 0.5%0.5%
0.6%
0.3%
0.3%
0.3%0.3%
0.3% 0.3%
0%
1%
2%
3%
4%
5%
6%
7%
8%
9%
1996 1997 1998 1999 2000 2001 2002 2003 2004 2005 2006 2007
A B–C D–E Other
Sources: DfES/DCSF, RS database.
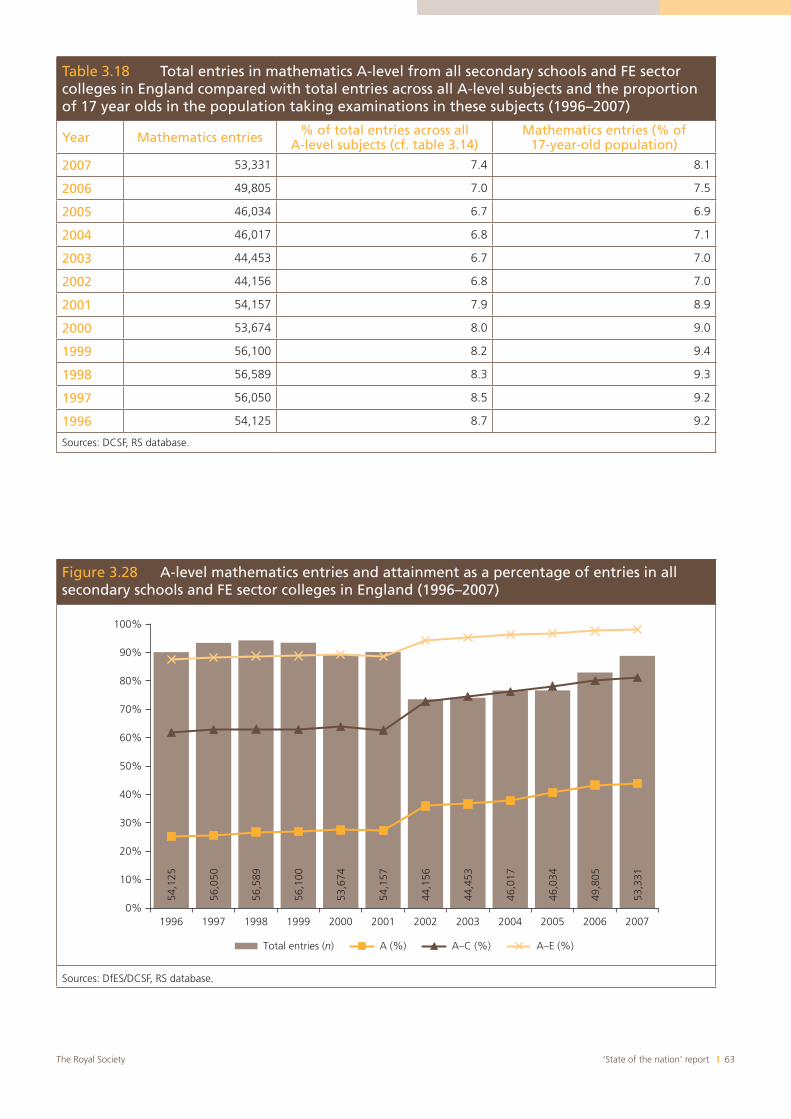
‘State of the nation’ report I 63The Royal Society
Figure 3.28 A-level mathematics entries and attainment as a percentage of entries in all secondary schools and FE sector colleges in England (1996–2007)
54,1
25
56,0
50
56,5
89
56,1
00
53,6
74
54,1
57
44,1
56
44,4
53
46,0
17
46,0
34
49,8
05
53,3
31
0%
10%
20%
30%
40%
50%
60%
70%
80%
90%
100%
1996 1997 1998 1999 2000 2001 2002 2003 2004 2005 2006 2007
Total entries (n) A (%) A–C (%) A–E (%)
Sources: DfES/DCSF, RS database.
Table 3.18 Total entries in mathematics A-level from all secondary schools and FE sector colleges in England compared with total entries across all A-level subjects and the proportion of 17 year olds in the population taking examinations in these subjects (1996–2007)
Year Mathematics entries % of total entries across all A-level subjects (cf. table 3.14)
Mathematics entries (% of 17-year-old population)
2007 53,331 7.4 8.1
2006 49,805 7.0 7.5
2005 46,034 6.7 6.9
2004 46,017 6.8 7.1
2003 44,453 6.7 7.0
2002 44,156 6.8 7.0
2001 54,157 7.9 8.9
2000 53,674 8.0 9.0
1999 56,100 8.2 9.4
1998 56,589 8.3 9.3
1997 56,050 8.5 9.2
1996 54,125 8.7 9.2
Sources: DCSF, RS database.
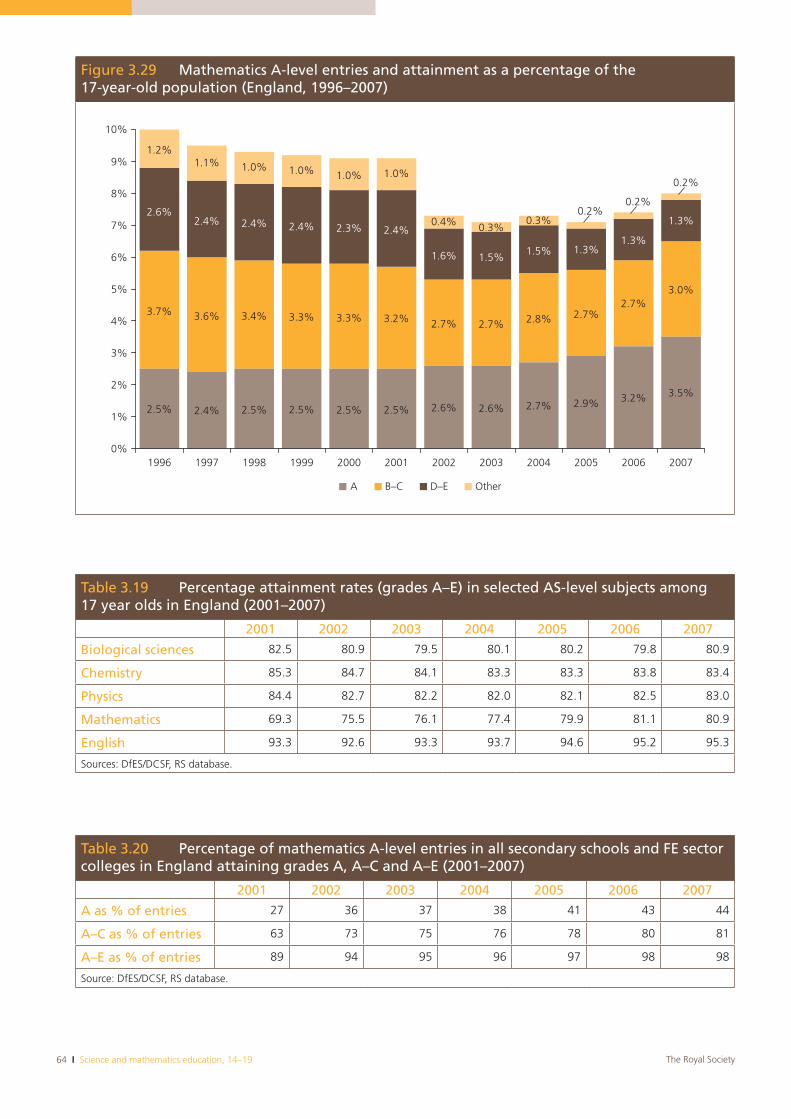
64 I Science and mathematics education, 14–19 The Royal Society
Table 3.19 Percentage attainment rates (grades A–E) in selected AS-level subjects among 17 year olds in England (2001–2007)
2001 2002 2003 2004 2005 2006 2007
Biological sciences 82.5 80.9 79.5 80.1 80.2 79.8 80.9
Chemistry 85.3 84.7 84.1 83.3 83.3 83.8 83.4
Physics 84.4 82.7 82.2 82.0 82.1 82.5 83.0
Mathematics 69.3 75.5 76.1 77.4 79.9 81.1 80.9
English 93.3 92.6 93.3 93.7 94.6 95.2 95.3
Sources: DfES/DCSF, RS database.
Table 3.20 Percentage of mathematics A-level entries in all secondary schools and FE sector colleges in England attaining grades A, A–C and A–E (2001–2007)
2001 2002 2003 2004 2005 2006 2007
A as % of entries 27 36 37 38 41 43 44
A–C as % of entries 63 73 75 76 78 80 81
A–E as % of entries 89 94 95 96 97 98 98
Source: DfES/DCSF, RS database.
Figure 3.29 Mathematics A-level entries and attainment as a percentage of the 17-year-old population (England, 1996–2007)
2.5% 2.4% 2.5% 2.5% 2.5% 2.5% 2.6% 2.6% 2.7% 2.9% 3.2% 3.5%
3.7% 3.6% 3.4% 3.3% 3.3% 3.2% 2.7% 2.7% 2.8% 2.7%2.7%
3.0%
2.6%2.4% 2.4% 2.4% 2.3% 2.4%
1.6% 1.5%1.5% 1.3%
1.3%
1.3%
1.2%1.1% 1.0% 1.0% 1.0% 1.0%
0.4% 0.3%0.3%
0.2%
0.2%
0%
1%
2%
3%
4%
5%
6%
7%
8%
9%
10%
1996 1997 1998 1999 2000 2001 2002 2003 2004 2005 2006 2007
A B–C D–E Other
0.2%
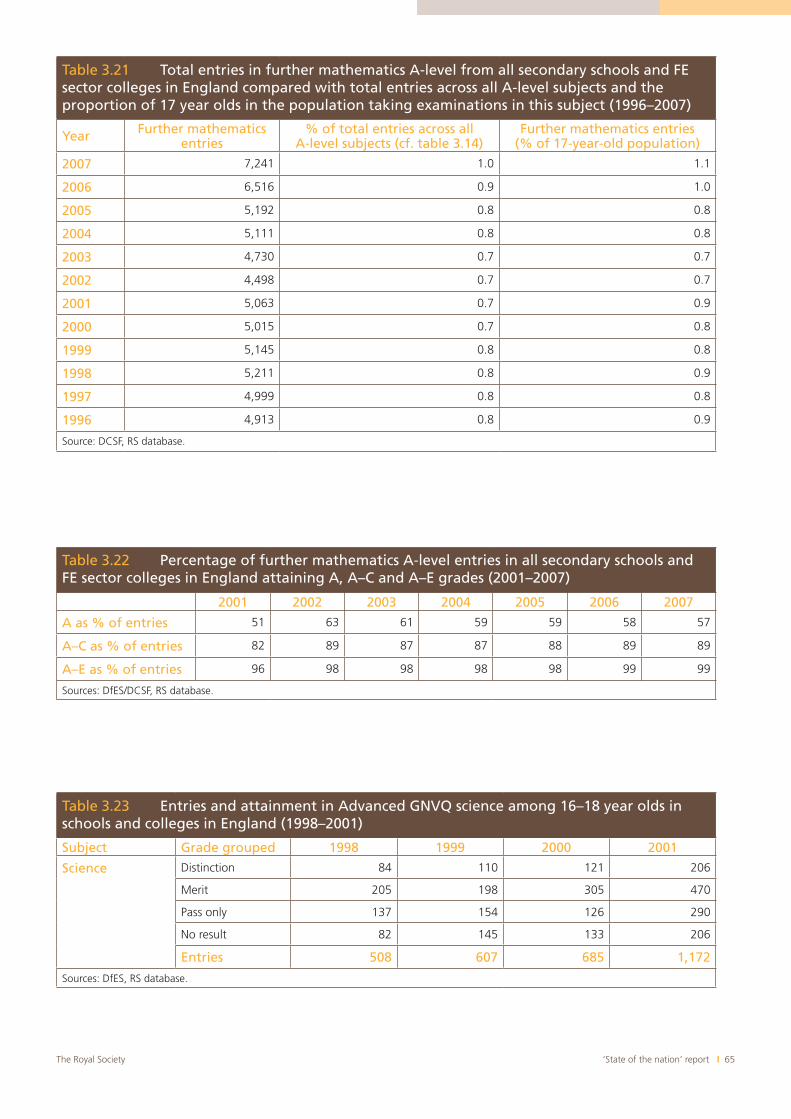
‘State of the nation’ report I 65The Royal Society
Table 3.21 Total entries in further mathematics A-level from all secondary schools and FE sector colleges in England compared with total entries across all A-level subjects and the proportion of 17 year olds in the population taking examinations in this subject (1996–2007)
Year Further mathematics entries
% of total entries across all A-level subjects (cf. table 3.14)
Further mathematics entries (% of 17-year-old population)
2007 7,241 1.0 1.1
2006 6,516 0.9 1.0
2005 5,192 0.8 0.8
2004 5,111 0.8 0.8
2003 4,730 0.7 0.7
2002 4,498 0.7 0.7
2001 5,063 0.7 0.9
2000 5,015 0.7 0.8
1999 5,145 0.8 0.8
1998 5,211 0.8 0.9
1997 4,999 0.8 0.8
1996 4,913 0.8 0.9
Source: DCSF, RS database.
Table 3.22 Percentage of further mathematics A-level entries in all secondary schools and FE sector colleges in England attaining A, A–C and A–E grades (2001–2007)
2001 2002 2003 2004 2005 2006 2007
A as % of entries 51 63 61 59 59 58 57
A–C as % of entries 82 89 87 87 88 89 89
A–E as % of entries 96 98 98 98 98 99 99
Sources: DfES/DCSF, RS database.
Table 3.23 Entries and attainment in Advanced GNVQ science among 16–18 year olds in schools and colleges in England (1998–2001)
Subject Grade grouped 1998 1999 2000 2001
Science Distinction 84 110 121 206
Merit 205 198 305 470
Pass only 137 154 126 290
No result 82 145 133 206
Entries 508 607 685 1,172
Sources: DfES, RS database.
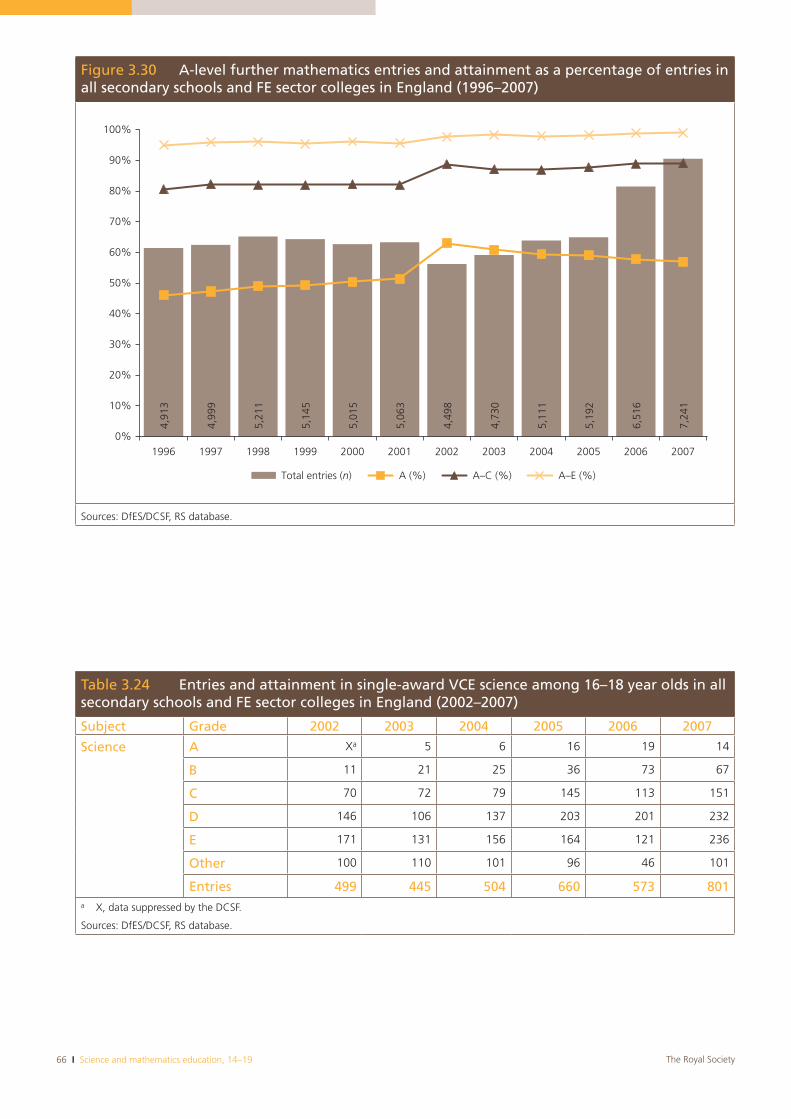
66 I Science and mathematics education, 14–19 The Royal Society
Table 3.24 Entries and attainment in single-award VCE science among 16–18 year olds in all secondary schools and FE sector colleges in England (2002–2007)
Subject Grade 2002 2003 2004 2005 2006 2007
Science A Xa 5 6 16 19 14
B 11 21 25 36 73 67
C 70 72 79 145 113 151
D 146 106 137 203 201 232
E 171 131 156 164 121 236
Other 100 110 101 96 46 101
Entries 499 445 504 660 573 801a X, data suppressed by the DCSF.
Sources: DfES/DCSF, RS database.
Figure 3.30 A-level further mathematics entries and attainment as a percentage of entries in all secondary schools and FE sector colleges in England (1996–2007)
4,91
3
4,99
9
5,21
1
5,14
5
5,01
5
5,06
3
4,49
8
4,73
0
5,11
1
5,19
2
6,51
6
7,24
1
0%
10%
20%
30%
40%
50%
60%
70%
80%
90%
100%
1996 1997 1998 1999 2000 2001 2002 2003 2004 2005 2006 2007
Total entries (n) A (%) A–C (%) A–E (%)
Sources: DfES/DCSF, RS database.
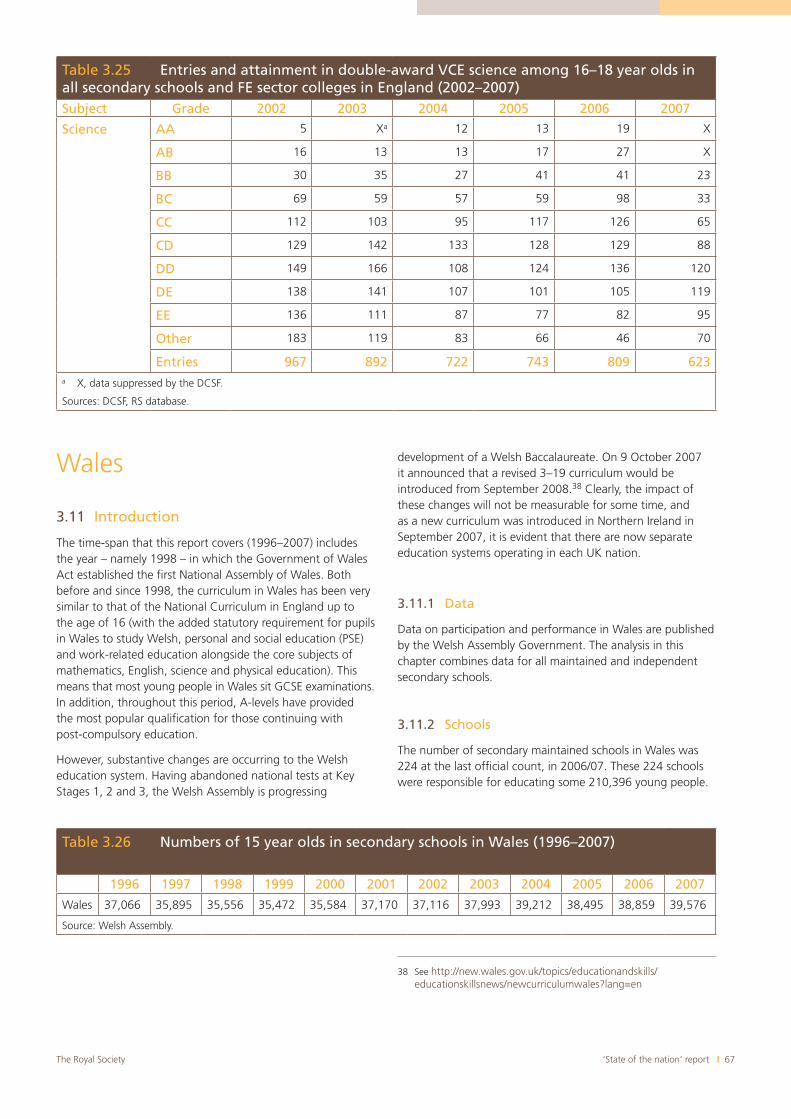
‘State of the nation’ report I 67The Royal Society
Wales
3.11 Introduction
The time-span that this report covers (1996–2007) includes the year – namely 1998 – in which the Government of Wales Act established the first National Assembly of Wales. Both before and since 1998, the curriculum in Wales has been very similar to that of the National Curriculum in England up to the age of 16 (with the added statutory requirement for pupils in Wales to study Welsh, personal and social education (PSE) and work-related education alongside the core subjects of mathematics, English, science and physical education). This means that most young people in Wales sit GCSE examinations. In addition, throughout this period, A-levels have provided the most popular qualification for those continuing with post-compulsory education.
However, substantive changes are occurring to the Welsh education system. Having abandoned national tests at Key Stages 1, 2 and 3, the Welsh Assembly is progressing
development of a Welsh Baccalaureate. On 9 October 2007 it announced that a revised 3–19 curriculum would be introduced from September 2008.38 Clearly, the impact of these changes will not be measurable for some time, and as a new curriculum was introduced in Northern Ireland in September 2007, it is evident that there are now separate education systems operating in each UK nation.
3.11.1 Data
Data on participation and performance in Wales are published by the Welsh Assembly Government. The analysis in this chapter combines data for all maintained and independent secondary schools.
3.11.2 Schools
The number of secondary maintained schools in Wales was 224 at the last official count, in 2006/07. These 224 schools were responsible for educating some 210,396 young people.
38 See http://new.wales.gov.uk/topics/educationandskills/educationskillsnews/newcurriculumwales?lang=en
Table 3.25 Entries and attainment in double-award VCE science among 16–18 year olds in all secondary schools and FE sector colleges in England (2002–2007)Subject Grade 2002 2003 2004 2005 2006 2007
Science AA 5 Xa 12 13 19 X
AB 16 13 13 17 27 X
BB 30 35 27 41 41 23
BC 69 59 57 59 98 33
CC 112 103 95 117 126 65
CD 129 142 133 128 129 88
DD 149 166 108 124 136 120
DE 138 141 107 101 105 119
EE 136 111 87 77 82 95
Other 183 119 83 66 46 70
Entries 967 892 722 743 809 623a X, data suppressed by the DCSF.
Sources: DCSF, RS database.
Table 3.26 Numbers of 15 year olds in secondary schools in Wales (1996–2007)
1996 1997 1998 1999 2000 2001 2002 2003 2004 2005 2006 2007
Wales 37,066 35,895 35,556 35,472 35,584 37,170 37,116 37,993 39,212 38,495 38,859 39,576
Source: Welsh Assembly.
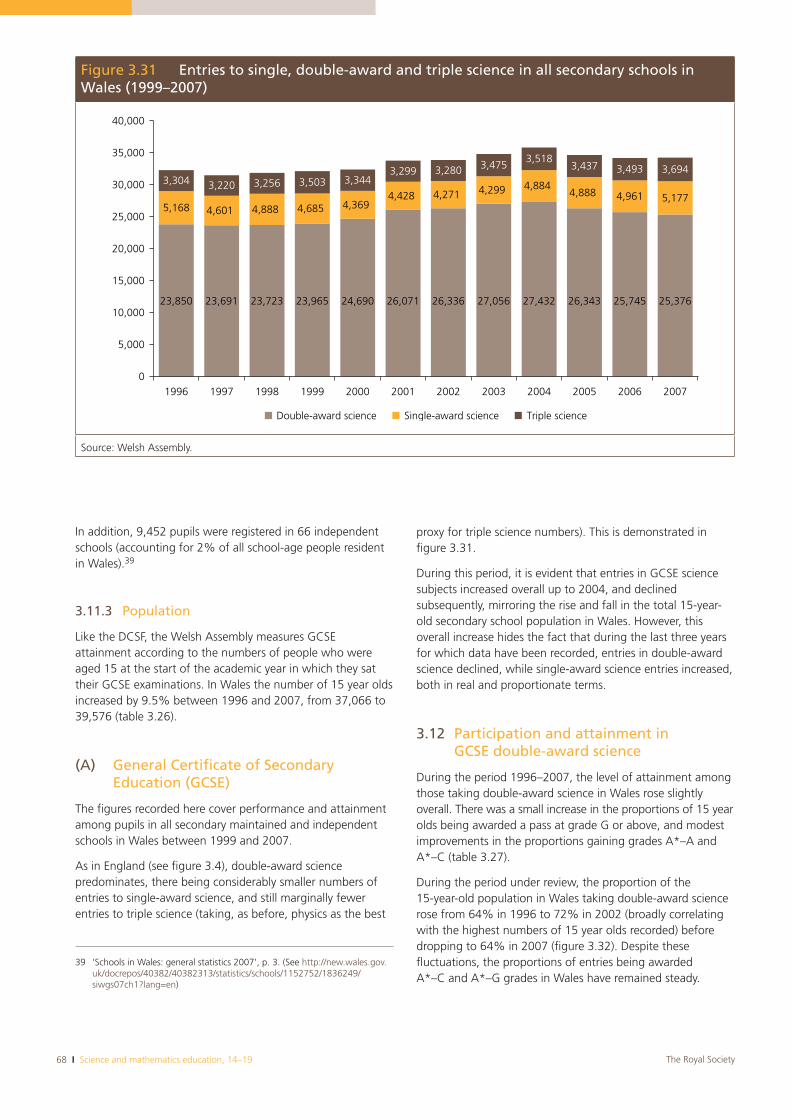
68 I Science and mathematics education, 14–19 The Royal Society
In addition, 9,452 pupils were registered in 66 independent schools (accounting for 2% of all school-age people resident in Wales).39
3.11.3 Population
Like the DCSF, the Welsh Assembly measures GCSE attainment according to the numbers of people who were aged 15 at the start of the academic year in which they sat their GCSE examinations. In Wales the number of 15 year olds increased by 9.5% between 1996 and 2007, from 37,066 to 39,576 (table 3.26).
(A) General Certificate of Secondary Education (GCSE)
The figures recorded here cover performance and attainment among pupils in all secondary maintained and independent schools in Wales between 1999 and 2007.
As in England (see figure 3.4), double-award science predominates, there being considerably smaller numbers of entries to single-award science, and still marginally fewer entries to triple science (taking, as before, physics as the best
39 ‘Schools in Wales: general statistics 2007’, p. 3. (See http://new.wales.gov.uk/docrepos/40382/40382313/statistics/schools/1152752/1836249/siwgs07ch1?lang=en)
proxy for triple science numbers). This is demonstrated in figure 3.31.
During this period, it is evident that entries in GCSE science subjects increased overall up to 2004, and declined subsequently, mirroring the rise and fall in the total 15-year-old secondary school population in Wales. However, this overall increase hides the fact that during the last three years for which data have been recorded, entries in double-award science declined, while single-award science entries increased, both in real and proportionate terms.
3.12 Participation and attainment in GCSE double-award science
During the period 1996–2007, the level of attainment among those taking double-award science in Wales rose slightly overall. There was a small increase in the proportions of 15 year olds being awarded a pass at grade G or above, and modest improvements in the proportions gaining grades A*–A and A*–C (table 3.27).
During the period under review, the proportion of the 15-year-old population in Wales taking double-award science rose from 64% in 1996 to 72% in 2002 (broadly correlating with the highest numbers of 15 year olds recorded) before dropping to 64% in 2007 (figure 3.32). Despite these fluctuations, the proportions of entries being awarded A*–C and A*–G grades in Wales have remained steady.
Figure 3.31 Entries to single, double-award and triple science in all secondary schools in Wales (1999–2007)
23,850 23,691 23,723 23,965 24,690 26,071 26,336 27,056 27,432 26,343 25,745 25,376
5,168 4,601 4,888 4,685 4,3694,428 4,271 4,299 4,884
4,888 4,961 5,177
3,304 3,220 3,256 3,503 3,3443,299 3,280 3,475
3,5183,437 3,493 3,694
0
5,000
10,000
15,000
20,000
25,000
30,000
35,000
40,000
1996 1997 1998 1999 2000 2001 2002 2003 2004 2005 2006 2007
Double-award science Single-award science Triple science
Source: Welsh Assembly.
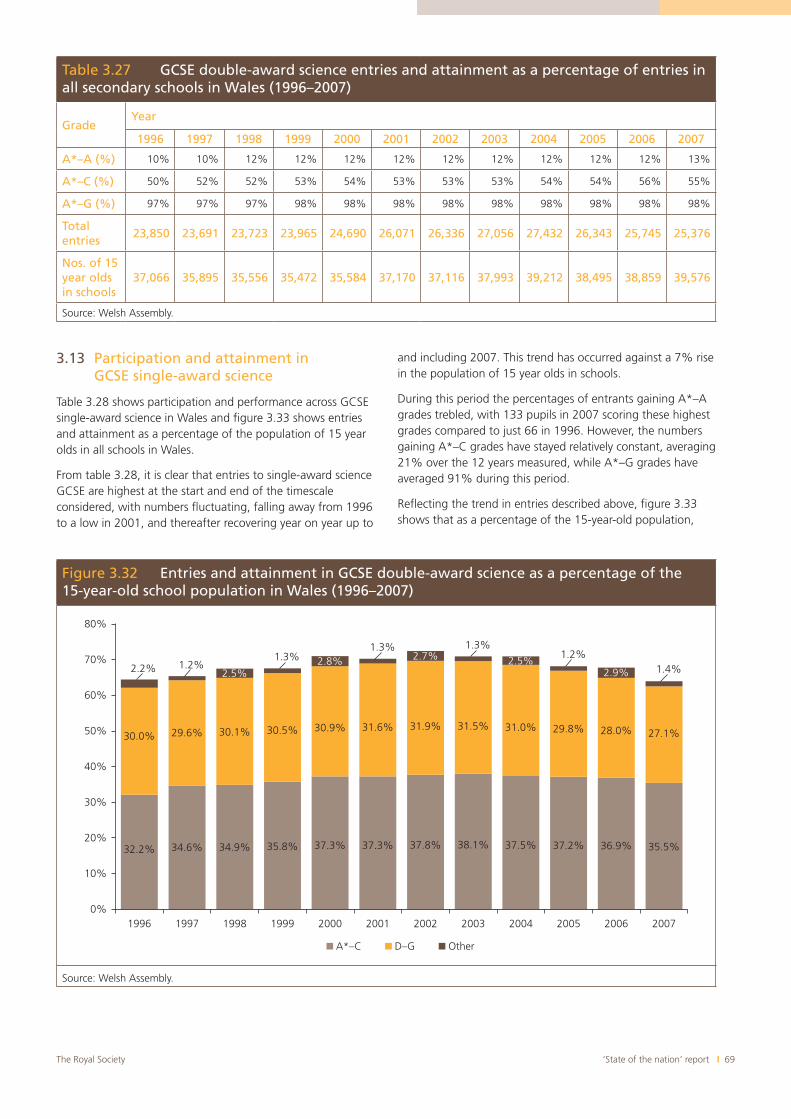
‘State of the nation’ report I 69The Royal Society
3.13 Participation and attainment in GCSE single-award science
Table 3.28 shows participation and performance across GCSE single-award science in Wales and figure 3.33 shows entries and attainment as a percentage of the population of 15 year olds in all schools in Wales.
From table 3.28, it is clear that entries to single-award science GCSE are highest at the start and end of the timescale considered, with numbers fluctuating, falling away from 1996 to a low in 2001, and thereafter recovering year on year up to
and including 2007. This trend has occurred against a 7% rise in the population of 15 year olds in schools.
During this period the percentages of entrants gaining A*–A grades trebled, with 133 pupils in 2007 scoring these highest grades compared to just 66 in 1996. However, the numbers gaining A*–C grades have stayed relatively constant, averaging 21% over the 12 years measured, while A*–G grades have averaged 91% during this period.
Reflecting the trend in entries described above, figure 3.33 shows that as a percentage of the 15-year-old population,
Table 3.27 GCSE double-award science entries and attainment as a percentage of entries in all secondary schools in Wales (1996–2007)
GradeYear
1996 1997 1998 1999 2000 2001 2002 2003 2004 2005 2006 2007
A*–A (%) 10% 10% 12% 12% 12% 12% 12% 12% 12% 12% 12% 13%
A*–C (%) 50% 52% 52% 53% 54% 53% 53% 53% 54% 54% 56% 55%
A*–G (%) 97% 97% 97% 98% 98% 98% 98% 98% 98% 98% 98% 98%
Total entries
23,850 23,691 23,723 23,965 24,690 26,071 26,336 27,056 27,432 26,343 25,745 25,376
Nos. of 15 year olds in schools
37,066 35,895 35,556 35,472 35,584 37,170 37,116 37,993 39,212 38,495 38,859 39,576
Source: Welsh Assembly.
Figure 3.32 Entries and attainment in GCSE double-award science as a percentage of the 15-year-old school population in Wales (1996–2007)
32.2% 34.6% 34.9% 35.8% 37.3% 37.3% 37.8% 38.1% 37.5% 37.2% 36.9% 35.5%
30.0% 29.6% 30.1% 30.5% 30.9% 31.6% 31.9% 31.5% 31.0% 29.8% 28.0% 27.1%
2.2% 1.2%2.5%
1.3% 2.8%1.3%
2.7%1.3%
2.5%1.2%
2.9% 1.4%
0%
10%
20%
30%
40%
50%
60%
70%
80%
1996 1997 1998 1999 2000 2001 2002 2003 2004 2005 2006 2007
A*–C D–G Other
Source: Welsh Assembly.
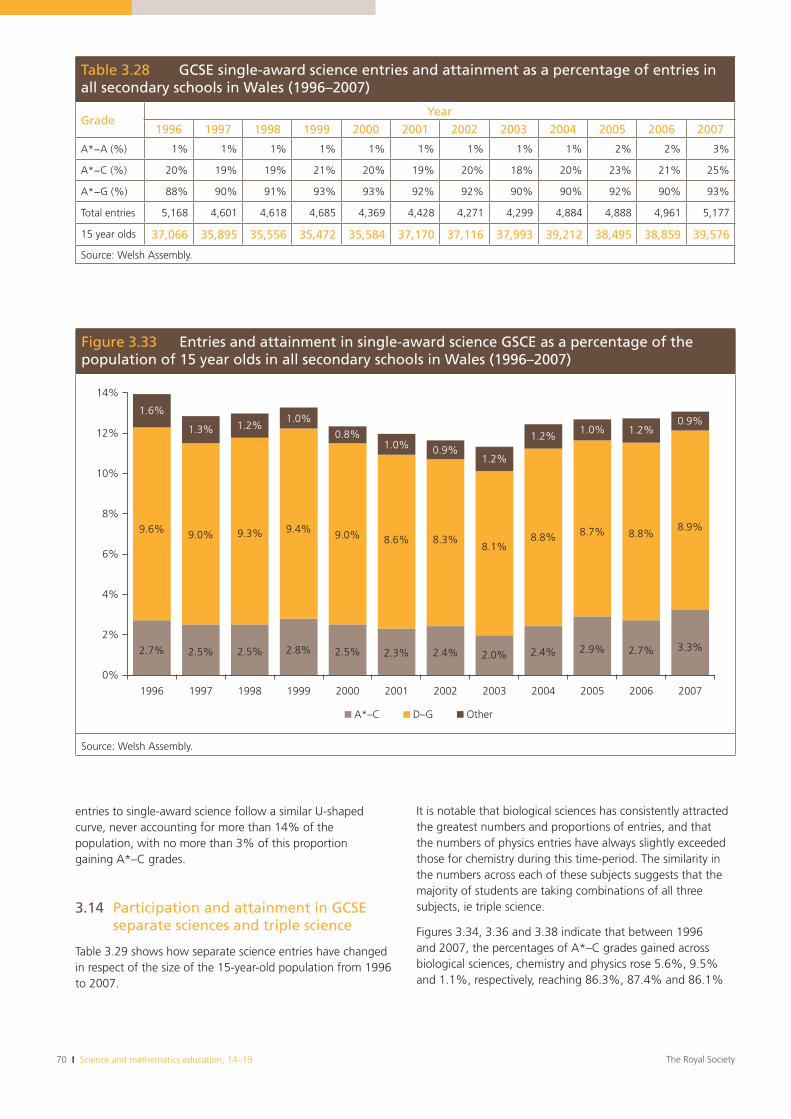
70 I Science and mathematics education, 14–19 The Royal Society
entries to single-award science follow a similar U-shaped curve, never accounting for more than 14% of the population, with no more than 3% of this proportion gaining A*–C grades.
3.14 Participation and attainment in GCSE separate sciences and triple science
Table 3.29 shows how separate science entries have changed in respect of the size of the 15-year-old population from 1996 to 2007.
It is notable that biological sciences has consistently attracted the greatest numbers and proportions of entries, and that the numbers of physics entries have always slightly exceeded those for chemistry during this time-period. The similarity in the numbers across each of these subjects suggests that the majority of students are taking combinations of all three subjects, ie triple science.
Figures 3.34, 3.36 and 3.38 indicate that between 1996 and 2007, the percentages of A*–C grades gained across biological sciences, chemistry and physics rose 5.6%, 9.5% and 1.1%, respectively, reaching 86.3%, 87.4% and 86.1%
Table 3.28 GCSE single-award science entries and attainment as a percentage of entries in all secondary schools in Wales (1996–2007)
GradeYear
1996 1997 1998 1999 2000 2001 2002 2003 2004 2005 2006 2007
A*−A (%) 1% 1% 1% 1% 1% 1% 1% 1% 1% 2% 2% 3%
A*−C (%) 20% 19% 19% 21% 20% 19% 20% 18% 20% 23% 21% 25%
A*−G (%) 88% 90% 91% 93% 93% 92% 92% 90% 90% 92% 90% 93%
Total entries 5,168 4,601 4,618 4,685 4,369 4,428 4,271 4,299 4,884 4,888 4,961 5,177
15 year olds 37,066 35,895 35,556 35,472 35,584 37,170 37,116 37,993 39,212 38,495 38,859 39,576
Source: Welsh Assembly.
Figure 3.33 Entries and attainment in single-award science GSCE as a percentage of the population of 15 year olds in all secondary schools in Wales (1996–2007)
2.7% 2.5% 2.5% 2.8% 2.5% 2.3% 2.4% 2.0% 2.4% 2.9% 2.7% 3.3%
9.6% 9.0% 9.3% 9.4% 9.0% 8.6% 8.3%8.1%
8.8% 8.7% 8.8%8.9%
1.6%
1.3% 1.2%1.0%
0.8%1.0% 0.9%
1.2%
1.2%1.0% 1.2%
0.9%
0%
2%
4%
6%
8%
10%
12%
14%
1996 1997 1998 1999 2000 2001 2002 2003 2004 2005 2006 2007
A*–C D–G Other
Source: Welsh Assembly.
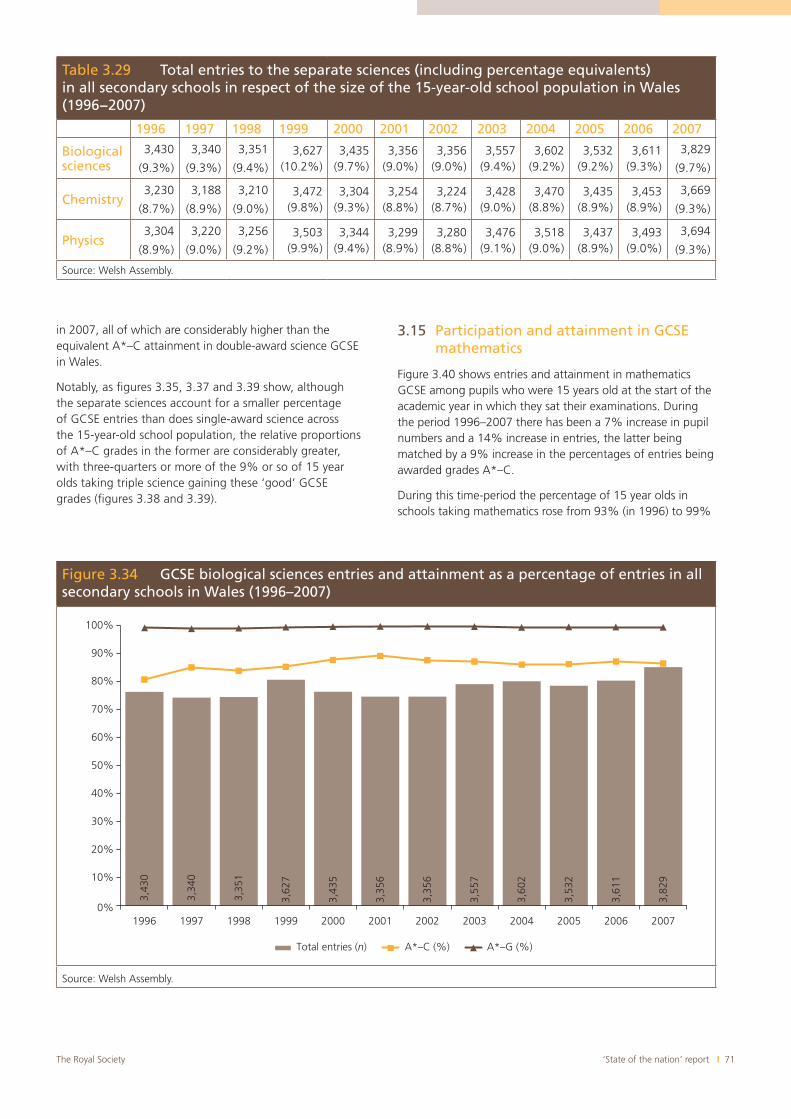
‘State of the nation’ report I 71The Royal Society
Table 3.29 Total entries to the separate sciences (including percentage equivalents) in all secondary schools in respect of the size of the 15-year-old school population in Wales (1996−2007)
1996 1997 1998 1999 2000 2001 2002 2003 2004 2005 2006 2007
Biologicalsciences
3,430
(9.3%)
3,340
(9.3%)
3,351
(9.4%)3,627
(10.2%)3,435
(9.7%)3,356
(9.0%)3,356
(9.0%)3,557
(9.4%)3,602
(9.2%)3,532
(9.2%)3,611
(9.3%)3,829
(9.7%)
Chemistry3,230
(8.7%)
3,188
(8.9%)
3,210
(9.0%)3,472
(9.8%)3,304
(9.3%)3,254
(8.8%)3,224
(8.7%)3,428
(9.0%)3,470
(8.8%)3,435
(8.9%)3,453
(8.9%)3,669
(9.3%)
Physics3,304
(8.9%)
3,220
(9.0%)
3,256
(9.2%)3,503
(9.9%)3,344
(9.4%)3,299
(8.9%)3,280
(8.8%)3,476
(9.1%)3,518
(9.0%)3,437
(8.9%)3,493
(9.0%)3,694
(9.3%)
Source: Welsh Assembly.
Figure 3.34 GCSE biological sciences entries and attainment as a percentage of entries in all secondary schools in Wales (1996–2007)
3,43
0
3,34
0
3,35
1
3,62
7
3,43
5
3,35
6
3,35
6
3,55
7
3,60
2
3,53
2
3,61
1
3,82
9
0%
10%
20%
30%
40%
50%
60%
70%
80%
90%
100%
1996 1997 1998 1999 2000 2001 2002 2003 2004 2005 2006 2007
Total entries (n) A*–C (%) A*–G (%)
Source: Welsh Assembly.
in 2007, all of which are considerably higher than the equivalent A*–C attainment in double-award science GCSE in Wales.
Notably, as figures 3.35, 3.37 and 3.39 show, although the separate sciences account for a smaller percentage of GCSE entries than does single-award science across the 15-year-old school population, the relative proportions of A*–C grades in the former are considerably greater, with three-quarters or more of the 9% or so of 15 year olds taking triple science gaining these ‘good’ GCSE grades (figures 3.38 and 3.39).
3.15 Participation and attainment in GCSE mathematics
Figure 3.40 shows entries and attainment in mathematics GCSE among pupils who were 15 years old at the start of the academic year in which they sat their examinations. During the period 1996–2007 there has been a 7% increase in pupil numbers and a 14% increase in entries, the latter being matched by a 9% increase in the percentages of entries being awarded grades A*–C.
During this time-period the percentage of 15 year olds in schools taking mathematics rose from 93% (in 1996) to 99%
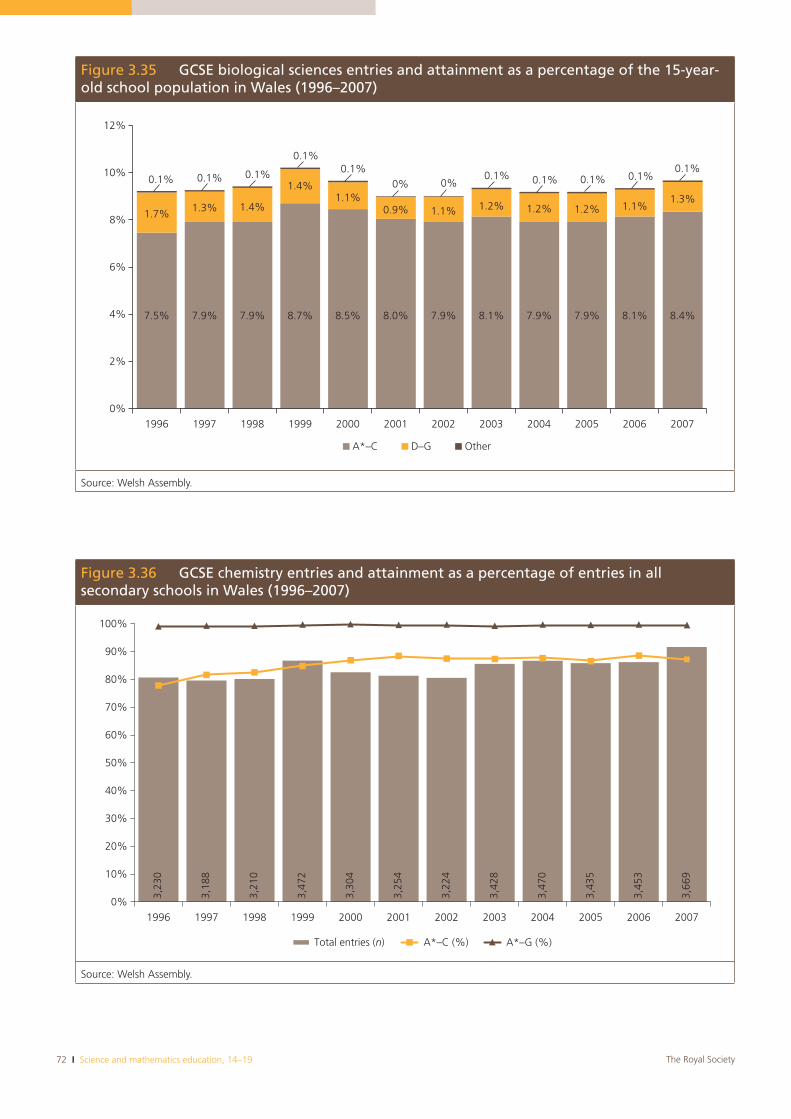
72 I Science and mathematics education, 14–19 The Royal Society
Figure 3.36 GCSE chemistry entries and attainment as a percentage of entries in all secondary schools in Wales (1996–2007)
3,23
0
3,18
8
3,21
0
3,47
2
3,30
4
3,25
4
3,22
4
3,42
8
3,47
0
3,43
5
3,45
3
3,66
9
0%
10%
20%
30%
40%
50%
60%
70%
80%
90%
100%
1996 1997 1998 1999 2000 2001 2002 2003 2004 2005 2006 2007
Total entries (n) A*–C (%) A*–G (%)
Source: Welsh Assembly.
Figure 3.35 GCSE biological sciences entries and attainment as a percentage of the 15-year-old school population in Wales (1996–2007)
7.5% 7.9% 7.9% 8.7% 8.5% 8.0% 7.9% 8.1% 7.9% 7.9% 8.1% 8.4%
1.7% 1.3% 1.4%
1.4%1.1%
0.9% 1.1% 1.2% 1.2% 1.2% 1.1%1.3%
0.1% 0.1% 0.1%0%
A*–C D–G Other
0%
2%
4%
6%
8%
10%
12%
1996 1997 1998 1999 2000 2001 2002 2003 2004 2005 2006 2007
0.1%0.1%
0.1% 0.1% 0.1% 0.1%0.1%
0%
Source: Welsh Assembly.
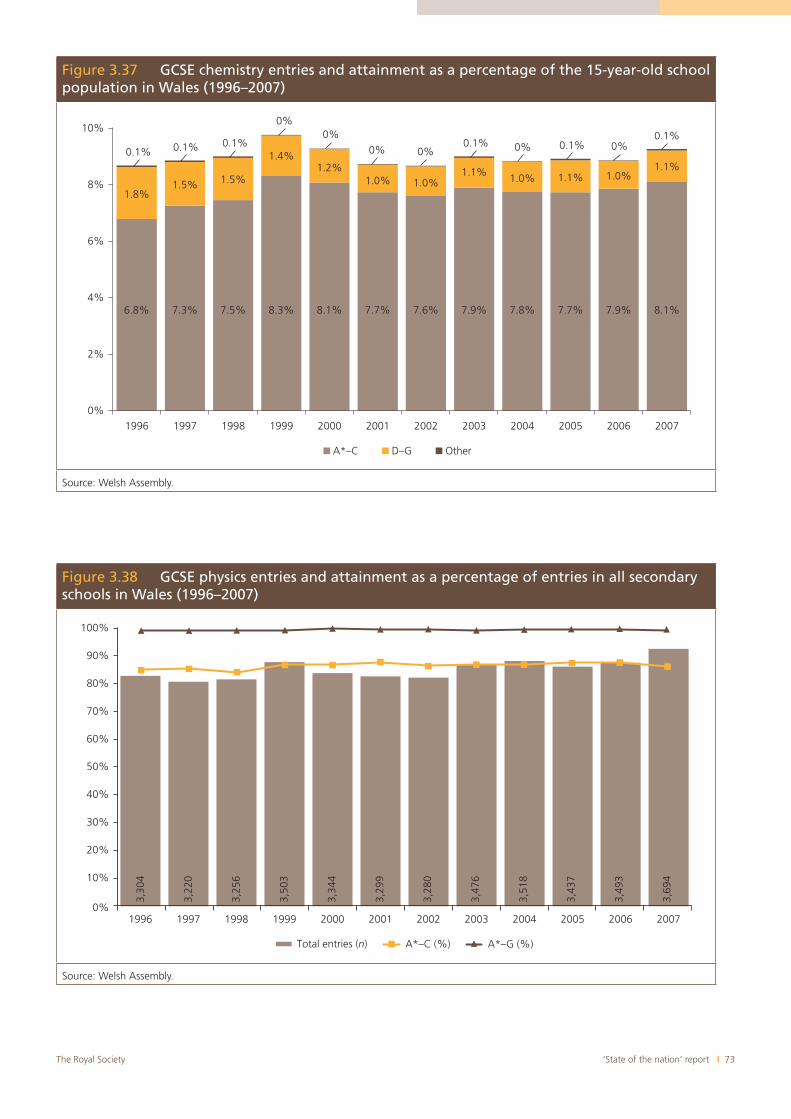
‘State of the nation’ report I 73The Royal Society
Figure 3.37 GCSE chemistry entries and attainment as a percentage of the 15-year-old school population in Wales (1996–2007)
6.8% 7.3% 7.5% 8.3% 8.1% 7.7% 7.6% 7.9% 7.8% 7.7% 7.9% 8.1%
1.8%1.5% 1.5%
1.4%1.2%
1.0% 1.0%1.1%
1.0% 1.1% 1.0%1.1%
0%0.1%
0%
2%
4%
6%
8%
10%
1996 1997 1998 1999 2000 2001 2002 2003 2004 2005 2006 2007
A*–C D–G Other
0.1%0.1%0.1%0.1%0.1% 0%0%0%
0%0%
Source: Welsh Assembly.
Figure 3.38 GCSE physics entries and attainment as a percentage of entries in all secondary schools in Wales (1996–2007)
3,30
4
3,22
0
3,25
6
3,50
3
3,34
4
3,29
9
3,28
0
3,47
6
3,51
8
3,43
7
3,49
3
3,69
4
0%
10%
20%
30%
40%
50%
60%
70%
80%
90%
100%
1996 1997 1998 1999 2000 2001 2002 2003 2004 2005 2006 2007
Total entries (n) A*–C (%) A*–G (%)
Source: Welsh Assembly.
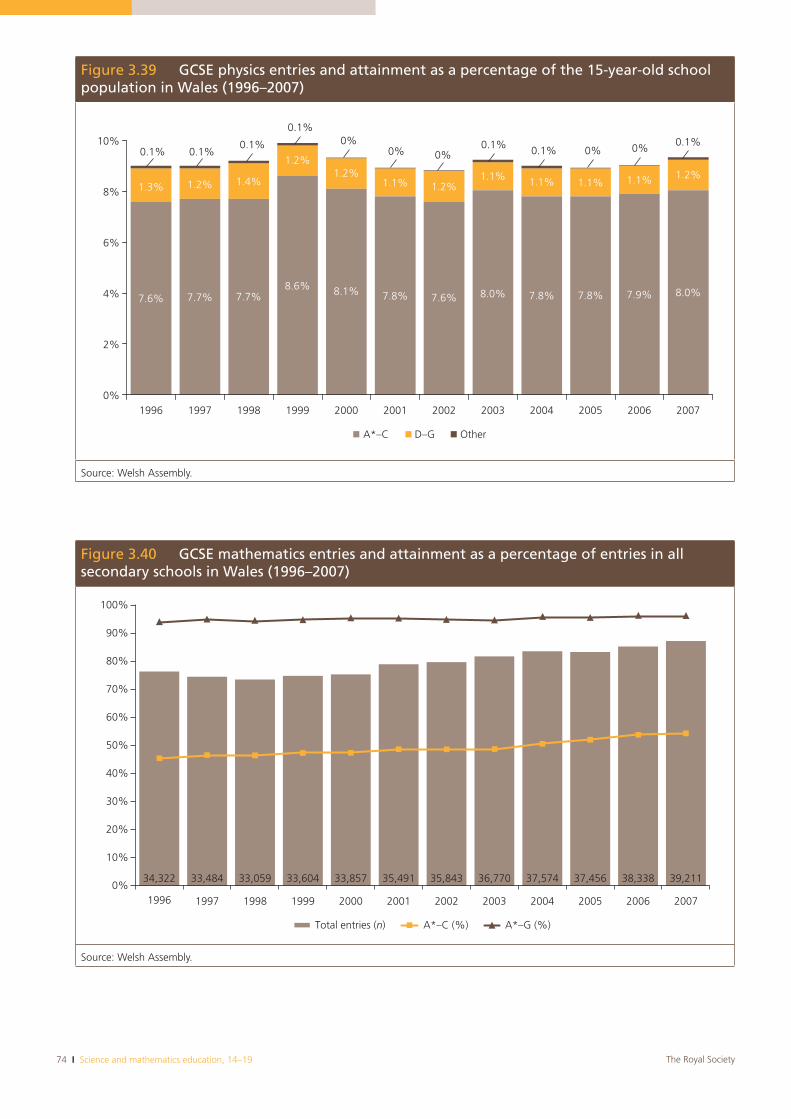
74 I Science and mathematics education, 14–19 The Royal Society
Figure 3.40 GCSE mathematics entries and attainment as a percentage of entries in all secondary schools in Wales (1996–2007)
34,322 33,484 33,059 33,604 33,857 35,491 35,843 36,770 37,574 37,456 38,338 39,2110%
10%
20%
30%
40%
50%
60%
70%
80%
90%
100%
1996 1997 1998 1999 2000 2001 2002 2003 2004 2005 2006 2007
Total entries (n) A*–C (%) A*–G (%)
Source: Welsh Assembly.
Figure 3.39 GCSE physics entries and attainment as a percentage of the 15-year-old school population in Wales (1996–2007)
7.6% 7.7% 7.7%8.6% 8.1% 7.8% 7.6% 8.0% 7.8% 7.8% 7.9% 8.0%
1.3% 1.2% 1.4%
1.2%1.2%
1.1% 1.2%1.1% 1.1% 1.1% 1.1% 1.2%
0%0.1%
0%
2%
4%
6%
8%
10%
1996 1997 1998 1999 2000 2001 2002 2003 2004 2005 2006 2007
A*–C D–G Other
0.1%
0.1%
0.1%0.1%0.1%
0.1% 0%0%0%0%
Source: Welsh Assembly.
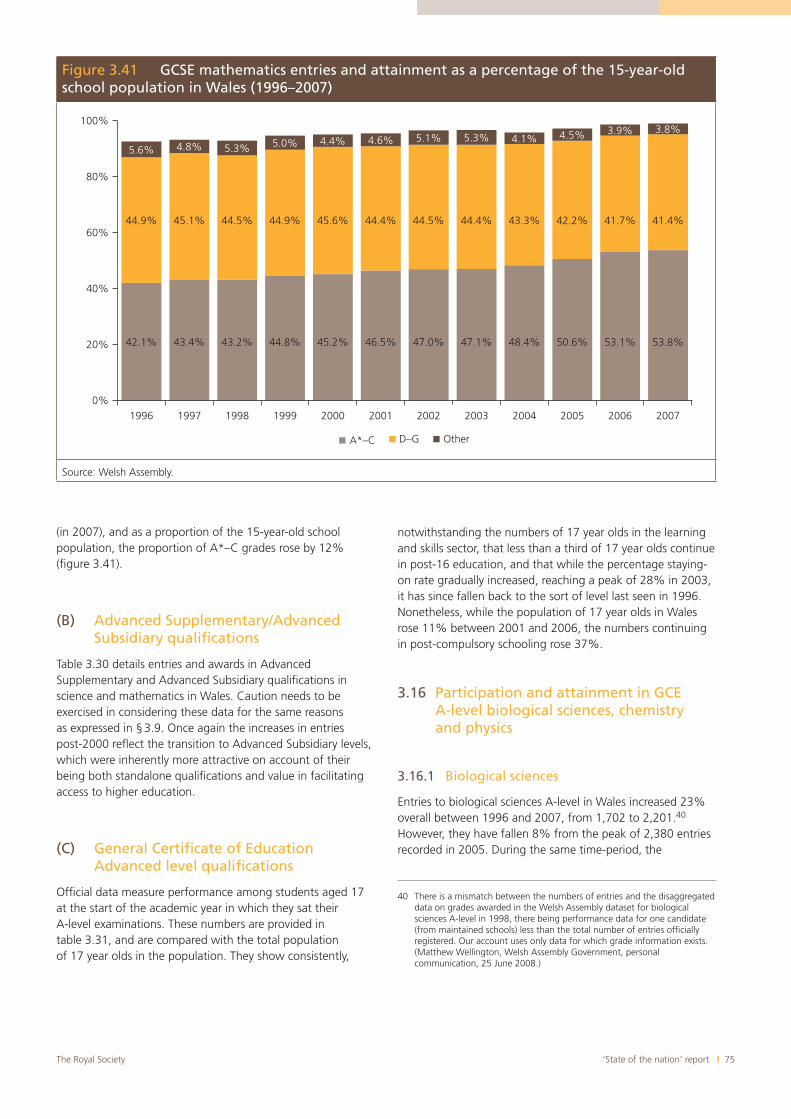
‘State of the nation’ report I 75The Royal Society
(in 2007), and as a proportion of the 15-year-old school population, the proportion of A*–C grades rose by 12% (figure 3.41).
(B) Advanced Supplementary/Advanced Subsidiary qualifications
Table 3.30 details entries and awards in Advanced Supplementary and Advanced Subsidiary qualifications in science and mathematics in Wales. Caution needs to be exercised in considering these data for the same reasons as expressed in §3.9. Once again the increases in entries post-2000 reflect the transition to Advanced Subsidiary levels, which were inherently more attractive on account of their being both standalone qualifications and value in facilitating access to higher education.
(C) General Certificate of Education Advanced level qualifications
Official data measure performance among students aged 17 at the start of the academic year in which they sat their A-level examinations. These numbers are provided in table 3.31, and are compared with the total population of 17 year olds in the population. They show consistently,
notwithstanding the numbers of 17 year olds in the learning and skills sector, that less than a third of 17 year olds continue in post-16 education, and that while the percentage staying-on rate gradually increased, reaching a peak of 28% in 2003, it has since fallen back to the sort of level last seen in 1996. Nonetheless, while the population of 17 year olds in Wales rose 11% between 2001 and 2006, the numbers continuing in post-compulsory schooling rose 37%.
3.16 Participation and attainment in GCE A-level biological sciences, chemistry and physics
3.16.1 Biological sciences
Entries to biological sciences A-level in Wales increased 23% overall between 1996 and 2007, from 1,702 to 2,201.40
However, they have fallen 8% from the peak of 2,380 entries recorded in 2005. During the same time-period, the
40 There is a mismatch between the numbers of entries and the disaggregated data on grades awarded in the Welsh Assembly dataset for biological sciences A-level in 1998, there being performance data for one candidate (from maintained schools) less than the total number of entries officially registered. Our account uses only data for which grade information exists. (Matthew Wellington, Welsh Assembly Government, personal communication, 25 June 2008.)
Figure 3.41 GCSE mathematics entries and attainment as a percentage of the 15-year-old school population in Wales (1996–2007)
42.1% 43.4% 43.2% 44.8% 45.2% 46.5% 47.0% 47.1% 48.4% 50.6% 53.1% 53.8%
44.9% 45.1% 44.5% 44.9% 45.6% 44.4% 44.5% 44.4% 43.3% 42.2% 41.7% 41.4%
5.6% 4.8% 5.3% 5.0% 4.4% 4.6% 5.1% 5.3% 4.1% 4.5% 3.9% 3.8%
0%
20%
40%
60%
80%
100%
1996 1997 1998 1999 2000 2001 2002 2003 2004 2005 2006 2007
A*–C D–G Other
Source: Welsh Assembly.
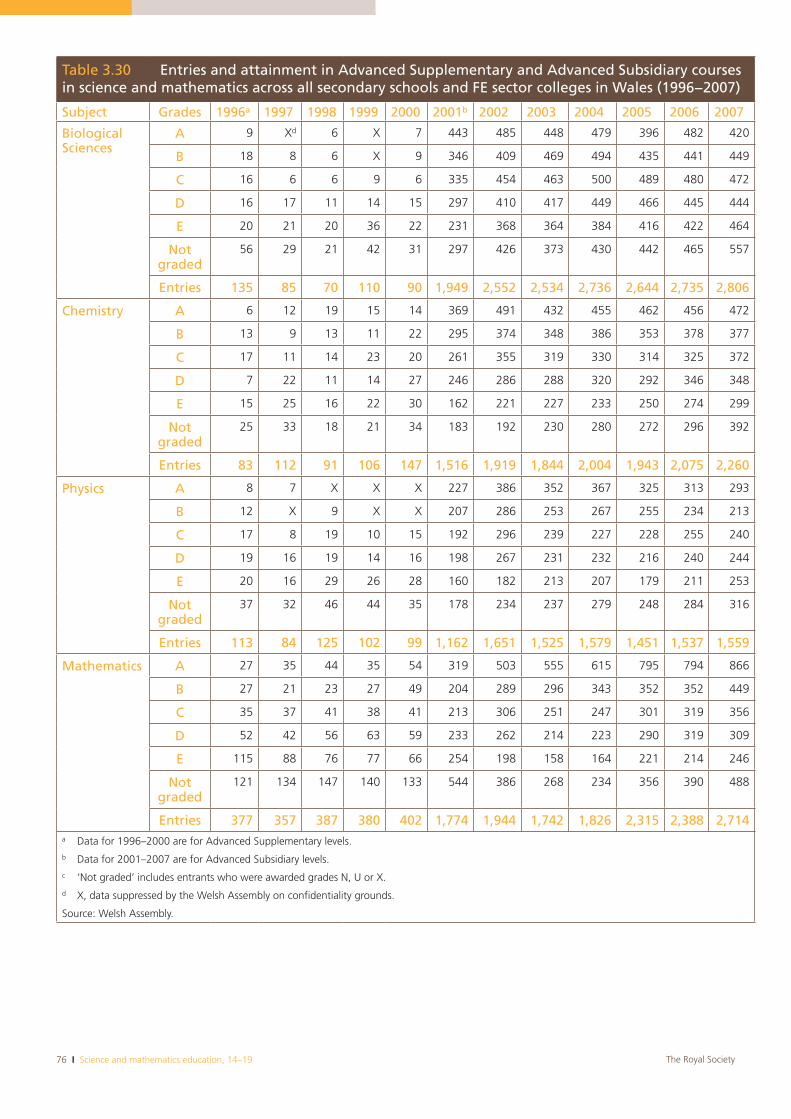
76 I Science and mathematics education, 14–19 The Royal Society
Table 3.30 Entries and attainment in Advanced Supplementary and Advanced Subsidiary courses in science and mathematics across all secondary schools and FE sector colleges in Wales (1996−2007)
Subject Grades 1996a 1997 1998 1999 2000 2001b 2002 2003 2004 2005 2006 2007
BiologicalSciences
A 9 Xd 6 X 7 443 485 448 479 396 482 420
B 18 8 6 X 9 346 409 469 494 435 441 449
C 16 6 6 9 6 335 454 463 500 489 480 472
D 16 17 11 14 15 297 410 417 449 466 445 444
E 20 21 20 36 22 231 368 364 384 416 422 464
Notgraded
56 29 21 42 31 297 426 373 430 442 465 557
Entries 135 85 70 110 90 1,949 2,552 2,534 2,736 2,644 2,735 2,806
Chemistry A 6 12 19 15 14 369 491 432 455 462 456 472
B 13 9 13 11 22 295 374 348 386 353 378 377
C 17 11 14 23 20 261 355 319 330 314 325 372
D 7 22 11 14 27 246 286 288 320 292 346 348
E 15 25 16 22 30 162 221 227 233 250 274 299
Notgraded
25 33 18 21 34 183 192 230 280 272 296 392
Entries 83 112 91 106 147 1,516 1,919 1,844 2,004 1,943 2,075 2,260
Physics A 8 7 X X X 227 386 352 367 325 313 293
B 12 X 9 X X 207 286 253 267 255 234 213
C 17 8 19 10 15 192 296 239 227 228 255 240
D 19 16 19 14 16 198 267 231 232 216 240 244
E 20 16 29 26 28 160 182 213 207 179 211 253
Notgraded
37 32 46 44 35 178 234 237 279 248 284 316
Entries 113 84 125 102 99 1,162 1,651 1,525 1,579 1,451 1,537 1,559
Mathematics A 27 35 44 35 54 319 503 555 615 795 794 866
B 27 21 23 27 49 204 289 296 343 352 352 449
C 35 37 41 38 41 213 306 251 247 301 319 356
D 52 42 56 63 59 233 262 214 223 290 319 309
E 115 88 76 77 66 254 198 158 164 221 214 246
Notgraded
121 134 147 140 133 544 386 268 234 356 390 488
Entries 377 357 387 380 402 1,774 1,944 1,742 1,826 2,315 2,388 2,714a Data for 1996–2000 are for Advanced Supplementary levels.b Data for 2001–2007 are for Advanced Subsidiary levels.c ‘Not graded’ includes entrants who were awarded grades N, U or X.d X, data suppressed by the Welsh Assembly on confidentiality grounds.
Source: Welsh Assembly.
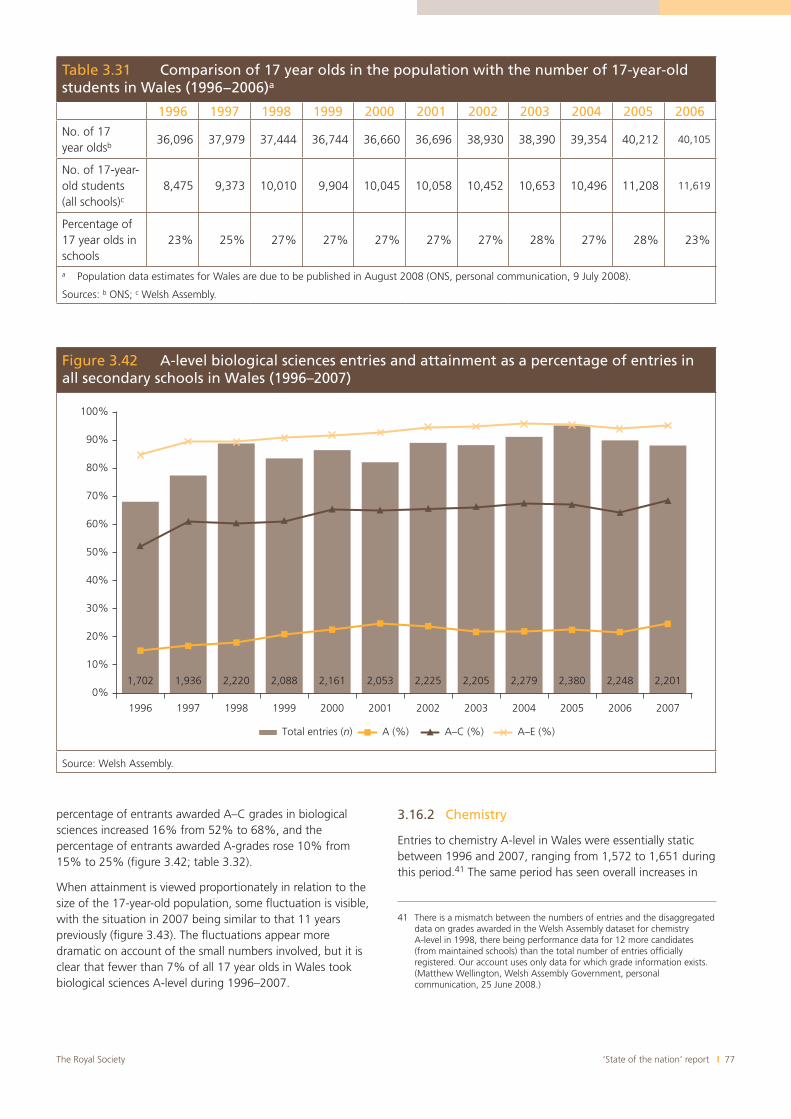
‘State of the nation’ report I 77The Royal Society
percentage of entrants awarded A–C grades in biological sciences increased 16% from 52% to 68%, and the percentage of entrants awarded A-grades rose 10% from 15% to 25% (figure 3.42; table 3.32).
When attainment is viewed proportionately in relation to the size of the 17-year-old population, some fluctuation is visible, with the situation in 2007 being similar to that 11 years previously (figure 3.43). The fluctuations appear more dramatic on account of the small numbers involved, but it is clear that fewer than 7% of all 17 year olds in Wales took biological sciences A-level during 1996–2007.
3.16.2 Chemistry
Entries to chemistry A-level in Wales were essentially static between 1996 and 2007, ranging from 1,572 to 1,651 during this period.41 The same period has seen overall increases in
41 There is a mismatch between the numbers of entries and the disaggregated data on grades awarded in the Welsh Assembly dataset for chemistry A-level in 1998, there being performance data for 12 more candidates (from maintained schools) than the total number of entries officially registered. Our account uses only data for which grade information exists. (Matthew Wellington, Welsh Assembly Government, personal communication, 25 June 2008.)
Table 3.31 Comparison of 17 year olds in the population with the number of 17-year-old students in Wales (1996−2006)a
1996 1997 1998 1999 2000 2001 2002 2003 2004 2005 2006No. of 17 year oldsb 36,096 37,979 37,444 36,744 36,660 36,696 38,930 38,390 39,354 40,212 40,105
No. of 17-year-old students (all schools)c
8,475 9,373 10,010 9,904 10,045 10,058 10,452 10,653 10,496 11,208 11,619
Percentage of 17 year olds in schools
23% 25% 27% 27% 27% 27% 27% 28% 27% 28% 23%
a Population data estimates for Wales are due to be published in August 2008 (ONS, personal communication, 9 July 2008).
Sources: b ONS; c Welsh Assembly.
Figure 3.42 A-level biological sciences entries and attainment as a percentage of entries in all secondary schools in Wales (1996–2007)
1,702 1,936 2,220 2,088 2,161 2,053 2,225 2,205 2,279 2,380 2,248 2,2010%
10%
20%
30%
40%
50%
60%
70%
80%
90%
100%
1996 1997 1998 1999 2000 2001 2002 2003 2004 2005 2006 2007
Total entries (n) A (%) A–C (%) A–E (%)
Source: Welsh Assembly.
78 I Science and mathematics education, 14–19 The Royal Society
attainment, with the number of A–C grades awarded in chemistry increasing 11%, and the number of A-grades awarded rising 26% (see figure 3.43; table 3.33).
When participation and attainment are viewed in relation to the size of the 17-year-old population, it becomes clear immediately that there has been a 0.6% fall in the proportion of the population taking A-level chemistry, and that this has never exceeded 5% during 1996–2007. During this time, the percentages gaining grades A–C and D–E have stayed constant, there being a slight overall rise in the percentage gaining A grades and an equally slight overall fall in the percentage gaining A–E grades (figure 3.45).
3.16.3 Physics
Entries to physics A-level in Wales decreased 13% between 1996 and 2007, from 1,287 to 1,117.42 During this period the number of A–C grades awarded in physics decreased 5% overall, although these numbers fluctuated. Similarly, the
42 There is a mismatch between the numbers of entries and the disaggregated data on grades awarded in the Welsh Assembly dataset for physics A-level in 1998, there being performance data for one fewer candidate (from independent schools) and 12 fewer candidates (from maintained schools) than the total number of entries officially registered. Our account uses only data for which grade information exists. (Matthew Wellington, Welsh Assembly Government, personal communication, 25 June 2008.)
Figure 3.43 Entries and attainment in A-level biological sciences as a percentage of the 17-year-old population in Wales (1996–2007)
0.8% 0.9% 1.1% 1.2% 1.3% 1.4% 1.4% 1.2% 1.3% 1.4% 1.2% 1.4%
1.9%2.4%
2.5% 2.2%2.5% 2.2% 2.5%
2.5%2.7% 2.7%
2.4%2.4%
1.7%
1.5%1.7%
1.7%1.6%
1.6%
1.8%1.6%
1.7% 1.7%
1.7% 1.5%0.8%
0.6%
0.6%0.5%
0.5%0.4%
0.3%
0.3%
0.3% 0.3%
0.3% 0.3%
0%
1%
2%
3%
4%
5%
6%
7%
1996 1997 1998 1999 2000 2001 2002 2003 2004 2005 2006 2007
A B–C D–E Other
Source: Welsh Assembly.
Table 3.32 A-level biological sciences attainment as a percentage of entries in all secondary schools in Wales (1996–2007)
Grade Year
1996 1997 1998 1999 2000 2001 2002 2003 2004 2005 2006 2007
A (%) 15 17 18 21 23 25 24 22 22 22 22 25
A–C (%) 52 61 60 61 65 65 65 66 67 67 64 68
A–E (%) 85 90 89 91 92 93 95 95 96 95 94 95
Total entries 1,702 1,936 2,220 2,088 2,161 2,053 2,225 2,205 2,279 2,380 2,248 2,101
17 year olds 32,804 36,096 37,979 37,444 36,744 36,660 36,696 38,930 38,390 39,354 40,212 40,105
Source: Welsh Assembly, ONS.
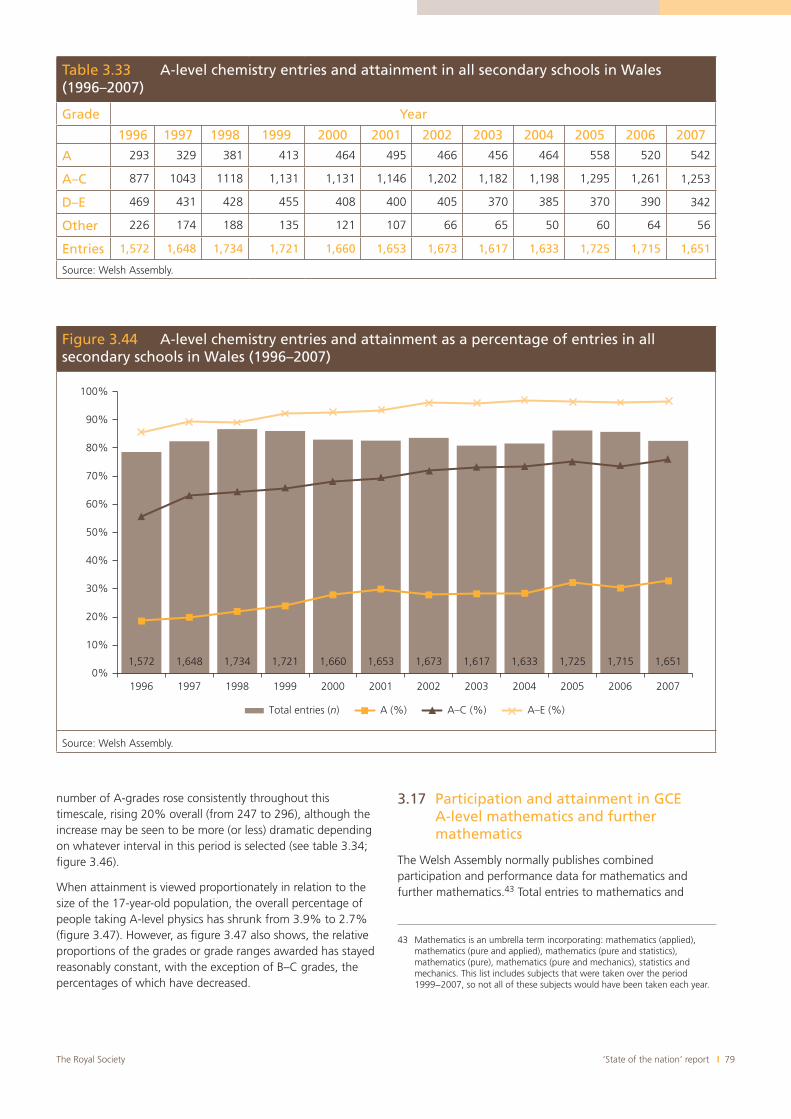
‘State of the nation’ report I 79The Royal Society
Table 3.33 A-level chemistry entries and attainment in all secondary schools in Wales (1996–2007)
Grade Year
1996 1997 1998 1999 2000 2001 2002 2003 2004 2005 2006 2007
A 293 329 381 413 464 495 466 456 464 558 520 542
A–C 877 1043 1118 1,131 1,131 1,146 1,202 1,182 1,198 1,295 1,261 1,253
D–E 469 431 428 455 408 400 405 370 385 370 390 342
Other 226 174 188 135 121 107 66 65 50 60 64 56
Entries 1,572 1,648 1,734 1,721 1,660 1,653 1,673 1,617 1,633 1,725 1,715 1,651
Source: Welsh Assembly.
Figure 3.44 A-level chemistry entries and attainment as a percentage of entries in all secondary schools in Wales (1996–2007)
1,572 1,648 1,734 1,721 1,660 1,653 1,673 1,617 1,633 1,725 1,715 1,6510%
10%
20%
30%
40%
50%
60%
70%
80%
90%
100%
1996 1997 1998 1999 2000 2001 2002 2003 2004 2005 2006 2007
Total entries (n) A (%) A–C (%) A–E (%)
Source: Welsh Assembly.
number of A-grades rose consistently throughout this timescale, rising 20% overall (from 247 to 296), although the increase may be seen to be more (or less) dramatic depending on whatever interval in this period is selected (see table 3.34; figure 3.46).
When attainment is viewed proportionately in relation to the size of the 17-year-old population, the overall percentage of people taking A-level physics has shrunk from 3.9% to 2.7% (figure 3.47). However, as figure 3.47 also shows, the relative proportions of the grades or grade ranges awarded has stayed reasonably constant, with the exception of B–C grades, the percentages of which have decreased.
3.17 Participation and attainment in GCE A-level mathematics and further mathematics
The Welsh Assembly normally publishes combined participation and performance data for mathematics and further mathematics.43 Total entries to mathematics and
43 Mathematics is an umbrella term incorporating: mathematics (applied), mathematics (pure and applied), mathematics (pure and statistics), mathematics (pure), mathematics (pure and mechanics), statistics and mechanics. This list includes subjects that were taken over the period 1999−2007, so not all of these subjects would have been taken each year.
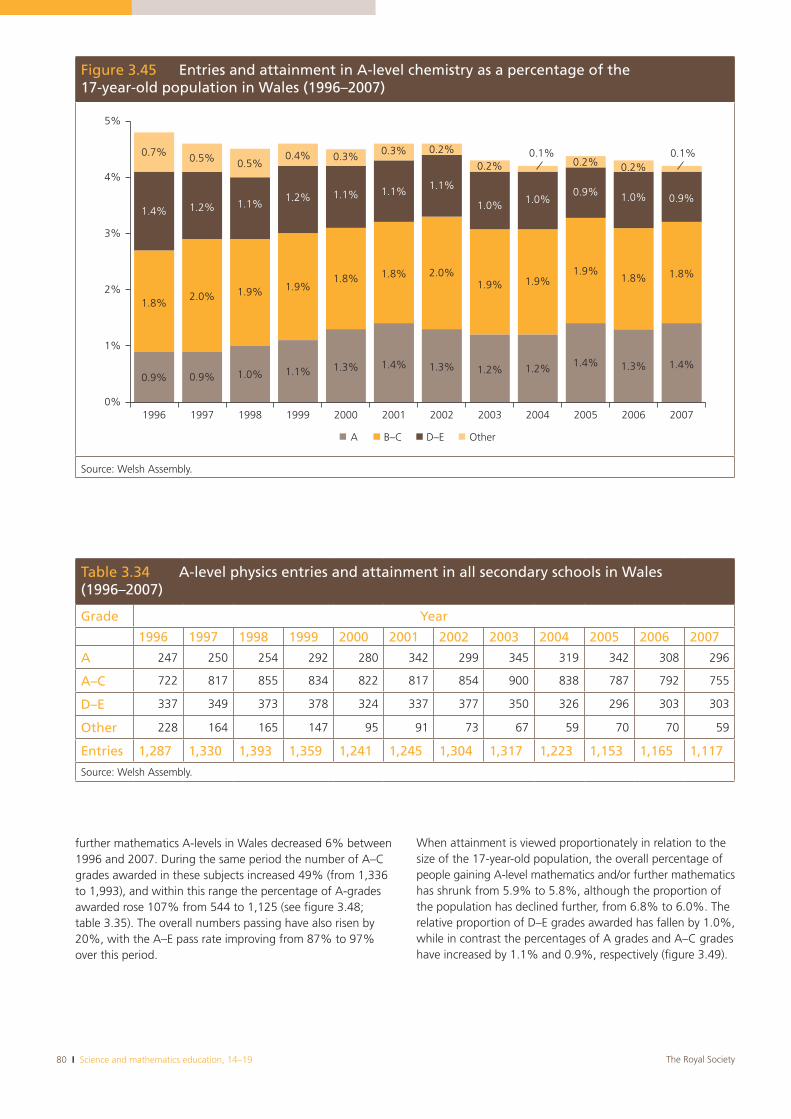
80 I Science and mathematics education, 14–19 The Royal Society
further mathematics A-levels in Wales decreased 6% between 1996 and 2007. During the same period the number of A–C grades awarded in these subjects increased 49% (from 1,336 to 1,993), and within this range the percentage of A-grades awarded rose 107% from 544 to 1,125 (see figure 3.48; table 3.35). The overall numbers passing have also risen by 20%, with the A–E pass rate improving from 87% to 97% over this period.
When attainment is viewed proportionately in relation to the size of the 17-year-old population, the overall percentage of people gaining A-level mathematics and/or further mathematics has shrunk from 5.9% to 5.8%, although the proportion of the population has declined further, from 6.8% to 6.0%. The relative proportion of D–E grades awarded has fallen by 1.0%, while in contrast the percentages of A grades and A–C grades have increased by 1.1% and 0.9%, respectively (figure 3.49).
Table 3.34 A-level physics entries and attainment in all secondary schools in Wales (1996–2007)
Grade Year
1996 1997 1998 1999 2000 2001 2002 2003 2004 2005 2006 2007
A 247 250 254 292 280 342 299 345 319 342 308 296
A–C 722 817 855 834 822 817 854 900 838 787 792 755
D–E 337 349 373 378 324 337 377 350 326 296 303 303
Other 228 164 165 147 95 91 73 67 59 70 70 59
Entries 1,287 1,330 1,393 1,359 1,241 1,245 1,304 1,317 1,223 1,153 1,165 1,117
Source: Welsh Assembly.
Figure 3.45 Entries and attainment in A-level chemistry as a percentage of the 17-year-old population in Wales (1996–2007)
0.9% 0.9% 1.0% 1.1% 1.3% 1.4% 1.3% 1.2% 1.2% 1.4% 1.3% 1.4%
1.8%2.0% 1.9% 1.9%
1.8% 1.8% 2.0%1.9% 1.9%
1.9%1.8% 1.8%
1.4% 1.2% 1.1%1.2% 1.1% 1.1% 1.1%
1.0% 1.0%0.9% 1.0% 0.9%
0.7% 0.5% 0.5%0.4% 0.3% 0.3% 0.2%
0.2% 0.2% 0.2%
0%
1%
2%
3%
4%
5%
1996 1997 1998 1999 2000 2001 2002 2003 2004 2005 2006 2007
A B–C D–E Other
0.1%0.1%
Source: Welsh Assembly.
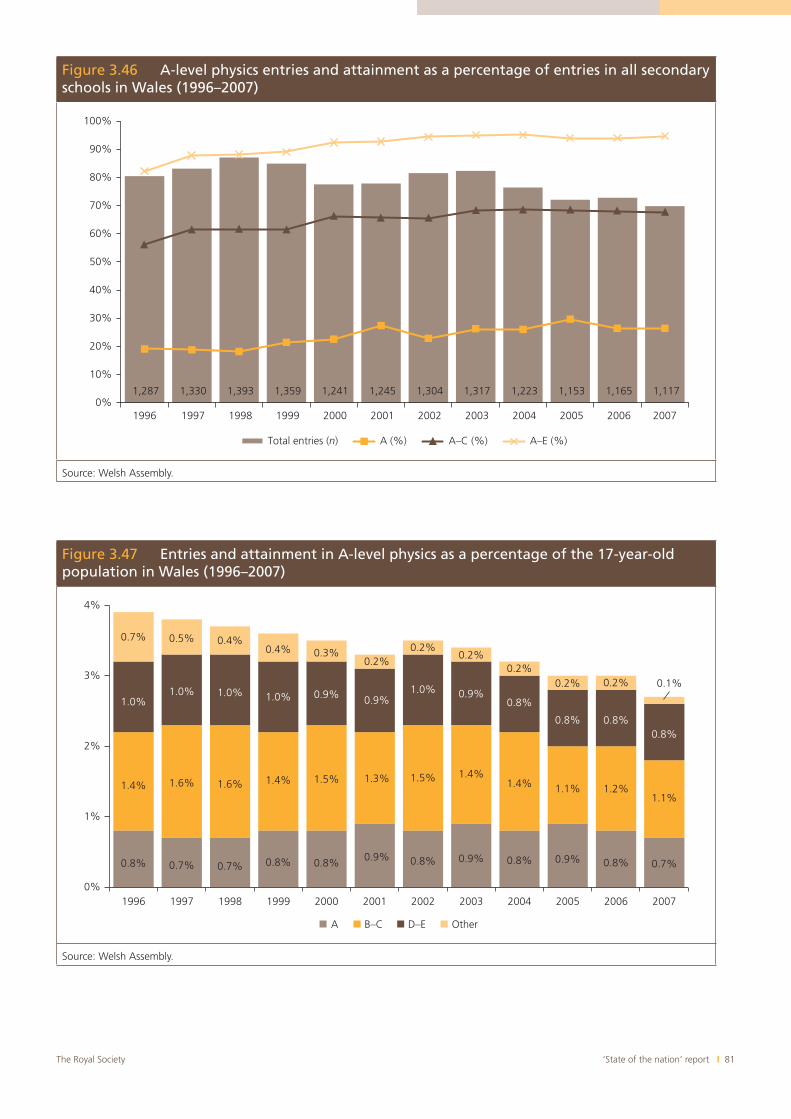
‘State of the nation’ report I 81The Royal Society
Figure 3.46 A-level physics entries and attainment as a percentage of entries in all secondary schools in Wales (1996–2007)
1,287 1,330 1,393 1,359 1,241 1,245 1,304 1,317 1,223 1,153 1,165 1,1170%
10%
20%
30%
40%
50%
60%
70%
80%
90%
100%
1996 1997 1998 1999 2000 2001 2002 2003 2004 2005 2006 2007
Total entries (n) A (%) A–C (%) A–E (%)
Source: Welsh Assembly.
Figure 3.47 Entries and attainment in A-level physics as a percentage of the 17-year-old population in Wales (1996–2007)
0.8% 0.7% 0.7% 0.8% 0.8% 0.9% 0.8% 0.9% 0.8% 0.9% 0.8% 0.7%
1.4% 1.6% 1.6% 1.4% 1.5% 1.3% 1.5% 1.4%1.4% 1.1% 1.2%
1.1%
1.0%1.0% 1.0% 1.0% 0.9% 0.9%
1.0% 0.9%0.8%
0.8% 0.8%0.8%
0.7% 0.5% 0.4%0.4% 0.3%
0.2%0.2%
0.2%0.2%
0.2% 0.2%
0%
1%
2%
3%
4%
1996 1997 1998 1999 2000 2001 2002 2003 2004 2005 2006 2007
A B–C D–E Other
0.1%
Source: Welsh Assembly.
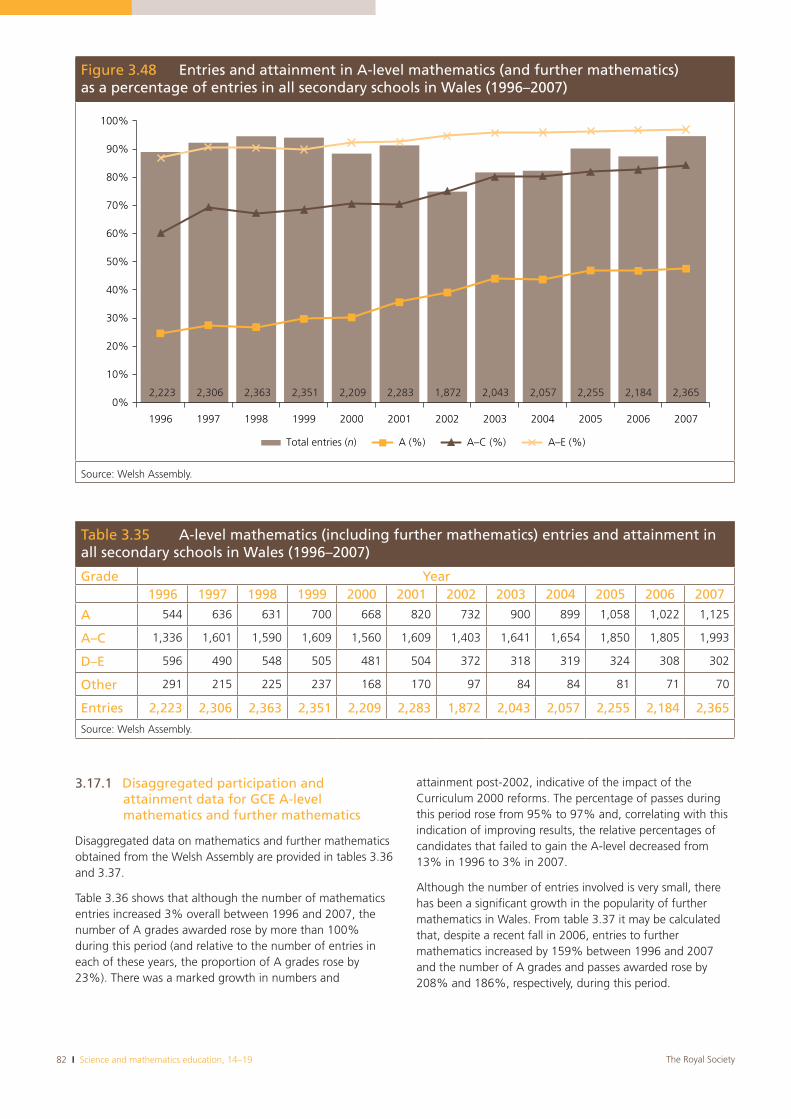
82 I Science and mathematics education, 14–19 The Royal Society
3.17.1 Disaggregated participation and attainment data for GCE A-level mathematics and further mathematics
Disaggregated data on mathematics and further mathematics obtained from the Welsh Assembly are provided in tables 3.36 and 3.37.
Table 3.36 shows that although the number of mathematics entries increased 3% overall between 1996 and 2007, the number of A grades awarded rose by more than 100% during this period (and relative to the number of entries in each of these years, the proportion of A grades rose by 23%). There was a marked growth in numbers and
attainment post-2002, indicative of the impact of the Curriculum 2000 reforms. The percentage of passes during this period rose from 95% to 97% and, correlating with this indication of improving results, the relative percentages of candidates that failed to gain the A-level decreased from 13% in 1996 to 3% in 2007.
Although the number of entries involved is very small, there has been a significant growth in the popularity of further mathematics in Wales. From table 3.37 it may be calculated that, despite a recent fall in 2006, entries to further mathematics increased by 159% between 1996 and 2007 and the number of A grades and passes awarded rose by 208% and 186%, respectively, during this period.
Table 3.35 A-level mathematics (including further mathematics) entries and attainment in all secondary schools in Wales (1996–2007)
Grade Year1996 1997 1998 1999 2000 2001 2002 2003 2004 2005 2006 2007
A 544 636 631 700 668 820 732 900 899 1,058 1,022 1,125
A–C 1,336 1,601 1,590 1,609 1,560 1,609 1,403 1,641 1,654 1,850 1,805 1,993
D–E 596 490 548 505 481 504 372 318 319 324 308 302
Other 291 215 225 237 168 170 97 84 84 81 71 70
Entries 2,223 2,306 2,363 2,351 2,209 2,283 1,872 2,043 2,057 2,255 2,184 2,365
Source: Welsh Assembly.
Figure 3.48 Entries and attainment in A-level mathematics (and further mathematics) as a percentage of entries in all secondary schools in Wales (1996–2007)
2,223 2,306 2,363 2,351 2,209 2,283 1,872 2,043 2,057 2,255 2,184 2,3650%
10%
20%
30%
40%
50%
60%
70%
80%
90%
100%
1996 1997 1998 1999 2000 2001 2002 2003 2004 2005 2006 2007
Total entries (n) A (%) A–C (%) A–E (%)
Source: Welsh Assembly.
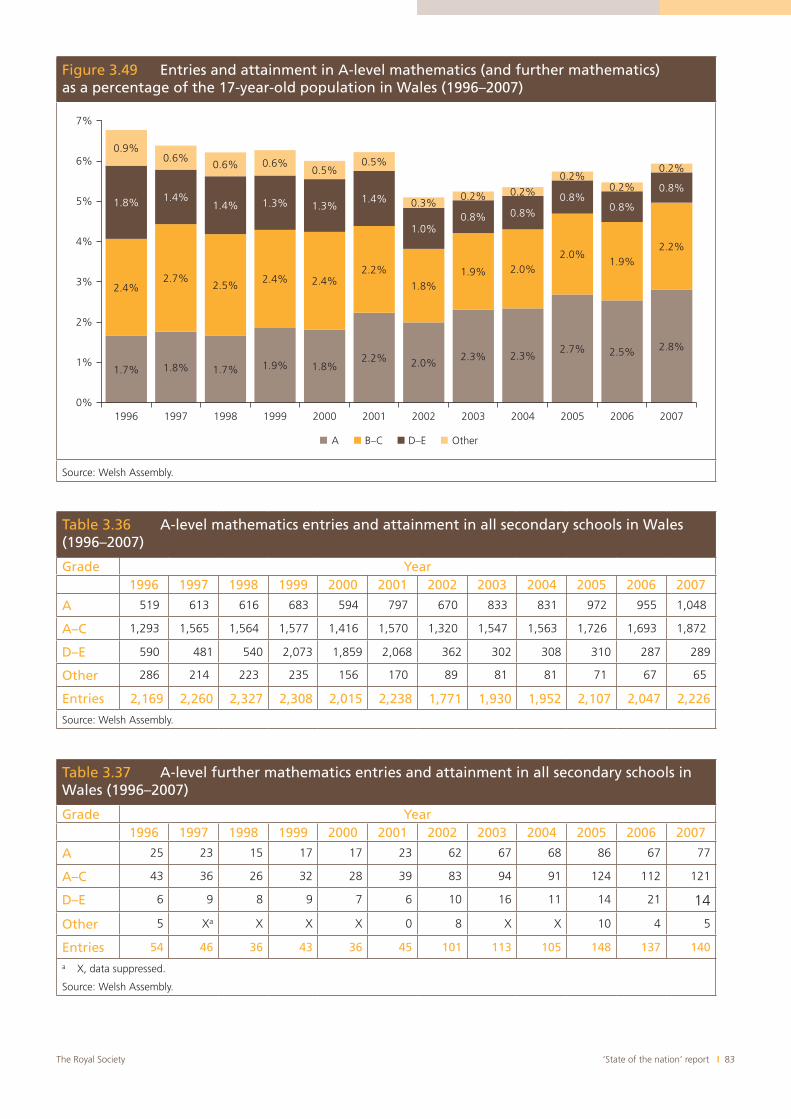
‘State of the nation’ report I 83The Royal Society
Figure 3.49 Entries and attainment in A-level mathematics (and further mathematics) as a percentage of the 17-year-old population in Wales (1996–2007)
1.7% 1.8% 1.7% 1.9% 1.8%2.2% 2.0%
2.3% 2.3%2.7% 2.5% 2.8%
2.4%2.7%
2.5%2.4% 2.4%
2.2%
1.8%1.9% 2.0%
2.0%1.9%
2.2%
1.8% 1.4%1.4% 1.3% 1.3%
1.4%
1.0%0.8% 0.8%
0.8%0.8%
0.8%
0.9%0.6%
0.6% 0.6%0.5%
0.5%
0.3%0.2% 0.2%
0.2%0.2%
0.2%
0%
1%
2%
3%
4%
5%
6%
7%
1996 1997 1998 1999 2000 2001 2002 2003 2004 2005 2006 2007
A B–C D–E Other
Source: Welsh Assembly.
Table 3.36 A-level mathematics entries and attainment in all secondary schools in Wales (1996–2007)
Grade Year1996 1997 1998 1999 2000 2001 2002 2003 2004 2005 2006 2007
A 519 613 616 683 594 797 670 833 831 972 955 1,048
A–C 1,293 1,565 1,564 1,577 1,416 1,570 1,320 1,547 1,563 1,726 1,693 1,872
D–E 590 481 540 2,073 1,859 2,068 362 302 308 310 287 289
Other 286 214 223 235 156 170 89 81 81 71 67 65
Entries 2,169 2,260 2,327 2,308 2,015 2,238 1,771 1,930 1,952 2,107 2,047 2,226
Source: Welsh Assembly.
Table 3.37 A-level further mathematics entries and attainment in all secondary schools in Wales (1996–2007)
Grade Year1996 1997 1998 1999 2000 2001 2002 2003 2004 2005 2006 2007
A 25 23 15 17 17 23 62 67 68 86 67 77
A–C 43 36 26 32 28 39 83 94 91 124 112 121
D–E 6 9 8 9 7 6 10 16 11 14 21 14
Other 5 Xa X X X 0 8 X X 10 4 5
Entries 54 46 36 43 36 45 101 113 105 148 137 140
a X, data suppressed.
Source: Welsh Assembly.
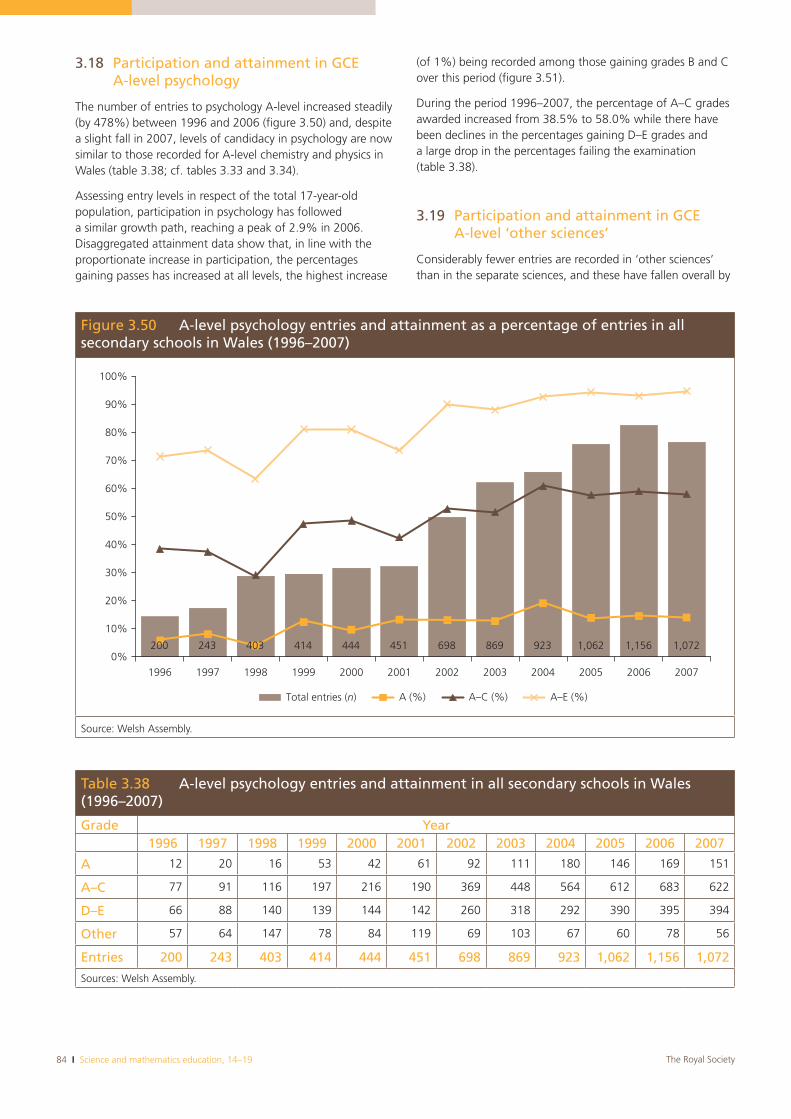
84 I Science and mathematics education, 14–19 The Royal Society
3.18 Participation and attainment in GCE A-level psychology
The number of entries to psychology A-level increased steadily (by 478%) between 1996 and 2006 (figure 3.50) and, despite a slight fall in 2007, levels of candidacy in psychology are now similar to those recorded for A-level chemistry and physics in Wales (table 3.38; cf. tables 3.33 and 3.34).
Assessing entry levels in respect of the total 17-year-old population, participation in psychology has followed a similar growth path, reaching a peak of 2.9% in 2006. Disaggregated attainment data show that, in line with the proportionate increase in participation, the percentages gaining passes has increased at all levels, the highest increase
(of 1%) being recorded among those gaining grades B and C over this period (figure 3.51).
During the period 1996–2007, the percentage of A–C grades awarded increased from 38.5% to 58.0% while there have been declines in the percentages gaining D–E grades and a large drop in the percentages failing the examination (table 3.38).
3.19 Participation and attainment in GCE A-level ‘other sciences’
Considerably fewer entries are recorded in ‘other sciences’ than in the separate sciences, and these have fallen overall by
Table 3.38 A-level psychology entries and attainment in all secondary schools in Wales (1996–2007)
Grade Year1996 1997 1998 1999 2000 2001 2002 2003 2004 2005 2006 2007
A 12 20 16 53 42 61 92 111 180 146 169 151
A–C 77 91 116 197 216 190 369 448 564 612 683 622
D–E 66 88 140 139 144 142 260 318 292 390 395 394
Other 57 64 147 78 84 119 69 103 67 60 78 56
Entries 200 243 403 414 444 451 698 869 923 1,062 1,156 1,072
Sources: Welsh Assembly.
Figure 3.50 A-level psychology entries and attainment as a percentage of entries in all secondary schools in Wales (1996–2007)
200 243 403 414 444 451 698 869 923 1,062 1,156 1,0720%
10%
20%
30%
40%
50%
60%
70%
80%
90%
100%
1996 1997 1998 1999 2000 2001 2002 2003 2004 2005 2006 2007
Total entries (n) A (%) A–C (%) A–E (%)
Source: Welsh Assembly.
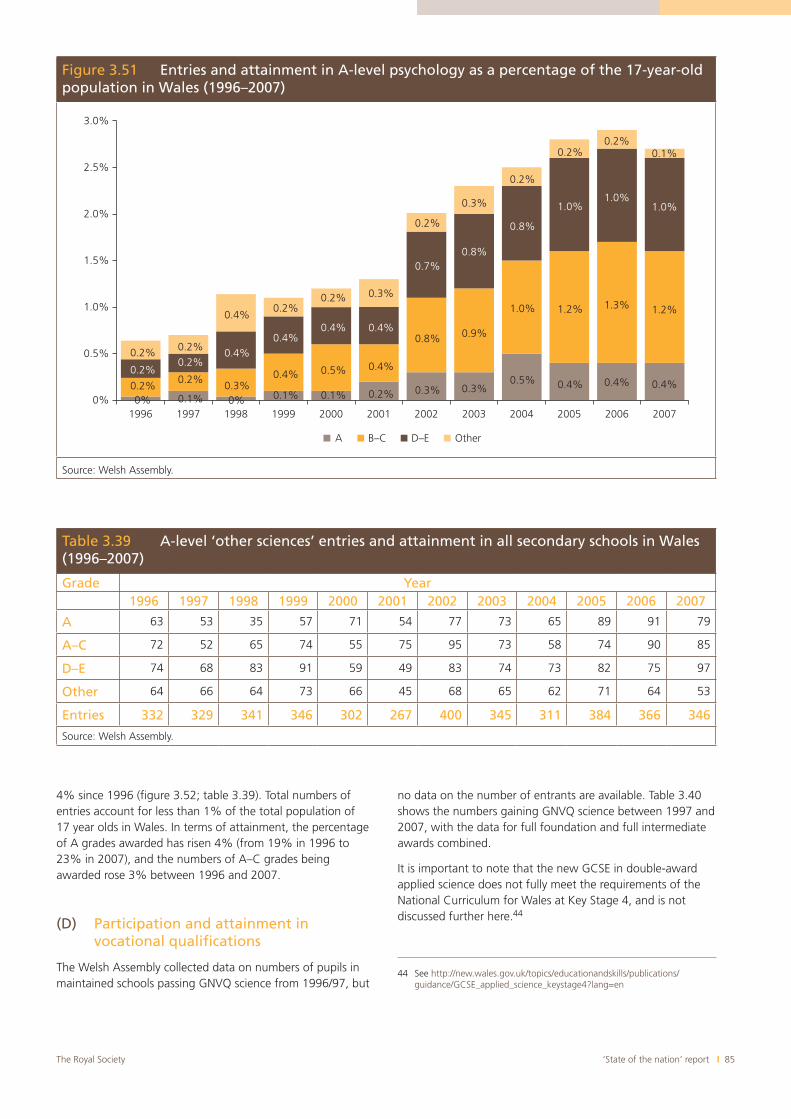
‘State of the nation’ report I 85The Royal Society
Table 3.39 A-level ‘other sciences’ entries and attainment in all secondary schools in Wales (1996–2007)
Grade Year1996 1997 1998 1999 2000 2001 2002 2003 2004 2005 2006 2007
A 63 53 35 57 71 54 77 73 65 89 91 79
A–C 72 52 65 74 55 75 95 73 58 74 90 85
D–E 74 68 83 91 59 49 83 74 73 82 75 97
Other 64 66 64 73 66 45 68 65 62 71 64 53
Entries 332 329 341 346 302 267 400 345 311 384 366 346
Source: Welsh Assembly.
Figure 3.51 Entries and attainment in A-level psychology as a percentage of the 17-year-old population in Wales (1996–2007)
0% 0.1% 0% 0.1% 0.1% 0.2% 0.3% 0.3%0.5% 0.4% 0.4% 0.4%0.2%
0.2%0.3%
0.4% 0.5% 0.4%
0.8% 0.9%
1.0% 1.2% 1.3% 1.2%
0.2%0.2%
0.4%0.4%
0.4% 0.4%
0.7%0.8%
0.8%
1.0%1.0%
1.0%
0.2% 0.2%
0.4%0.2%
0.2% 0.3%
0.2%
0.3%
0.2%
0.2%0.2%
0.1%
0%
0.5%
1.0%
1.5%
2.0%
2.5%
3.0%
1996 1997 1998 1999 2000 2001 2002 2003 2004 2005 2006 2007
A B–C D–E Other
Source: Welsh Assembly.
4% since 1996 (figure 3.52; table 3.39). Total numbers of entries account for less than 1% of the total population of 17 year olds in Wales. In terms of attainment, the percentage of A grades awarded has risen 4% (from 19% in 1996 to 23% in 2007), and the numbers of A–C grades being awarded rose 3% between 1996 and 2007.
(D) Participation and attainment in vocational qualifications
The Welsh Assembly collected data on numbers of pupils in maintained schools passing GNVQ science from 1996/97, but
no data on the number of entrants are available. Table 3.40 shows the numbers gaining GNVQ science between 1997 and 2007, with the data for full foundation and full intermediate awards combined.
It is important to note that the new GCSE in double-award applied science does not fully meet the requirements of the National Curriculum for Wales at Key Stage 4, and is not discussed further here.44
44 See http://new.wales.gov.uk/topics/educationandskills/publications/guidance/GCSE_applied_science_keystage4?lang=en
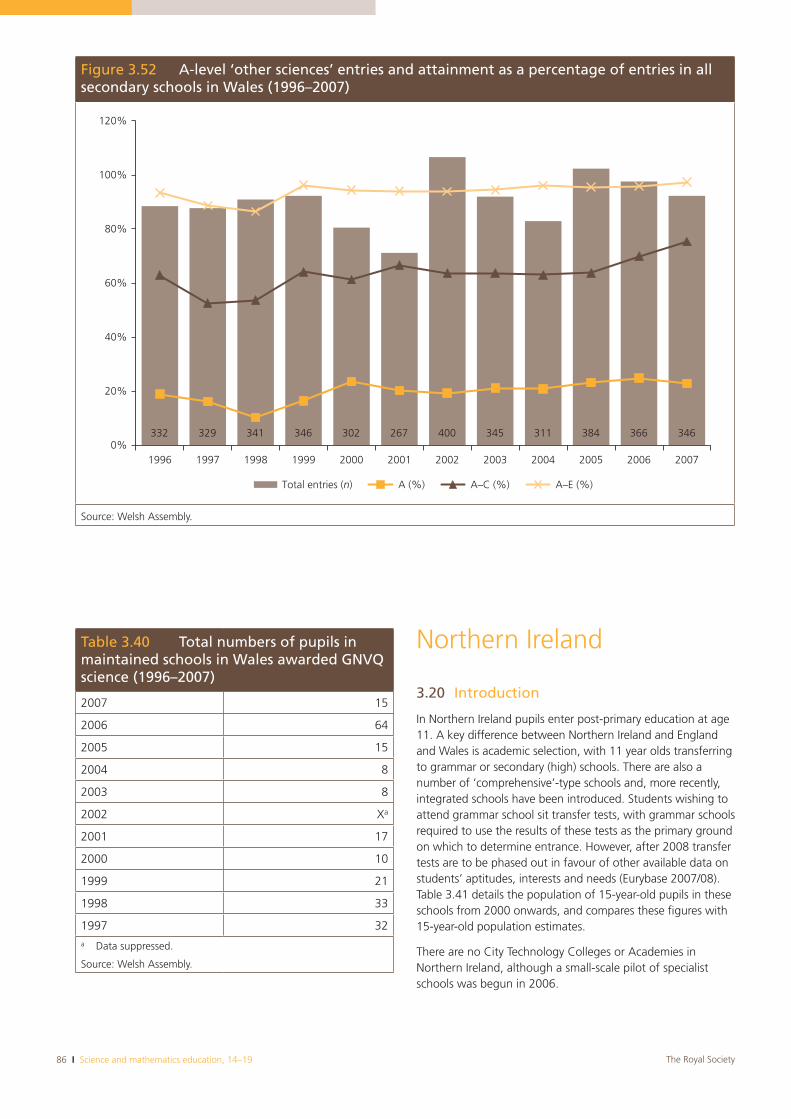
86 I Science and mathematics education, 14–19 The Royal Society
Northern Ireland
3.20 Introduction
In Northern Ireland pupils enter post-primary education at age 11. A key difference between Northern Ireland and England and Wales is academic selection, with 11 year olds transferring to grammar or secondary (high) schools. There are also a number of ‘comprehensive’-type schools and, more recently, integrated schools have been introduced. Students wishing to attend grammar school sit transfer tests, with grammar schools required to use the results of these tests as the primary ground on which to determine entrance. However, after 2008 transfer tests are to be phased out in favour of other available data on students’ aptitudes, interests and needs (Eurybase 2007/08). Table 3.41 details the population of 15-year-old pupils in these schools from 2000 onwards, and compares these figures with 15-year-old population estimates.
There are no City Technology Colleges or Academies in Northern Ireland, although a small-scale pilot of specialist schools was begun in 2006.
Table 3.40 Total numbers of pupils in maintained schools in Wales awarded GNVQ science (1996–2007)
2007 15
2006 64
2005 15
2004 8
2003 8
2002 Xa
2001 17
2000 10
1999 21
1998 33
1997 32a Data suppressed.
Source: Welsh Assembly.
Figure 3.52 A-level ‘other sciences’ entries and attainment as a percentage of entries in all secondary schools in Wales (1996–2007)
332 329 341 346 302 267 400 345 311 384 366 3460%
20%
40%
60%
80%
100%
120%
1996 1997 1998 1999 2000 2001 2002 2003 2004 2005 2006 2007
Total entries (n) A (%) A–C (%) A–E (%)
Source: Welsh Assembly.
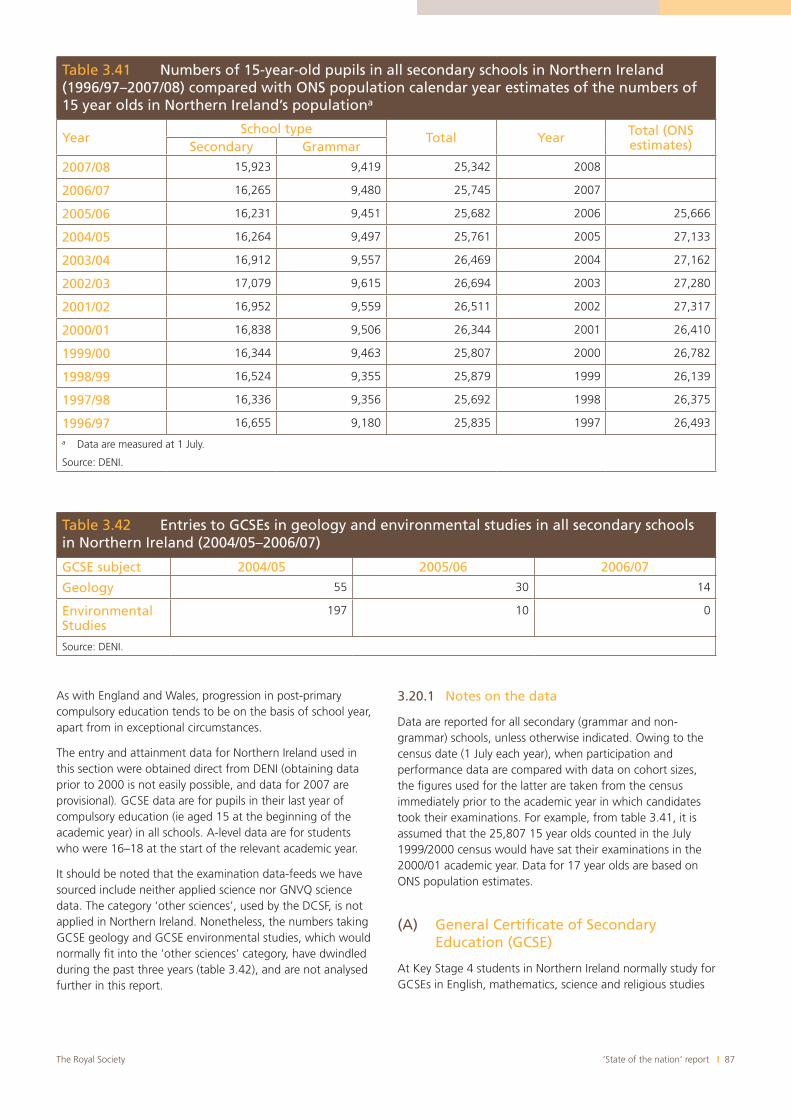
‘State of the nation’ report I 87The Royal Society
As with England and Wales, progression in post-primary compulsory education tends to be on the basis of school year, apart from in exceptional circumstances.
The entry and attainment data for Northern Ireland used in this section were obtained direct from DENI (obtaining data prior to 2000 is not easily possible, and data for 2007 are provisional). GCSE data are for pupils in their last year of compulsory education (ie aged 15 at the beginning of the academic year) in all schools. A-level data are for students who were 16–18 at the start of the relevant academic year.
It should be noted that the examination data-feeds we have sourced include neither applied science nor GNVQ science data. The category ‘other sciences’, used by the DCSF, is not applied in Northern Ireland. Nonetheless, the numbers taking GCSE geology and GCSE environmental studies, which would normally fit into the ‘other sciences’ category, have dwindled during the past three years (table 3.42), and are not analysed further in this report.
3.20.1 Notes on the data
Data are reported for all secondary (grammar and non-grammar) schools, unless otherwise indicated. Owing to the census date (1 July each year), when participation and performance data are compared with data on cohort sizes, the figures used for the latter are taken from the census immediately prior to the academic year in which candidates took their examinations. For example, from table 3.41, it is assumed that the 25,807 15 year olds counted in the July 1999/2000 census would have sat their examinations in the 2000/01 academic year. Data for 17 year olds are based on ONS population estimates.
(A) General Certificate of Secondary Education (GCSE)
At Key Stage 4 students in Northern Ireland normally study for GCSEs in English, mathematics, science and religious studies
Table 3.41 Numbers of 15-year-old pupils in all secondary schools in Northern Ireland (1996/97–2007/08) compared with ONS population calendar year estimates of the numbers of 15 year olds in Northern Ireland’s populationa
YearSchool type
Total Year Total (ONS estimates)Secondary Grammar
2007/08 15,923 9,419 25,342 2008
2006/07 16,265 9,480 25,745 2007
2005/06 16,231 9,451 25,682 2006 25,666
2004/05 16,264 9,497 25,761 2005 27,133
2003/04 16,912 9,557 26,469 2004 27,162
2002/03 17,079 9,615 26,694 2003 27,280
2001/02 16,952 9,559 26,511 2002 27,317
2000/01 16,838 9,506 26,344 2001 26,410
1999/00 16,344 9,463 25,807 2000 26,782
1998/99 16,524 9,355 25,879 1999 26,139
1997/98 16,336 9,356 25,692 1998 26,375
1996/97 16,655 9,180 25,835 1997 26,493
a Data are measured at 1 July.
Source: DENI.
Table 3.42 Entries to GCSEs in geology and environmental studies in all secondary schools in Northern Ireland (2004/05–2006/07)
GCSE subject 2004/05 2005/06 2006/07
Geology 55 30 14
EnvironmentalStudies
197 10 0
Source: DENI.
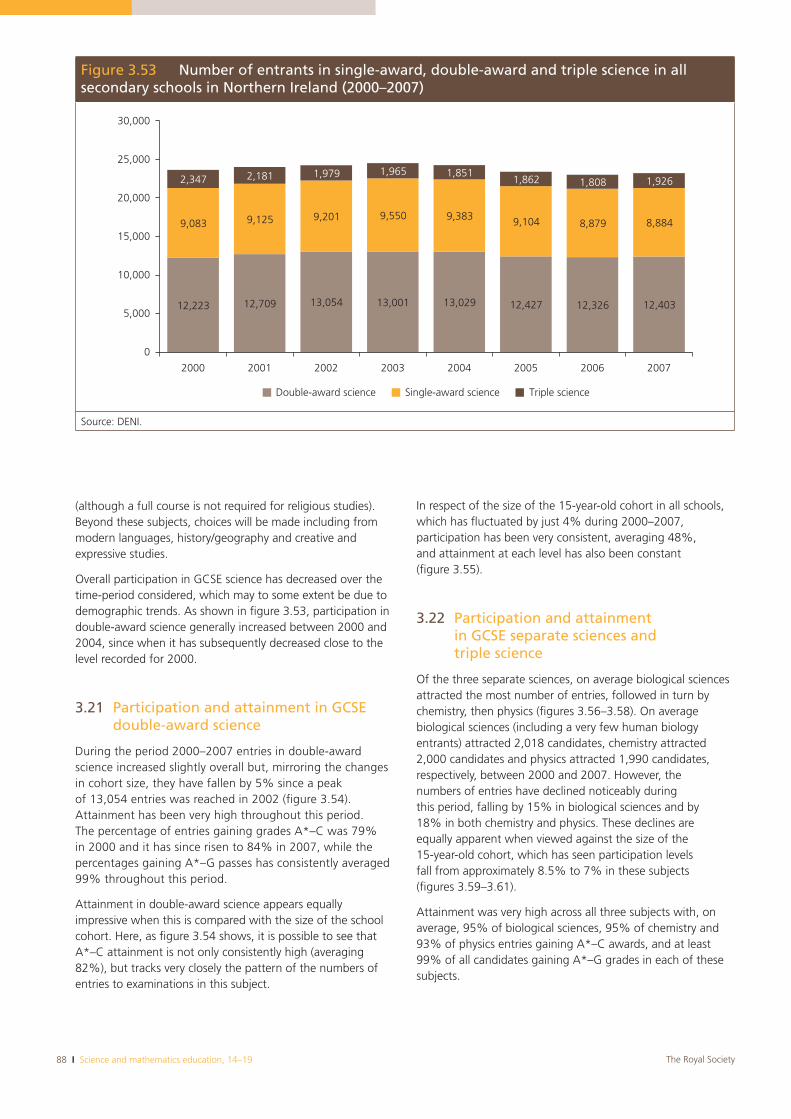
88 I Science and mathematics education, 14–19 The Royal Society
(although a full course is not required for religious studies). Beyond these subjects, choices will be made including from modern languages, history/geography and creative and expressive studies.
Overall participation in GCSE science has decreased over the time-period considered, which may to some extent be due to demographic trends. As shown in figure 3.53, participation in double-award science generally increased between 2000 and 2004, since when it has subsequently decreased close to the level recorded for 2000.
3.21 Participation and attainment in GCSE double-award science
During the period 2000–2007 entries in double-award science increased slightly overall but, mirroring the changes in cohort size, they have fallen by 5% since a peak of 13,054 entries was reached in 2002 (figure 3.54). Attainment has been very high throughout this period. The percentage of entries gaining grades A*–C was 79% in 2000 and it has since risen to 84% in 2007, while the percentages gaining A*–G passes has consistently averaged 99% throughout this period.
Attainment in double-award science appears equally impressive when this is compared with the size of the school cohort. Here, as figure 3.54 shows, it is possible to see that A*–C attainment is not only consistently high (averaging 82%), but tracks very closely the pattern of the numbers of entries to examinations in this subject.
In respect of the size of the 15-year-old cohort in all schools, which has fluctuated by just 4% during 2000–2007, participation has been very consistent, averaging 48%, and attainment at each level has also been constant (figure 3.55).
3.22 Participation and attainment in GCSE separate sciences and triple science
Of the three separate sciences, on average biological sciences attracted the most number of entries, followed in turn by chemistry, then physics (figures 3.56–3.58). On average biological sciences (including a very few human biology entrants) attracted 2,018 candidates, chemistry attracted 2,000 candidates and physics attracted 1,990 candidates, respectively, between 2000 and 2007. However, the numbers of entries have declined noticeably during this period, falling by 15% in biological sciences and by 18% in both chemistry and physics. These declines are equally apparent when viewed against the size of the 15-year-old cohort, which has seen participation levels fall from approximately 8.5% to 7% in these subjects (figures 3.59–3.61).
Attainment was very high across all three subjects with, on average, 95% of biological sciences, 95% of chemistry and 93% of physics entries gaining A*–C awards, and at least 99% of all candidates gaining A*–G grades in each of these subjects.
Figure 3.53 Number of entrants in single-award, double-award and triple science in all secondary schools in Northern Ireland (2000–2007)
12,223 12,709 13,054 13,001 13,029 12,427 12,326 12,403
9,083 9,125 9,201 9,550 9,383 9,104 8,879 8,884
2,347 2,181 1,979 1,965 1,8511,862 1,808 1,926
0
5,000
10,000
15,000
20,000
25,000
30,000
2000 2001 2002 2003 2004 2005 2006 2007
Double-award science Single-award science Triple science
Source: DENI.
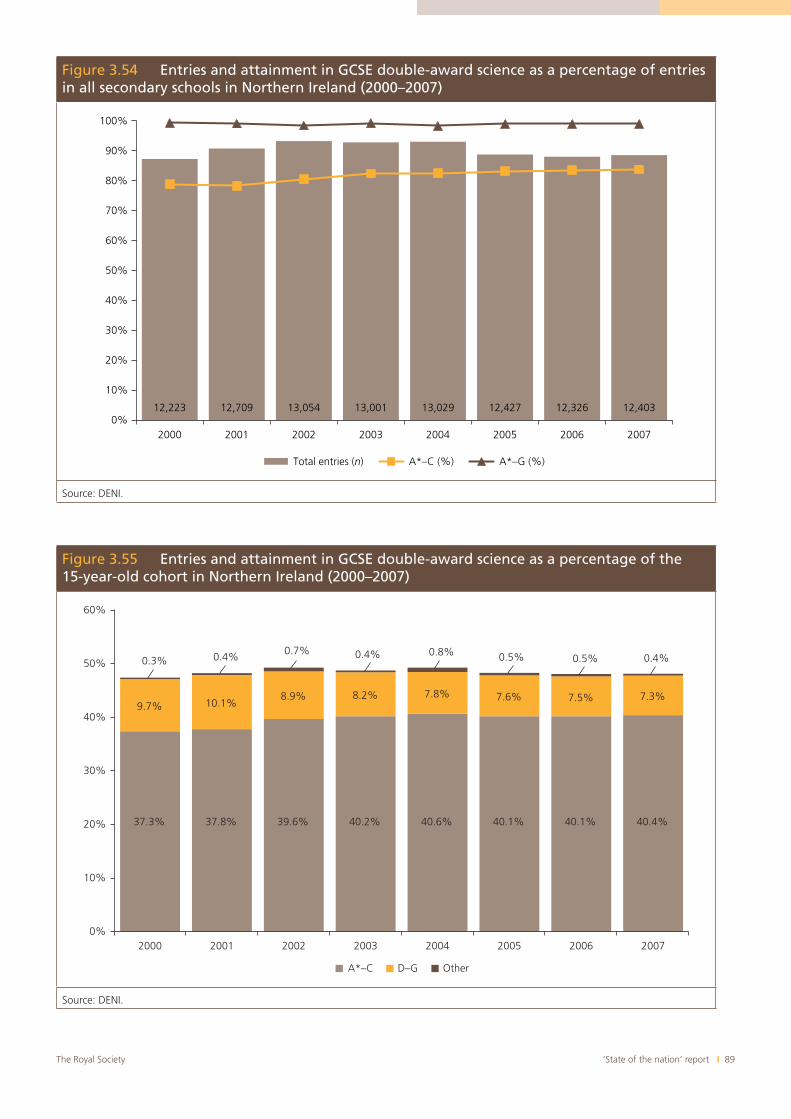
‘State of the nation’ report I 89The Royal Society
Figure 3.54 Entries and attainment in GCSE double-award science as a percentage of entries in all secondary schools in Northern Ireland (2000–2007)
12,223 12,709 13,054 13,001 13,029 12,427 12,326 12,4030%
10%
20%
30%
40%
50%
60%
70%
80%
90%
100%
2000 2001 2002 2003 2004 2005 2006 2007
Total entries (n) A*–C (%) A*–G (%)
Source: DENI.
Figure 3.55 Entries and attainment in GCSE double-award science as a percentage of the 15-year-old cohort in Northern Ireland (2000–2007)
37.3% 37.8% 39.6% 40.2% 40.6% 40.1% 40.1% 40.4%
9.7% 10.1%8.9% 8.2% 7.8% 7.6% 7.5% 7.3%
0.3% 0.4% 0.7% 0.4% 0.8% 0.5% 0.5% 0.4%
0%
10%
20%
30%
40%
50%
60%
2000 2001 2002 2003 2004 2005 2006 2007
A*–C D–G Other
Source: DENI.
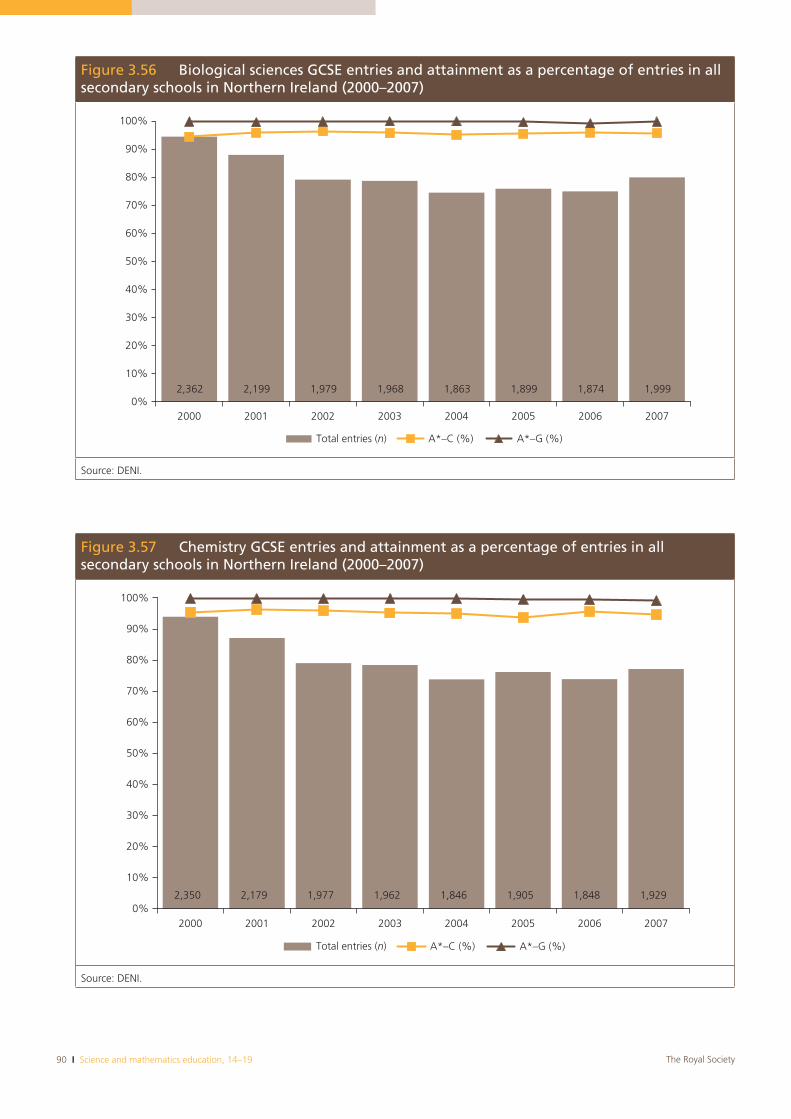
90 I Science and mathematics education, 14–19 The Royal Society
Figure 3.57 Chemistry GCSE entries and attainment as a percentage of entries in all secondary schools in Northern Ireland (2000–2007)
2,350 2,179 1,977 1,962 1,846 1,905 1,848 1,9290%
10%
20%
30%
40%
50%
60%
70%
80%
90%
100%
2000 2001 2002 2003 2004 2005 2006 2007
Total entries (n) A*–C (%) A*–G (%)
Source: DENI.
Figure 3.56 Biological sciences GCSE entries and attainment as a percentage of entries in all secondary schools in Northern Ireland (2000–2007)
2,362 2,199 1,979 1,968 1,863 1,899 1,874 1,9990%
10%
20%
30%
40%
50%
60%
70%
80%
90%
100%
2000 2001 2002 2003 2004 2005 2006 2007
Total entries (n) A*–C (%) A*–G (%)
Source: DENI.
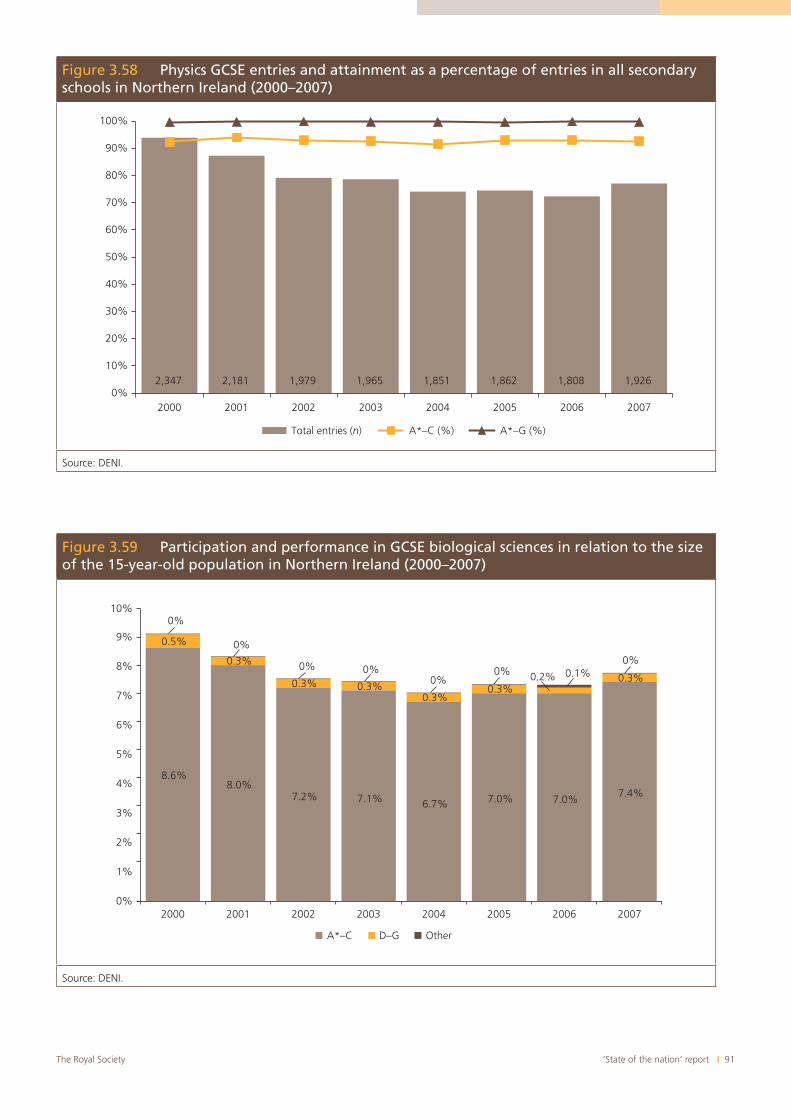
‘State of the nation’ report I 91The Royal Society
Figure 3.58 Physics GCSE entries and attainment as a percentage of entries in all secondary schools in Northern Ireland (2000–2007)
2,347 2,181 1,979 1,965 1,851 1,862 1,808 1,9260%
10%
20%
30%
40%
50%
60%
70%
80%
90%
100%
2000 2001 2002 2003 2004 2005 2006 2007
Total entries (n) A*–C (%) A*–G (%)
Source: DENI.
Figure 3.59 Participation and performance in GCSE biological sciences in relation to the size of the 15-year-old population in Northern Ireland (2000–2007)
8.6%8.0%
7.2% 7.1% 6.7% 7.0% 7.0%7.4%
0.5%
0.3%
0.3% 0.3%0.3%
0.3%0.2% 0.3%0.1%
0%
0%
1%
2%
3%
4%
5%
6%
7%
8%
9%
10%
2000 2001 2002 2003 2004 2005 2006 2007
A*–C D–G Other
0%0%
0%0%
0%
0%
Source: DENI.
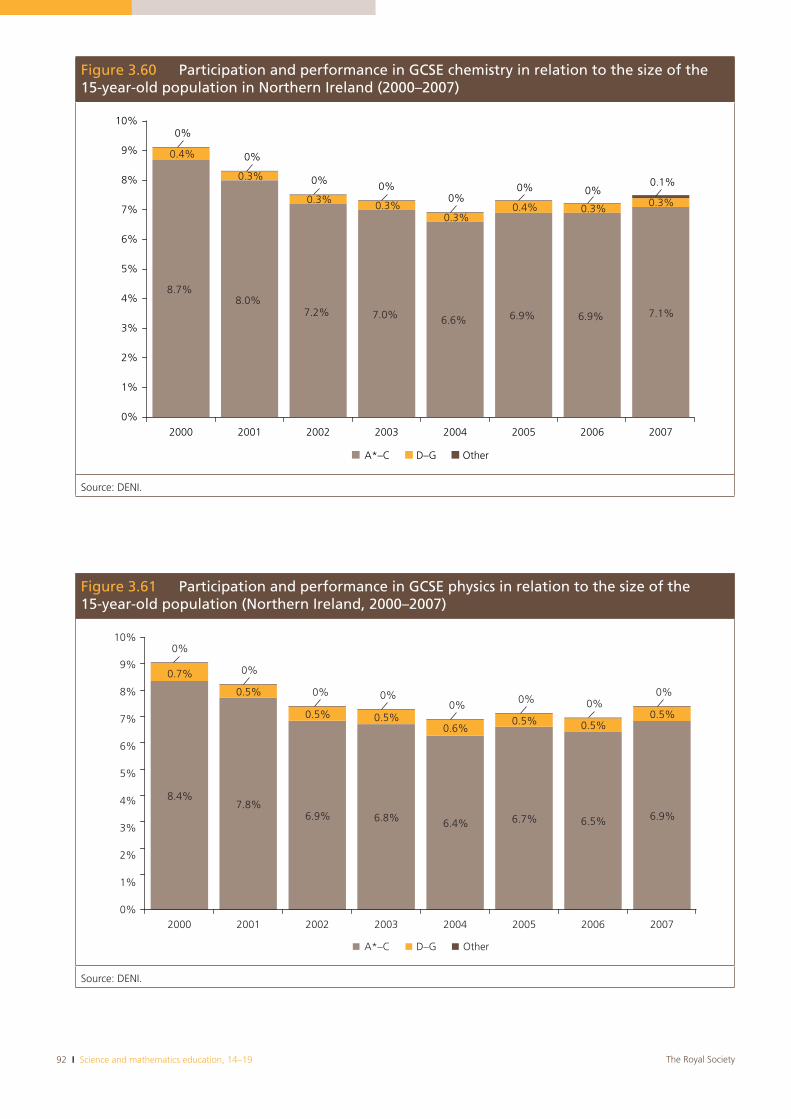
92 I Science and mathematics education, 14–19 The Royal Society
Figure 3.61 Participation and performance in GCSE physics in relation to the size of the 15-year-old population (Northern Ireland, 2000–2007)
8.4%7.8%
6.9% 6.8% 6.4% 6.7% 6.5% 6.9%
0.7%
0.5%
0.5% 0.5%0.6%
0.5% 0.5%0.5%
0%
0%
1%
2%
3%
4%
5%
6%
7%
8%
9%
10%
2000 2001 2002 2003 2004 2005 2006 2007
A*–C D–G Other
0%0%0%0%0%
0%
0%
Source: DENI.
Figure 3.60 Participation and performance in GCSE chemistry in relation to the size of the 15-year-old population in Northern Ireland (2000–2007)
8.7%8.0%
7.2% 7.0% 6.6% 6.9% 6.9% 7.1%
0.4%
0.3%
0.3% 0.3%0.3%
0.4% 0.3% 0.3%0%0% 0%
0.1%
0%
1%
2%
3%
4%
5%
6%
7%
8%
9%
10%
2000 2001 2002 2003 2004 2005 2006 2007
A*–C D–G Other
0%0%
0%
0%
Source: DENI.
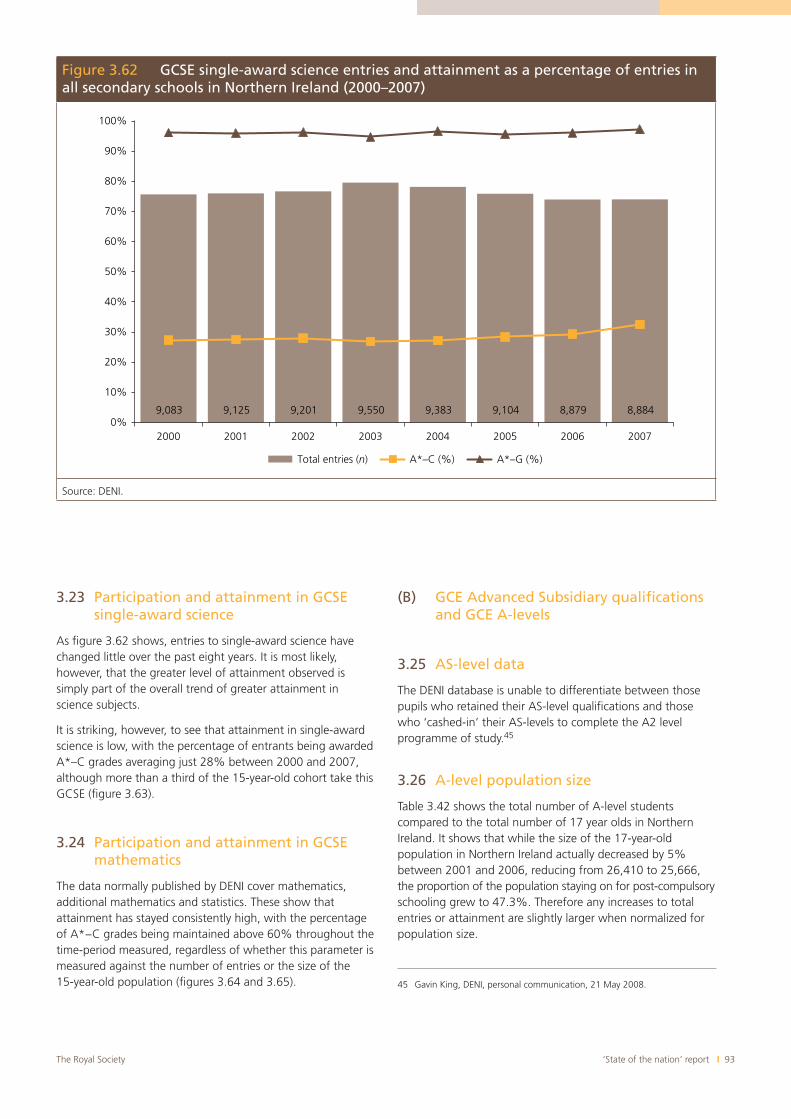
‘State of the nation’ report I 93The Royal Society
Figure 3.62 GCSE single-award science entries and attainment as a percentage of entries in all secondary schools in Northern Ireland (2000–2007)
9,083 9,125 9,201 9,550 9,383 9,104 8,879 8,8840%
10%
20%
30%
40%
50%
60%
70%
80%
90%
100%
2000 2001 2002 2003 2004 2005 2006 2007
Total entries (n) A*–C (%) A*–G (%)
Source: DENI.
3.23 Participation and attainment in GCSE single-award science
As figure 3.62 shows, entries to single-award science have changed little over the past eight years. It is most likely, however, that the greater level of attainment observed is simply part of the overall trend of greater attainment in science subjects.
It is striking, however, to see that attainment in single-award science is low, with the percentage of entrants being awarded A*–C grades averaging just 28% between 2000 and 2007, although more than a third of the 15-year-old cohort take this GCSE (figure 3.63).
3.24 Participation and attainment in GCSE mathematics
The data normally published by DENI cover mathematics, additional mathematics and statistics. These show that attainment has stayed consistently high, with the percentage of A*−C grades being maintained above 60% throughout the time-period measured, regardless of whether this parameter is measured against the number of entries or the size of the 15-year-old population (figures 3.64 and 3.65).
(B) GCE Advanced Subsidiary qualifications and GCE A-levels
3.25 AS-level data
The DENI database is unable to differentiate between those pupils who retained their AS-level qualifications and those who ‘cashed-in’ their AS-levels to complete the A2 level programme of study.45
3.26 A-level population size
Table 3.42 shows the total number of A-level students compared to the total number of 17 year olds in Northern Ireland. It shows that while the size of the 17-year-old population in Northern Ireland actually decreased by 5% between 2001 and 2006, reducing from 26,410 to 25,666, the proportion of the population staying on for post-compulsory schooling grew to 47.3%. Therefore any increases to total entries or attainment are slightly larger when normalized for population size.
45 Gavin King, DENI, personal communication, 21 May 2008.
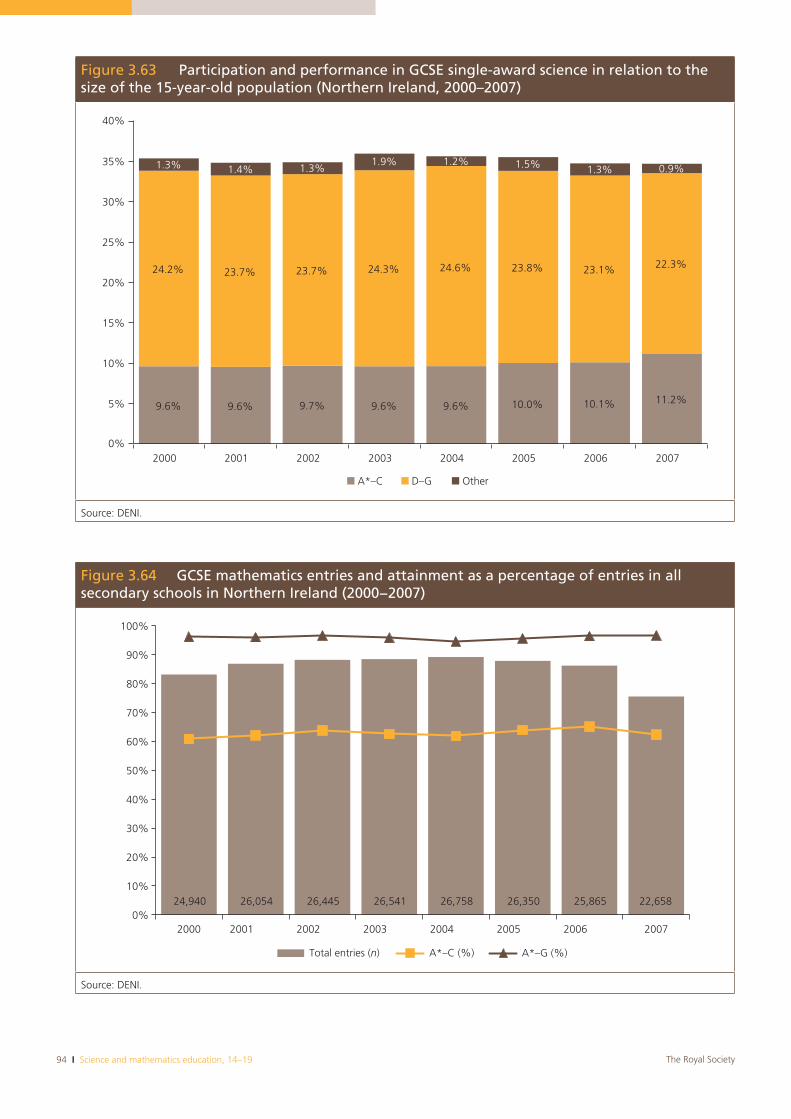
94 I Science and mathematics education, 14–19 The Royal Society
Figure 3.63 Participation and performance in GCSE single-award science in relation to the size of the 15-year-old population (Northern Ireland, 2000–2007)
9.6% 9.6% 9.7% 9.6% 9.6% 10.0% 10.1% 11.2%
24.2% 23.7% 23.7% 24.3% 24.6% 23.8% 23.1% 22.3%
1.3% 1.4% 1.3%1.9% 1.2% 1.5% 1.3% 0.9%
0%
5%
10%
15%
20%
25%
30%
35%
40%
2000 2001 2002 2003 2004 2005 2006 2007
A*–C D–G Other
Source: DENI.
Figure 3.64 GCSE mathematics entries and attainment as a percentage of entries in all secondary schools in Northern Ireland (2000−2007)
24,940 26,054 26,445 26,541 26,758 26,350 25,865 22,6580%
10%
20%
30%
40%
50%
60%
70%
80%
90%
100%
2000 2001 2002 2003 2004 2005 2006 2007
Total entries (n) A*–C (%) A*–G (%)
Source: DENI.
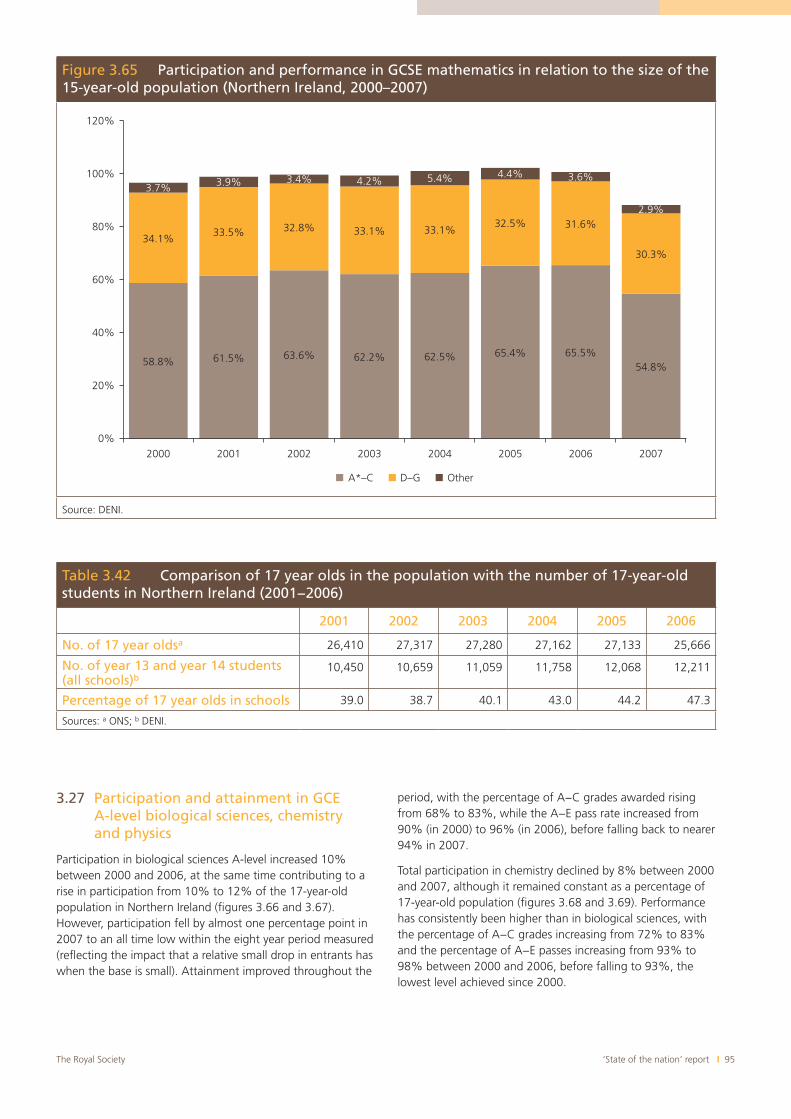
‘State of the nation’ report I 95The Royal Society
3.27 Participation and attainment in GCE A-level biological sciences, chemistry and physics
Participation in biological sciences A-level increased 10% between 2000 and 2006, at the same time contributing to a rise in participation from 10% to 12% of the 17-year-old population in Northern Ireland (figures 3.66 and 3.67). However, participation fell by almost one percentage point in 2007 to an all time low within the eight year period measured (reflecting the impact that a relative small drop in entrants has when the base is small). Attainment improved throughout the
period, with the percentage of A−C grades awarded rising from 68% to 83%, while the A−E pass rate increased from 90% (in 2000) to 96% (in 2006), before falling back to nearer 94% in 2007.
Total participation in chemistry declined by 8% between 2000 and 2007, although it remained constant as a percentage of 17-year-old population (figures 3.68 and 3.69). Performance has consistently been higher than in biological sciences, with the percentage of A−C grades increasing from 72% to 83% and the percentage of A−E passes increasing from 93% to 98% between 2000 and 2006, before falling to 93%, the lowest level achieved since 2000.
Figure 3.65 Participation and performance in GCSE mathematics in relation to the size of the 15-year-old population (Northern Ireland, 2000–2007)
58.8% 61.5% 63.6% 62.2% 62.5% 65.4% 65.5%54.8%
34.1%33.5% 32.8% 33.1% 33.1%
32.5% 31.6%
30.3%
3.7% 3.9% 3.4% 4.2% 5.4% 4.4% 3.6%
2.9%
0%
20%
40%
60%
80%
100%
120%
2000 2001 2002 2003 2004 2005 2006 2007
A*–C D–G Other
Source: DENI.
Table 3.42 Comparison of 17 year olds in the population with the number of 17-year-old students in Northern Ireland (2001−2006)
2001 2002 2003 2004 2005 2006
No. of 17 year oldsa 26,410 27,317 27,280 27,162 27,133 25,666
No. of year 13 and year 14 students (all schools)b
10,450 10,659 11,059 11,758 12,068 12,211
Percentage of 17 year olds in schools 39.0 38.7 40.1 43.0 44.2 47.3
Sources: a ONS; b DENI.
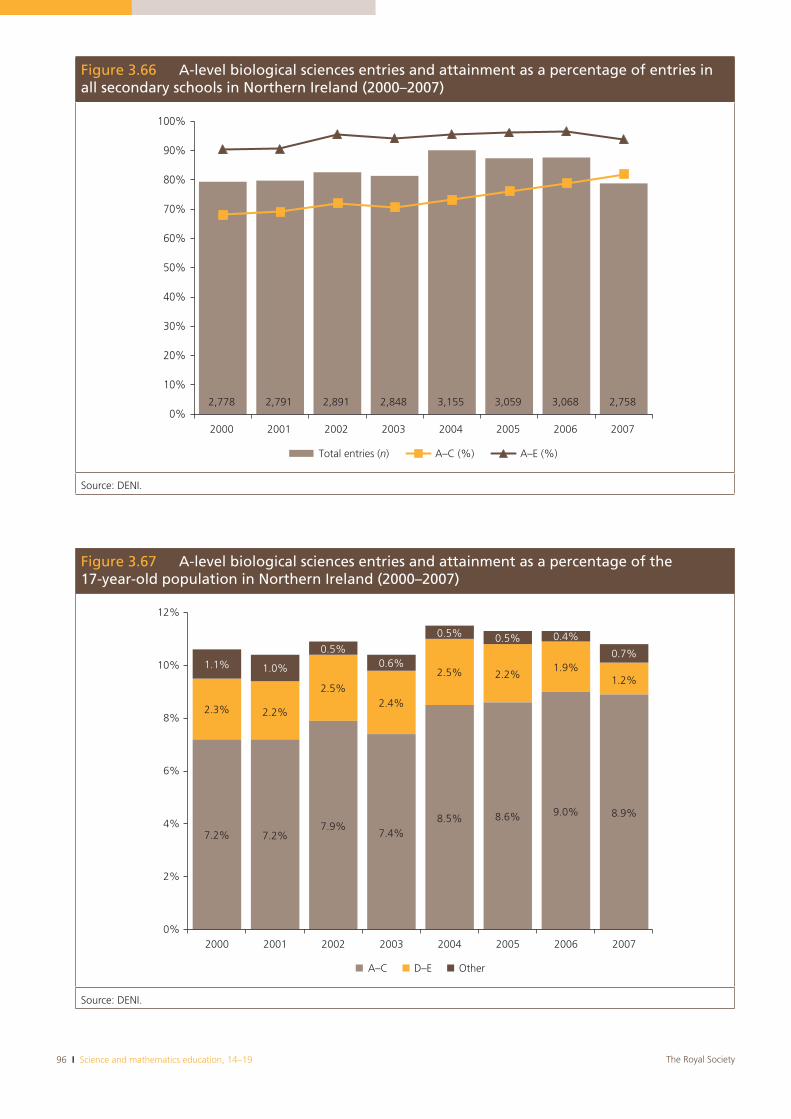
96 I Science and mathematics education, 14–19 The Royal Society
Figure 3.67 A-level biological sciences entries and attainment as a percentage of the 17-year-old population in Northern Ireland (2000–2007)
7.2% 7.2%7.9%
7.4%8.5% 8.6% 9.0% 8.9%
2.3% 2.2%
2.5%2.4%
2.5% 2.2%1.9%
1.2%
1.1% 1.0%
0.5%0.6%
0.5% 0.5% 0.4%
0.7%
0%
2%
4%
6%
8%
10%
12%
2000 2001 2002 2003 2004 2005 2006 2007
A–C D–E Other
Source: DENI.
Figure 3.66 A-level biological sciences entries and attainment as a percentage of entries in all secondary schools in Northern Ireland (2000–2007)
2,778 2,791 2,891 2,848 3,155 3,059 3,068 2,7580%
10%
20%
30%
40%
50%
60%
70%
80%
90%
100%
2000 2001 2002 2003 2004 2005 2006 2007
Total entries (n) A–C (%) A–E (%)
Source: DENI.
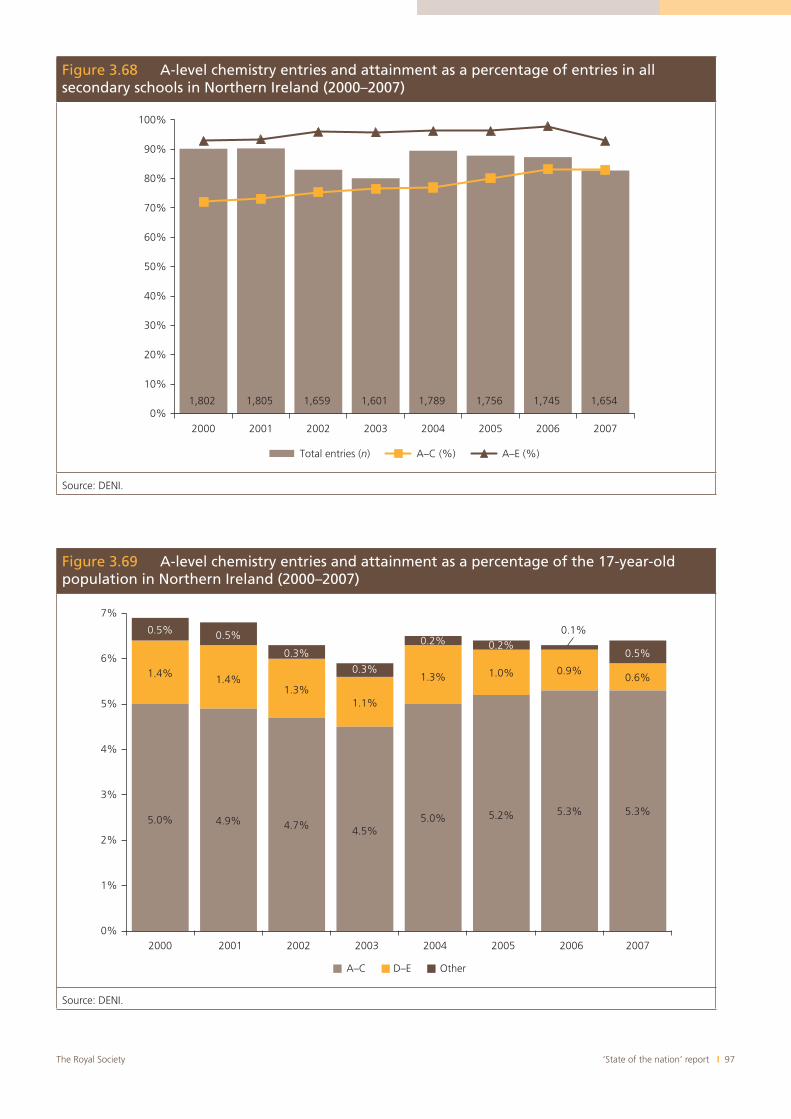
‘State of the nation’ report I 97The Royal Society
Figure 3.68 A-level chemistry entries and attainment as a percentage of entries in all secondary schools in Northern Ireland (2000–2007)
1,802 1,805 1,659 1,601 1,789 1,756 1,745 1,6540%
10%
20%
30%
40%
50%
60%
70%
80%
90%
100%
2000 2001 2002 2003 2004 2005 2006 2007
Total entries (n) A–C (%) A–E (%)
Source: DENI.
Figure 3.69 A-level chemistry entries and attainment as a percentage of the 17-year-old population in Northern Ireland (2000–2007)
5.0% 4.9% 4.7% 4.5%5.0% 5.2% 5.3% 5.3%
1.4% 1.4%1.3%
1.1%
1.3% 1.0% 0.9%0.6%
0.5% 0.5%
0.3%
0.3%
0.2% 0.2%0.1%
0.5%
0%
1%
2%
3%
4%
5%
6%
7%
2000 2001 2002 2003 2004 2005 2006 2007
A–C D–E Other
Source: DENI.
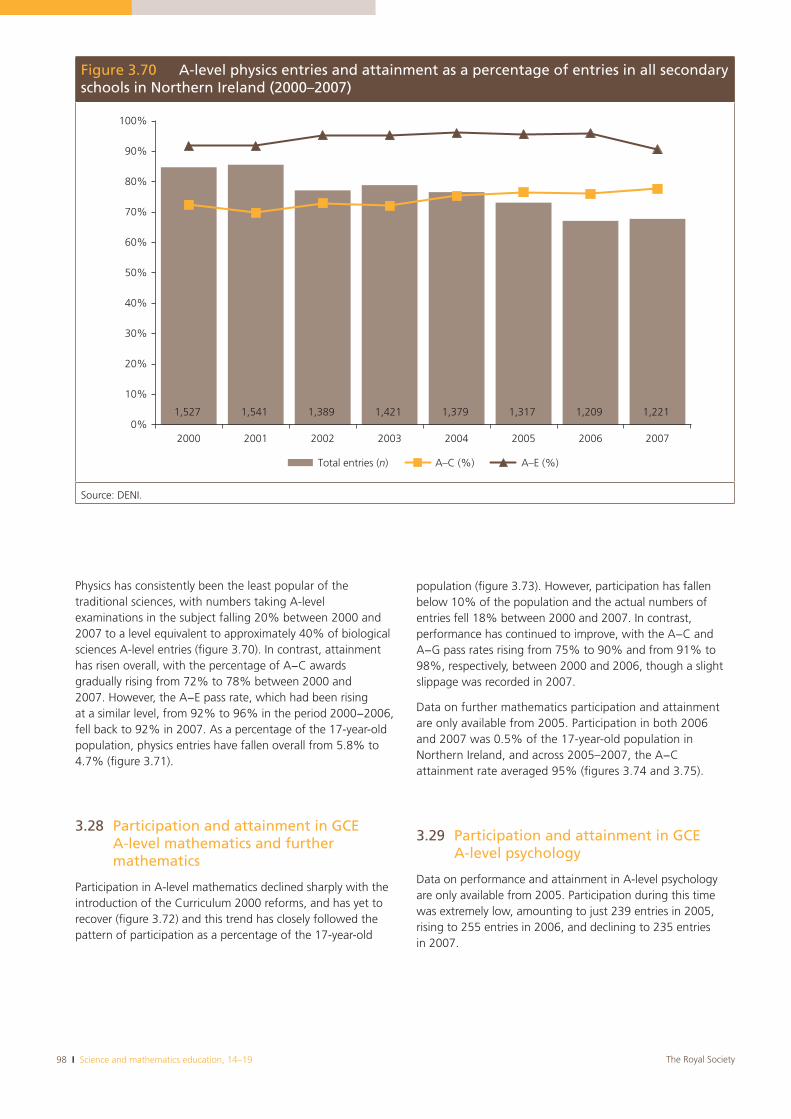
98 I Science and mathematics education, 14–19 The Royal Society
Figure 3.70 A-level physics entries and attainment as a percentage of entries in all secondary schools in Northern Ireland (2000–2007)
1,527 1,541 1,389 1,421 1,379 1,317 1,209 1,2210%
10%
20%
30%
40%
50%
60%
70%
80%
90%
100%
2000 2001 2002 2003 2004 2005 2006 2007
Total entries (n) A–C (%) A–E (%)
Source: DENI.
Physics has consistently been the least popular of the traditional sciences, with numbers taking A-level examinations in the subject falling 20% between 2000 and 2007 to a level equivalent to approximately 40% of biological sciences A-level entries (figure 3.70). In contrast, attainment has risen overall, with the percentage of A−C awards gradually rising from 72% to 78% between 2000 and 2007. However, the A−E pass rate, which had been rising at a similar level, from 92% to 96% in the period 2000−2006, fell back to 92% in 2007. As a percentage of the 17-year-old population, physics entries have fallen overall from 5.8% to 4.7% (figure 3.71).
3.28 Participation and attainment in GCE A-level mathematics and further mathematics
Participation in A-level mathematics declined sharply with the introduction of the Curriculum 2000 reforms, and has yet to recover (figure 3.72) and this trend has closely followed the pattern of participation as a percentage of the 17-year-old
population (figure 3.73). However, participation has fallen below 10% of the population and the actual numbers of entries fell 18% between 2000 and 2007. In contrast, performance has continued to improve, with the A−C and A−G pass rates rising from 75% to 90% and from 91% to 98%, respectively, between 2000 and 2006, though a slight slippage was recorded in 2007.
Data on further mathematics participation and attainment are only available from 2005. Participation in both 2006 and 2007 was 0.5% of the 17-year-old population in Northern Ireland, and across 2005–2007, the A−C attainment rate averaged 95% (figures 3.74 and 3.75).
3.29 Participation and attainment in GCE A-level psychology
Data on performance and attainment in A-level psychology are only available from 2005. Participation during this time was extremely low, amounting to just 239 entries in 2005, rising to 255 entries in 2006, and declining to 235 entries in 2007.
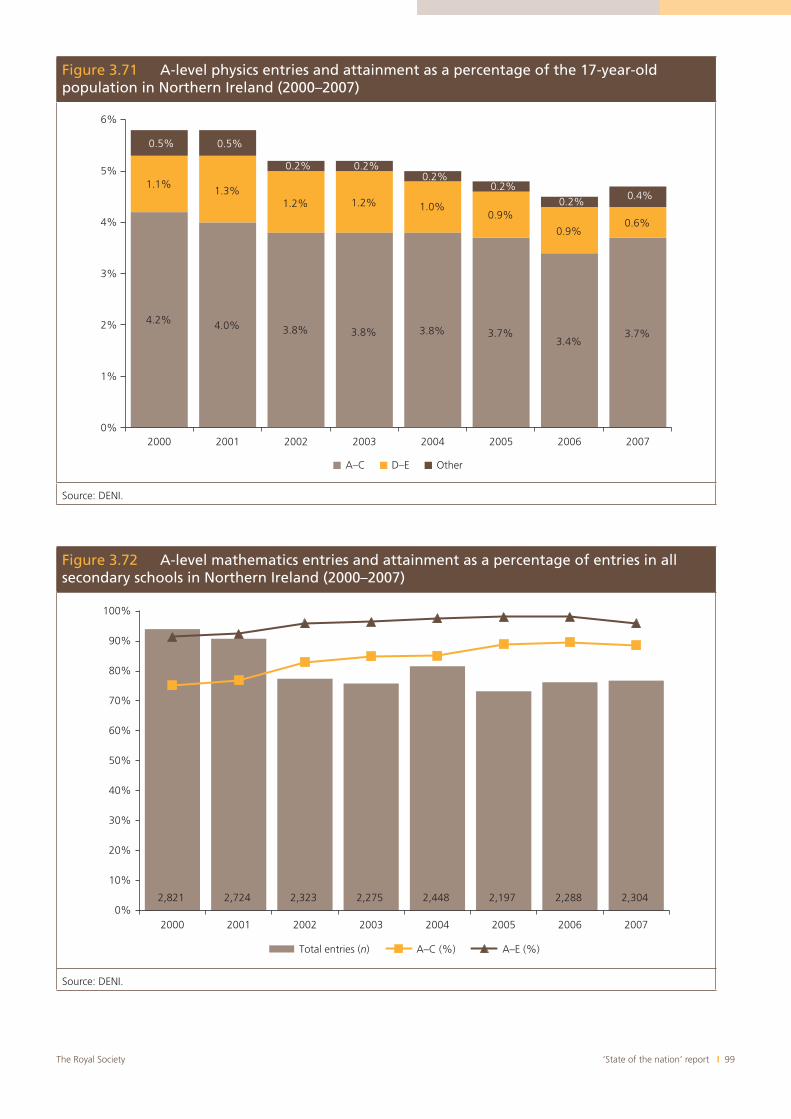
‘State of the nation’ report I 99The Royal Society
Figure 3.71 A-level physics entries and attainment as a percentage of the 17-year-old population in Northern Ireland (2000–2007)
4.2% 4.0% 3.8% 3.8% 3.8% 3.7%3.4%
3.7%
1.1%1.3%
1.2% 1.2% 1.0%0.9%
0.9%0.6%
0.5% 0.5%
0.2% 0.2%0.2%
0.2%0.2%
0.4%
0%
1%
2%
3%
4%
5%
6%
2000 2001 2002 2003 2004 2005 2006 2007
A–C D–E Other
Source: DENI.
Figure 3.72 A-level mathematics entries and attainment as a percentage of entries in all secondary schools in Northern Ireland (2000–2007)
2,821 2,724 2,323 2,275 2,448 2,197 2,288 2,3040%
10%
20%
30%
40%
50%
60%
70%
80%
90%
100%
2000 2001 2002 2003 2004 2005 2006 2007
Total entries (n) A–C (%) A–E (%)
Source: DENI.
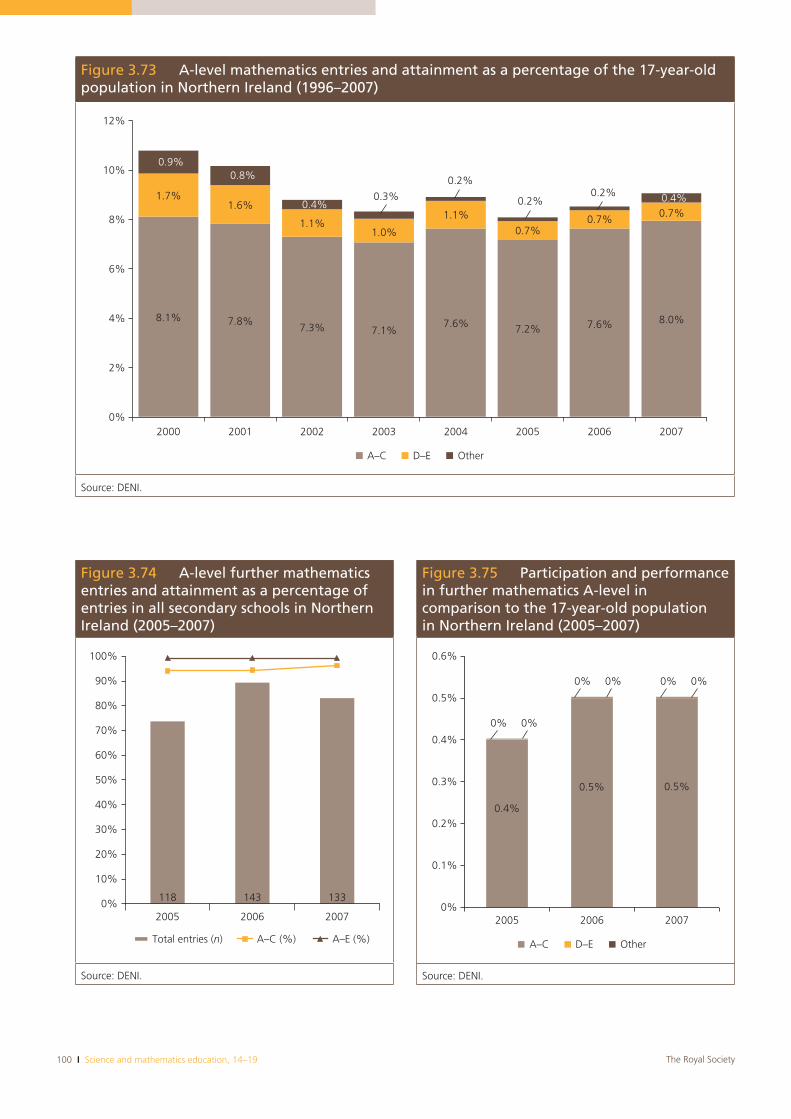
100 I Science and mathematics education, 14–19 The Royal Society
Figure 3.73 A-level mathematics entries and attainment as a percentage of the 17-year-old population in Northern Ireland (1996–2007)
8.1% 7.8%7.3% 7.1%
7.6% 7.2% 7.6% 8.0%
1.7%1.6%
1.1%1.0%
1.1%
0.7%0.7%
0.7%
0.9%0.8%
0.4% 0.2%
0.2%
0.3% 0.2% 0.4%
0%
2%
4%
6%
8%
10%
12%
2000 2001 2002 2003 2004 2005 2006 2007
A–C D–E Other
Source: DENI.
Figure 3.74 A-level further mathematics entries and attainment as a percentage of entries in all secondary schools in Northern Ireland (2005–2007)
118 143 1330%
10%
20%
30%
40%
50%
60%
70%
80%
90%
100%
2005 2006 2007
Total entries (n) A–C (%) A–E (%)
Source: DENI.
Figure 3.75 Participation and performance in further mathematics A-level in comparison to the 17-year-old population in Northern Ireland (2005–2007)
0.4%
0.5% 0.5%
0%0%
0%
0.1%
0.2%
0.3%
0.4%
0.5%
0.6%
2005 2006 2007
A–C D–E Other
0%0% 0%0%
Source: DENI.
‘State of the nation’ report I 101The Royal Society
Scotland
3.30 Scottish qualifications covered in this report
The discussion here focuses on Standard Grades and National Courses, the suite of courses taken by middle and upper school students including Intermediate 1, Intermediate 2, Higher and Advanced Higher qualifications (cf. tables 3.1 and 3.2).46
3.31 Population
The number of pupils in publicly funded Scottish primary and secondary schools has fallen 9% over the past 11 years, from 763,539 in 1997 to 692,215 in 2007, and it is projected to fall by a further 3.5% by 2017.47 Despite this reduction, much of which has affected primary schools to date, the number of secondary pupils (S1−S6) has decreased by less than 2% over the same period (table 3.43). In fact, the number of pupils in the latter stages of secondary schooling (S4−S6) has increased by around 3%. The figures in table 3.43 below do not take account of the number of pupils in the independent sector in Scotland (included in table 3.44), which equates to about 5% of the total secondary school population.
The figures in tables 3.43 and 3.44 for S4−S6 correspond most closely to the proportions of the total population of 15−17 year olds in Scotland continuing in post-compulsory education. The spread of ages in year groups is shown in tables 3.45 and 3.46 with almost all pupils in any year group falling within two years, eg ages 12 and 13 at S1. However,
46 We note, however, that some independent schools offer qualifications such as GCSEs and A-levels.
47 In Scotland, the expression ‘publicly funded’ is used in preference to ‘maintained’.
Table 3.43 Number of pupils in publicly funded Scottish secondary schools by stage of learninga
Stage 1999 2000 2001 2002 2003 2004 2005 2006 2007
S1 61,844 61,106 59,341 61,572 62,398 60,748 58,879 57,646 56,778
S2 60,844 61,853 61,133 59,275 61,673 62,436 60,817 58,876 57,814
S3 61,205 61,014 62,175 61,447 59,718 62,112 62,732 61,193 59,203
S4 59,250 60,138 59,998 61,035 60,446 58,871 61,190 61,697 60,351
S5 46,253 46,831 47,320 46,198 47,198 46,715 45,440 47,469 47,892
S6 25,960 26,762 26,392 27,372 26,993 27,018 26,782 26,098 27,522
a In 2002 there were four pupils and in 2003 there was one pupil for whom stage was not recorded.
Source: Scottish Government.
because of the relaxation of age and stage restrictions, SQA qualifications may be taken by pupils of different ages and stages. For example, Standard Grade examinations are normally taken at the end of S4, but in some schools they are taken at the end of S3.
The total numbers of young people of the predominant ages in the population that are involved in the major 14−18 qualifications are included in table 3.47.
In the following analyses, mid-year estimates of the population of people at a particular age in any year have had to be adjusted to take account of the academic year in which candidates took their examinations. Therefore, although the population of 16 year olds in Scotland in 2006 was estimated by the General Register Office for Scotland to number 64,154 individuals (table 3.47), the timing of this estimate requires that this figure be used to approximate the size of the pool of 16 year olds taking Highers in the 2006/07 academic year.
3.32 Further notes concerning the Scottish credit and qualifications framework
In addition to the differences between the SCQF and the NQF outlined at the beginning of this chapter, it is important to note that parts of the Scottish system relevant to 14–18 year olds underwent significant change during 1999–2001; this affects the ease with which it is possible to make comparisons of attainment over time. Under the Standards in Scotland’s Schools, etc Act 2000, pupils became entitled to an education that builds on their prior education, ability and aptitude. This means that, while progression is usually by age and stage, it is possible for schools to present pupils for courses at different
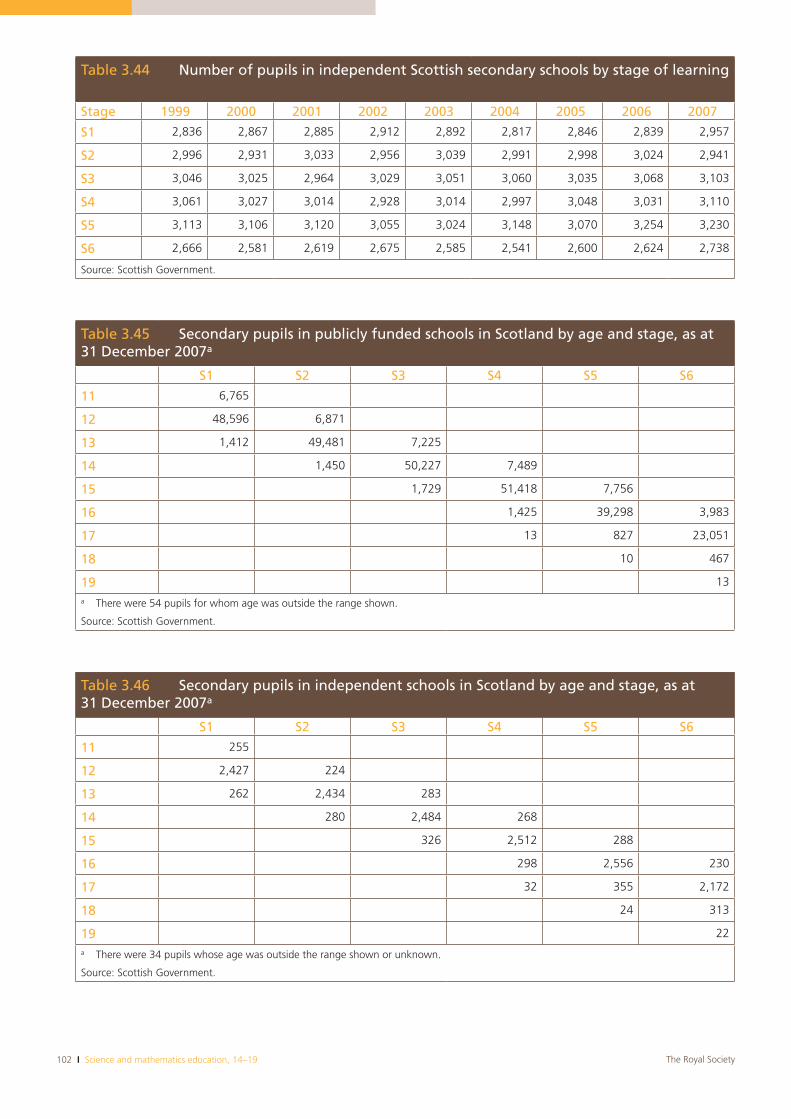
102 I Science and mathematics education, 14–19 The Royal Society
Table 3.44 Number of pupils in independent Scottish secondary schools by stage of learning
Stage 1999 2000 2001 2002 2003 2004 2005 2006 2007
S1 2,836 2,867 2,885 2,912 2,892 2,817 2,846 2,839 2,957
S2 2,996 2,931 3,033 2,956 3,039 2,991 2,998 3,024 2,941
S3 3,046 3,025 2,964 3,029 3,051 3,060 3,035 3,068 3,103
S4 3,061 3,027 3,014 2,928 3,014 2,997 3,048 3,031 3,110
S5 3,113 3,106 3,120 3,055 3,024 3,148 3,070 3,254 3,230
S6 2,666 2,581 2,619 2,675 2,585 2,541 2,600 2,624 2,738
Source: Scottish Government.
Table 3.45 Secondary pupils in publicly funded schools in Scotland by age and stage, as at 31 December 2007a
S1 S2 S3 S4 S5 S6
11 6,765
12 48,596 6,871
13 1,412 49,481 7,225
14 1,450 50,227 7,489
15 1,729 51,418 7,756
16 1,425 39,298 3,983
17 13 827 23,051
18 10 467
19 13
a There were 54 pupils for whom age was outside the range shown.
Source: Scottish Government.
Table 3.46 Secondary pupils in independent schools in Scotland by age and stage, as at 31 December 2007a
S1 S2 S3 S4 S5 S6
11 255
12 2,427 224
13 262 2,434 283
14 280 2,484 268
15 326 2,512 288
16 298 2,556 230
17 32 355 2,172
18 24 313
19 22
a There were 34 pupils whose age was outside the range shown or unknown.
Source: Scottish Government.
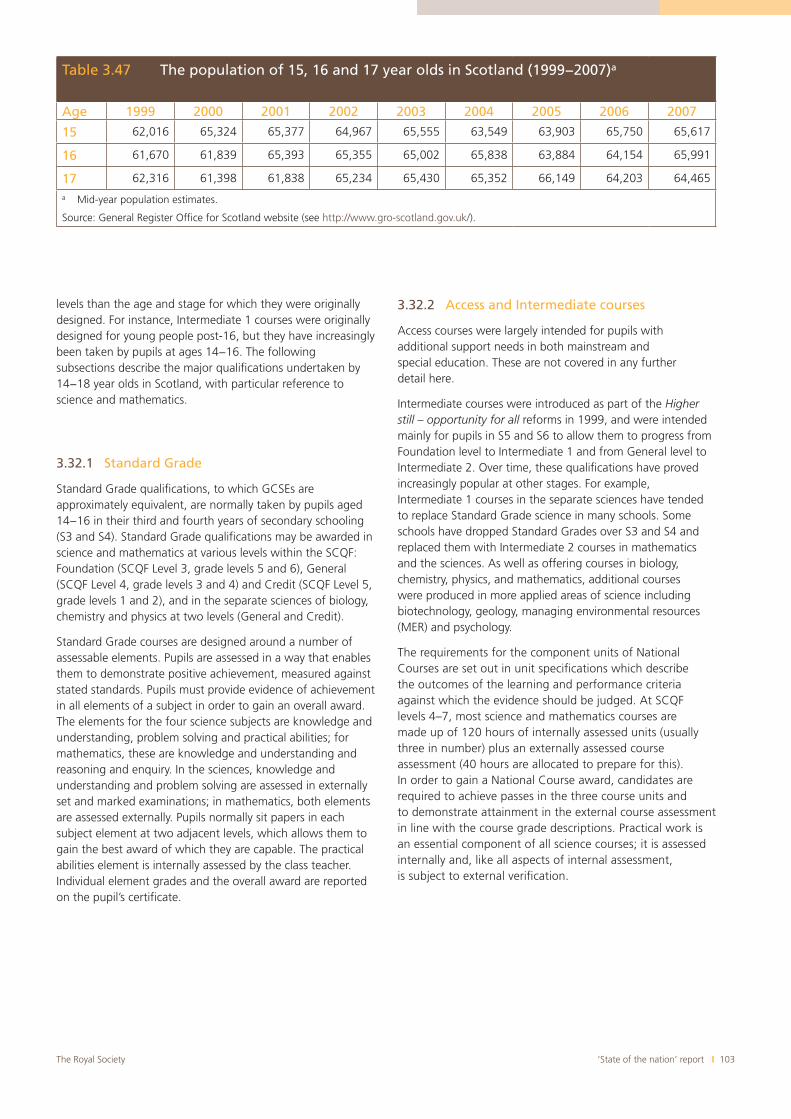
‘State of the nation’ report I 103The Royal Society
levels than the age and stage for which they were originally designed. For instance, Intermediate 1 courses were originally designed for young people post-16, but they have increasingly been taken by pupils at ages 14−16. The following subsections describe the major qualifications undertaken by 14−18 year olds in Scotland, with particular reference to science and mathematics.
3.32.1 Standard Grade
Standard Grade qualifications, to which GCSEs are approximately equivalent, are normally taken by pupils aged 14−16 in their third and fourth years of secondary schooling (S3 and S4). Standard Grade qualifications may be awarded in science and mathematics at various levels within the SCQF: Foundation (SCQF Level 3, grade levels 5 and 6), General (SCQF Level 4, grade levels 3 and 4) and Credit (SCQF Level 5, grade levels 1 and 2), and in the separate sciences of biology, chemistry and physics at two levels (General and Credit).
Standard Grade courses are designed around a number of assessable elements. Pupils are assessed in a way that enables them to demonstrate positive achievement, measured against stated standards. Pupils must provide evidence of achievement in all elements of a subject in order to gain an overall award. The elements for the four science subjects are knowledge and understanding, problem solving and practical abilities; for mathematics, these are knowledge and understanding and reasoning and enquiry. In the sciences, knowledge and understanding and problem solving are assessed in externally set and marked examinations; in mathematics, both elements are assessed externally. Pupils normally sit papers in each subject element at two adjacent levels, which allows them to gain the best award of which they are capable. The practical abilities element is internally assessed by the class teacher. Individual element grades and the overall award are reported on the pupil’s certificate.
3.32.2 Access and Intermediate courses
Access courses were largely intended for pupils with additional support needs in both mainstream and special education. These are not covered in any further detail here.
Intermediate courses were introduced as part of the Higherstill – opportunity for all reforms in 1999, and were intended mainly for pupils in S5 and S6 to allow them to progress from Foundation level to Intermediate 1 and from General level to Intermediate 2. Over time, these qualifications have proved increasingly popular at other stages. For example, Intermediate 1 courses in the separate sciences have tended to replace Standard Grade science in many schools. Some schools have dropped Standard Grades over S3 and S4 and replaced them with Intermediate 2 courses in mathematics and the sciences. As well as offering courses in biology, chemistry, physics, and mathematics, additional courses were produced in more applied areas of science including biotechnology, geology, managing environmental resources (MER) and psychology.
The requirements for the component units of National Courses are set out in unit specifications which describe the outcomes of the learning and performance criteria against which the evidence should be judged. At SCQF levels 4–7, most science and mathematics courses are made up of 120 hours of internally assessed units (usually three in number) plus an externally assessed course assessment (40 hours are allocated to prepare for this). In order to gain a National Course award, candidates are required to achieve passes in the three course units and to demonstrate attainment in the external course assessment in line with the course grade descriptions. Practical work is an essential component of all science courses; it is assessed internally and, like all aspects of internal assessment, is subject to external verification.
Table 3.47 The population of 15, 16 and 17 year olds in Scotland (1999−2007)a
Age 1999 2000 2001 2002 2003 2004 2005 2006 2007
15 62,016 65,324 65,377 64,967 65,555 63,549 63,903 65,750 65,617
16 61,670 61,839 65,393 65,355 65,002 65,838 63,884 64,154 65,991
17 62,316 61,398 61,838 65,234 65,430 65,352 66,149 64,203 64,465
a Mid-year population estimates.
Source: General Register Office for Scotland website (see http://www.gro-scotland.gov.uk/).
104 I Science and mathematics education, 14–19 The Royal Society
Unlike Standard Grade, Intermediate qualifications are assessed by an alphabetical system of grading similar to that used in other parts of the UK. Intermediate qualifications may be awarded at A, B, C or D grades (grade D is something of a compensatory award for those whose marks fell just shy of a C grade).
3.32.3 Highers
Pupils who have achieved well at Standard Grade (normally Credit level of Standard Grade) or at Intermediate 2 level would generally take up to five or six subjects at Higher level. Highers are generally sat by 16−18 year olds in their fifth (S5) or sixth (S6) year of secondary schooling. They are the accepted university entrance qualifications throughout Scotland and in many universities throughout the remainder of the UK. It is normal for students to take a range of qualifications including Intermediate, Higher and Advanced Higher qualifications over S5 and S6. It is possible for students to progress to either Higher or Advanced Higher. In S6 it is possible for a student to upgrade his/her Higher level passes by retaking a specific subject. The pattern of assessment of Higher courses is the same as that mentioned for Intermediate courses above. As well as Higher courses in biology, chemistry, physics, and mathematics, additional courses were created in more applied areas of science including biotechnology, geology, managing environmental resources (MER), psychology and human biology.
3.32.4 Advanced Highers
Advanced Highers, which are available in biology, chemistry, physics and mathematics, are generally taken following Highers in S6 by 17−18 year old pupils. Universities are increasingly recognizing Advanced Higher for university entrance, particularly where a student has stayed on for a sixth year. Advanced Highers can be used to motivate S6 pupils to encourage them to study throughout the S6 period. Advanced Highers replaced the Certificate of Sixth Year Studies (CSYS) from 2001. Capable students may well take two or three Advanced Highers and one or two Highers in S6. The pattern of assessment of Advanced Higher courses is the same as that mentioned for Intermediate courses above.
3.32.5 The equivalence of Scottish qualifications with GCSEs and A-levels
Table 3.1 compared very generally the equivalence of Scottish qualifications with those in the National Qualifications Framework in place in England, Northern Ireland and Wales.
A pass at Intermediate 2 and Credit level of Standard Grade approximates to A*−C grades at GCSE. A pass at Intermediate 1 and General level of Standard Grade is approximately equivalent to grades D−G at GCSE. Highers sit somewhere between AS- and A-level: they are accepted for entrance to university, and are allocated more points than AS-levels in the UCAS tariff tables. Advanced Highers are allocated the same number of UCAS points as A-levels.
3.33 Participation and attainment in Scottish science and mathematics qualifications
The following analysis assesses participation and attainment in science and mathematics in Scottish Standard Grade (General and Credit), Intermediates, Highers and Advanced Highers, equivalent to Levels 4−7 in the SCQF (tables 3.1, 3.2) across both publicly funded and independent schools.
3.33.1 Standard Grade
In Scotland, most pupils follow courses in biology, chemistry or physics either at Standard Grade or Intermediate or Access levels. Although pupils are required to study only one science subject, about 25−30% of the cohort study two or three sciences. The proportion following the integrated Standard Grade science course has steadily declined over recent years, with more schools opting to present pupils at Intermediate 1 courses in one or more of the separate sciences.
3.33.1.1 Participation and attainment in Standard Grade biology, chemistry and physics
Figure 3.76 shows the total participation in Standard Grade biology, chemistry and physics among pupils across all stages in all secondary schools during 1996−2007. (The y-axis reflects the fact that the individual totals for each subject combine to amount to 100% participation for the three subjects.) It demonstrates how the level of participation in biology has scarcely changed over this period, and that participation in both chemistry and physics has decreased quite markedly (by 19% and 26%, respectively). Table 3.48 complements figure 3.76, showing the breakdown of participation by stage. In line with expectation, it shows that the majority of participants are at a level below S5 (15 year olds, or younger). There have been increasingly few entrants at S5 and S6, and the introduction of Intermediate courses has caused participation at these upper levels of schooling to shrink to single figures.
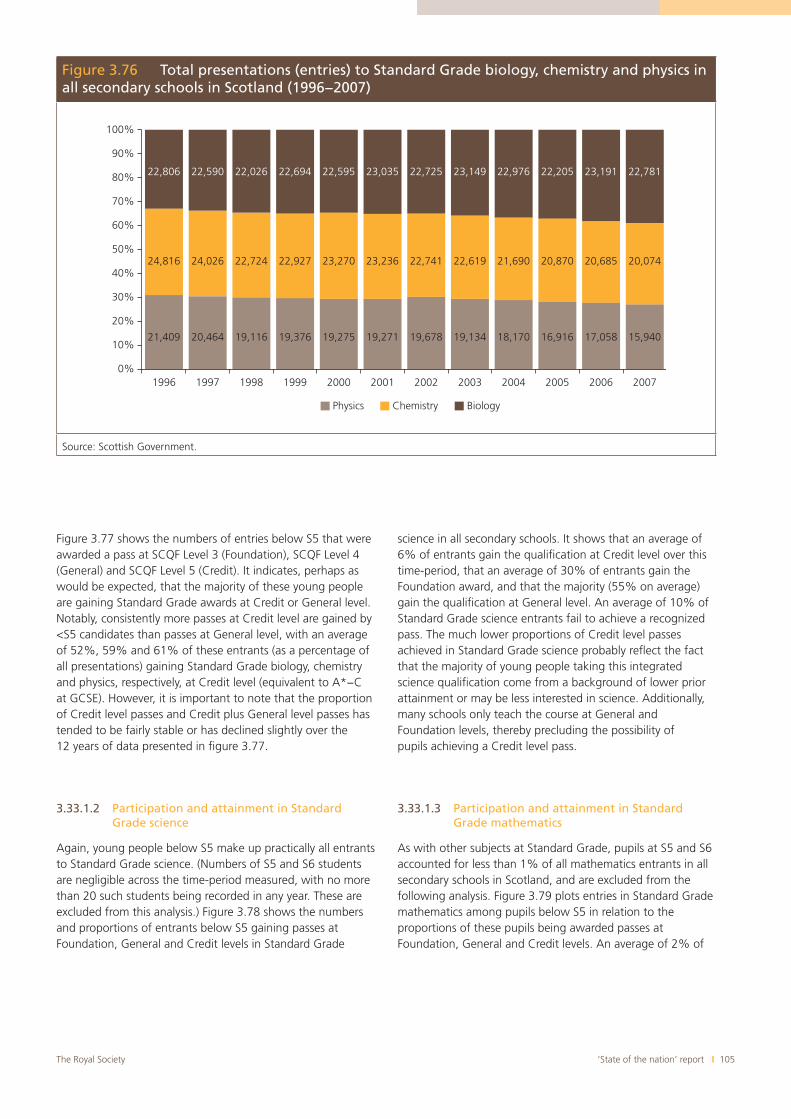
‘State of the nation’ report I 105The Royal Society
Figure 3.77 shows the numbers of entries below S5 that were awarded a pass at SCQF Level 3 (Foundation), SCQF Level 4 (General) and SCQF Level 5 (Credit). It indicates, perhaps as would be expected, that the majority of these young people are gaining Standard Grade awards at Credit or General level. Notably, consistently more passes at Credit level are gained by <S5 candidates than passes at General level, with an average of 52%, 59% and 61% of these entrants (as a percentage of all presentations) gaining Standard Grade biology, chemistry and physics, respectively, at Credit level (equivalent to A*−C at GCSE). However, it is important to note that the proportion of Credit level passes and Credit plus General level passes has tended to be fairly stable or has declined slightly over the 12 years of data presented in figure 3.77.
3.33.1.2 Participation and attainment in Standard Grade science
Again, young people below S5 make up practically all entrants to Standard Grade science. (Numbers of S5 and S6 students are negligible across the time-period measured, with no more than 20 such students being recorded in any year. These are excluded from this analysis.) Figure 3.78 shows the numbers and proportions of entrants below S5 gaining passes at Foundation, General and Credit levels in Standard Grade
science in all secondary schools. It shows that an average of 6% of entrants gain the qualification at Credit level over this time-period, that an average of 30% of entrants gain the Foundation award, and that the majority (55% on average) gain the qualification at General level. An average of 10% of Standard Grade science entrants fail to achieve a recognized pass. The much lower proportions of Credit level passes achieved in Standard Grade science probably reflect the fact that the majority of young people taking this integrated science qualification come from a background of lower prior attainment or may be less interested in science. Additionally, many schools only teach the course at General and Foundation levels, thereby precluding the possibility of pupils achieving a Credit level pass.
3.33.1.3 Participation and attainment in Standard Grade mathematics
As with other subjects at Standard Grade, pupils at S5 and S6 accounted for less than 1% of all mathematics entrants in all secondary schools in Scotland, and are excluded from the following analysis. Figure 3.79 plots entries in Standard Grade mathematics among pupils below S5 in relation to the proportions of these pupils being awarded passes at Foundation, General and Credit levels. An average of 2% of
Figure 3.76 Total presentations (entries) to Standard Grade biology, chemistry and physics in all secondary schools in Scotland (1996−2007)
100%
90%
80%
70%
60%
50%
40%
30%
20%
10%
0%1996
21,409
24,816 24,026 22,724 22,927 23,270 23,236 22,741 22,619 21,690 20,870 20,685 20,074
20,464 19,116 19,376 19,275 19,271 19,678 19,134 18,170 16,916 17,058 15,940
1997 1998 1999
Physics Chemistry Biology
2000 2001 2002 2003 2004 2005 2006 2007
22,806 22,590 22,026 22,694 22,595 23,035 22,725 23,149 22,976 22,205 23,191 22,781
Source: Scottish Government.
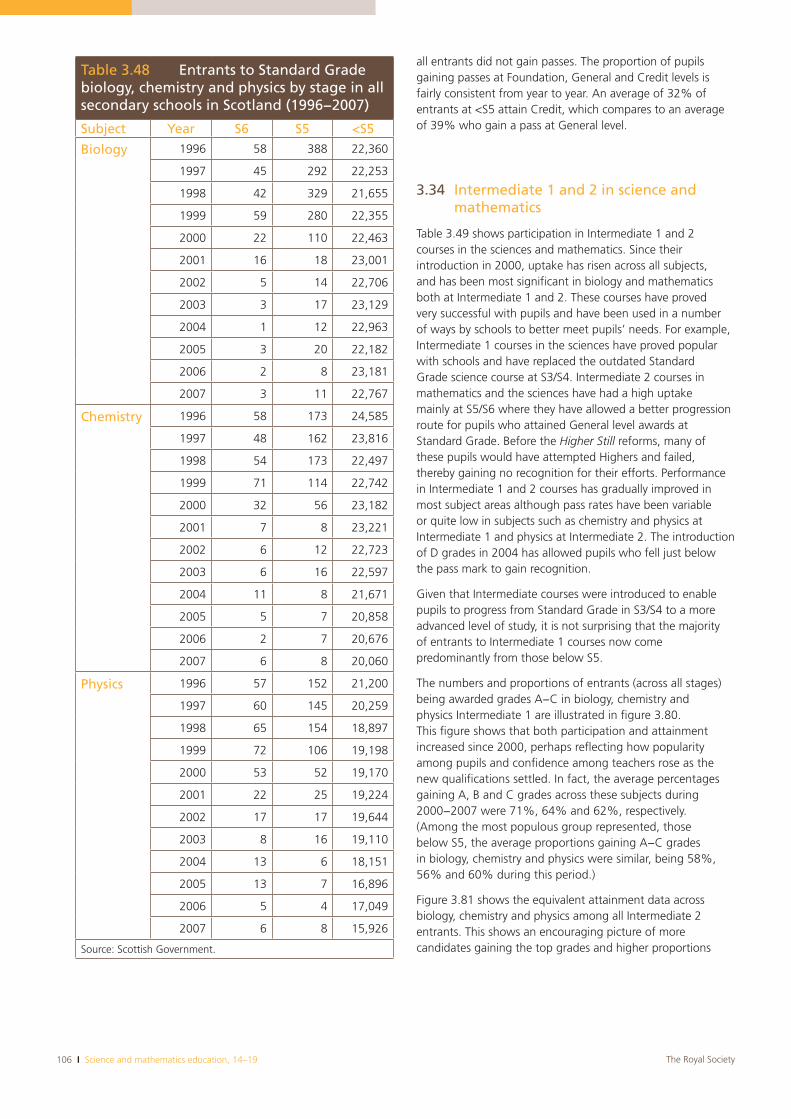
106 I Science and mathematics education, 14–19 The Royal Society
all entrants did not gain passes. The proportion of pupils gaining passes at Foundation, General and Credit levels is fairly consistent from year to year. An average of 32% of entrants at <S5 attain Credit, which compares to an average of 39% who gain a pass at General level.
3.34 Intermediate 1 and 2 in science and mathematics
Table 3.49 shows participation in Intermediate 1 and 2 courses in the sciences and mathematics. Since their introduction in 2000, uptake has risen across all subjects, and has been most significant in biology and mathematics both at Intermediate 1 and 2. These courses have proved very successful with pupils and have been used in a number of ways by schools to better meet pupils’ needs. For example, Intermediate 1 courses in the sciences have proved popular with schools and have replaced the outdated Standard Grade science course at S3/S4. Intermediate 2 courses in mathematics and the sciences have had a high uptake mainly at S5/S6 where they have allowed a better progression route for pupils who attained General level awards at Standard Grade. Before the Higher Still reforms, many of these pupils would have attempted Highers and failed, thereby gaining no recognition for their efforts. Performance in Intermediate 1 and 2 courses has gradually improved in most subject areas although pass rates have been variable or quite low in subjects such as chemistry and physics at Intermediate 1 and physics at Intermediate 2. The introduction of D grades in 2004 has allowed pupils who fell just below the pass mark to gain recognition.
Given that Intermediate courses were introduced to enable pupils to progress from Standard Grade in S3/S4 to a more advanced level of study, it is not surprising that the majority of entrants to Intermediate 1 courses now come predominantly from those below S5.
The numbers and proportions of entrants (across all stages) being awarded grades A−C in biology, chemistry and physics Intermediate 1 are illustrated in figure 3.80. This figure shows that both participation and attainment increased since 2000, perhaps reflecting how popularity among pupils and confidence among teachers rose as the new qualifications settled. In fact, the average percentages gaining A, B and C grades across these subjects during 2000−2007 were 71%, 64% and 62%, respectively. (Among the most populous group represented, those below S5, the average proportions gaining A−C grades in biology, chemistry and physics were similar, being 58%, 56% and 60% during this period.)
Figure 3.81 shows the equivalent attainment data across biology, chemistry and physics among all Intermediate 2 entrants. This shows an encouraging picture of more candidates gaining the top grades and higher proportions
Table 3.48 Entrants to Standard Grade biology, chemistry and physics by stage in all secondary schools in Scotland (1996−2007)
Subject Year S6 S5 <S5
Biology 1996 58 388 22,360
1997 45 292 22,253
1998 42 329 21,655
1999 59 280 22,355
2000 22 110 22,463
2001 16 18 23,001
2002 5 14 22,706
2003 3 17 23,129
2004 1 12 22,963
2005 3 20 22,182
2006 2 8 23,181
2007 3 11 22,767
Chemistry 1996 58 173 24,585
1997 48 162 23,816
1998 54 173 22,497
1999 71 114 22,742
2000 32 56 23,182
2001 7 8 23,221
2002 6 12 22,723
2003 6 16 22,597
2004 11 8 21,671
2005 5 7 20,858
2006 2 7 20,676
2007 6 8 20,060
Physics 1996 57 152 21,200
1997 60 145 20,259
1998 65 154 18,897
1999 72 106 19,198
2000 53 52 19,170
2001 22 25 19,224
2002 17 17 19,644
2003 8 16 19,110
2004 13 6 18,151
2005 13 7 16,896
2006 5 4 17,049
2007 6 8 15,926
Source: Scottish Government.
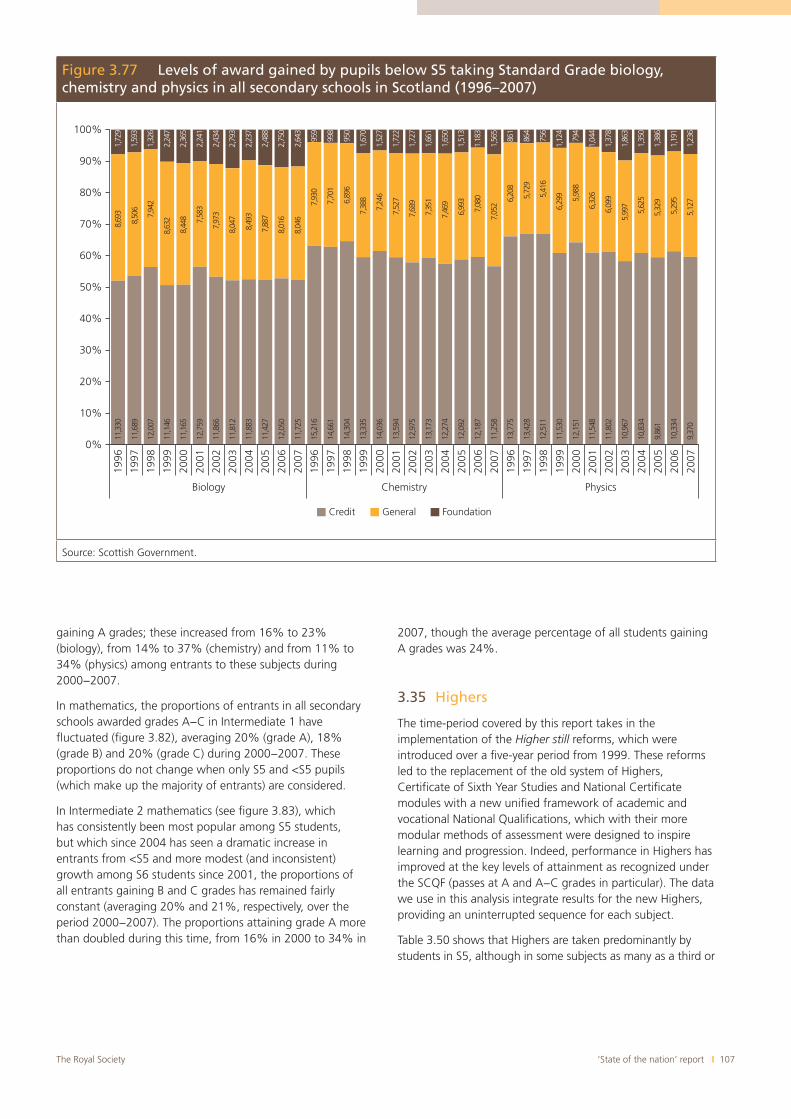
‘State of the nation’ report I 107The Royal Society
gaining A grades; these increased from 16% to 23% (biology), from 14% to 37% (chemistry) and from 11% to 34% (physics) among entrants to these subjects during 2000−2007.
In mathematics, the proportions of entrants in all secondary schools awarded grades A−C in Intermediate 1 have fluctuated (figure 3.82), averaging 20% (grade A), 18% (grade B) and 20% (grade C) during 2000−2007. These proportions do not change when only S5 and <S5 pupils (which make up the majority of entrants) are considered.
In Intermediate 2 mathematics (see figure 3.83), which has consistently been most popular among S5 students, but which since 2004 has seen a dramatic increase in entrants from <S5 and more modest (and inconsistent) growth among S6 students since 2001, the proportions of all entrants gaining B and C grades has remained fairly constant (averaging 20% and 21%, respectively, over the period 2000−2007). The proportions attaining grade A more than doubled during this time, from 16% in 2000 to 34% in
2007, though the average percentage of all students gaining A grades was 24%.
3.35 Highers
The time-period covered by this report takes in the implementation of the Higher still reforms, which were introduced over a five-year period from 1999. These reforms led to the replacement of the old system of Highers, Certificate of Sixth Year Studies and National Certificate modules with a new unified framework of academic and vocational National Qualifications, which with their more modular methods of assessment were designed to inspire learning and progression. Indeed, performance in Highers has improved at the key levels of attainment as recognized under the SCQF (passes at A and A−C grades in particular). The data we use in this analysis integrate results for the new Highers, providing an uninterrupted sequence for each subject.
Table 3.50 shows that Highers are taken predominantly by students in S5, although in some subjects as many as a third or
Figure 3.77 Levels of award gained by pupils below S5 taking Standard Grade biology, chemistry and physics in all secondary schools in Scotland (1996–2007)
Credit General Foundation
100%
90%
80%
70%
60%
50%
40%
30%
20%
10%
0%
Biology Chemistry Physics
1996
11,3
30
11,6
89
12,0
07
11,1
46
11,1
65
12,7
59
11,8
66
11,8
12
11,8
83
11,4
27
12,0
50
11,7
25
15,2
16
14,6
61
14,3
04
13,3
35
14,0
36
13,5
94
12,9
75
13,1
73
12,2
74
12,0
92
12,1
87
11,2
58
13,7
75
13,4
28
12,5
11
11,5
30
12,1
51
11,5
48
11,8
02
10,9
67
10,8
34
9,86
1
10,3
34
9,37
0
8,69
3
8,50
6
7,94
2
8,63
2
8,44
8 7,58
3
7,97
3
8,04
7
8,49
3
7,88
7
8,01
6
8,04
6
7,93
0
7,70
1
6,89
6
7,38
8
7,24
6
7,52
7
7,68
9
7,35
1
7,46
9
6,99
3
7,08
0
7,05
2
6,20
8
5,72
9
5,41
6
6,29
9
5,98
8
6,32
6
6,09
9
5,99
7
5,62
5
5,32
9
5,29
5
5,12
7
1,72
9
1,59
3
1,32
6
2,24
7
2,36
5
2,24
1
2,43
4
2,79
3
2,23
7
2,48
8
2,75
0
2,64
3
959
998
950
1,67
0
1,52
7
1,72
2
1,72
7
1,66
1
1,65
0
1,51
3
1.18
3
1,56
5
861
864
756
1,12
4
794
1,04
4
1,37
8
1,86
3
1,35
0
1,38
6
1,19
1
1,23
6
1997
1998
1999
2000
2001
2002
2003
2004
2005
2006
2007
1996
1997
1998
1999
2000
2001
2002
2003
2004
2005
2006
2007
1996
1997
1998
1999
2000
2001
2002
2003
2004
2005
2006
2007
Source: Scottish Government.
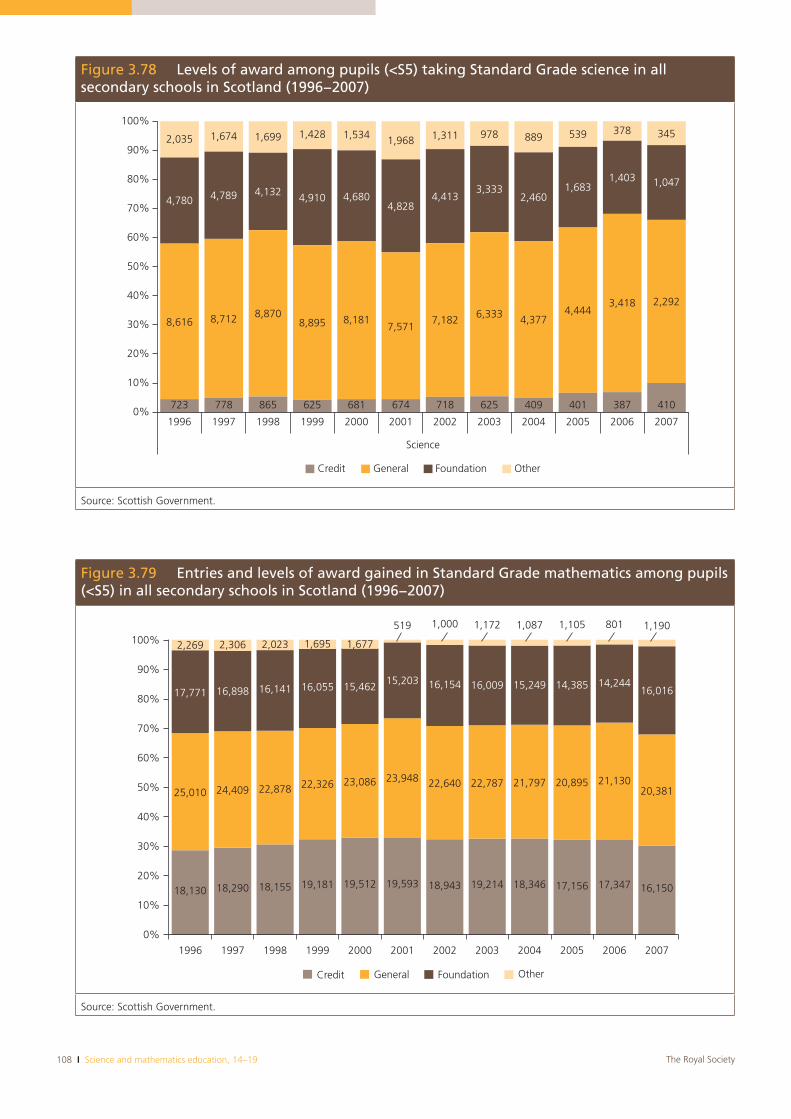
108 I Science and mathematics education, 14–19 The Royal Society
Figure 3.78 Levels of award among pupils (<S5) taking Standard Grade science in all secondary schools in Scotland (1996−2007)
Credit General Foundation Other
100%
2,035
4,780
8,616
723 778 865 625 681 674 718 625 409 401 387 410
8,712 8,8708,895 8,181
7,5717,182 6,333 4,377
4,4443,418 2,292
4,789 4,132 4,910 4,680 4,4133,333
2,4601,683
1,403 1,047
4,828
1,674 1,699 1,428 1,534 1,311 978 889 539 378 3451,968
90%
80%
70%
60%
50%
40%
30%
20%
10%
0%1996 1997 1998 1999 2000 2001
Science
2002 2003 2004 2005 2006 2007
Source: Scottish Government.
Figure 3.79 Entries and levels of award gained in Standard Grade mathematics among pupils (<S5) in all secondary schools in Scotland (1996−2007)
100%
90%
80%
70%
60%
50%
40%
30%
20%
10%
0%
1996 1997 1998 1999
Credit General Foundation Other
2000 2001 2002 2003 2004 2005 2006 2007
2,3062,269 2,023 1,695 1,677
519 1,000 1,172 1,087 1,105 801 1,190
17,771 16,898 16,141 16,055 15,46215,203 16,154 16,009 15,249 14,385 14,244
16,016
25,010 24,409 22,878 22,326 23,086 23,948 22,640 22,787 21,797 20,895 21,13020,381
18,130 18,290 18,155 19,181 19,512 19,593 18,943 19,214 18,346 17,156 17,347 16,150
Source: Scottish Government.
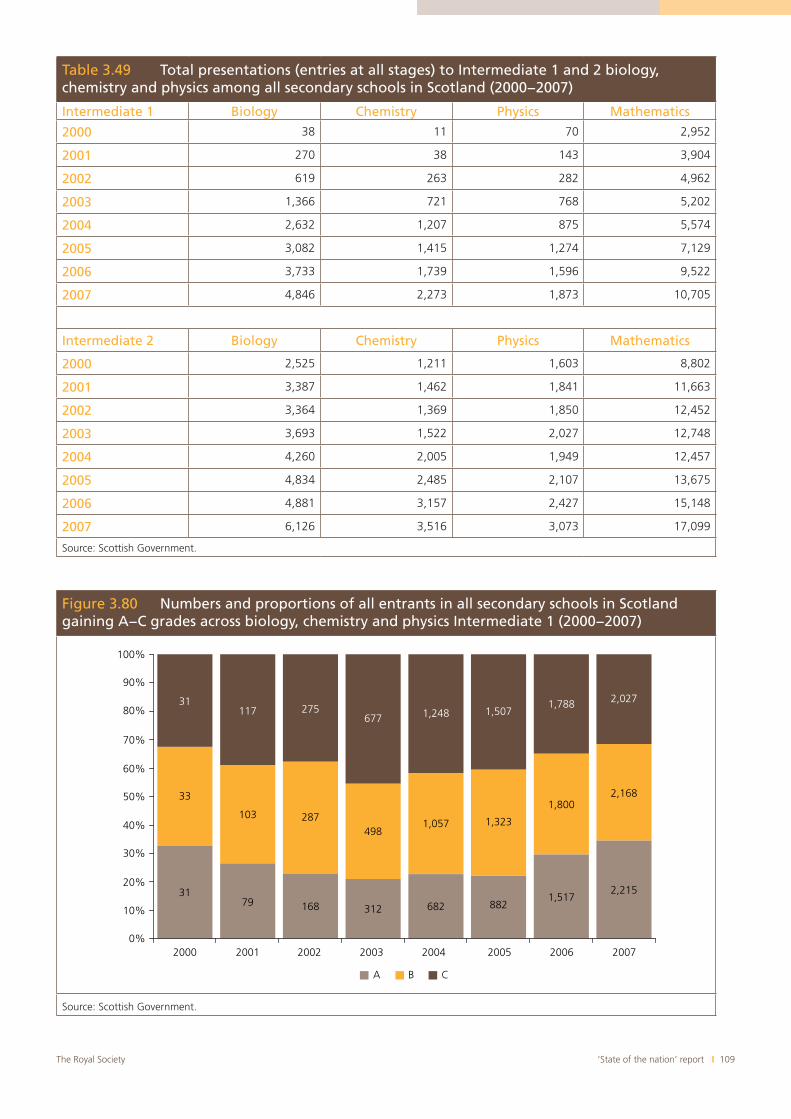
‘State of the nation’ report I 109The Royal Society
Table 3.49 Total presentations (entries at all stages) to Intermediate 1 and 2 biology, chemistry and physics among all secondary schools in Scotland (2000−2007)
Intermediate 1 Biology Chemistry Physics Mathematics
2000 38 11 70 2,952
2001 270 38 143 3,904
2002 619 263 282 4,962
2003 1,366 721 768 5,202
2004 2,632 1,207 875 5,574
2005 3,082 1,415 1,274 7,129
2006 3,733 1,739 1,596 9,522
2007 4,846 2,273 1,873 10,705
Intermediate 2 Biology Chemistry Physics Mathematics
2000 2,525 1,211 1,603 8,802
2001 3,387 1,462 1,841 11,663
2002 3,364 1,369 1,850 12,452
2003 3,693 1,522 2,027 12,748
2004 4,260 2,005 1,949 12,457
2005 4,834 2,485 2,107 13,675
2006 4,881 3,157 2,427 15,148
2007 6,126 3,516 3,073 17,099
Source: Scottish Government.
Figure 3.80 Numbers and proportions of all entrants in all secondary schools in Scotland gaining A−C grades across biology, chemistry and physics Intermediate 1 (2000−2007)
100%
90%
80%
70%
60%
50%
40%
30%
20%
10%
0%2000 2001 2002 2003 2004 2005 2006 2007
2,0271,7881,5071,248677
27511731
33
103 287498
1,057 1,323
1,8002,168
2,2151,517
8826823121687931
A B C
Source: Scottish Government.
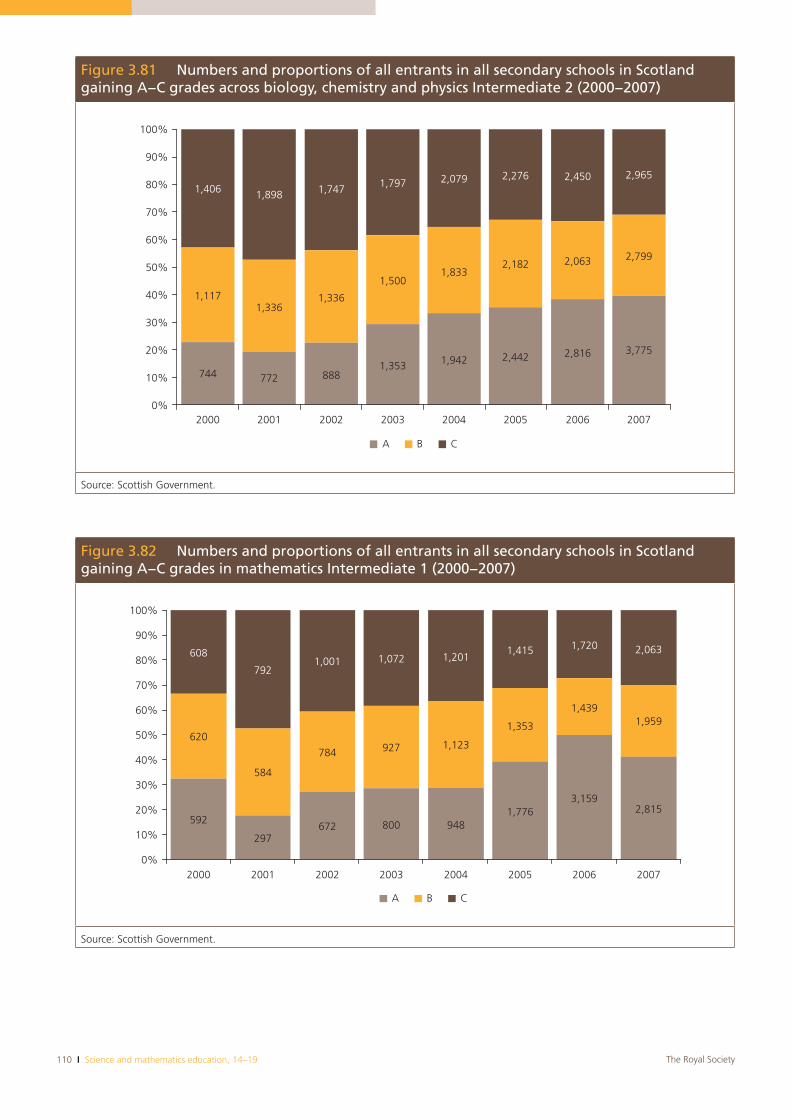
110 I Science and mathematics education, 14–19 The Royal Society
Figure 3.81 Numbers and proportions of all entrants in all secondary schools in Scotland gaining A−C grades across biology, chemistry and physics Intermediate 2 (2000−2007)
100%
90%
80%
70%
60%
50%
40%
30%
20%
10%
0%2000 2001 2002 2003 2004 2005 2006 2007
A B C
1,406
1,117
744 772 8881,353 1,942 2,442 2,816 3,775
1,3361,336
1,5001,833
2,182 2,063 2,799
1,898 1,747 1,797 2,079 2,276 2,450 2,965
Source: Scottish Government.
Figure 3.82 Numbers and proportions of all entrants in all secondary schools in Scotland gaining A−C grades in mathematics Intermediate 1 (2000−2007)
100%
90%
80%
70%
60%
50%
40%
30%
20%
10%
0%2000 2001 2002 2003 2004 2005 2006 2007
608
620
592
297672 800 948
1,7763,159
2,815
584
784 927 1,123
1,353
1,4391,959
7921,001 1,072 1,201
1,415 1,720 2,063
A B C
Source: Scottish Government.
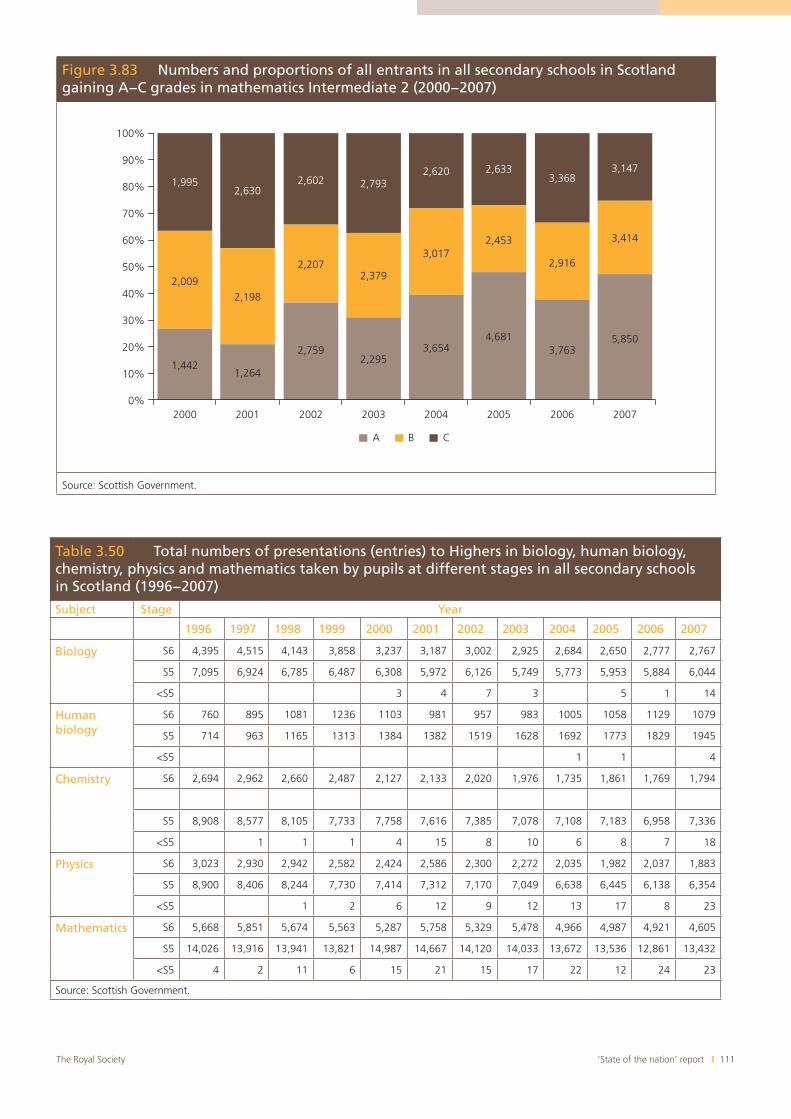
‘State of the nation’ report I 111The Royal Society
Table 3.50 Total numbers of presentations (entries) to Highers in biology, human biology, chemistry, physics and mathematics taken by pupils at different stages in all secondary schools in Scotland (1996−2007)
Subject Stage Year
1996 1997 1998 1999 2000 2001 2002 2003 2004 2005 2006 2007
Biology S6 4,395 4,515 4,143 3,858 3,237 3,187 3,002 2,925 2,684 2,650 2,777 2,767
S5 7,095 6,924 6,785 6,487 6,308 5,972 6,126 5,749 5,773 5,953 5,884 6,044
<S5 3 4 7 3 5 1 14
Humanbiology
S6 760 895 1081 1236 1103 981 957 983 1005 1058 1129 1079
S5 714 963 1165 1313 1384 1382 1519 1628 1692 1773 1829 1945
<S5 1 1 4
Chemistry S6 2,694 2,962 2,660 2,487 2,127 2,133 2,020 1,976 1,735 1,861 1,769 1,794
S5 8,908 8,577 8,105 7,733 7,758 7,616 7,385 7,078 7,108 7,183 6,958 7,336
<S5 1 1 1 4 15 8 10 6 8 7 18
Physics S6 3,023 2,930 2,942 2,582 2,424 2,586 2,300 2,272 2,035 1,982 2,037 1,883
S5 8,900 8,406 8,244 7,730 7,414 7,312 7,170 7,049 6,638 6,445 6,138 6,354
<S5 1 2 6 12 9 12 13 17 8 23
Mathematics S6 5,668 5,851 5,674 5,563 5,287 5,758 5,329 5,478 4,966 4,987 4,921 4,605
S5 14,026 13,916 13,941 13,821 14,987 14,667 14,120 14,033 13,672 13,536 12,861 13,432
<S5 4 2 11 6 15 21 15 17 22 12 24 23
Source: Scottish Government.
Figure 3.83 Numbers and proportions of all entrants in all secondary schools in Scotland gaining A−C grades in mathematics Intermediate 2 (2000−2007)
100%
90%
80%
70%
60%
50%
40%
30%
20%
10%
0%2000 2001
A B C
2002 2003 2004 2005 2006 2007
1,995
2,009
1,4421,264
2,7592,295
3,6544,681
3,7635,850
2,198
2,2072,379
3,0172,453
2,916
3,414
2,6302,602 2,793
2,620 2,6333,368
3,147
Source: Scottish Government.
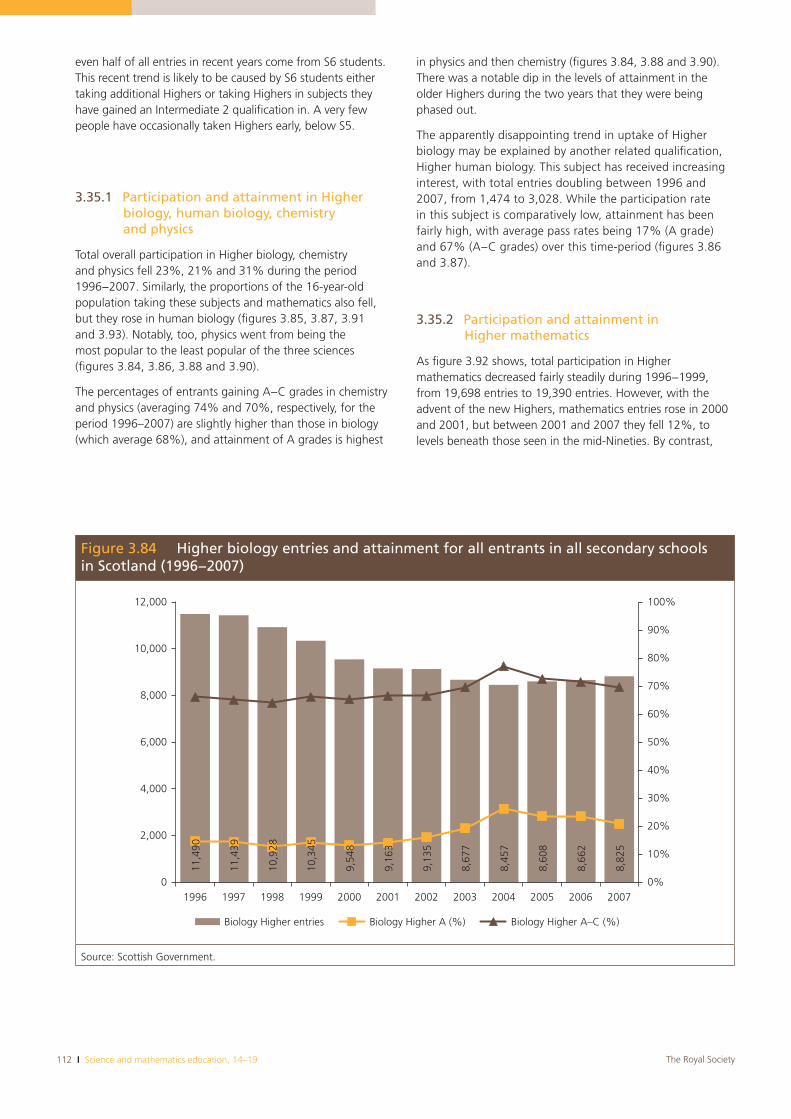
112 I Science and mathematics education, 14–19 The Royal Society
even half of all entries in recent years come from S6 students. This recent trend is likely to be caused by S6 students either taking additional Highers or taking Highers in subjects they have gained an Intermediate 2 qualification in. A very few people have occasionally taken Highers early, below S5.
3.35.1 Participation and attainment in Higher biology, human biology, chemistry and physics
Total overall participation in Higher biology, chemistry and physics fell 23%, 21% and 31% during the period 1996−2007. Similarly, the proportions of the 16-year-old population taking these subjects and mathematics also fell, but they rose in human biology (figures 3.85, 3.87, 3.91 and 3.93). Notably, too, physics went from being the most popular to the least popular of the three sciences (figures 3.84, 3.86, 3.88 and 3.90).
The percentages of entrants gaining A−C grades in chemistry and physics (averaging 74% and 70%, respectively, for the period 1996–2007) are slightly higher than those in biology (which average 68%), and attainment of A grades is highest
in physics and then chemistry (figures 3.84, 3.88 and 3.90). There was a notable dip in the levels of attainment in the older Highers during the two years that they were being phased out.
The apparently disappointing trend in uptake of Higher biology may be explained by another related qualification, Higher human biology. This subject has received increasing interest, with total entries doubling between 1996 and 2007, from 1,474 to 3,028. While the participation rate in this subject is comparatively low, attainment has been fairly high, with average pass rates being 17% (A grade) and 67% (A−C grades) over this time-period (figures 3.86 and 3.87).
3.35.2 Participation and attainment in Higher mathematics
As figure 3.92 shows, total participation in Higher mathematics decreased fairly steadily during 1996−1999, from 19,698 entries to 19,390 entries. However, with the advent of the new Highers, mathematics entries rose in 2000 and 2001, but between 2001 and 2007 they fell 12%, to levels beneath those seen in the mid-Nineties. By contrast,
Figure 3.84 Higher biology entries and attainment for all entrants in all secondary schools in Scotland (1996−2007)
11,4
90
11,4
39
10,9
28
10,3
45
9,54
8
9,16
3
9,13
5
8,67
7
8,45
7
8,60
8
8,66
2
8,82
5
0%
10%
20%
30%
40%
50%
60%
70%
80%
90%
100%
0
2,000
4,000
6,000
8,000
10,000
12,000
1996 1997 1998 1999 2000 2001 2002 2003 2004 2005 2006 2007
Biology Higher entries Biology Higher A (%) Biology Higher A–C (%)
Source: Scottish Government.
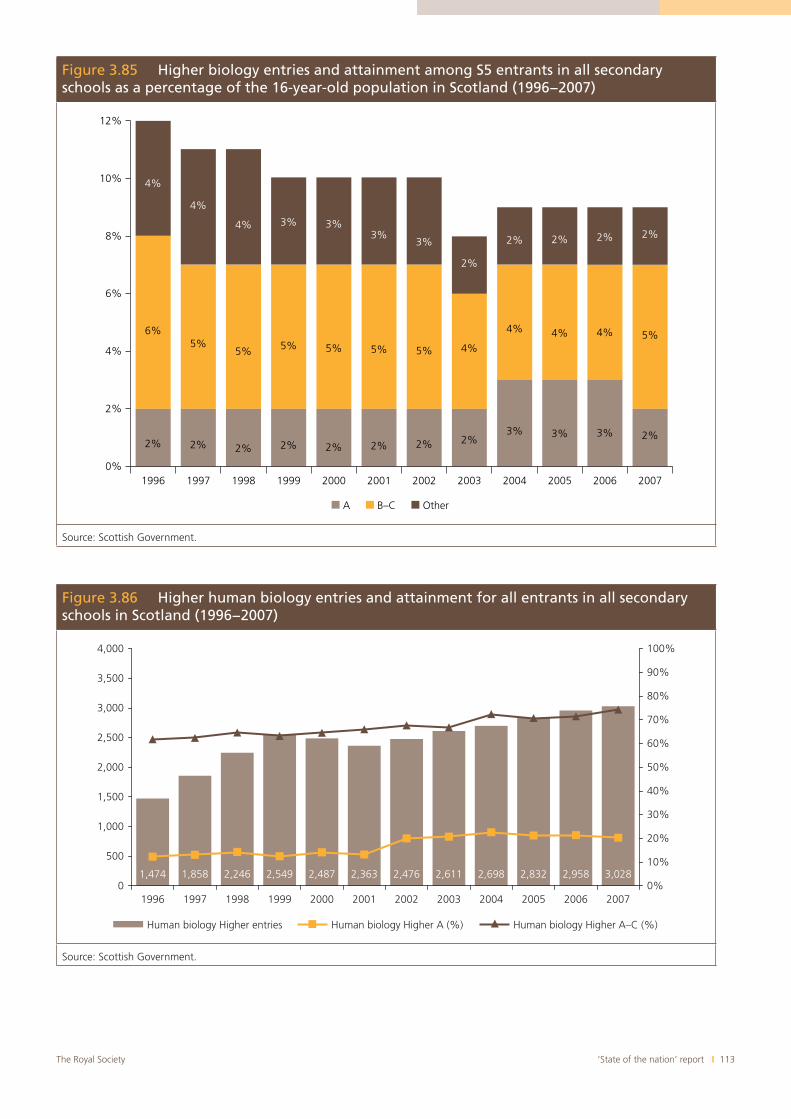
‘State of the nation’ report I 113The Royal Society
Figure 3.85 Higher biology entries and attainment among S5 entrants in all secondary schools as a percentage of the 16-year-old population in Scotland (1996−2007)
2% 2% 2% 2% 2% 2% 2% 2%3% 3% 3% 2%
6%5%
5% 5% 5% 5% 5% 4%
4% 4% 4% 5%
4%
4%
4% 3% 3%3%
3%
2%
2% 2% 2% 2%
0%
2%
4%
6%
8%
10%
12%
1996 1997 1998 1999 2000 2001 2002 2003 2004 2005 2006 2007
A B–C Other
Source: Scottish Government.
Figure 3.86 Higher human biology entries and attainment for all entrants in all secondary schools in Scotland (1996−2007)
1,474 1,858 2,246 2,549 2,487 2,363 2,476 2,611 2,698 2,832 2,958 3,0280%
10%
20%
30%
40%
50%
60%
70%
80%
90%
100%
500
0
1,000
1,500
2,000
2,500
3,000
3,500
4,000
1996 1997 1998 1999 2000 2001 2002 2003 2004 2005 2006 2007
Human biology Higher entries Human biology Higher A (%) Human biology Higher A–C (%)
Source: Scottish Government.
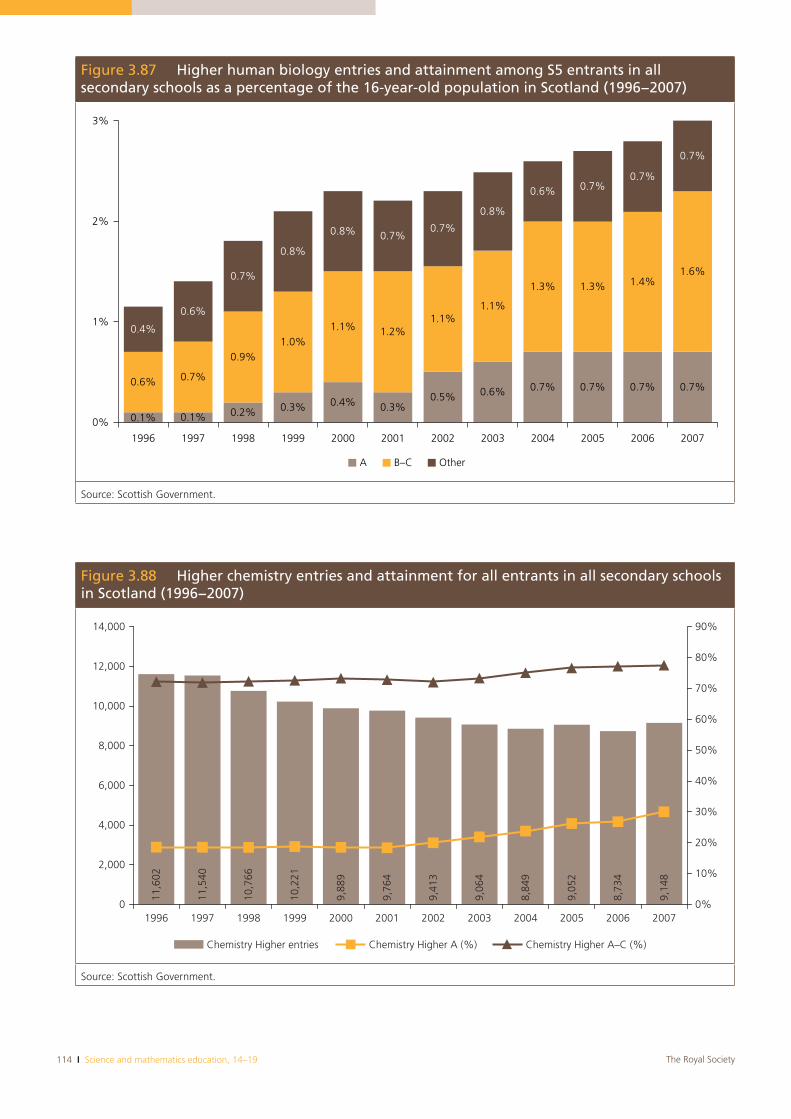
114 I Science and mathematics education, 14–19 The Royal Society
Figure 3.87 Higher human biology entries and attainment among S5 entrants in all secondary schools as a percentage of the 16-year-old population in Scotland (1996−2007)
0.1% 0.1% 0.2% 0.3% 0.4% 0.3%0.5% 0.6% 0.7% 0.7% 0.7% 0.7%0.6% 0.7%
0.9%1.0%
1.1% 1.2%1.1%
1.1%
1.3% 1.3% 1.4%1.6%
0.4%
0.6%
0.7%
0.8%
0.8% 0.7%0.7%
0.8%
0.6% 0.7%0.7%
0.7%
0%
1%
2%
3%
1996 1997 1998 1999 2000 2001 2002 2003 2004 2005 2006 2007
A B–C Other
Source: Scottish Government.
Figure 3.88 Higher chemistry entries and attainment for all entrants in all secondary schools in Scotland (1996−2007)
11,6
02
11,5
40
10,7
66
10,2
21
9,88
9
9,76
4
9,41
3
9,06
4
8,84
9
9,05
2
8,73
4
9,14
8
0%
10%
20%
30%
40%
50%
60%
70%
80%
90%
0
2,000
4,000
6,000
8,000
10,000
12,000
14,000
1996 1997 1998 1999 2000 2001 2002 2003 2004 2005 2006 2007
Chemistry Higher entries Chemistry Higher A (%) Chemistry Higher A–C (%)
Source: Scottish Government.
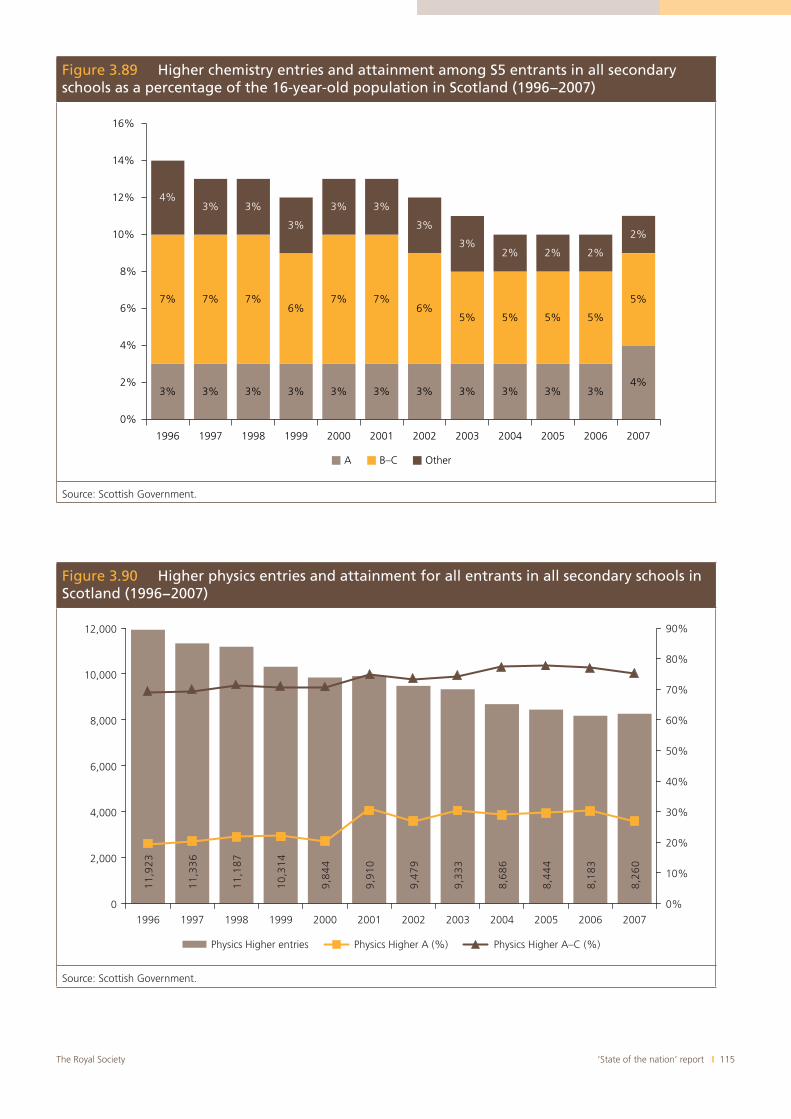
‘State of the nation’ report I 115The Royal Society
Figure 3.89 Higher chemistry entries and attainment among S5 entrants in all secondary schools as a percentage of the 16-year-old population in Scotland (1996−2007)
3% 3% 3% 3% 3% 3% 3% 3% 3% 3% 3%4%
7% 7%6%
5% 5%
5%
4%3%
7%
3%
7%
3%
7%
3%
3%
6%
3%
3%2%
5%
2%
5%
2%
2%
0%
2%
4%
6%
8%
10%
12%
14%
16%
1996 1997 1998 1999 2000 2001 2002 2003 2004 2005 2006 2007
A B–C Other
Source: Scottish Government.
Figure 3.90 Higher physics entries and attainment for all entrants in all secondary schools in Scotland (1996−2007)
0%
10%
20%
30%
40%
50%
60%
70%
80%
90%
0
2,000
4,000
6,000
8,000
10,000
12,000
1996 1997 1998 1999 2000 2001 2002 2003 2004 2005 2006 2007
Physics Higher entries Physics Higher A (%) Physics Higher A–C (%)
32
9,1
1
63
3,1
1
78
1,1
1
41
3,0
1
44
8,9
01
9,9
97
4,9
33
3,9
68
6,8
44
4,8
38
1,8
06
2,8
Source: Scottish Government.

116 I Science and mathematics education, 14–19 The Royal Society
Figure 3.91 Higher physics entries and attainment among S5 entrants in all secondary schools as a percentage of the 16-year-old population in Scotland (1996−2007)
3% 3%4%
3% 4% 3% 3% 3% 3%
7% 6%
3%
6%
3%
6%5%
4%5%
4%
4%
4% 3% 3%
3%
6%
3% 3%
5%
3% 3%2%
5%
2%
2%
4%
2%
0%
2%
4%
6%
8%
10%
12%
14%
16%
1996 1997 1998 1999 2000 2001 2002 2003 2004 2005 2006 2007
A B–C Other
Source: Scottish Government.
Figure 3.92 Higher mathematics entries and attainment for all entrants in all secondary schools in Scotland (1996−2007)
19,6
98
19,7
69
19,6
26
19,3
90
20,2
89
20,4
46
19,4
64
19,5
28
18,6
60
18,5
35
17,8
06
18,0
60
0%
10%
20%
30%
40%
50%
60%
70%
80%
90%
100%
0
2,000
4,000
6,000
8,000
10,000
12,000
14,000
16,000
18,000
20,000
22,000
1996 1997 1998 1999 2000 2001 2002 2003 2004 2005 2006 2007
Mathematics Higher entries Mathematics Higher A (%) Mathematics Higher A–C (%)
Source: Scottish Government.
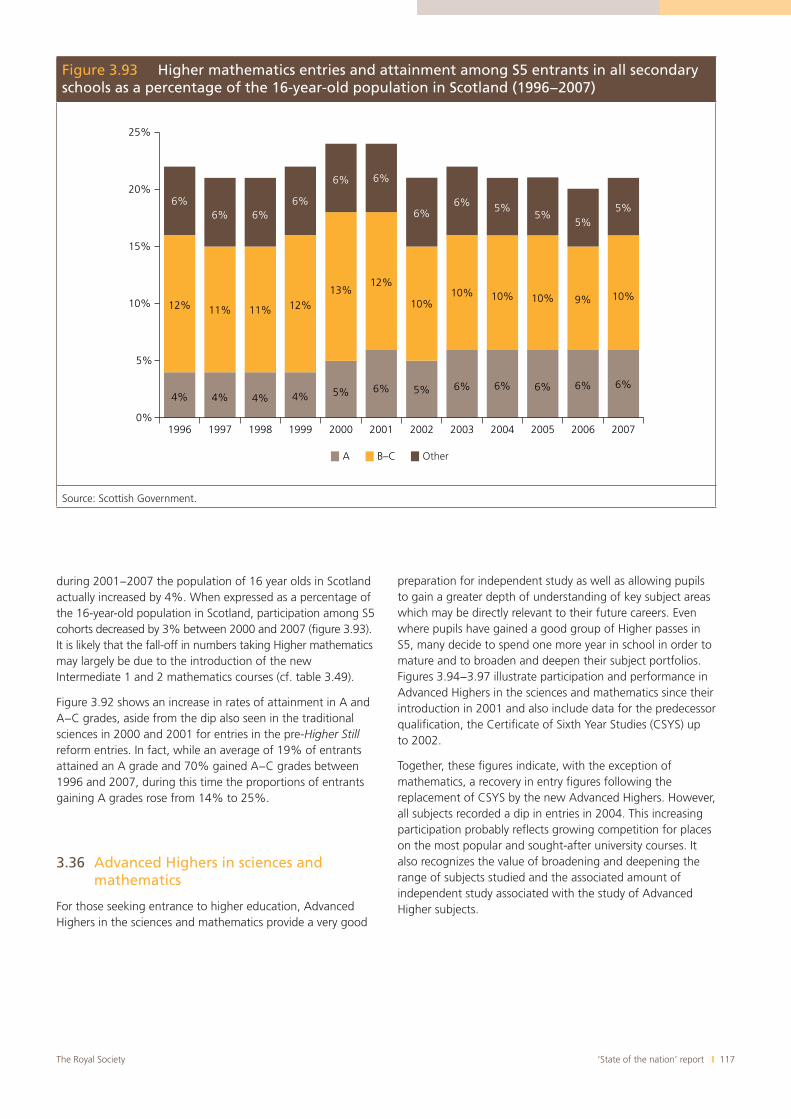
‘State of the nation’ report I 117The Royal Society
during 2001−2007 the population of 16 year olds in Scotland actually increased by 4%. When expressed as a percentage of the 16-year-old population in Scotland, participation among S5 cohorts decreased by 3% between 2000 and 2007 (figure 3.93). It is likely that the fall-off in numbers taking Higher mathematics may largely be due to the introduction of the new Intermediate 1 and 2 mathematics courses (cf. table 3.49).
Figure 3.92 shows an increase in rates of attainment in A and A−C grades, aside from the dip also seen in the traditional sciences in 2000 and 2001 for entries in the pre-Higher Still reform entries. In fact, while an average of 19% of entrants attained an A grade and 70% gained A−C grades between 1996 and 2007, during this time the proportions of entrants gaining A grades rose from 14% to 25%.
3.36 Advanced Highers in sciences and mathematics
For those seeking entrance to higher education, Advanced Highers in the sciences and mathematics provide a very good
preparation for independent study as well as allowing pupils to gain a greater depth of understanding of key subject areas which may be directly relevant to their future careers. Even where pupils have gained a good group of Higher passes in S5, many decide to spend one more year in school in order to mature and to broaden and deepen their subject portfolios. Figures 3.94−3.97 illustrate participation and performance in Advanced Highers in the sciences and mathematics since their introduction in 2001 and also include data for the predecessor qualification, the Certificate of Sixth Year Studies (CSYS) up to 2002.
Together, these figures indicate, with the exception of mathematics, a recovery in entry figures following the replacement of CSYS by the new Advanced Highers. However, all subjects recorded a dip in entries in 2004. This increasing participation probably reflects growing competition for places on the most popular and sought-after university courses. It also recognizes the value of broadening and deepening the range of subjects studied and the associated amount of independent study associated with the study of Advanced Higher subjects.
Figure 3.93 Higher mathematics entries and attainment among S5 entrants in all secondary schools as a percentage of the 16-year-old population in Scotland (1996−2007)
4% 4% 4% 4% 5% 6% 5% 6% 6% 6% 6% 6%
12% 11%
13%10%
10% 10% 9%
6%
12%
6%
12%
6%6%
11%
6%
6%
6%
10%
6% 5%
10%
5%5%
5%
0%
5%
10%
15%
20%
25%
1996 1997 1998 1999 2000 2001 2002 2003 2004 2005 2006 2007
A B–C Other
Source: Scottish Government.
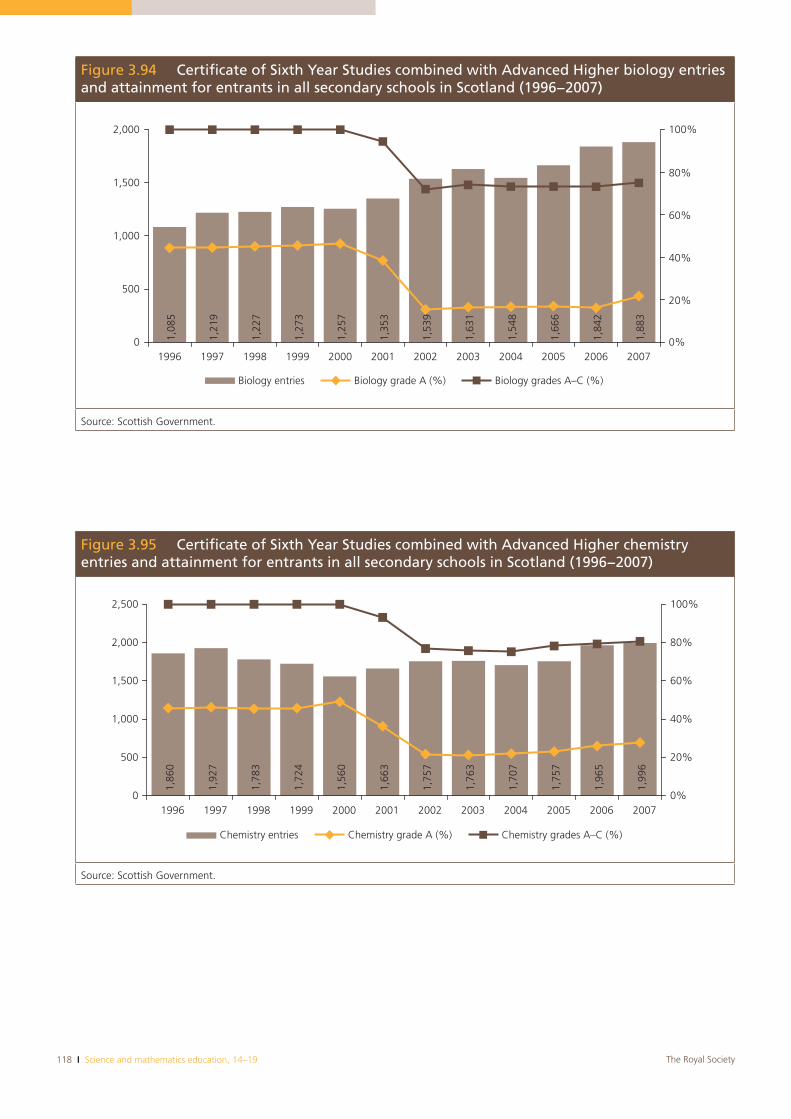
118 I Science and mathematics education, 14–19 The Royal Society
Figure 3.94 Certificate of Sixth Year Studies combined with Advanced Higher biology entries and attainment for entrants in all secondary schools in Scotland (1996−2007)
1,08
5
1,21
9
1,22
7
1,27
3
1,25
7
1,35
3
1,53
9
1,63
1
1,54
8
1,66
6
1,84
2
1,88
3
0%
20%
40%
60%
80%
100%
0
500
1,000
1,500
2,000
1996 1997 1998 1999 2000 2001 2002 2003 2004 2005 2006 2007
Biology entries Biology grade A (%) Biology grades A–C (%)
Source: Scottish Government.
Figure 3.95 Certificate of Sixth Year Studies combined with Advanced Higher chemistry entries and attainment for entrants in all secondary schools in Scotland (1996−2007)
1,86
0
1,92
7
1,78
3
1,72
4
1,56
0
1,66
3
1,75
7
1,76
3
1,70
7
1,75
7
1,96
5
1,99
6
0%
20%
40%
60%
80%
100%
0
500
1,000
1,500
2,000
2,500
1996 1997 1998 1999 2000 2001 2002 2003 2004 2005 2006 2007
Chemistry entries Chemistry grade A (%) Chemistry grades A–C (%)
Source: Scottish Government.
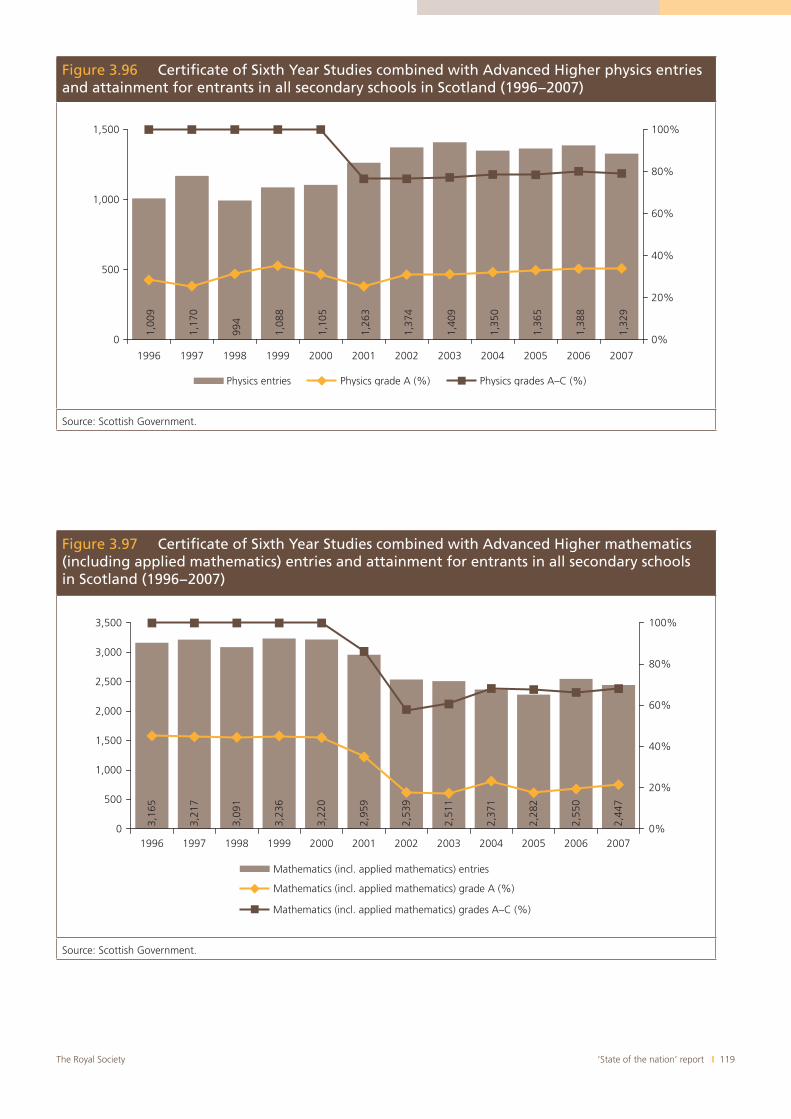
‘State of the nation’ report I 119The Royal Society
Figure 3.97 Certificate of Sixth Year Studies combined with Advanced Higher mathematics (including applied mathematics) entries and attainment for entrants in all secondary schools in Scotland (1996−2007)
3,16
5
3,21
7
3,09
1
3,23
6
3,22
0
2,95
9
2,53
9
2,51
1
2,37
1
2,28
2
2,55
0
2,44
7
0%
20%
40%
60%
80%
100%
0
500
1,000
1,500
2,000
2,500
3,000
3,500
1996 1997 1998 1999 2000 2001 2002 2003 2004 2005 2006 2007
Mathematics (incl. applied mathematics) entries
Mathematics (incl. applied mathematics) grade A (%)
Mathematics (incl. applied mathematics) grades A–C (%)
Source: Scottish Government.
Figure 3.96 Certificate of Sixth Year Studies combined with Advanced Higher physics entries and attainment for entrants in all secondary schools in Scotland (1996−2007)
1,00
9
1,17
0
994
1,08
8
1,10
5
1,26
3
1,37
4
1,40
9
1,35
0
1,36
5
1,38
8
1,32
9
0%
20%
40%
60%
80%
100%
0
500
1,000
1,500
1996 1997 1998 1999 2000 2001 2002 2003 2004 2005 2006 2007
Physics entries Physics grade A (%) Physics grades A–C (%)
Source: Scottish Government.
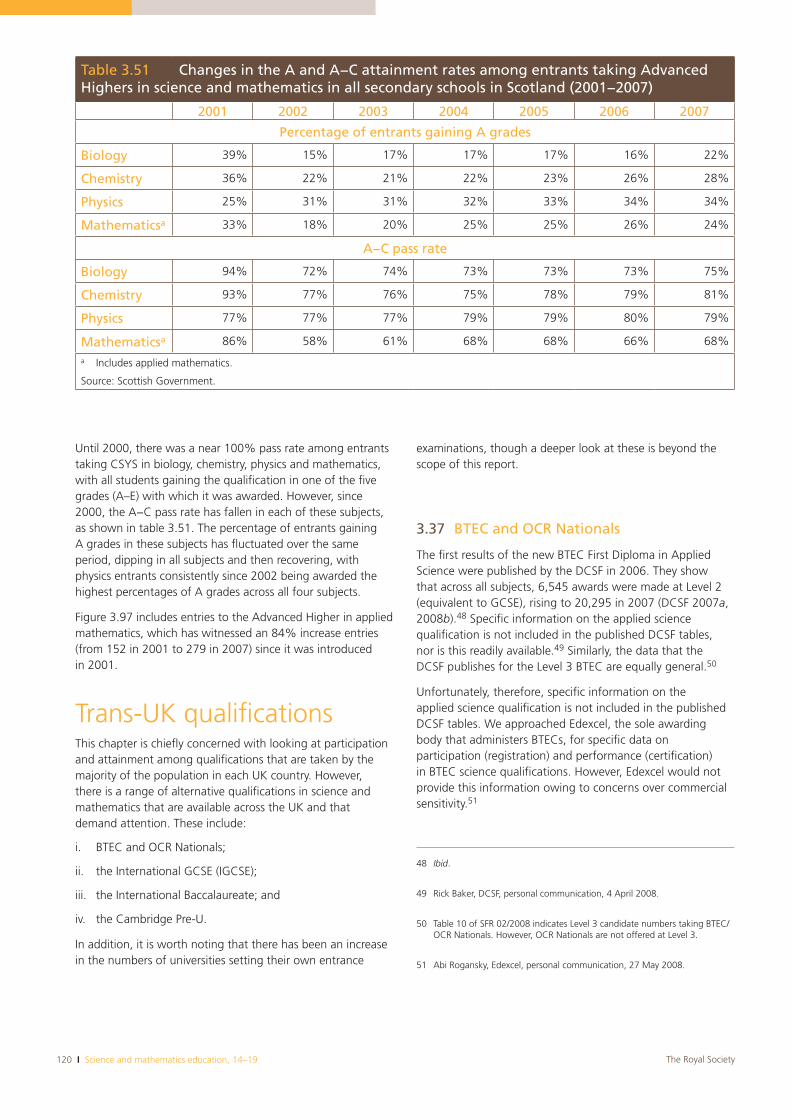
120 I Science and mathematics education, 14–19 The Royal Society
Until 2000, there was a near 100% pass rate among entrants taking CSYS in biology, chemistry, physics and mathematics, with all students gaining the qualification in one of the five grades (A–E) with which it was awarded. However, since 2000, the A−C pass rate has fallen in each of these subjects, as shown in table 3.51. The percentage of entrants gaining A grades in these subjects has fluctuated over the same period, dipping in all subjects and then recovering, with physics entrants consistently since 2002 being awarded the highest percentages of A grades across all four subjects.
Figure 3.97 includes entries to the Advanced Higher in applied mathematics, which has witnessed an 84% increase entries (from 152 in 2001 to 279 in 2007) since it was introduced in 2001.
Trans-UK qualificationsThis chapter is chiefly concerned with looking at participation and attainment among qualifications that are taken by the majority of the population in each UK country. However, there is a range of alternative qualifications in science and mathematics that are available across the UK and that demand attention. These include:
BTEC and OCR Nationals;i.
the International GCSE (IGCSE);ii.
the International Baccalaureate; andiii.
the Cambridge Pre-U.iv.
In addition, it is worth noting that there has been an increase in the numbers of universities setting their own entrance
examinations, though a deeper look at these is beyond the scope of this report.
3.37 BTEC and OCR Nationals
The first results of the new BTEC First Diploma in Applied Science were published by the DCSF in 2006. They show that across all subjects, 6,545 awards were made at Level 2 (equivalent to GCSE), rising to 20,295 in 2007 (DCSF 2007a,2008b).48 Specific information on the applied science qualification is not included in the published DCSF tables, nor is this readily available.49 Similarly, the data that the DCSF publishes for the Level 3 BTEC are equally general.50
Unfortunately, therefore, specific information on the applied science qualification is not included in the published DCSF tables. We approached Edexcel, the sole awarding body that administers BTECs, for specific data on participation (registration) and performance (certification) in BTEC science qualifications. However, Edexcel would not provide this information owing to concerns over commercial sensitivity.51
48 Ibid.
49 Rick Baker, DCSF, personal communication, 4 April 2008.
50 Table 10 of SFR 02/2008 indicates Level 3 candidate numbers taking BTEC/OCR Nationals. However, OCR Nationals are not offered at Level 3.
51 Abi Rogansky, Edexcel, personal communication, 27 May 2008.
Table 3.51 Changes in the A and A−C attainment rates among entrants taking Advanced Highers in science and mathematics in all secondary schools in Scotland (2001−2007)
2001 2002 2003 2004 2005 2006 2007
Percentage of entrants gaining A grades
Biology 39% 15% 17% 17% 17% 16% 22%
Chemistry 36% 22% 21% 22% 23% 26% 28%
Physics 25% 31% 31% 32% 33% 34% 34%
Mathematicsa 33% 18% 20% 25% 25% 26% 24%
A−C pass rate
Biology 94% 72% 74% 73% 73% 73% 75%
Chemistry 93% 77% 76% 75% 78% 79% 81%
Physics 77% 77% 77% 79% 79% 80% 79%
Mathematicsa 86% 58% 61% 68% 68% 66% 68%
a Includes applied mathematics.
Source: Scottish Government.
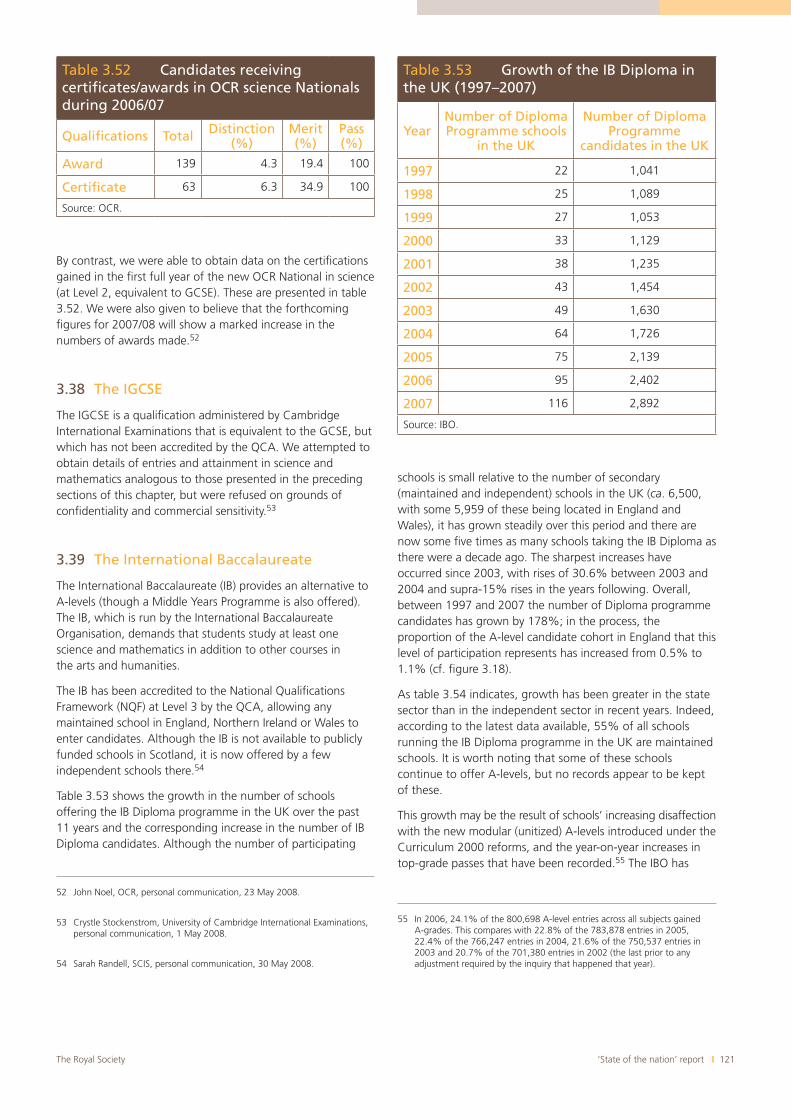
‘State of the nation’ report I 121The Royal Society
By contrast, we were able to obtain data on the certifications gained in the first full year of the new OCR National in science (at Level 2, equivalent to GCSE). These are presented in table 3.52. We were also given to believe that the forthcoming figures for 2007/08 will show a marked increase in the numbers of awards made.52
3.38 The IGCSE
The IGCSE is a qualification administered by Cambridge International Examinations that is equivalent to the GCSE, but which has not been accredited by the QCA. We attempted to obtain details of entries and attainment in science and mathematics analogous to those presented in the preceding sections of this chapter, but were refused on grounds of confidentiality and commercial sensitivity.53
3.39 The International Baccalaureate
The International Baccalaureate (IB) provides an alternative to A-levels (though a Middle Years Programme is also offered). The IB, which is run by the International Baccalaureate Organisation, demands that students study at least one science and mathematics in addition to other courses in the arts and humanities.
The IB has been accredited to the National Qualifications Framework (NQF) at Level 3 by the QCA, allowing any maintained school in England, Northern Ireland or Wales to enter candidates. Although the IB is not available to publicly funded schools in Scotland, it is now offered by a few independent schools there.54
Table 3.53 shows the growth in the number of schools offering the IB Diploma programme in the UK over the past 11 years and the corresponding increase in the number of IB Diploma candidates. Although the number of participating
52 John Noel, OCR, personal communication, 23 May 2008.
53 Crystle Stockenstrom, University of Cambridge International Examinations, personal communication, 1 May 2008.
54 Sarah Randell, SCIS, personal communication, 30 May 2008.
schools is small relative to the number of secondary (maintained and independent) schools in the UK (ca. 6,500, with some 5,959 of these being located in England and Wales), it has grown steadily over this period and there are now some five times as many schools taking the IB Diploma as there were a decade ago. The sharpest increases have occurred since 2003, with rises of 30.6% between 2003 and 2004 and supra-15% rises in the years following. Overall, between 1997 and 2007 the number of Diploma programme candidates has grown by 178%; in the process, the proportion of the A-level candidate cohort in England that this level of participation represents has increased from 0.5% to 1.1% (cf. figure 3.18).
As table 3.54 indicates, growth has been greater in the state sector than in the independent sector in recent years. Indeed, according to the latest data available, 55% of all schools running the IB Diploma programme in the UK are maintained schools. It is worth noting that some of these schools continue to offer A-levels, but no records appear to be kept of these.
This growth may be the result of schools’ increasing disaffection with the new modular (unitized) A-levels introduced under the Curriculum 2000 reforms, and the year-on-year increases in top-grade passes that have been recorded.55 The IBO has
55 In 2006, 24.1% of the 800,698 A-level entries across all subjects gained A-grades. This compares with 22.8% of the 783,878 entries in 2005, 22.4% of the 766,247 entries in 2004, 21.6% of the 750,537 entries in 2003 and 20.7% of the 701,380 entries in 2002 (the last prior to any adjustment required by the inquiry that happened that year).
Table 3.52 Candidates receiving certificates/awards in OCR science Nationals during 2006/07
Qualifications Total Distinction(%)
Merit(%)
Pass(%)
Award 139 4.3 19.4 100
Certificate 63 6.3 34.9 100
Source: OCR.
Table 3.53 Growth of the IB Diploma in the UK (1997–2007)
YearNumber of Diploma Programme schools
in the UK
Number of Diploma Programme
candidates in the UK
1997 22 1,041
1998 25 1,089
1999 27 1,053
2000 33 1,129
2001 38 1,235
2002 43 1,454
2003 49 1,630
2004 64 1,726
2005 75 2,139
2006 95 2,402
2007 116 2,892
Source: IBO.
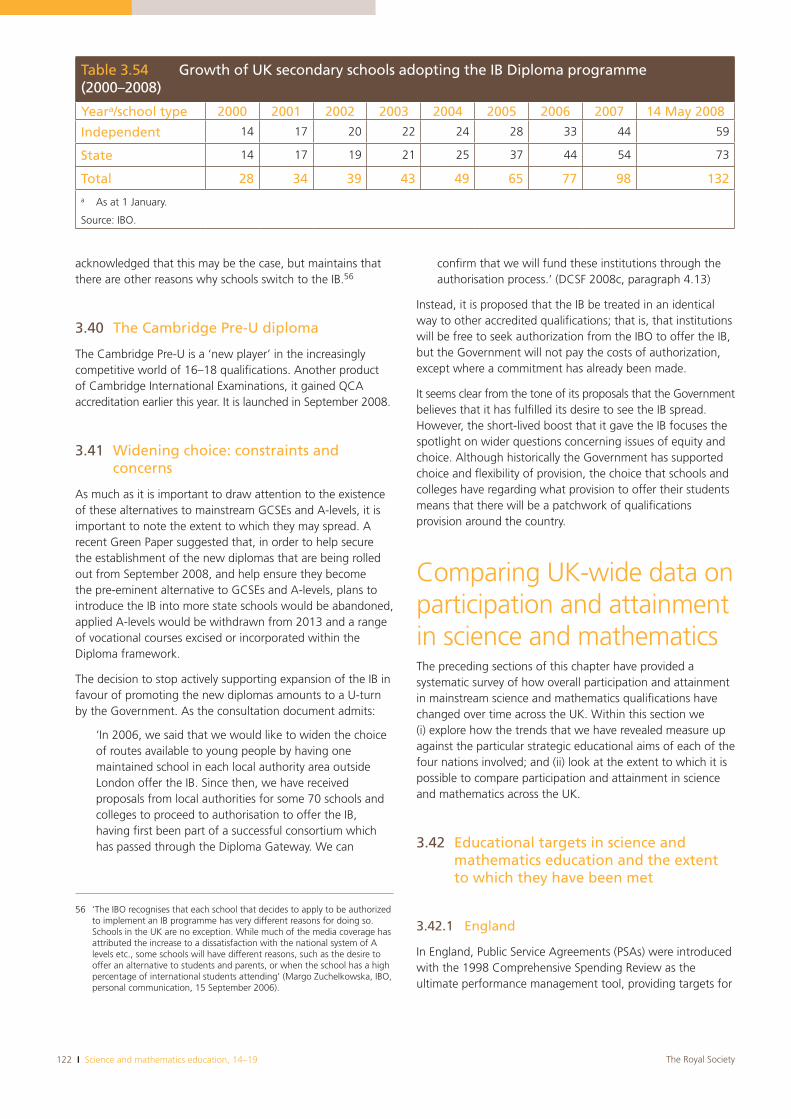
122 I Science and mathematics education, 14–19 The Royal Society
acknowledged that this may be the case, but maintains that there are other reasons why schools switch to the IB.56
3.40 The Cambridge Pre-U diploma
The Cambridge Pre-U is a ‘new player’ in the increasingly competitive world of 16–18 qualifications. Another product of Cambridge International Examinations, it gained QCA accreditation earlier this year. It is launched in September 2008.
3.41 Widening choice: constraints and concerns
As much as it is important to draw attention to the existence of these alternatives to mainstream GCSEs and A-levels, it is important to note the extent to which they may spread. A recent Green Paper suggested that, in order to help secure the establishment of the new diplomas that are being rolled out from September 2008, and help ensure they become the pre-eminent alternative to GCSEs and A-levels, plans to introduce the IB into more state schools would be abandoned, applied A-levels would be withdrawn from 2013 and a range of vocational courses excised or incorporated within the Diploma framework.
The decision to stop actively supporting expansion of the IB in favour of promoting the new diplomas amounts to a U-turn by the Government. As the consultation document admits:
‘In 2006, we said that we would like to widen the choice of routes available to young people by having one maintained school in each local authority area outside London offer the IB. Since then, we have received proposals from local authorities for some 70 schools and colleges to proceed to authorisation to offer the IB, having first been part of a successful consortium which has passed through the Diploma Gateway. We can
56 ‘The IBO recognises that each school that decides to apply to be authorized to implement an IB programme has very different reasons for doing so. Schools in the UK are no exception. While much of the media coverage has attributed the increase to a dissatisfaction with the national system of A levels etc., some schools will have different reasons, such as the desire to offer an alternative to students and parents, or when the school has a high percentage of international students attending’ (Margo Zuchelkowska, IBO, personal communication, 15 September 2006).
confirm that we will fund these institutions through the authorisation process.’ (DCSF 2008c, paragraph 4.13)
Instead, it is proposed that the IB be treated in an identical way to other accredited qualifications; that is, that institutions will be free to seek authorization from the IBO to offer the IB, but the Government will not pay the costs of authorization, except where a commitment has already been made.
It seems clear from the tone of its proposals that the Government believes that it has fulfilled its desire to see the IB spread. However, the short-lived boost that it gave the IB focuses the spotlight on wider questions concerning issues of equity and choice. Although historically the Government has supported choice and flexibility of provision, the choice that schools and colleges have regarding what provision to offer their students means that there will be a patchwork of qualifications provision around the country.
Comparing UK-wide data on participation and attainment in science and mathematicsThe preceding sections of this chapter have provided a systematic survey of how overall participation and attainment in mainstream science and mathematics qualifications have changed over time across the UK. Within this section we (i) explore how the trends that we have revealed measure up against the particular strategic educational aims of each of the four nations involved; and (ii) look at the extent to which it is possible to compare participation and attainment in science and mathematics across the UK.
3.42 Educational targets in science and mathematics education and the extent to which they have been met
3.42.1 England
In England, Public Service Agreements (PSAs) were introduced with the 1998 Comprehensive Spending Review as the ultimate performance management tool, providing targets for
Table 3.54 Growth of UK secondary schools adopting the IB Diploma programme (2000–2008)
Yeara/school type 2000 2001 2002 2003 2004 2005 2006 2007 14 May 2008
Independent 14 17 20 22 24 28 33 44 59
State 14 17 19 21 25 37 44 54 73
Total 28 34 39 43 49 65 77 98 132a As at 1 January.
Source: IBO.
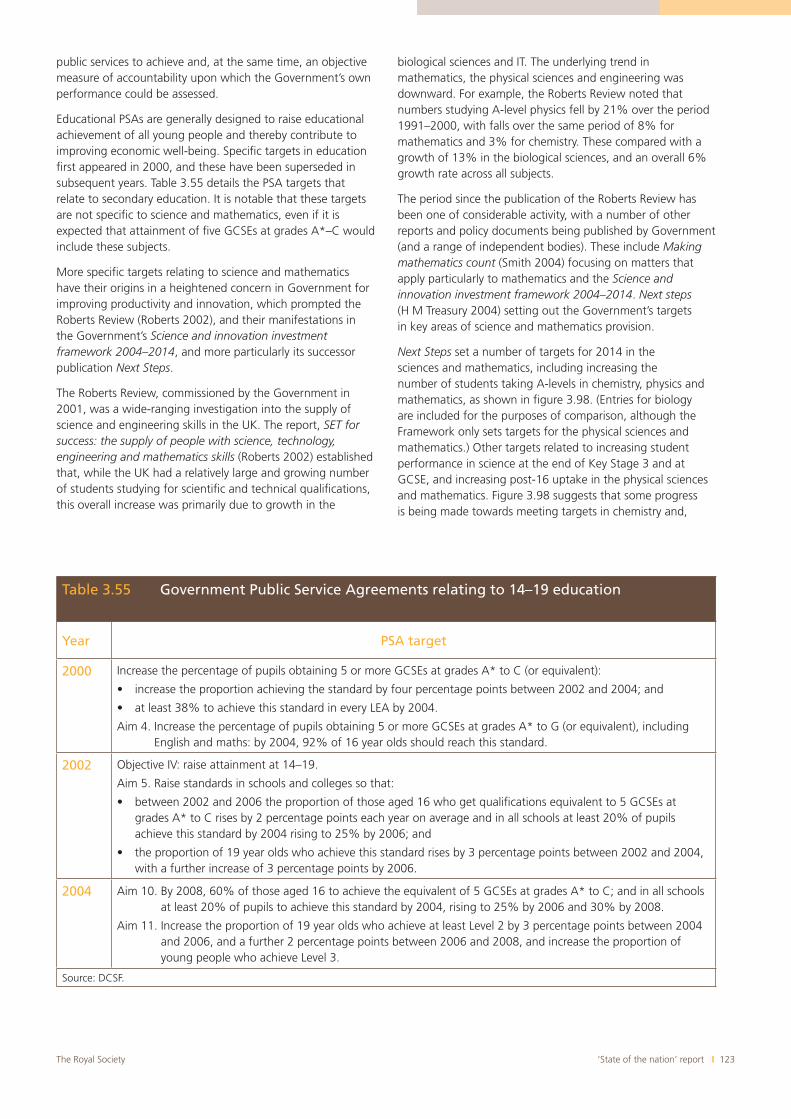
‘State of the nation’ report I 123The Royal Society
public services to achieve and, at the same time, an objective measure of accountability upon which the Government’s own performance could be assessed.
Educational PSAs are generally designed to raise educational achievement of all young people and thereby contribute to improving economic well-being. Specific targets in education first appeared in 2000, and these have been superseded in subsequent years. Table 3.55 details the PSA targets that relate to secondary education. It is notable that these targets are not specific to science and mathematics, even if it is expected that attainment of five GCSEs at grades A*–C would include these subjects.
More specific targets relating to science and mathematics have their origins in a heightened concern in Government for improving productivity and innovation, which prompted the Roberts Review (Roberts 2002), and their manifestations in the Government’s Science and innovation investment framework 2004–2014, and more particularly its successor publication Next Steps.
The Roberts Review, commissioned by the Government in 2001, was a wide-ranging investigation into the supply of science and engineering skills in the UK. The report, SET for success: the supply of people with science, technology, engineering and mathematics skills (Roberts 2002) established that, while the UK had a relatively large and growing number of students studying for scientific and technical qualifications, this overall increase was primarily due to growth in the
biological sciences and IT. The underlying trend in mathematics, the physical sciences and engineering was downward. For example, the Roberts Review noted that numbers studying A-level physics fell by 21% over the period 1991–2000, with falls over the same period of 8% for mathematics and 3% for chemistry. These compared with a growth of 13% in the biological sciences, and an overall 6% growth rate across all subjects.
The period since the publication of the Roberts Review has been one of considerable activity, with a number of other reports and policy documents being published by Government (and a range of independent bodies). These include Makingmathematics count (Smith 2004) focusing on matters that apply particularly to mathematics and the Science and innovation investment framework 2004–2014. Next steps(H M Treasury 2004) setting out the Government’s targets in key areas of science and mathematics provision.
Next Steps set a number of targets for 2014 in the sciences and mathematics, including increasing the number of students taking A-levels in chemistry, physics and mathematics, as shown in figure 3.98. (Entries for biology are included for the purposes of comparison, although the Framework only sets targets for the physical sciences and mathematics.) Other targets related to increasing student performance in science at the end of Key Stage 3 and at GCSE, and increasing post-16 uptake in the physical sciences and mathematics. Figure 3.98 suggests that some progress is being made towards meeting targets in chemistry and,
Table 3.55 Government Public Service Agreements relating to 14–19 education
Year PSA target
2000 Increase the percentage of pupils obtaining 5 or more GCSEs at grades A* to C (or equivalent):
Aim 4. Increase the percentage of pupils obtaining 5 or more GCSEs at grades A* to G (or equivalent), including English and maths: by 2004, 92% of 16 year olds should reach this standard.
2002 Objective IV: raise attainment at 14–19.
Aim 5. Raise standards in schools and colleges so that:
grades A* to C rises by 2 percentage points each year on average and in all schools at least 20% of pupils achieve this standard by 2004 rising to 25% by 2006; and
with a further increase of 3 percentage points by 2006.
2004 Aim 10. By 2008, 60% of those aged 16 to achieve the equivalent of 5 GCSEs at grades A* to C; and in all schools at least 20% of pupils to achieve this standard by 2004, rising to 25% by 2006 and 30% by 2008.
Aim 11. Increase the proportion of 19 year olds who achieve at least Level 2 by 3 percentage points between 2004 and 2006, and a further 2 percentage points between 2006 and 2008, and increase the proportion of young people who achieve Level 3.
Source: DCSF.
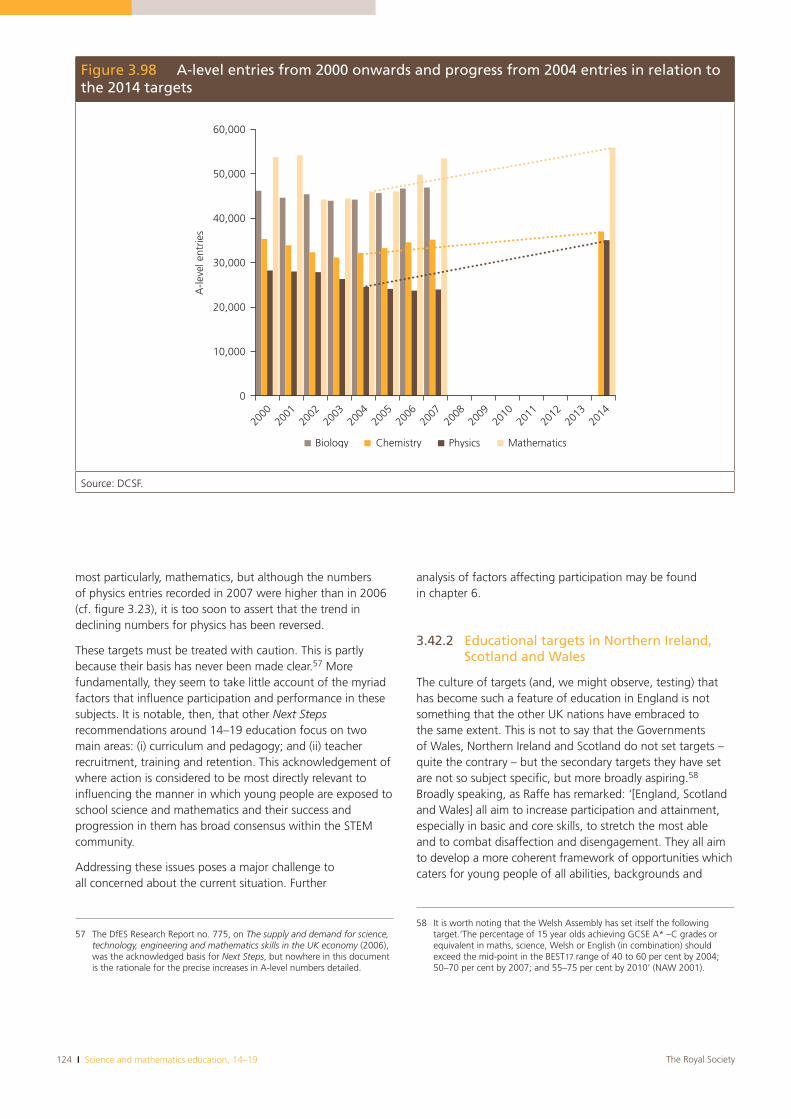
124 I Science and mathematics education, 14–19 The Royal Society
most particularly, mathematics, but although the numbers of physics entries recorded in 2007 were higher than in 2006 (cf. figure 3.23), it is too soon to assert that the trend in declining numbers for physics has been reversed.
These targets must be treated with caution. This is partly because their basis has never been made clear.57 More fundamentally, they seem to take little account of the myriad factors that influence participation and performance in these subjects. It is notable, then, that other Next Stepsrecommendations around 14–19 education focus on two main areas: (i) curriculum and pedagogy; and (ii) teacher recruitment, training and retention. This acknowledgement of where action is considered to be most directly relevant to influencing the manner in which young people are exposed to school science and mathematics and their success and progression in them has broad consensus within the STEM community.
Addressing these issues poses a major challenge to all concerned about the current situation. Further
57 The DfES Research Report no. 775, on The supply and demand for science, technology, engineering and mathematics skills in the UK economy (2006),was the acknowledged basis for Next Steps, but nowhere in this document is the rationale for the precise increases in A-level numbers detailed.
analysis of factors affecting participation may be found in chapter 6.
3.42.2 Educational targets in Northern Ireland, Scotland and Wales
The culture of targets (and, we might observe, testing) that has become such a feature of education in England is not something that the other UK nations have embraced to the same extent. This is not to say that the Governments of Wales, Northern Ireland and Scotland do not set targets – quite the contrary – but the secondary targets they have set are not so subject specific, but more broadly aspiring.58
Broadly speaking, as Raffe has remarked: ‘[England, Scotland and Wales] all aim to increase participation and attainment, especially in basic and core skills, to stretch the most able and to combat disaffection and disengagement. They all aim to develop a more coherent framework of opportunities which caters for young people of all abilities, backgrounds and
58 It is worth noting that the Welsh Assembly has set itself the following target.’The percentage of 15 year olds achieving GCSE A* –C grades or equivalent in maths, science, Welsh or English (in combination) should exceed the mid-point in the BEST17 range of 40 to 60 per cent by 2004; 50–70 per cent by 2007; and 55–75 per cent by 2010’ (NAW 2001).
Figure 3.98 A-level entries from 2000 onwards and progress from 2004 entries in relation to the 2014 targets
10,000
20,000
30,000
A-le
vel e
ntrie
s
40,000
50,000
60,000
0
2000
2001
2002
2003
2004
2005
2006
2007
2008
2009
2010
2011
2012
2013
2014
Biology Chemistry Physics Mathematics
Source: DCSF.
‘State of the nation’ report I 125The Royal Society
interests, provides more choice (especially of vocational options at 14) and facilitates flexible progression. They all aim to reduce the assessment burden, to encourage collaboration among providers and to strengthen vocational learning, including apprenticeship’ (Raffe 2005).
3.43 Assessing the ‘state’ of the nation: comparing participation and attainment in secondary science and mathematics education within and across the UK
Measuring the success of UK 14–19 science and mathematics in terms of examination participation and attainment is a challenge, owing to the different educational systems in operation across the UK and differences in the way that data are collected in those nations whose provision has historically been so similar. In fact, while there are historic similarities in the education systems of England, Northern Ireland and Wales, Scotland’s system is singular and does not lend itself easily to comparison. In chapter 4 of this report international methods of assessing prowess in science and mathematics are described and evaluated, which provide alternative standardized measures to assess the performance of secondary pupils within the UK (and to compare such performance with that of pupils internationally).
Moreover, in order to come to any firm conclusions about the ‘state’ of UK 14−19 science and mathematics education, it is necessary to have a clear idea of the targets that are being aimed at, or a sense of a relative point of reference in time when 14−19 science and mathematics education was considered to be in good health. As we have seen, the former only exist in a limited capacity. The latter is not possible as there is no clear agreement about a time when the system was in good health, if ever it was, not to mention the many contextual changes which would be found between any such time and now. Further, the UK is a federation of nations whose educational jurisdiction does not extend beyond their individual borders; it is worthwhile noting that while the Next Steps ambitions are explicitly UK-wide, its education targets relate only to England.
The following comparisons are concerned purely with traditional academic qualifications, reflecting the better availability of information on these subjects.
3.43.1 Comparing GCSE participation and attainment across England, Northern Ireland and Wales
This analysis takes account of the years 2000–2007, a time-period for which data on all subjects are available across England, Northern Ireland and Wales.
Figures 3.99−3.102 set trends in participation in science and mathematics GCSEs across these nations during this period in the context of the populations of 15 year olds in each
country. These show that the relative proportions of the 15-year-old population participating in these subjects appear to be very different. Perhaps the most striking observations are that single-award science is taken by a much higher percentage of the population in Northern Ireland than that in England or Wales, and that a higher proportion of 15 year olds in Wales takes triple science than is the case in England or Northern Ireland.
3.43.1.1 GCSE double-award science
On average, 73% of 15 year olds in England took double-award science between 2000 and 2007 compared with 48% in Northern Ireland and 64% in Wales. However, of these, an average of 54% of pupils in England taking double-award science gained A*–C grades while, equivalently, 82% of entrants in Northern Ireland and 55% of entrants in Wales were awarded A*–C grades.
3.43.1.2 GCSE single-award science
Participation in single-award science GCSE increased between 2000 and 2007 in England and Wales, but fell in Northern Ireland. However, as a percentage of the 15-year-old cohort in these nations, an average of 35% of entrants took this subject in Northern Ireland compared with 9% and 12%, respectively, in England and Wales. The comparatively high participation rate in Northern Ireland is indicative that the perception of this GCSE here is very different from that in England and Wales, it being the science GCSE of choice both for people who are ambitious to pursue post-16 education in non-science subjects and, most particularly, for those who are less able or less engaged in education.
3.43.1.3 GCSE separate sciences and triple science
Using, as previously, physics as a proxy for triple science, participation in the separate sciences between 2000 and 2007 increased by 35% in England and 10% in Wales, but fell 18% in Northern Ireland. The fluctuations in Northern Ireland and Wales broadly reflect the oscillating populations of these nations, but the increase in England is more than three times higher than the rate of population increase. This rapid increase in England evidences impact of another of the Next Steps ambitions:
‘by September 2008, all pupils achieving at least Level 6 at Key Stage 3 to be entitled to study triple science GCSE, for example through collaborative arrangements with other schools, FE colleges and universities;
by September 2008, ensure that all specialist science schools offer triple science at least to all pupils achieving Level 6+ at the end of Key Stage 3; and
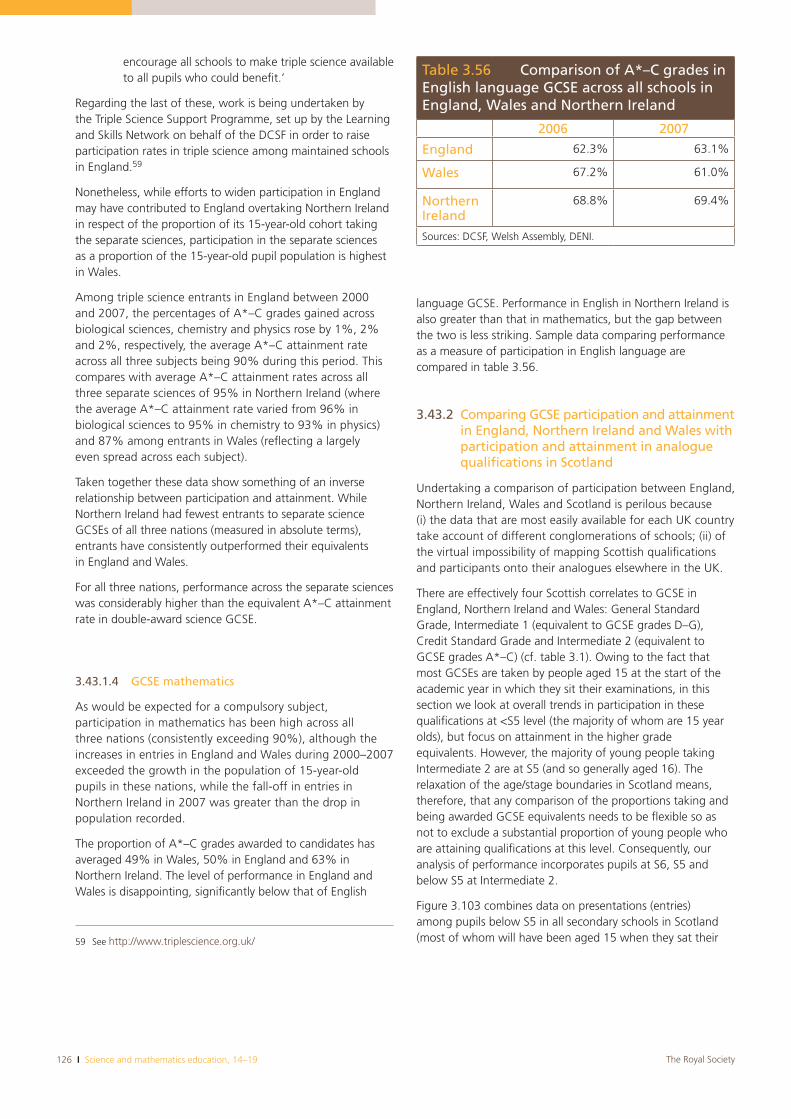
126 I Science and mathematics education, 14–19 The Royal Society
encourage all schools to make triple science available to all pupils who could benefit.’
Regarding the last of these, work is being undertaken by the Triple Science Support Programme, set up by the Learning and Skills Network on behalf of the DCSF in order to raise participation rates in triple science among maintained schools in England.59
Nonetheless, while efforts to widen participation in England may have contributed to England overtaking Northern Ireland in respect of the proportion of its 15-year-old cohort taking the separate sciences, participation in the separate sciences as a proportion of the 15-year-old pupil population is highest in Wales.
Among triple science entrants in England between 2000 and 2007, the percentages of A*–C grades gained across biological sciences, chemistry and physics rose by 1%, 2% and 2%, respectively, the average A*–C attainment rate across all three subjects being 90% during this period. This compares with average A*–C attainment rates across all three separate sciences of 95% in Northern Ireland (where the average A*–C attainment rate varied from 96% in biological sciences to 95% in chemistry to 93% in physics) and 87% among entrants in Wales (reflecting a largely even spread across each subject).
Taken together these data show something of an inverse relationship between participation and attainment. While Northern Ireland had fewest entrants to separate science GCSEs of all three nations (measured in absolute terms), entrants have consistently outperformed their equivalents in England and Wales.
For all three nations, performance across the separate sciences was considerably higher than the equivalent A*–C attainment rate in double-award science GCSE.
3.43.1.4 GCSE mathematics
As would be expected for a compulsory subject, participation in mathematics has been high across all three nations (consistently exceeding 90%), although the increases in entries in England and Wales during 2000–2007 exceeded the growth in the population of 15-year-old pupils in these nations, while the fall-off in entries in Northern Ireland in 2007 was greater than the drop in population recorded.
The proportion of A*–C grades awarded to candidates has averaged 49% in Wales, 50% in England and 63% in Northern Ireland. The level of performance in England and Wales is disappointing, significantly below that of English
59 See http://www.triplescience.org.uk/
language GCSE. Performance in English in Northern Ireland is also greater than that in mathematics, but the gap between the two is less striking. Sample data comparing performance as a measure of participation in English language are compared in table 3.56.
3.43.2 Comparing GCSE participation and attainment in England, Northern Ireland and Wales with participation and attainment in analogue qualifications in Scotland
Undertaking a comparison of participation between England, Northern Ireland, Wales and Scotland is perilous because (i) the data that are most easily available for each UK country take account of different conglomerations of schools; (ii) of the virtual impossibility of mapping Scottish qualifications and participants onto their analogues elsewhere in the UK.
There are effectively four Scottish correlates to GCSE in England, Northern Ireland and Wales: General Standard Grade, Intermediate 1 (equivalent to GCSE grades D–G), Credit Standard Grade and Intermediate 2 (equivalent to GCSE grades A*–C) (cf. table 3.1). Owing to the fact that most GCSEs are taken by people aged 15 at the start of the academic year in which they sit their examinations, in this section we look at overall trends in participation in these qualifications at <S5 level (the majority of whom are 15 year olds), but focus on attainment in the higher grade equivalents. However, the majority of young people taking Intermediate 2 are at S5 (and so generally aged 16). The relaxation of the age/stage boundaries in Scotland means, therefore, that any comparison of the proportions taking and being awarded GCSE equivalents needs to be flexible so as not to exclude a substantial proportion of young people who are attaining qualifications at this level. Consequently, our analysis of performance incorporates pupils at S6, S5 and below S5 at Intermediate 2.
Figure 3.103 combines data on presentations (entries) among pupils below S5 in all secondary schools in Scotland (most of whom will have been aged 15 when they sat their
Table 3.56 Comparison of A*–C grades in English language GCSE across all schools in England, Wales and Northern Ireland
2006 2007
England 62.3% 63.1%
Wales 67.2% 61.0%
NorthernIreland
68.8% 69.4%
Sources: DCSF, Welsh Assembly, DENI.
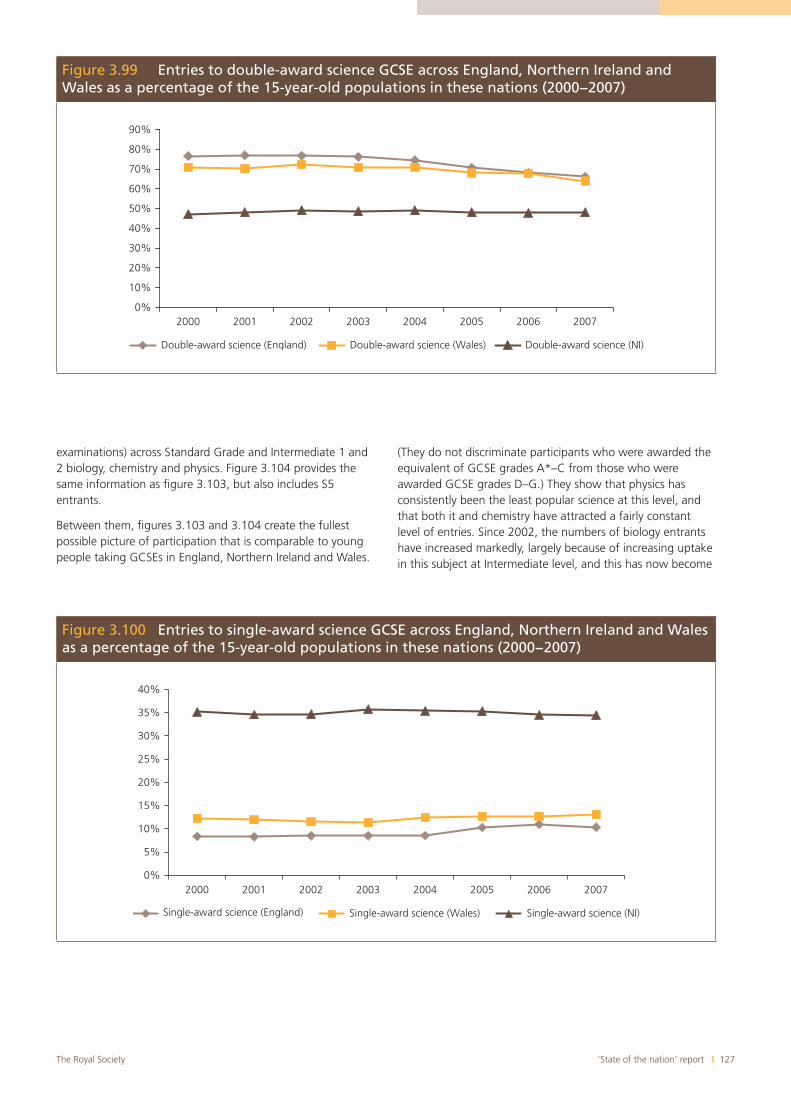
‘State of the nation’ report I 127The Royal Society
Figure 3.99 Entries to double-award science GCSE across England, Northern Ireland and Wales as a percentage of the 15-year-old populations in these nations (2000−2007)
0%
10%
20%
30%
40%
50%
60%
70%
80%
90%
2000 2001 2002 2003 2004 2005 2006 2007
Double-award science (England) Double-award science (Wales) Double-award science (NI)
Figure 3.100 Entries to single-award science GCSE across England, Northern Ireland and Wales as a percentage of the 15-year-old populations in these nations (2000−2007)
0%
5%
10%
15%
20%
25%
30%
35%
40%
2000 2001 2002 2003 2004 2005 2006 2007
Single-award science (England) Single-award science (Wales) Single-award science (NI)
examinations) across Standard Grade and Intermediate 1 and 2 biology, chemistry and physics. Figure 3.104 provides the same information as figure 3.103, but also includes S5 entrants.
Between them, figures 3.103 and 3.104 create the fullest possible picture of participation that is comparable to young people taking GCSEs in England, Northern Ireland and Wales.
(They do not discriminate participants who were awarded the equivalent of GCSE grades A*–C from those who were awarded GCSE grades D–G.) They show that physics has consistently been the least popular science at this level, and that both it and chemistry have attracted a fairly constant level of entries. Since 2002, the numbers of biology entrants have increased markedly, largely because of increasing uptake in this subject at Intermediate level, and this has now become
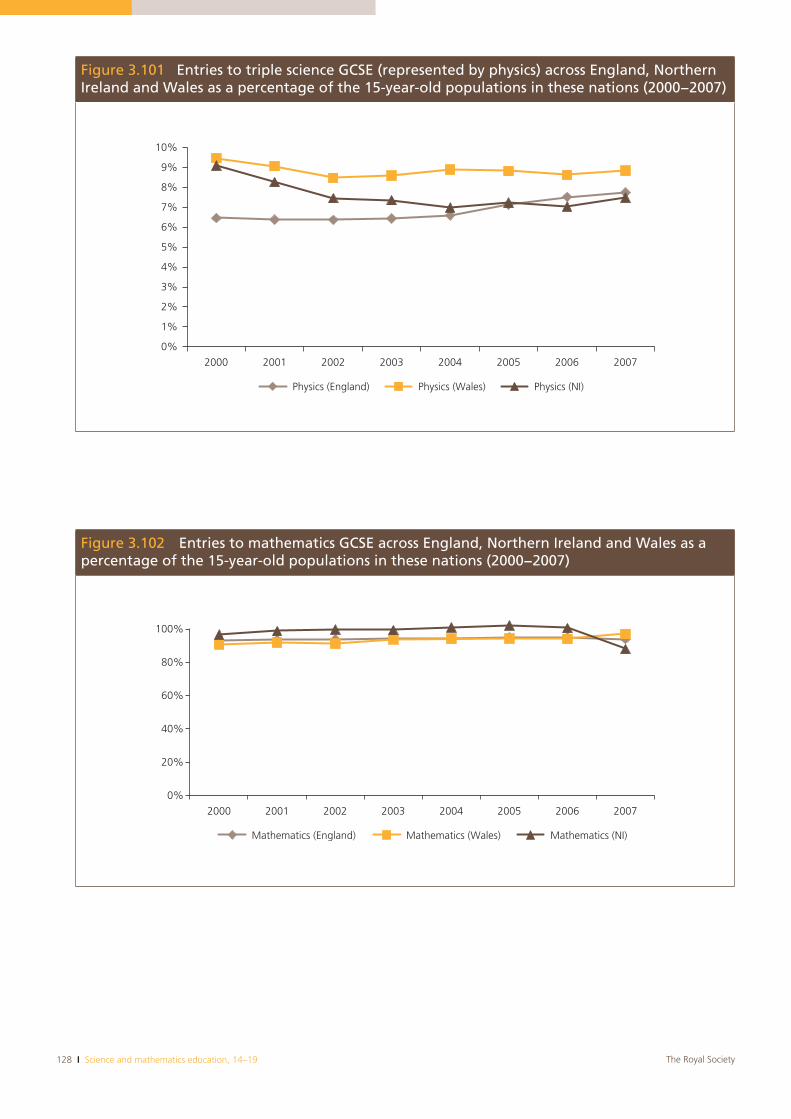
128 I Science and mathematics education, 14–19 The Royal Society
Figure 3.101 Entries to triple science GCSE (represented by physics) across England, Northern Ireland and Wales as a percentage of the 15-year-old populations in these nations (2000−2007)
0%
1%
2%
3%
4%
5%
6%
7%
8%
9%
10%
2000 2001 2002 2003 2004 2005 2006 2007
Physics (England) Physics (Wales) Physics (NI)
Figure 3.102 Entries to mathematics GCSE across England, Northern Ireland and Wales as a percentage of the 15-year-old populations in these nations (2000−2007)
0%
20%
40%
60%
80%
100%
2000 2001 2002 2003 2004 2005 2006 2007
Mathematics (England) Mathematics (Wales) Mathematics (NI)
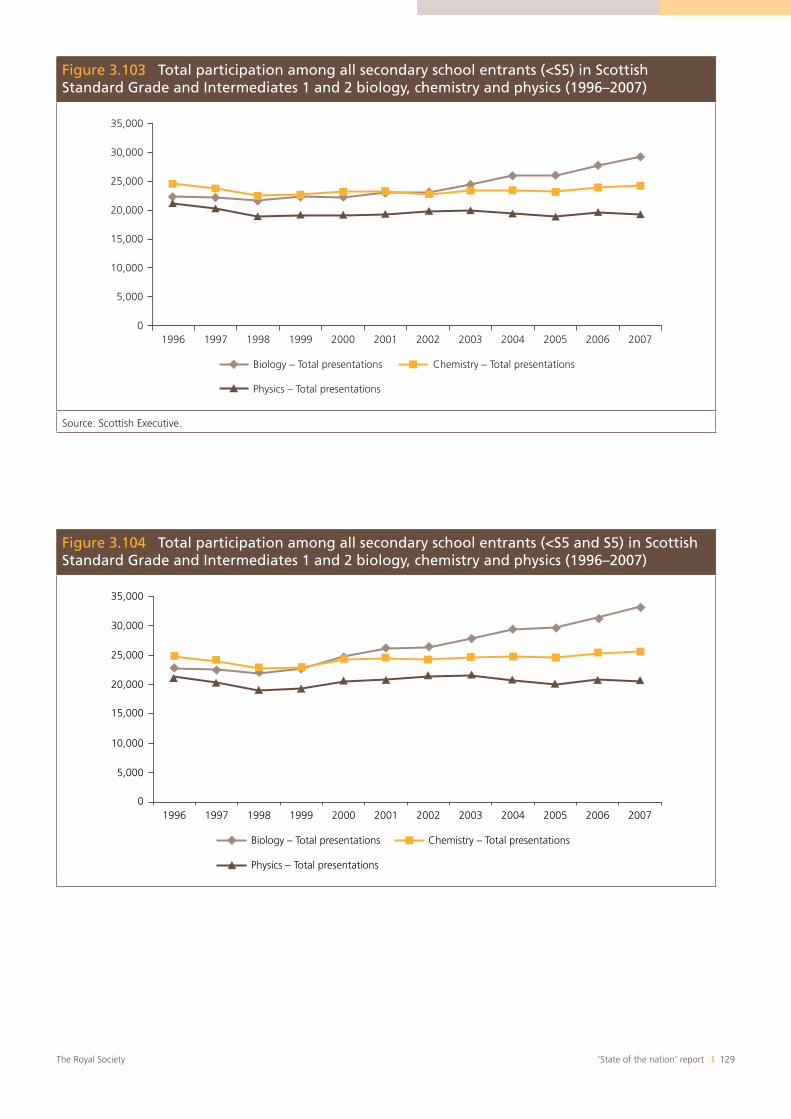
‘State of the nation’ report I 129The Royal Society
Figure 3.104 Total participation among all secondary school entrants (<S5 and S5) in Scottish Standard Grade and Intermediates 1 and 2 biology, chemistry and physics (1996–2007)
35,000
30,000
25,000
20,000
15,000
5,000
01996 1997 1998 1999 2000 2001 2002 2003 2004 2005 2006 2007
10,000
Biology – Total presentations Chemistry – Total presentations
Physics – Total presentations
Figure 3.103 Total participation among all secondary school entrants (<S5) in Scottish Standard Grade and Intermediates 1 and 2 biology, chemistry and physics (1996–2007)
35,000
30,000
25,000
20,000
15,000
5,000
01996 1997 1998 1999 2000 2001 2002 2003 2004 2005 2006 2007
10,000
Biology – Total presentations
Physics – Total presentations
Chemistry – Total presentations
Source: Scottish Executive.
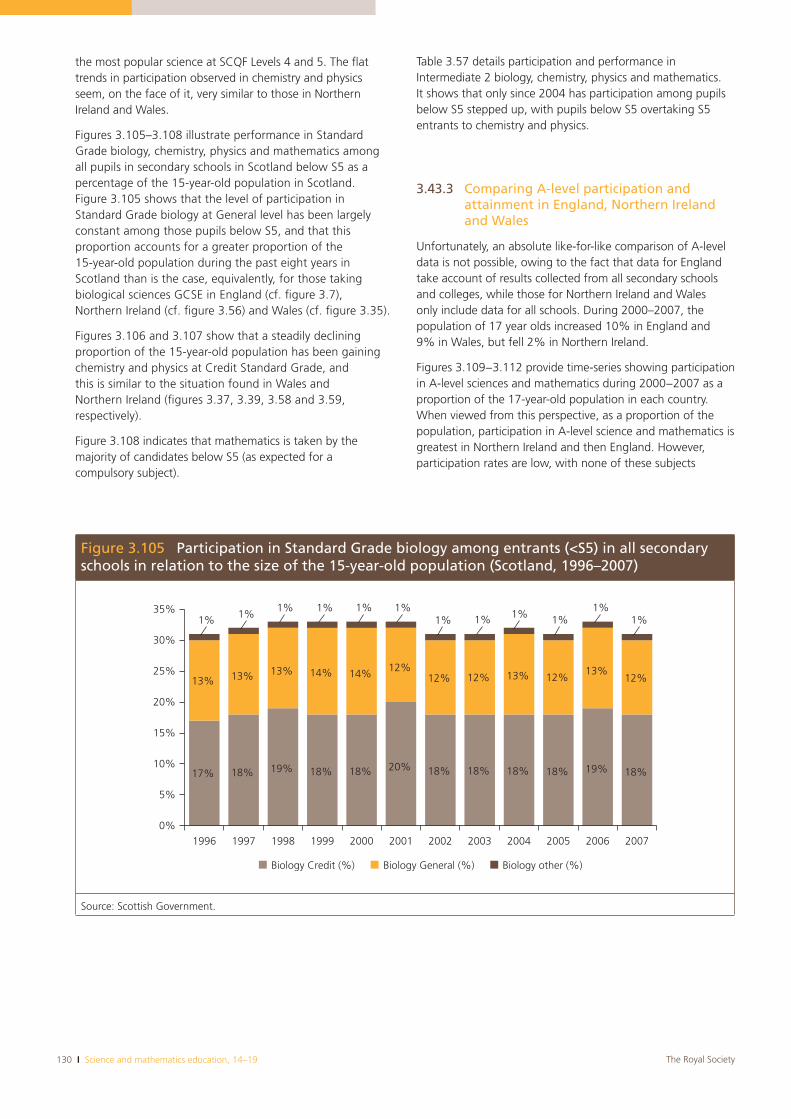
130 I Science and mathematics education, 14–19 The Royal Society
the most popular science at SCQF Levels 4 and 5. The flat trends in participation observed in chemistry and physics seem, on the face of it, very similar to those in Northern Ireland and Wales.
Figures 3.105–3.108 illustrate performance in Standard Grade biology, chemistry, physics and mathematics among all pupils in secondary schools in Scotland below S5 as a percentage of the 15-year-old population in Scotland. Figure 3.105 shows that the level of participation in Standard Grade biology at General level has been largely constant among those pupils below S5, and that this proportion accounts for a greater proportion of the 15-year-old population during the past eight years in Scotland than is the case, equivalently, for those taking biological sciences GCSE in England (cf. figure 3.7), Northern Ireland (cf. figure 3.56) and Wales (cf. figure 3.35).
Figures 3.106 and 3.107 show that a steadily declining proportion of the 15-year-old population has been gaining chemistry and physics at Credit Standard Grade, and this is similar to the situation found in Wales and Northern Ireland (figures 3.37, 3.39, 3.58 and 3.59, respectively).
Figure 3.108 indicates that mathematics is taken by the majority of candidates below S5 (as expected for a compulsory subject).
Table 3.57 details participation and performance in Intermediate 2 biology, chemistry, physics and mathematics. It shows that only since 2004 has participation among pupils below S5 stepped up, with pupils below S5 overtaking S5 entrants to chemistry and physics.
3.43.3 Comparing A-level participation and attainment in England, Northern Ireland and Wales
Unfortunately, an absolute like-for-like comparison of A-level data is not possible, owing to the fact that data for England take account of results collected from all secondary schools and colleges, while those for Northern Ireland and Wales only include data for all schools. During 2000–2007, the population of 17 year olds increased 10% in England and 9% in Wales, but fell 2% in Northern Ireland.
Figures 3.109−3.112 provide time-series showing participation in A-level sciences and mathematics during 2000−2007 as a proportion of the 17-year-old population in each country. When viewed from this perspective, as a proportion of the population, participation in A-level science and mathematics is greatest in Northern Ireland and then England. However, participation rates are low, with none of these subjects
Figure 3.105 Participation in Standard Grade biology among entrants (<S5) in all secondary schools in relation to the size of the 15-year-old population (Scotland, 1996–2007)
17% 18% 19% 18% 18% 20% 18% 18% 18% 18% 19% 18%
13% 13% 13% 14% 14% 12%12% 12% 13% 12%
13%12%
1%
0%
5%
10%
15%
20%
25%
30%
35%
1996 1997 1998 1999 2000 2001 2002 2003 2004 2005 2006 2007
Biology Credit (%) Biology General (%) Biology other (%)
1%1%1%1%1%
1%1%1%1%1%1%
Source: Scottish Government.
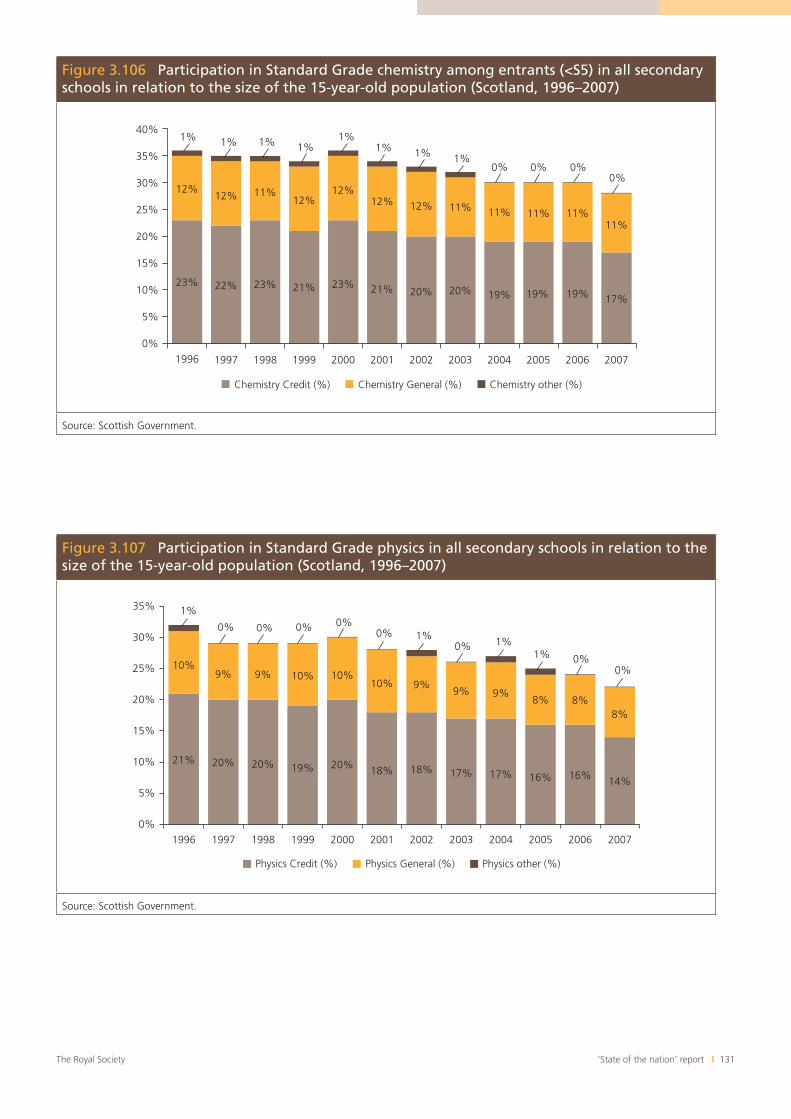
‘State of the nation’ report I 131The Royal Society
Figure 3.106 Participation in Standard Grade chemistry among entrants (<S5) in all secondary schools in relation to the size of the 15-year-old population (Scotland, 1996–2007)
23% 22% 23% 21% 23% 21% 20% 20% 19% 19% 19% 17%
12%12% 11%
12%12%
12% 12% 11% 11% 11% 11%11%
0%0%
0%
5%
10%
15%
20%
25%
30%
35%
40%
1996 1997 1998 1999 2000 2001 2002 2003 2004 2005 2006 2007
Chemistry Credit (%) Chemistry General (%) Chemistry other (%)
0%0%1%1%1%
1%1%1%1%1%
Source: Scottish Government.
Figure 3.107 Participation in Standard Grade physics in all secondary schools in relation to the size of the 15-year-old population (Scotland, 1996–2007)
21% 20% 20% 19% 20% 18% 18% 17% 17% 16% 16% 14%
10%9% 9% 10% 10%
10% 9%9% 9%
8% 8%8%
1%
0% 0% 0% 0%0% 1%
0% 1%1% 0%
0%
0%
5%
10%
15%
20%
25%
30%
35%
1996 1997 1998 1999 2000 2001 2002 2003 2004 2005 2006 2007
Physics Credit (%) Physics General (%) Physics other (%)
Source: Scottish Government.
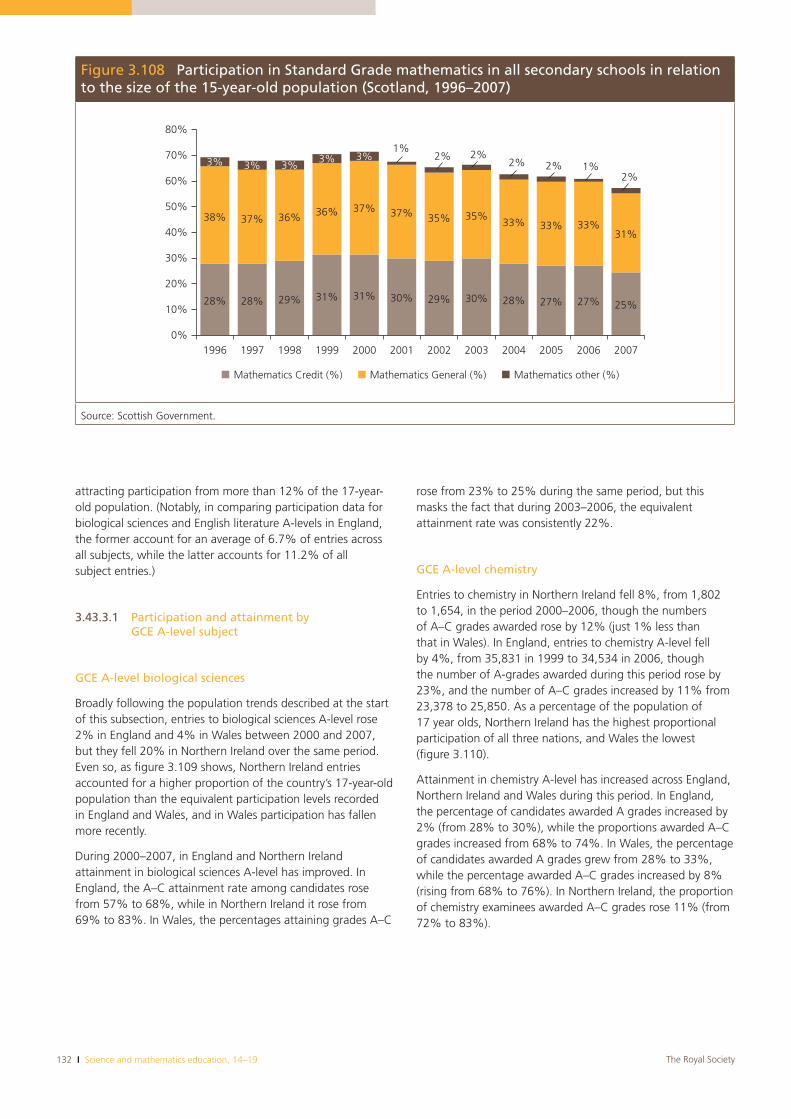
132 I Science and mathematics education, 14–19 The Royal Society
attracting participation from more than 12% of the 17-year-old population. (Notably, in comparing participation data for biological sciences and English literature A-levels in England, the former account for an average of 6.7% of entries across all subjects, while the latter accounts for 11.2% of all subject entries.)
3.43.3.1 Participation and attainment by GCE A-level subject
GCE A-level biological sciences
Broadly following the population trends described at the start of this subsection, entries to biological sciences A-level rose 2% in England and 4% in Wales between 2000 and 2007, but they fell 20% in Northern Ireland over the same period. Even so, as figure 3.109 shows, Northern Ireland entries accounted for a higher proportion of the country’s 17-year-old population than the equivalent participation levels recorded in England and Wales, and in Wales participation has fallen more recently.
During 2000–2007, in England and Northern Ireland attainment in biological sciences A-level has improved. In England, the A–C attainment rate among candidates rose from 57% to 68%, while in Northern Ireland it rose from 69% to 83%. In Wales, the percentages attaining grades A–C
rose from 23% to 25% during the same period, but this masks the fact that during 2003–2006, the equivalent attainment rate was consistently 22%.
GCE A-level chemistry
Entries to chemistry in Northern Ireland fell 8%, from 1,802 to 1,654, in the period 2000–2006, though the numbers of A–C grades awarded rose by 12% (just 1% less than that in Wales). In England, entries to chemistry A-level fell by 4%, from 35,831 in 1999 to 34,534 in 2006, though the number of A-grades awarded during this period rose by 23%, and the number of A–C grades increased by 11% from 23,378 to 25,850. As a percentage of the population of 17 year olds, Northern Ireland has the highest proportional participation of all three nations, and Wales the lowest (figure 3.110).
Attainment in chemistry A-level has increased across England, Northern Ireland and Wales during this period. In England, the percentage of candidates awarded A grades increased by 2% (from 28% to 30%), while the proportions awarded A–C grades increased from 68% to 74%. In Wales, the percentage of candidates awarded A grades grew from 28% to 33%, while the percentage awarded A–C grades increased by 8% (rising from 68% to 76%). In Northern Ireland, the proportion of chemistry examinees awarded A–C grades rose 11% (from 72% to 83%).
Figure 3.108 Participation in Standard Grade mathematics in all secondary schools in relation to the size of the 15-year-old population (Scotland, 1996–2007)
28% 28% 29% 31% 31% 30% 29% 30% 28% 27% 27% 25%
38% 37% 36% 36% 37% 37% 35% 35%33% 33% 33%
31%
3% 3% 3%3% 3%
1%2% 2%
2% 2% 1%2%
0%
10%
20%
30%
40%
50%
60%
70%
80%
1996 1997 1998 1999 2000 2001 2002 2003 2004 2005 2006 2007
Mathematics Credit (%) Mathematics General (%) Mathematics other (%)
Source: Scottish Government.
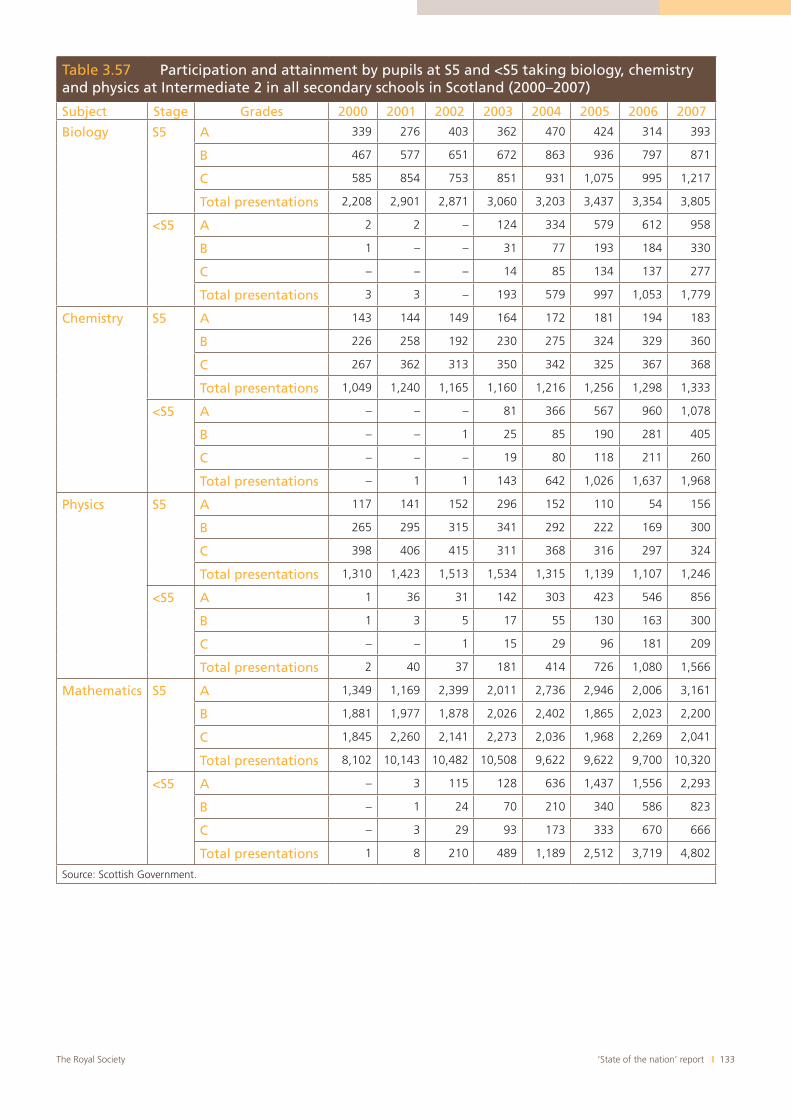
‘State of the nation’ report I 133The Royal Society
Table 3.57 Participation and attainment by pupils at S5 and <S5 taking biology, chemistry and physics at Intermediate 2 in all secondary schools in Scotland (2000–2007)
Subject Stage Grades 2000 2001 2002 2003 2004 2005 2006 2007
Biology S5 A 339 276 403 362 470 424 314 393
B 467 577 651 672 863 936 797 871
C 585 854 753 851 931 1,075 995 1,217
Total presentations 2,208 2,901 2,871 3,060 3,203 3,437 3,354 3,805
<S5 A 2 2 – 124 334 579 612 958
B 1 – – 31 77 193 184 330
C – – – 14 85 134 137 277
Total presentations 3 3 – 193 579 997 1,053 1,779
Chemistry S5 A 143 144 149 164 172 181 194 183
B 226 258 192 230 275 324 329 360
C 267 362 313 350 342 325 367 368
Total presentations 1,049 1,240 1,165 1,160 1,216 1,256 1,298 1,333
<S5 A – – – 81 366 567 960 1,078
B – – 1 25 85 190 281 405
C – – – 19 80 118 211 260
Total presentations – 1 1 143 642 1,026 1,637 1,968
Physics S5 A 117 141 152 296 152 110 54 156
B 265 295 315 341 292 222 169 300
C 398 406 415 311 368 316 297 324
Total presentations 1,310 1,423 1,513 1,534 1,315 1,139 1,107 1,246
<S5 A 1 36 31 142 303 423 546 856
B 1 3 5 17 55 130 163 300
C – – 1 15 29 96 181 209
Total presentations 2 40 37 181 414 726 1,080 1,566
Mathematics S5 A 1,349 1,169 2,399 2,011 2,736 2,946 2,006 3,161
B 1,881 1,977 1,878 2,026 2,402 1,865 2,023 2,200
C 1,845 2,260 2,141 2,273 2,036 1,968 2,269 2,041
Total presentations 8,102 10,143 10,482 10,508 9,622 9,622 9,700 10,320
<S5 A – 3 115 128 636 1,437 1,556 2,293
B – 1 24 70 210 340 586 823
C – 3 29 93 173 333 670 666
Total presentations 1 8 210 489 1,189 2,512 3,719 4,802
Source: Scottish Government.
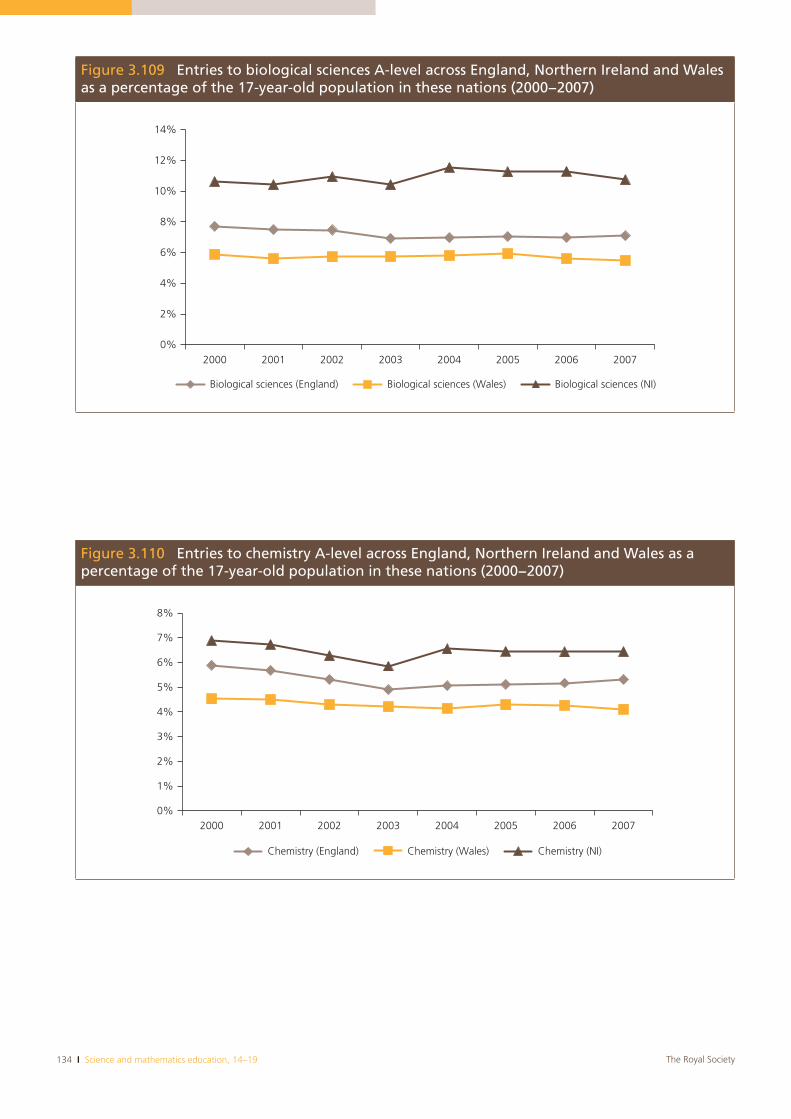
134 I Science and mathematics education, 14–19 The Royal Society
Figure 3.109 Entries to biological sciences A-level across England, Northern Ireland and Wales as a percentage of the 17-year-old population in these nations (2000−2007)
0%
2%
4%
6%
8%
10%
12%
14%
2000 2001 2002 2003 2004 2005 2006 2007
Biological sciences (England) Biological sciences (Wales) Biological sciences (NI)
Figure 3.110 Entries to chemistry A-level across England, Northern Ireland and Wales as a percentage of the 17-year-old population in these nations (2000−2007)
0%
1%
2%
3%
4%
5%
6%
7%
8%
2000 2001 2002 2003 2004 2005 2006 2007
Chemistry (England) Chemistry (Wales) Chemistry (NI)
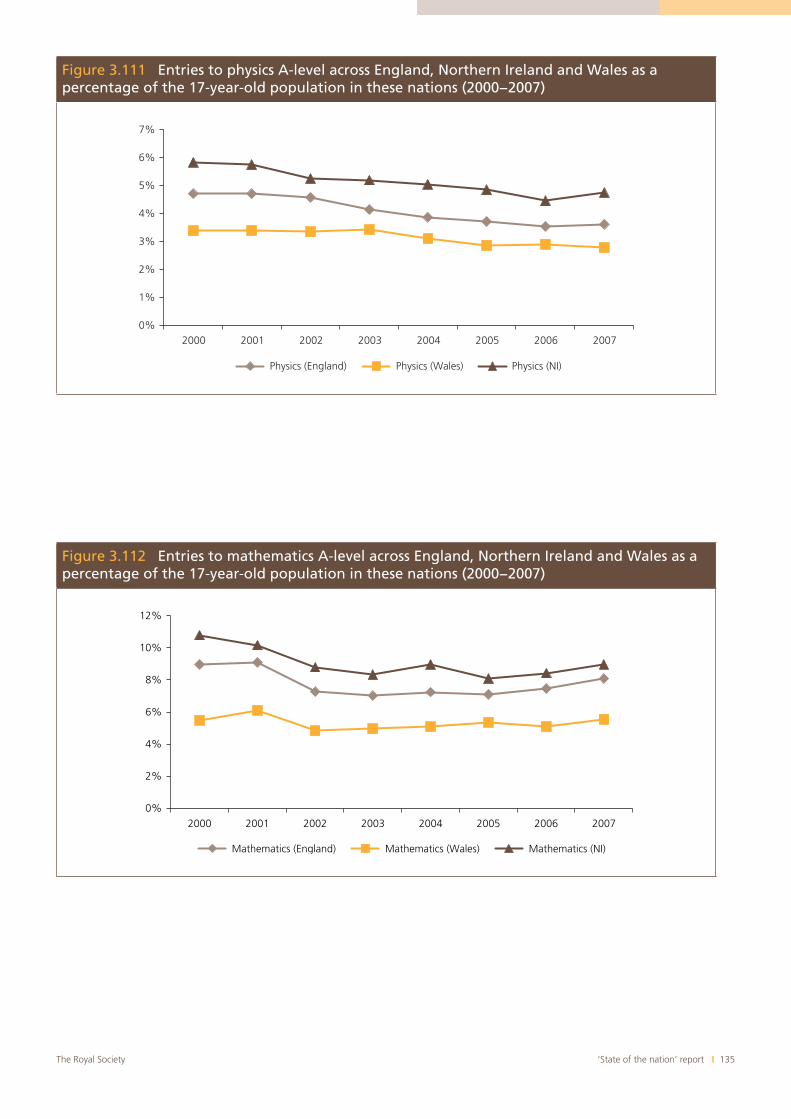
‘State of the nation’ report I 135The Royal Society
Figure 3.111 Entries to physics A-level across England, Northern Ireland and Wales as a percentage of the 17-year-old population in these nations (2000−2007)
0%
1%
2%
3%
4%
5%
6%
7%
2000 2001 2002 2003 2004 2005 2006 2007
Physics (England) Physics (Wales) Physics (NI)
Figure 3.112 Entries to mathematics A-level across England, Northern Ireland and Wales as a percentage of the 17-year-old population in these nations (2000−2007)
0%
2%
4%
6%
8%
10%
12%
2000 2001 2002 2003 2004 2005 2006 2007
Mathematics (England) Mathematics (Wales) Mathematics (NI)
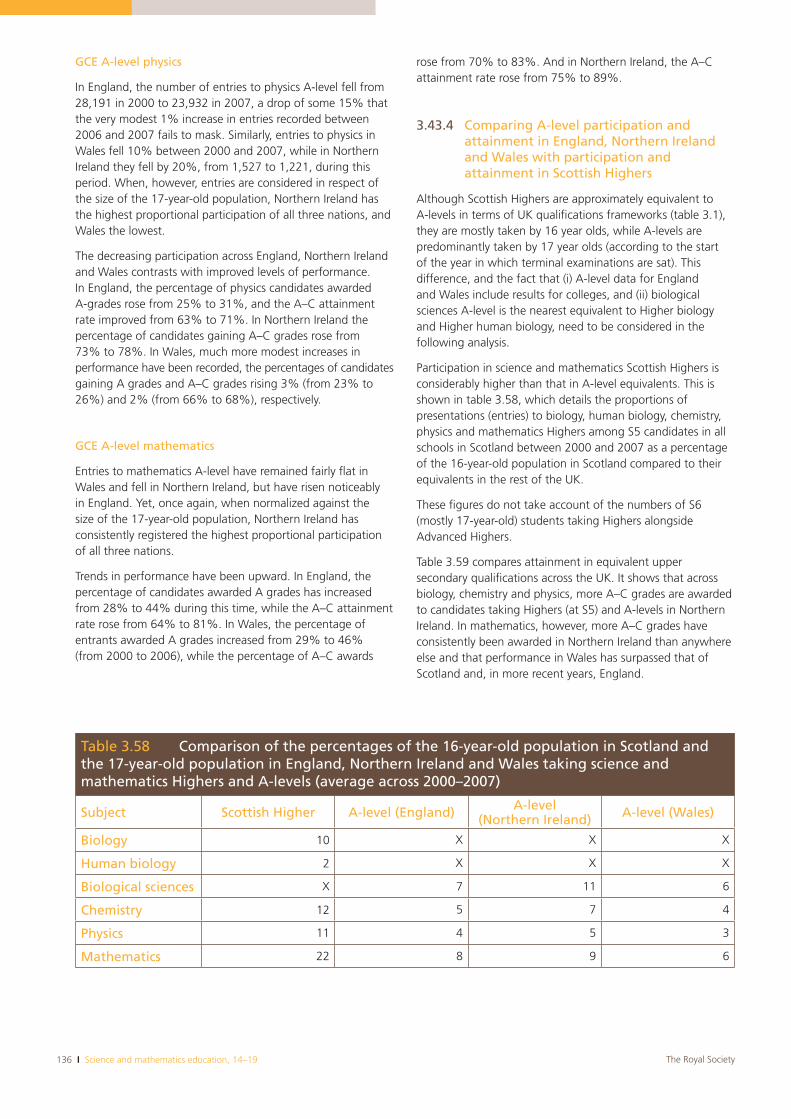
136 I Science and mathematics education, 14–19 The Royal Society
GCE A-level physics
In England, the number of entries to physics A-level fell from 28,191 in 2000 to 23,932 in 2007, a drop of some 15% that the very modest 1% increase in entries recorded between 2006 and 2007 fails to mask. Similarly, entries to physics in Wales fell 10% between 2000 and 2007, while in Northern Ireland they fell by 20%, from 1,527 to 1,221, during this period. When, however, entries are considered in respect of the size of the 17-year-old population, Northern Ireland has the highest proportional participation of all three nations, and Wales the lowest.
The decreasing participation across England, Northern Ireland and Wales contrasts with improved levels of performance. In England, the percentage of physics candidates awarded A-grades rose from 25% to 31%, and the A–C attainment rate improved from 63% to 71%. In Northern Ireland the percentage of candidates gaining A–C grades rose from 73% to 78%. In Wales, much more modest increases in performance have been recorded, the percentages of candidates gaining A grades and A–C grades rising 3% (from 23% to 26%) and 2% (from 66% to 68%), respectively.
GCE A-level mathematics
Entries to mathematics A-level have remained fairly flat in Wales and fell in Northern Ireland, but have risen noticeably in England. Yet, once again, when normalized against the size of the 17-year-old population, Northern Ireland has consistently registered the highest proportional participation of all three nations.
Trends in performance have been upward. In England, the percentage of candidates awarded A grades has increased from 28% to 44% during this time, while the A–C attainment rate rose from 64% to 81%. In Wales, the percentage of entrants awarded A grades increased from 29% to 46% (from 2000 to 2006), while the percentage of A–C awards
rose from 70% to 83%. And in Northern Ireland, the A–C attainment rate rose from 75% to 89%.
3.43.4 Comparing A-level participation and attainment in England, Northern Ireland and Wales with participation and attainment in Scottish Highers
Although Scottish Highers are approximately equivalent to A-levels in terms of UK qualifications frameworks (table 3.1), they are mostly taken by 16 year olds, while A-levels are predominantly taken by 17 year olds (according to the start of the year in which terminal examinations are sat). This difference, and the fact that (i) A-level data for England and Wales include results for colleges, and (ii) biological sciences A-level is the nearest equivalent to Higher biology and Higher human biology, need to be considered in the following analysis.
Participation in science and mathematics Scottish Highers is considerably higher than that in A-level equivalents. This is shown in table 3.58, which details the proportions of presentations (entries) to biology, human biology, chemistry, physics and mathematics Highers among S5 candidates in all schools in Scotland between 2000 and 2007 as a percentage of the 16-year-old population in Scotland compared to their equivalents in the rest of the UK.
These figures do not take account of the numbers of S6 (mostly 17-year-old) students taking Highers alongside Advanced Highers.
Table 3.59 compares attainment in equivalent upper secondary qualifications across the UK. It shows that across biology, chemistry and physics, more A–C grades are awarded to candidates taking Highers (at S5) and A-levels in Northern Ireland. In mathematics, however, more A–C grades have consistently been awarded in Northern Ireland than anywhere else and that performance in Wales has surpassed that of Scotland and, in more recent years, England.
Table 3.58 Comparison of the percentages of the 16-year-old population in Scotland and the 17-year-old population in England, Northern Ireland and Wales taking science and mathematics Highers and A-levels (average across 2000–2007)
Subject Scottish Higher A-level (England) A-level(Northern Ireland) A-level (Wales)
Biology 10 X X X
Human biology 2 X X X
Biological sciences X 7 11 6
Chemistry 12 5 7 4
Physics 11 4 5 3
Mathematics 22 8 9 6

‘State of the nation’ report I 137The Royal Society
3.44 Interpreting the observed trends in participation and attainment
The variation in participation and attainment that we have described is not easily explained owing to a plethora of factors, some of which are more quantifiable than others. These include:
educational reform;i.
socio-economic status;ii.
student attitudes and motivation and their relation to iii.perceptions of relative subject difficulty;
local/regional effects;iv.
the influence of school type;v.
the numbers and distribution of subject-specialist teachers vi.and their deployment;
pupil/teacher ratios;vii.
changes to curricular and course specifications;viii.
the extent to which pupils’ study options may be ix.constrained by school governance, prior attainment and resources; and
the effectiveness with which young people are informed x.about the range of careers that are potentially open to them if they pursue science and mathematics studies.
This list is not exhaustive, and the significance of the interactions between each factor makes it even more difficult to distinguish those that are primary, but it serves to indicate the complexities involved in interpreting these types of data. Equally it is important to remember that differences in both the methodologies used to collect data and the way that data are presented by the various authorities serve to occlude understanding.
Some of these issues, notably equity, student attitudes and relative subject difficulty are explored further in chapters 5
Table 3.59 Attainment (grades A–C) in Higher sciences and mathematics compared to A-level subject equivalents in England, Northern Ireland and Wales (2000–2007)
2000 2001 2002 2003 2004 2005 2006 2007
Higher biology (S5) 67% 69% 69% 73% 80% 77% 76% 74%
Higher human biology (S5) 65% 68% 68% 69% 76% 75% 75% 77%
A-level biological sciences (England) 57% 59% 61% 63% 65% 65% 67% 68%
A-level biological sciences (Northern Ireland)
68% 69% 72% 71% 73% 76% 79% 83%
A-level biological sciences (Wales) 65% 65% 65% 66% 67% 67% 64% 68%
Higher chemistry (S5) 76% 75% 75% 76% 78% 80% 80% 81%
A-level chemistry (England) 66% 67% 71% 72% 74% 74% 75% 76%
A-level chemistry (Northern Ireland) 72% 73% 75% 77% 77% 80% 83% 83%
A-level chemistry (Wales) 68% 69% 72% 73% 73% 75% 74% 76%
Higher physics (S5) 72% 76% 76% 76% 80% 81% 79% 77%
A-level physics (England) 63% 64% 66% 67% 69% 69% 70% 71%
A-level physics (Northern Ireland) 72% 70% 73% 72% 75% 77% 76% 78%
A-level physics (Wales) 66% 66% 65% 68% 69% 68% 68% 68%
Higher mathematics (S5) 74% 74% 71% 73% 75% 75% 76% 76%
A-level mathematics (England) 64% 63% 73% 75% 76% 78% 80% 81%
A-level mathematics (Northern Ireland)
75% 77% 83% 85% 85% 89% 90% 89%
A-level mathematics (Wales) 70% 70% 75% 80% 80% 82% 83% 84%
138 I Science and mathematics education, 14–19 The Royal Society
and 6. Those to do with local/regional effects and careers education (issues (iv) and (x)) are beyond the scope of this report. Here we take a brief look at issues (v)–(ix).
3.44.1 Teachers and teaching
We acknowledged in our first ‘state of the nation’ report that teachers are ‘generally the greatest influence on a young person’s personal and intellectual development other than parents or guardians’ (Royal Society 2007, p. 13). However, owing to the plethora of factors highlighted above, it would be simplistic to attribute the trends we have described in this report solely to good or poor teachers/teaching.
However, given that, comparatively, Northern Ireland generally fares better than England and Wales in terms of its performance in GCSE and A-level sciences and mathematics, and that, to the extent that it is possible to make comparisons, performance in equivalent examinations in Scotland generally exceeds that elsewhere in the UK, one might imagine that Northern Ireland and Scotland possess a higher concentration of specialist teachers in these subjects. Unfortunately, however, there is no evidence available to corroborate the situation in Northern Ireland as no record is kept there of the numbers of specialist science and mathematics teachers.60 And while statistics do exist concerning the numbers of specialist subject teachers registered in Scotland, these do not themselves explain the higher relative success in Scotland. That said, the fact that Scotland only offers specialist subject teacher training in the traditional sciences may be significant and, although as we reported,61 concerns have been raised over retention of science and mathematics teachers in Scotland, it is possible that higher retention rates may have contributed to the stronger performance observed.
It is certainly indisputable that the numbers of science and mathematics specialist teachers in England have fallen during the time-period that this report covers and that, as the recently published 2007 survey of secondary school staffing indicates further falls in the numbers of these specialists, the numbers and future supply62 of these teachers may be inadequate to enable the Next Steps targets to be met (Charles et al. 2008). This, together with a repetitive, uninspiring curriculum, lacklustre teaching and a focus on summative testing, may have served to reduce interest in A-level mathematics (Ofsted 2004), and although more recently there has been an upturn in the number of mathematics entries, their numbers remain well below the levels of participation seen in the 1980s and are lower than
60 Royal Society (2007), p. 25.
61 Ibid., pp. 57–58.
62 Contrary to the way the English Government generally handles this issue when asked to comment by the media, ‘supply’ should be interpreted more broadly than the numbers of people recruited to teacher training courses.
might reasonably be expected given the fact that overall A-level candidate numbers have increased 14% since 1995/96 (figure 3.18).
Equally, in physics and chemistry, where A-level entries have essentially declined or stayed static in England, Northern Ireland and Wales, but where, as a measure of both percentage participation in respect of population and attainment, Northern Ireland has the best record, questions must be raised as to whether there is a tight correlation between the numbers and supply of specialist teachers in these subjects and student participation and success. The fact that participation as a proportion of the population in these subjects appears to be even greater in Scotland than in Northern Ireland adds to the likelihood that such a correlation exists.
Notably, back in 2004, Lipsett drew attention to the shortages of qualified graduates teaching specialist subjects in schools, asserting that ‘fewer and less qualified teachers will lead to fewer university students; and fewer graduates in turn will result in a dwindling supply of teachers’ (Lipsett 2004). Certainly the competition among employers for science and mathematics graduates has intensified, both because of a greater demand in industry and more widely for the range of skills that good graduates in these disciplines possess and on account of the fact that, as a Royal Society study found, the numbers of chemistry and physics graduates have fallen by, respectively, 35% and 13% in recent years (figure 3.113).
The situation is complicated further by there being a question-mark over the calibre, as well as the number, of specialist teachers in circulation. Lipsett, quoting sources at the Royal Society of Chemistry and Institute of Physics, draws attention to shared concerns that their particular subject specialism will be taught by non-specialists who may well not be competent or confident teaching a subject that they have little training in. With combined and general science PGCE overtaking biology as the most popular science teacher training course in England and Wales in 2006, it is natural that these fears should be heightened.63
Concerns over the lack of specialist chemistry and physics teachers are further compounded by (i) the fact that schools in England are increasingly advertising for general science teachers rather than for chemistry and physics specialists (in what appears as a pragmatic response to a lack of subject specialists);64 (ii) the Government’s push for triple science to be taught increasingly, and perhaps preferentially, in schools; and (iii) the changes to A-levels, particularly the introduction of the extended project, that are being introduced in September 2008, all of which may only accentuate the need for chemistry and physics specialists.
63 In Wales, biology regained its position as the most popular science PGCE from combined and general science in 2007, though the difference between the popularity of the two courses was fractional.
64 Op. cit., note 60 (p. 67).
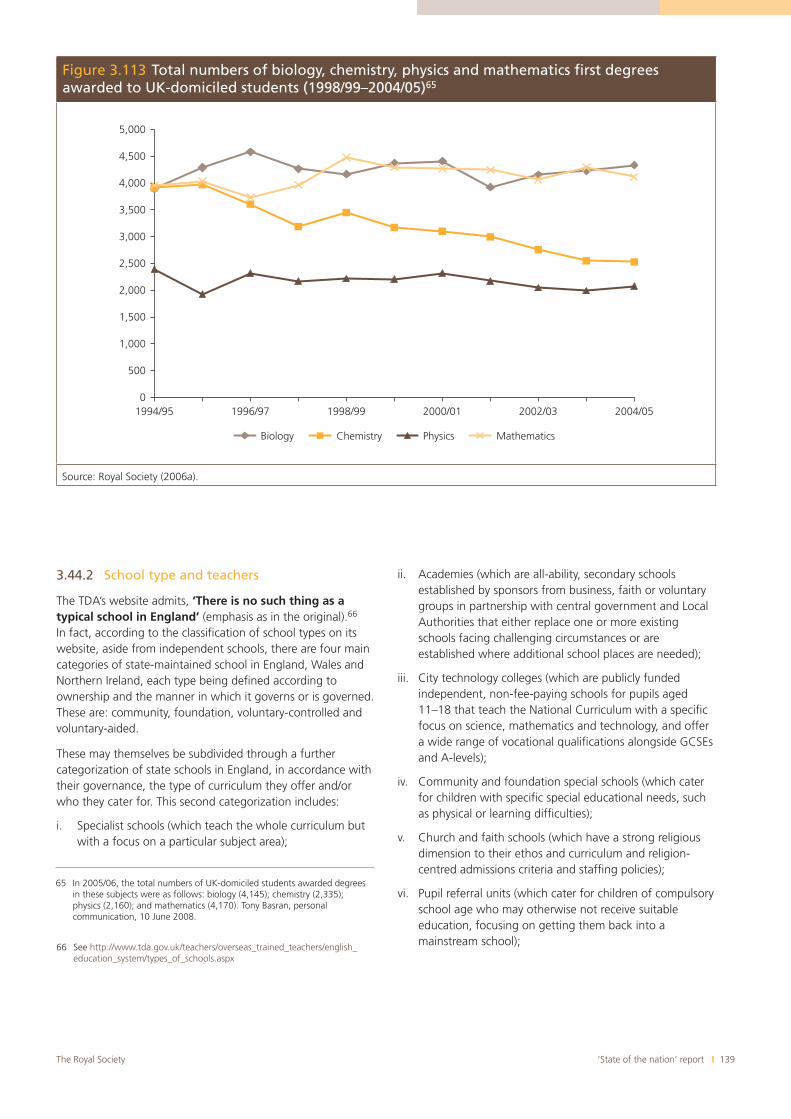
‘State of the nation’ report I 139The Royal Society
0
500
1,000
1,500
2,000
2,500
3,000
3,500
4,000
4,500
5,000
1994/95 1996/97 1998/99 2000/01 2002/03 2004/05
Biology Chemistry Physics Mathematics
Source: Royal Society (2006a).
3.44.2 School type and teachers
The TDA’s website admits, ‘There is no such thing as a typical school in England’ (emphasis as in the original).66
In fact, according to the classification of school types on its website, aside from independent schools, there are four main categories of state-maintained school in England, Wales and Northern Ireland, each type being defined according to ownership and the manner in which it governs or is governed. These are: community, foundation, voluntary-controlled and voluntary-aided.
These may themselves be subdivided through a further categorization of state schools in England, in accordance with their governance, the type of curriculum they offer and/or who they cater for. This second categorization includes:
Specialist schools (which teach the whole curriculum but i.with a focus on a particular subject area);
66 See http://www.tda.gov.uk/teachers/overseas_trained_teachers/english_education_system/types_of_schools.aspx
Academies (which are all-ability, secondary schools ii.established by sponsors from business, faith or voluntary groups in partnership with central government and Local Authorities that either replace one or more existing schools facing challenging circumstances or are established where additional school places are needed);
City technology colleges (which are publicly funded iii.independent, non-fee-paying schools for pupils aged 11–18 that teach the National Curriculum with a specific focus on science, mathematics and technology, and offer a wide range of vocational qualifications alongside GCSEs and A-levels);
Community and foundation special schools (which cater iv.for children with specific special educational needs, such as physical or learning difficulties);
Church and faith schools (which have a strong religious v.dimension to their ethos and curriculum and religion-centred admissions criteria and staffing policies);
Pupil referral units (which cater for children of compulsory vi.school age who may otherwise not receive suitable education, focusing on getting them back into a mainstream school);
Figure 3.113 Total numbers of biology, chemistry, physics and mathematics first degrees awarded to UK-domiciled students (1998/99–2004/05)65
65 In 2005/06, the total numbers of UK-domiciled students awarded degrees in these subjects were as follows: biology (4,145); chemistry (2,335); physics (2,160); and mathematics (4,170). Tony Basran, personal communication, 10 June 2008.
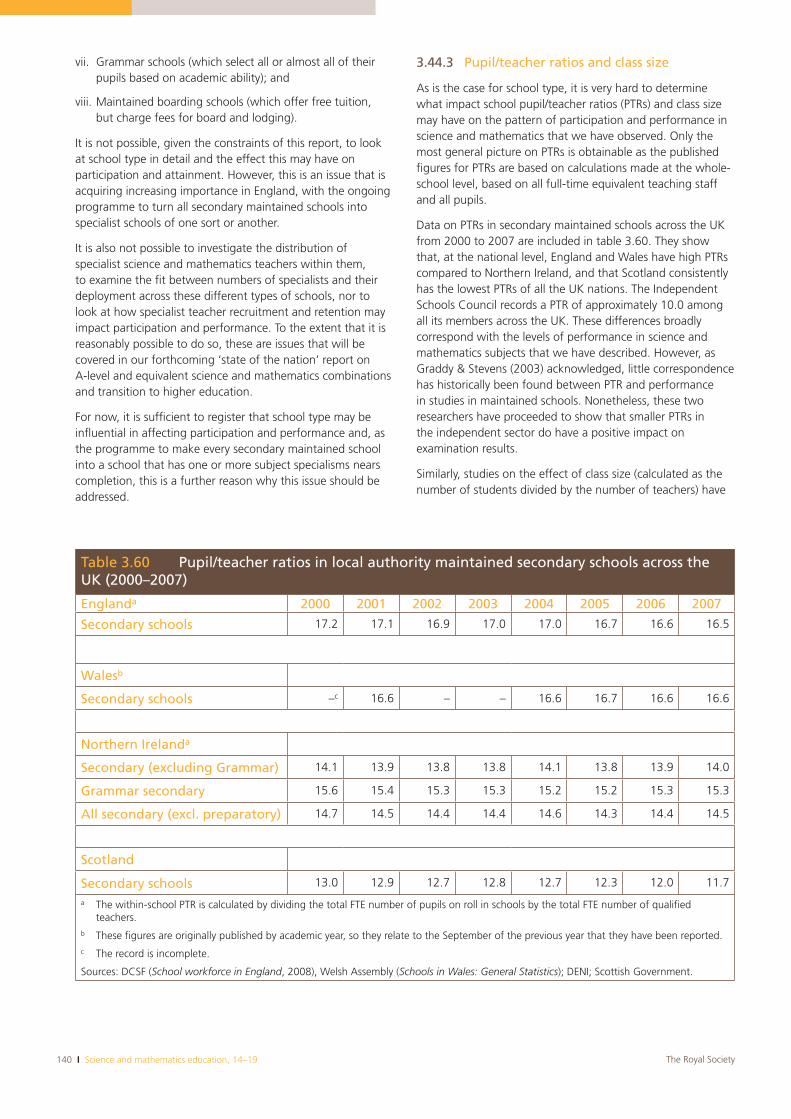
140 I Science and mathematics education, 14–19 The Royal Society
Grammar schools (which select all or almost all of their vii.pupils based on academic ability); and
Maintained boarding schools (which offer free tuition, viii.but charge fees for board and lodging).
It is not possible, given the constraints of this report, to look at school type in detail and the effect this may have on participation and attainment. However, this is an issue that is acquiring increasing importance in England, with the ongoing programme to turn all secondary maintained schools into specialist schools of one sort or another.
It is also not possible to investigate the distribution of specialist science and mathematics teachers within them, to examine the fit between numbers of specialists and their deployment across these different types of schools, nor to look at how specialist teacher recruitment and retention may impact participation and performance. To the extent that it is reasonably possible to do so, these are issues that will be covered in our forthcoming ‘state of the nation’ report on A-level and equivalent science and mathematics combinations and transition to higher education.
For now, it is sufficient to register that school type may be influential in affecting participation and performance and, as the programme to make every secondary maintained school into a school that has one or more subject specialisms nears completion, this is a further reason why this issue should be addressed.
3.44.3 Pupil/teacher ratios and class size
As is the case for school type, it is very hard to determine what impact school pupil/teacher ratios (PTRs) and class size may have on the pattern of participation and performance in science and mathematics that we have observed. Only the most general picture on PTRs is obtainable as the published figures for PTRs are based on calculations made at the whole-school level, based on all full-time equivalent teaching staff and all pupils.
Data on PTRs in secondary maintained schools across the UK from 2000 to 2007 are included in table 3.60. They show that, at the national level, England and Wales have high PTRs compared to Northern Ireland, and that Scotland consistently has the lowest PTRs of all the UK nations. The Independent Schools Council records a PTR of approximately 10.0 among all its members across the UK. These differences broadly correspond with the levels of performance in science and mathematics subjects that we have described. However, as Graddy & Stevens (2003) acknowledged, little correspondence has historically been found between PTR and performance in studies in maintained schools. Nonetheless, these two researchers have proceeded to show that smaller PTRs in the independent sector do have a positive impact on examination results.
Similarly, studies on the effect of class size (calculated as the number of students divided by the number of teachers) have
Table 3.60 Pupil/teacher ratios in local authority maintained secondary schools across the UK (2000–2007)
Englanda 2000 2001 2002 2003 2004 2005 2006 2007
Secondary schools 17.2 17.1 16.9 17.0 17.0 16.7 16.6 16.5
Walesb
Secondary schools –c 16.6 – – 16.6 16.7 16.6 16.6
Northern Irelanda
Secondary (excluding Grammar) 14.1 13.9 13.8 13.8 14.1 13.8 13.9 14.0
Grammar secondary 15.6 15.4 15.3 15.3 15.2 15.2 15.3 15.3
All secondary (excl. preparatory) 14.7 14.5 14.4 14.4 14.6 14.3 14.4 14.5
Scotland
Secondary schools 13.0 12.9 12.7 12.8 12.7 12.3 12.0 11.7
a The within-school PTR is calculated by dividing the total FTE number of pupils on roll in schools by the total FTE number of qualified teachers.
b These figures are originally published by academic year, so they relate to the September of the previous year that they have been reported.c The record is incomplete.
Sources: DCSF (School workforce in England, 2008), Welsh Assembly (Schools in Wales: General Statistics); DENI; Scottish Government.
‘State of the nation’ report I 141The Royal Society
proved equivocal. The largest study in the UK focused on primary education, but it concluded that it had ‘not found [there] to be any evidence that children in smaller classes made more progress in mathematics, English or science, even after allowing for the characteristics of pupils in small and large classes’ (Blatchford et al. 2004).
The effects of PTR and class size on, specifically, science and mathematics at secondary level would benefit from further research.
3.44.4 Changes to curricular and course specifications
A recent report from the independent think tank Reform argued that mathematics GCSE curricula have become broader and shallower with, in turn, GCSE mathematics examinations becoming less demanding and challenging (Kounine et al.2008). The findings of this study provide a useful context in which to evaluate the performance trends described in figure 3.15. If taken at face value, the rising trends both in participation and attainment of A*–C grades seen in figure 3.15 should be welcomed. But there have been repeated concerns (i) expressed by employers about a want of numeracy skills in the non-graduate and graduate workforce; and (ii) that falling GCSE standards have led also to slippage in A-level standards and prompted some universities to incorporate additional teaching into their course structures to overcome the skills deficit. Indeed, earlier we drew attention to the initial negative impact of the Curriculum 2000 reforms and the additional reform of mathematics AS-level that was required to stem the decline in A-level mathematics entries (figure 3.28).
These events illustrate the potential serious, and unintended, consequences that educational reforms can have. They also show the dangers of making piecemeal changes to the educational system. Yet, in England, piecemeal reform continues to be the preferred option in Government. The Tomlinson review of 14–19 education and the post-14 mathematics inquiry together spawned a number of actions (including the revision of the Programme of Study for GCSE science and the development of the new diplomas). Now, with those changes in train, the Government has turned its attention to revising the primary curriculum, commissioning the Williams Review of mathematics and the broader-ranging Rose Review.
This approach to educational reform differs vastly from the ‘root and branch’ reform undertaken of late in Northern Ireland, Scotland and Wales, where new curricula have been mapped out for young people from the first years of learning to the end of schooling (at 18 or 19) that are underpinned by a clearly stated vision of the expectations and desires for the newly revised education systems in these nations. Given that Northern Ireland introduced its new curriculum in September 2007, and that the new Scottish and Welsh curricula will come on-stream in September 2008, it will not be possible to evaluate the impact of these holistic changes for some time.
3.44.5 Constraints on pupils
The extent to which the trends we have observed reflect the true choice/opportunity that pupils have to study the sciences is highly variable (see chapter 5 for more on this). In addition to the effects of school streaming and setting policies, which themselves vary greatly, there are some practical constraints on the choices of learning experience that young people have. For instance, it is up to schools in England to decide whether or not they wish to offer triple science, and (unlike their counterparts in Wales and Scotland) to select their course provision from a number of competing awarding bodies.67
The impact of the competitive and commercialized Key Stage 4 examination system in England (and to a lesser extent elsewhere) is unknown, but we have noted the difficulty of obtaining some data because of its commercial sensitivity. This seems to us undesirable in matters of important public policy. Schools’ decisions to offer triple science are likely to be influenced by the resources (human, capital and laboratory) available to them. It is likely, therefore, that the spread of triple science throughout England may be affected particularly by the quality/availability of suitably qualified teachers and the quality/paucity of other resources at their disposal. Such decisions and circumstances will directly affect the choice (or otherwise) that pupils are given, and have ramifications for their performance.
3.45 Summary conclusions and recommendations
It is, in general, and with the clear exception of Curriculum 2000, hard to untangle the main cause(s) of the trends in public examination participation and performance, and to relate them to the impact of specific educational reforms. And it is certainly not possible from the analysis of these trends alone to recommend specific curricular, examination or other policy changes.
But what the measured trends do show is that despite the unprecedented amount of educational reform that we have witnessed in recent years, particularly in England, there is little evidence to indicate a significant positive impression on participation and performance in science and mathematics post-16. But in Scotland, where the dropping of the age/stage barrier complicates analysis and comparison with the other UK nations, there appear to have been increases in uptake and performance that may be attributed to the Higher Stillreforms, resulting from a provision that better suits the needs and aspirations of more young people.
This invites two fundamental questions:
1. Why is it that significantly more young people are not being attracted to study these subjects?
67 In Northern Ireland schools are able to select their course provision from specifications offered by competing awarding bodies, and it is quite common practice to select the specifications offered by the English awarding bodies.
142 I Science and mathematics education, 14–19 The Royal Society
2. What may be done to ensure that, in future, greater proportions of successive school year cohorts progress with science and mathematics studies post-16?
Unfortunately, there are no simple answers to these questions. But we can point to the success of the Further Mathematics Network in inspiring more young people to take further mathematics A-level, and it may be that this could provide something of a model that could be replicated more widely.
A key lesson from our analysis is how crucial it is that time be allowed for the true impact of any major reform to be assessed and evaluated, if we are to gain an informed understanding of the policy process. This is especially the case for the new science GCSEs, the first full (provisional) results of which only appeared in August 2008. Education should not be a political football, and policy itself should be based on a longer-term vision that extends well beyond the tenure of one government.
Recommendation 3.1
There should be greater collaboration between the education authorities in England, Wales and Northern Ireland to ensure that data are collected and presented more consistently and coherently than has been the case, in order to facilitate comparison of participation and performance in public examinations.
Recommendation 3.2
The UK Government should make much better use of the evidence base that they oversee, and study these carefully, and in consultation with STEM partners, before committing to educational reform that could have an uncertain impact on science and mathematics uptake and progression.
Recommendation 3.3
The DCSF should publish details of the results of pupils who take GCSE or A-level courses early.
Recommendation 3.4
The impact, in England, of the move to two mathematics GCSEs on progression to mathematics qualifications post-16 should be monitored once these are introduced.
Recommendation 3.5
All commercial organizations with responsibility for administering 14−19 examinations should be more fully publicly accountable than is currently the case. They should be obliged to make available specific subject-based data on examination participation and performance.
Recommendation 3.6
It is essential that the provision of alternative 14–19 examinations to those that are most widely available be mapped and monitored regularly, so that the true choice available to young people in different localities, and the value of the extent of this choice, may be assessed and evaluated.
The Royal Society ‘State of the nation’ report I 143
4 What may be learnt from international comparative studies?
Although international studies are occasionally used to generate sensationalist newspaper headlines, undertaking comparisons of this kind is not straightforward, even on the basis of a common assessment instrument. Therefore, as well as summarizing some of the major findings from such studies we also give attention to the methodological issues which they face, including the criticisms they have received. We address the issue of ‘league tables’: whether it is appropriate to express results in such ordered lists, particularly when those generated from surveys undertaken at different times are compared. If such comparisons are to be made, the question of which are the most appropriate comparator nations to the UK must also be faced: we identify the main groupings which have been used. Finally, in the light of these discussions, we return to the question of what, if any, robust conclusions can be drawn from these data.
Comparative international studies use alternative measures of educational performance, both to explore particular research questions of interest, but also to get around the problems inherent in comparing performance using pre-existing data highly influenced by national systems and assessment methodologies. The results of these studies must still be treated with care, not least because the teaching methods, curriculum, student characteristics, and social context in which teaching and learning occur vary greatly between nations. The findings of international comparative research, often complex and qualified judgements, are in the UK context frequently reduced to simplistic and eye-catching media headlines about the attainment of students within a particular education system.68
Two organizations are currently involved in major international comparative studies of science and mathematics education: the International Association for the Evaluation of Education Achievement (IEA), based in Amsterdam, and the Organisation for Economic Co-operation and Development (OECD), based in Paris. The First and Second International Mathematics Studies (FIMS and SIMS) were sponsored by the IEA in 1964 and 1982−83 respectively, the corresponding science studies (FISS and SISS) taking place in 1970−72 and 1984.
68 See http://news.bbc.co.uk/1/hi/education/7119511.stm
These studies led to the Third International Science and Mathematics Study (TIMSS) in 1995 and to subsequent projects in 1999 and 2003. Now known as the Trends in Mathematics and Science Study (TIMSS), the work is coordinated from the TIMSS International Center at Boston College in the USA.
A further international TIMSS project is currently underway with the results due in December 2008 (Clark 2007; Paton 2007).69
The OECD Programme for International Student Assessment (PISA) was launched in 2000 and seeks to make international comparisons of ‘literacy’ in three domains: reading, mathematics and science. The Programme operates on a three year cycle, each exploring in turn one of the domains to which two-thirds of the testing time is devoted. The ‘major’ domain in 2000 was reading, followed by mathematics in 2003 and science in 2006.70
These international comparative studies can be seen, in conjunction with other initiatives not focused specifically on science and mathematics or secondary students,71 as part of a wider movement to internationalize assessment that has several important consequences. These include highlighting the many features beyond the control of schools that influence student performance, identifying the relative significance of within, and between, country variation in such performance, and promoting a ‘world trade in educational policies’ (Broadfoot & Black 2004), a trade that has not always taken due account of the differences between education systems.
69 There is also TIMSS Advanced 2008. Last conducted in 1995, this survey will explore the achievement of students in the final year of secondary schooling (normally the 12th year of formal schooling) who have taken advanced courses in physics and mathematics. For details, see Garden et al. (2006). The UK did not participate in the 1995 survey.
70 The strategy for PISA for 2009 and beyond has been reviewed by the PISA Governing Board.
71 They include the First and Second International Assessment of Education Progress in Mathematics (IAEPM 1 and IAEPM 2) and Science (IAEPS 1 and IAEPS 2) projects in 1988 and 1990, respectively, together with a large number of more specific studies that draw upon the data provided by the large-scale international studies to make bilateral or other comparisons (see, for example, Stevenson & Stigler (1992); NCES (2007)).
In this chapter we look at the available data from selected international assessment exercises seeking to establish whether these data can contribute to our understanding of science and mathematics attainment within the UK, and if so what they tell us.
144 I Science and mathematics education, 14–19 The Royal Society
4.1 Features of PISA and TIMSS and their differences
Both PISA and TIMSS explore the influence of contextual variables on what students know and are able to do. However, there are important differences, most notably differences in what is assessed. The following outlines key features of PISA and TIMSS and highlights their differences.
4.1.1 Aims
TIMSS focuses attention on the curriculum as a broad factor underlying student achievement and has generated data relating to the prescribed curriculum, the curriculum as implemented and what students learn as a result.72 It attempts to produce assessment that reflects the content of curricula in a significant number of participating nations.
PISA is not concerned so much with mastery of the school curriculum as with assessing the knowledge and skills (the functional literacy) that 15-year-old students will need as adults. The emphasis within PISA is therefore upon mastery of processes, the understanding of concepts and the ability to function effectively within each of the three ‘literacy’ domains: reading, science and mathematics.
4.1.2 Age of students
TIMSS investigates two groups, fourth and eight grade students. In 2003, the latter of these translated into students of average age 14.3 years in England and 13.7 years in Scotland. In some educational systems students are required to stay in a grade until they are successful, so the age range of students in a given grade may be wide.
PISA is concerned with measuring the output of compulsory schooling and is therefore focused on students aged about 15 in both school-based and age-based educational programmes. The average age of students participating in PISA in 2003 was 15 years 7.3 months in England, and 15 years 7.4 months in Northern Ireland, in each case about one month younger than the OECD average.73
4.1.3 Definition of content areas
In TIMSS in 2003, mathematics was defined in terms of five content areas (number, algebra, measurement, geometry, data) and four cognitive domains (knowing facts and procedures, using concepts, solving routine problems, reasoning). Test items were constructed on the basis of this
72 It is difficult to find a succinct statement of the aims of TIMSS. As Hutchinson & Schagen (2007) have noted, ‘IEA studies have been around so long that they collect a range of aims, and cost so much that it is obviously desirable that the subscribers … get as much as they can from them’.
73 This is because testing was carried out at the earliest opportunity within PISA specifications (March 2000, rather than in April, as was the case in most other Northern Hemisphere countries).
definition. In science, test items were drawn from life science, chemistry, physics, earth science and environmental science and the corresponding cognitive domains were factual knowledge, conceptual understanding, and reasoning and analysis.
In PISA 2003 and 2006, mathematical literacy (the major domain) was defined in terms of students’ ability to analyse, reason and communicate effectively as they pose, solve and interpret mathematical problems in a variety of situations involving quantitative, spatial, probabilistic or other mathematical concepts (OECD 2003, 2007). These abilities were tested with respect to four content areas: space and shape; change and relationships; quantity; uncertainty. Scientific literacy was defined as the capacity to use scientific knowledge to identify questions and to draw evidence-based conclusions in order to understand and help make decisions about the natural world and the changes made to it through human activity (OECD 2003, 2004, 2007). In 2006 application of knowledge of physics, chemistry, biological science and earth and space sciences was tested.
4.1.4 Methodology, sampling procedures and criteria
It appears that there are notable differences in the selection and participation of schools. As an example, Canada took part in PISA 2003 but only some provinces took part in TIMSS 2003 (OECD 2004; Martin et al. 2004).
In 2003, 50 countries from all parts of the world participated in TIMSS. Similarly, PISA 2006 involved 57 countries, many of which were not members of the OECD. Thirty were members of the OECD74 and 27 were members of the European Union. The survey also included 27 ‘Partner countries and economies’, many of which were located in East and South-East Asia (eg Hong Kong−China, Indonesia, Thailand), Central and Eastern Europe and Central Asia (eg Azerbaijan, Croatia, Estonia, Kyrgyzstan, the Russian Federation), the Middle East (eg Israel, Jordan, Qatar), Central and South America (eg Argentina, Brazil, Chile, Colombia, Uruguay) and North Africa (eg Tunisia). Such a diverse range of education systems has implications for the average international level of performance and for comparisons that might be drawn between this average and the performance of students in any one country.
4.1.5 Form and content of test items
Given the difference in aims, differences in the types of test items are inevitable, although all used multiple choice, short response and longer response items. The balance between these various types is, however, different with PISA tests requiring considerably more reading than those of TIMSS, a difference that is likely to have some influence on students’
74 The OECD countries are Australia, Austria, Belgium, Canada, Czech Republic, Denmark, Finland, France, Germany, Greece, Hungary, Iceland, Ireland, Italy, Japan, Korea, Luxembourg, Mexico, Netherlands, New Zealand, Norway, Poland, Portugal, Slovak Republic, Spain, Sweden, Switzerland, Turkey, United Kingdom and USA.
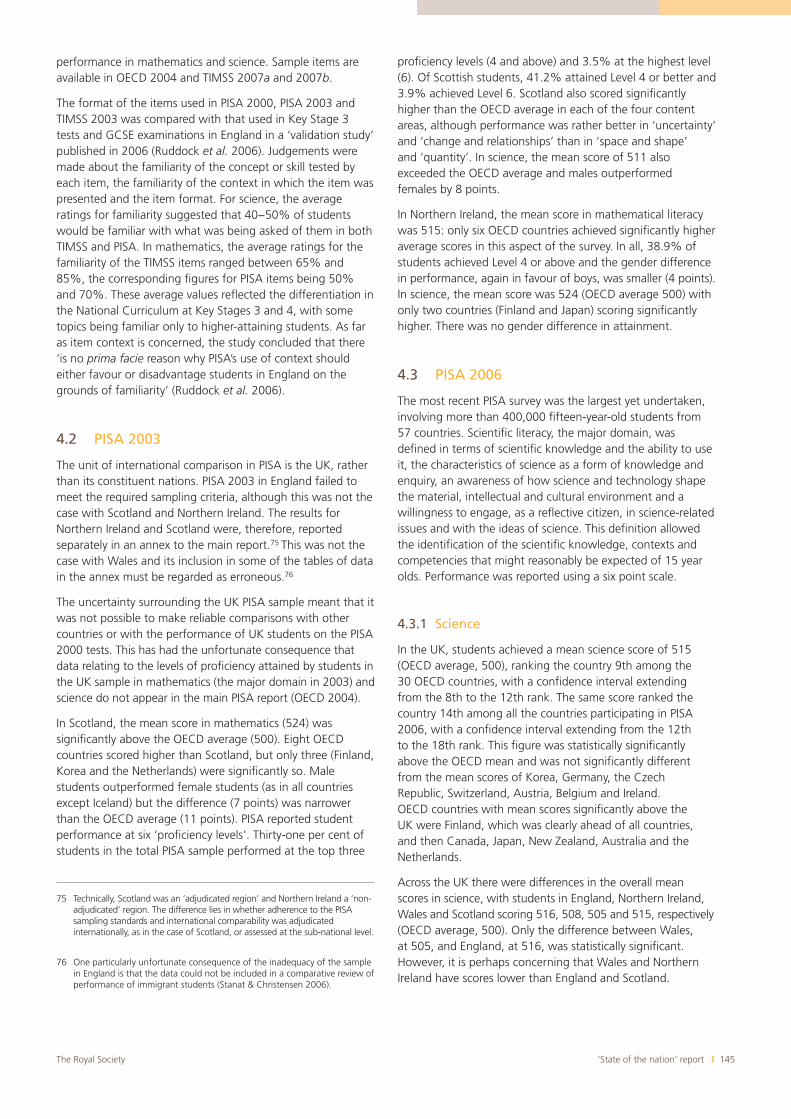
‘State of the nation’ report I 145The Royal Society
performance in mathematics and science. Sample items are available in OECD 2004 and TIMSS 2007a and 2007b.
The format of the items used in PISA 2000, PISA 2003 and TIMSS 2003 was compared with that used in Key Stage 3 tests and GCSE examinations in England in a ‘validation study’ published in 2006 (Ruddock et al. 2006). Judgements were made about the familiarity of the concept or skill tested by each item, the familiarity of the context in which the item was presented and the item format. For science, the average ratings for familiarity suggested that 40−50% of students would be familiar with what was being asked of them in both TIMSS and PISA. In mathematics, the average ratings for the familiarity of the TIMSS items ranged between 65% and 85%, the corresponding figures for PISA items being 50% and 70%. These average values reflected the differentiation in the National Curriculum at Key Stages 3 and 4, with some topics being familiar only to higher-attaining students. As far as item context is concerned, the study concluded that there ‘is no prima facie reason why PISA’s use of context should either favour or disadvantage students in England on the grounds of familiarity’ (Ruddock et al. 2006).
4.2 PISA 2003
The unit of international comparison in PISA is the UK, rather than its constituent nations. PISA 2003 in England failed to meet the required sampling criteria, although this was not the case with Scotland and Northern Ireland. The results for Northern Ireland and Scotland were, therefore, reported separately in an annex to the main report.75 This was not the case with Wales and its inclusion in some of the tables of data in the annex must be regarded as erroneous.76
The uncertainty surrounding the UK PISA sample meant that it was not possible to make reliable comparisons with other countries or with the performance of UK students on the PISA 2000 tests. This has had the unfortunate consequence that data relating to the levels of proficiency attained by students in the UK sample in mathematics (the major domain in 2003) and science do not appear in the main PISA report (OECD 2004).
In Scotland, the mean score in mathematics (524) was significantly above the OECD average (500). Eight OECD countries scored higher than Scotland, but only three (Finland, Korea and the Netherlands) were significantly so. Male students outperformed female students (as in all countries except Iceland) but the difference (7 points) was narrower than the OECD average (11 points). PISA reported student performance at six ‘proficiency levels’. Thirty-one per cent of students in the total PISA sample performed at the top three
75 Technically, Scotland was an ‘adjudicated region’ and Northern Ireland a ‘non-adjudicated’ region. The difference lies in whether adherence to the PISA sampling standards and international comparability was adjudicated internationally, as in the case of Scotland, or assessed at the sub-national level.
76 One particularly unfortunate consequence of the inadequacy of the sample in England is that the data could not be included in a comparative review of performance of immigrant students (Stanat & Christensen 2006).
proficiency levels (4 and above) and 3.5% at the highest level (6). Of Scottish students, 41.2% attained Level 4 or better and 3.9% achieved Level 6. Scotland also scored significantly higher than the OECD average in each of the four content areas, although performance was rather better in ‘uncertainty’ and ‘change and relationships’ than in ‘space and shape’ and ‘quantity’. In science, the mean score of 511 also exceeded the OECD average and males outperformed females by 8 points.
In Northern Ireland, the mean score in mathematical literacy was 515: only six OECD countries achieved significantly higher average scores in this aspect of the survey. In all, 38.9% of students achieved Level 4 or above and the gender difference in performance, again in favour of boys, was smaller (4 points). In science, the mean score was 524 (OECD average 500) with only two countries (Finland and Japan) scoring significantly higher. There was no gender difference in attainment.
4.3 PISA 2006
The most recent PISA survey was the largest yet undertaken, involving more than 400,000 fifteen-year-old students from 57 countries. Scientific literacy, the major domain, was defined in terms of scientific knowledge and the ability to use it, the characteristics of science as a form of knowledge and enquiry, an awareness of how science and technology shape the material, intellectual and cultural environment and a willingness to engage, as a reflective citizen, in science-related issues and with the ideas of science. This definition allowed the identification of the scientific knowledge, contexts and competencies that might reasonably be expected of 15 year olds. Performance was reported using a six point scale.
4.3.1 Science
In the UK, students achieved a mean science score of 515 (OECD average, 500), ranking the country 9th among the 30 OECD countries, with a confidence interval extending from the 8th to the 12th rank. The same score ranked the country 14th among all the countries participating in PISA 2006, with a confidence interval extending from the 12th to the 18th rank. This figure was statistically significantly above the OECD mean and was not significantly different from the mean scores of Korea, Germany, the Czech Republic, Switzerland, Austria, Belgium and Ireland. OECD countries with mean scores significantly above the UK were Finland, which was clearly ahead of all countries, and then Canada, Japan, New Zealand, Australia and the Netherlands.
Across the UK there were differences in the overall mean scores in science, with students in England, Northern Ireland, Wales and Scotland scoring 516, 508, 505 and 515, respectively (OECD average, 500). Only the difference between Wales, at 505, and England, at 516, was statistically significant. However, it is perhaps concerning that Wales and Northern Ireland have scores lower than England and Scotland.
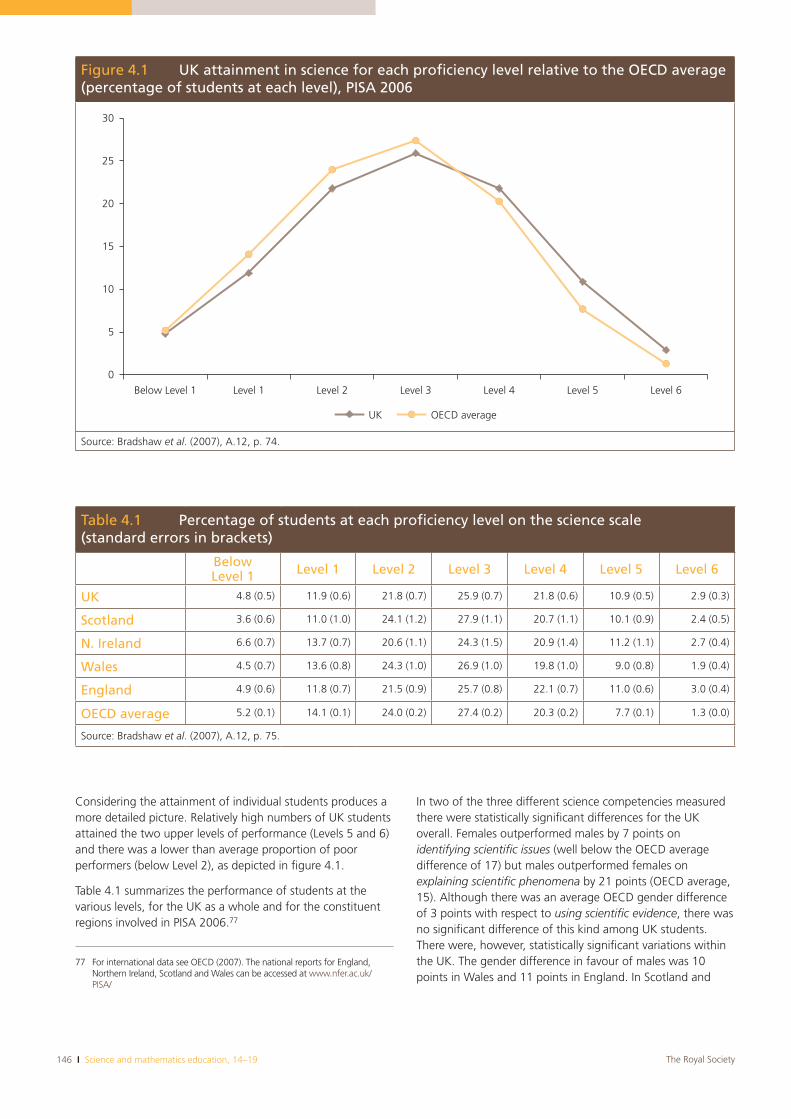
146 I Science and mathematics education, 14–19 The Royal Society
Considering the attainment of individual students produces a more detailed picture. Relatively high numbers of UK students attained the two upper levels of performance (Levels 5 and 6) and there was a lower than average proportion of poor performers (below Level 2), as depicted in figure 4.1.
Table 4.1 summarizes the performance of students at the various levels, for the UK as a whole and for the constituent regions involved in PISA 2006.77
77 For international data see OECD (2007). The national reports for England, Northern Ireland, Scotland and Wales can be accessed at www.nfer.ac.uk/PISA/
In two of the three different science competencies measured there were statistically significant differences for the UK overall. Females outperformed males by 7 points on identifying scientific issues (well below the OECD average difference of 17) but males outperformed females on explaining scientific phenomena by 21 points (OECD average, 15). Although there was an average OECD gender difference of 3 points with respect to using scientific evidence, there was no significant difference of this kind among UK students. There were, however, statistically significant variations within the UK. The gender difference in favour of males was 10 points in Wales and 11 points in England. In Scotland and
Table 4.1 Percentage of students at each proficiency level on the science scale (standard errors in brackets)
BelowLevel 1 Level 1 Level 2 Level 3 Level 4 Level 5 Level 6
UK 4.8 (0.5) 11.9 (0.6) 21.8 (0.7) 25.9 (0.7) 21.8 (0.6) 10.9 (0.5) 2.9 (0.3)
Scotland 3.6 (0.6) 11.0 (1.0) 24.1 (1.2) 27.9 (1.1) 20.7 (1.1) 10.1 (0.9) 2.4 (0.5)
N. Ireland 6.6 (0.7) 13.7 (0.7) 20.6 (1.1) 24.3 (1.5) 20.9 (1.4) 11.2 (1.1) 2.7 (0.4)
Wales 4.5 (0.7) 13.6 (0.8) 24.3 (1.0) 26.9 (1.0) 19.8 (1.0) 9.0 (0.8) 1.9 (0.4)
England 4.9 (0.6) 11.8 (0.7) 21.5 (0.9) 25.7 (0.8) 22.1 (0.7) 11.0 (0.6) 3.0 (0.4)
OECD average 5.2 (0.1) 14.1 (0.1) 24.0 (0.2) 27.4 (0.2) 20.3 (0.2) 7.7 (0.1) 1.3 (0.0)
Source: Bradshaw et al. (2007), A.12, p. 75.
Figure 4.1 UK attainment in science for each proficiency level relative to the OECD average (percentage of students at each level), PISA 2006
0
5
10
15
20
25
30
Below Level 1 Level 1 Level 2 Level 3 Level 4 Level 5 Level 6
UK OECD average
Source: Bradshaw et al. (2007), A.12, p. 74.
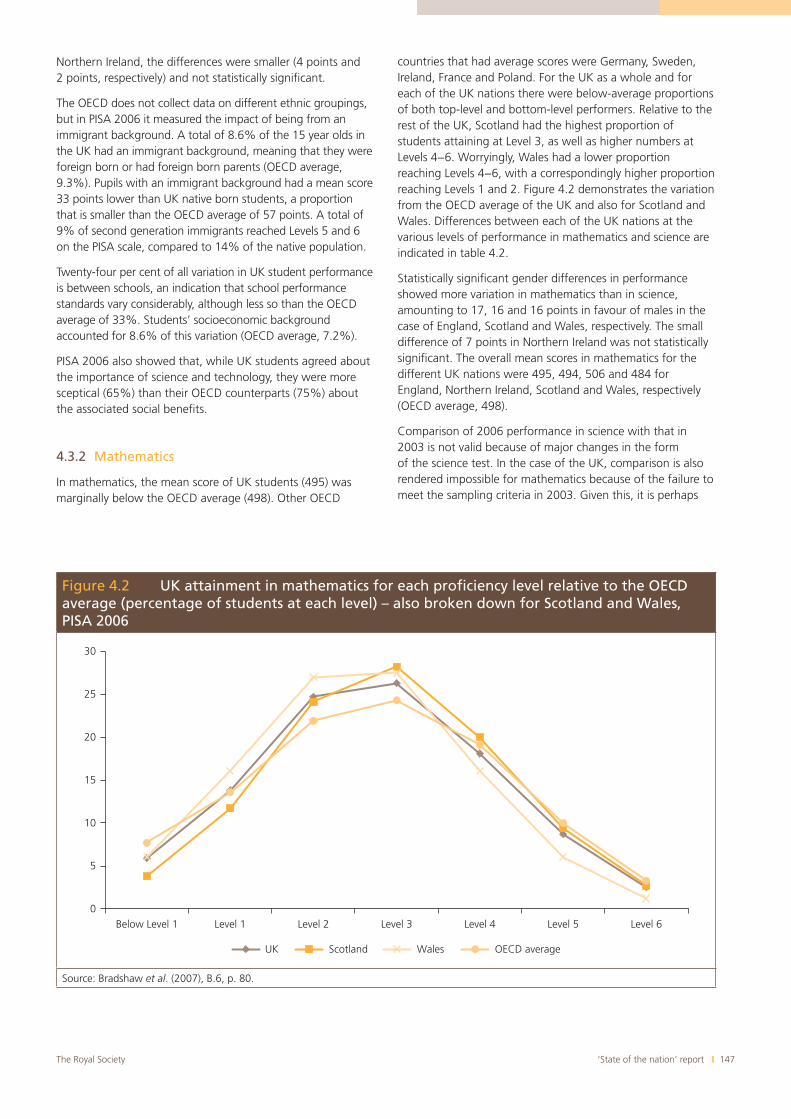
‘State of the nation’ report I 147The Royal Society
Northern Ireland, the differences were smaller (4 points and 2 points, respectively) and not statistically significant.
The OECD does not collect data on different ethnic groupings, but in PISA 2006 it measured the impact of being from an immigrant background. A total of 8.6% of the 15 year olds in the UK had an immigrant background, meaning that they were foreign born or had foreign born parents (OECD average, 9.3%). Pupils with an immigrant background had a mean score 33 points lower than UK native born students, a proportion that is smaller than the OECD average of 57 points. A total of 9% of second generation immigrants reached Levels 5 and 6 on the PISA scale, compared to 14% of the native population.
Twenty-four per cent of all variation in UK student performance is between schools, an indication that school performance standards vary considerably, although less so than the OECD average of 33%. Students’ socioeconomic background accounted for 8.6% of this variation (OECD average, 7.2%).
PISA 2006 also showed that, while UK students agreed about the importance of science and technology, they were more sceptical (65%) than their OECD counterparts (75%) about the associated social benefits.
4.3.2 Mathematics
In mathematics, the mean score of UK students (495) was marginally below the OECD average (498). Other OECD
countries that had average scores were Germany, Sweden, Ireland, France and Poland. For the UK as a whole and for each of the UK nations there were below-average proportions of both top-level and bottom-level performers. Relative to the rest of the UK, Scotland had the highest proportion of students attaining at Level 3, as well as higher numbers at Levels 4−6. Worryingly, Wales had a lower proportion reaching Levels 4−6, with a correspondingly higher proportion reaching Levels 1 and 2. Figure 4.2 demonstrates the variation from the OECD average of the UK and also for Scotland and Wales. Differences between each of the UK nations at the various levels of performance in mathematics and science are indicated in table 4.2.
Statistically significant gender differences in performance showed more variation in mathematics than in science, amounting to 17, 16 and 16 points in favour of males in the case of England, Scotland and Wales, respectively. The small difference of 7 points in Northern Ireland was not statistically significant. The overall mean scores in mathematics for the different UK nations were 495, 494, 506 and 484 for England, Northern Ireland, Scotland and Wales, respectively (OECD average, 498).
Comparison of 2006 performance in science with that in 2003 is not valid because of major changes in the form of the science test. In the case of the UK, comparison is also rendered impossible for mathematics because of the failure to meet the sampling criteria in 2003. Given this, it is perhaps
Figure 4.2 UK attainment in mathematics for each proficiency level relative to the OECD average (percentage of students at each level) – also broken down for Scotland and Wales, PISA 2006
0
5
10
15
20
25
30
Below Level 1 Level 1 Level 2 Level 3 Level 4 Level 5 Level 6
UK Scotland Wales OECD average
Source: Bradshaw et al. (2007), B.6, p. 80.
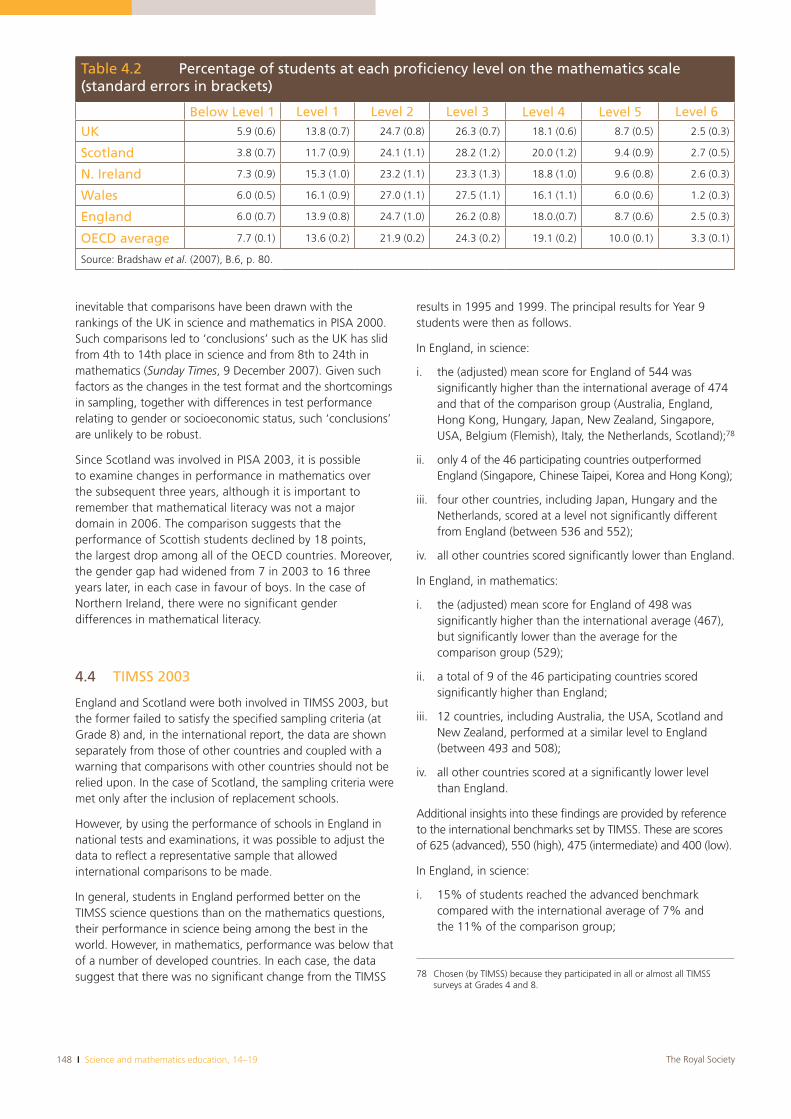
148 I Science and mathematics education, 14–19 The Royal Society
inevitable that comparisons have been drawn with the rankings of the UK in science and mathematics in PISA 2000. Such comparisons led to ‘conclusions’ such as the UK has slid from 4th to 14th place in science and from 8th to 24th in mathematics (Sunday Times, 9 December 2007). Given such factors as the changes in the test format and the shortcomings in sampling, together with differences in test performance relating to gender or socioeconomic status, such ‘conclusions’ are unlikely to be robust.
Since Scotland was involved in PISA 2003, it is possible to examine changes in performance in mathematics over the subsequent three years, although it is important to remember that mathematical literacy was not a major domain in 2006. The comparison suggests that the performance of Scottish students declined by 18 points, the largest drop among all of the OECD countries. Moreover, the gender gap had widened from 7 in 2003 to 16 three years later, in each case in favour of boys. In the case of Northern Ireland, there were no significant gender differences in mathematical literacy.
4.4 TIMSS 2003
England and Scotland were both involved in TIMSS 2003, but the former failed to satisfy the specified sampling criteria (at Grade 8) and, in the international report, the data are shown separately from those of other countries and coupled with a warning that comparisons with other countries should not be relied upon. In the case of Scotland, the sampling criteria were met only after the inclusion of replacement schools.
However, by using the performance of schools in England in national tests and examinations, it was possible to adjust the data to reflect a representative sample that allowed international comparisons to be made.
In general, students in England performed better on the TIMSS science questions than on the mathematics questions, their performance in science being among the best in the world. However, in mathematics, performance was below that of a number of developed countries. In each case, the data suggest that there was no significant change from the TIMSS
results in 1995 and 1999. The principal results for Year 9 students were then as follows.
In England, in science:
the (adjusted) mean score for England of 544 was i.significantly higher than the international average of 474 and that of the comparison group (Australia, England, Hong Kong, Hungary, Japan, New Zealand, Singapore, USA, Belgium (Flemish), Italy, the Netherlands, Scotland);78
only 4 of the 46 participating countries outperformed ii.England (Singapore, Chinese Taipei, Korea and Hong Kong);
four other countries, including Japan, Hungary and the iii.Netherlands, scored at a level not significantly different from England (between 536 and 552);
all other countries scored significantly lower than England.iv.
In England, in mathematics:
the (adjusted) mean score for England of 498 was i.significantly higher than the international average (467), but significantly lower than the average for the comparison group (529);
a total of 9 of the 46 participating countries scored ii.significantly higher than England;
12 countries, including Australia, the USA, Scotland and iii.New Zealand, performed at a similar level to England (between 493 and 508);
all other countries scored at a significantly lower level iv.than England.
Additional insights into these findings are provided by reference to the international benchmarks set by TIMSS. These are scores of 625 (advanced), 550 (high), 475 (intermediate) and 400 (low).
In England, in science:
15% of students reached the advanced benchmark i.compared with the international average of 7% and the 11% of the comparison group;
78 Chosen (by TIMSS) because they participated in all or almost all TIMSS surveys at Grades 4 and 8.
Table 4.2 Percentage of students at each proficiency level on the mathematics scale (standard errors in brackets)
Below Level 1 Level 1 Level 2 Level 3 Level 4 Level 5 Level 6
UK 5.9 (0.6) 13.8 (0.7) 24.7 (0.8) 26.3 (0.7) 18.1 (0.6) 8.7 (0.5) 2.5 (0.3)
Scotland 3.8 (0.7) 11.7 (0.9) 24.1 (1.1) 28.2 (1.2) 20.0 (1.2) 9.4 (0.9) 2.7 (0.5)
N. Ireland 7.3 (0.9) 15.3 (1.0) 23.2 (1.1) 23.3 (1.3) 18.8 (1.0) 9.6 (0.8) 2.6 (0.3)
Wales 6.0 (0.5) 16.1 (0.9) 27.0 (1.1) 27.5 (1.1) 16.1 (1.1) 6.0 (0.6) 1.2 (0.3)
England 6.0 (0.7) 13.9 (0.8) 24.7 (1.0) 26.2 (0.8) 18.0.(0.7) 8.7 (0.6) 2.5 (0.3)
OECD average 7.7 (0.1) 13.6 (0.2) 21.9 (0.2) 24.3 (0.2) 19.1 (0.2) 10.0 (0.1) 3.3 (0.1)
Source: Bradshaw et al. (2007), B.6, p. 80.
‘State of the nation’ report I 149The Royal Society
48% of students reached the high benchmark, compared ii.with the international average of 30% and the 43% of the comparison group;
the proportion of students reaching the intermediate iii.benchmark increased significantly from 1995.79
These scores reflect a fairly even performance across the content areas, although chemistry was relatively weak. Boys performed (550) at a significantly higher level than girls (538).
In England, in mathematics:
5% of students reached the advanced benchmark, close i.to the international average of 7% but below the 13% of the comparison group;
performance at the high benchmark was similar to the ii.international average but above it at the intermediate and low benchmarks;
the proportions reaching the various benchmarks were iii.not significantly different from 1995 or 1999.
These scores reflect a performance that was strongest in data and geometry and relatively weaker in numbers, patterns and relationships. There were no significant gender differences in overall performance.
Although students in Scotland performed above the international TIMSS average in both science and mathematics, they generally performed less well than their counterparts in England. In considering the Scottish data, it is important to remember that the students in the Scottish sample were the youngest in the TIMSS survey.
In Scotland, in science:
the score of 512 was significantly higher than the i.international average of 474 but below that of the comparison group of 12 countries (533);
11 of the 46 participating countries outperformed ii.Scotland (Singapore, Chinese Taipei, Republic of Korea, Hong Kong, Estonia, Japan, Hungary, the Netherlands, USA, Australia and Sweden);
nine other countries, including Lithuania, Latvia, Russian iii.Federation and Malaysia, scored at a level not significantly different from Scotland (between 504 and 520);
all other countries scored significantly lower than Scotland.iv.
In Scotland, in mathematics:
the score of 498 was significantly higher than the i.international average (467) but significantly lower than the average for the comparison group (529);
13 of the 46 participating countries outperformed ii.Scotland (Singapore, Republic of Korea, Hong Kong,
79 The TIMSS report (table 2.3) suggests an increase from 75% in 1995 to 81% in 2003. It identifies this increase as statistically significant but cautions that the data relate to a sample that failed to satisfy the sampling criteria.
Chinese Taipei, Japan, Belgium (Flemish), the Netherlands, Estonia, Hungary, Malaysia, Latvia, Russian Federation and Slovak Republic);
six other countries, including Australia, Sweden, USA and iii.New Zealand, scored at a level not significantly different from Scotland (between 492 and 506);
all other countries scored significantly lower than Scotland.iv.
In Scotland, in science:
6% of students reached the advanced benchmark i.compared with the international average of 7% and the 11% of the comparison group. This was a decrease from the 9% of students in Scotland who achieved this benchmark in 1995;80
32% reached the high benchmark compared with the ii.international average of 30% and the 43% of the comparison group;
the proportion of students reaching the intermediate iii.benchmark increased significantly from 1995.
In Scotland, in mathematics:
4% of students reached the advanced benchmark, i.compared with the international average of 7% and below the 13% of the comparison group;
the proportion of students (25%) achieving the high ii.benchmark was slightly above the international average (23%);
the proportions reaching the various benchmarks in 2003 iii.were not significantly different from 1995;
the average score of girls improved significantly since iv.1995. A small decline over the same period in the case of boys was not statistically significant.
4.5 A caution about using international comparisons
The results of large-scale studies tend to be presented in the form of rankings or league tables, despite the complexity of the findings and the care needed in interpreting them. Furthermore, the prominence, potential policy significance and cost81 of large-scale studies such as PISA and TIMSS also mean that the political agenda of governments may lead to the pursuit of questions that are different from those that a purely research-led initiative might seek to address.
80 Scotland did not participate in TIMSS 1999, so comparison with data from this earlier study is not possible even though data for 1995 are available in the TIMSS report for 2003.
81 Prais (2007) has estimated that the total cost of PISA and TIMSS testing in 2003 exceeded 100 million US dollars, to which needs to be added the ‘hidden’ costs of teacher and student time. He also notes that a Parliamentary request for information about locally incurred expenditure in England was refused on the basis that publication could ‘prejudice commercial interests’ in negotiations about subsequent tests.
150 I Science and mathematics education, 14–19 The Royal Society
By investigating different samples of particular age groups at regular time intervals, the data collected are cross-sectional rather than longitudinal. While this allows some trends over time to be established, the data provide limited insight into the factors affecting learning and their long-term influence. If performance on a test item or set of items changes over time, it is possible that this can be attributed to changes in the student population, the curriculum, teaching method(s), to factors that may lie beyond the influence of the system of formal education or to all of these.
Sampling also presents many problems. Age-based sampling needs to take account of the fact that children in different countries start school at different ages. Grade-related sampling encounters the problem that, in some education systems, students are required to stay in a grade until they are successful so that the age range of students in a given grade may be broad.
Both PISA and TIMSS are evolving instruments and many of the shortcomings of earlier international studies have been overcome or ameliorated. Nonetheless, major concerns remain and there is a substantial critical literature. Some of this criticism is technical and some is directed at the way in which the results are interpreted and used to shape policy (eg Brown 1996, 1999; Atkin & Black 1997; Bracey 1997; Elliott & Hufton 2000; von Collani 2001; Pollitt & Ahmed 2001; Adams 2003; Prais 2003; Goldstein 2004). The most fundamental challenges, however, reflect the belief that such tests fail to accommodate the cultural specificity of different education systems, a specificity that renders international rankings questionable at best, and throws into question the simplistic belief that practice and experience in one culture can be readily transferred to another.
4.6 Interpreting PISA and TIMSS
Considerable care is needed when responding to the outcomes of international comparative studies. Media headlines tend to judge a school system on the basis of PISA or TIMSS results that prioritize but relate to only part of the curriculum. Statistically insignificant differences between countries, along with differences in performance on various components of the tests, also tend to be ignored when constructing an international ‘league table’, with countries being categorized too readily as ‘winners’ or ‘losers’. Such headlines influence not only public perceptions about, but also government policy towards, education.82
It is also worth recalling the note of caution expressed above about the base used to compare the performance of students in a given country with that of their peers elsewhere. Reference to the international average rather than the OECD average in PISA data presents a different comparative picture of national performance, and these are simply two of a variety
82 In South Korea, results from international surveys such as TIMSS and PISA are ‘taken into account when revising the curriculum and establishing policies for school inspection’ (Hahn 1995).
of other averages that might be used. For example, instead of comparing the UK science score of 515 in PISA 2006 with the OECD average of 500, it could be compared with the average of 503 for the other countries in the G8 group (Canada, France, Germany, Italy, Japan, the Russian Federation and the USA) or with the average of 473 for all participating countries. Similarly, the UK mathematics score of 495 in PISA 2006 can be set alongside the OECD average of 498, the average of the other G8 countries of 494, or the average of 469 for all participating countries. It is clear, therefore, that, in the case of either TIMSS or PISA, either a more or a less favourable picture of the performance of students in an individual country can be drawn by selecting an appropriate basis for comparison.83
Studies such as TIMSS and PISA inevitably influence how school science or mathematics is conceptualized, taught and assessed and they reflect assumptions that arguably receive too little public scrutiny. Almost all the items used in PISA and TIMSS are kept secret, although a few are in the public domain. The few PISA items that have been released prompt questions about the feasibility of using paper and pencil tests to assess the knowledge and skills deemed essential for 15 year olds if they are to function effectively as future citizens. It seems unlikely that students in every country involved in PISA will need much the same knowledge and skills or face comparable challenges once they have left the education system for the adult world. PISA or TIMSS testing is also regarded more as a matter of national pride in some countries than others,84 although national test results from PISA or TIMSS are widely used to praise or condemn the teaching of school science or mathematics. In effect, PISA and TIMSS promote a globalization of school science and mathematics curricula when there is ample evidence that teaching and learning are markedly historically, socially and culturally contingent (see, for example, Schmidt et al. 1997; Alexander 2000; European Commission 2006).
Little is known about how students respond to the tests and their constituent items, especially since neither PISA nor TIMSS enables any feedback to individual students or their schools. Bradshaw et al. (2007) note that compared to Key Stage 3 and GCSE tests, there were differences in the PISA 2006 tests in the format of the science and particularly mathematics assessment, with students required to read and understand much more contextual information. However, the differences may well go further than this, since much of GCSE assessment has focused on factual recall (an aspect that has been widely criticized), whereas the emphasis in PISA is on mastery of process and understanding of concepts. Furthermore, assessment techniques differ − teacher assessment,
83 Of the G8 countries, Canada, France and Germany did not participate in TIMSS 2003 and, as noted earlier, England (not the UK as in PISA) failed to meet the sampling criteria.
84 In Germany, for example, booklets offering PISA-type tests for self-assessment are best sellers. On the day when TIMSS testing was conducted in Taiwan, students and parents were addressed by a school’s director before the students were marched into the school to accompaniment of the Taiwanese national anthem.
‘State of the nation’ report I 151The Royal Society
for example, plays no part in either TIMSS or PISA. An equivalent comparison has not been made for Scottish Highers.
There are several examples which illustrate, at the very least, the sensitivity of a performance measure to the test instrument. At a high level, gender differences in attainment appear to be reversed: boys on average outscored girls in PISA 2006, girls now generally score more highly than boys in GCSE and S4 examinations (as will be discussed more fully in chapter 5).85 Similarly, regional patterns of attainment were more different than one might expect based on GCSE and A-level results: Wales lagged behind the rest of the UK in all three elements of the PISA 2006 test, as did Northern Ireland, a somewhat surprising finding given that students in Northern Ireland perform better than their counterparts in England and Wales at GCSE and A-levels.
4.7 Conclusion
In the context of the cautions of the two preceding sections, some tentative conclusions can be drawn on what international comparative studies say about the UK. In science the UK PISA 2006 mean score was above the OECD mean, although it was not in the top grouped countries. The mean score of Wales was lowest, at 505, and was significantly lower than that of England, at 516 the highest. It is possible that these relative differences might have appeared different if the results were adjusted for the effects of socioeconomic status, something which is not available in PISA at the country level and an aspect that could be further explored. A positive sign is that relatively high numbers of UK pupils reached the top levels of attainment.
In mathematics, the UK’s result was not statistically significantly below the OECD average and was broadly in line with those of France or Germany and above those of Spain, Norway and the USA. Encouragingly, fewer students attained at the lowest levels. However, there were also fewer attaining at the highest levels compared with the OECD averages. The results below the OECD average were statically significant for England and Wales for Levels 4−6, and for Northern Ireland at
85 It is also important to acknowledge that gender differences in PISA are not uniform across the various components of the individual domains and that, on some of these components, the gender differences in performance are not statistically significant. Of the three PISA major domains, science is the one where the overall gender differences are smallest. In most countries, there are no significant differences in the average scores for males and females.
Level 6. This implies that the general system that has been common to England, Northern Ireland and Wales has not been harnessing the abilities of the most able students, at least as measured by the style of assessment in PISA, and this is something that could be explored further. Furthermore there may be a case for directing more attention to the needs of the most able students in mathematics. This is reinforced by the adjusted TIMSS 2003 tests, which show comparatively low proportions of students in England reaching the advanced benchmark. Both studies suggest that mathematics education for more able students is not such a concern in Scotland, with the proportion of students achieving the high benchmark in TIMSS being slightly above the average, although the proportion reaching the advanced benchmark was still below average.
Neither the science nor mathematics PISA 2006 results have highlighted a failure of the UK educational systems. Indeed, many countries would be extremely pleased to have produced the majority of the results discussed above, and it is perhaps, in England at least, a feature of recent political history that the results received such prominent and negative media coverage. It could be argued that so many reforms, and in some cases extensive investment, should have produced better outcomes and this raises the question of whether the strategy followed to effect educational reform should to be revisited. However, the UK’s place within the overall results is at least in part an effect of other countries also simultaneously seeking and achieving improvements. While it is difficult to draw comparisons, the results of PISA imply that the year-on-year improvement seen in England, Northern Ireland and Wales in GCSE and A-level results does not necessarily translate to performance in other kinds of testing. This observation does not apply to Scotland, where overall rates of attainment for 16 year olds have increased.
Looking to the future, the assessment brought in for the new GCSE science courses, which were taught for the first time in September 2006, is intended to be much broader in its examined and internal aspects. It appears that the questions associated with these courses have more in common with the kinds of test items used in PISA than has been the case with earlier GCSE syllabuses. It must be remembered, however, that international tests do not provide robust measures of school effectiveness, and improved performance in future TIMSS or PISA tests may be better regarded as a consequence, not as the goal, of any educational reform.

152 I Science and mathematics education, 14–19 The Royal Society
The Royal Society ‘State of the nation’ report I 153
5 The impact of gender, socioeconomic status and ethnicity on participation and attainment in science and mathematics subjects in the UK
This chapter does not attempt a full analysis of all available data, but seeks rather to explore the kinds of patterns that can be observed. We recognize that there is an emphasis on England in the analysis; this is largely a result of the data that are available. We were able to access analyses of the increasingly broad PLASC/NPD database in England, which has enabled the presentation of some reasonably complex data for this nation.86 We are not aware of published subject-specific data on ethnicity and socioeconomic status, or proxies, for Northern Ireland, Scotland and Wales, and they cannot, therefore, be included here. All four nations publish data on gender and figures may therefore be presented for each country on this aspect. (Note, however, that the easy availability of gender data may have the pitfall of giving undue weight to gender differences over other relevant student characteristics.) We have not investigated the differences for looked-after students or students with learning difficulties, although these are clearly lines along which inequalities might operate.
5.1 Gender
There is a long history of gender inequalities in science and mathematics in the UK, with girls traditionally participating at lower rates. Each entry in tables 5.1–5.5 gives the
86 Data collected in the Pupil Level Annual Schools Census (PLASC) are matched to the National Pupil Database (NPD) in England, matching student and school characteristics to student-level attainment.
participation rank of the particular subject among those taken by candidates of the stated gender in the stated year, with 1 being the subject with the highest number of entries among the relevant group of candidates. Only the top 10 subjects are ranked, and so an entry of ‘–‘ means that the subject was not among the 10 most popular subjects in the cohort. Comparisons between years are somewhat qualified by the increasing diversity of subjects taken in recent years, and between countries by the different numbers of subjects taken.
The data for England are presented in tables 5.1 and 5.2. At O-level/GCSE, it can be seen from table 5.1 that the disparities present in 1985 had disappeared by 2006, as a result of the requirement that all students study mathematics and a ‘balanced’ science (double-award science for the majority).87 At A-level, however, table 5.2 shows that the traditional gender preference patterns between biology and chemistry had greatly reduced by 2006, while those in physics and mathematics have clearly persisted. Physics has never reached the top 10 subjects taken by girls. The general popularity of both physics and chemistry has declined substantially.
In Scotland, table 5.3 shows that the 1986 pattern for physics and mathematics at age 16 was similar to that in England. There has been no subsequent increase in popularity of biology among males or physics among females. At post-16
87 Viz. chapter 2 of this report, §2.1.2.
This chapter is concerned with inequalities in the participation and outcome of science and mathematics education, particularly in relation to gender, socioeconomic status and ethnic background. In conformity with the rest of the report it will view the issue principally through the lenses of attainment and participation. There is considerable variation between different demographic groupings in terms of their prior attainment, subject choices and their attainment and progression. It should be noted that while data on attainment and participation patterns by gender are available for students across England, Northern Ireland, Scotland and Wales, published data on socioeconomic status and ethnicity are available only from England. In the final section of the chapter we briefly consider research on contextual factors that may provide some explanations for the patterns observed.
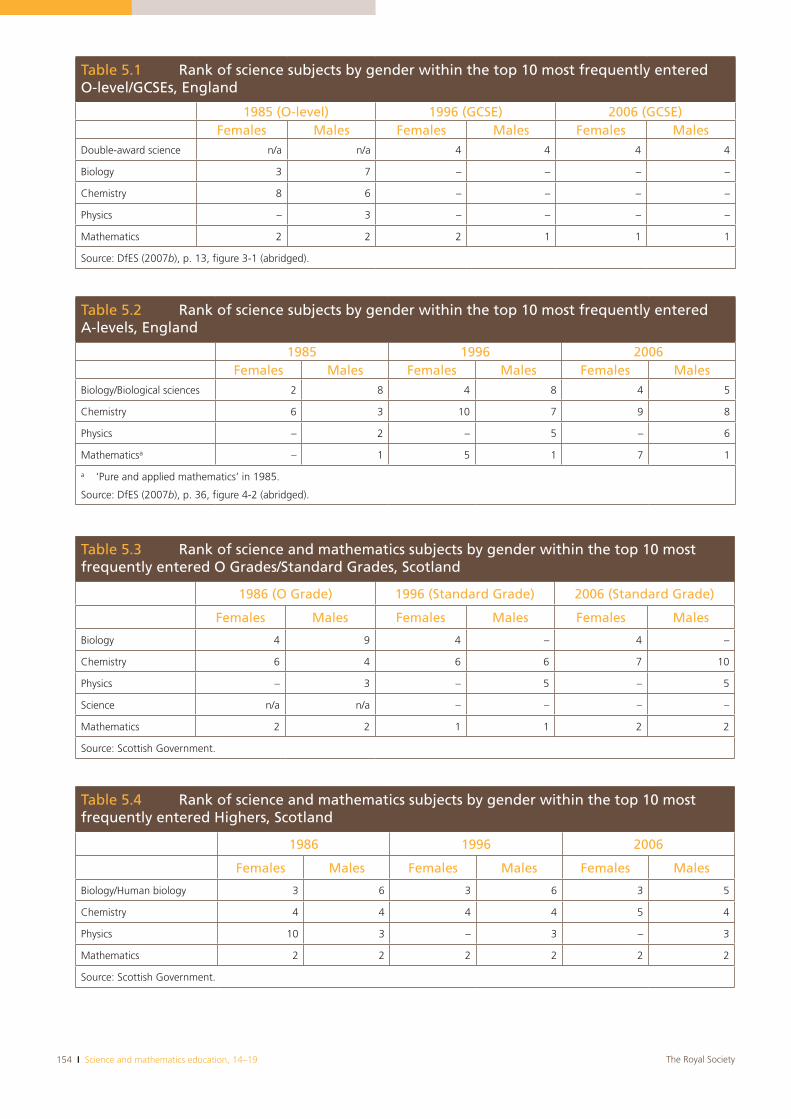
154 I Science and mathematics education, 14–19 The Royal Society
Table 5.1 Rank of science subjects by gender within the top 10 most frequently entered O-level/GCSEs, England
1985 (O-level) 1996 (GCSE) 2006 (GCSE)Females Males Females Males Females Males
Double-award science n/a n/a 4 4 4 4
Biology 3 7 – – – –
Chemistry 8 6 – – – –
Physics – 3 – – – –
Mathematics 2 2 2 1 1 1
Source: DfES (2007b), p. 13, figure 3-1 (abridged).
Table 5.2 Rank of science subjects by gender within the top 10 most frequently entered A-levels, England
1985 1996 2006Females Males Females Males Females Males
Biology/Biological sciences 2 8 4 8 4 5
Chemistry 6 3 10 7 9 8
Physics – 2 – 5 – 6
Mathematicsa – 1 5 1 7 1
a ‘Pure and applied mathematics’ in 1985.
Source: DfES (2007b), p. 36, figure 4-2 (abridged).
Table 5.3 Rank of science and mathematics subjects by gender within the top 10 most frequently entered O Grades/Standard Grades, Scotland
1986 (O Grade) 1996 (Standard Grade) 2006 (Standard Grade)
Females Males Females Males Females Males
Biology 4 9 4 – 4 –
Chemistry 6 4 6 6 7 10
Physics – 3 – 5 – 5
Science n/a n/a – – – –
Mathematics 2 2 1 1 2 2
Source: Scottish Government.
Table 5.4 Rank of science and mathematics subjects by gender within the top 10 most frequently entered Highers, Scotland
1986 1996 2006
Females Males Females Males Females Males
Biology/Human biology 3 6 3 6 3 5
Chemistry 4 4 4 4 5 4
Physics 10 3 – 3 – 3
Mathematics 2 2 2 2 2 2
Source: Scottish Government.
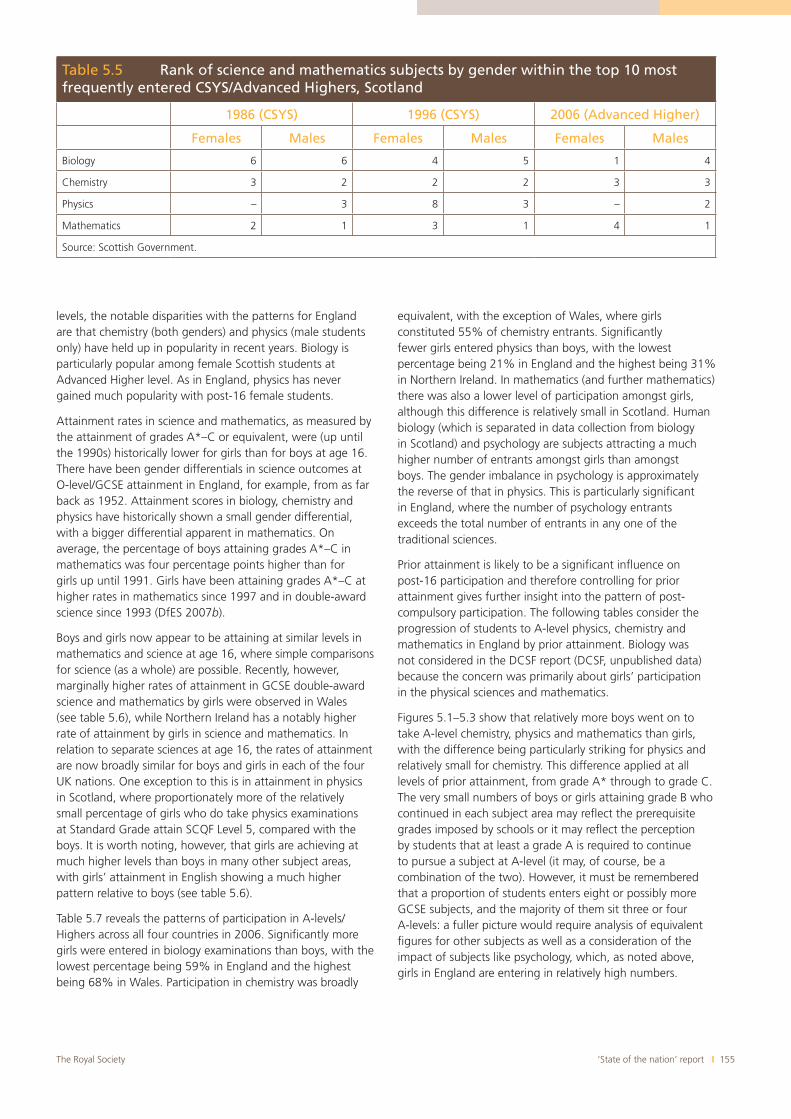
‘State of the nation’ report I 155The Royal Society
levels, the notable disparities with the patterns for England are that chemistry (both genders) and physics (male students only) have held up in popularity in recent years. Biology is particularly popular among female Scottish students at Advanced Higher level. As in England, physics has never gained much popularity with post-16 female students.
Attainment rates in science and mathematics, as measured by the attainment of grades A*–C or equivalent, were (up until the 1990s) historically lower for girls than for boys at age 16. There have been gender differentials in science outcomes at O-level/GCSE attainment in England, for example, from as far back as 1952. Attainment scores in biology, chemistry and physics have historically shown a small gender differential, with a bigger differential apparent in mathematics. On average, the percentage of boys attaining grades A*–C in mathematics was four percentage points higher than for girls up until 1991. Girls have been attaining grades A*–C at higher rates in mathematics since 1997 and in double-award science since 1993 (DfES 2007b).
Boys and girls now appear to be attaining at similar levels in mathematics and science at age 16, where simple comparisons for science (as a whole) are possible. Recently, however, marginally higher rates of attainment in GCSE double-award science and mathematics by girls were observed in Wales (see table 5.6), while Northern Ireland has a notably higher rate of attainment by girls in science and mathematics. In relation to separate sciences at age 16, the rates of attainment are now broadly similar for boys and girls in each of the four UK nations. One exception to this is in attainment in physics in Scotland, where proportionately more of the relatively small percentage of girls who do take physics examinations at Standard Grade attain SCQF Level 5, compared with the boys. It is worth noting, however, that girls are achieving at much higher levels than boys in many other subject areas, with girls’ attainment in English showing a much higher pattern relative to boys (see table 5.6).
Table 5.7 reveals the patterns of participation in A-levels/Highers across all four countries in 2006. Significantly more girls were entered in biology examinations than boys, with the lowest percentage being 59% in England and the highest being 68% in Wales. Participation in chemistry was broadly
equivalent, with the exception of Wales, where girls constituted 55% of chemistry entrants. Significantly fewer girls entered physics than boys, with the lowest percentage being 21% in England and the highest being 31% in Northern Ireland. In mathematics (and further mathematics) there was also a lower level of participation amongst girls, although this difference is relatively small in Scotland. Human biology (which is separated in data collection from biology in Scotland) and psychology are subjects attracting a much higher number of entrants amongst girls than amongst boys. The gender imbalance in psychology is approximately the reverse of that in physics. This is particularly significant in England, where the number of psychology entrants exceeds the total number of entrants in any one of the traditional sciences.
Prior attainment is likely to be a significant influence on post-16 participation and therefore controlling for prior attainment gives further insight into the pattern of post-compulsory participation. The following tables consider the progression of students to A-level physics, chemistry and mathematics in England by prior attainment. Biology was not considered in the DCSF report (DCSF, unpublished data) because the concern was primarily about girls’ participation in the physical sciences and mathematics.
Figures 5.1–5.3 show that relatively more boys went on to take A-level chemistry, physics and mathematics than girls, with the difference being particularly striking for physics and relatively small for chemistry. This difference applied at all levels of prior attainment, from grade A* through to grade C. The very small numbers of boys or girls attaining grade B who continued in each subject area may reflect the prerequisite grades imposed by schools or it may reflect the perception by students that at least a grade A is required to continue to pursue a subject at A-level (it may, of course, be a combination of the two). However, it must be remembered that a proportion of students enters eight or possibly more GCSE subjects, and the majority of them sit three or four A-levels: a fuller picture would require analysis of equivalent figures for other subjects as well as a consideration of the impact of subjects like psychology, which, as noted above, girls in England are entering in relatively high numbers.
Table 5.5 Rank of science and mathematics subjects by gender within the top 10 most frequently entered CSYS/Advanced Highers, Scotland
1986 (CSYS) 1996 (CSYS) 2006 (Advanced Higher)
Females Males Females Males Females Males
Biology 6 6 4 5 1 4
Chemistry 3 2 2 2 3 3
Physics – 3 8 3 – 2
Mathematics 2 1 3 1 4 1
Source: Scottish Government.
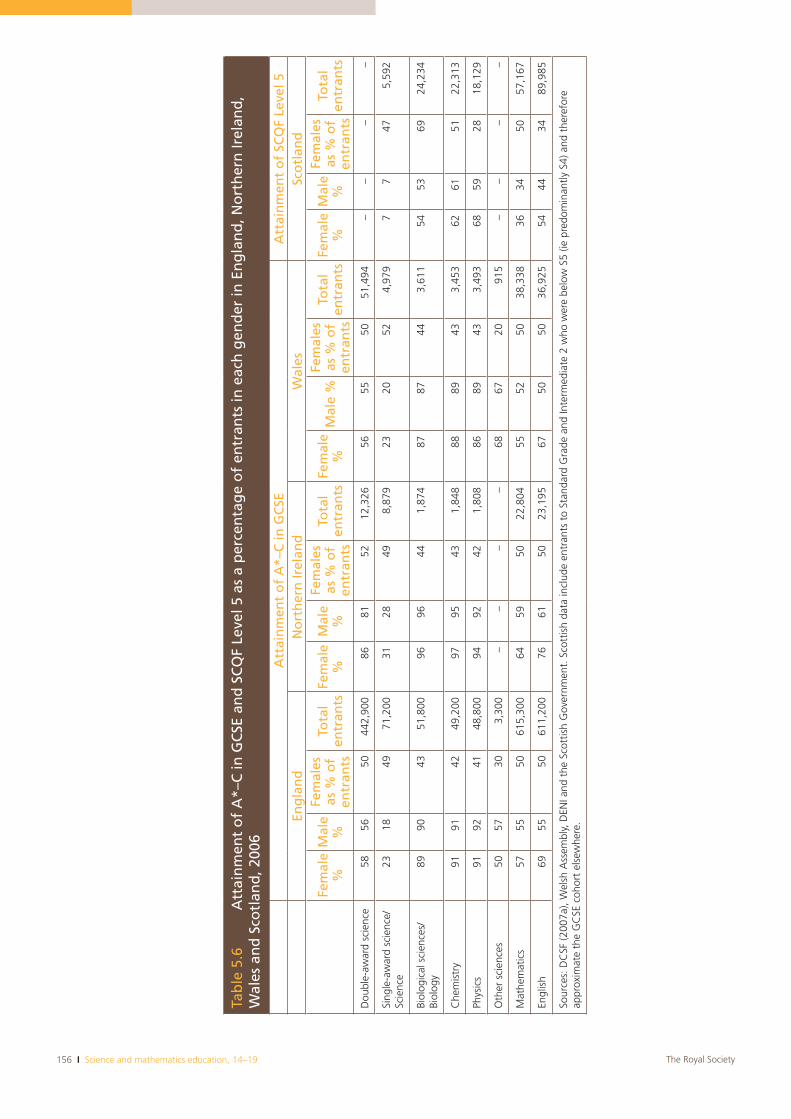
156 I Science and mathematics education, 14–19 The Royal Society
Tab
le 5
.6A
ttai
nm
ent
of
A*–
C in
GC
SE a
nd
SC
QF
Leve
l 5 a
s a
per
cen
tag
e o
f en
tran
ts in
eac
h g
end
er in
En
gla
nd
, No
rth
ern
Irel
and
, W
ales
an
d S
cotl
and
, 200
6
Att
ain
men
t o
f A
*–C
in G
CSE
Att
ain
men
t o
f SC
QF
Leve
l 5En
gla
nd
No
rth
ern
Irel
and
Wal
esSc
otl
and
Fem
ale
%M
ale
%
Fem
ales
as %
of
entr
ants
Tota
l en
tran
tsFe
mal
e%
Mal
e%
Fem
ales
as %
of
entr
ants
Tota
l en
tran
tsFe
mal
e%
Mal
e %
Fem
ales
as %
of
entr
ants
Tota
l en
tran
tsFe
mal
e%
Mal
e%
Fem
ales
as %
of
entr
ants
Tota
l en
tran
ts
Dou
ble-
awar
d sc
ienc
e58
5650
442,
900
8681
5212
,326
5655
5051
,494
––
––
Sing
le-a
war
d sc
ienc
e/Sc
ienc
e23
1849
71,2
0031
2849
8,87
923
2052
4,97
97
747
5,59
2
Biol
ogic
al s
cien
ces/
Biol
ogy
8990
4351
,800
9696
441,
874
8787
443,
611
5453
6924
,234
Che
mis
try
9191
4249
,200
9795
431,
848
8889
433,
453
6261
5122
,313
Phys
ics
9192
4148
,800
9492
421,
808
8689
433,
493
6859
2818
,129
Oth
er s
cien
ces
5057
303,
300
––
––
6867
2091
5–
––
–
Mat
hem
atic
s57
5550
615,
300
6459
5022
,804
5552
5038
,338
3634
5057
,167
Engl
ish
6955
5061
1,20
076
6150
23,1
9567
5050
36,9
2554
4434
89,9
85
Sour
ces:
DC
SF (2
007a
), W
elsh
Ass
embl
y, D
ENI a
nd t
he S
cott
ish
Gov
ernm
ent.
Sco
ttis
h da
ta in
clud
e en
tran
ts t
o St
anda
rd G
rade
and
Inte
rmed
iate
2 w
ho w
ere
belo
w S
5 (ie
pre
dom
inan
tly S
4) a
nd t
here
fore
ap
prox
imat
e th
e G
CSE
coh
ort
else
whe
re.
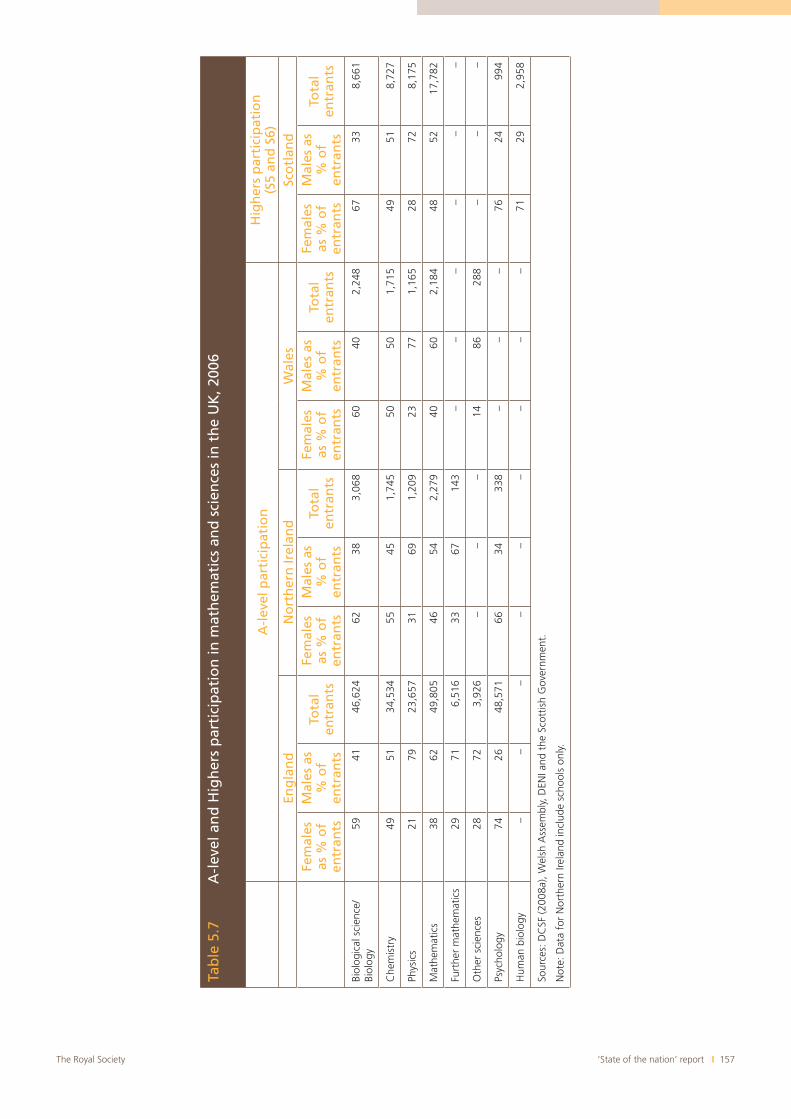
‘State of the nation’ report I 157The Royal Society
Tab
le 5
.7A
-lev
el a
nd
Hig
her
s p
arti
cip
atio
n in
mat
hem
atic
s an
d s
cien
ces
in t
he
UK
, 200
6
A-l
evel
par
tici
pat
ion
Hig
her
s p
arti
cip
atio
n
(S5
and
S6)
Eng
lan
dN
ort
her
n Ir
elan
dW
ales
Sco
tlan
dFe
mal
esas
% o
f en
tran
ts
Mal
es a
s %
of
entr
ants
Tota
l en
tran
ts
Fem
ales
as %
of
entr
ants
Mal
es a
s %
of
entr
ants
Tota
l en
tran
ts
Fem
ales
as %
of
entr
ants
Mal
es a
s %
of
entr
ants
Tota
l en
tran
ts
Fem
ales
as %
of
entr
ants
Mal
es a
s %
of
entr
ants
Tota
l en
tran
ts
Biol
ogic
al s
cien
ce/
Biol
ogy
5941
46,6
2462
383,
068
6040
2,24
867
338,
661
Che
mis
try
4951
34,5
3455
451,
745
5050
1,71
549
518,
727
Phys
ics
2179
23,6
5731
691,
209
2377
1,16
528
728,
175
Mat
hem
atic
s38
6249
,805
4654
2,27
940
602,
184
4852
17,7
82
Furt
her
mat
hem
atic
s29
716,
516
3367
143
––
––
––
Oth
er s
cien
ces
2872
3,92
6–
––
1486
288
––
–
Psyc
holo
gy74
2648
,571
6634
338
––
–76
2499
4
Hum
an b
iolo
gy–
––
––
––
––
7129
2,95
8
Sour
ces:
DC
SF (2
008a
), W
elsh
Ass
embl
y, D
ENI a
nd t
he S
cott
ish
Gov
ernm
ent.
Not
e: D
ata
for
Nor
ther
n Ire
land
incl
ude
scho
ols
only.
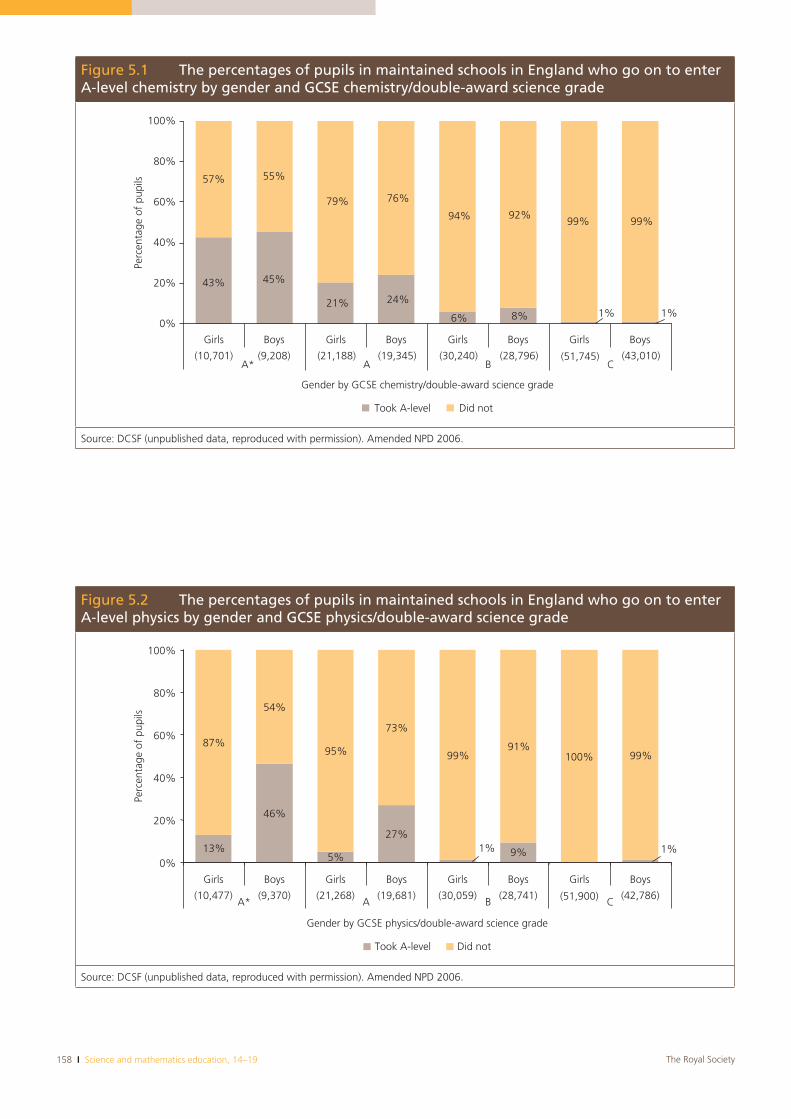
158 I Science and mathematics education, 14–19 The Royal Society
Figure 5.2 The percentages of pupils in maintained schools in England who go on to enter A-level physics by gender and GCSE physics/double-award science grade
46%
5%
27%
9%
87%
54%
95%
73%
99%91%
100% 99%
13% 1%1%0%
20%
40%
60%
80%
100%
Girls Boys Girls Boys Girls Boys Girls Boys
A* A B C
Gender by GCSE physics/double-award science grade
Perc
enta
ge o
f pu
pils
Took A-level Did not
(10,477) (9,370) (21,268) (19,681) (30,059) (28,741) (51,900) (42,786)
Source: DCSF (unpublished data, reproduced with permission). Amended NPD 2006.
Figure 5.1 The percentages of pupils in maintained schools in England who go on to enter A-level chemistry by gender and GCSE chemistry/double-award science grade
45%
21% 24%
8%
57% 55%
79% 76%
94%
6%
92%99% 99%
43%
1%1%0%
20%
40%
60%
80%
100%
Girls Boys Girls Boys Girls Boys Girls Boys
A* A B C
Gender by GCSE chemistry/double-award science grade
Perc
enta
ge o
f pu
pils
Took A-level Did not
(10,701) (9,208) (21,188) (19,345) (30,240) (28,796) (51,745) (43,010)
Source: DCSF (unpublished data, reproduced with permission). Amended NPD 2006.
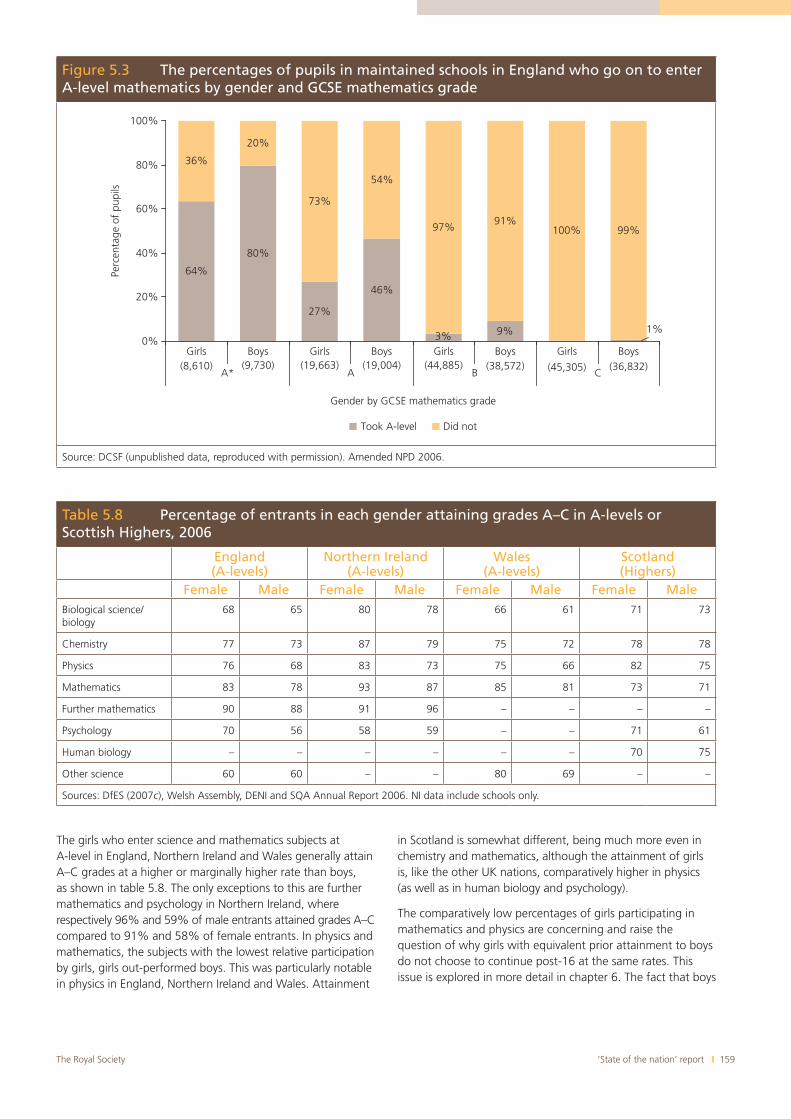
‘State of the nation’ report I 159The Royal Society
The girls who enter science and mathematics subjects at A-level in England, Northern Ireland and Wales generally attain A–C grades at a higher or marginally higher rate than boys, as shown in table 5.8. The only exceptions to this are further mathematics and psychology in Northern Ireland, where respectively 96% and 59% of male entrants attained grades A–C compared to 91% and 58% of female entrants. In physics and mathematics, the subjects with the lowest relative participation by girls, girls out-performed boys. This was particularly notable in physics in England, Northern Ireland and Wales. Attainment
in Scotland is somewhat different, being much more even in chemistry and mathematics, although the attainment of girls is, like the other UK nations, comparatively higher in physics (as well as in human biology and psychology).
The comparatively low percentages of girls participating in mathematics and physics are concerning and raise the question of why girls with equivalent prior attainment to boys do not choose to continue post-16 at the same rates. This issue is explored in more detail in chapter 6. The fact that boys
Figure 5.3 The percentages of pupils in maintained schools in England who go on to enter A-level mathematics by gender and GCSE mathematics grade
64%
80%
27%
46%
3% 9%
36%
20%
73%
54%
97%91%
100% 99%
1%0%
20%
40%
60%
80%
100%
Girls Boys Girls Boys Girls Boys Girls Boys
A* A B C
Gender by GCSE mathematics grade
Perc
enta
ge o
f pu
pils
(8,610) (9,730) (19,663) (19,004) (44,885) (38,572) (45,305) (36,832)
Took A-level Did not
Source: DCSF (unpublished data, reproduced with permission). Amended NPD 2006.
Table 5.8 Percentage of entrants in each gender attaining grades A–C in A-levels or Scottish Highers, 2006
England(A-levels)
Northern Ireland(A-levels)
Wales(A-levels)
Scotland(Highers)
Female Male Female Male Female Male Female MaleBiological science/biology
68 65 80 78 66 61 71 73
Chemistry 77 73 87 79 75 72 78 78
Physics 76 68 83 73 75 66 82 75
Mathematics 83 78 93 87 85 81 73 71
Further mathematics 90 88 91 96 – – – –
Psychology 70 56 58 59 – – 71 61
Human biology – – – – – – 70 75
Other science 60 60 – – 80 69 – –
Sources: DfES (2007c), Welsh Assembly, DENI and SQA Annual Report 2006. NI data include schools only.
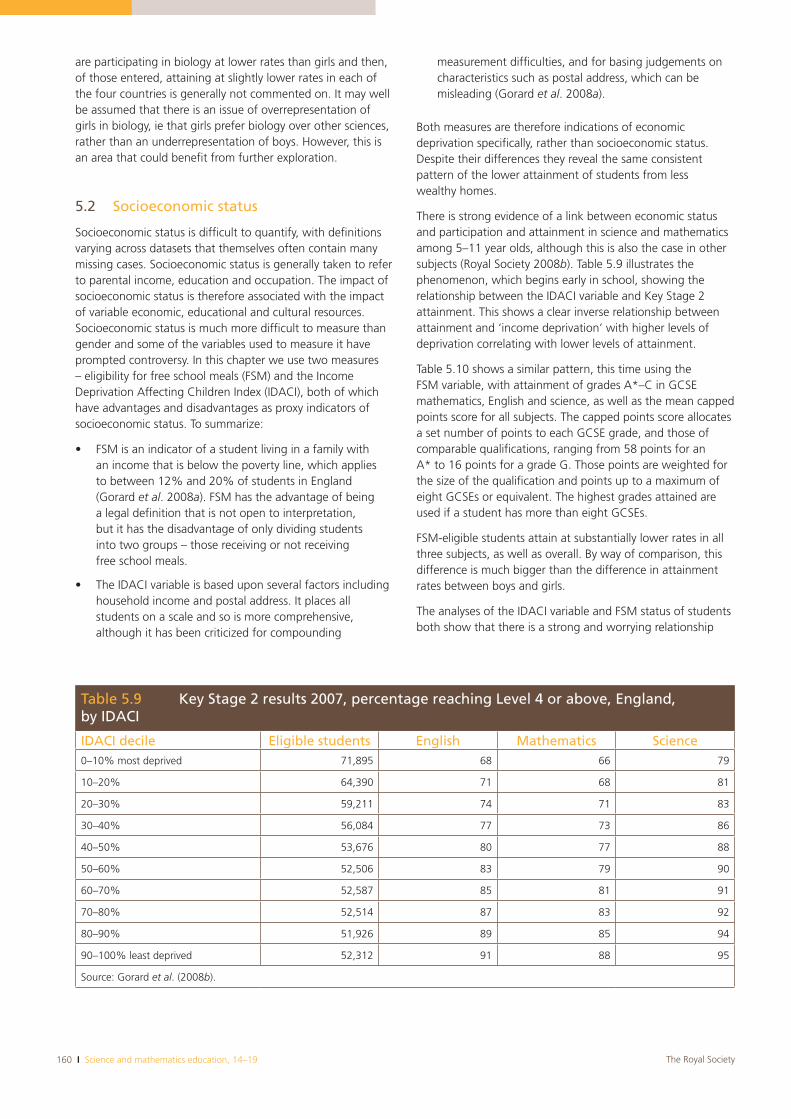
160 I Science and mathematics education, 14–19 The Royal Society
are participating in biology at lower rates than girls and then, of those entered, attaining at slightly lower rates in each of the four countries is generally not commented on. It may well be assumed that there is an issue of overrepresentation of girls in biology, ie that girls prefer biology over other sciences, rather than an underrepresentation of boys. However, this is an area that could benefit from further exploration.
5.2 Socioeconomic status
Socioeconomic status is difficult to quantify, with definitions varying across datasets that themselves often contain many missing cases. Socioeconomic status is generally taken to refer to parental income, education and occupation. The impact of socioeconomic status is therefore associated with the impact of variable economic, educational and cultural resources. Socioeconomic status is much more difficult to measure than gender and some of the variables used to measure it have prompted controversy. In this chapter we use two measures – eligibility for free school meals (FSM) and the Income Deprivation Affecting Children Index (IDACI), both of which have advantages and disadvantages as proxy indicators of socioeconomic status. To summarize:
FSM is an indicator of a student living in a family with an income that is below the poverty line, which applies to between 12% and 20% of students in England (Gorard et al. 2008a). FSM has the advantage of being a legal definition that is not open to interpretation, but it has the disadvantage of only dividing students into two groups – those receiving or not receiving free school meals.
The IDACI variable is based upon several factors including household income and postal address. It places all students on a scale and so is more comprehensive, although it has been criticized for compounding
measurement difficulties, and for basing judgements on characteristics such as postal address, which can be misleading (Gorard et al. 2008a).
Both measures are therefore indications of economic deprivation specifically, rather than socioeconomic status. Despite their differences they reveal the same consistent pattern of the lower attainment of students from less wealthy homes.
There is strong evidence of a link between economic status and participation and attainment in science and mathematics among 5–11 year olds, although this is also the case in other subjects (Royal Society 2008b). Table 5.9 illustrates the phenomenon, which begins early in school, showing the relationship between the IDACI variable and Key Stage 2 attainment. This shows a clear inverse relationship between attainment and ‘income deprivation’ with higher levels of deprivation correlating with lower levels of attainment.
Table 5.10 shows a similar pattern, this time using the FSM variable, with attainment of grades A*–C in GCSE mathematics, English and science, as well as the mean capped points score for all subjects. The capped points score allocates a set number of points to each GCSE grade, and those of comparable qualifications, ranging from 58 points for an A* to 16 points for a grade G. Those points are weighted for the size of the qualification and points up to a maximum of eight GCSEs or equivalent. The highest grades attained are used if a student has more than eight GCSEs.
FSM-eligible students attain at substantially lower rates in all three subjects, as well as overall. By way of comparison, this difference is much bigger than the difference in attainment rates between boys and girls.
The analyses of the IDACI variable and FSM status of students both show that there is a strong and worrying relationship
Table 5.9 Key Stage 2 results 2007, percentage reaching Level 4 or above, England, by IDACI
IDACI decile Eligible students English Mathematics Science0–10% most deprived 71,895 68 66 79
10–20% 64,390 71 68 81
20–30% 59,211 74 71 83
30–40% 56,084 77 73 86
40–50% 53,676 80 77 88
50–60% 52,506 83 79 90
60–70% 52,587 85 81 91
70–80% 52,514 87 83 92
80–90% 51,926 89 85 94
90–100% least deprived 52,312 91 88 95
Source: Gorard et al. (2008b).
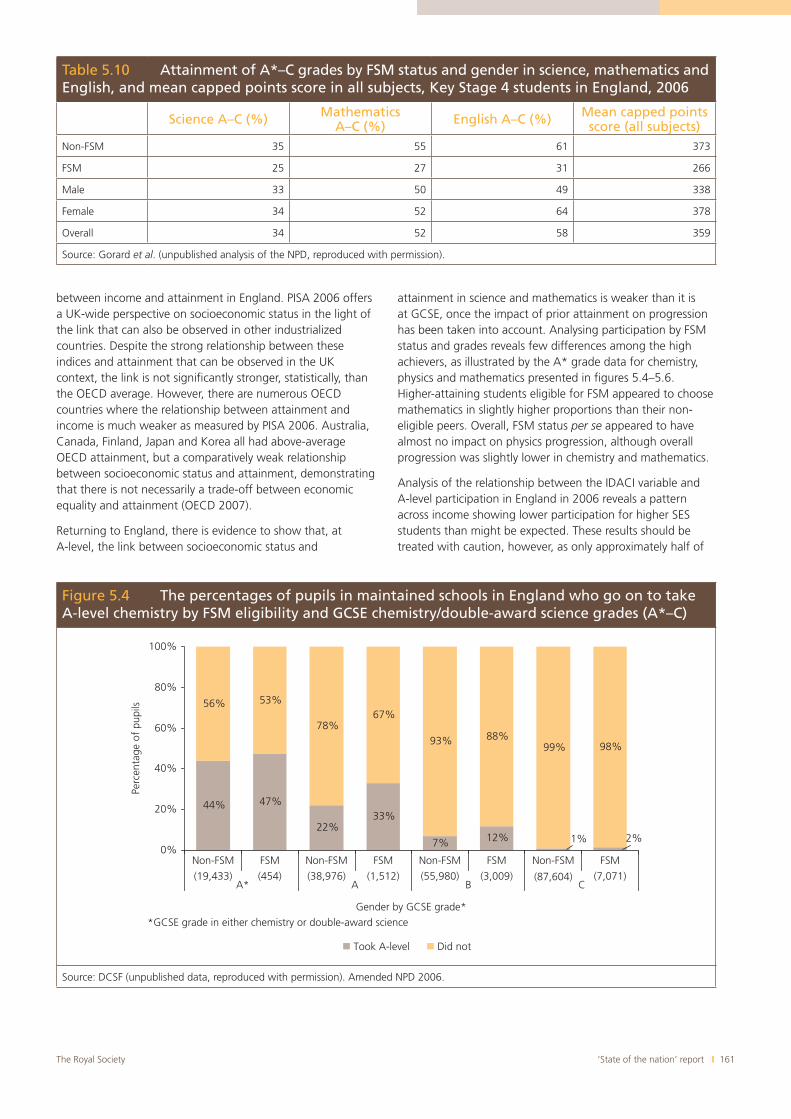
‘State of the nation’ report I 161The Royal Society
between income and attainment in England. PISA 2006 offers a UK-wide perspective on socioeconomic status in the light of the link that can also be observed in other industrialized countries. Despite the strong relationship between these indices and attainment that can be observed in the UK context, the link is not significantly stronger, statistically, than the OECD average. However, there are numerous OECD countries where the relationship between attainment and income is much weaker as measured by PISA 2006. Australia, Canada, Finland, Japan and Korea all had above-average OECD attainment, but a comparatively weak relationship between socioeconomic status and attainment, demonstrating that there is not necessarily a trade-off between economic equality and attainment (OECD 2007).
Returning to England, there is evidence to show that, at A-level, the link between socioeconomic status and
attainment in science and mathematics is weaker than it is at GCSE, once the impact of prior attainment on progression has been taken into account. Analysing participation by FSM status and grades reveals few differences among the high achievers, as illustrated by the A* grade data for chemistry, physics and mathematics presented in figures 5.4–5.6. Higher-attaining students eligible for FSM appeared to choose mathematics in slightly higher proportions than their non-eligible peers. Overall, FSM status per se appeared to have almost no impact on physics progression, although overall progression was slightly lower in chemistry and mathematics.
Analysis of the relationship between the IDACI variable and A-level participation in England in 2006 reveals a pattern across income showing lower participation for higher SES students than might be expected. These results should be treated with caution, however, as only approximately half of
Table 5.10 Attainment of A*–C grades by FSM status and gender in science, mathematics and English, and mean capped points score in all subjects, Key Stage 4 students in England, 2006
Science A–C (%) MathematicsA–C (%) English A–C (%) Mean capped points
score (all subjects)Non-FSM 35 55 61 373
FSM 25 27 31 266
Male 33 50 49 338
Female 34 52 64 378
Overall 34 52 58 359
Source: Gorard et al. (unpublished analysis of the NPD, reproduced with permission).
Figure 5.4 The percentages of pupils in maintained schools in England who go on to take A-level chemistry by FSM eligibility and GCSE chemistry/double-award science grades (A*–C)
44% 47%
22%33%
7% 12%
56% 53%
78%67%
93% 88%99% 98%
2%1%0%
20%
40%
60%
80%
100%
Non-FSM FSM Non-FSM FSM Non-FSM FSM Non-FSM FSM
A* A B C
Perc
enta
ge o
f pu
pils
Took A-level Did not
*GCSE grade in either chemistry or double-award science
Gender by GCSE grade*
(19,433) (454) (38,976) (1,512) (55,980) (3,009) (87,604) (7,071)
Source: DCSF (unpublished data, reproduced with permission). Amended NPD 2006.
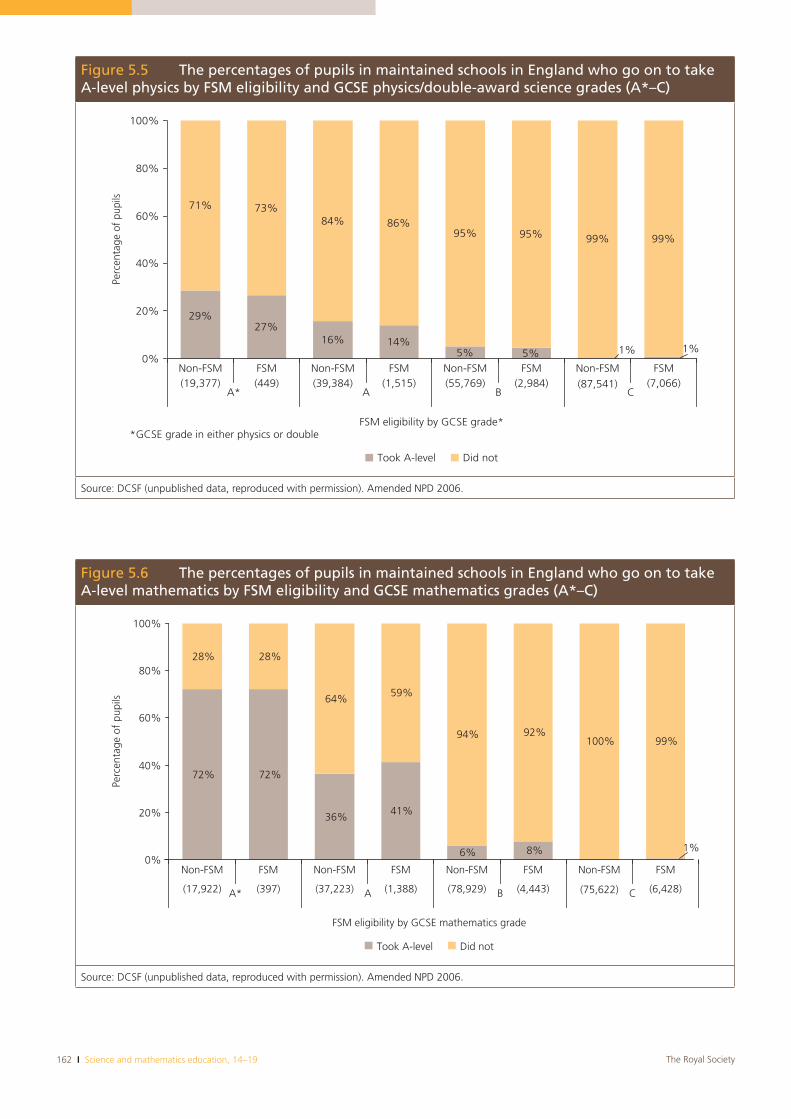
162 I Science and mathematics education, 14–19 The Royal Society
Figure 5.5 The percentages of pupils in maintained schools in England who go on to take A-level physics by FSM eligibility and GCSE physics/double-award science grades (A*–C)
27%16% 14%
5% 5%
71% 73%84% 86%
95% 95% 99% 99%
29%
1% 1%0%
20%
40%
60%
80%
100%
Non-FSM FSM Non-FSM FSM Non-FSM FSM Non-FSM FSM
A* A B C
FSM eligibility by GCSE grade*
Perc
enta
ge o
f pu
pils
Took A-level Did not
*GCSE grade in either physics or double
(19,377) (449) (39,384) (1,515) (55,769) (2,984) (87,541) (7,066)
Source: DCSF (unpublished data, reproduced with permission). Amended NPD 2006.
Figure 5.6 The percentages of pupils in maintained schools in England who go on to take A-level mathematics by FSM eligibility and GCSE mathematics grades (A*–C)
72% 72%
36% 41%
6% 8%
28% 28%
64% 59%
94% 92%100% 99%
1%0%
20%
40%
60%
80%
100%
Non-FSM FSM Non-FSM FSM Non-FSM FSM Non-FSM FSM
A* A B C
FSM eligibility by GCSE mathematics grade
Perc
enta
ge o
f pu
pils
Took A-level Did not
(17,922) (397) (37,223) (1,388) (78,929) (4,443) (75,622) (6,428)
Source: DCSF (unpublished data, reproduced with permission). Amended NPD 2006.
‘State of the nation’ report I 163The Royal Society
all students had a recorded IDACI variable. Table 5.11 divides all of the students in the National Pupil Database (NPD) with a recorded IDACI variable into three groups – low, middle and high measures of deprivation – with low and high representing the upper and lower quartiles. The table presents data on the upper and middle quartile and the central two quartiles (50%). It shows the likelihood of students participating in A-level science and mathematics relative to what might be expected if participation were equally distributed (ie the percentage of actual participants coming from a particular IDACI group over the percentage that grouping contributes to the whole cohort). The further from 1, the greater the difference in relative participation. These data are not adjusted for prior attainment.
The only area where any potentially significant difference is evident is in the relative participation of students from the lower quartile, where they are somewhat underrepresented in physics and mathematics.
A similar analysis of A-level attainment, in table 5.12, shows that proportionately fewer students in the lowest income quartiles obtained high grades than the numbers in the cohort would suggest. The issue is most significant in physics.
Table 5.12 Relative attainment of students at maintained schools in England at A-level (A–C grades) by low, middle and high IDACI variable
Low Middle HighMathematics 0.8 1.1 1.0
Physics 0.6 1.1 1.1
Chemistry 0.8 1.1 0.9
Biology 0.8 1.1 1.0
Source: Boaler & Newton (unpublished data based on an analysis of the NPD, reproduced with permission).
The reasons that students from poorer backgrounds achieve at lower levels pre- and post-16 – in science and non-science subjects (Gorard & See 2008) – are complex and have been the subject of many analyses. Some possible explanations are discussed in more detail in sections 5.6.1 and 5.6.2.
5.3 Ethnicity
Whereas the patterns that prevail in analyses of gender suggest differences in subject choice and analyses of
Table 5.11 Relative participation of maintained students in England at A-level by low, middle and high IDACI variable
Low (25% of students) Middle (50% of students) High (25% of students)Mathematics 0.8 1.1 1.0
Physics 0.7 1.1 1.0
Chemistry 0.9 1.1 0.9
Biology 0.9 1.1 0.9
Source: Boaler & Newton (unpublished data based on an analysis of the NPD, reproduced with permission).
Table 5.13 Attainment of grades A*–C by ethnicity in science, mathematics and English, and mean capped points score in all subjects, Key Stage 4 students in England, 2006
ScienceA*–C (%)
MathematicsA*–C (%)
EnglishA*–C (%)
Mean capped points score (all subjects) n
African 31 46 50 331 10,873
Bangladeshi 32 48 52 362 5,871
Caribbean 30 36 47 317 8,647
Chinese 41 80 66 455 2,332
Indian 39 68 69 419 13,652
Pakistani 31 43 46 344 14,024
White British 34 52 57 360 486,470
Source: Gorard et al. (unpublished analysis of the NPD, reproduced with permission).
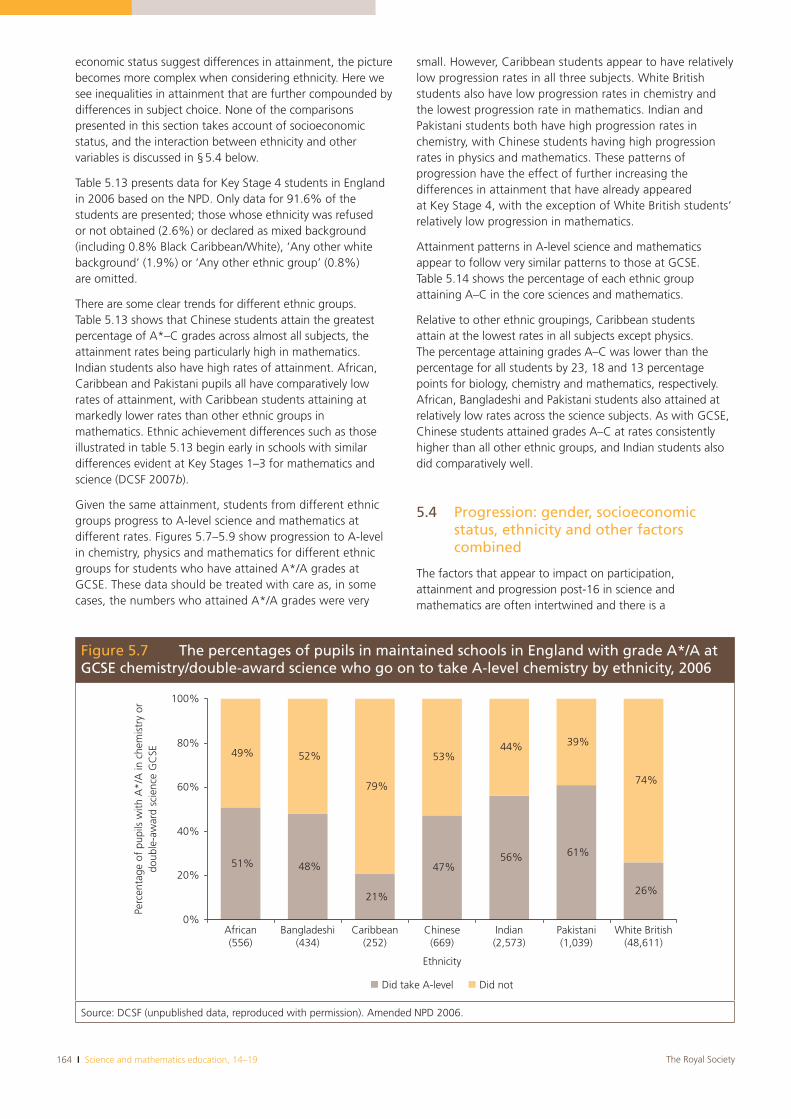
164 I Science and mathematics education, 14–19 The Royal Society
economic status suggest differences in attainment, the picture becomes more complex when considering ethnicity. Here we see inequalities in attainment that are further compounded by differences in subject choice. None of the comparisons presented in this section takes account of socioeconomic status, and the interaction between ethnicity and other variables is discussed in §5.4 below.
Table 5.13 presents data for Key Stage 4 students in England in 2006 based on the NPD. Only data for 91.6% of the students are presented; those whose ethnicity was refused or not obtained (2.6%) or declared as mixed background (including 0.8% Black Caribbean/White), ‘Any other white background’ (1.9%) or ‘Any other ethnic group’ (0.8%) are omitted.
There are some clear trends for different ethnic groups. Table 5.13 shows that Chinese students attain the greatest percentage of A*–C grades across almost all subjects, the attainment rates being particularly high in mathematics. Indian students also have high rates of attainment. African, Caribbean and Pakistani pupils all have comparatively low rates of attainment, with Caribbean students attaining at markedly lower rates than other ethnic groups in mathematics. Ethnic achievement differences such as those illustrated in table 5.13 begin early in schools with similar differences evident at Key Stages 1–3 for mathematics and science (DCSF 2007b).
Given the same attainment, students from different ethnic groups progress to A-level science and mathematics at different rates. Figures 5.7–5.9 show progression to A-level in chemistry, physics and mathematics for different ethnic groups for students who have attained A*/A grades at GCSE. These data should be treated with care as, in some cases, the numbers who attained A*/A grades were very
small. However, Caribbean students appear to have relatively low progression rates in all three subjects. White British students also have low progression rates in chemistry and the lowest progression rate in mathematics. Indian and Pakistani students both have high progression rates in chemistry, with Chinese students having high progression rates in physics and mathematics. These patterns of progression have the effect of further increasing the differences in attainment that have already appeared at Key Stage 4, with the exception of White British students’ relatively low progression in mathematics.
Attainment patterns in A-level science and mathematics appear to follow very similar patterns to those at GCSE. Table 5.14 shows the percentage of each ethnic group attaining A–C in the core sciences and mathematics.
Relative to other ethnic groupings, Caribbean students attain at the lowest rates in all subjects except physics. The percentage attaining grades A–C was lower than the percentage for all students by 23, 18 and 13 percentage points for biology, chemistry and mathematics, respectively. African, Bangladeshi and Pakistani students also attained at relatively low rates across the science subjects. As with GCSE, Chinese students attained grades A–C at rates consistently higher than all other ethnic groups, and Indian students also did comparatively well.
5.4 Progression: gender, socioeconomic status, ethnicity and other factors combined
The factors that appear to impact on participation, attainment and progression post-16 in science and mathematics are often intertwined and there is a
Figure 5.7 The percentages of pupils in maintained schools in England with grade A*/A at GCSE chemistry/double-award science who go on to take A-level chemistry by ethnicity, 2006
51% 48%
21%
47%56% 61%
26%
49% 52%
79%
53%44% 39%
74%
0%
20%
40%
60%
80%
100%
African Bangladeshi Caribbean Chinese Indian Pakistani White British
Ethnicity
Perc
enta
ge o
f pu
pils
with
A*/
A in
che
mis
try
ordo
uble
-aw
ard
scie
nce
GC
SE
Did take A-level Did not
(556) (434) (252) (669) (2,573) (1,039) (48,611)
Source: DCSF (unpublished data, reproduced with permission). Amended NPD 2006.
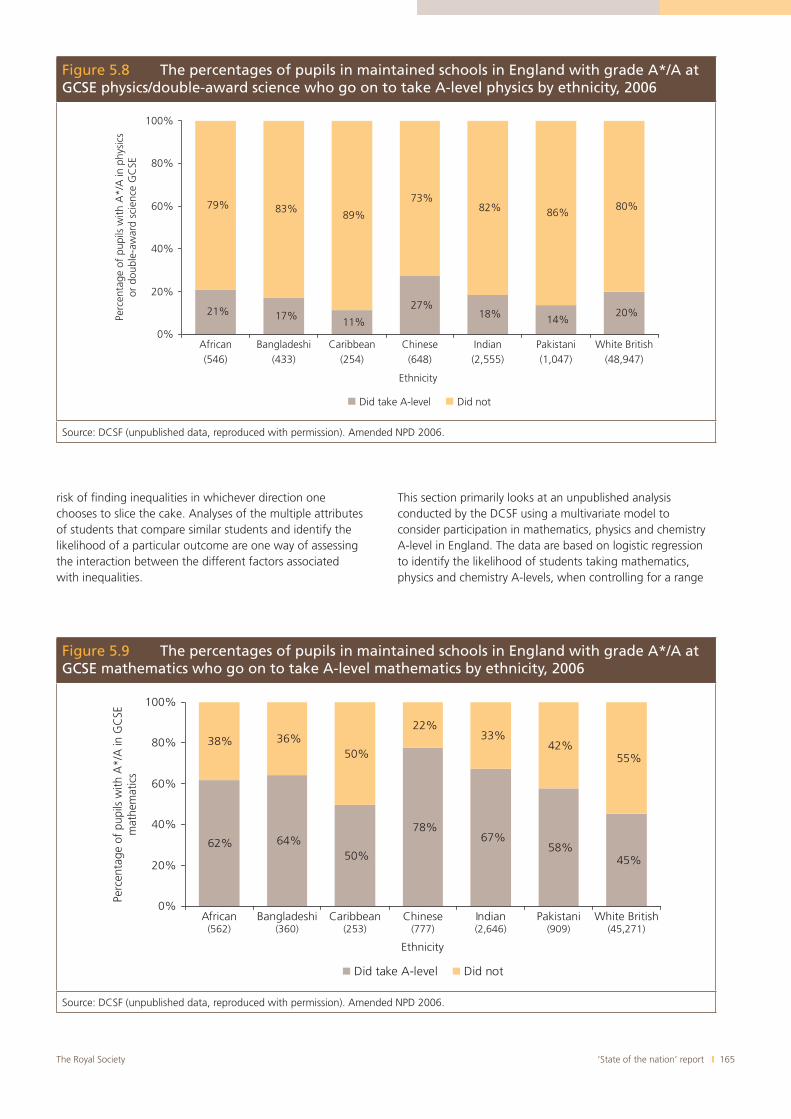
‘State of the nation’ report I 165The Royal Society
Figure 5.8 The percentages of pupils in maintained schools in England with grade A*/A at GCSE physics/double-award science who go on to take A-level physics by ethnicity, 2006
17%11%
27%14%
79% 83%89%
73%82% 86%
80%
18% 20%21%
0%
20%
40%
60%
80%
100%
African Bangladeshi Caribbean Chinese Indian Pakistani White British
Ethnicity
Perc
enta
ge o
f pu
pils
with
A*/
A in
phy
sics
or d
oubl
e-aw
ard
scie
nce
GC
SE
Did take A-level Did not
(546) (433) (254) (648) (2,555) (1,047) (48,947)
Source: DCSF (unpublished data, reproduced with permission). Amended NPD 2006.
Figure 5.9 The percentages of pupils in maintained schools in England with grade A*/A at GCSE mathematics who go on to take A-level mathematics by ethnicity, 2006
62% 64%50%
78%67%
58%
38% 36%50%
22%33%
42%55%
45%
0%
20%
40%
60%
80%
100%
African(562)
Bangladeshi(360)
Caribbean(253)
Chinese(777)
Indian(2,646)
Pakistani(909)
White British(45,271)
Ethnicity
Perc
enta
ge o
f pu
pils
with
A*/
A in
GC
SEm
athe
mat
ics
Did take A-level Did not
Source: DCSF (unpublished data, reproduced with permission). Amended NPD 2006.
risk of finding inequalities in whichever direction one chooses to slice the cake. Analyses of the multiple attributes of students that compare similar students and identify the likelihood of a particular outcome are one way of assessing the interaction between the different factors associated with inequalities.
This section primarily looks at an unpublished analysis conducted by the DCSF using a multivariate model to consider participation in mathematics, physics and chemistry A-level in England. The data are based on logistic regression to identify the likelihood of students taking mathematics, physics and chemistry A-levels, when controlling for a range
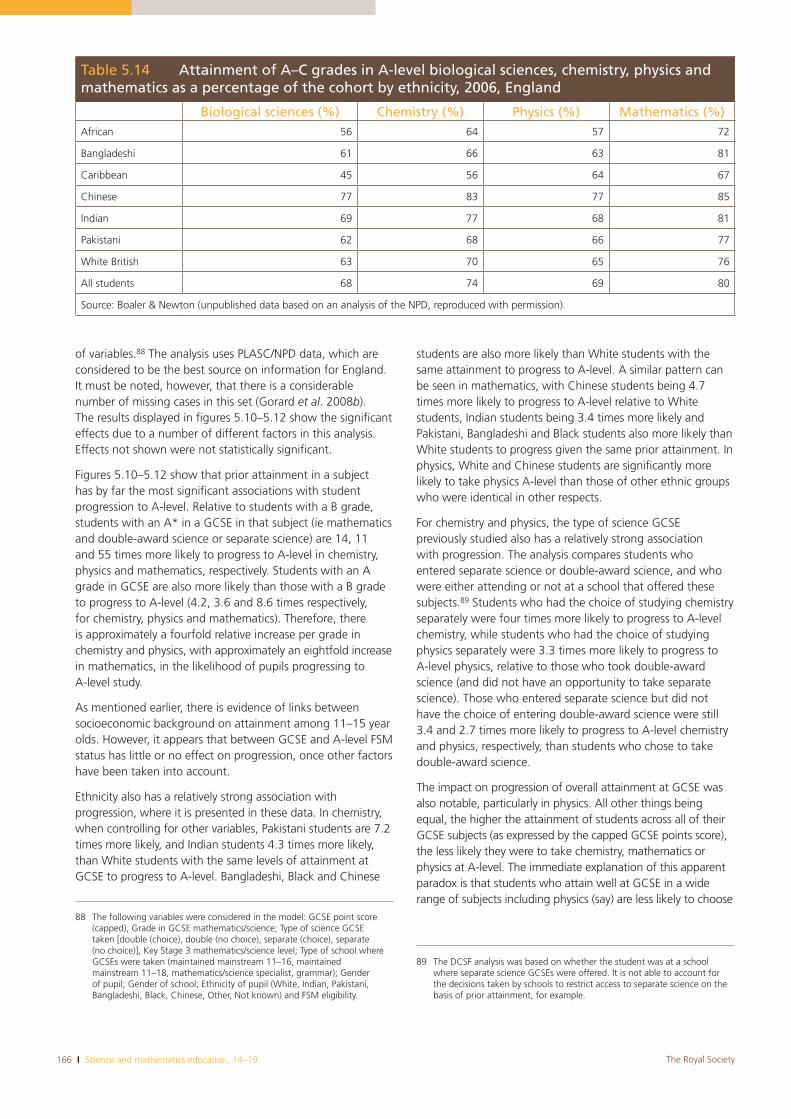
166 I Science and mathematics education, 14–19 The Royal Society
of variables.88 The analysis uses PLASC/NPD data, which are considered to be the best source on information for England. It must be noted, however, that there is a considerable number of missing cases in this set (Gorard et al. 2008b).The results displayed in figures 5.10–5.12 show the significant effects due to a number of different factors in this analysis. Effects not shown were not statistically significant.
Figures 5.10–5.12 show that prior attainment in a subject has by far the most significant associations with student progression to A-level. Relative to students with a B grade, students with an A* in a GCSE in that subject (ie mathematics and double-award science or separate science) are 14, 11 and 55 times more likely to progress to A-level in chemistry, physics and mathematics, respectively. Students with an A grade in GCSE are also more likely than those with a B grade to progress to A-level (4.2, 3.6 and 8.6 times respectively, for chemistry, physics and mathematics). Therefore, there is approximately a fourfold relative increase per grade in chemistry and physics, with approximately an eightfold increase in mathematics, in the likelihood of pupils progressing to A-level study.
As mentioned earlier, there is evidence of links between socioeconomic background on attainment among 11–15 year olds. However, it appears that between GCSE and A-level FSM status has little or no effect on progression, once other factors have been taken into account.
Ethnicity also has a relatively strong association with progression, where it is presented in these data. In chemistry, when controlling for other variables, Pakistani students are 7.2 times more likely, and Indian students 4.3 times more likely, than White students with the same levels of attainment at GCSE to progress to A-level. Bangladeshi, Black and Chinese
88 The following variables were considered in the model: GCSE point score (capped), Grade in GCSE mathematics/science; Type of science GCSE taken [double (choice), double (no choice), separate (choice), separate (no choice)], Key Stage 3 mathematics/science level; Type of school where GCSEs were taken (maintained mainstream 11–16, maintained mainstream 11–18, mathematics/science specialist, grammar); Gender of pupil; Gender of school; Ethnicity of pupil (White, Indian, Pakistani, Bangladeshi, Black, Chinese, Other, Not known) and FSM eligibility.
students are also more likely than White students with the same attainment to progress to A-level. A similar pattern can be seen in mathematics, with Chinese students being 4.7 times more likely to progress to A-level relative to White students, Indian students being 3.4 times more likely and Pakistani, Bangladeshi and Black students also more likely than White students to progress given the same prior attainment. In physics, White and Chinese students are significantly more likely to take physics A-level than those of other ethnic groups who were identical in other respects.
For chemistry and physics, the type of science GCSE previously studied also has a relatively strong association with progression. The analysis compares students who entered separate science or double-award science, and who were either attending or not at a school that offered these subjects.89 Students who had the choice of studying chemistry separately were four times more likely to progress to A-level chemistry, while students who had the choice of studying physics separately were 3.3 times more likely to progress to A-level physics, relative to those who took double-award science (and did not have an opportunity to take separate science). Those who entered separate science but did not have the choice of entering double-award science were still 3.4 and 2.7 times more likely to progress to A-level chemistry and physics, respectively, than students who chose to take double-award science.
The impact on progression of overall attainment at GCSE was also notable, particularly in physics. All other things being equal, the higher the attainment of students across all of their GCSE subjects (as expressed by the capped GCSE points score), the less likely they were to take chemistry, mathematics or physics at A-level. The immediate explanation of this apparent paradox is that students who attain well at GCSE in a wide range of subjects including physics (say) are less likely to choose
89 The DCSF analysis was based on whether the student was at a school where separate science GCSEs were offered. It is not able to account for the decisions taken by schools to restrict access to separate science on the basis of prior attainment, for example.
Table 5.14 Attainment of A–C grades in A-level biological sciences, chemistry, physics and mathematics as a percentage of the cohort by ethnicity, 2006, England
Biological sciences (%) Chemistry (%) Physics (%) Mathematics (%)African 56 64 57 72
Bangladeshi 61 66 63 81
Caribbean 45 56 64 67
Chinese 77 83 77 85
Indian 69 77 68 81
Pakistani 62 68 66 77
White British 63 70 65 76
All students 68 74 69 80
Source: Boaler & Newton (unpublished data based on an analysis of the NPD, reproduced with permission).
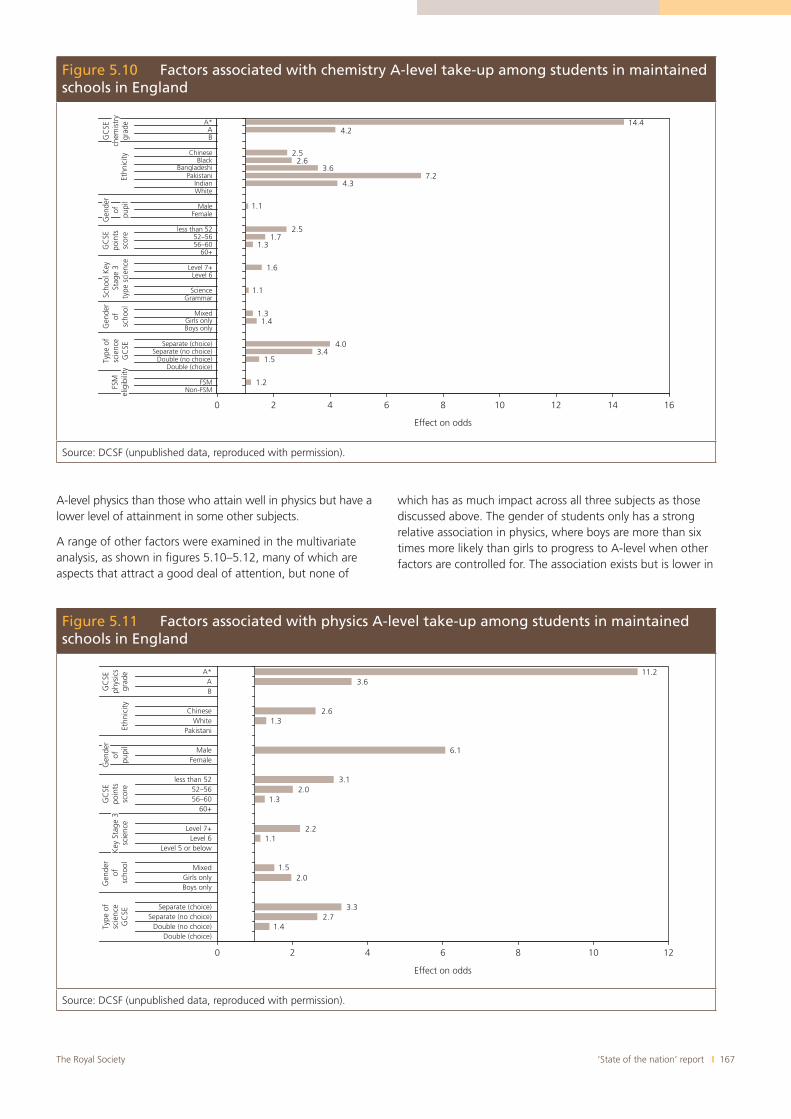
‘State of the nation’ report I 167The Royal Society
A-level physics than those who attain well in physics but have a lower level of attainment in some other subjects.
A range of other factors were examined in the multivariate analysis, as shown in figures 5.10–5.12, many of which are aspects that attract a good deal of attention, but none of
which has as much impact across all three subjects as those discussed above. The gender of students only has a strong relative association in physics, where boys are more than six times more likely than girls to progress to A-level when other factors are controlled for. The association exists but is lower in
Figure 5.10 Factors associated with chemistry A-level take-up among students in maintained schools in England
1.2
1.53.4
4.0
1.41.3
1.1
1.6
1.31.7
2.5
1.1
4.37.2
3.62.6
2.5
4.214.4
0 2 4 6 8 10 12 14 16
Non-FSMFSM
Double (choice)Double (no choice)
Separate (no choice)Separate (choice)
Boys onlyGirls only
Mixed
GrammarScience
Level 6Level 7+
60+56–6052–56
less than 52
FemaleMale
WhiteIndian
PakistaniBangladeshi
BlackChinese
BA
A*
Type
of
scie
nce
GC
SE
Gen
der
ofsc
hool
GC
SEpo
ints
scor
eEt
hnic
ity
Effect on odds
FSM
elig
ibili
ty
Scho
ol K
ey
Sta
ge 3
type
sci
ence
Gen
der
ofpu
pil
GC
SEch
emis
try
grad
e
Source: DCSF (unpublished data, reproduced with permission).
Figure 5.11 Factors associated with physics A-level take-up among students in maintained schools in England
1.42.7
3.3
2.01.5
1.12.2
1.32.0
3.1
6.1
1.32.6
3.611.2
0 2 4 6 8 10 12
Double (choice)Double (no choice)
Separate (no choice)Separate (choice)
Boys onlyGirls only
Mixed
Level 5 or belowLevel 6
Level 7+
60+56–6052–56
less than 52
FemaleMale
PakistaniWhite
Chinese
BA
A*
Type
of
scie
nce
GC
SE
Gen
der
ofsc
hool
GC
SEpo
ints
scor
eEt
hnic
ity
GC
SEph
ysic
sgr
ade
Effect on odds
Key
Sta
ge 3
scie
nce
Gen
der
ofpu
pil
Source: DCSF (unpublished data, reproduced with permission).
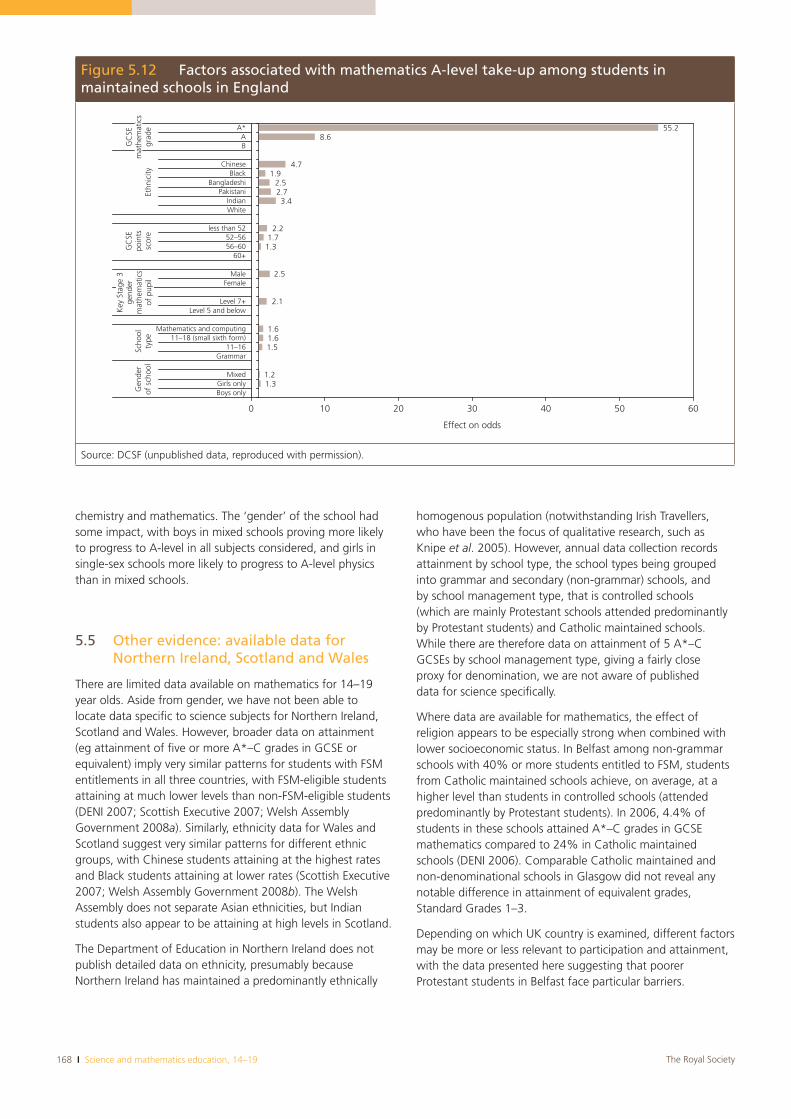
168 I Science and mathematics education, 14–19 The Royal Society
chemistry and mathematics. The ‘gender’ of the school had some impact, with boys in mixed schools proving more likely to progress to A-level in all subjects considered, and girls in single-sex schools more likely to progress to A-level physics than in mixed schools.
5.5 Other evidence: available data for Northern Ireland, Scotland and Wales
There are limited data available on mathematics for 14–19 year olds. Aside from gender, we have not been able to locate data specific to science subjects for Northern Ireland, Scotland and Wales. However, broader data on attainment (eg attainment of five or more A*–C grades in GCSE or equivalent) imply very similar patterns for students with FSM entitlements in all three countries, with FSM-eligible students attaining at much lower levels than non-FSM-eligible students (DENI 2007; Scottish Executive 2007; Welsh Assembly Government 2008a). Similarly, ethnicity data for Wales and Scotland suggest very similar patterns for different ethnic groups, with Chinese students attaining at the highest rates and Black students attaining at lower rates (Scottish Executive 2007; Welsh Assembly Government 2008b). The Welsh Assembly does not separate Asian ethnicities, but Indian students also appear to be attaining at high levels in Scotland.
The Department of Education in Northern Ireland does not publish detailed data on ethnicity, presumably because Northern Ireland has maintained a predominantly ethnically
homogenous population (notwithstanding Irish Travellers, who have been the focus of qualitative research, such as Knipe et al. 2005). However, annual data collection records attainment by school type, the school types being grouped into grammar and secondary (non-grammar) schools, and by school management type, that is controlled schools (which are mainly Protestant schools attended predominantly by Protestant students) and Catholic maintained schools. While there are therefore data on attainment of 5 A*–C GCSEs by school management type, giving a fairly close proxy for denomination, we are not aware of published data for science specifically.
Where data are available for mathematics, the effect of religion appears to be especially strong when combined with lower socioeconomic status. In Belfast among non-grammar schools with 40% or more students entitled to FSM, students from Catholic maintained schools achieve, on average, at a higher level than students in controlled schools (attended predominantly by Protestant students). In 2006, 4.4% of students in these schools attained A*–C grades in GCSE mathematics compared to 24% in Catholic maintained schools (DENI 2006). Comparable Catholic maintained and non-denominational schools in Glasgow did not reveal any notable difference in attainment of equivalent grades, Standard Grades 1–3.
Depending on which UK country is examined, different factors may be more or less relevant to participation and attainment, with the data presented here suggesting that poorer Protestant students in Belfast face particular barriers.
Figure 5.12 Factors associated with mathematics A-level take-up among students in maintained schools in England
1.31.2
1.51.61.6
2.1
2.5
1.31.7
2.2
3.42.72.5
1.94.7
8.655.2
0 10 20 30 40 50 60
Boys onlyGirls only
Mixed
Grammar11–16
11–18 (small sixth form)Mathematics and computing
Level 5 and belowLevel 7+
FemaleMale
60+56–6052–56
less than 52
WhiteIndian
PakistaniBangladeshi
BlackChinese
BA
A*G
ende
rof
sch
ool
Scho
olty
pe
GC
SEpo
ints
scor
eEt
hnic
ity
Effect on odds
Key
Sta
ge 3
gend
erm
athe
mat
ics
of p
upil
GC
SEm
athe
mat
ics
grad
e
Source: DCSF (unpublished data, reproduced with permission).
‘State of the nation’ report I 169The Royal Society
5.6 Other research
This section briefly considers selected research on the contextual factors in and around schools that may provide some explanation for the data discussed above. It considers evidence on the impact of setting, the entrance of students in tiered testing and the impact of parental and cultural attitudes. The impact of gender is not discussed here, but gender differences in attitudes to science and mathematics are discussed in chapter 6.
5.6.1 Setting and tiered entry and selectivity
Grouping by ability, or setting, is more common in science and mathematics, with the amount of setting in English schools increasing throughout Key Stage 3 and into Key Stage 4 (Kutnick et al. 2005). Kutnick et al.’s extended literature review of the effects of student grouping found some evidence that lower sets tend to have a higher number of boys, Black pupils and students from lower socioeconomic groupings. This is particularly concerning given other evidence about the effects of setting for students of equivalent prior attainment. In Key Stage 4 mathematics, where there is rigorous setting in comparison to other subjects, students with comparable prior attainment at Key Stage 3 show an attainment difference of 1–3 GCSE grades, depending on whether they are placed in the highest or lowest sets at GCSE (Wiliam & Bartholomew 2004). Comparing matched pupils, being placed in the top set raises GCSE mathematics attainment by half a grade, and being placed in the bottom set lowers it by half a grade (Wiliam & Bartholomew 2004).
When tests and results are tiered there are strong incentives for schools to maximize grades and minimize the risk of students being entered for too difficult a tier. Strand’s analysis of the Longitudinal Study of Young People in England (LSYPE) data examined the entrance of students to the two Key Stage 3 science tiers and the four Key Stage 3 mathematics tiers (Strand 2007). He found that Pakistani, Black Caribbean and Black African students were about half as likely to be entered for the upper tier in science and the two upper tiers in mathematics as White British students. Adjusting for prior attainment Black Caribbean students were significantly less likely to be entered in the top tier(s), and Indian students significantly more likely to be entered in the top tier(s) than White British students. Black Caribbean students were correspondingly overrepresented in the lower tiers. Although this research was focused on Key Stage 3, it implies a worrying state of affairs for Black Caribbean students in England. Tiered entry has the effect of restricting the grades available to students and, therefore, it also has the potential to impact on students’ options as their education continues.
Chapter 3 referred to the potential impact of school type on participation and attainment. Returning to Northern Ireland, where far fewer FSM-eligible pupils attend grammar schools, there is evidence that the grammar system has a direct impact
on the science subject options available to students at GCSE.90
A 1998 study of Key Stage 4 science in Northern Ireland found sizeable differences between the science offer and uptake in selective and non-selective schools (Jarman et al.1998). While the vast majority of non-selective secondary schools offered single- and double-award science, the majority of selective grammar schools offered double- and separate sciences (but not always single science). In non-selective schools, ‘less able’ pupils were directed to take single-award science and sometimes this amounted to more than 70% of the year group. In some small non-selective schools single-award science was seen to be appropriate for the majority of students and, as schools found it difficult to achieve viable class sizes for other science subjects, it was therefore the only provision. The issue of which GCSE science subjects schools offer, for reasons of resourcing or prioritization, and to whom these are offered, is something which affects all UK nations and could be investigated further, eg in the light of the large-scale changes in subjects available in England.
5.6.2 Parental and cultural attitudes
Parental and different cultural attitudes may offer some additional contextual explanation for the observed differences in participation and attainment described in this chapter. Students’ attitudes to science and mathematics will be considered in more detail in chapter 6.
It is well established that family background is influential in attainment at school and that socioeconomic status in particular has a significant effect in all subjects (see Gorard & See 2008). A range of explanations has been ventured, including parents from lower socioeconomic status backgrounds being less likely to help and supervise children’s science and mathematics homework. Socioeconomic status is also related to patterns of subject choice at school (although in the case of science this may also have something to do with separate science availability) and to the career aspirations of students. Furthermore, parents are a source of information on course choice, and the advice they give is likely to be based on their own experience and knowledge (Gorard & See 2008).
Differences in educational aspirations appear to offer explanations for many of the differential patterns of participation, and perhaps attainment, observed. Strand (2008) refers to the importance of aspirational cultures, among Asian groups in particular. Based on research in inner-city schools involving a survey of 800 students and focus groups, Strand & Winston (2008) suggest that immigrants are more dedicated to education because they see it as a path out of poverty. They tended to have high educational aspirations
90 Analysis of DENI post-primary schools data for 2005/06 (see http://www.deni.gov.uk/post_primary_school_data_2005_06-2.xls) reveals that in Northern Ireland there is a strong link between FSM status and attendance at grammar schools. Even though 40% of post-primary students were enrolled in grammar schools, only 6.6% of grammar school students were FSM eligible. In contrast, secondary school students made up 59% of post-primary students, but FSM eligible students accounted for 27% of secondary school rolls.
170 I Science and mathematics education, 14–19 The Royal Society
because they were focused towards the professions. In contrast, these authors found that White British working-class students tended not to see education as being as significant to their more vocational career goals.
White British boys are an ethnic group who are prime candidates for claims of underperformance in the UK, after controlling for factors such as poverty (Cassen & Kingdon 2007). Science has traditionally been a route to higher socioeconomic status for working-class children, and while the relatively lower numbers participating in post-16 physics and mathematics are a cause for concern, they should not be taken to mean that science is not still providing a valuable pathway for talented working-class children. It is possible that the apparent underperformance of White British boys stems from different perceptions of the subject, and how success is obtained. White Western students are known to develop the idea that success in mathematics comes from being naturally gifted, whereas students from China and other Asian cultures believe that success comes from hard work (Stigler & Hiebert 1999). However, there is some evidence that when teachers prioritize the communication of the idea that mathematics success comes from hard work and that everyone can be successful, supported by equitable teaching methods, then many more students of all types are successful in mathematics and choose to take it to higher levels (Boaler & Staples 2008).
5.7 Summary and concluding thoughts
This chapter has reviewed a selection of data to attempt to gain a picture of the relationship between gender, socioeconomic status, ethnicity and participation and attainment in science and mathematics. The parts of the chapter considering socioeconomic status and ethnicity have primarily focused on England, owing to data availability. Unfortunately, the DCSF report used extensively in this chapter did not undertake analysis for biology, presumably because the situation with biology was assumed not to be so concerning. Such an assumption would imply that the relatively lower participation of boys in biology in UK countries was not considered as urgent an issue within policy and research agendas. It deserves to be questioned.
Overall, girls’ participation and attainment in science and mathematics does not appear to be of particular concern up to age 16 – if anything, there should be slight concern about boys’ attainment if differences in average attainment rates are to grow in future. In England, Northern Ireland and Wales, girls attained A*–C grades at slightly higher rates than boys in GCSE double-award science and mathematics, while in Scotland girls attained SCQF Level 5 at slightly higher rates than boys in mathematics. Participation post-16 is patterned by gender for all countries, with substantially more girls entering biology than boys and fewer entering physics and mathematics (although in Scotland there is only a small difference in mathematics). Even controlling for prior attainment, there appear to be gender differences; data available for progression to A-level chemistry, physics and
mathematics in England by high-attaining girls all show lower post-16 participation. However, in biology, chemistry, physics and mathematics, those girls who do continue post-16 attain on average at slightly higher rates than boys in England, Northern Ireland and Wales, possibly as a result of self-selection. Attainment in the same subjects in Scotland is more even, with the exception of physics where girls attain at a higher level on average.
Data for England show that the impact of socioeconomic status on prior attainment in all subjects is evident from the early years of schooling and that by Key Stage 4 there is a notable differential in the rates of attainment of top GCSE grades. However, when controlling for attainment, progression to A-level physics and mathematics is roughly equivalent for those eligible for FSM and those who are not. Progression is slightly lower at all levels for chemistry. Grouped data for the remainder of the UK, while not available individually for science subjects and seldom individually for mathematics, indicate similar patterns.
There are some clear patterns associated with ethnicity in the data examined for England. At GCSE and at A-level there are higher rates of attainment of A*–C grades by Chinese and Indian students in science and mathematics. Worryingly, Caribbean students are attaining A*–C at much lower rates in all core science and mathematics subjects at GCSE and A-level, as well as across the board in GCSE. There is also evidence of relatively low progression to A-level for Caribbean and White English students of equivalent prior attainment, as well as evidence of relatively high rates of progression for Pakistani and Indian students in physics and chemistry and Chinese students in mathematics.
Systematic differences across the issues which have been the focus of this chapter imply that there may be issues of social justice to be addressed within science education, deriving from the impact of prior attainment, different responses to the curriculum or different aspirations post-16. From an economic perspective these differences also represent a loss of potential students from the system at a time when the numbers studying sciences and mathematics continue to be judged low across the UK. Probably the key finding from the DCSF multivariate analysis of progression to A-level chemistry, physics and mathematics in England is the association between prior attainment and continued participation. This was far and away the largest association identified. The other factor of note was the association between the study of separate sciences at GCSE (whether or not students were given the opportunity of studying double-award science) and progression to A-level science. These two findings raise questions about the extent to which schools should restrict access to further study on the basis of prior attainment and the messages that students receive about their ability to achieve. This is not something that schools are necessarily incentivized to do under current policy settings, given the publication of performance tables, but it is something that could be explored further in a larger-scale study. It also implies the need to address attainment differences much earlier in schooling.
The Royal Society ‘State of the nation’ report I 171
6.1 Is there a problem?
The relatively low rates of progression to science and mathematics post-16 discussed in previous chapters have prompted questions about why young people make the decisions that they make, with research on their attitudes to science and mathematics being one of the main areas in which researchers and policymakers have sought to find answers. The concern about the attitudes of young people towards science and mathematics is not new. However, what is notable about the 2000s is the widespread nature of the concern, with reports and research studies being commissioned by employers, government bodies, awarding bodies and research funders. No decade since the 1970s, in the aftermath of the ‘swing from science’ (Department of Education and Science 1968), has seen so much being written about the disaffection young people appear to have for science and mathematics.
There are two dimensions to the problem. The first of these concerns engagement, and is most directly experienced by teachers in schools, particularly at the secondary level. Here, there is enduring concern that students do not find the science and mathematics they encounter at school as interesting as might be hoped. The effects of this lack of engagement lead to the second dimension of the problem, participation. Once the period of compulsory study has ended and decisions are made over subject choices, physical science subjects and mathematics are not particularly popular choices. As highlighted in chapter 3, post-16 participation as a proportion of population has dropped in chemistry, physics and mathematics in each of the UK nations.
6.2 Young people’s attitudes to science and mathematics
Given comparatively low levels of uptake and the probability that there is a linkage between attitudes to science and mathematics and their uptake beyond compulsory study, it is not surprising that a considerable amount of research effort has been devoted to exploring students’ attitudes. The hope has been that the insights yielded will point to possible remedial action.
The literature on attitudes to science is particularly extensive, with a first peak of activity in the 1970s and the first half of the 1980s, and an upsurge of interest in the 2000s. The comparative lack of work in the late 1980s and 1990s can perhaps be largely attributed to the need to assess the effects of the introduction of the National Curriculum in England and Wales in 1989, which moved the age of compulsory study of all three sciences from 14 to 16. The increasing body of evidence to suggest that compulsory study to age 16 has had little impact on uptake post-16 is one of the factors contributing to current high levels of interest. The literature on attitudes to mathematics is characterized by a steadier output of concern over levels of engagement, as mathematics did not experience the same level of change as science when the National Curriculum was introduced.
This chapter looks at the main features of work on attitudes, drawing primarily on data gathered in medium-to-large-scale studies undertaken post-2000, as listed in table 6.1.
As can be seen from table 6.1, the predominant method of data collection is the survey. The majority of the surveys relied
6 The evidence on attitudes towards science and mathematics for 14–19 year olds
This chapter reviews the evidence on school students’ attitudes to science and mathematics, both in school and beyond, and their impact on participation in the post-compulsory period of study. In doing so, it is recognized that the discussion draws more extensively on the situation in England than in Northern Ireland, Scotland and Wales although where possible, reference has been made to variations within the UK. We focus primarily on the evidence that has emerged from 12 studies undertaken post-2000, of which 9 are medium-to-large-scale surveys. On the basis of this evidence we identify the points in education when attitudes appear to be most affected, the impact of the curriculum on attitudes, the extent to which attitudes to school science match up with attitudes to science more widely, teacher effects, gender effects and the perception that the sciences and mathematics are difficult subjects. We conclude by considering what, if anything, the findings can say more widely about how to increase science and mathematics participation post-16, and what further research can be done to inform this question.
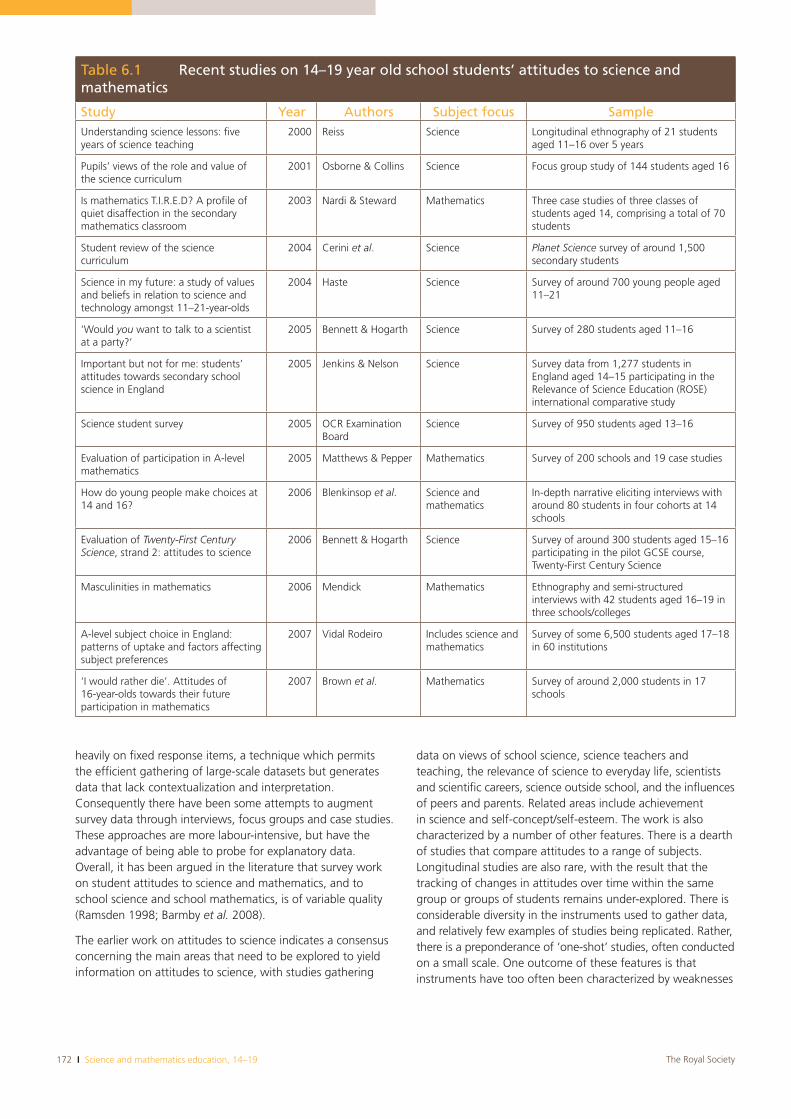
172 I Science and mathematics education, 14–19 The Royal Society
heavily on fixed response items, a technique which permits the efficient gathering of large-scale datasets but generates data that lack contextualization and interpretation. Consequently there have been some attempts to augment survey data through interviews, focus groups and case studies. These approaches are more labour-intensive, but have the advantage of being able to probe for explanatory data. Overall, it has been argued in the literature that survey work on student attitudes to science and mathematics, and to school science and school mathematics, is of variable quality (Ramsden 1998; Barmby et al. 2008).
The earlier work on attitudes to science indicates a consensus concerning the main areas that need to be explored to yield information on attitudes to science, with studies gathering
data on views of school science, science teachers and teaching, the relevance of science to everyday life, scientists and scientific careers, science outside school, and the influences of peers and parents. Related areas include achievement in science and self-concept/self-esteem. The work is also characterized by a number of other features. There is a dearth of studies that compare attitudes to a range of subjects. Longitudinal studies are also rare, with the result that the tracking of changes in attitudes over time within the same group or groups of students remains under-explored. There is considerable diversity in the instruments used to gather data, and relatively few examples of studies being replicated. Rather, there is a preponderance of ‘one-shot’ studies, often conducted on a small scale. One outcome of these features is that instruments have too often been characterized by weaknesses
Table 6.1 Recent studies on 14–19 year old school students’ attitudes to science and mathematics
Study Year Authors Subject focus SampleUnderstanding science lessons: five years of science teaching
2000 Reiss Science Longitudinal ethnography of 21 students aged 11–16 over 5 years
Pupils’ views of the role and value of the science curriculum
2001 Osborne & Collins Science Focus group study of 144 students aged 16
Is mathematics T.I.R.E.D? A profile of quiet disaffection in the secondary mathematics classroom
2003 Nardi & Steward Mathematics Three case studies of three classes of students aged 14, comprising a total of 70 students
Student review of the science curriculum
2004 Cerini et al. Science Planet Science survey of around 1,500 secondary students
Science in my future: a study of values and beliefs in relation to science and technology amongst 11–21-year-olds
2004 Haste Science Survey of around 700 young people aged 11–21
‘Would you want to talk to a scientist at a party?’
2005 Bennett & Hogarth Science Survey of 280 students aged 11–16
Important but not for me: students’ attitudes towards secondary school science in England
2005 Jenkins & Nelson Science Survey data from 1,277 students in England aged 14–15 participating in the Relevance of Science Education (ROSE) international comparative study
Science student survey 2005 OCR Examination Board
Science Survey of 950 students aged 13–16
Evaluation of participation in A-level mathematics
2005 Matthews & Pepper Mathematics Survey of 200 schools and 19 case studies
How do young people make choices at 14 and 16?
2006 Blenkinsop et al. Science and mathematics
In-depth narrative eliciting interviews with around 80 students in four cohorts at 14 schools
Evaluation of Twenty-First Century Science, strand 2: attitudes to science
2006 Bennett & Hogarth Science Survey of around 300 students aged 15–16 participating in the pilot GCSE course, Twenty-First Century Science
Masculinities in mathematics 2006 Mendick Mathematics Ethnography and semi-structured interviews with 42 students aged 16–19 in three schools/colleges
A-level subject choice in England: patterns of uptake and factors affecting subject preferences
2007 Vidal Rodeiro Includes science and mathematics
Survey of some 6,500 students aged 17–18 in 60 institutions
‘I would rather die’. Attitudes of 16-year-olds towards their future participation in mathematics
2007 Brown et al. Mathematics Survey of around 2,000 students in 17 schools
‘State of the nation’ report I 173The Royal Society
in design, with poorly constructed items and insufficient attention paid to the reliability and validity of both the instrument and the analysis of the data gathered. For example, the failure to separate out responses to the different branches of science poses a significant threat to instrument validity. Though more recent instruments are characterized by greater care in design, research on attitudes to science is still characterized by a lack of standardization of instruments, with new studies almost always developing new instruments to collect data.
Despite concerns over the quality of some of the earlier work, a number of clear messages emerged from the work of the 1970s and 1980s. Many students were negatively disposed towards school science, seeing it as difficult and not relevant to their everyday lives or those of most other people. Attitudes to school science declined over the years of secondary schooling, with female students more negatively disposed than male students, and physical science subjects less positively perceived than biological sciences. Beyond school, the messages about attitudes were slightly more mixed. On the one hand, science, and scientists in particular, were not viewed very positively, with science seen as a source of environmental problems. On the other hand, value appeared to be placed on the products of science and technology, and the benefits they could bring to society. So there was a suggestion that attitudes to science beyond school were less negative than attitudes to science studied within school.
Broadly similar areas have been covered in work on attitudes to mathematics, although the focus has tended to be more closely linked to mathematics as experienced in schools. As with science, mathematics tended not to be viewed very positively, with many questioning the relevance of what they were doing. Female students appeared to be more alienated than male students, though the differences were less appreciable than in science. Whether they liked the subject or not, mathematics was also seen by students to have some value both as a qualification in its own right and as a likely requirement for future employment.
6.3 Science and mathematics in schools
Recent studies suggest that science is seen by students as an important subject in the school curriculum. For example, 70% of students responded positively to the statement I think everyone should learn science at school (Jenkins & Nelson 2005), over 53% of the students agreeing with the statement Everyone should study all three sciences up to the age of 16(Bennett & Hogarth 2005) and 54% of students describing science as ‘useful’ (Cerini et al. 2004). However, the value placed on science appears to derive more from perceptions of possible career benefits than its ability to engage and interest students (Osborne & Collins 2001; Jenkins & Nelson 2005).
Positive attitudes to science decrease across the period of compulsory secondary schooling, with Bennett & Hogarth (2005) finding positive responses to the statements Science
lessons are amongst my favourite lessons and If I had a choice, I would study biology/chemistry/physics were lower at the older end of the 11–16 age range, with the reduction being biggest between ages 11 and 14. Within this, physics consistently received the fewest positive responses, but the decline in interest was sharpest for chemistry, a feature that also emerged in the study by Osborne & Collins (2001). Additional evidence to support the appreciable decline in interest at this age comes from Galton et al. (2003), who demonstrated that attitudes to science and school science, when compared with mathematics and English, decline most noticeably in the early years of secondary education. These findings point to the early years of secondary education as being particularly crucial in shaping attitudes.
Although the majority of the evidence points to particularly negative responses to physics, this would appear not to be the case in respect of Scottish Highers, mainly taken by students at age 16. For several years physics has been one of the most popular subjects after English and mathematics, and was the most popular science until 2005, after which it was superseded by chemistry. Assuming uptake after the compulsory period of study is one indicator of attitude, the picture in Scotland points to a more positive perception of physics. Reid & Skryabina (2002) suggest that the applications-based nature of the Standard Grade course taken by students at age 15 makes it particularly successful at retaining interest. They also note that a substantially higher proportion of physics in Scotland is taught by qualified physicists, and this might also exert a positive influence. There continues to be a higher proportion of specialist physics teachers in Scotland relative to the size of the science specialist teaching population, as was highlighted in the first ‘state of the nation’ report, The UK’s science and mathematics teaching workforce (Royal Society 2007).
There is evidence to suggest that students find aspects of their study of science interesting. Jenkins & Nelson (2005) found 61% of students agreed with the statement School science is interesting, with a similar number agreeing with Schoolscience has increased my curiosity about things we cannot yet explain. Cerini et al. (2004) also found 58% of students felt their science lessons made them curious about the world and interested in finding out more. There was also evidence in both studies to suggest that students felt the science they studied was relevant to their everyday lives, with 61% of students agreeing with the statement The things I learn in science at school will be helpful in my everyday life (Jenkins & Nelson 2005) and around half the students in the study by Cerini et al. (2004) describing their science as ‘useful’ and ‘relevant’. Overall, biology-based topics were reported as more interesting than physical science topics. Despite these findings, post-16 uptake of science subjects would seem to point to levels of engagement being higher for a number of other subjects.
Both Osborne & Collins (2001) and Cerini et al. (2004) report concern by students about the very full and fact-laden nature of the science curriculum in England (and by implication, Northern Ireland and Wales) with, in the words of the former,
174 I Science and mathematics education, 14–19 The Royal Society
students feeling they were ‘frog-marched across the scientific landscape’ (Osborne & Collins 2001, p. 450). This resulted in a feeling of a lack of control over their learning. Students also felt there was insufficient time for discussion of scientific issues, though Jenkins & Nelson (2005) found less support for the inclusion of such matters in the science curriculum. A recent systematic review of the effects of such approaches (Bennett et al. 2007) in the context of England has shown that, whilst students are more engaged with their experiences in science lessons, there is relatively little evidence to suggest that this is translated into increased uptake in the post-compulsory period of study. Therefore, increasing the emphasis on everyday applications appears to offer, at best, only a partial solution to increasing interest in studying science. This throws into question the earlier point made about the impact of the context-based learning in the Scottish system, although it should also be borne in mind that there are also differences in assessment pressures between the two countries owing to the absence in Scotland of performance tables.
There is some evidence on the effects on attitudes to school science of recent changes in the science curriculum for students aged 14–16. A new GCSE course, Twenty-First Century Science, with a substantial component focusing on the development of scientific literacy,91 was piloted in schools from September 2003 to 2005, and has subsequently informed recent revisions to all GCSE courses. Bennett & Hogarth (2006) compared the attitudes of students following the new course with those of students following more conventional courses. Caution is required in interpreting the findings, particularly as there is evidence to show that the ability of students participating in the pilot was skewed towards the lower end of the attainment range, and so represent a group less likely to continue with academic study. Although comparatively few differences emerged, over 70% of students supported the statement Everyone should study science up to the age of 16, compared with 50% of students taking more conventional courses, and students reporting that they were significantly more interested in news items about science and reading their science textbooks. This finding implies increased levels of engagement with experiences in science lessons and beyond on Twenty-First Century Sciencecompared with other science courses. However, such an interpretation requires caution, as other parts of the study suggested that the attitudes of Twenty-first Century Sciencestudents to school science were not changed significantly and their stated likelihood of pursuing science post-16 differed little from that of students following more conventional courses.
As with science, mathematics is seen by students as an important subject in the school curriculum, with, for example,
91 Twenty-First Century Science describes scientific literacy as developing an appreciation and understanding of the impact of science and technology on everyday life; being able to take informed personal decisions about matters that involve science, such as health, diet, use of energy resources; being able to read and understand the essential points of media reports about matters that involve science; reflecting critically on the information included in, and (often more important) omitted from, such reports; and taking part confidently in discussions with others about issues involving science.
over 70% of students aged 16 agreeing with the statements Maths is important for adult life and Maths is useful for me now (Blenkinsop et al. 2006). Attitudes appear to be less positive with older students, with Nardi & Steward (2003) noting the ‘quiet disaffection’ of many students at age 14 who, whilst recognizing the value of a mathematics qualification and feeling obliged to participate, demonstrated little real engagement in lessons. A particularly noticeable feature of the work was the link between enjoyment of mathematics and feeling confident with the subject (Matthews & Pepper 2005; Kyriacou & Goulding 2006; Brown et al. 2007).
There is strong evidence to suggest that negative attitudes to mathematics are associated with students’ views of their experiences in lessons as isolating, over-individualized, involving a high reliance on dull repetition and rote learning, exacerbated by dependence on applying techniques that were not understood, but gave the right answer (Nardi & Steward 2003; Mathews & Pepper 2005). There is also some evidence that students have negative attitudes to contextualized learning activities (ie activities that have been developed with a view to setting the mathematical ideas being studied in the context of everyday situations). Despite the intentions of such approaches, they are perceived by students to be irrelevant (Nardi & Steward 2003). These appear to be important messages for curriculum interventions in mathematics: the emphasis on personalized learning may result in feelings of isolation on the part of students, and contexts that might appear to be ‘real-life’ to those developing materials may not be seen as such by students.
A particular phenomenon in mathematics is the group termed by Matthews & Pepper (2005) as the ‘clever core’, whose existence tends to polarize attitudes to mathematics. This is the group of particularly able students who enjoy mathematics, appreciate its logic and ability to solve problems, and do not report finding it particularly difficult. The notion of the clever core has its parallels in the work of Brown et al.(2007), where students’ attitudes were influenced by their perception of mathematics as a subject with a ‘fixed ceiling’ of understanding beyond which it was not possible for them to progress. In contrast to the clever core, other students were much more likely to see mathematics as irrelevant and difficult. Matthews & Pepper (2005) also suggested that the image of mathematics being for an elite clever core was reinforced by the fairly common practice of post-16 recruitment by schools and sixth form colleges being restricted to the top GCSE sets. In common with Brown et al. (2007), they recommend exploring the introduction of two-tier provision post-16, with one of the tiers targeting students at the level below the clever core.
6.3.1 Teacher effects
All the evidence on teacher effects points to their significant influence on students’ attitudes to both science and mathematics. Both Osborne & Collins (2001) and Bennett & Hogarth (2005) established that students see their science
‘State of the nation’ report I 175The Royal Society
teachers as being influential in determining their response to science, particularly in the early years of secondary education. Cerini et al. (2004) also reported students’ desire to be taught by subject specialists who are enthusiastic and knowledgeable. Similar responses emerged for mathematics, where teacher support and encouragement emerged as particularly important in building confidence during lessons and in influencing study decisions post-16 (Matthews & Pepper 2005). Nardi & Steward (2003) also established that teacher effects were more influential than the use of any particular work scheme or textbooks in influencing students’ responses to mathematics.
6.3.2 Gender effects
It has long been established that there is a strong association between attitudes to science and gender, with female students typically being less interested than male students in science and technology, and more likely to say they dislike school science subjects, particularly the physical sciences, and find them hard. More recent studies have simply confirmed well-established patterns. For example, Bennett & Hogarth (2005) established that most female students’ attitudes to both school science and science beyond school were more negative than those of most male students at age 11, and became increasingly so over the period of secondary age schooling. Considerable effort has been expended to determine the cause of male and female students’ differing attitudes, though no clear explanations have emerged. What is clear, however, is that the problem is not to do with attainment in school. As was shown in chapter 5, girls attained at higher rates than boys in GCSE double-award science and mathematics in 2006, while in Scotland a greater proportion of the S4 roll attains SCQF Level 5 (equivalent to GCSE A*–C) in biology, chemistry and mathematics (but not physics). On a related note, the particular success of female students in single-sex schools in achieving good grades in science subjects has resulted in some schools experimenting with single-sex groupings in science teaching, but there has been little research into its effectiveness (Murphy & Whitelegg 2006).
Gender effects are also apparent in attitudes to mathematics, where a clear picture emerges of female students typically being far less confident in their abilities in this subject and therefore viewing it less positively than their male counterparts (Nardi & Steward 2003; Kyriacou & Goulding 2006; Brown et al. 2007). Both Boaler (1997) and Mendick (2006) have discussed the ways in which schools unwittingly make it more difficult for girls to believe they are succeeding at mathematics even when all the evidence suggests that they are.
The differing attitudes of male and female students to science and mathematics appear to exert considerable influence over decisions about post-16 study, where male students significantly outnumber female students in physics and mathematics. Career intentions appear to be much more influential in decision-making for science and mathematics than in other subjects, in that science and mathematics are far less likely to be chosen by students who have yet to formulate
their career plans (Vidal Rodeiro 2007). Clear gender differences emerge in reasons for choice. For example, Haste (2004) found female students in England expressed strong interest in acquiring further knowledge in science and less interest in learning about new developments in technology, but were concerned about the environment and ethical issues. Male students thought science was beneficial and were interested in technology, space and hardware. They endorsed a scientific way of knowing and believed science can solve human problems, but were less interested in ethical issues. In Scotland, when given a range of topics, female pupils up to age 14 were on average more interested in cosmetic surgery, cancer research and designer babies, while boys were generally more interested in nuclear power, space exploration, robotics and weapons of mass destruction (Scottish Executive Education Department 2003). These very different characteristics point to a particular mismatch between female students’ preferences and the ways in which physical sciences may be portrayed in school science teaching. In mathematics, Matthews & Pepper (2005) found enjoyment was likely to be cited by female students as the main reason for continuing their study of mathematics, and, whilst this was also important for male students, it was less influential for them than career intentions.
6.3.3 Science and mathematics relative to other subjects
There is very little research that explores students’ attitudes to all subject areas (Lord & Jones 2006). Harland et al. (2002) explored students’ perceptions of science and mathematics in relation to the whole of the curriculum. Their study focused on students from Years 8–10 (equivalent to Years 7–9 in England, cf. table 3.2) and therefore gives an insight into the relative positioning of science and mathematics in Key Stage 3 in Northern Ireland. The Key Stage 3 phase of the study, from 1996, was extremely comprehensive, involving a questionnaire that was answered by a representative sample of 10% of the Northern Ireland Year 8 cohort in 1996. In measuring the enjoyment of pupils in different subjects, Harland et al. found that science was slightly more popular than the mean in Year 8, but by Year 10 had, like a number of other subjects, suffered a drop in enjoyment bringing it to the mean in Year 10. The enjoyment of mathematics was consistently below the means, although religious education, music and French were enjoyed even less. Over the same age range students’ perceived relevance of mathematics to future needs was reversed, being second only to English. Science was perceived as marginally more relevant to adult life than the mean (behind English, mathematics, careers education, IT, home economics, health education and physical education).
6.3.4 The perceived difficulty of science and mathematics
The evidence on the difficulty, or perceived difficulty, of science and mathematics is mixed. Osborne & Collins (2001) found many students reporting they found science hard or
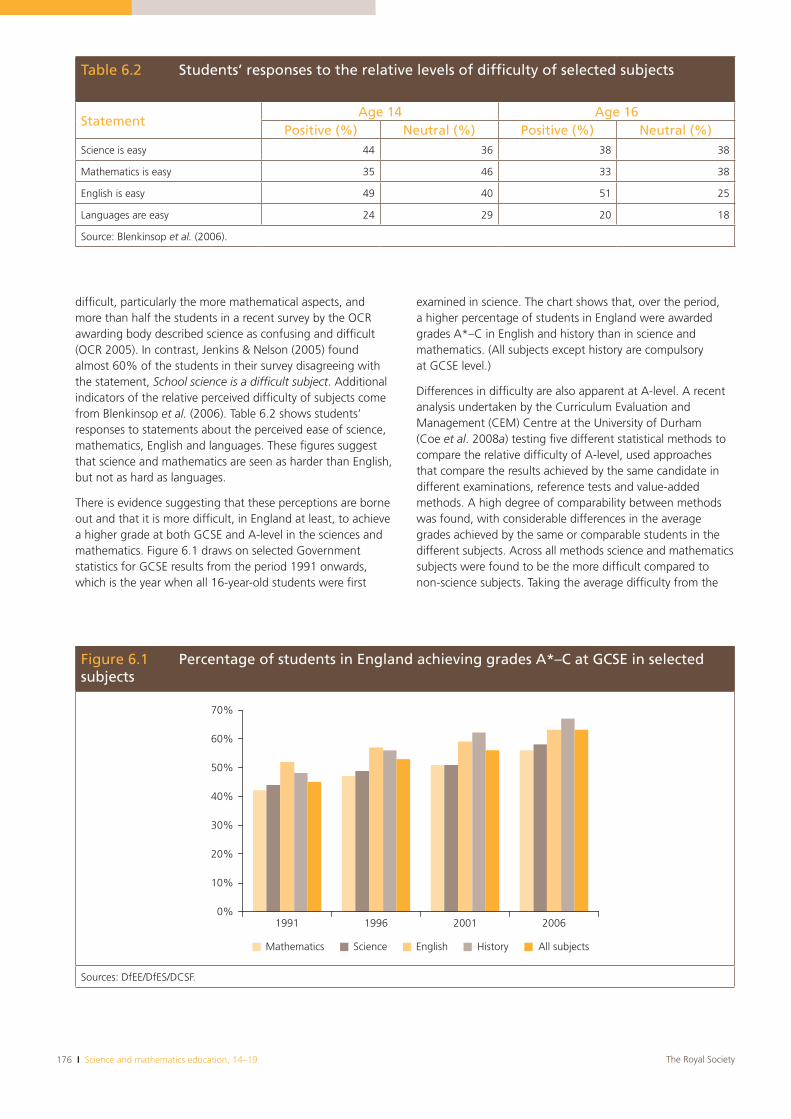
176 I Science and mathematics education, 14–19 The Royal Society
difficult, particularly the more mathematical aspects, and more than half the students in a recent survey by the OCR awarding body described science as confusing and difficult (OCR 2005). In contrast, Jenkins & Nelson (2005) found almost 60% of the students in their survey disagreeing with the statement, School science is a difficult subject. Additional indicators of the relative perceived difficulty of subjects come from Blenkinsop et al. (2006). Table 6.2 shows students’ responses to statements about the perceived ease of science, mathematics, English and languages. These figures suggest that science and mathematics are seen as harder than English, but not as hard as languages.
There is evidence suggesting that these perceptions are borne out and that it is more difficult, in England at least, to achieve a higher grade at both GCSE and A-level in the sciences and mathematics. Figure 6.1 draws on selected Government statistics for GCSE results from the period 1991 onwards, which is the year when all 16-year-old students were first
examined in science. The chart shows that, over the period, a higher percentage of students in England were awarded grades A*–C in English and history than in science and mathematics. (All subjects except history are compulsory at GCSE level.)
Differences in difficulty are also apparent at A-level. A recent analysis undertaken by the Curriculum Evaluation and Management (CEM) Centre at the University of Durham (Coe et al. 2008a) testing five different statistical methods to compare the relative difficulty of A-level, used approaches that compare the results achieved by the same candidate in different examinations, reference tests and value-added methods. A high degree of comparability between methods was found, with considerable differences in the average grades achieved by the same or comparable students in the different subjects. Across all methods science and mathematics subjects were found to be the more difficult compared to non-science subjects. Taking the average difficulty from the
Table 6.2 Students’ responses to the relative levels of difficulty of selected subjects
StatementAge 14 Age 16
Positive (%) Neutral (%) Positive (%) Neutral (%)Science is easy 44 36 38 38
Mathematics is easy 35 46 33 38
English is easy 49 40 51 25
Languages are easy 24 29 20 18
Source: Blenkinsop et al. (2006).
Figure 6.1 Percentage of students in England achieving grades A*–C at GCSE in selected subjects
70%
60%
50%
40%
30%
20%
10%
0%1991 1996 2001 2006
Mathematics English History All subjectsScience
Sources: DfEE/DfES/DCSF.
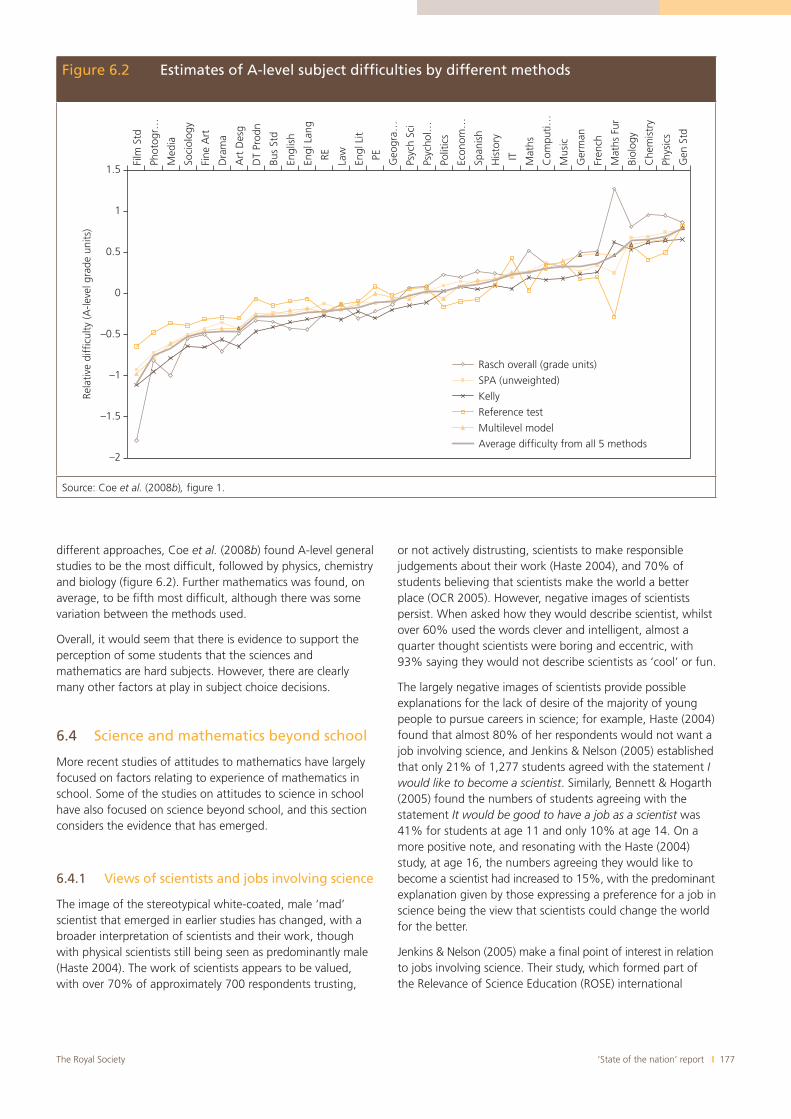
‘State of the nation’ report I 177The Royal Society
different approaches, Coe et al. (2008b) found A-level general studies to be the most difficult, followed by physics, chemistry and biology (figure 6.2). Further mathematics was found, on average, to be fifth most difficult, although there was some variation between the methods used.
Overall, it would seem that there is evidence to support the perception of some students that the sciences and mathematics are hard subjects. However, there are clearly many other factors at play in subject choice decisions.
6.4 Science and mathematics beyond school
More recent studies of attitudes to mathematics have largely focused on factors relating to experience of mathematics in school. Some of the studies on attitudes to science in school have also focused on science beyond school, and this section considers the evidence that has emerged.
6.4.1 Views of scientists and jobs involving science
The image of the stereotypical white-coated, male ‘mad’ scientist that emerged in earlier studies has changed, with a broader interpretation of scientists and their work, though with physical scientists still being seen as predominantly male (Haste 2004). The work of scientists appears to be valued, with over 70% of approximately 700 respondents trusting,
or not actively distrusting, scientists to make responsible judgements about their work (Haste 2004), and 70% of students believing that scientists make the world a better place (OCR 2005). However, negative images of scientists persist. When asked how they would describe scientist, whilst over 60% used the words clever and intelligent, almost a quarter thought scientists were boring and eccentric, with 93% saying they would not describe scientists as ‘cool’ or fun.
The largely negative images of scientists provide possible explanations for the lack of desire of the majority of young people to pursue careers in science; for example, Haste (2004) found that almost 80% of her respondents would not want a job involving science, and Jenkins & Nelson (2005) established that only 21% of 1,277 students agreed with the statement Iwould like to become a scientist. Similarly, Bennett & Hogarth (2005) found the numbers of students agreeing with the statement It would be good to have a job as a scientist was 41% for students at age 11 and only 10% at age 14. On a more positive note, and resonating with the Haste (2004) study, at age 16, the numbers agreeing they would like to become a scientist had increased to 15%, with the predominant explanation given by those expressing a preference for a job in science being the view that scientists could change the world for the better.
Jenkins & Nelson (2005) make a final point of interest in relation to jobs involving science. Their study, which formed part of the Relevance of Science Education (ROSE) international
Figure 6.2 Estimates of A-level subject difficulties by different methods
–2
–1.5
–1
–0.5
0
0.5
1
1.5
Film
Std
Phot
ogr…
Med
ia
Soci
olog
y
Fine
Art
Dra
ma
Art
Des
g
DT
Prod
n
Bus
Std
Engl
ish
Engl
Lan
g
RE Law
Engl
Lit
PE Geo
gra…
Psyc
h Sc
i
Psyc
hol…
Polit
ics
Econ
om…
Span
ish
His
tory
IT Mat
hs
Com
puti…
Mus
ic
Ger
man
Fren
ch
Mat
hs F
ur
Biol
ogy
Che
mis
try
Phys
ics
Gen
Std
Rela
tive
diff
icul
ty (A
-leve
l gra
de u
nits
)
Rasch overall (grade units)
SPA (unweighted)
Kelly
Reference test
Multilevel model
Average difficulty from all 5 methods
Source: Coe et al. (2008b), figure 1.
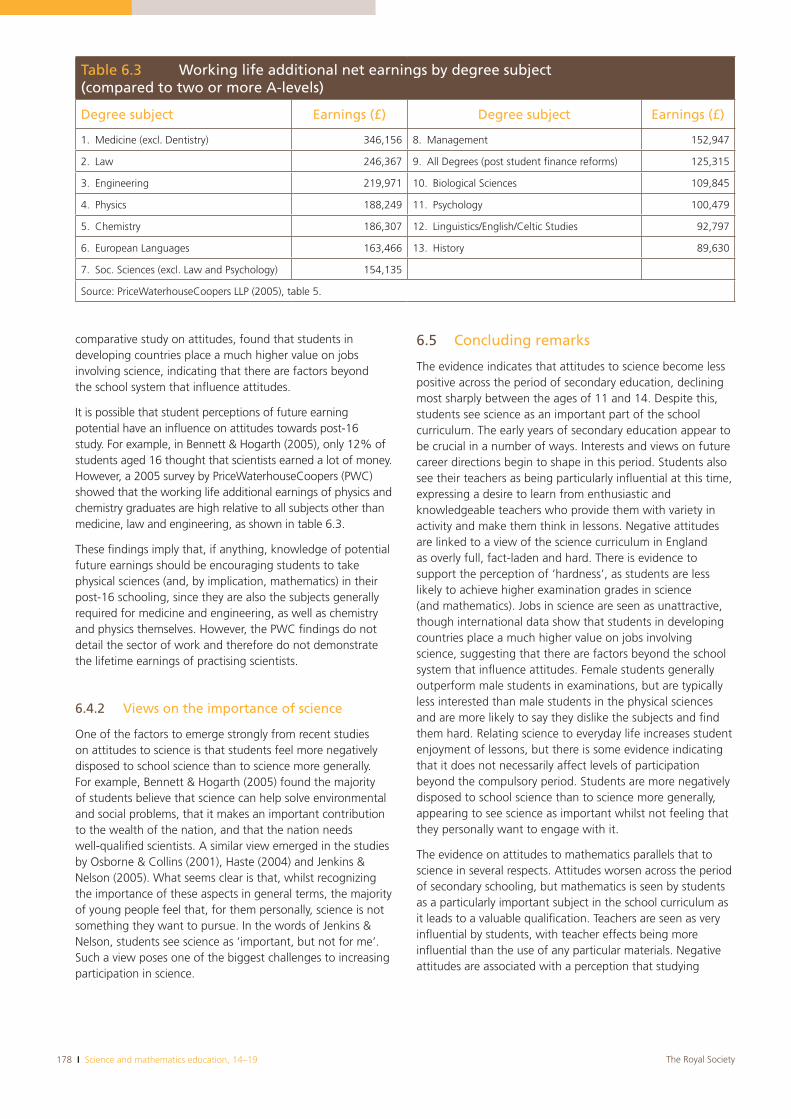
178 I Science and mathematics education, 14–19 The Royal Society
comparative study on attitudes, found that students in developing countries place a much higher value on jobs involving science, indicating that there are factors beyond the school system that influence attitudes.
It is possible that student perceptions of future earning potential have an influence on attitudes towards post-16 study. For example, in Bennett & Hogarth (2005), only 12% of students aged 16 thought that scientists earned a lot of money. However, a 2005 survey by PriceWaterhouseCoopers (PWC) showed that the working life additional earnings of physics and chemistry graduates are high relative to all subjects other than medicine, law and engineering, as shown in table 6.3.
These findings imply that, if anything, knowledge of potential future earnings should be encouraging students to take physical sciences (and, by implication, mathematics) in their post-16 schooling, since they are also the subjects generally required for medicine and engineering, as well as chemistry and physics themselves. However, the PWC findings do not detail the sector of work and therefore do not demonstrate the lifetime earnings of practising scientists.
6.4.2 Views on the importance of science
One of the factors to emerge strongly from recent studies on attitudes to science is that students feel more negatively disposed to school science than to science more generally. For example, Bennett & Hogarth (2005) found the majority of students believe that science can help solve environmental and social problems, that it makes an important contribution to the wealth of the nation, and that the nation needs well-qualified scientists. A similar view emerged in the studies by Osborne & Collins (2001), Haste (2004) and Jenkins & Nelson (2005). What seems clear is that, whilst recognizing the importance of these aspects in general terms, the majority of young people feel that, for them personally, science is not something they want to pursue. In the words of Jenkins & Nelson, students see science as ‘important, but not for me’. Such a view poses one of the biggest challenges to increasing participation in science.
6.5 Concluding remarks
The evidence indicates that attitudes to science become less positive across the period of secondary education, declining most sharply between the ages of 11 and 14. Despite this, students see science as an important part of the school curriculum. The early years of secondary education appear to be crucial in a number of ways. Interests and views on future career directions begin to shape in this period. Students also see their teachers as being particularly influential at this time, expressing a desire to learn from enthusiastic and knowledgeable teachers who provide them with variety in activity and make them think in lessons. Negative attitudes are linked to a view of the science curriculum in England as overly full, fact-laden and hard. There is evidence to support the perception of ‘hardness’, as students are less likely to achieve higher examination grades in science (and mathematics). Jobs in science are seen as unattractive, though international data show that students in developing countries place a much higher value on jobs involving science, suggesting that there are factors beyond the school system that influence attitudes. Female students generally outperform male students in examinations, but are typically less interested than male students in the physical sciences and are more likely to say they dislike the subjects and find them hard. Relating science to everyday life increases student enjoyment of lessons, but there is some evidence indicating that it does not necessarily affect levels of participation beyond the compulsory period. Students are more negatively disposed to school science than to science more generally, appearing to see science as important whilst not feeling that they personally want to engage with it.
The evidence on attitudes to mathematics parallels that to science in several respects. Attitudes worsen across the period of secondary schooling, but mathematics is seen by students as a particularly important subject in the school curriculum as it leads to a valuable qualification. Teachers are seen as very influential by students, with teacher effects being more influential than the use of any particular materials. Negative attitudes are associated with a perception that studying
Table 6.3 Working life additional net earnings by degree subject (compared to two or more A-levels)
Degree subject Earnings (£) Degree subject Earnings (£)
1. Medicine (excl. Dentistry) 346,156 8. Management 152,947
2. Law 246,367 9. All Degrees (post student finance reforms) 125,315
3. Engineering 219,971 10. Biological Sciences 109,845
4. Physics 188,249 11. Psychology 100,479
5. Chemistry 186,307 12. Linguistics/English/Celtic Studies 92,797
6. European Languages 163,466 13. History 89,630
7. Soc. Sciences (excl. Law and Psychology) 154,135
Source: PriceWaterhouseCoopers LLP (2005), table 5.
‘State of the nation’ report I 179The Royal Society
mathematics is isolating, over-individualized and involves a high reliance on dull repetition and rote learning. Female students are typically much less confident in their abilities in mathematics than male students and this results in a more negative view of the subject.
The most striking feature of work on attitudes to science and mathematics is the broad similarity of the findings, both from study to study and over a period of time in which there has been considerable change in the science and mathematics curricula experienced by students. This points to the deep-rooted and persistent nature of the attitudes and their resistance to change, and is an underlying issue that needs to be explored.
The paucity of studies comparing attitudes to science and to mathematics with attitudes to other subjects, and of longitudinal studies, has been noted earlier. Both these aspects would benefit from more detailed study. What evidence there is suggests that students view science and its benefits more positively than they do school science. This would also benefit from further probing through student interviews. Survey questionnaires, whilst helping to paint the ‘big picture’, are unlikely to unpick the detail of particular situations and contexts, and it is this detail that is all too often missing from attitudes research. The majority of studies of attitudes do not look at the link between pupils’ attitudes and their decisions and eventual actions. What is more, many studies do not distinguish between attitudes to science as experienced within schools and attitudes towards science as it is conducted in practice. Future research that focuses more on the processes young people go through when they make decisions – and how their understanding of science fits with their identity and plans for the future – may offer more answers in this regard.
There is much anecdotal evidence to indicate that features of individual schools and actions by individual teachers, or groups of teachers, within a school can have a significant impact on students’ attitudes to subjects. It is also the case that factors in schools that influence students’ attitudes may not be apparent to the students themselves. However, comparatively little information has been gathered in a systematic way on schools that appear to make a difference, resulting in gaps and uncertainties in what is known about the factors that influence attitudes and how these might be shaped through change.
Some work does exist. For example, Fitzgibbon (1999) showed that there were significant inter-school variations in numbers of students electing to study subjects beyond the compulsory period. Fitzgibbon’s study primarily focused on mathematics and what she termed the ‘pulling power’ of different mathematics departments in schools, but she also suggested that there might be similarities with the sciences in factors underlying student choice. Smaller-scale work with a particular focus on science has been undertaken by Ponchaud (2006), who reports three case studies of schools that are more successful in recruiting students to science A-levels. Key features of these schools included the existence of a culture of success, enthusiastic specialist teaching, and provision of good information about the value and flexibility of science qualifications. More recently there have been several larger Government-sponsored studies of the approaches of schools that have good post-16 progression rates, with similar findings to those of Ponchaud, notably the National Strategies’ Progression to post-16 science (National Strategies 2008) and the NCETM’s Factors influencing progression to A-level mathematics (NCETM 2008).

180 I Science and mathematics education, 14–19 The Royal Society
The Royal Society ‘State of the nation’ report I 181
This report has had two main purposes: to provide a summary of the information available about 14–19 attainment and participation within UK science and mathematics education; and to review some of the key issues underlying these data. Some aspects of the latter, notably the pattern of post-16 subject combinations in which mathematics and the sciences figure, will be discussed in a later ‘state of the nation’ report.
To what extent is it possible to offer an overall judgement on the ‘state of the nation’ in respect of 14–19 science and mathematics education? The Government targets which we cited in chapter 3 provide one baseline against which such judgements might be made. Yet they relate mainly to England, and do not include all core science subjects, being most strongly associated with physics, chemistry and mathematics. In addition, many of the issues with which we are concerned cannot readily be summed up in terms of whether individual numerical targets are attained or missed. Therefore much of this chapter will be concerned with wider policy, its impact and its sources. Our evaluative comments and recommendations will be particularly focused on the quality, comparability and interpretability of the data that are available. In the course of the chapter we will, where appropriate, make recommendations, but these recommendations most commonly relate to how we may better understand the present situation and seek to evaluate future developments. We have deliberately not made evaluative judgements on the details of current pedagogic and curricular reforms in science and mathematics. Indeed this report can be seen as principally concerned with establishing a benchmark against which the realization and impact of those reforms can be judged. In respect of all of these issues we have offered recommendations where appropriate.
Ensuring that this report covers all four nations within the UK in comparable depth has provided a significant challenge. England, Northern Ireland, Scotland and Wales display a complex pattern of similarities and differences, which renders any generalization dangerous. Yet, as we observed in chapter 2, some developments of the past 50 years, such as the introduction of comprehensive schooling and catering appropriately for increased post-compulsory participation, have been largely shared. These processes are still ongoing, as current reforms in the academic selection process in Northern Ireland demonstrate. Moreover, within all four jurisdictions, large-scale policy reforms relating to secondary education are
currently in train. Since each country has its own distinctive character and, increasingly, governance, it seems likely that generalization across them will become still more difficult. Nevertheless, we have, so far as possible, sought to provide a commentary and recommendations which speak to the United Kingdom as a whole.
7.1 Attainment and standards
The most obvious source of data in forming judgements about attainment in the 14–19 age-group is public examination results. In GCSEs, A-levels and Scottish Highers, the area where comparisons are most readily made, student attainment, as measured by the percentage obtaining higher grades in public examinations, has generally increased across all four of the UK nations. Yet even where annual statistics are readily available, it is not straightforward to obtain an overview of the situation. In England, Northern Ireland and Wales, at GCSE level, this is mainly due to the range of qualifications available. There has also been an increase in the range of qualifications available in Scotland, and a breaking of the ‘age and stage’ linkage. Shifts in the entry across available qualifications (for example, in England, away from double-award science towards separate sciences and double-award applied science) mean that trends in attainment over time become obscured. In mathematics the situation is simpler, mainly because of the more limited range of qualifications available, and again here attainment has broadly continued to rise, if slowly.
Examination results must then be treated with caution, not least because they can often be presented in several ways. We have provided attainment data (eg the percentage of students obtaining A*–C grades at GCSE level in England, Northern Ireland and Wales, or the fraction obtaining A–C grades in Scottish Highers) as percentages both of entry and of the relevant national cohort. The latter is not always possible, particularly for Scotland, because of the difficulty in defining the relevant annual national cohort. Nevertheless cohort-related statistics can cast a distinctive light on the situation. Therefore, in England, while the percentage of entrants gaining an A-grade in GCE A-level physics has steadily increased during the last decade, the percentage of the national cohort doing so has remained constant, at approximately 1.1%. This situation is due to the increase in
7 Conclusions
182 I Science and mathematics education, 14–19 The Royal Society
the percentage of those entered who obtain a grade A in physics compensating for the declining national entry for physics. As a corollary, the percentage of the cohort gaining middle grades (grades C and D) has diminished. A similar picture emerges for physics in Scottish Highers, though here approximately 4% of the cohort consistently obtain an A grade in physics. This pattern of greater participation in Scottish Highers is repeated across the other sciences and mathematics:92
we will take up the point again later in this chapter.
The take-up of the separate sciences within compulsory schooling and their impact on attainment and progression is currently an important policy issue. The concluding section of chapter 3 demonstrates that there is considerable variation in the UK nations in this take-up. Scotland has remained committed to the specialist sciences, and ‘science’ even when introduced, has proved unpopular. In the remainder of the UK, Wales has retained the highest level of specialist provision. It is difficult to know what conclusions might be drawn from these differences, though a case can be made that the retention of specialisms has been to the benefit of post-16 participation in Scotland. The situation merits further investigation. Another striking finding is the relatively high level of attainment at grades A–C in double-award science in Northern Ireland. However, this figure is much less striking when expressed as a percentage of the annual cohort (figure 3.55), and may reflect the nation’s larger entry to single-award science.
As we have seen in chapter 4, national statistics can be supplemented by international comparative studies in forming a judgement about UK performance. At the end of that chapter we sought to summarize the conclusions that might be drawn from these studies. Broadly, they were that the UK performed at about the average level when judged against comparable industrialized countries. It displayed some strengths in science, some of which might derive from a relative concordance between its curriculum and the characteristics of the PISA assessment instrument, compared with other countries. The UK performance in mathematics is weaker. Wales in particular returned a lower performance than the rest of the UK. Having said this, the many methodological issues surrounding the TIMSS and PISA studies mean that any conclusions drawn from them, particularly when expressed in terms of the league table positions beloved of headline writers, need to be carefully qualified.
92 SCQF Level 6: approximately equivalent to English Level 3.
Throughout chapter 3 the presentation of data in time-series reflects the strong emphasis on trends over time in public policy discussion and in the evaluation of national performance. Judgements about how performance is changing over time may be said to lie at the heart of the issue. Yet any statements made about such changes must take account of the standards by which attainment is judged. This is a critical issue, which is often the subject of a corrosive debate when annual results are announced. It can appear to generate a popular judgement that if attainment is seen to change either way, standards must be falling. This situation is due in part to a notable ambiguity in the educational usage of the word ‘standards’.
The word is sometimes used to refer to the number of students, or the percentage of entrants, gaining particular grades. ‘Higher standards’ then means more students, or a greater proportion of entered students, obtaining the higher grades. But it can also refer to the performances which are required to attain those grades.93 Due to the inherent ambiguity of the term, we have avoided talking about ‘standards’ in this report. The question of whether standards, in the second sense just given of criteria by which performance is judged, have remained constant over the last decade can be addressed from at least three directions. One of these is to refer to national performance within international comparative studies where these are supposedly assessed to a common standard over time.
Lurid headlines accompanied the release of the 2006 PISA data, including those cited in chapter 4. Yet the discussion in that chapter suggests that it is difficult to draw any robust conclusions from these data and their predecessors about changes in UK attainment or standards within UK public examinations or other assessments. In particular, it needs to be borne in mind that the TIMSS and PISA assessment instruments embody very particular assumptions about what should be assessed. If they are to be compared with national examination trends, we need to recall that they are commonly deployed with different age ranges and for different purposes. Probably the most that can be said on the basis of the available international data on changes in performance over time is that they do not confirm suggestions that attainment is rising, within either public examinations or, outside Scotland, National Curriculum testing.
93 So ‘Are standards falling?’ can mean: ‘Are fewer students obtaining a grade A?’; or it can mean ‘Is it easier to get a grade A?’.
Recommendation 7.1
Further research is needed into the lower proportion of 15-year-old UK students attaining at the upper levels of difficulty in mathematics, as identified in PISA 2006 and TIMSS 2003, and what might be done to achieve a level comparable to other industrialized countries.
Recommendation 7.2
Further research is needed into the differences between UK nations revealed in PISA 2006, in order to explore whether differences may be accounted for by socioeconomic status or whether other factors are responsible for the differences observed.
‘State of the nation’ report I 183The Royal Society
Another approach to the issue of standards is to examine the processes by which attainment is measured, the guidance and attainment criteria used, and the means which are employed to generate grades. In England this approach is taken within the sequence of review reports published by the QCA and the recently established Ofqual.94 It is shared with the regulatory bodies in Wales95 and Northern Ireland,96 and it appears that the Scottish Qualifications Authority employs a similar method.97 The general conclusion within the reports produced by the QCA has been that standards have been maintained. However, some commentators, including a senior Government mathematics adviser, Sir Peter Williams, do not seem to have found these claims convincing.98
A different approach has been taken by some academic studies. Researchers at the CEM Centre based at Durham University have used as a standard their own tests, which are administered to a sample of students. The researchers take these to be a measure of potential attainment. They then compare individual students’ scores with their GCSE and A-level attainment, over time.99 They have come to the conclusion that, across A-levels as a whole, students who had obtained similar test scores were obtaining on average over a full grade higher in 2005 than would have been the case in 1988. In mathematics the difference is three grades. These kinds of data are of course not conclusive: other explanations than a lowering of standards are possible, not least more effective teaching. But the findings remain striking, and it is not clear that work based on the QCA methodology rebuts them. We are unaware of any similar studies in Northern Ireland, Scotland or Wales.
Drawing firm conclusions about trends in national attainment at the end of compulsory or within post-compulsory schooling on the basis of national examination statistics is therefore challenging. It should be recalled that the principal purpose of public qualifications, and the grading systems associated with them, is not directly to provide data that will allow an overview of attainment at a national level. Their purpose is to identify and certify student attainment in areas of learning that have educational (including vocational) significance. These areas of learning are of many different types, and may require assessment in correspondingly different modes if they
94 See http://www.ofqual.gov.uk/84.aspx (accessed 29 April 2008).
95 See http://old.accac.org.uk/eng/content.php?mID=540 (accessed 29 April 2008).
96 See http://www.ccea.org.uk/ (accessed 29 April 2008).
97 See http://www.sqa.org.uk/sqa/31305.html (accessed 30 April 2008).
98 See http://www.guardian.co.uk/uk/2007/jul/15/alevels.schools (accessed 29 April 2008).
99 Reports are available at http://www.cemcentre.org/renderpage.asp?linkid=32010400 (accessed 30 April 2008). See especially http://www.times-archive.co.uk/onlinespecials/english_in_schools.html.The report gives no data on how accurate the test scores are in predicting A-level performance.
are to be fit for purpose. Furthermore, judgements of what is appropriate in terms of curriculum and assessment change over time. The development of the various national qualifications frameworks might offer opportunities in establishing a common metric for qualifications and for standards, both within and across the UK nations. This would facilitate the task of making an overall judgement of attainment, and its variation over time. However, standardization for these purposes must not override the central purpose of the qualifications, which is educational. Reforms to meet new educational needs ought not to be overridden simply to allow standardized national monitoring of student outcomes across nations or over time.
A ‘rough guide’ comparing the qualifications of England, Wales and Northern Ireland, Scotland and Ireland was produced in 2005 by the relevant agencies responsible for qualifications standards.100 However, much has changed and continues to change in each of the UK nations considered in this report.
We have argued that, whatever the qualification or group of qualifications under review, judgements of attainment trends are conditional on the maintenance of standards (as in, the performances required to attain grades) over time. Despite the inevitable changes in what is taught and assessed, a regulatory system needs methodologies that can enable those standards to be monitored, not least so that it can, if appropriate, convincingly refute charges of decline. The absence of monitoring that does not simply rely on relative judgements of examination papers between years leads to annual debates about standards that are corrosive of confidence and which sap the morale of students and teachers. It is not clear that the existing regulatory systems, which focus more on the assessment process than student outcomes, are able to do so. Nor must it be forgotten that other monitoring methods are possible. England, Northern Ireland and Wales once had the Assessment of Performance Unit, which used a light-touch sampling methodology. The USA has the National Assessment of Educational Progress.101
Scotland has recently introduced the Scottish Survey of Achievement.102 Such approaches usually apply to younger
100 SCQF, QCA, ACCAC, CCEA, the Quality Assurance Agency for Higher Education and National Framework of Qualifications.
101 See http://nces.ed.gov/naep3/ (accessed 3 May 2008).
102 See http://www.scotland.gov.uk/Topics/Education/Schools/curriculum/Attainment (accessed 17 July 2008).
Recommendation 7.3
The mapping of individual nations’ qualifications frameworks should continue to be updated and maintained, identifying comparable levels and the standards of attainment associated with those levels.
184 I Science and mathematics education, 14–19 The Royal Society
age groups than those considered here, and offer their own challenges, but they nevertheless remind us that other methods are available.
7.2 Participation
Judgements about participation in science and mathematics may require significantly different approaches before and after the end of compulsory schooling. Choice may be curtailed during compulsory schooling, and therefore participation cannot be a good proxy for willing involvement. In post-compulsory schooling the situation is different, though even then students may take a subject because it is necessary for extrinsic progression purposes, rather than because of interest or enjoyment. An example of this might be studying chemistry in order to apply for entry to medical first-degree courses. Furthermore, schools may limit post-16 students’ choices according to prior attainment at GCSE or (in Scotland) Standard or Intermediate level.
Some form of participation in mathematics and science has been required within secondary education in maintained schools across the UK over the timeframe considered in this report, though for science the statutory form of that participation differs significantly between Scotland and the remaining nations. Whereas in the latter some form of so-called ‘balanced science’ has been required, in Scotland students may study a flexible combination of the science disciplines. As indicated in the first ‘state of the nation’ report, The UK’s science and mathematics teaching workforce (Royal Society 2007), this possibility is reflected in Scottish teacher training, where students predominantly specialize in a single science discipline. The impact of greater flexibility is reflected in participation trends in the sciences at Scottish Standard
Grade, where, over the last decade, an increase for biology, a more varied pattern for chemistry and a general decline for physics are visible. This pattern is similar to that for participation post-16 in the remainder of the UK. It is important to note that for all of these subjects the national participation rate within Highers appears very considerably greater than that for A-levels in England, Northern Ireland and Wales.103
We referred earlier to the English Government’s targets. At GCSE level there is some evidence of progress toward them, with increased numbers of students entered for the three separate sciences, and indications that the target of 80% of the cohort undertaking at least two science GCSEs may well be met or even exceeded. In Scotland, given that the separate sciences have remained the normal form of provision, it is not possible to make a direct comparison. It appears likely that the Scottish retention of the separate science disciplines, combined with the different pattern of entry for Highers, has been effective in maintaining a greater level of involvement in the sciences beyond the end of compulsory schooling. The contrast between the two nations, and the English shift in policy, after spending over a decade promoting ‘balanced science’ over the separate sciences at GCSE, anticipate points we make below about the policy-making process.
Across all four nations arguably the most striking and immediately urgent issue is the declining participation in physics, which appears to occur when students are given a significant degree of choice. The Scottish situation at Standard Grade and Intermediate suggests that the pattern appears independently of when that choice becomes available. By contrast, participation in mathematics appears relatively stable, though the introduction of Curriculum 2000 across England, Northern Ireland and Wales caused a hiatus the effects of which have not yet been fully overcome. Within Northern Ireland the rate of post-16 participation in the sciences and mathematics is significantly greater than in England and Wales, and this again deserves investigation.
A further issue within post-16 take-up is the relative decline in entries for the sciences when compared with entries as a whole. The data are less clear for Scotland given the difficulties of defining the cohort, and they are further compounded by the need to take account of vocational courses including, outside Scotland, GCE applied science.
Chapter 5 demonstrates that buried within aggregate figures for participation and attainment are wide-ranging differences in participation, as well as attainment, according to gender, socioeconomic status and ethnic background. There is a long history of research into gender differences, and of attempts to shift the balance of girls’ participation. It is fair to say that major shifts in patterns of participation have been achieved in this area mainly when statutory authority has been brought to bear, so that girls are no longer able to ‘opt out’, or be opted out, of science or mathematics before 16. It is also worth noting that this statutory intervention has confirmed that
103 We note again that some manipulation of the data is necessary to produce comparative cohort-based figures for Scotland.
Recommendation 7.4
Each of the relevant agencies across the UK should have robust systems in place to monitor standards over time at key levels in its qualifications framework.
Recommendation 7.5
Further research is needed into variation in schools’ policies concerning entry requirements to A-level sciences and mathematics and their equivalents in Scotland, and in particular the options that are made available to pupils awarded B and C grades in their GCSEs who wish to continue studies in these subjects post-16.
‘State of the nation’ report I 185The Royal Society
there is no reason, and certainly no empirical evidence, that girls cannot attain as highly as boys in traditionally male domains when given the opportunity, or in some cases compelled, to participate. It is highly probable that, if participation in the study of physical science were required of them post-16, girls would continue to demonstrate equal capacity. It also needs to be recalled that this is not a uniform issue across the sciences. Girls form the majority in A-level and Higher biology entries, and are approximately equally represented or in a significant majority (Northern Ireland) in chemistry. However, it is a significant and remarkably uniform issue with physics. Across the UK girls form only a minority of physics students beyond the end of compulsory education. Girls’ participation in mathematics is more variable, with England showing the lowest relative take-up and Scotland the highest (an approximately equal gender balance). However, the Scottish success in mathematics does not appear to transfer to physics.
The patterns of participation and attainment across socioeconomic and ethnic groups presented in chapter 5 are complex, and at times unexpected. It is perhaps predictable that both attainment and participation are low among the lowest socioeconomic quartile. However, it is less predictable that, post-16 participation in particular, but also to a slight extent attainment, should also be lower (relative to the middle 50%) among the highest socioeconomic quartile, even though the relative differences are smaller. Lower participation, it appears, does not necessarily indicate reduced opportunity, though at any socioeconomic level parental pressure must not be discounted. The data indicate also that there is no automatic reduction in attainment or participation as a result of membership of an ethnic minority group: Chinese students repeatedly outperform other groups.
It would be wrong to pretend that there are simple solutions here. Even conceptualizing differential patterns of attainment presents challenges: lower attainment is sometimes identified with ‘under-attainment’. Yet this type of language embodies assumptions about what might be expected of the groups concerned. So-called value-added studies might be thought of as a route out of this difficulty, enabling us to understand better whether groups have not fulfilled the potential demonstrated at an earlier stage. Yet it needs to be recalled that patterns of differential achievement across the various groupings emerge very early within the education system. Certainly, it appears to be the case in the English data considered here that prior attainment is the key predictor of progression and that differences in attainment emerge well before the 14−19 age range considered in this report. Determining defensible baselines from which to track later attainment, and thus to identify under-attainment properly so-called, is not straightforward, and might be judged an urgent challenge. Moreover we are of course conscious that any finding of so-called ‘under-achievement’, or ‘under-participation’ is likely to have as its corollary ‘over-achievement’ and ‘over-participation’ in other groupings. Nevertheless we believe that a pragmatic and defensible position to adopt is that any significant deviation from similar patterns of
attainment and participation, whether across gender, socioeconomic or ethnic groupings, is a legitimate cause for concern, for investigation and potentially for intervention.
If the process of identifying these patterns is a challenge, explaining them and intervening to prevent them are yet greater ones. Curricula and teaching methods, as well as peer and family cultures, are all potentially important influences. We know relatively little about the processes and criteria by which young people choose to participate, or not to participate, in science and mathematics when the option becomes open to them. Research based around ‘attitudes’ is notoriously difficult to conduct and interpret, in part because of the problematic linkage between what students say about these issues and their behaviour. So far as English students are concerned the situation can perhaps be summed up succinctly in the phrase cited in chapter 6 from Jenkins & Nelson (2005): for many late secondary students science is ‘important, but not for me’. In other words, students see science as a worthy subject, but not one which appeals strongly to their personal interests, or their vision of their own future in terms of work or even personal interests.
Differences in the relative difficulty of A-level subjects are highlighted by the 2008 CEM Centre report (Coe et al.2008a). Apart from the somewhat surprising finding that general studies is the most difficult A-level subject, physics, chemistry, biology and further mathematics were found to be the second-to-fifth most difficult subjects. But whether students accurately perceive that they are likely to earn approximately 0.75 of a grade higher by entering psychology than by entering physics does not necessarily dictate that they will automatically choose psychology. The CEM centre has suggested weighting UCAS tariffs so that at the point of entry to university standards are essentially equivalent. This adjustment, or the rejected option of adjusting all grades so that they are standard across subjects, might have the advantage of improving the appeal of science subjects so that they appear less risky, but it is difficult to predict the extent to which student decision-making would be affected. It is possible that greater transparency within the current system about the level of assessment required in different subjects would provide some improvement. If students know that their achievements in more difficult subjects will be recognized and rewarded, particularly in university applications, the brightest students may well be attracted to more difficult subjects.
While there is a good deal of what might be called ‘folk wisdom’ or ‘common knowledge’ about what motivates and interests students, recent research has begun to investigate the processes of subject and career choice from new perspectives, focusing particularly on students’ notions of self and identity (Ball et al. 2000; Foskett & Hemsley-Brown 2001; White 2007; Archer & Francis 2007). These student perspectives are as much or more about lived experience and a sense of students’ own life narrative as they are about motivation or intellectualized judgements. There is evidence that students have begun to frame likely narratives and associated choices well before the late secondary years. We can note that these characteristics are shared broadly across
186 I Science and mathematics education, 14–19 The Royal Society
the developed countries, though much less so in the developing world. It appears then that this area is one which runs much deeper than can be encompassed by curriculum or pedagogic reform, particularly if that reform is focused in the late secondary years. The recent Economic and Social Research Council (ESRC) Science & Mathematics Education Targeted Initiative has sponsored a substantial programme of work in this area which is just getting underway. It represents an important opportunity to generate a deeper understanding of these issues, though the first findings will not become available for some years. This initiative should be considered for extension into a major research programme into science and mathematics education with a specific remit to compare and contrast UK nations in order to evaluate different practices and policies. In addition, it is important that studies are coordinated, and assimilated into the policy-making process, and that they focus not merely on problems but also on the many examples of successful practices in schools and elsewhere.
The majority of the statistics in chapter 5 are drawn from national datasets, but only a subset, mainly relating to gender, are published in any detail across subjects. The sources of the data are in some cases from ad hoc studies conducted by Government departments, and in others from academic or other commissioned work. Moreover, again other than that on gender, the data reported here relate almost entirely to England. The key findings were the high correlation between prior attainment and progression in chemistry, physics and mathematics (data for biology were not available) and the correlation between the study of GCSE single subject chemistry and physics as separate specialist sciences and progression to those subjects at A-level. It is probable that broadly similar patterns can be found in the other UK nations, but we are not in a position to say so confidently. In sum, there are no detailed and systematic public statistics available about these important issues at the level of science and
mathematics, despite the investment of significant amounts of effort and public funding in gathering such substantial resources as the English National Pupil Database. These resources represent a powerful tool which needs to be fully exploited.
7.3 Reforming the system
The shifting patterns of participation and attainment which we have reviewed in this report have occurred against an ongoing process of institutional and policy reform. Two general points might be made about this process. They apply across the four nations, though perhaps not uniformly.
First there is intense pressure within the education system directed towards improving ‘standards’. Despite the ambiguity we noted earlier, in political discourse, the word ‘standards’ is usually taken to mean the numbers of students attaining qualifications at particular levels against a fixed benchmark. This is reflected in the annual publication of high-stakes statistical indicators relating both to the system as a whole and, in England at least, to individual schools. There has been some retrenchment on the publication of school-level data in Wales, but a significant reduction in England seems unlikely for the foreseeable future. By contrast, little attention is given to the complexity of the influences on these numbers, the difficulty in their interpretation, the impact on schools’ entry policies or even the statistical variations which might be expected from year to year. The expectation of annual increases in ‘standards’ is very great. This high-stakes use of crude numerical indicators encourages an annual debate about whether standards, in the different sense to that in
Recommendation 7.6
Further research is needed into the drop in science and mathematics participation post-16, with a particular focus on students’ decision-making and actions, and this should be conducted in a coordinated way across the UK.
Recommendation 7.7
Further research is needed into schools with relatively high take-up of mathematics and science subjects post-16, using a sufficient number to account for variation in the student population, particularly in prior attainment, and the variation in school circumstances.
Recommendation 7.8
The impact, in England, on progression to science post-16 of the ‘entitlement’ for certain students to study separate science GCSEs from 2008 should be monitored.
Recommendation 7.9
Across the UK, published annual education statistics should include much greater detail about patterns of socioeconomic and ethnic participation and attainment in science and mathematics.
Recommendation 7.10
A programme of research should be undertaken making use of large-scale national datasets to understand better patterns of socioeconomic and ethnic participation and attainment.
‘State of the nation’ report I 187The Royal Society
which we have used the term above, have been compromised. Some might argue that it leads to pressure on the standards themselves. A more considered approach within both political rhetoric and the public reporting system, which placed less emphasis on year-on-year numbers, might lead to a healthier and less corrosive debate.
Second, we note that important aspects both of provision and of the pattern of reform vary significantly across the four UK nations. What might be learned from this great ‘natural experiment?’104 The most striking difference between Scotland and the other nations was identified above: the apparently larger percentage of the cohort, at Higher level, participating in science and mathematics. The source of this difference is likely in part to be the different pattern of subject take up for Highers, because stronger S5 students are likely to be entered for five or more Highers, and a significant minority of S6 students also enter in Higher subjects. However, we note also, for science, that Standard Grade and Intermediate courses are dominated by the specialist science disciplines. Does the rest of the UK have anything to learn from any of these differences in policy and provision? Similarly, in Northern Ireland the proportions of students attaining GCSE grades A*−C are in general substantially higher across the sciences and mathematics than in either England or Wales. Is there any identifiable cause of this?
Across all of the UK nations the means by which the direction of policy reforms are determined, the mechanisms of implementation and the timeframe within which they are evaluated all merit serious attention. The introduction of the English (and at that stage Welsh) National Curriculum was dominated by rushed, and in some cases politicized, initiatives and ad hoc responses, which necessitated several wholesale revisions. The trajectory of reform visible from the appointment of the Tomlinson working group to the current development of the Diploma might be cited as another example of a process with an unclear and unstable rationale.
104 See http://en.wikipedia.org/wiki/Natural_experiment (accessed 10 May 2008).
The guarded response to the announcement of the UCAS tariffs associated with the Diploma reflects the detrimental impact of too close an association between politicized agendas and reform.105 Something similar might be said of the route from GNVQ to AVCE to applied A-levels. Indeed the demise of applied A-levels, as the (as yet untried and untested) Diploma comes into existence, was proposed in a March 2008 Green Paper (DCSF 2008c). It can be argued that none of these initiatives, with the possible exception of GNVQ, has been given adequate time to be tested. The examples just cited are of course predominantly English, and it might be argued that this is significant. The process can be compared with the measured development of Curriculumfor Excellence in Scotland.106 Parallel reforms in Northern Ireland107 and Wales108 arguably lie between these two extremes.
Recent developments in relation to English science provision at Key Stage 4 exhibit a return to precipitate mechanisms of reform. The inspiration for the recent GCSE science reform, and the model for the GCSE suites associated with it, is the Twenty-First Century Science project. The announcement of the reconfiguration of GCSE science, on terms broadly commensurate with Twenty-First Century science, was made before any serious evaluation of that project had been undertaken. Indeed it can be claimed that the project has not been evaluated, since the evaluation which was undertaken focused purely on one part of it − the Core science award. Nor is it likely to be. We have already noted that the Government has introduced a range of measures to encourage more highly attaining students in England to follow courses in the separate science disciplines, apparently in the expectation that this will promote increased participation in the physical sciences post-16. The basis of this initiative is not entirely clear: it is not clear whether it owes anything to the evidence available from Scotland. At any rate it appears to draw at least in part on a series of privately commissioned reports on the position of physics in schools.109
Furthermore it was announced not within any systematic review of science education policy, but rather within the documents associated with the 2006 Budget (H M Treasury 2006). The evidence presented in chapter 5 showing correlations between participation in separate science GCSEs and progression was produced by the DCSF significantly after the Key Stage 4 entitlement was announced. It implies,
105 See http://news.bbc.co.uk/1/hi/education/7149994.stm (accessed 4 May 2008).
106 See http://www.curriculumforexcellencescotland.gov.uk/ (accessed 4 May 2008).
107 See http://www.nicurriculum.org.uk/background/curriculum_review.asp(accessed 4 May 2008).
108 See http://new.wales.gov.uk/topics/educationandskills/curriculum_and_assessment/arevisedcurriculumforwales/?lang=en (accessed 4 May 2008).
109 See http://www.buckingham.ac.uk/education/research/ceer/publications.html
Recommendation 7.11
Research on the higher rates of attainment by GCSE students in Northern Ireland should be conducted in order to explore potential lessons that may be learned by other UK nations.
Recommendation 7.12
Research on the greater participation in specialist science disciplines in Scotland should be conducted in order to explore potential lessons that may be learned by other UK nations.
188 I Science and mathematics education, 14–19 The Royal Society
however, that there may indeed be benefits to widening the availability of separate sciences, although school factors may have influenced these figures.
Our purpose here is not to cast doubt on the wisdom of these proposals, or the supporting evidence offered, but rather to press for a system of policy creation and evaluation which is systematic and integrated, and for the avoidance of ad hoc or politicized decisions. Reform should be, so far as possible, evidence-based.
7.4 Looking to the future
It is possible to comment on the patterns of attainment and participation across the UK at many levels of detail, but it will be apparent that it needs to be very fine-grained to catch the many subtle differences that exist. In this report, and this concluding chapter, we have been able to identify and comment on only the most pronounced patterns and issues: the low take-up of physics, the relative decline in mathematics and some of the sciences within post-16 participation, the standards employed in public examinations, and the marked differences of take-up and attainment across gender, socioeconomic status and ethnicity. A review of these issues, and the manner in which they have developed, is likely to form the core of our work when we revisit 14−19 education in mathematics and science in approximately two years’ time, in order to update this report.
In both science and mathematics there is a significant movement for curricula to be made more relevant to students’ everyday and working lives, and, particularly in the case of science, to their role as citizens involved with key political and ethical decisions. This account of the aims of science education is sometimes associated with the contested term ‘scientific literacy’. The revised GCSE criteria ensure its significance across England, Northern Ireland and Wales, but it is also prominent in the guidance for the Scottish Curriculumfor Excellence.110 While mathematics does not offer quite the same linkages to critical issues of personal and collective decision-making, there is a partial parallel in the attention being given to the idea of ‘functional mathematics’. This concept, which seems to have originated in England (DfES
110 See http://www.curriculumforexcellencescotland.gov.uk/buildingthecurriculum/Buildingthecurriculum1/sciences/intro.asp(accessed 4 May 2008).
2005), has also had some influence in Scotland, reflected in the HMIE Report Improving achievement in mathematics.111
These reforms are likely to have an important influence on the likely future experiences of science and mathematics of all students. Their impact, if any, on attainment and participation is likely to receive sustained attention, and we will endeavour to address this in our follow-up to this report, so far as data allow.
Less prominent, but likely to be equally significant for many students, is the increasing emphasis on the ‘vocational’ dimension of science and mathematics education. In England, Northern Ireland and Wales the new ‘applied’ GCSEs and A-levels are attracting a small but growing entry, as are qualifications such as BTEC and OCR Nationals. Beyond these qualifications both science and mathematics are prominent, in the 14−19 Diplomas, with science planned to be available as a Diploma in its own right. The diplomas are being presented as consisting of a balance of applied and academic study, although it remains to be seen whether they will be accepted as a valid replacement of A-levels with regards to entrance to university or whether they will experience the same kinds of issues of acceptance associated historically with ‘applied’ and ‘vocational’ qualifications. The attitude to the Diploma in Wales and Northern Ireland is, to date, ambivalent. Wales has its own structural reform in the Baccalaureate, which is being further rolled out. In Scotland, which has also recently announced plans to introduce a science Baccalaureate, there is a substantial suite of vocational qualifications, many of which have scientific and mathematical dimensions.112 These qualifications have occupied a relatively minor position in the present report, and we will be concerned to follow their development, any growth in their significance, and their relationship with the study of science in higher education.
It is difficult to predict the impact of the removal in Northern Ireland of the compulsory study of Key Stage 4 science, a change that will be unique in the UK. Given the CCEA’s continued preference for a double-award style offer, it may be that a double- and single-award approach continues to feature in Northern Ireland. However, it is hoped that with students having more control over their decision making the study of separate sciences will be encouraged, although whether there will be a move to the greater specialization that is observed in Scotland remains to be seen. The extent to which schools continue to encourage or require students to study science at GCSE is likely to have the most direct bearing in future on Key Stage 4 and post-16 participation in Northern Ireland.
Finally, and somewhat more parochially, we can observe that in England the Government’s support for specialist schools has led to the growth of some 400 specialist science colleges (including second specialisms) with a further 300 specializing in mathematics. The nature of these institutions, the character of the science and mathematics taught within them and,
111 See http://www.sqa.org.uk/sqa/13845.html (accessed 4 May 2008).
112 See http://www.sqa.org.uk/sqa/2.html (accessed 4 May 2008).
Recommendation 7.13
The UK Government should routinely draw on the evidence base it oversees, in consultation with its STEM partners, before committing to educational reform that could have unintentional effects on science and mathematics uptake and progression.
‘State of the nation’ report I 189The Royal Society
perhaps even more significant, the place of science and mathematics in schools without these specialisms all deserve attention.
7.5 In conclusion
If there was to be one immediate message to be highlighted above others from this report in relation to the position of science and mathematics education in the UK, it would perhaps be a stress on the need for reform (how it is devised, its implementation and its evaluation) to proceed in a more considered and evidence-based manner. The process should be of a piece with wider policy reforms, and, where possible, draw on evidence from across the UK nations and elsewhere. Monitoring of the impact over a reasonable time-period, before further changes are introduced, is essential. The process would also benefit from a greater distancing from political control. Across all of these aspects the experience of the last decade within science and mathematics education has been mixed. The intensity and diversity of the reform process, and its sometimes erratic character, make it difficult
to judge against any kind of stable background whether our systems of science and mathematics education are fit for purpose, let alone whether they are improving. While the Royal Society will continue to monitor the process and impacts of change in science and mathematics education, there is clearly a need for authoritative bodies in England, Northern Ireland, Scotland and Wales to act independently from Government, and directly in the public interest, to ensure that educational reform is driven by the needs of education rather than the sometimes short-term agendas of politicians.
Recommendation 7.14
There should be a fully independent body responsible for curriculum reform in each of the UK nations.
190 I Science and mathematics education, 14–19 The Royal Society
ACME Advisory Committee on Mathematics Education
AGNVQ Advanced General National Vocational Qualification
AQA Assessment and Qualifications Alliance
AS Advanced Subsidiary (qualification)
ASE Association for Science Education
AVCE Advanced Vocational Certificate of Education
BTEC Business and Technician Education Council
CBI Confederation of British Industry
CCEA Council for the Curriculum Examinations and Assessment (Northern Ireland)
CEM Curriculum Evaluation and Management Centre, University of Durham
CPD Continuing professional development
CSE Certificate of Secondary Education
CSYS Certificate of Sixth Year Studies
DCSF Department for Children, Schools and Families
DENI Department of Education, Northern Ireland
DES Department for Education and Science
DfEE Department for Education and Employment
DfES Department for Education and Skills
DIUS Department for Innovation, Universities and Skills
EPPI Evidence, Policy and Practice Initiative
FE Further Education
FSM Free school meal
FSMQ Free standing mathematics qualification
GCE General Certificate of Education
GCSE General Certificate of Secondary Education
GNVQ General National Vocational Qualification
HMSO Her Majesty’s Stationery Office
HND Higher National Diploma
IB International Baccalaureate
IBO International Baccalaureate Organisation
ICT Information and communications technology
IDACI Income Deprivation Affecting Children Index
IGCSE International General Certificate of Secondary Education
JCQ Joint Council of Qualifications
LEA Local Education Authority (now known as Local Authority)
LSYPE Longitudinal Study of Young People in England
MEI Mathematics in Education and Industry
NAW National Assembly of Wales
NFER National Foundation for Educational Research
NPD National Pupil Database
NQF National Qualifications Framework
NVQ National Vocational Qualification
OCR Oxford and Cambridge Region (Examination Board)
OECD Organisation for Economic Co-operation and Development
ONS Office for National Statistics
PISA Programme for International Student Assessment
PLASC Pupil Level Annual School Census
PSA Public Service Agreement
PSE Personal and Social Education
PTR Pupil/teacher ratio
QCA Qualifications and Curriculum Authority
RS Royal Society
SCIS Scottish Council of Independent Schools
SCOTVEC Scottish Vocational Education Council
SCQF Scottish Credit and Qualifications Framework
SEB Scottish Education Board
SFR Statistical First Release
SQA Scottish Qualifications Authority
STEM Science, technology, engineering and mathematics
TDA Training and Development Agency for Schools
TIMSS Third International Mathematics and Science Study
UCAS Universities and Colleges Admissions Service
VCE Vocational Certificate of Education
WJEC Welsh Joint Council Education Committee
Glossary
‘State of the nation’ report I 191The Royal Society
Adams, R J 2003 A response to ‘Cautions on OECD’s Educational Survey (PISA)’. Oxford Rev. Ed. 29, 377–389.
Alexander, R 2000 Culture and pedagogy: international comparisons in primary education. Oxford: Blackwell.
Archer, L & Francis, B 2007 Understanding minority ethnic achievement: the role of race, class, gender and ‘success’.London: Routledge.
Atkin, M J & Black, P 1997 Policy perils of international comparisons: the TIMSS case. Phi Delta Kappan 79, 22–28.
Ball, S J, Maguire, M & Macrae, S 2000 Choice, pathways, and transitions post-16: new youth, new economies in the global city. London: RoutledgeFalmer.
Barmby, P, Kind, P M & Jones, K 2008 Examining changing attitudes in secondary school science. Int. J. Sci. Ed. 30,1075–1093.
Bell, J & Donnelly, J 2006 Double award applied science: issues and responses. School Science Review 88, 57–65.
Bennett, J & Hogarth, S 2005 ‘Would YOU want to talk to a scientist at a party?’. Students’ attitudes to school science and science. Research Paper 2005/08. York: University of York, Department of Educational Studies. (See Paper 8 at www.york.ac.uk/depts/educ/ResearchPaperSeries/index.htm)
Bennett, J & Hogarth, S 2006 Evaluation of Twenty-First Century Science, strand 2. Attitudes to science. Report commissioned by The Nuffield Foundation and the Wellcome Trust. York: University of York, Department of Educational Studies. (See www.21stcenturyscience.org/rationale/pilot-evaluation,1493,NA.html)
Bennett, J, Lubben, F & Hogarth, S 2007 Bringing science to life: a synthesis of the research evidence on the effects of context-based and STS approaches to science teaching. Science Education 91, 347–370.
Blair, A 2007 League tables ‘encourage soft exam choices’. The Times, 23 July 2007. (See http://www.timesonline.co.uk/tol/life_and_style/education/school_league_tables/article2120782.ece)
Blatchford, P, Bassett, P, Brown, P, Martin, C & Russell, A 2004 The effects of class size on attainment and classroom processes in English primary schools (Years 4 to 6) 2000–2003. Research Brief RBX13-04. London: DfES. (See http://www.dfes.gov.uk/research/data/uploadfiles/RBX13-04.pdf)
Blenkinsop, S, McCrone, T. Wade, P & Morris, M 2006 Howdo young people make choices at 14 and 16? Slough: NFER.
Boaler, J 1997 Experiencing school mathematics: teaching styles, sex and setting. Buckingham: Open University Press.
Boaler, J & Staples, M 2008 Creating mathematical futures through an equitable teaching approach: the case of Railside School. Teacher. Coll. Rec. 110, 608–645.
Bracey, G W 1997 The truth about America’s schools. TheBracey Reports 1991–97. Bloomington, IN: Phi Delta Kappa Educational Foundation.
Bradshaw, J, Sturman, L, Vappula, V, Ager, R & Wheater, R 2007 Achievement of 15-year-olds in England: PISA 2006 National Report (OECD Programme for International Student Assessment). Slough: NFER.
Broadfoot, P & Black, P 2004 Redefining assessment? The first ten years of Assessment in Education. Assessment Ed. 11, 7–27.
Brown, M 1996 FIMS and SIMS: the first two IEA International Mathematics Surveys. Assessment Ed. 3, 193–212.
Brown, M 1999 Problems of interpreting international comparative data. In Comparing standards internationally: research and practice in mathematics and beyond (ed. B Jaworski & D Phillips), pp. 183–205. Oxford: Symposium.
Brown, M, Brown, P & Bibby, T 2007 ‘I would rather die’. Attitudes of 16 year-olds towards their future participation in mathematics. In Proc. Br. Soc. Res. Learning Math. 27, vol. 1 (ed. D Küchemann), pp. 18–23. (See http://www.bsrlm.org.uk/IPs/ip27-1/BSRLM-IP-27-1-Full.pdf)
Cassen, R & Kingdon, G G 2007 Understanding low achievement in English schools. (See http://econpapers.repec.org/paper/cepsticas/_2F118.htm)
CBI 2008 Taking stock: CBI education and skills survey 2008. London: CBI.
Cerini, B, Murray, I & Reiss, M 2004 Student review of the science curriculum. Major findings. London: Planet Science. (See http://www.planet-science.com/sciteach/review/Findings.pdf)
Charles, M, Marsh, A, Milne, A, Morris, C, Scott, E & Shamsan, Y 2008 Secondary School Curriculum and Staffing Survey 2007. (DCSF Research Report 026.) London: DCSF.
Clark, L 2007 Billions spent on education, but British schools slump in the world league. Daily Mail, 5 December 2007. (See http://www.dailymail.co.uk/news/article-499753/Billions-spent-education-British-schools-slump-world-league.html)
Coe, R, Searle, J, Barmby, P, Jones, K & Higgins, S 2008aRelative difficulty of examinations in different subjects.
References
192 I Science and mathematics education, 14–19 The Royal Society
Durham: CEM Centre. (See http://www.cemcentre.org/documents/news/SCORE2008report.pdf)
Coe, R J, Searle, J, Barmby, P, Jones, K & Higgins, S 2008bSummary report. Relative difficulty of examinations in different subjects. Durham: CEM Centre. (See http://www.cemcentre.org/documents/news/SCORE2008summary.pdf)
Cox, S 2006 The truth about school league tables. BBC Radio 4 broadcast on 20 October 2006. (See http://murfy.org/wordpress/?p=26)
DCSF 2007a GCSE and equivalent examination results in England 2005/06 (Revised). SFR 01/2007. (See http://www.dcsf.gov.uk/rsgateway/DB/SFR/s000702/SFR01-2007.pdf)
DCSF 2007b National Curriculum assessment, GCSE and equivalent attainment and post-16 attainment by pupil characteristics, in England 2006/07. SFR 38/2007. (See http://www.dfes.gov.uk/rsgateway/DB/SFR/s000759/index.shtml)
DCSF 2008a GCE/VCE A/AS and equivalent examination results in England, 2006/07 (Revised). SFR 02/2008. (See http://www.dfes.gov.uk/rsgateway/DB/SFR/s000769/index.shtml)
DCSF 2008b GCSE and equivalent examination results in England 2006/07 (Revised). SFR 01/2008. (See http://www.dfes.gov.uk/rsgateway/DB/SFR/s000768/sfr01-2008.pdf)
DCSF 2008c Promoting achievement, valuing success: a strategy for 14–19 qualifications. Norwich: The Stationery Office.
DENI 2006 Evidence to House of Commons Committee of Public Accounts 2006. In Improving literacy and numeracy in schools (Northern Ireland). Second Report of Session 2006–07, table 3, p. 35. London: The Stationery Office Ltd.
DENI 2007 Qualifications and destinations of Northern Ireland school leavers 2005/06. Statistical Press Release. (See http://www.deni.gov.uk/sls0506pdf-2.pdf)
Department for Education 1995 The National Curriculum,p. vi. London: HMSO.
Department of Education and Science 1968 Enquiry into the flow of candidates in science and technology into higher education. (The Dainton Report.) London: HMSO.
DfES 2005 14–19 education and skills. Norwich: The Stationery Office.
DfES 2006a GCE VCE A/AS examination results for young people in England 2004/05. (Revised). SFR 01/2006. (See http://www.dfes.gov.uk/rsgateway/DB/SFR/s000630/SFR01-2006v1.pdf)
DfES 2006b London Science Challenge. Guidance notes for headteachers and heads of Science on the new KS4 Science curriculum, p. 12. Publication no. D16/6572. London: DfES.
DfES 2007a Participation in education, training and employment by 16–18 year olds in England: 2005 and 2006 and Participation in education and training by 16 and 17 year olds in each Local Area in England: 2004 and 2005. SFR22/2007. (See http://www.dfes.gov.uk/rsgateway/DB/SFR/s000734/index.shtml)
DfES 2007b Gender and education: the evidence on pupils in England. (See http://www.dfes.gov.uk/research/data/uploadfiles/RTP01-07.pdf)
DIUS 2007 World class skills: implementing the Leitch Review of Skills in England. Norwich: The Stationery Office.
Elliott, J & Hufton, N 2000 International comparisons. What really matters? In Learning from others: international comparisons in education (ed. D Shorrocks-Taylor & E W Jenkins), pp. 79–114. Dordrecht: Kluwer.
European Commission 2006 Science teaching in schools in Europe: policies and research. Brussels: European Commission/Eurydice Unit.
Eurybase 2007/08. The education system in England, Wales, Northern Ireland, 2007/08, p. 170. Brussels: European Commission. (See http://www.eurydice.org/ressources/eurydice/eurybase/pdf/0_integral/UN_EN.pdf, accessed 17 July 2007.)
Evans, R 2007 The history of technical education: a short introduction (2nd edn), p. 52. Cambridge: T Magazine Ltd. (See http://www.tmag.co.uk/extras/history_of_Technical_Education_v2.pdf)
Fitzgibbon, C 1999 Long-term consequences of curriculum choices with particular reference to mathematics and science. School Effectiveness and School Improvement 10, 217–232.
Foskett, N & Hemsley-Brown, J 2001 Choosing futures: young people’s decision making, training and career markets.London: Routledge.
Galton, M, Gray, J & Rudduck, J 2003 Transfer and transitions in the middle years of schools (7–14): continuities and discontinuities in learning. Department for Education and Skills (DfES) research report, no. 443. London: HMSO.
Garden, R A, Lie, S, Robitaille, D F, Angell, C, Martin, M O, Mullis, I V S, Foy, P & Arora, A 2006 TIMSS advanced 2008 assessment frameworks. Boston College: IEA/TIMSS and PIRLS International Study Center.
Garner, R 2005 New exam league tables dismissed as worthless. The Independent, 13 January 2005. (See http://www.independent.co.uk/news/education/education-news/new-exam-league-tables-dismissed-as-worthless-486438.html)
Goldstein, H 2004 International comparisons of student attainment: some issues arising from the PISA study. Assessment Ed. 11, 319–330.
Gorard, S & See, B H 2008 The impact of SES on participation and attainment in science: a review of existing literature. In Exploring the relationship between socioeconomic status and participation and attainment in science education, pp. 22–29. London: The Royal Society.
Gorard, S, See, B H & Smith, E 2008a The impact of SES on participation and attainment in science: an analysis of available data. Paper given at a Royal Society seminar on socioeconomic status and school science on 12 February 2008.
‘State of the nation’ report I 193The Royal Society
Gorard, S, See, B H & Smith, E 2008b The impact of SES on participation and attainment in science: an analysis of available data. In Exploring the relationship between socioeconomic status and participation and attainment in science education, pp. 10–21. London: Royal Society.
Graddy, K & Stevens, M 2003 The impact of school inputs on student performance: an empirical study of private schools in the United Kingdom. (See http://cep.lse.ac.uk/_new/publications/seminar_pubs.asp?ID=18)
Green, F, Machin, S, Murphy, R & Zhu, Y 2008 Competitionfor private and state school teachers. London: London School of Economics.
Hahn, J-H 1995 The quest for national standards in science education in Korea. Stud. Sci. Ed. 26, 59–71.
Harland, J, Moor, H, Kinder, K & Ashworth, M 2002 Is the curriculum working? The key stage 3 phase of the Northern Ireland Curriculum Cohort Study. Slough: NfER.
Haste, H 2004 Science in my future: a study of values and beliefs in relation to science and technology amongst 11–21-year-olds. Nestlé Social Research programme report no. 1. London: Nestlé Social Research Programme.
H M Treasury 2004 Science and innovation investment framework 2004–2014. London: H M Treasury. (See www.hm-treasury.gov.uk/documents/enterprise_and_productivity/enterprise_and_innovation/science_innov/ent_sciinnov_index.cfm)
H M Treasury 2006 Science and innovation investment framework 2004–2014: next steps. Norwich: The Stationery Office.
Hutchinson, D & Schagen, I 2007 Comparisons between PISA and TIMSS – are we the man with two watches?Slough: NFER.
Jarman, R, McAleese, L, & McConnell, B 1998 A survey of science at Key Stage 4. Summary of main findings,Department of Edcuation Northern Ireland Research Report Series, no. 9.
Jenkins, E & Nelson, N 2005 Important but not for me: students’ attitudes towards secondary school science in England. Res. Sci. Tech. Ed. 23, 41–57.
Knipe, D, Montgomery, A M & Reynolds, M 2005 Traveller children’s experiences in mainstream post-primary schools in Northern Ireland: a qualitative study. Department of Education, Bangor, Northern Ireland.
Kounine, L, Marks, J & Truss, E 2008 The value of mathematics. London: Reform.
Krogh, L B & Thomsen, P 2005 Studying students’ attitudes towards science from a cultural perspective but with a quantitative methodology: border crossing into the physics classroom. Int. J. Sci. Ed. 27, 281–302.
Kutnick, P, Sebba, J, Blatchford, O, Galton, M & Thorp, J (with H. MacIntyre and L. Berdondini) 2005 The effects of
pupil grouping: literature review. (DCSF Research Report 688.) London: DCSF.
Kyriacou, C & Goulding, M 2006 A systematic review of strategies to raise pupils’ motivational effort in Key Stage 4 mathematics. London: EPPI Centre.
Lauglo, J & Maclean, R (eds) 2005 Vocationalisation of secondary education revisited. Berlin Springer.
Lipsett, A 2004 It’s a downward spiral of decline. Times Higher Education Supplement, 17 December 2004. (See http://www.timeshighereducation.co.uk/story.asp?storyCode=193082§ioncode=26)
Lord, P & Jones, M 2006 Pupils’ experiences and perspectives of the national curriculum and assessment: final report for the research review. Slough: NfER.
Martin, M O, Mullis, I V S & Chrostowski, S J (eds) 2004 TIMSS2003 Technical Report. Boston College: TIMSS/PIRLS International Study Center.
Matthews, A & Pepper, D 2005 Evaluation of participation in A-level mathematics. London: QCA. (See www.qca.org.uk/libraryAssets/media/qca-06-2326-gce-maths-participation.pdf)
Mendick, H 2006 Masculinities in mathematics. Maidenhead: Open University Press.
Murphy, P & Whitelegg, E 2006 Girls in the physics classroom: a review of research on the participation of girls in physics.London: Institute of Physics. (See http://www.iop.org/activity/education/Making_a_Difference/Policy/page_22191.html)
Nardi, E & Steward, S 2003 Is mathematics T.I.R.E.D? A profile of quiet disaffection in the secondary mathematics classroom. Br. Ed. Res. J. 29, 345–366.
National Strategies 2008 Progression to post-16 science: an enquiry into the factors which are influential in achieving high levels of take-up of science subjects post-16. London: DCSF.
NCES 2007 Academic performance of fourth graders in mathematics and science. Key findings: Italy, Japan, Russian Federation, United Kingdom (England and Scotland only), United States. Washington: National Center for Education Statistics. (See http://nces.ed.gov/surveys/international/IntlIndicators/pdf/2007006_academic.pdf)
NCETM 2008 Factors influencing progression to A level mathematics. National Centre for Excellence in the Teaching of Mathematics. (See http://www.ncetm.org.uk/Default.aspx?page=13&module=res&mode=100&resid=10114)
Norwood, C 1943 Curriculum and examinations in secondary schools. Report of the Committee of the Secondary School Examinations Council appointed by the President of the Board of Education in 1941. London: H M Stationery Office. (See http://www.dg.dial.pipex.com/documents/docs2/norwood00.shtml)
Nuffield Review of 14–19 Education and Training 2008 Issues Paper 6. Aims and values. (See http://www.nuffield14-19review.org.uk/files/documents179-1.pdf)
194 I Science and mathematics education, 14–19 The Royal Society
Oakeshott, M 1962 The voice of poetry in the conversation of mankind. In Rationalism in politics and other essays, p. 199. London: Methuen.
OCR 2005 Science student survey results. (See www.ocr.org.uk)
OECD 2003 The PISA 2003 assessment framework: mathematics, reading, science and problem solving knowledge and skills. Paris: OECD.
OECD 2004 Learning for tomorrow’s world: first results from PISA 2003. Paris: OECD.
OECD 2007 PISA 2006. Science competencies for tomorrow’s world. Paris: OECD.
Ofsted 2004 Mathematics in secondary schools. HMI 2326. February 2005. London: Ofsted.
Osborne, J & Collins, S 2001 Pupils’ views of the role and value of the science curriculum. Int. J. Sci. Ed. 23, 441–467.
Paton, G 2007 UK’s education record plummets. DailyTelegraph, 5 December 2007. (See http://www.telegraph.co.uk/news/uknews/1571542/UK’s-education-record-plummets.html)
Pollitt, A & Ahmed, A 2001 Science or reading? How students think when answering TIMSS questions. Paper presented to the International Association for Educational Achievement, Rio de Janeiro, Brazil, May 2001.
Ponchaud, B 2006 Showcasing success in science education. Ed. Sci. 218, 8–9.
Prais, S J 2003 Cautions on OCED’s recent educational survey (PISA). Oxford Rev. Ed. 29, 139–163.
Prais, S J 2007 Two recent (2003) international surveys of schooling attainment in mathematics: England’s problems. Oxford Rev. Ed. 33, 1.
PricewaterhouseCoopers LLP 2005 The economic benefits of higher education qualifications: a report produced for the Royal Society of Chemistry and the Institute of Physics. (See http://www.rsc.org/images/EconomicBenefitsHigherEducationQualifications_tcm18-12647.pdf)
Raffe, D 2005 Learning from ‘home international’ comparisons. 14–19 curriculum and qualifications reform in England, Scotland and Wales. Discussion Paper 3 for Seminar on Policy Learning in 14–19 Education. Joint seminar of Education and Youth Transitions Project and Nuffield Review, 15 March 2005. (See http://www.nuffield14-19review.org.uk/files/documents65-1.pdf)
Ramsden, J 1998 Mission impossible? Can anything be done about attitudes to science? Int. J. Sci. Ed. 20, 125–137.
Reid, N & Skryabina, E 2002 Attitudes towards physics. Res.Sci. Tech. Ed. 20, 67–80.
Reiss, M J 2000 Understanding science lessons: five years of science teaching. Buckingham: Open University Press.
Revell, P 2006 Back to basics. The Guardian, 19 January 2006. (See http://education.guardian.co.uk/secondaries/story/0,,1689968,00.html)
Roberts, G 2002 SET for success. The supply of people with science, technology, engineering and mathematics skills.London: H M Treasury. (See www.hm-treasury.gov.uk/documents/enterprise_and_productivity/research_and_enterprise/ent_res_roberts.cfm)
Royal Society 2006a A degree of concern? UK first degrees in science, technology and mathematics, p. 31. London: Royal Society.
Royal Society 2006b Increasing uptake of science post-16. Report of a Royal Society conference held on Friday 10 March 2006. London: Royal Society.
Royal Society 2007 The UK’s science and mathematics teaching workforce. A ‘state of the nation’ report, p. 13. RS1018. London: Royal Society.
Royal Society 2008a A higher degree of concern. RS1068. London: Royal Society.
Royal Society 2008b Exploring the relationship between socioeconomic status and participation and attainment in science education. RS1258. London: The Royal Society.
Ruddock, G, Clausen-May, T, Purple, C & Ager, R 2006 Validation study of the PISA 2000, PISA 2003 and TIMSS 2003 international studies of pupil attainment. Research Report No. 772. Slough: NFER.
Sainsbury, Lord, of Turville 2007 The race to the top. A review of Government’s science and innovation policies. Norwich: HMSO.
Schmidt, W H, Raizen, S, Britton, E D, Bianchi, L J & Wolfe, R G 1997 Many visions, many aims: a cross-national investigation of curricular intentions in school science.Dordrecht: Kluwer.
Scottish Education Department 1969 Science for general education. Curriculum paper 7. Edinburgh: HMSO.
Scottish Education Department 1977a The structure of the curriculum in the third and fourth years of the secondary school. (The Munn Report.) Edinburgh: HMSO.
Scottish Education Department 1977b Assessment for all.(The Dunning Report.) Edinburgh, HMSO.
Scottish Executive 2004 A curriculum for excellence.Edinburgh: Scottish Executive.
Scottish Executive 2007 SQA attainment and school leaver qualifications in Scotland: 2005/06. (See http://www.scotland.gov.uk/Resource/Doc/148629/0039522.pdf)
Scottish Executive Education Department 2003 Assessmentand Achievement Programme: sixth survey of science 2003. Summary. (See http://www.scotland.gov.uk/Resource/Doc/30859/0023657.pdf)
‘State of the nation’ report I 195The Royal Society
Scottish Office 1992 Upper secondary education in Scotland.(The Howie Report.) Edinburgh: HMSO.
Smith, A 2004 Making mathematics count. The report of Professor Adrian Smith’s inquiry into post-14 mathematics education. (See www.mathsinquiry.org.uk/report/)
Stanat, P & Christensen, G 2006 Where immigrant students succeed: a comparative review of performance and engagement in PISA 2003. Paris: OECD.
Stevenson, H W & Stigler, J W 1992 The learning gap: why our schools are failing and what we can learn from Japanese and Chinese education. New York: Simon & Schuster.
Stigler, J & Hiebert, J 1999 The teaching gap: best ideas from the world’s teachers for improving education in the classroom.New York: Free Press.
Strand, S 2007 Minority ethnic pupils in the longitudinal study of young people in England (LSYPE). DCSF Research Report RR002. (See http://www.dfes.gov.uk/research/data/uploadfiles/DCSF-RR002.pdf)
Strand, S 2008 Minority ethnic pupils in the Longitudinal Study of Young People in England. Extension report on performance in public examinations at age 16. (DCSFResearch Report 029.) London: DCSF.
Strand, S & Winston, J 2008 Educational aspirations in inner city schools. Ed. Stud. 34. (In the press.) (For a proof, see http://www2.warwick.ac.uk/fac/soc/cedar/staff/stevestrand/)
Stripp, C 2007 The Further Mathematics Network. Looking ahead. (See http://www.fmnetwork.org.uk/manager_area/files/The%20FM%20Network%20Looking%20Ahead%20Oct%202007b.pdf)
TIMSS 2007a TIMSS 2003. Released items: science. Boston College: TIMSS International Study Center/IEA.
TIMSS 2007b TIMSS 2003. Released items: mathematics.Boston College: TIMSS International Study Center/IEA.
Tomlinson, M 2004 14–19 curriculum and qualifications reform: final report of the Working Group on 14–19 Reform. (See http://www.dfes.gov.uk/14-19/documents/Final%20Report.pdf)
Vidal Rodeiro, C 2007 A-level subject choice in England: patterns of uptake and factors affecting subject preferences. (See http://www.cambridgeassessment.org.uk/ca/digitalAssets/114189_Survey_Report_-_Final.pdf)
von Collani, E 2001 OECD PISA: an example of stochastic illiteracy? Economic Q. Control 16, 227–253.
Welsh Assembly Government 2008a Academic achievement by pupil characteristics, 2005–2007. Statistical Bulletin SB16/2008. (See http://new.wales.gov.uk/topics/statistics/headlines/schools2008/hdw20080327/?lang=en)
Welsh Assembly Government 2008b Academic achievement and entitlement to free school meals. Statistical Bulletin SB13/2008. (See http://new.wales.gov.uk/topics/statistics/headlines/schools2008/hdw20080326/?lang=en)
White, P 2007 Education and career choice: a new model of decision making. Basingstoke: Palgrave Macmillan.
Wiliam, D & Bartholomew, H 2004 It’s not which school but which set you’re in that matters: the influence on ability-grouping practices on student progress in mathematics. Br. Ed. Res. J. 30, 279–294.

196 I Science and mathematics education, 14–19 The Royal Society
ISBN: 978-0-85403-712-4Issued: September 2008 RS1290
Founded in 1660, the Royal Societyis the independent scientific academy of the UK, dedicated to promoting excellence in science
Registered Charity No 207043
The Royal Society6–9 Carlton House TerraceLondon SW1Y 5AGtel +44 (0)20 7451 2500fax +44 (0)20 7930 2170email [email protected] royalsociety.org
The Royal Society is a Fellowship of more than 1300 outstanding individuals from all areas of science, mathematics, engineering and medicine, who form a global scientifi c network of the highest calibre. The Fellowship is supported by over 100 permanent staff with responsibility for the day-to-day management of the Society and its activities. The Society encourages public debate on key issues involving science, engineering and medicine, and the use of high quality scientifi c advice in policy-making. We are committed to delivering the best independent expert advice, drawing upon the experience of the Society’s Fellows and Foreign Members, the wider scientifi c community and relevant stakeholders.
As we prepare for our 350th anniversary in 2010, we are working to achieve fi ve strategic priorities:
Invest• in future scientifi c leaders and in innovationInfl uence• policymaking with the best scientifi c adviceInvigorate• science and mathematics educationIncrease• access to the best science internationallyInspire• an interest in the joy, wonder and excitement of scientifi c discovery