Embed Size (px)
Citation preview
Schwarz, Stefan Theodor and Xing, Yue and Tomar, Pragya and Bajaj, Nin and Auer, Dorothee P. (2016) In vivo assessment of brainstem depigmentation in Parkinson’s: potential as severity marker for multi-centre studies. Radiology . ISSN 1527-1315
Access from the University of Nottingham repository: http://eprints.nottingham.ac.uk/39965/8/radiol%252E2016160662.pdf
Copyright and reuse:
The Nottingham ePrints service makes this work by researchers of the University of Nottingham available open access under the following conditions.
This article is made available under the Creative Commons Attribution licence and may be reused according to the conditions of the licence. For more details see: http://creativecommons.org/licenses/by/2.5/
A note on versions:
The version presented here may differ from the published version or from the version of record. If you wish to cite this item you are advised to consult the publisher’s version. Please see the repository url above for details on accessing the published version and note that access may require a subscription.
For more information, please contact [email protected]
Original research n
Neuroradiology
Radiology: Volume 000: Number 0— 2016 n radiology.rsna.org 1
1 From the Department of Radiological Sciences, Division of Clinical Neuroscience, School of Medicine (S.T.S., Y.X., P.T., D.P.A.), and The Sir Peter Mansfield Imaging Centre, School of Physics and Astronomy (S.T.S., Y.X., D.P.A.), Uni-versity of Nottingham, Queen’s Medical Centre, Derby Rd, Nottingham NG7 2UH, England; Department of Neurology, Nottingham University Hospitals NHS Trust, Nottingham, England (N.B.); and Department of Radiology, Cardiff and Vale University Health Board, Cardiff, Wales (S.T.S.). Received March 29, 2016; revision requested May 17; revision received July 12; accepted July 25; final version accepted August 26. Address correspondence to S.T.S. (e-mail: [email protected]).
This work supported by the Medical Research Council (grant G090132); Parkinson’s UK (grant J-1204), support provided to S.T.S and Y.X.; Special Trustees for Nottingham University Hospital (STR 82/04/N); and the Sarah Matheson Trust (now the Multiple System Atrophy Trust founded by Sarah Matheson).
Published under a CC BY 4.0 license.
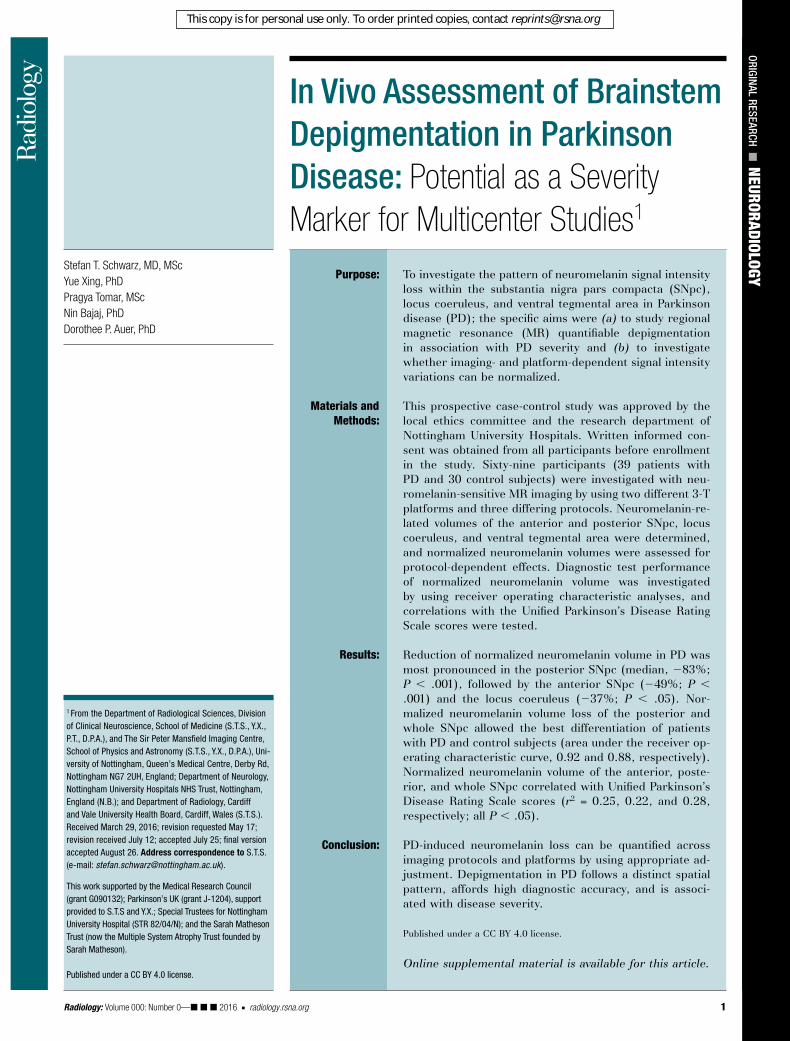
Purpose: To investigate the pattern of neuromelanin signal intensity loss within the substantia nigra pars compacta (SNpc), locus coeruleus, and ventral tegmental area in Parkinson disease (PD); the specific aims were (a) to study regional magnetic resonance (MR) quantifiable depigmentation in association with PD severity and (b) to investigate whether imaging- and platform-dependent signal intensity variations can be normalized.
Materials and Methods:
This prospective case-control study was approved by the local ethics committee and the research department of Nottingham University Hospitals. Written informed con-sent was obtained from all participants before enrollment in the study. Sixty-nine participants (39 patients with PD and 30 control subjects) were investigated with neu-romelanin-sensitive MR imaging by using two different 3-T platforms and three differing protocols. Neuromelanin-re-lated volumes of the anterior and posterior SNpc, locus coeruleus, and ventral tegmental area were determined, and normalized neuromelanin volumes were assessed for protocol-dependent effects. Diagnostic test performance of normalized neuromelanin volume was investigated by using receiver operating characteristic analyses, and correlations with the Unified Parkinson’s Disease Rating Scale scores were tested.
Results: Reduction of normalized neuromelanin volume in PD was most pronounced in the posterior SNpc (median, 283%; P , .001), followed by the anterior SNpc (249%; P , .001) and the locus coeruleus (237%; P , .05). Nor-malized neuromelanin volume loss of the posterior and whole SNpc allowed the best differentiation of patients with PD and control subjects (area under the receiver op-erating characteristic curve, 0.92 and 0.88, respectively). Normalized neuromelanin volume of the anterior, poste-rior, and whole SNpc correlated with Unified Parkinson’s Disease Rating Scale scores (r2 = 0.25, 0.22, and 0.28, respectively; all P , .05).
Conclusion: PD-induced neuromelanin loss can be quantified across imaging protocols and platforms by using appropriate ad-justment. Depigmentation in PD follows a distinct spatial pattern, affords high diagnostic accuracy, and is associ-ated with disease severity.
Published under a CC BY 4.0 license.
Online supplemental material is available for this article.
Stefan T. Schwarz, MD, MScYue Xing, PhDPragya Tomar, MScNin Bajaj, PhDDorothee P. Auer, PhD
in Vivo assessment of Brainstem Depigmentation in Parkinson Disease: Potential as a Severity Marker for Multicenter Studies1
This copy is for personal use only. To order printed copies, contact [email protected]
2 radiology.rsna.org n Radiology: Volume 000: Number 0— 2016
NEURORADIOLOGY: In Vivo Assessment of Brainstem Depigmentation in Parkinson Disease Schwarz et al
ventral tegmental area (VTA), and the locus coeruleus (LC) (1). Anatomically, these nuclei can be readily appreciated macroscopically because of a pigment accumulated within the cells called neu-romelanin (2). This protein polymer has a molecular structure similar to the skin pigment melanin and is a by-prod-uct of catecholamine synthesis. It is deposited within the cells in an age-de-pendent manner and is largely absent at birth, with accumulation throughout adult life (3,4). There is a PD-induced pathologic decline of SNpc, VTA, and LC neurons that contain neuromelanin, which results in pronounced depigmen-tation (5,6).
Although the whole of the pars compacta is involved in PD-induced neurodegeneration, the dopaminergic cell loss is nonuniform across its subre-gions. An area previously described as “ventrolateral” substantia nigra is pref-erentially and most extensively affected (7). The degree of neuronal loss in the SNpc is correlated to PD severity, which confirms the potential of SNpc imaging in tracking disease progression (8,9). By exploiting the paramagnetic properties of neuromelanin, T1-weight-ed “neuromelanin-sensitive” magnetic resonance (MR) imaging sequences have been developed to identify and characterize the SNpc and LC in vivo and demonstrate PD-induced signal in-tensity loss (10,11). Neuromelanin-re-lated MR imaging SNpc signal intensity increase and corresponding loss in PD was confirmed in primates and human specimens postmortem, with good cor-relation between the density of SNpc neuromelanin that contained neurons and neuromelanin-related MR imaging signal intensity (12,13).
Previous studies also demonstrated the potential of neuromelanin-related SNpc signal intensity loss to index disease progression by showing Hoehn and Yahr stage-dependent changes (14–16). It is unclear whether and how closely neuromelanin-related SNpc sig-nal intensity changes correlate to the Unified Parkinson’s Disease Rating Scale (UPDRS) scores as a more accu-rate estimator of disease severity. How well neuromelanin MR imaging reflects
Parkinson disease (PD) is charac-terized by a depletion of catechol-aminergic neurons in brainstem
gray matter nuclei, such as the substan-tia nigra pars compacta (SNpc), the
Published online before print10.1148/radiol.2016160662 Content codes:
Radiology 2017; 000:1–10
Abbreviations:AUC = area under the ROC curveCI = confidence intervalLC = locus coeruleusMT = magnetization transferPD = Parkinson diseaseROC = receiver operating characteristicSD = standard deviationSNpc = substantia nigra pars compactaUPDRS = Unified Parkinson’s Disease Rating ScaleVTA = ventral tegmental area
Author contributions:Guarantors of integrity of entire study, S.T.S., Y.X., D.P.A.; study concepts/study design or data acquisition or data analysis/interpretation, all authors; manuscript drafting or manuscript revision for important intellectual content, all authors; approval of final version of submitted manuscript, all authors; agrees to ensure any questions related to the work are appropriately resolved, all authors; literature research, S.T.S., Y.X., P.T., D.P.A.; clinical studies, S.T.S., N.B., D.P.A.; experimental studies, S.T.S., Y.X.; statistical analysis, S.T.S., Y.X., P.T., D.P.A.; and manuscript editing, S.T.S., Y.X., N.B., D.P.A.
Conflicts of interest are listed at the end of this article.
Advances in Knowledge
n Neuromelanin-weighted MR im-aging sequences with additional magnetization-transfer pulses are sensitive to Parkinson disease (PD)–induced depigmentation of the substantia nigra pars com-pacta (SNpc) (volume in control subjects, 112.8 mm3 6 46.1; volume in patients with PD, 52.8 mm3 6 29.4; P , .001) and locus coeruleus (LC) (volume in con-trol subjects, 16.7 mm3 6 9.1; volume in patients with PD, 11.7 mm3 6 6.2; P , .05) but not to neuronal loss in the ventral teg-mental area (VTA) (volume in control subjects, 1.3 mm3 6 1.6; volume in patients with PD, 1.5 6 2.2 [not significant]).
n Variations in MR sequences and imaging unit platforms can be corrected by using sequence-spe-cific signal intensity thresholds, thereby enabling between-site standardized volumetric analysis.
n The most severe PD-induced signal intensity volume loss is found in the posterior SNpc (median, 83%; range, 34%–100%), which correlates well with findings in previous histopatho-logic studies and shows one of the best receiver operating character-istic (ROC) values (area under the ROC curve, 0.92 6 0.03; P , .001) to distinguish patients with PD from healthy control subjects.
n There is a significant inverse cor-relation of the Unified Parkinson’s Disease Rating Scale score (a clin-ical measure of disease severity) with the signal intensity volume of the anterior (r2 = 0.25, P , .05), posterior (r2 = 0.22, P , .05), and whole (r2 = 0.28, P , .05) SNpc but not that of the LC or the VTA (SNpc volumes corrected for age and cerebral volume).
disease progression and which subre-gions are most suited to index disease severity also remain unknown.
Additionally, there is lack of stan-dardization, with studies to date vary-ing in acquisition and analysis proto-cols; this significantly limits the wider clinical use of neuromelanin MR imag-ing. To the best of our knowledge, there are currently no investigators studying and controlling for the effects of dif-ferent imaging unit platforms and se-quences on neuromelanin-related signal intensity. Being able to compare results independent of different imaging unit platforms or sequences is, however, im-perative if this technique is to be used clinically or in multicenter trials.
The purpose of this study was to investigate the pattern of neuromelanin signal intensity loss within the SNpc, LC, and VTA in PD. The specific aims were (a) to study regional MR-quan-tifiable depigmentation in association with PD severity and (b) to investigate whether imaging- and platform-depen-dent signal intensity variations can be normalized.
Radiology: Volume 000: Number 0— 2016 n radiology.rsna.org 3
NEURORADIOLOGY: In Vivo Assessment of Brainstem Depigmentation in Parkinson Disease Schwarz et al
in neuroradiology with 8 years of expe-rience in movement disorder imaging research) (14,18,19). Suprathreshold hyperintense volumes were assessed on three adjacent sections in the whole SNpc, VTA, and LC. In addition, the SNpc was geometrically divided into anterior and posterior halves by using manually placed regions of interest (an-terior and posterior SNpc, performed by S.T.S.). Region of interest placement and signal intensity distribution were deter-mined by using image analysis software (Jim version 7.0, Xinapse Systems, Col-chester, United Kingdom; www.xinapse.com). For more details, see Figures E1–E6 (online). Backgrounds were chosen as midbrain tegmentum and cerebral pe-duncles for the SNpc and VTA, respec-tively, and the pons for the LC. We aver-aged the signal intensity obtained from the background regions of interest for calculation of the mean background sig-nal intensity and expressed background noise as the standard deviation (SD) of the background signal intensity.
We determined an adjustment factor for the threshold to define neuromelanin-containing voxels across acquisition pro-tocols and imaging units. We achieved this by identifying a reference protocol out of the three neuromelanin-sensitive MR imaging protocols that best matched the normative volumes from a recent
previously (14). The current study ex-pands on the prior study by introducing a new algorithm to adjust for varying neu-romelanin-sensitive sequences and imag-ing unit platforms by introducing a new segmentation technique of the substantia nigra and by relating neuromelanin sub-regional SNpc signal intensity changes to UPDRS scores.
Imaging was performed with two 3-T MR imaging units (Achieva, Philips Med-ical Systems, Best, the Netherlands; and Discovery MR750, GE Healthcare, Mil-waukee, Wis) with eight- and 32-chan-nel head coils, respectively, and three different sequences (spectral presatura-tion inversion-recovery acquisition with the Philips imaging unit, magnetization-transfer [MT] acquisition with the Philips imaging unit, and MT acquisition with the GE Healthcare imaging unit; Table 1). The orientation of the axial sections was individually aligned parallel to a line that connected the splenium and genu of the corpus callosum. High-spatial-resolution anatomic images were obtained in each individual’s brain by using a T1-weighted three-dimensional magnetization-pre-pared rapid-acquisition gradient-echo sequence (voxel size, 1 mm isotropic).
We modified a previously proposed analysis method to determine hyper-intense neuromelanin-rich volumes (S.T.S., a senior clinical research fellow
Materials and Methods
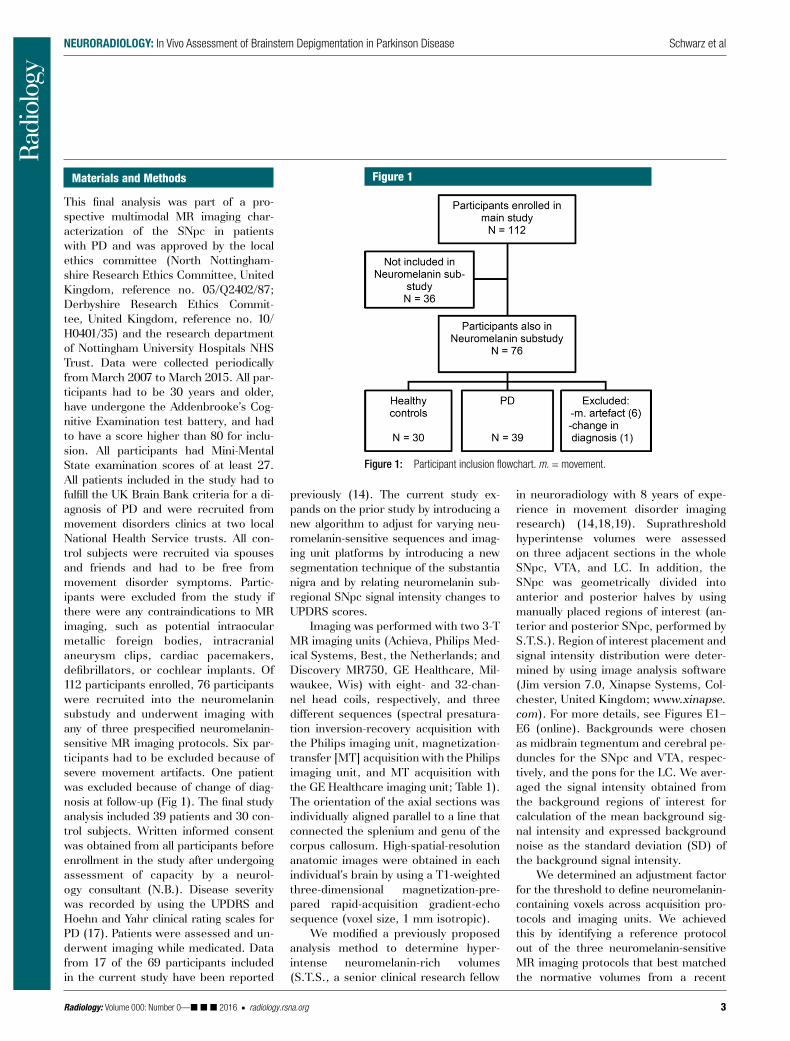
This final analysis was part of a pro-spective multimodal MR imaging char-acterization of the SNpc in patients with PD and was approved by the local ethics committee (North Nottingham-shire Research Ethics Committee, United Kingdom, reference no. 05/Q2402/87; Derbyshire Research Ethics Commit-tee, United Kingdom, reference no. 10/H0401/35) and the research department of Nottingham University Hospitals NHS Trust. Data were collected periodically from March 2007 to March 2015. All par-ticipants had to be 30 years and older, have undergone the Addenbrooke’s Cog-nitive Examination test battery, and had to have a score higher than 80 for inclu-sion. All participants had Mini-Mental State examination scores of at least 27. All patients included in the study had to fulfill the UK Brain Bank criteria for a di-agnosis of PD and were recruited from movement disorders clinics at two local National Health Service trusts. All con-trol subjects were recruited via spouses and friends and had to be free from movement disorder symptoms. Partic-ipants were excluded from the study if there were any contraindications to MR imaging, such as potential intraocular metallic foreign bodies, intracranial aneurysm clips, cardiac pacemakers, defibrillators, or cochlear implants. Of 112 participants enrolled, 76 participants were recruited into the neuromelanin substudy and underwent imaging with any of three prespecified neuromelanin-sensitive MR imaging protocols. Six par-ticipants had to be excluded because of severe movement artifacts. One patient was excluded because of change of diag-nosis at follow-up (Fig 1). The final study analysis included 39 patients and 30 con-trol subjects. Written informed consent was obtained from all participants before enrollment in the study after undergoing assessment of capacity by a neurol-ogy consultant (N.B.). Disease severity was recorded by using the UPDRS and Hoehn and Yahr clinical rating scales for PD (17). Patients were assessed and un-derwent imaging while medicated. Data from 17 of the 69 participants included in the current study have been reported
Figure 1
Figure 1: Participant inclusion flowchart. m. = movement.
4 radiology.rsna.org n Radiology: Volume 000: Number 0— 2016
NEURORADIOLOGY: In Vivo Assessment of Brainstem Depigmentation in Parkinson Disease Schwarz et al
for Functional MRI of the Brain, or FMRIB, linear imaging registration tool (http://fsl.fmrib.ox.ac.uk/fsl/fslwiki/FLIRT; Appendix E1 [online]).
Statistical tests (including ROC analyses, linear regression, and analysis of variance) were performed by using IBM-SPSS for windows (version 21.0; IBM, Armonk, NY) and Microsoft Ex-cel 2010 (Microsoft, Redmond, Wash). Group comparisons between patients and control subjects were performed by using univariate or multivariate analysis of variance with least-squares differences post hoc comparison or Stu-dent t tests. Nonparametric tests were used for group comparisons in case of nonnormal distribution of the data. Values are given as means 6 SDs or as medians with interquartile ranges and ranges, unless stated otherwise. Signif-icance was defined at P less than .05. ROC analyses and intraclass correlation coefficient analyses (the second mea-surement performed by Y.X., a blinded investigator) were performed by using SPSS software (for details, see Appen-dix E1 [online]). Partial correlation analysis was performed by using SPSS and Matlab software version 2015a (http://www.mathworks.com/products/matlab; S.T.S. and Y.X.).
Results
There was no difference in age or sex distribution of the patients with PD and the control subjects (patients with PD, 22 men [mean age, 66 years 6 7.6; age
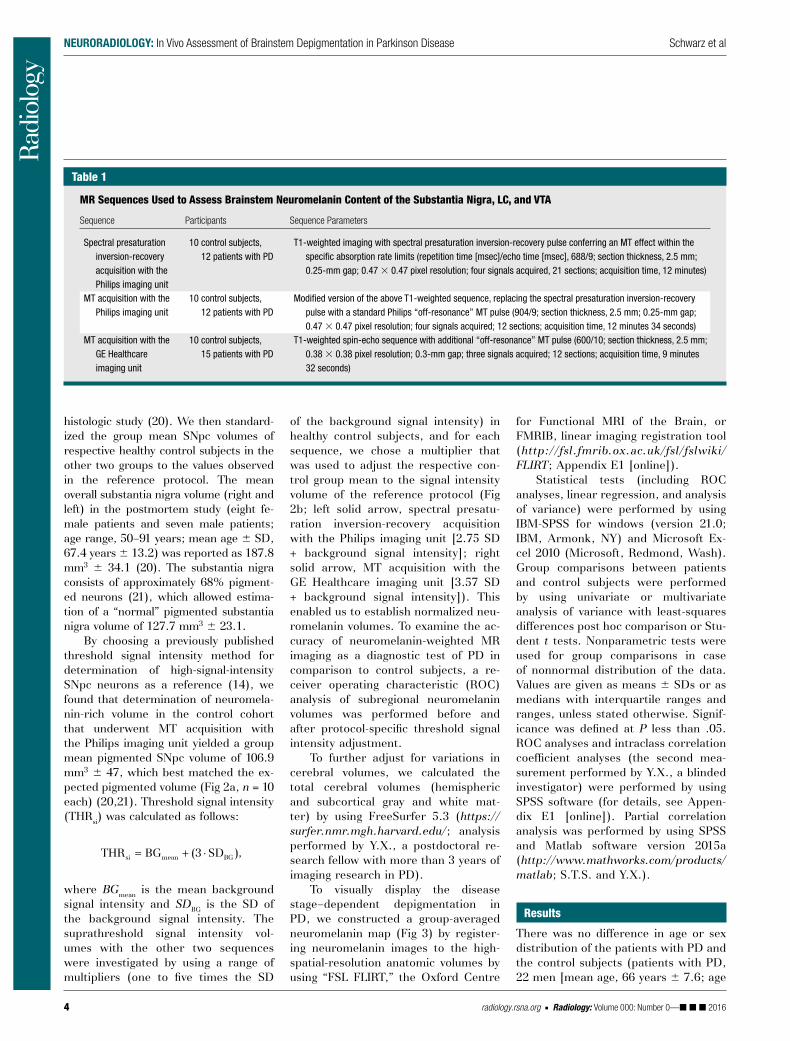
of the background signal intensity) in healthy control subjects, and for each sequence, we chose a multiplier that was used to adjust the respective con-trol group mean to the signal intensity volume of the reference protocol (Fig 2b; left solid arrow, spectral presatu-ration inversion-recovery acquisition with the Philips imaging unit [2.75 SD + background signal intensity]; right solid arrow, MT acquisition with the GE Healthcare imaging unit [3.57 SD + background signal intensity]). This enabled us to establish normalized neu-romelanin volumes. To examine the ac-curacy of neuromelanin-weighted MR imaging as a diagnostic test of PD in comparison to control subjects, a re-ceiver operating characteristic (ROC) analysis of subregional neuromelanin volumes was performed before and after protocol-specific threshold signal intensity adjustment.
To further adjust for variations in cerebral volumes, we calculated the total cerebral volumes (hemispheric and subcortical gray and white mat-ter) by using FreeSurfer 5.3 (https://surfer.nmr.mgh.harvard.edu/; analysis performed by Y.X., a postdoctoral re-search fellow with more than 3 years of imaging research in PD).
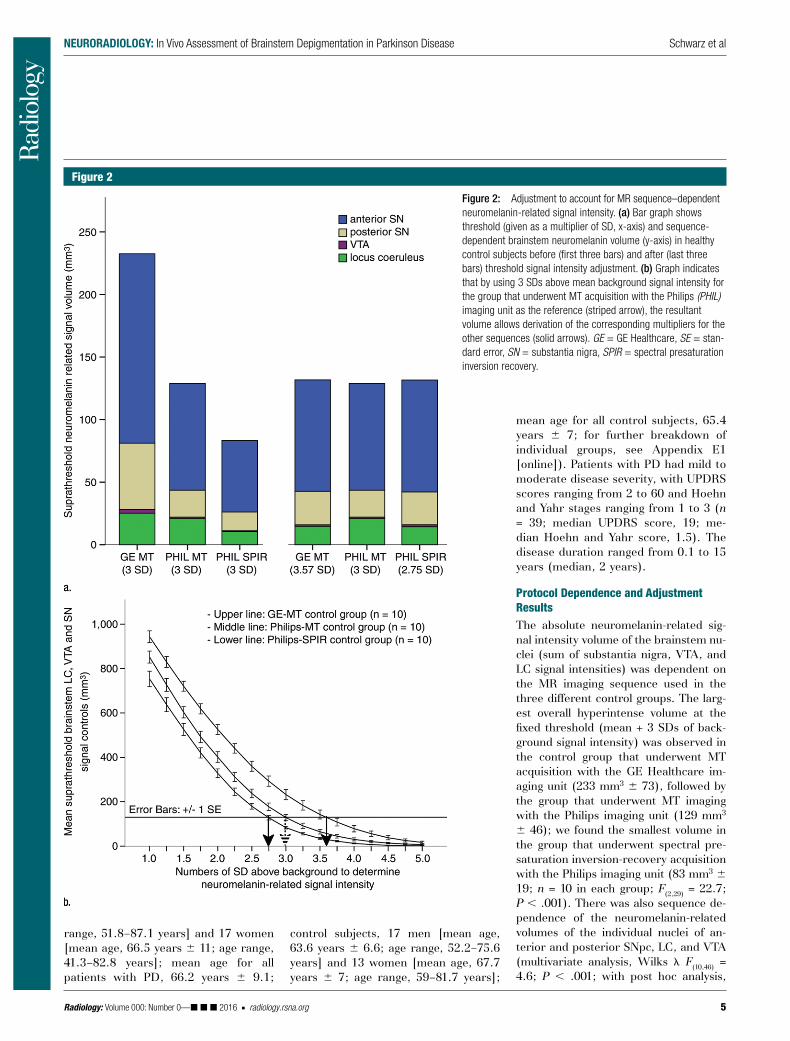
To visually display the disease stage–dependent depigmentation in PD, we constructed a group-averaged neuromelanin map (Fig 3) by register-ing neuromelanin images to the high-spatial-resolution anatomic volumes by using “FSL FLIRT,” the Oxford Centre
histologic study (20). We then standard-ized the group mean SNpc volumes of respective healthy control subjects in the other two groups to the values observed in the reference protocol. The mean overall substantia nigra volume (right and left) in the postmortem study (eight fe-male patients and seven male patients; age range, 50–91 years; mean age 6 SD, 67.4 years 6 13.2) was reported as 187.8 mm3 6 34.1 (20). The substantia nigra consists of approximately 68% pigment-ed neurons (21), which allowed estima-tion of a “normal” pigmented substantia nigra volume of 127.7 mm3 6 23.1.
By choosing a previously published threshold signal intensity method for determination of high-signal-intensity SNpc neurons as a reference (14), we found that determination of neuromela-nin-rich volume in the control cohort that underwent MT acquisition with the Philips imaging unit yielded a group mean pigmented SNpc volume of 106.9 mm3 6 47, which best matched the ex-pected pigmented volume (Fig 2a, n = 10 each) (20,21). Threshold signal intensity (THRsi) was calculated as follows:
= + ×si mean BGTHR BG (3 SD ),
where BGmean is the mean background signal intensity and SDBG is the SD of the background signal intensity. The suprathreshold signal intensity vol-umes with the other two sequences were investigated by using a range of multipliers (one to five times the SD
Table 1
MR Sequences Used to Assess Brainstem Neuromelanin Content of the Substantia Nigra, LC, and VTA
Sequence Participants Sequence Parameters
Spectral presaturation inversion-recovery acquisition with the Philips imaging unit
10 control subjects, 12 patients with PD
T1-weighted imaging with spectral presaturation inversion-recovery pulse conferring an MT effect within the specific absorption rate limits (repetition time [msec]/echo time [msec], 688/9; section thickness, 2.5 mm; 0.25-mm gap; 0.47 3 0.47 pixel resolution; four signals acquired, 21 sections; acquisition time, 12 minutes)
MT acquisition with the Philips imaging unit
10 control subjects, 12 patients with PD
Modified version of the above T1-weighted sequence, replacing the spectral presaturation inversion-recovery pulse with a standard Philips “off-resonance” MT pulse (904/9; section thickness, 2.5 mm; 0.25-mm gap; 0.47 3 0.47 pixel resolution; four signals acquired; 12 sections; acquisition time, 12 minutes 34 seconds)
MT acquisition with the GE Healthcare imaging unit
10 control subjects, 15 patients with PD
T1-weighted spin-echo sequence with additional “off-resonance” MT pulse (600/10; section thickness, 2.5 mm; 0.38 3 0.38 pixel resolution; 0.3-mm gap; three signals acquired; 12 sections; acquisition time, 9 minutes 32 seconds)
Radiology: Volume 000: Number 0— 2016 n radiology.rsna.org 5
NEURORADIOLOGY: In Vivo Assessment of Brainstem Depigmentation in Parkinson Disease Schwarz et al
range, 51.8–87.1 years] and 17 women [mean age, 66.5 years 6 11; age range, 41.3–82.8 years]; mean age for all patients with PD, 66.2 years 6 9.1;
Figure 2
Figure 2: Adjustment to account for MR sequence–dependent neuromelanin-related signal intensity. (a) Bar graph shows threshold (given as a multiplier of SD, x-axis) and sequence-dependent brainstem neuromelanin volume (y-axis) in healthy control subjects before (first three bars) and after (last three bars) threshold signal intensity adjustment. (b) Graph indicates that by using 3 SDs above mean background signal intensity for the group that underwent MT acquisition with the Philips (PHIL) imaging unit as the reference (striped arrow), the resultant volume allows derivation of the corresponding multipliers for the other sequences (solid arrows). GE = GE Healthcare, SE = stan-dard error, SN = substantia nigra, SPIR = spectral presaturation inversion recovery.
control subjects, 17 men [mean age, 63.6 years 6 6.6; age range, 52.2–75.6 years] and 13 women [mean age, 67.7 years 6 7; age range, 59–81.7 years];
mean age for all control subjects, 65.4 years 6 7; for further breakdown of individual groups, see Appendix E1 [online]). Patients with PD had mild to moderate disease severity, with UPDRS scores ranging from 2 to 60 and Hoehn and Yahr stages ranging from 1 to 3 (n = 39; median UPDRS score, 19; me-dian Hoehn and Yahr score, 1.5). The disease duration ranged from 0.1 to 15 years (median, 2 years).
Protocol Dependence and Adjustment ResultsThe absolute neuromelanin-related sig-nal intensity volume of the brainstem nu-clei (sum of substantia nigra, VTA, and LC signal intensities) was dependent on the MR imaging sequence used in the three different control groups. The larg-est overall hyperintense volume at the fixed threshold (mean + 3 SDs of back-ground signal intensity) was observed in the control group that underwent MT acquisition with the GE Healthcare im-aging unit (233 mm3 6 73), followed by the group that underwent MT imaging with the Philips imaging unit (129 mm3 6 46); we found the smallest volume in the group that underwent spectral pre-saturation inversion-recovery acquisition with the Philips imaging unit (83 mm3 6 19; n = 10 in each group; F(2,29) = 22.7; P , .001). There was also sequence de-pendence of the neuromelanin-related volumes of the individual nuclei of an-terior and posterior SNpc, LC, and VTA (multivariate analysis, Wilks l F(10,46) = 4.6; P , .001; with post hoc analysis,
6 radiology.rsna.org n Radiology: Volume 000: Number 0— 2016
NEURORADIOLOGY: In Vivo Assessment of Brainstem Depigmentation in Parkinson Disease Schwarz et al
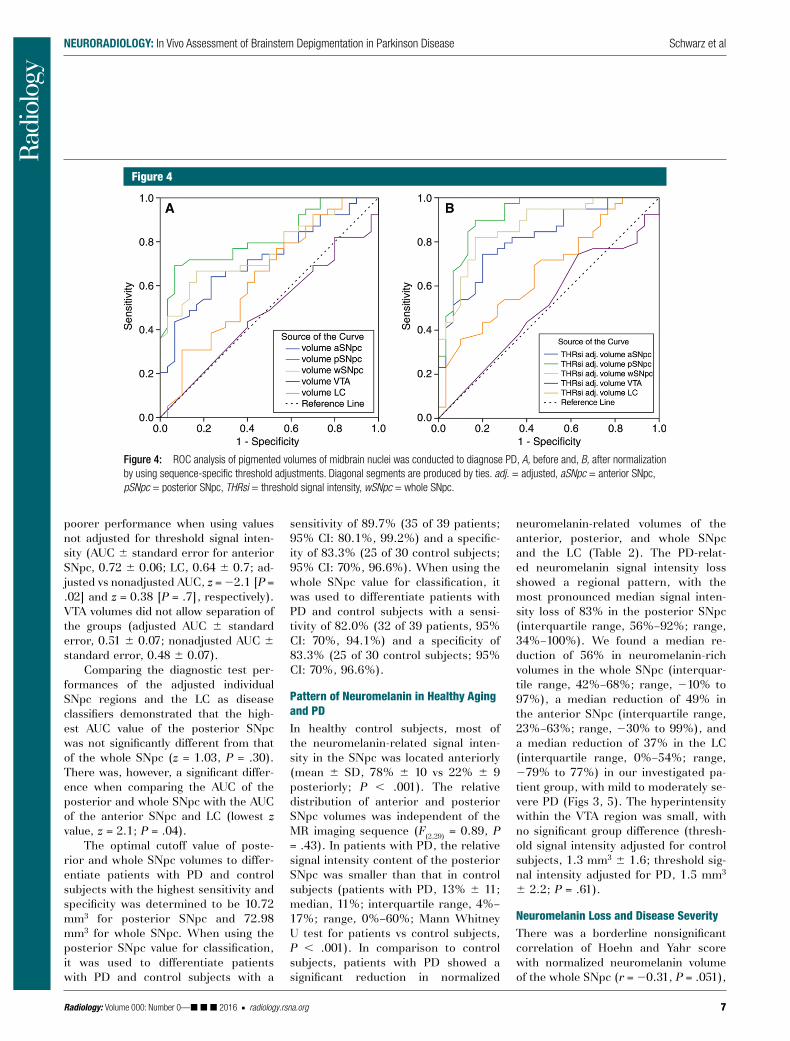
markers of PD (Fig 4). The area under the ROC curve (AUC) for the normal-ized (threshold-adjusted) posterior and whole SNpc neuromelanin-rich volumes demonstrated the best distinction be-tween patients with PD and control subjects (posterior SNpc, adjusted AUC 6 standard error of 0.92 6 0.03 [P , .001], nonadjusted AUC of 0.82 6 0.05 [P , .001], and z = 22.72 [P = .006] for adjusted AUC vs nonadjusted AUC [22]; whole SNpc, adjusted AUC of 0.88 6 0.04 [P , .001], nonadjusted AUC of 0.76 6 0.06 [P , .001], and z = 22.56 [P = .01] for adjusted AUC vs nonad-justed AUC). Measurements in the an-terior SNpc and the LC demonstrated good to moderate AUC values when values adjusted for threshold signal in-tensity were used (AUC 6 standard er-ror, 0.82 6 0.05 [P , .001] and 0.67 6 0.07 [P = .02], respectively) with
the LC region). There was no significant correlation of cerebral volumes with any of the brainstem nuclei neuromelanin volumes in the healthy control group (lowest P value, P = .48 in the LC re-gion) or the PD group (lowest P value, P = .30 in the whole SNpc region). The intraclass and interclass correlation co-efficients for intrarater and interrater concordance were very high, with cor-relation coefficients of 0.99 (95% con-fidence interval [CI]: 0.97, 0.99) and 0.94 (95% CI: 0.90, 0.97; all P , .001), respectively.
Diagnostic Performance of Normalized and Nonnormalized Regional Neuromelanin VolumeThe sequence-specific normalization procedure significantly improved the diagnostic test performance of using regional neuromelanin measures as
all subregions were significantly differ-ent; see Fig 2a). After threshold adjust-ment as described earlier, there was no significant difference in hyperintense volumes of the brainstem nuclei nor in the distribution of hyperintense volumes within the anterior and posterior SNpc, VTA, and LC (F(10,46) = 0.7; P = .41; with post hoc analysis, there was no signif-icant difference between subregions; lowest P value, P = .18 in the LC region; Fig 2a). By using normalized signal in-tensity volumes, we found a mild neg-ative correlation of the signal intensity volume of the anterior SNpc with age in all control subjects (r2 = 0.14; F1,29 = 4.5; P = .04) but not in the PD group (anterior SNpc, P = .94) or in the other brainstem regions (for control subjects the lowest P value was P = .08 in the posterior SNpc region; for patients with PD the lowest P value was P = .22 in
Figure 3
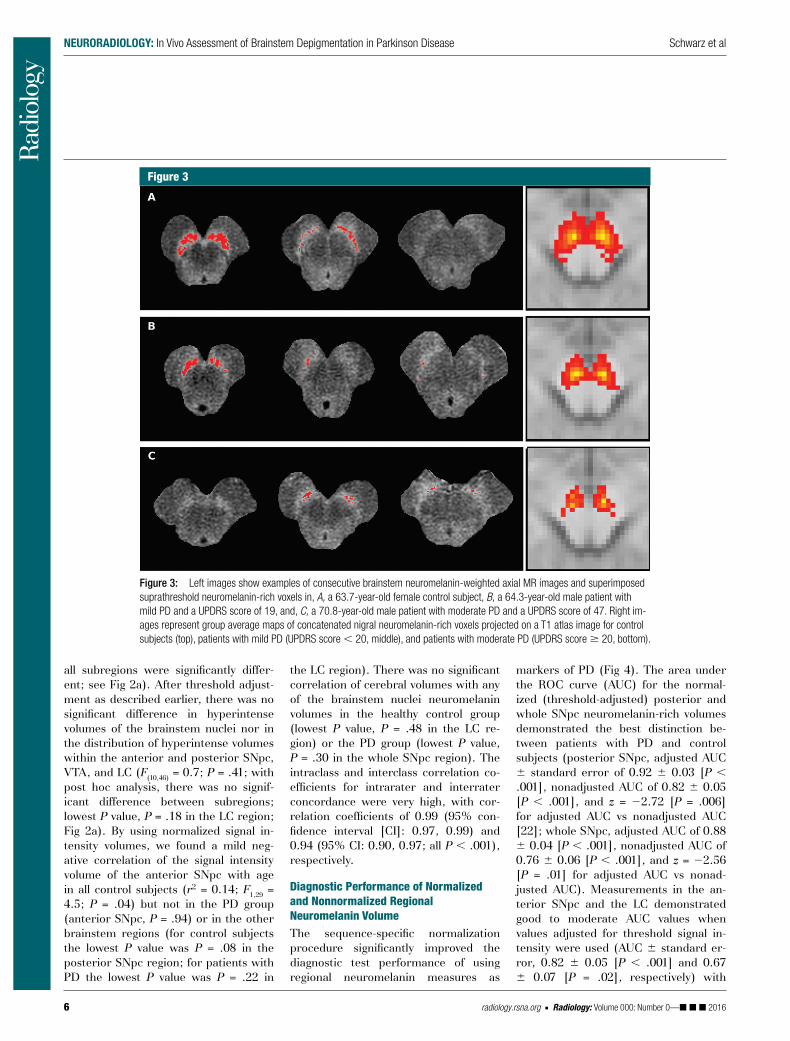
Figure 3: Left images show examples of consecutive brainstem neuromelanin-weighted axial MR images and superimposed suprathreshold neuromelanin-rich voxels in, A, a 63.7-year-old female control subject, B, a 64.3-year-old male patient with mild PD and a UPDRS score of 19, and, C, a 70.8-year-old male patient with moderate PD and a UPDRS score of 47. Right im-ages represent group average maps of concatenated nigral neuromelanin-rich voxels projected on a T1 atlas image for control subjects (top), patients with mild PD (UPDRS score , 20, middle), and patients with moderate PD (UPDRS score 20, bottom).
Radiology: Volume 000: Number 0— 2016 n radiology.rsna.org 7
NEURORADIOLOGY: In Vivo Assessment of Brainstem Depigmentation in Parkinson Disease Schwarz et al
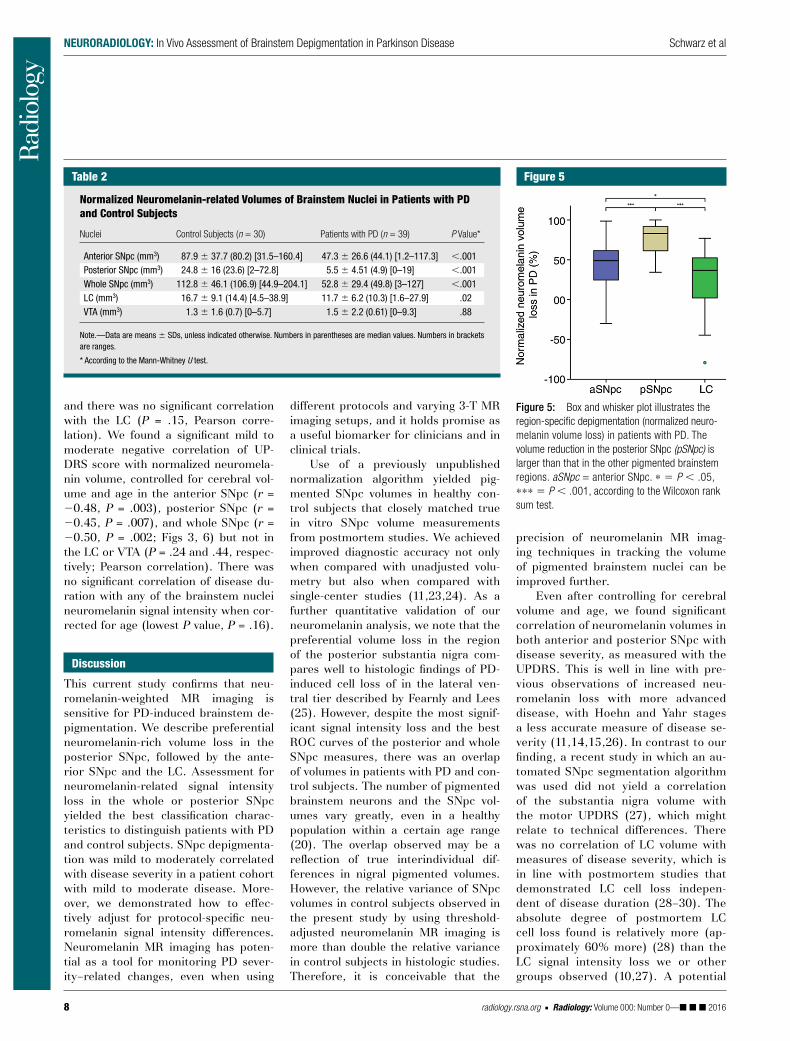
neuromelanin-related volumes of the anterior, posterior, and whole SNpc and the LC (Table 2). The PD-relat-ed neuromelanin signal intensity loss showed a regional pattern, with the most pronounced median signal inten-sity loss of 83% in the posterior SNpc (interquartile range, 56%–92%; range, 34%–100%). We found a median re-duction of 56% in neuromelanin-rich volumes in the whole SNpc (interquar-tile range, 42%–68%; range, 210% to 97%), a median reduction of 49% in the anterior SNpc (interquartile range, 23%–63%; range, 230% to 99%), and a median reduction of 37% in the LC (interquartile range, 0%–54%; range, 279% to 77%) in our investigated pa-tient group, with mild to moderately se-vere PD (Figs 3, 5). The hyperintensity within the VTA region was small, with no significant group difference (thresh-old signal intensity adjusted for control subjects, 1.3 mm3 6 1.6; threshold sig-nal intensity adjusted for PD, 1.5 mm3 6 2.2; P = .61).
Neuromelanin Loss and Disease SeverityThere was a borderline nonsignificant correlation of Hoehn and Yahr score with normalized neuromelanin volume of the whole SNpc (r = 20.31, P = .051),
sensitivity of 89.7% (35 of 39 patients; 95% CI: 80.1%, 99.2%) and a specific-ity of 83.3% (25 of 30 control subjects; 95% CI: 70%, 96.6%). When using the whole SNpc value for classification, it was used to differentiate patients with PD and control subjects with a sensi-tivity of 82.0% (32 of 39 patients, 95% CI: 70%, 94.1%) and a specificity of 83.3% (25 of 30 control subjects; 95% CI: 70%, 96.6%).
Pattern of Neuromelanin in Healthy Aging and PDIn healthy control subjects, most of the neuromelanin-related signal inten-sity in the SNpc was located anteriorly (mean 6 SD, 78% 6 10 vs 22% 6 9 posteriorly; P , .001). The relative distribution of anterior and posterior SNpc volumes was independent of the MR imaging sequence (F(2,29) = 0.89, P = .43). In patients with PD, the relative signal intensity content of the posterior SNpc was smaller than that in control subjects (patients with PD, 13% 6 11; median, 11%; interquartile range, 4%–17%; range, 0%–60%; Mann Whitney U test for patients vs control subjects, P , .001). In comparison to control subjects, patients with PD showed a significant reduction in normalized
poorer performance when using values not adjusted for threshold signal inten-sity (AUC 6 standard error for anterior SNpc, 0.72 6 0.06; LC, 0.64 6 0.7; ad-justed vs nonadjusted AUC, z = 22.1 [P = .02] and z = 0.38 [P = .7], respectively). VTA volumes did not allow separation of the groups (adjusted AUC 6 standard error, 0.51 6 0.07; nonadjusted AUC 6 standard error, 0.48 6 0.07).
Comparing the diagnostic test per-formances of the adjusted individual SNpc regions and the LC as disease classifiers demonstrated that the high-est AUC value of the posterior SNpc was not significantly different from that of the whole SNpc (z = 1.03, P = .30). There was, however, a significant differ-ence when comparing the AUC of the posterior and whole SNpc with the AUC of the anterior SNpc and LC (lowest z value, z = 2.1; P = .04).
The optimal cutoff value of poste-rior and whole SNpc volumes to differ-entiate patients with PD and control subjects with the highest sensitivity and specificity was determined to be 10.72 mm3 for posterior SNpc and 72.98 mm3 for whole SNpc. When using the posterior SNpc value for classification, it was used to differentiate patients with PD and control subjects with a
Figure 4
Figure 4: ROC analysis of pigmented volumes of midbrain nuclei was conducted to diagnose PD, A, before and, B, after normalization by using sequence-specific threshold adjustments. Diagonal segments are produced by ties. adj. = adjusted, aSNpc = anterior SNpc, pSNpc = posterior SNpc, THRsi = threshold signal intensity, wSNpc = whole SNpc.
8 radiology.rsna.org n Radiology: Volume 000: Number 0— 2016
NEURORADIOLOGY: In Vivo Assessment of Brainstem Depigmentation in Parkinson Disease Schwarz et al
precision of neuromelanin MR imag-ing techniques in tracking the volume of pigmented brainstem nuclei can be improved further.
Even after controlling for cerebral volume and age, we found significant correlation of neuromelanin volumes in both anterior and posterior SNpc with disease severity, as measured with the UPDRS. This is well in line with pre-vious observations of increased neu-romelanin loss with more advanced disease, with Hoehn and Yahr stages a less accurate measure of disease se-verity (11,14,15,26). In contrast to our finding, a recent study in which an au-tomated SNpc segmentation algorithm was used did not yield a correlation of the substantia nigra volume with the motor UPDRS (27), which might relate to technical differences. There was no correlation of LC volume with measures of disease severity, which is in line with postmortem studies that demonstrated LC cell loss indepen-dent of disease duration (28–30). The absolute degree of postmortem LC cell loss found is relatively more (ap-proximately 60% more) (28) than the LC signal intensity loss we or other groups observed (10,27). A potential
different protocols and varying 3-T MR imaging setups, and it holds promise as a useful biomarker for clinicians and in clinical trials.
Use of a previously unpublished normalization algorithm yielded pig-mented SNpc volumes in healthy con-trol subjects that closely matched true in vitro SNpc volume measurements from postmortem studies. We achieved improved diagnostic accuracy not only when compared with unadjusted volu-metry but also when compared with single-center studies (11,23,24). As a further quantitative validation of our neuromelanin analysis, we note that the preferential volume loss in the region of the posterior substantia nigra com-pares well to histologic findings of PD-induced cell loss of in the lateral ven-tral tier described by Fearnly and Lees (25). However, despite the most signif-icant signal intensity loss and the best ROC curves of the posterior and whole SNpc measures, there was an overlap of volumes in patients with PD and con-trol subjects. The number of pigmented brainstem neurons and the SNpc vol-umes vary greatly, even in a healthy population within a certain age range (20). The overlap observed may be a reflection of true interindividual dif-ferences in nigral pigmented volumes. However, the relative variance of SNpc volumes in control subjects observed in the present study by using threshold-adjusted neuromelanin MR imaging is more than double the relative variance in control subjects in histologic studies. Therefore, it is conceivable that the
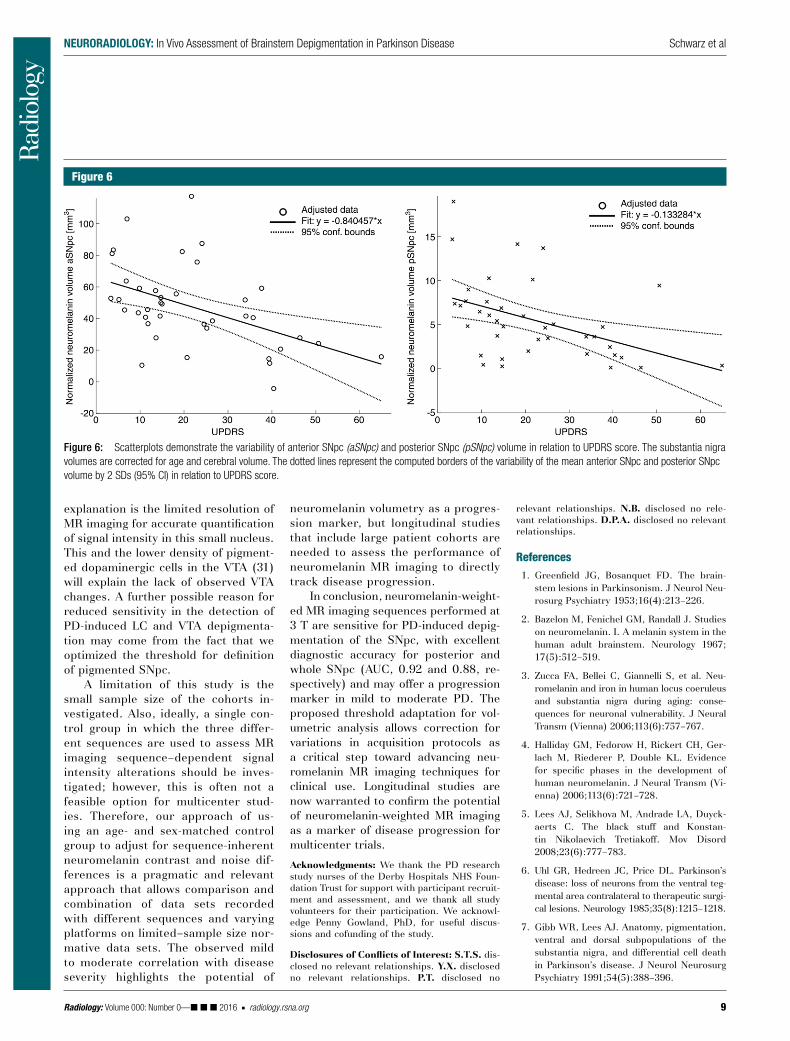
and there was no significant correlation with the LC (P = .15, Pearson corre-lation). We found a significant mild to moderate negative correlation of UP-DRS score with normalized neuromela-nin volume, controlled for cerebral vol-ume and age in the anterior SNpc (r = 20.48, P = .003), posterior SNpc (r = 20.45, P = .007), and whole SNpc (r = 20.50, P = .002; Figs 3, 6) but not in the LC or VTA (P = .24 and .44, respec-tively; Pearson correlation). There was no significant correlation of disease du-ration with any of the brainstem nuclei neuromelanin signal intensity when cor-rected for age (lowest P value, P = .16).
Discussion
This current study confirms that neu-romelanin-weighted MR imaging is sensitive for PD-induced brainstem de-pigmentation. We describe preferential neuromelanin-rich volume loss in the posterior SNpc, followed by the ante-rior SNpc and the LC. Assessment for neuromelanin-related signal intensity loss in the whole or posterior SNpc yielded the best classification charac-teristics to distinguish patients with PD and control subjects. SNpc depigmenta-tion was mild to moderately correlated with disease severity in a patient cohort with mild to moderate disease. More-over, we demonstrated how to effec-tively adjust for protocol-specific neu-romelanin signal intensity differences. Neuromelanin MR imaging has poten-tial as a tool for monitoring PD sever-ity–related changes, even when using
Figure 5
Figure 5: Box and whisker plot illustrates the region-specific depigmentation (normalized neuro-melanin volume loss) in patients with PD. The volume reduction in the posterior SNpc (pSNpc) is larger than that in the other pigmented brainstem regions. aSNpc = anterior SNpc. ∗ 5 P , .05, ∗∗∗ 5 P , .001, according to the Wilcoxon rank sum test.
Table 2
Normalized Neuromelanin-related Volumes of Brainstem Nuclei in Patients with PD and Control Subjects
Nuclei Control Subjects (n = 30) Patients with PD (n = 39) P Value*
Anterior SNpc (mm3) 87.9 6 37.7 (80.2) [31.5–160.4] 47.3 6 26.6 (44.1) [1.2–117.3] ,.001Posterior SNpc (mm3) 24.8 6 16 (23.6) [2–72.8] 5.5 6 4.51 (4.9) [0–19] ,.001Whole SNpc (mm3) 112.8 6 46.1 (106.9) [44.9–204.1] 52.8 6 29.4 (49.8) [3–127] ,.001LC (mm3) 16.7 6 9.1 (14.4) [4.5–38.9] 11.7 6 6.2 (10.3) [1.6–27.9] .02VTA (mm3) 1.3 6 1.6 (0.7) [0–5.7] 1.5 6 2.2 (0.61) [0–9.3] .88
Note.—Data are means 6 SDs, unless indicated otherwise. Numbers in parentheses are median values. Numbers in brackets are ranges.
* According to the Mann-Whitney U test.
Radiology: Volume 000: Number 0— 2016 n radiology.rsna.org 9
NEURORADIOLOGY: In Vivo Assessment of Brainstem Depigmentation in Parkinson Disease Schwarz et al
relevant relationships. N.B. disclosed no rele-vant relationships. D.P.A. disclosed no relevant relationships.
References 1. Greenfield JG, Bosanquet FD. The brain-
stem lesions in Parkinsonism. J Neurol Neu-rosurg Psychiatry 1953;16(4):213–226.
2. Bazelon M, Fenichel GM, Randall J. Studies on neuromelanin. I. A melanin system in the human adult brainstem. Neurology 1967; 17(5):512–519.
3. Zucca FA, Bellei C, Giannelli S, et al. Neu-romelanin and iron in human locus coeruleus and substantia nigra during aging: conse-quences for neuronal vulnerability. J Neural Transm (Vienna) 2006;113(6):757–767.
4. Halliday GM, Fedorow H, Rickert CH, Ger-lach M, Riederer P, Double KL. Evidence for specific phases in the development of human neuromelanin. J Neural Transm (Vi-enna) 2006;113(6):721–728.
5. Lees AJ, Selikhova M, Andrade LA, Duyck-aerts C. The black stuff and Konstan-tin Nikolaevich Tretiakoff. Mov Disord 2008;23(6):777–783.
6. Uhl GR, Hedreen JC, Price DL. Parkinson’s disease: loss of neurons from the ventral teg-mental area contralateral to therapeutic surgi-cal lesions. Neurology 1985;35(8):1215–1218.
7. Gibb WR, Lees AJ. Anatomy, pigmentation, ventral and dorsal subpopulations of the substantia nigra, and differential cell death in Parkinson’s disease. J Neurol Neurosurg Psychiatry 1991;54(5):388–396.
neuromelanin volumetry as a progres-sion marker, but longitudinal studies that include large patient cohorts are needed to assess the performance of neuromelanin MR imaging to directly track disease progression.
In conclusion, neuromelanin-weight-ed MR imaging sequences performed at 3 T are sensitive for PD-induced depig-mentation of the SNpc, with excellent diagnostic accuracy for posterior and whole SNpc (AUC, 0.92 and 0.88, re-spectively) and may offer a progression marker in mild to moderate PD. The proposed threshold adaptation for vol-umetric analysis allows correction for variations in acquisition protocols as a critical step toward advancing neu-romelanin MR imaging techniques for clinical use. Longitudinal studies are now warranted to confirm the potential of neuromelanin-weighted MR imaging as a marker of disease progression for multicenter trials.
Acknowledgments: We thank the PD research study nurses of the Derby Hospitals NHS Foun-dation Trust for support with participant recruit-ment and assessment, and we thank all study volunteers for their participation. We acknowl-edge Penny Gowland, PhD, for useful discus-sions and cofunding of the study.
Disclosures of Conflicts of Interest: S.T.S. dis-closed no relevant relationships. Y.X. disclosed no relevant relationships. P.T. disclosed no
explanation is the limited resolution of MR imaging for accurate quantification of signal intensity in this small nucleus. This and the lower density of pigment-ed dopaminergic cells in the VTA (31) will explain the lack of observed VTA changes. A further possible reason for reduced sensitivity in the detection of PD-induced LC and VTA depigmenta-tion may come from the fact that we optimized the threshold for definition of pigmented SNpc.
A limitation of this study is the small sample size of the cohorts in-vestigated. Also, ideally, a single con-trol group in which the three differ-ent sequences are used to assess MR imaging sequence–dependent signal intensity alterations should be inves-tigated; however, this is often not a feasible option for multicenter stud-ies. Therefore, our approach of us-ing an age- and sex-matched control group to adjust for sequence-inherent neuromelanin contrast and noise dif-ferences is a pragmatic and relevant approach that allows comparison and combination of data sets recorded with different sequences and varying platforms on limited–sample size nor-mative data sets. The observed mild to moderate correlation with disease severity highlights the potential of
Figure 6
Figure 6: Scatterplots demonstrate the variability of anterior SNpc (aSNpc) and posterior SNpc (pSNpc) volume in relation to UPDRS score. The substantia nigra volumes are corrected for age and cerebral volume. The dotted lines represent the computed borders of the variability of the mean anterior SNpc and posterior SNpc volume by 2 SDs (95% CI) in relation to UPDRS score.
10 radiology.rsna.org n Radiology: Volume 000: Number 0— 2016
NEURORADIOLOGY: In Vivo Assessment of Brainstem Depigmentation in Parkinson Disease Schwarz et al
8. Ma SY, Röyttä M, Rinne JO, Collan Y, Rinne UK. Correlation between neuromor-phometry in the substantia nigra and clin-ical features in Parkinson’s disease using disector counts. J Neurol Sci 1997;151(1): 83–87.
9. Kordower JH, Olanow CW, Dodiya HB, et al. Disease duration and the integrity of the nigrostriatal system in Parkinson’s disease. Brain 2013;136(Pt 8):2419–2431.
10. Sasaki M, Shibata E, Tohyama K, et al. Neu-romelanin magnetic resonance imaging of locus ceruleus and substantia nigra in Par-kinson’s disease. Neuroreport 2006;17(11): 1215–1218.
11. Ohtsuka C, Sasaki M, Konno K, et al. Changes in substantia nigra and locus coeruleus in patients with early-stage Par-kinson’s disease using neuromelanin-sensi-tive MR imaging. Neurosci Lett 2013;541: 93–98.
12. Kitao S, Matsusue E, Fujii S, et al. Correlation between pathology and neuromelanin MR imaging in Parkinson’s disease and dementia with Lewy bodies. Neuroradiology 2013; 55(8):947–953.
13. Bolding MS, Reid MA, Avsar KB, et al. Mag-netic transfer contrast accurately localizes substantia nigra confirmed by histology. Biol Psychiatry 2013;73(3):289–294.
14. Schwarz ST, Rittman T, Gontu V, Morgan PS, Bajaj N, Auer DP. T1-weighted MRI shows stage-dependent substantia nigra sig-nal loss in Parkinson’s disease. Mov Disord 2011;26(9):1633–1638.
15. Kashihara K, Shinya T, Higaki F. Neuromela-nin magnetic resonance imaging of nigral volume loss in patients with Parkinson’s disease. J Clin Neurosci 2011;18(8):1093–1096.
16. Matsuura K, Maeda M, Yata K, et al. Neu-romelanin magnetic resonance imaging in Parkinson’s disease and multiple system at-rophy. Eur Neurol 2013;70(1-2):70–77.
17. Fahn S, Jenner P, Marsden CD, et al. The Unified Parkinson’s Disease Rating Scale. In: Fahn S, Marsden CD, Calne DB, et al, eds. Recent developments in Parkinson’s disease. Florham Park, NJ: Macmillan Healthcare In-formation, 1987.
18. Chen X, Huddleston DE, Langley J, et al. Simultaneous imaging of locus coeruleus and substantia nigra with a quantitative neuromelanin MRI approach. Magn Reson Imaging 2014;32(10):1301–1306.
19. Murty VP, Shermohammed M, Smith DV, Carter RM, Huettel SA, Adcock RA. Resting state networks distinguish human ventral tegmental area from substantia nigra. Neu-roimage 2014;100:580–589.
20. Di Lorenzo Alho AT, Suemoto CK, Polichiso L, et al. Three-dimensional and stereologi-cal characterization of the human substantia nigra during aging. Brain Struct Funct 2016; 221(7):3393–3403.
21. Pakkenberg B, Møller A, Gundersen HJ, Mouritzen Dam A, Pakkenberg H. The ab-solute number of nerve cells in substantia nigra in normal subjects and in patients with Parkinson’s disease estimated with an unbi-ased stereological method. J Neurol Neuro-surg Psychiatry 1991;54(1):30–33.
22. Hanley JA, McNeil BJ. A method of com-paring the areas under receiver operating characteristic curves derived from the same cases. Radiology 1983;148(3):839–843.
23. Ogisu K, Kudo K, Sasaki M, et al. 3D neuromelanin-sensitive magnetic resonance imaging with semi-automated volume mea-
surement of the substantia nigra pars com-pacta for diagnosis of Parkinson’s disease. Neuroradiology 2013;55(6):719–724.
24. Reimão S, Pita Lobo P, Neutel D, et al. Sub-stantia nigra neuromelanin magnetic reso-nance imaging in de novo Parkinson’s disease patients. Eur J Neurol 2015;22(3):540–546.
25. Fearnley JM, Lees AJ. Ageing and Parkin-son’s disease: substantia nigra regional se-lectivity. Brain 1991;114(Pt 5):2283–2301.
26. Miyoshi F, Ogawa T, Kitao SI, et al. Eval-uation of Parkinson disease and Alzheimer disease with the use of neuromelanin MR im-aging and (123)I-metaiodobenzylguanidine scintigraphy. AJNR Am J Neuroradiol 2013; 34(11):2113–2118.
27. Castellanos G, Fernández-Seara MA, Loren-zo-Betancor O, et al. Automated neuromela-nin imaging as a diagnostic biomarker for Parkinson’s disease. Mov Disord 2015;30(7): 945–952.
28. German DC, Manaye KF, White CL 3rd, et al. Disease-specific patterns of locus coe-ruleus cell loss. Ann Neurol 1992;32(5): 667–676.
29. Hirsch E, Graybiel AM, Agid YA. Melanized dopaminergic neurons are differentially susceptible to degeneration in Parkinson’s disease. Nature 1988;334(6180):345–348.
30. Zarow C, Lyness SA, Mortimer JA, Chui HC. Neuronal loss is greater in the locus coeruleus than nucleus basalis and substan-tia nigra in Alzheimer and Parkinson dis-eases. Arch Neurol 2003;60(3):337–341.
31. Margolis EB, Lock H, Hjelmstad GO, Fields HL. The ventral tegmental area revisited: is there an electrophysiological marker for dopa-minergic neurons? J Physiol 2006;577(Pt 3): 907–924.