Embed Size (px)
Citation preview
Strategic Management JournalStrat. Mgmt. J., 26: 887–911 (2005)
Published online in Wiley InterScience (www.interscience.wiley.com). DOI: 10.1002/smj.492
SCHUMPETER’S GHOST: IS HYPERCOMPETITIONMAKING THE BEST OF TIMES SHORTER?
ROBERT R. WIGGINS1* and TIMOTHY W. RUEFLI2
1 Fogelman College of Business and Economics, University of Memphis, Memphis,Tennessee, U.S.A.2 McCombs School of Business and IC2 Institute, University of Texas at Austin, Austin,Texas, U.S.A.
At the center of Schumpeter’s theory of competitive behavior is the assertion that competitiveadvantage will become increasingly more difficult to sustain in a wide range of industries. Morerecently, this assertion has resurfaced in the notion of hypercompetition. This research examinestwo large longitudinal samples of firms to discover which industries, if any, exhibit performancethat is consonant with Schumpeterian theory and the assertions of hypercompetition. We findsupport for the argument that over time competitive advantage has become significantly harderto sustain and, further, that the phenomenon is limited neither to high-technology industriesnor to manufacturing industries but is seen across a broad range of industries. We also findevidence that sustained competitive advantage is increasingly a matter not of a single advantagemaintained over time but more a matter of concatenating over time a sequence of advantages.Copyright 2005 John Wiley & Sons, Ltd.
INTRODUCTION
While Schumpeter’s (1942: 84) notion of a ‘gale ofcreative destruction’ has garnered the most atten-tion in the research and practitioner literatures, itis the role profit plays in motivating innovation asa precursor to creative destruction that is the keyto his theories. Schumpeter (1939: 105) said thatprofit is ‘the premium put upon successful inno-vation in capitalist society and is temporary bynature: it will vanish in the subsequent processof competition and adaptation.’ Drucker (1983)observed:
Schumpeter’s Economic Development does whatneither the classical economists nor Marx norKeynes was able to do: It makes profit fulfill an
Keywords: Schumpeter; hypercompetition; performance;persistence; sustainability*Correspondence to: Robert R. Wiggins, Fogelman College ofBusiness and Economics, University of Memphis, Memphis, TN38152, U.S.A. E-mail: [email protected]
economic function. In the economy of change andinnovation, profit, in contrast to Marx and his the-ory, is not a Mehrwert, a ‘surplus value’ stolenfrom the workers. On the contrary, it is the onlysource of jobs for workers and of labor income. Thetheory of economic development shows that no oneexcept the innovator makes a genuine ‘profit’; andthe innovator’s profit is always quite short-lived.But innovation in Schumpeter’s famous phrase isalso ‘creative destruction.’ It makes obsolete yes-terday’s capital equipment and capital investment.The more an economy progresses, the more cap-ital formation will it therefore need. Thus whatthe classical economists—or the accountant or thestock exchange—considers ‘profit’ is a genuinecost, the cost of staying in business, the cost ofa future in which nothing is predictable except thattoday’s profitable business will become tomorrow’swhite elephant.
Schumpeter’s gale of creative destruction wouldcreate a disequilibrium in which ‘practically everyenterprise [is] threatened and put on the defensiveas soon as it comes into existence (Schumpeter,1939: 107).’ For decades Schumpeter’s theory was
Copyright 2005 John Wiley & Sons, Ltd. Received 16 May 2003Final revision received 12 May 2005
888 R. R. Wiggins and T. W. Ruefli
occasionally mentioned but did not figure promi-nently in many analyses of business behavior.
Over the past decade, however, there has beenincreasing attention given to Schumpeterian the-ory and to hypercompetition in the academic lit-erature. Primary, of course, is D’Aveni’s seminalbook (1994), where he defines hypercompetitionas ‘an environment characterized by intense andrapid competitive moves, in which competitorsmust move quickly to build advantage and erodethe advantage of their rivals’ (D’Aveni, 1994:217–218), as well as Christensen’s (1997) book onthe problems of industry-leading companies facingcompetition from upstarts. Beyond that there havebeen two special issues of Organization Science(July and August 1996) devoted to hypercompeti-tion, an edited book (Ilinitch, Lewin, and D’Aveni,1998) that overlaps with the special issues, andsome articles in academic journals. Few of theseresearch studies have been empirically based, butthose that were will be reviewed below. In par-ticular, the current research and its findings willbe compared to McNamara, Vaaler, and Devers(2003) since it is the most comprehensive and com-parable study to date.
The purpose of our study is to add substan-tially to the base of empirical evidence concerningSchumpeter’s theory in terms of the nature andmagnitude of the claimed shift in the US economy.Given Schumpeter’s emphasis on the role of prof-its, the underlying subject of our study will be arecognized hallmark of traditional firm and indus-try behavior: sustained competitive advantage. Thereason for this is as D’Aveni (1994: 7) has noted:‘The pursuit of sustainable advantage has longbeen the focus of strategy.’ The key predictionsof Schumpeterian theory for strategy researchersare: (1) that firms are increasingly less able to sus-tain a strategic advantage over their competition;(2) that such behavior is characteristic of a widerange of industries; and (3) that sustained compet-itive advantage has become less a matter of findingand sustaining a single competitive advantage andmore a case of finding a series of competitiveadvantages over time and concatenating them intoa sustained competitive advantage. Thus all of thethree key Schumpeterian outcomes cited relate tosustained competitive advantage.
Our approach will be to develop a theoreticalframework and hypotheses that relate Schumpete-rian theory to sustained competitive advantage. Wethen examine not only 6,772 firms in 40 industries
over a 25-year period but also all 13,899 businessunits in 8,806 firms over a 17-year period (a super-set of the sample employed by the most recent andcomparable study of hypercompetition; McNamaraet al., 2003) and identify in a rigorous way thosefirms and business units that have been able tomaintain, for a sustained period of time, a com-petitive advantage in a fashion that yielded supe-rior economic performance. We will examine theseperiods of superior performance to determine if, inconsonance with hypercompetition, those periodshave become significantly shorter over time—and,if so, for which groups of industries. Then we willexamine these same firms for evidence that sus-tained competitive advantage is increasingly notsingular, but is instead composed more and moreoften of multiple short advantages over time.
THEORETICAL FRAMEWORKAND ANTECEDENT LITERATURE
Historically, traditional theories of strategic man-agement eschewed the Schumpeterian theory ofdisequilibrium as a base framework and choseinstead the equilibrium-oriented approach of indus-trial organization. In so doing they placed empha-sis on what Schumpeter (1947: 153) called the‘adaptive response’ of managers and on creat-ing a sustained competitive advantage for a firm.Thus for decades sustained competitive advan-tage has been a dominant concept in strategicmanagement research. Emerging from the struc-ture–conduct–performance paradigm of industrialorganization economics (Bain, 1959; Mason, 1939,1949) and popularized by the Harvard BusinessSchool and the work of Michael Porter (1985), sus-tained competitive advantage is the most influentialmechanism for explaining the persistence of supe-rior economic performance.1 The increasingly pop-ular resource-based view of the firm extends theinfluence of sustained competitive advantage andits result, above-normal returns, by making achiev-ing sustained competitive advantage the very rea-son for firms’ existence (Conner, 1991: 132).
1 Coff (1999) {, 1999 #718} points out that there may be casesin which firms have a competitive advantage in the marketfor outputs, but not for inputs—and thus may not realizesuperior economic performance. We shall explicitly assume thatcompetitive advantage obtains overall for a firm.
Copyright 2005 John Wiley & Sons, Ltd. Strat. Mgmt. J., 26: 887–911 (2005)
Schumpeter’s Ghost 889
A firm’s ability to maintain superior economicperformance has a long and varied history in eco-nomic and strategic management research. Neo-classical economics argues that persistent superioreconomic performance is an anomaly, a tempo-rary condition that will vanish when equilibriumis reached (Debreu, 1959). Industrial organizationeconomics argues that any persistence is the resultof industry structure, with mechanisms such asentry barriers preventing the equilibrium of neo-classical economics from being achieved (Bain,1959). Evolutionary economics (Nelson and Win-ter, 1982) as well as the related Austrian schoolof economics (Jacobson, 1992; Schumpeter, 1939)both argued that persistent superior economic per-formance is the result of cycles of entrepreneurialinnovation and imitation that create a continuingdisequilibrium where some firms can achieve per-sistence of performance although it will be even-tually eroded. Organizational and strategic man-agement theories have incorporated most of theseideas and added the concept of sustained competi-tive advantage (Porter, 1985) that can lead directlyto persistent superior economic performance.
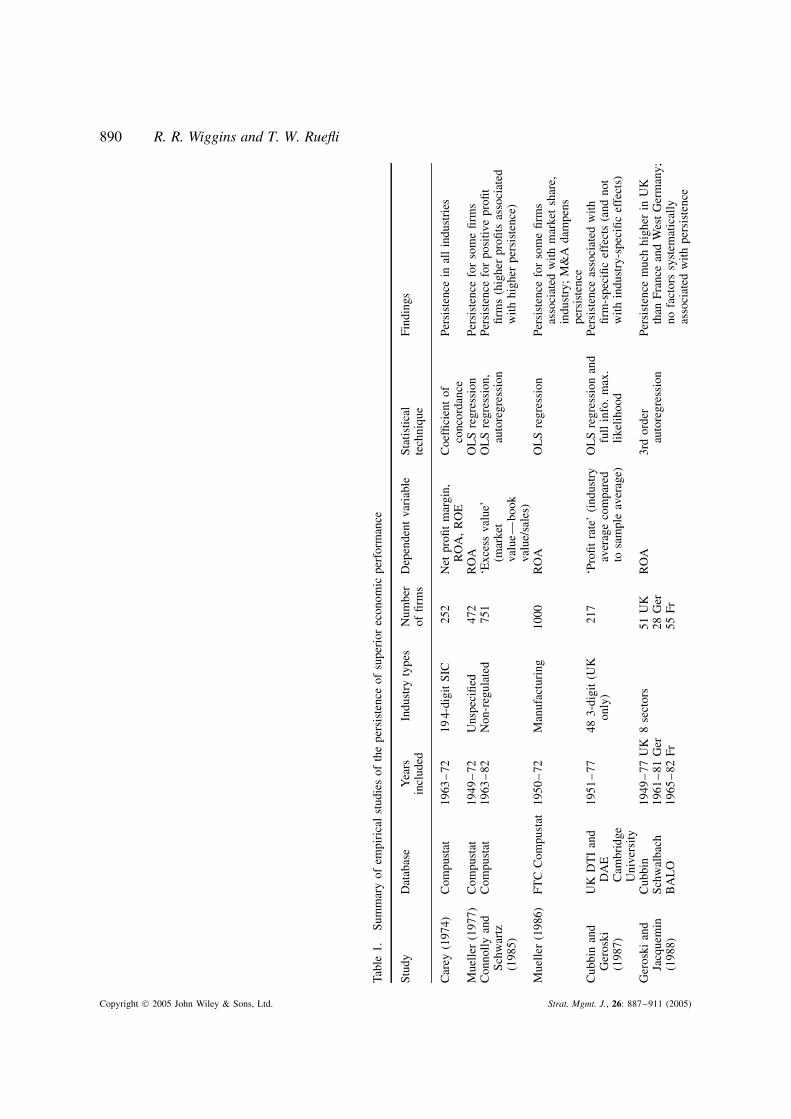
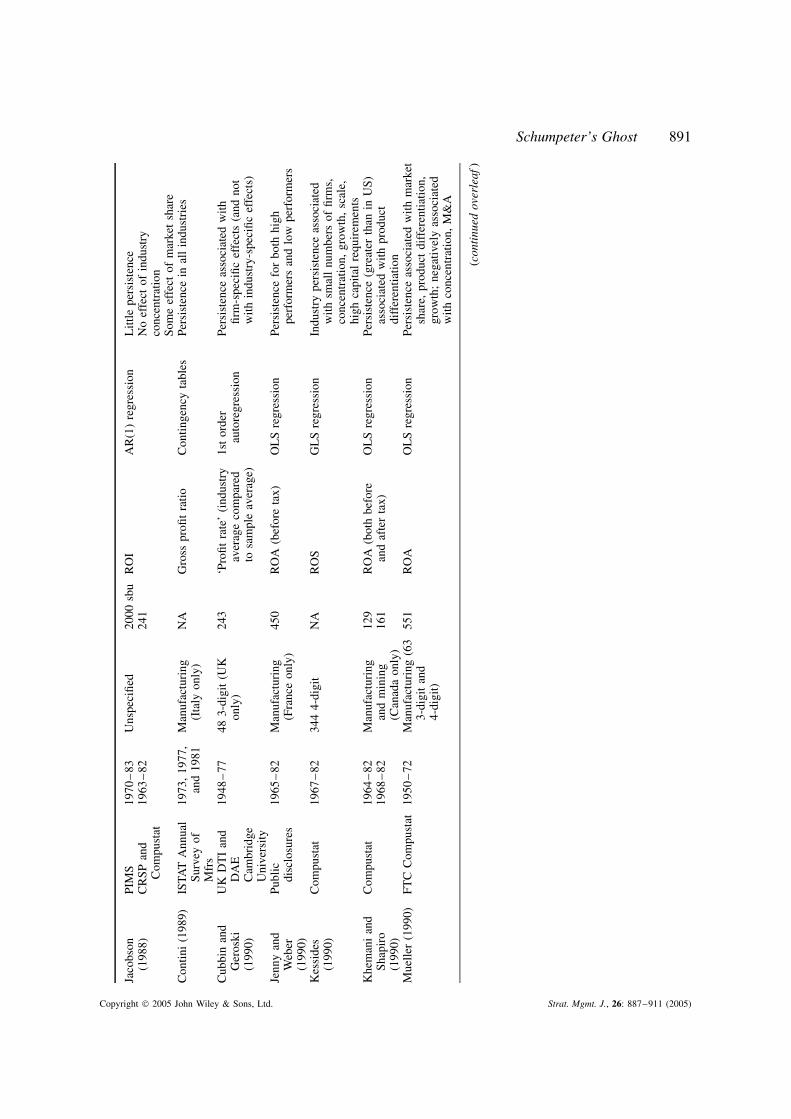
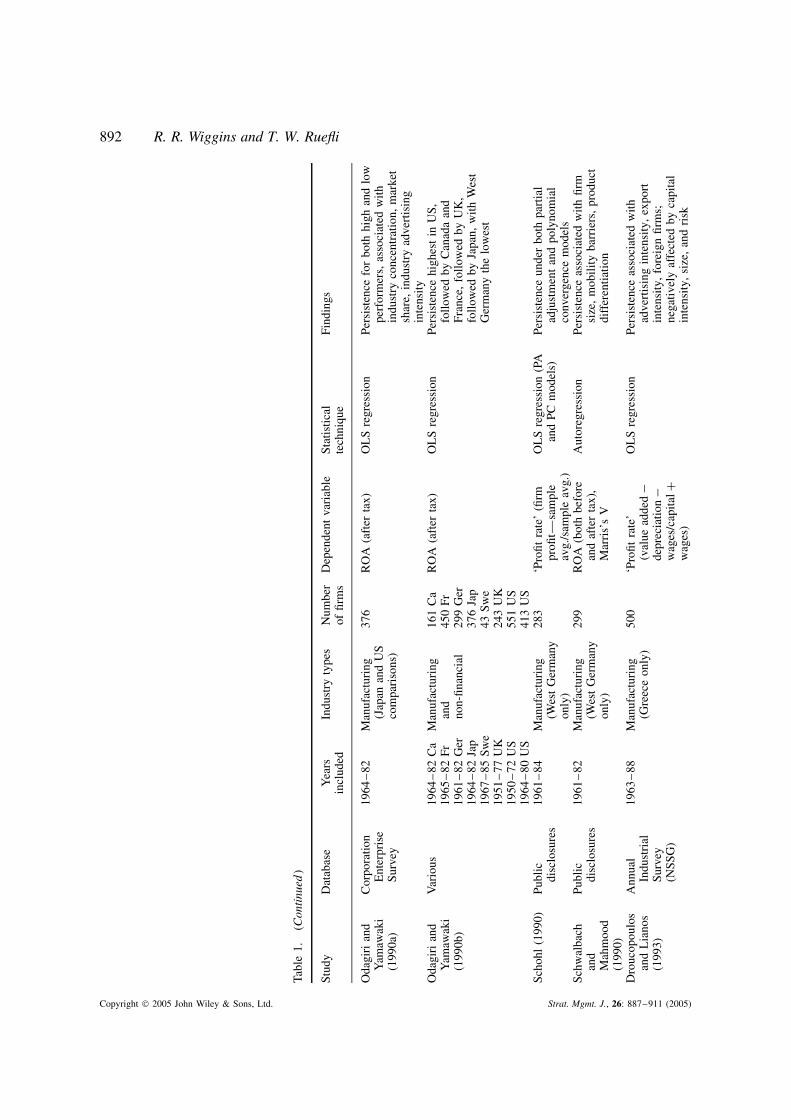
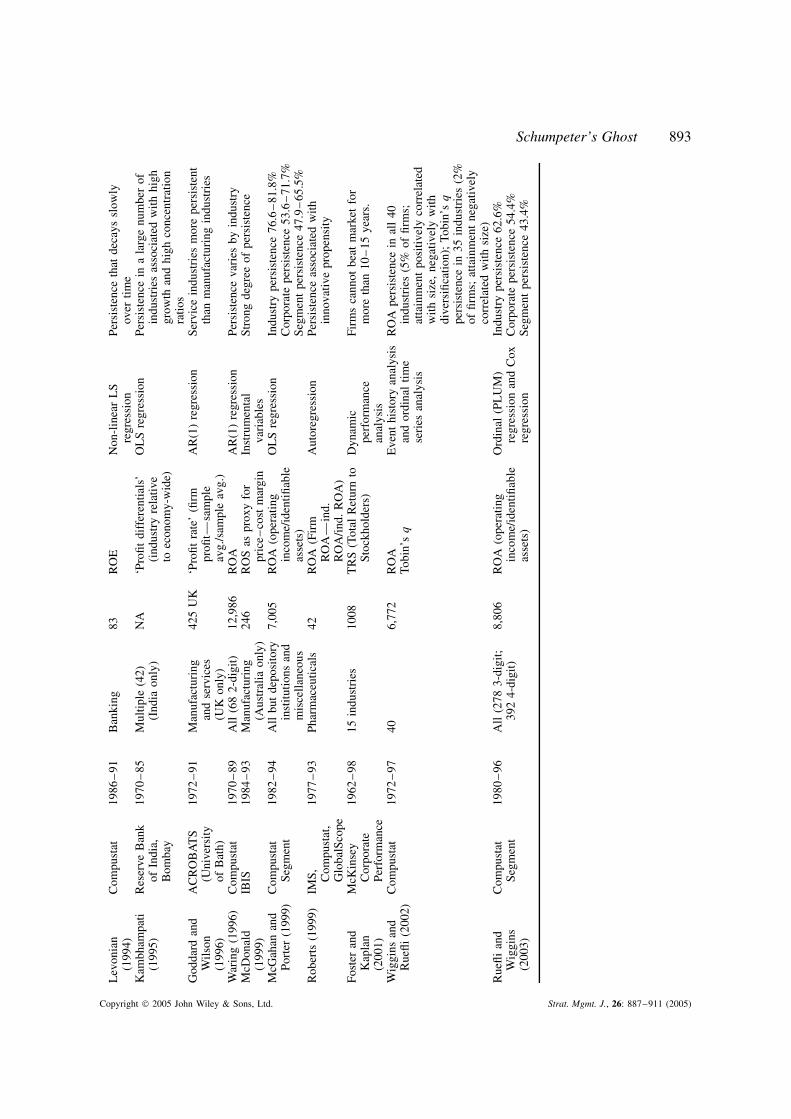
There have been a large number of empiri-cal studies (summarized in Table 1) of the per-sistence of economic performance. Some of themajor exemplars of this line of research includeMueller (1986), which, in a time-series regression-based study of ROA of 600 large industrial firmsover the period 1950–72 utilizing Compustat andFTC databases, found that profit levels tended toconverge toward the mean, but that the highest-performing firms converged the most slowly, andsome of the high-performing firms’ profitabilityeven increased over time. Geroski and Jacquemin(1988), Schohl (1990), Droucopoulos and Lianos(1993), and Goddard and Wilson (1996), all usingnon-US samples found similar results to Mueller(1986), as did Waring (1996) in a large-scalestudy of 68 US industries. Jacobson (1988), ina time-series regression-based study of ROI overthe period 1970–83 utilizing the PIMS SBU-leveldatabase, also found that profit levels convergedover time but did not find persistence, and con-cluded that ‘the conditions under which marketforces do not drive return back to its competi-tive rate seem remote, if present at all’ (Jacobson,1988: 415). All of these studies were concernedwith the pattern of loss of abnormal profitabilitypositions—but none focused on the length of time
superior performance was maintained nor distin-guished between above and below normal prof-its. McGahan and Porter (1999) examined shocksto profitability (both positive and negative posi-tions) and estimated the effects of the factors ofindustry, firm and business unit level on the per-sistence of those shocks, but did not examine eitherthe degree of persistence of abnormal profitabilityor its incidence across specific industries. Theirmethodology relied on an autoregressive approachthat makes assumptions (e.g., that abnormal prof-its will decay) that we avoid. Their results nei-ther support nor conflict with results reported here.The primary insight to be gained from Table 1 isthe sheer number of studies that found persistentsuperior economic performance. Of the 27 stud-ies listed, only one did not find any evidence ofpersistence of performance, and that was Jacob-son (1988), which is also the only study to use thePIMS database.
None of these studies examined the effects oftime on persistence, and all of them, by usingautoregressive techniques, confounded low andhigh performance regression and found it difficultto identify which firms achieve persistence or forhow long they sustain it. All of these previousstudies were focused on examining the assumedrate of decay of persistence (both positive andnegative), rather than the timeframes of persis-tent superior performance—which is the test ofthe heart of Schumpeter’s theory and the focusof this study. By using a non-parametric method-ology that is better suited to the identification ofboth modal performers and outliers, this researchavoids the problems of the autoregressive time-series methodologies and their parametric assump-tions in particular. Further, the time frame of thisresearch, 1972–97, complements the time period(1950–72) used by Mueller (1986). Finally, andimportantly, the present research also supplementsthe accounting measures of performance used inthese prior studies with a market-based perfor-mance measure. Barber and Lyon (1996) showedthat the accounting performance data for all firmsin the Compustat database has been trending downover time. This latter point calls into question anyfindings of autoregressive studies of decay of per-formance—since such decay could be confoundedwith the decline of the central tendency of all firms.However, this decline could also be indicative ofprecisely the effects of proposed by Schumpeter.
Copyright 2005 John Wiley & Sons, Ltd. Strat. Mgmt. J., 26: 887–911 (2005)
890 R. R. Wiggins and T. W. Ruefli
Tabl
e1.
Sum
mar
yof
empi
rica
lst
udie
sof
the
pers
iste
nce
ofsu
peri
orec
onom
icpe
rfor
man
ce
Stud
yD
atab
ase
Yea
rsin
clud
edIn
dust
ryty
pes
Num
ber
offir
ms
Dep
ende
ntva
riab
leSt
atis
tical
tech
niqu
eFi
ndin
gs
Car
ey(1
974)
Com
pust
at19
63–
7219
4-di
git
SIC
252
Net
profi
tm
argi
n,R
OA
,R
OE
Coe
ffici
ent
ofco
ncor
danc
ePe
rsis
tenc
ein
all
indu
stri
es
Mue
ller
(197
7)C
ompu
stat
1949
–72
Uns
peci
fied
472
RO
AO
LS
regr
essi
onPe
rsis
tenc
efo
rso
me
firm
sC
onno
llyan
dSc
hwar
tz(1
985)
Com
pust
at19
63–
82N
on-r
egul
ated
751
‘Exc
ess
valu
e’(m
arke
tva
lue—
book
valu
e/sa
les)
OL
Sre
gres
sion
,au
tore
gres
sion
Pers
iste
nce
for
posi
tive
profi
tfir
ms
(hig
her
profi
tsas
soci
ated
with
high
erpe
rsis
tenc
e)
Mue
ller
(198
6)FT
CC
ompu
stat
1950
–72
Man
ufac
turi
ng10
00R
OA
OL
Sre
gres
sion
Pers
iste
nce
for
som
efir
ms
asso
ciat
edw
ithm
arke
tsh
are,
indu
stry
;M
&A
dam
pens
pers
iste
nce
Cub
bin
and
Ger
oski
(198
7)
UK
DT
Ian
dD
AE
Cam
brid
geU
nive
rsit
y
1951
–77
483-
digi
t(U
Kon
ly)
217
‘Pro
fitra
te’
(ind
ustr
yav
erag
eco
mpa
red
tosa
mpl
eav
erag
e)
OL
Sre
gres
sion
and
full
info
.m
ax.
like
liho
od
Pers
iste
nce
asso
ciat
edw
ithfir
m-s
peci
ficef
fect
s(a
ndno
tw
ithin
dust
ry-s
peci
ficef
fect
s)
Ger
oski
and
Jacq
uem
in(1
988)
Cub
bin
Schw
alba
chB
AL
O
1949
–77
UK
1961
–81
Ger
1965
–82
Fr
8se
ctor
s51
UK
28G
er55
Fr
RO
A3r
dor
der
auto
regr
essi
onPe
rsis
tenc
em
uch
high
erin
UK
than
Fran
cean
dW
est
Ger
man
y;no
fact
ors
syst
emat
ical
lyas
soci
ated
with
pers
iste
nce
Copyright 2005 John Wiley & Sons, Ltd. Strat. Mgmt. J., 26: 887–911 (2005)
Schumpeter’s Ghost 891Ja
cobs
on(1
988)
PIM
SC
RSP
and
Com
pust
at
1970
–83
1963
–82
Uns
peci
fied
2000
sbu
241
RO
IA
R(1
)re
gres
sion
Litt
lepe
rsis
tenc
eN
oef
fect
ofin
dust
ryco
ncen
trat
ion
Som
eef
fect
ofm
arke
tsh
are
Con
tini
(198
9)IS
TAT
Ann
ual
Surv
eyof
Mfr
s
1973
,19
77,
and
1981
Man
ufac
turi
ng(I
taly
only
)N
AG
ross
profi
tra
tioC
ontin
genc
yta
bles
Pers
iste
nce
inal
lin
dust
ries
Cub
bin
and
Ger
oski
(199
0)
UK
DT
Ian
dD
AE
Cam
brid
geU
nive
rsit
y
1948
–77
483-
digi
t(U
Kon
ly)
243
‘Pro
fitra
te’
(ind
ustr
yav
erag
eco
mpa
red
tosa
mpl
eav
erag
e)
1st
orde
rau
tore
gres
sion
Pers
iste
nce
asso
ciat
edw
ithfir
m-s
peci
ficef
fect
s(a
ndno
tw
ithin
dust
ry-s
peci
ficef
fect
s)
Jenn
yan
dW
eber
(199
0)
Publ
icdi
sclo
sure
s19
65–
82M
anuf
actu
ring
(Fra
nce
only
)45
0R
OA
(bef
ore
tax)
OL
Sre
gres
sion
Pers
iste
nce
for
both
high
perf
orm
ers
and
low
perf
orm
ers
Kes
side
s(1
990)
Com
pust
at19
67–
8234
44-
digi
tN
AR
OS
GL
Sre
gres
sion
Indu
stry
pers
iste
nce
asso
ciat
edw
ithsm
all
num
bers
offir
ms,
conc
entr
atio
n,gr
owth
,sc
ale,
high
capi
tal
requ
irem
ents
Khe
man
ian
dSh
apir
o(1
990)
Com
pust
at19
64–
8219
68–
82M
anuf
actu
ring
and
min
ing
(Can
ada
only
)
129
161
RO
A(b
oth
befo
rean
daf
ter
tax)
OL
Sre
gres
sion
Pers
iste
nce
(gre
ater
than
inU
S)as
soci
ated
with
prod
uct
diff
eren
tiatio
nM
uelle
r(1
990)
FTC
Com
pust
at19
50–
72M
anuf
actu
ring
(63
3-di
git
and
4-di
git)
551
RO
AO
LS
regr
essi
onPe
rsis
tenc
eas
soci
ated
with
mar
ket
shar
e,pr
oduc
tdi
ffer
entia
tion,
grow
th;
nega
tivel
yas
soci
ated
with
conc
entr
atio
n,M
&A
(con
tinu
edov
erle
af)
Copyright 2005 John Wiley & Sons, Ltd. Strat. Mgmt. J., 26: 887–911 (2005)
892 R. R. Wiggins and T. W. Ruefli
Tabl
e1.
(Con
tinu
ed)
Stud
yD
atab
ase
Yea
rsin
clud
edIn
dust
ryty
pes
Num
ber
offir
ms
Dep
ende
ntva
riab
leSt
atis
tical
tech
niqu
eFi
ndin
gs
Oda
giri
and
Yam
awak
i(1
990a
)
Cor
pora
tion
Ent
erpr
ise
Surv
ey
1964
–82
Man
ufac
turi
ng(J
apan
and
US
com
pari
sons
)
376
RO
A(a
fter
tax)
OL
Sre
gres
sion
Pers
iste
nce
for
both
high
and
low
perf
orm
ers,
asso
ciat
edw
ithin
dust
ryco
ncen
trat
ion,
mar
ket
shar
e,in
dust
ryad
vert
isin
gin
tens
ity
Oda
giri
and
Yam
awak
i(1
990b
)
Var
ious
1964
–82
Ca
1965
–82
Fr19
61–
82G
er19
64–
82Ja
p19
67–
85Sw
e19
51–
77U
K19
50–
72U
S
Man
ufac
turi
ngan
dno
n-fin
anci
al
161
Ca
450
Fr29
9G
er37
6Ja
p43
Swe
243
UK
551
US
RO
A(a
fter
tax)
OL
Sre
gres
sion
Pers
iste
nce
high
est
inU
S,fo
llow
edby
Can
ada
and
Fran
ce,
follo
wed
byU
K,
follo
wed
byJa
pan,
with
Wes
tG
erm
any
the
low
est
1964
–80
US
413
US
Scho
hl(1
990)
Publ
icdi
sclo
sure
s19
61–
84M
anuf
actu
ring
(Wes
tG
erm
any
only
)
283
‘Pro
fitra
te’
(firm
profi
t—sa
mpl
eav
g./s
ampl
eav
g.)
OL
Sre
gres
sion
(PA
and
PCm
odel
s)Pe
rsis
tenc
eun
der
both
part
ial
adju
stm
ent
and
poly
nom
ial
conv
erge
nce
mod
els
Schw
alba
chan
dM
ahm
ood
(199
0)
Publ
icdi
sclo
sure
s19
61–
82M
anuf
actu
ring
(Wes
tG
erm
any
only
)
299
RO
A(b
oth
befo
rean
daf
ter
tax)
,M
arri
s’s
V
Aut
oreg
ress
ion
Pers
iste
nce
asso
ciat
edw
ithfir
msi
ze,
mob
ility
barr
iers
,pr
oduc
tdi
ffer
entia
tion
Dro
ucop
oulo
san
dL
iano
s(1
993)
Ann
ual
Indu
stri
alSu
rvey
(NSS
G)
1963
–88
Man
ufac
turi
ng(G
reec
eon
ly)
500
‘Pro
fitra
te’
(val
uead
ded
−de
prec
iatio
n−
wag
es/c
apita
l+w
ages
)
OL
Sre
gres
sion
Pers
iste
nce
asso
ciat
edw
ithad
vert
isin
gin
tens
ity,
expo
rtin
tens
ity,
fore
ign
firm
s;ne
gativ
ely
affe
cted
byca
pita
lin
tens
ity,
size
,an
dri
sk
Copyright 2005 John Wiley & Sons, Ltd. Strat. Mgmt. J., 26: 887–911 (2005)
Schumpeter’s Ghost 893
Lev
onia
n(1
994)
Com
pust
at19
86–
91B
anki
ng83
RO
EN
on-l
inea
rL
Sre
gres
sion
Pers
iste
nce
that
deca
yssl
owly
over
time
Kam
bham
pati
(199
5)R
eser
veB
ank
ofIn
dia,
Bom
bay
1970
–85
Mul
tipl
e(4
2)(I
ndia
only
)N
A‘P
rofit
diff
eren
tials
’(i
ndus
try
rela
tive
toec
onom
y-w
ide)
OL
Sre
gres
sion
Pers
iste
nce
ina
larg
enu
mbe
rof
indu
stri
esas
soci
ated
with
high
grow
than
dhi
ghco
ncen
trat
ion
ratio
sG
odda
rdan
dW
ilso
n(1
996)
AC
RO
BA
TS
(Uni
vers
ityof
Bat
h)
1972
–91
Man
ufac
turi
ngan
dse
rvic
es(U
Kon
ly)
425
UK
‘Pro
fitra
te’
(firm
profi
t—sa
mpl
eav
g./s
ampl
eav
g.)
AR
(1)
regr
essi
onSe
rvic
ein
dust
ries
mor
epe
rsis
tent
than
man
ufac
turi
ngin
dust
ries
War
ing
(199
6)C
ompu
stat
1970
–89
All
(68
2-di
git)
12,9
86R
OA
AR
(1)
regr
essi
onPe
rsis
tenc
eva
ries
byin
dust
ryM
cDon
ald
(199
9)IB
IS19
84–
93M
anuf
actu
ring
(Aus
tral
iaon
ly)
246
RO
Sas
prox
yfo
rpr
ice–
cost
mar
gin
Inst
rum
enta
lva
riab
les
Stro
ngde
gree
ofpe
rsis
tenc
e
McG
ahan
and
Port
er(1
999)
Com
pust
atSe
gmen
t19
82–
94A
llbu
tde
posi
tory
inst
itut
ions
and
mis
cella
neou
s
7,00
5R
OA
(ope
ratin
gin
com
e/id
entifi
able
asse
ts)
OL
Sre
gres
sion
Indu
stry
pers
iste
nce
76.6
–81
.8%
Cor
pora
tepe
rsis
tenc
e53
.6–
71.7
%Se
gmen
tpe
rsis
tenc
e47
.9–
65.5
%R
ober
ts(1
999)
IMS, Com
pust
at,
Glo
balS
cope
1977
–93
Phar
mac
eutic
als
42R
OA
(Fir
mR
OA
—in
d.R
OA
/ind.
RO
A)
Aut
oreg
ress
ion
Pers
iste
nce
asso
ciat
edw
ithin
nova
tive
prop
ensi
ty
Fost
eran
dK
apla
n(2
001)
McK
inse
yC
orpo
rate
Perf
orm
ance
1962
–98
15in
dust
ries
1008
TR
S(T
otal
Ret
urn
toSt
ockh
olde
rs)
Dyn
amic
perf
orm
ance
anal
ysis
Firm
sca
nnot
beat
mar
ket
for
mor
eth
an10
–15
year
s.
Wig
gins
and
Rue
fli(2
002)
Com
pust
at19
72–
9740
6,77
2R
OA
Tobi
n’s
qE
vent
hist
ory
anal
ysis
and
ordi
nal
time
seri
esan
alys
is
RO
Ape
rsis
tenc
ein
all
40in
dust
ries
(5%
offir
ms;
atta
inm
ent
posi
tivel
yco
rrel
ated
with
size
,ne
gativ
ely
with
dive
rsifi
catio
n);
Tobi
n’s
qpe
rsis
tenc
ein
35in
dust
ries
(2%
offir
ms;
atta
inm
ent
nega
tivel
yco
rrel
ated
with
size
)R
uefli
and
Wig
gins
(200
3)
Com
pust
atSe
gmen
t19
80–
96A
ll(2
783-
digi
t;39
24-
digi
t)8,
806
RO
A(o
pera
ting
inco
me/
iden
tifiab
leas
sets
)
Ord
inal
(PL
UM
)re
gres
sion
and
Cox
regr
essi
on
Indu
stry
pers
iste
nce
62.6
%C
orpo
rate
pers
iste
nce
54.4
%Se
gmen
tpe
rsis
tenc
e43
.4%
Copyright 2005 John Wiley & Sons, Ltd. Strat. Mgmt. J., 26: 887–911 (2005)
894 R. R. Wiggins and T. W. Ruefli
Some have argued that hypercompetition is sopervasive that ‘all competitive advantage is tem-porary’ (Fine, 1998: 30). But not everyone agrees.Michael Porter stated ‘in many industries, how-ever, what some call hypercompetition is a self-inflicted wound, not the inevitable outcome of achanging paradigm of competition’ (Porter, 1996:61) and that it is most likely to be limited to asubset of firms in high-technology industries. Thequestion of which of these arguments should pre-vail is ultimately an empirical one, and that is thepurpose of this research, to examine this questionby a longitudinal examination of the nature of thetiming of the loss of sustained competitive advan-tage, the scope across industries, and the unitary ormultiple nature of competitive advantage. In short,we seek to test whether there is a basis on whichthe call for ‘advocates of the hypercompetitiveparadigm to back up their sweeping generalizationsabout the ubiquity of hypercompetition with rigor-ous large-sample empirical evidence’ (Makadok,1998) can be answered.
While the above focuses on the state of empir-ical research on persistent superior performance,there have also been some investigations specif-ically into hypercompetition. In the first notableantecedent empirical test of some of the aspectsof hypercompetition, Thomas (1996) performed alarge-scale study, examining over 200 manufac-turing industries during the period from 1958 to1991 and found that a ‘hypercompetitive shift’ hasindeed occurred in this sector of the US economy.These models used growth rates in stock marketvalue as the dependent variable, the results camefrom pooled cross-section time-series data ana-lyzed using regression-based methodologies, andthe sample was restricted to manufacturing firms.Our study will build on Thomas’s approach, butwill use alternate measures and methods to directlyfocus on the signature aspects of hypercompetition.Both accounting and market measures of perfor-mance will be employed to provide immediatecomparisons with antecedent research. Longitudi-nal data will be employed to better enable theexamination of possible effects of hypercompeti-tion over time. We also use a unique stratifica-tion methodology applied industry by industry toidentify superior performers and to control for thecommon effects of general economic and industryconditions and then employ event history analysisto better discern over time which firms and whichindustries are involved in the possible effects of
Schumpeterian dynamics. Further, we include notonly manufacturing firms but also mining, naturalresource, transportation, utility, financial, and ser-vice firms, thus providing evidence about the scopeof possible hypercompetitive effects.
Another empirical study that bears on hyper-competition is that of Young, Smith, and Grimm(1996), who, in an examination of single-businessfirms in the software industry, obtained resultsthat indicated that competitive moves, unless theywere extreme, contributed more to increased per-formance than to industry rivalry. These resultswere extended and greatly expanded upon by Fer-rier, Smith, and Grimm (1999) who, in a pairedsample empirical study of single or dominant busi-ness firms, examined the possible market shareerosion and dethronement of market leaders whenconfronted by challengers. Their findings indicatethat across a wide range of industries market lead-ers which are faced with relatively more aggres-sive challengers are likely to be subject to marketshare erosion and dethronement as market leader.This finding is confirmed by Foster and Kaplan(2001) who, working with a McKinsey sampleof 1008 firms over 36 years, found that even themost admired firms could not maintain their above-market performance for more than 10–15 years.
The most recent large-scale empirical examina-tion of hypercompetition was assayed by McNa-mara et al. (2003) and is the study most com-parable to the one reported here. Their study ofa subset of the firms in this study, covering theperiod 1977–97, included an autoregressive modelsimilar to that used by Mueller (1986) and Jacob-son (1988), but included an interaction term toexamine changes in the rate of decay of perfor-mance (both superior and inferior). This interac-tion term was not significantly different from zero,indicating no significant change in the decay rateover time. These studies also reported no increasein mortality rates, no increasing trend in indus-try dynamism, and no decreasing trend in industrymunificence. Based on these findings, they arguethat the tendency for researchers to believe inhypercompetition may be a result of researcherhindsight. While we do not dispute their find-ings on mortality, dynamism, and munificence, andwe applaud their focus on changes in the rate ofdecay in their autoregressive models, we reiter-ate our arguments about the use of autoregressivemodels that admix superior, average, and inferiorperformers, do not compensate for overall trends in
Copyright 2005 John Wiley & Sons, Ltd. Strat. Mgmt. J., 26: 887–911 (2005)
Schumpeter’s Ghost 895
performance, require parametric assumptions, andthat are sensitive to outliers. Our approach willbe to focus only on the persistent superior per-formers and any effects on their rate of loss ofperformance. After all, the primary effect men-tioned in Schumpeterian theory and argued byD’Aveni (1994) is increased difficulty in sustaininga competitive advantage. To enhance direct com-parability with McNamara et al. (2003), we willinclude analyses utilizing the same Compustat seg-ment dataset that they (as well as McGahan andPorter, (1999) used.
THE RESEARCH QUESTIONS
Has persistent superior economic performancebecome more difficult to maintain over time, as theSchumpeterian theories would suggest? In whichindustries? Have firms increasingly sought sus-tained competitive advantage through concatena-tion of a set of shorter-term competitive advan-tages? These are the chief research questionsthat will be addressed through the formulation ofhypotheses and via a novel empirical study.
HYPOTHESIS DEVELOPMENT
Hypercompetition and loss of persistentsuperior economic performance
Conventional strategic management theory doesnot give a prominent role to either Schumpeteriantheory or hypercompetition. Porter (1980, 1985,1996) has long argued that classic industrial orga-nization solutions such as ‘increasing barriers toentry and gaining market power over rivals, sup-pliers and buyers will reduce rivalry within anindustry’ (Ilinitch et al., 1998: xxvi). Indeed, suchreasoning argues that we should see over timean increase in the length of time that competi-tive advantage can be maintained. McNamara et al.(2003) indicate there has been no change. On theother hand, D’Aveni (1994) clearly argues thathypercompetition is making it more and more dif-ficult for firms to maintain a competitive advan-tage. Therefore, we should see the average periodfor which firms sustain a competitive advantagedecrease over time. Following Schumpeterian the-ory and D’Aveni’s line of reasoning, the hypothesisis proposed:
Hypothesis 1: Periods of persistent superioreconomic performance have decreased in dura-tion over time.
Hypercompetition across multiple industries
Schumpeter (1939), followed by D’Aveni (1994:4), originally argued for the near-ubiquity of hyper-competition: ‘There are few industries and com-panies that have escaped this shift in compet-itiveness.’ Porter (1996) argued that hypercom-petitive effects are likely to be limited to high-technology industries. D’Aveni, in a more recentpublication (1999), proposed that there are fourenvironments of varying turbulence ranging from‘equilibrium’ to ‘disequilibrium.’ The latter envi-ronment he identifies with hypercompetition, buthe does not in this work specify the degree ofprevalence of any of his environments in the econ-omy. To formulate our next hypothesis we revertto Schumpeter and to D’Aveni’s original position,which leads directly to this formulation:
Hypothesis 2: Hypercompetition is not limited tohigh-technology industries, but occurs through-out most industries.
Hypercompetition and series of temporarycompetitive advantages
D’Aveni specifically stated, ‘Instead of seeking asustainable advantage, strategy in hypercompeti-tive environments now focuses on developing aset of temporary advantages’ (D’Aveni, 1994: 7).He reiterated this when he said, ‘If companiesare not seeking a sustainable competitive advan-tage, what is the goal of strategy in hypercom-petitive environments? The primary goal of thisnew approach to strategy is disruption of the sta-tus quo, to seize the initiative through creating aseries of temporary advantages’ (D’Aveni, 1994:10). Brown and Eisenhardt (1998) also argued thatsuccess can only come from a continuous streamof temporary advantages when the environmentis ‘relentlessly shifting’ (Brown and Eisenhardt,1997). These arguments lead directly to the fol-lowing hypothesis:
Hypothesis 3: Over time firms increasingly havesought to sustain competitive advantage by con-catenating a series of short-term competitiveadvantages.
Copyright 2005 John Wiley & Sons, Ltd. Strat. Mgmt. J., 26: 887–911 (2005)
896 R. R. Wiggins and T. W. Ruefli
METHODS
Data
Data were collected from three primary sources:the Compustat PC-Plus database (both active andresearch files) for the 20 years from 1978 to 1997inclusive, the Compustat Back History databasefor the 5-year period from 1972 to 1977, andthe Compustat Segment Tapes for 1978–97. Weincluded data from the Compustat Back Historydatabase to provide 20 overlapping 5-year peri-ods (1974–97), as well as two additional years(1972–73) to alleviate some of the left-censoringproblem. SIC codes for firms that exited thedatabase prior to 1978 are not included in theBack History database; these firms were classi-fied employing the CRSP/Compustat Cross Refer-ence database maintained by the Johnson GraduateSchool of Management at Cornell University, andalso the Moody’s Industrial, OTC, Transportation,Financial, and Utilities Manuals. Two samples (afirm-level and a business-unit-level sample) werederived from the primary source data.
Dependent variables
While the theories used to develop the hypothe-ses relate to sustained competitive advantage, weare unable to directly operationalize the concept.Barney (1991: 102), for example, defines a sus-tained competitive advantage as a competitiveadvantage that ‘continues to exist after efforts toduplicate that advantage have ceased.’ What wecan operationalize is the consequence of sustainedcompetitive advantage, persistent economic per-formance. While some may find this less desir-able, it is consistent with the work of Porter, whorefers to ‘long-term profitability’ (Porter, 1985: 1)and ‘above-average performance in the long run’(Porter, 1985: 11) when discussing the outcomesof sustained competitive advantage.
Two measures were used to operationalize eco-nomic performance: return on assets (ROA), anaccounting measure, and Tobin’s q (the ratio offirm market value to the replacement cost of itsassets), a market measure, because some studieshave shown results that vary between accountingand market measures (Hoskisson, Hitt and John-son, 1993). ROA (net income divided by totalassets for firms, segment net income divided byidentifiable assets for business units) was selected
primarily for comparability with earlier economicand strategic management research in this area (seeTable 1, where most of the studies use ROA astheir primary or only measure of performance).Tobin’s q was selected because, although he didnot use it in his study, Mueller (1990: 8–14) sug-gested its potential, and because Tobin’s q was uti-lized by McGahan and Porter (1999) and Wigginsand Ruefli (2002), and so its inclusion enhancescomparability with their results. Tobin’s q wasoperationalized as the ratio of market value to thebook value of assets. This ratio has been shownto be not only empirically equivalent (Perfect andWiles, 1994) but also theoretically equivalent toTobin’s q (Varaiya, Kerin, and Weeks, 1987).
Superior economic performance was operation-alized as statistically significant above averageeconomic performance (relative to other firms inthe same industry for the firm-level analyses, andrelative to all business units, or all industries, or allfirms for the segment-level analyses) over a 5-yearperiod. Note that this is consistent with Besanko,Dranove, and Shanley (1996), who define compet-itive advantage as a firm outperforming its indus-try. This was determined using the Iterative Kol-mogorov–Smirnov (IKS) technique, which strati-fies time-series data into statistically significantlydifferent levels of performance using iterativecomparisons described in detail in Ruefli and Wig-gins (2000). A rolling 5-year window (Cool andSchendel, 1988; Fiegenbaum and Thomas, 1988)was used for all measures. Since this techniqueyields ordinal categorical data (Argresti, 1984),factors such as the common effects of general eco-nomic conditions, industry cycles, and product lifecycles are controlled in the stratification process.
However, IKS analysis can generate varyingnumbers of performance strata over time, whichmakes longitudinal comparisons difficult. We areinterested only in the firms with performanceabove the industry or reference set modal stratum.Therefore, as a form of a fortiori analysis (becauseit is conservative in regard to the hypotheses beingtested), the number of performance strata was com-pressed in each time period to three by creating twosupersets of strata: those above the modal stratumand those below the modal stratum. To validate thestratification supersets, discriminant function anal-ysis was employed in a confirmatory mode on theindustries studied. For these industries, all of thediscriminant functions were significant (p < 0.05)
Copyright 2005 John Wiley & Sons, Ltd. Strat. Mgmt. J., 26: 887–911 (2005)
Schumpeter’s Ghost 897
for all variables, demonstrating the validity of thesuperset performance strata.
Persistent superior economic performance at thecorporate level was operationalized as superioreconomic performance lasting for six or more win-dows (i.e., a 10-year period), inasmuch as therewere two non-overlapping 5-year windows in sucha period, which eliminated potential bias owing tothe effect of a single year of outstanding perfor-mance. This establishes a very stringent test for theperformance effects of hypercompetition and onethat is tied directly to Schumpeterian theory, in thatit is only the significant shortening of the periodsduring which only those firms with significant sus-tained competitive advantage (i.e., over periods of10 years or more) that will be accepted as evi-dence. The first 5-year window in the firm-levelmodels is 1977–81 since that is the first windowin which an exit from the persistent superior eco-nomic performance stratum could occur. For thebusiness unit-level data, 5 years (one window) wasused to enhance comparability with McNamaraet al. (2003).
Independent and control variables
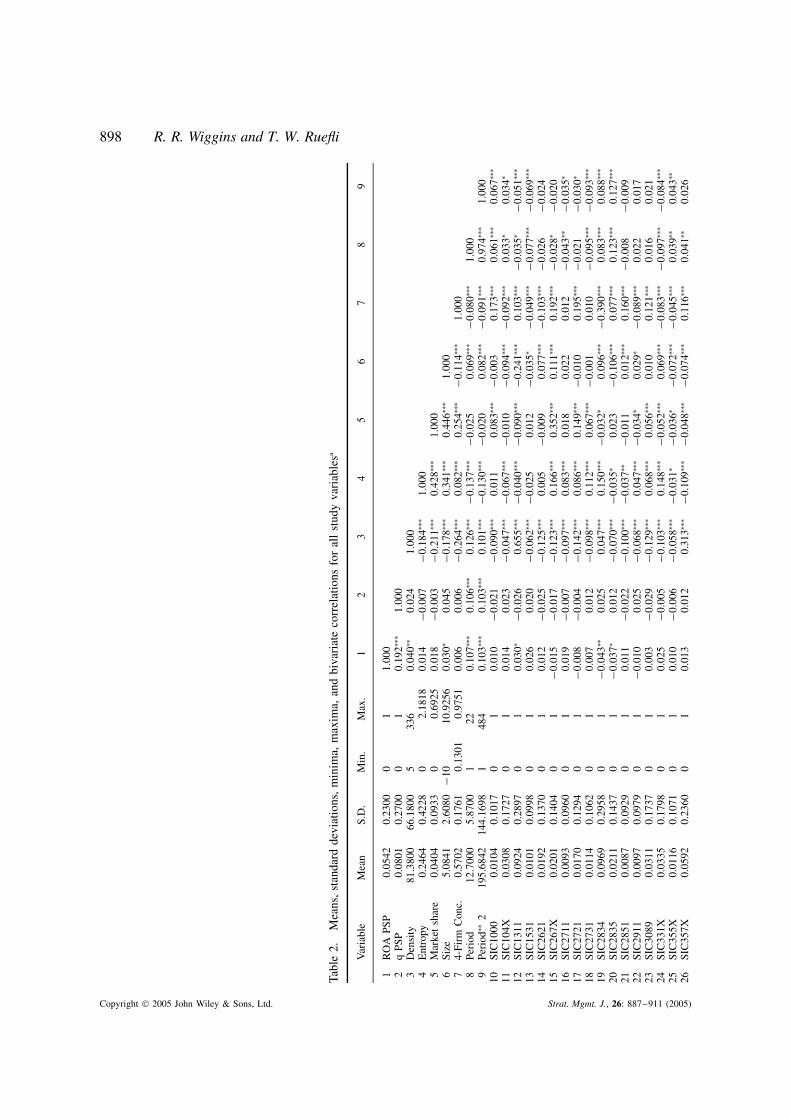
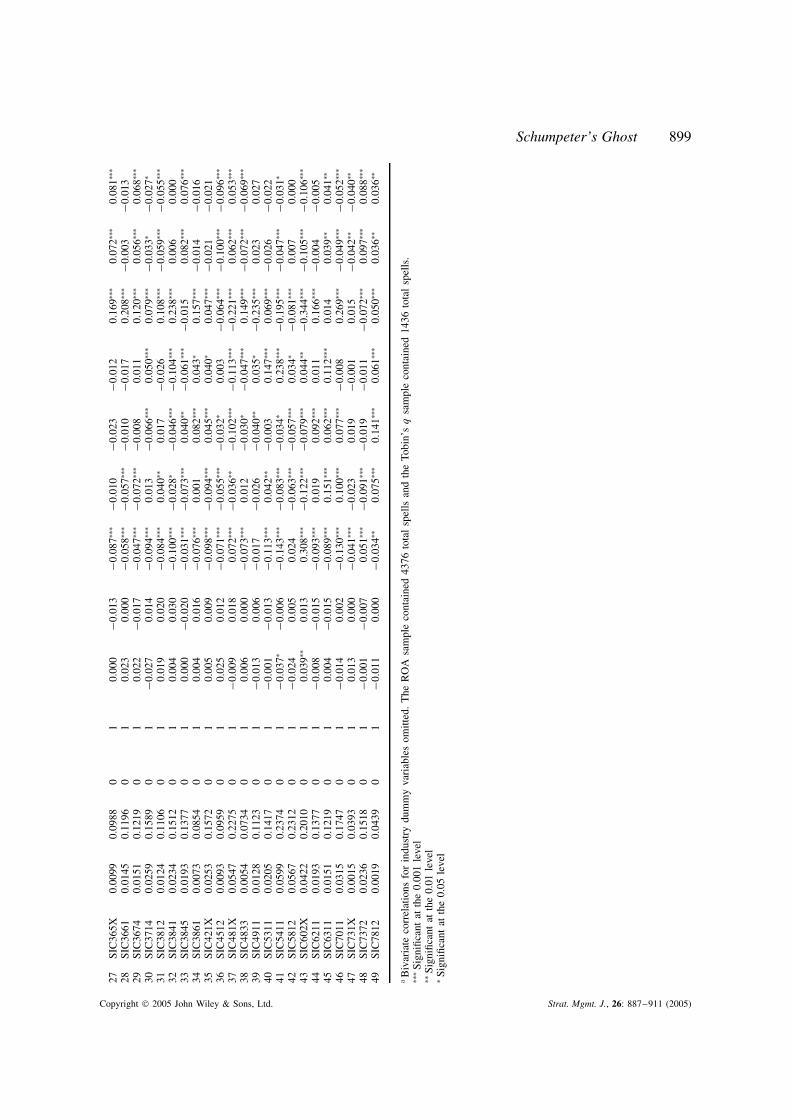
Because the primary question we are investigat-ing is the change over time of the rate at whichfirms lose superior profitability positions, the onlyindependent variable is time period. The strat-ification methodology controls for the commoneffects of general economic conditions, thus othercontrol variables included market share, industryconcentration, firm size, diversification, industrydensity, and dummy variables for each industry.These variables were operationalized as follows.For market share we used the ratio of each firm’stotal revenues to the total revenues of all firmsin the industry. Table 2 shows that market shareranged from 0 to 0.69 with a mean across allfirms of 0.04. Industry concentration was oper-ationalized by calculating the four-firm concen-tration ratio by dividing the combined total rev-enues of the four largest firms in each industryby the total revenues of all firms in the industry.As seen in Table 2, the industry four-firm con-centration ratio ranged from 0.13 to 0.98, with amean across all 40 industries of 0.57. For firm sizethe natural logarithm of total sales was employed.Table 2 shows the range of firm size as −10 to10.93 with a mean of 5.08. For diversificationwe used the Jacquemin–Berry entropy measure
of diversification (Jacquemin and Berry, 1979;Palepu, 1985), which is defined as
E =n∑
i=1
Pi ln(1/Pi)
where Pi is the ith segment’s share of the firm’stotal sales, which operates in n segments. As seenin Table 2, entropy ranged from 0 to 2.18 with amean of 0.25. For density we used the total num-ber of firms in each industry in each period, whichas Table 2 shows ranged from 5 to 336 with amean of 81.38. Because the dependent variablesrepresent 5-year windows, all of the control vari-ables were 5-year moving averages matched to thedependent variables’ 5-year windows. Finally, theindustry dummy variables were coded using thedeviation method, which compares the effect ofeach dummy variable to the overall effect. Thedescriptive statistics and correlations of the studyvariables are shown in Table 2.
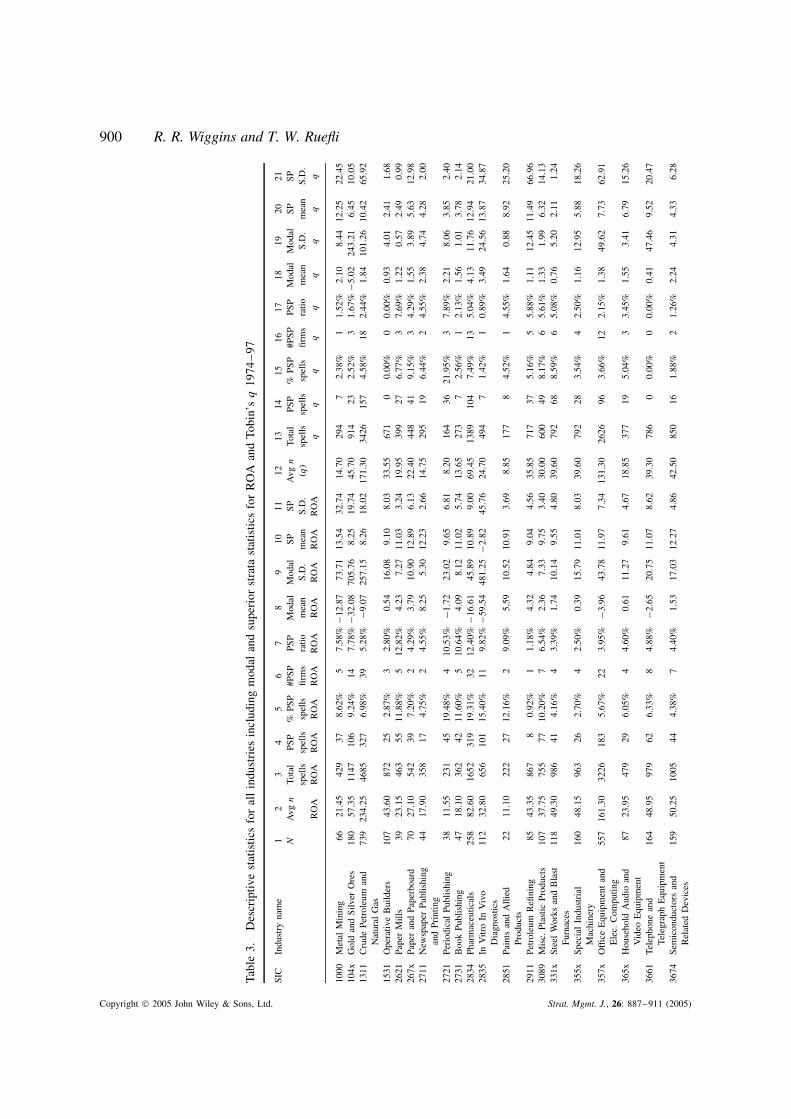
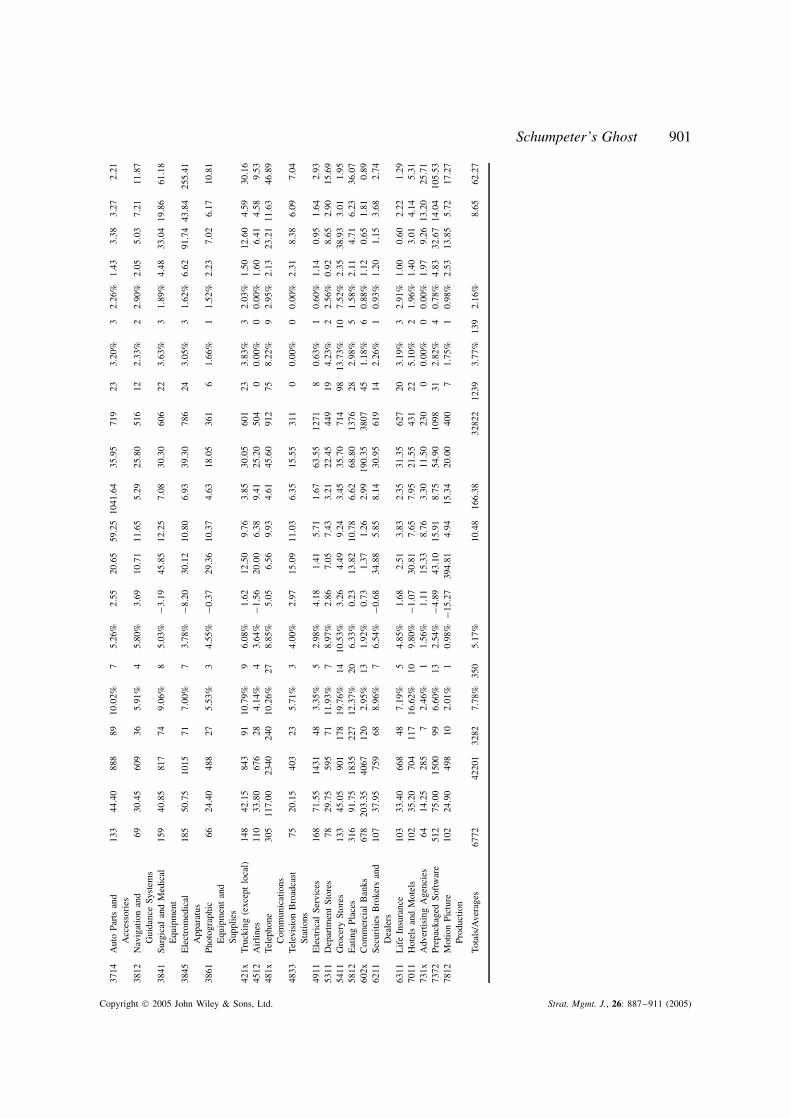
Samples
For the firm-level sample we selected the same 40industries (listed in Table 3) used by Wiggins andRuefli (2002). The industries in this sample repre-sent 7 out of 10 1-digit SIC level categories. Thissample thus includes an overlap with Thomas’s(1996) sample, although most of the industriesconsidered are outside the manufacturing sectorand is a superset of the sample used by McNamaraet al. (2003). Table 3 shows the complete firm-level sample, along with some descriptive statis-tics. For the segment-level sample we used all ofthe available Compustat segment data, since wewere not utilizing regression and therefore did notface the same methodological issues as McGahanand Porter (1999) and McNamara et al. (2003), andtherefore did not have to screen the data and loseobservations.
Identification of superior performance
In essence, our research concentrates on an outlieror frontier phenomenon (Starbuck, 1993), i.e., theloss of superior economic performance. In orderto identify firms that have lost superior economicperformance, we first identified firms that obtainedsuperior economic performance. Most statisticaltechniques, however, are based on measures ofcentral tendency, and consequently their focus is
Copyright 2005 John Wiley & Sons, Ltd. Strat. Mgmt. J., 26: 887–911 (2005)
898 R. R. Wiggins and T. W. Ruefli
Tabl
e2.
Mea
ns,
stan
dard
devi
atio
ns,
min
ima,
max
ima,
and
biva
riat
eco
rrel
atio
nsfo
ral
lst
udy
vari
able
sa
Var
iabl
eM
ean
S.D
.M
in.
Max
.1
23
45
67
89
1R
OA
PSP
0.05
420.
2300
01
1.00
02
qPS
P0.
0801
0.27
000
10.
192∗∗
∗1.
000
3D
ensi
ty81
.380
066
.180
05
336
0.04
0∗∗0.
024
1.00
04
Ent
ropy
0.24
640.
4228
02.
1818
0.01
4−0
.007
−0.1
84∗∗
∗1.
000
5M
arke
tsh
are
0.04
040.
0933
00.
6925
0.01
8−0
.003
−0.2
11∗∗
∗0.
428∗∗
∗1.
000
6Si
ze5.
0841
2.60
80−1
010
.925
60.
030∗
0.04
5−0
.178
∗∗∗
0.34
1∗∗∗
0.44
6∗∗∗
1.00
07
4-Fi
rmC
onc.
0.57
020.
1761
0.13
010.
9751
0.00
60.
006
−0.2
64∗∗
∗0.
082∗∗
∗0.
254∗∗
∗−0
.114
∗∗∗
1.00
08
Peri
od12
.700
05.
8700
122
0.10
7∗∗∗
0.10
6∗∗∗
0.12
6∗∗∗
−0.1
37∗∗
∗−0
.025
0.06
9∗∗∗
−0.0
80∗∗
∗1.
000
9Pe
riod
∗∗2
195.
6842
144.
1698
148
40.
103∗∗
∗0.
103∗∗
∗0.
101∗∗
∗−0
.130
∗∗∗
−0.0
200.
082∗∗
∗−0
.091
∗∗∗
0.97
4∗∗∗
1.00
010
SIC
1000
0.01
040.
1017
01
0.01
0−0
.021
−0.0
90∗∗
∗0.
011
0.08
3∗∗∗
−0.0
030.
173∗∗
∗0.
061∗∗
∗0.
067∗∗
∗
11SI
C10
4X0.
0308
0.17
270
10.
014
0.02
3−0
.047
∗∗∗
−0.0
67∗∗
∗−0
.010
−0.0
94∗∗
∗−0
.092
∗∗∗
0.03
3∗0.
034∗
12SI
C13
110.
0924
0.28
970
10.
030∗
−0.0
260.
655∗∗
∗−0
.040
∗∗∗
−0.0
90∗∗
∗−0
.241
∗∗∗
0.10
3∗∗∗
−0.0
35∗
−0.0
51∗∗
∗
13SI
C15
310.
0101
0.09
980
10.
026
0.02
0−0
.062
∗∗∗
−0.0
250.
012
−0.0
35∗
−0.0
49∗∗
∗−0
.077
∗∗∗
−0.0
69∗∗
∗
14SI
C26
210.
0192
0.13
700
10.
012
−0.0
25−0
.125
∗∗∗
0.00
5−0
.009
0.07
7∗∗∗
−0.1
03∗∗
∗−0
.026
−0.0
2415
SIC
267X
0.02
010.
1404
01
−0.0
15−0
.017
−0.1
23∗∗
∗0.
166∗∗
∗0.
352∗∗
∗0.
111∗∗
∗0.
192∗∗
∗−0
.028
∗−0
.020
16SI
C27
110.
0093
0.09
600
10.
019
−0.0
07−0
.097
∗∗∗
0.08
3∗∗∗
0.01
80.
022
0.01
2−0
.043
∗∗−0
.035
∗
17SI
C27
210.
0170
0.12
940
1−0
.008
−0.0
04−0
.142
∗∗∗
0.08
6∗∗∗
0.14
9∗∗∗
−0.0
100.
195∗∗
∗−0
.021
−0.0
30∗
18SI
C27
310.
0114
0.10
620
10.
007
0.01
2−0
.098
∗∗∗
0.11
2∗∗∗
0.06
7∗∗∗
−0.0
010.
010
−0.0
95∗∗
∗−0
.093
∗∗∗
19SI
C28
340.
0969
0.29
580
1−0
.043
∗∗0.
025
0.04
7∗∗∗
0.15
0∗∗∗
−0.0
32∗
0.09
6∗∗∗
−0.3
90∗∗
∗0.
083∗∗
∗0.
088∗∗
∗
20SI
C28
350.
0211
0.14
370
1−0
.037
∗0.
012
−0.0
70∗∗
∗−0
.035
∗0.
023
−0.1
06∗∗
∗0.
077∗∗
∗0.
123∗∗
∗0.
127∗∗
∗
21SI
C28
510.
0087
0.09
290
10.
011
−0.0
22−0
.100
∗∗∗
−0.0
37∗∗
−0.0
110.
012∗∗
∗0.
160∗∗
∗−0
.008
−0.0
0922
SIC
2911
0.00
970.
0979
01
−0.0
100.
025
−0.0
68∗∗
∗0.
047∗∗
∗−0
.034
∗0.
029∗
−0.0
89∗∗
∗0.
022
0.01
723
SIC
3089
0.03
110.
1737
01
0.00
3−0
.029
−0.1
29∗∗
∗0.
068∗∗
∗0.
056∗∗
∗0.
010
0.12
1∗∗∗
0.01
60.
021
24SI
C33
1X0.
0335
0.17
980
10.
025
−0.0
05−0
.103
∗∗∗
0.14
8∗∗∗
−0.0
52∗∗
∗0.
069∗∗
∗−0
.083
∗∗∗
−0.0
97∗∗
∗−0
.084
∗∗∗
25SI
C35
5X0.
0116
0.10
710
10.
010
−0.0
06−0
.058
∗∗∗
−0.0
31∗
−0.0
36∗
−0.0
72∗∗
∗−0
.045
∗∗∗
0.03
9∗∗0.
043∗∗
26SI
C35
7X0.
0592
0.23
600
10.
013
0.01
20.
313∗∗
∗−0
.109
∗∗∗
−0.0
48∗∗
∗−0
.074
∗∗∗
0.11
6∗∗∗
0.04
1∗∗0.
026
Copyright 2005 John Wiley & Sons, Ltd. Strat. Mgmt. J., 26: 887–911 (2005)
Schumpeter’s Ghost 899
27SI
C36
5X0.
0099
0.09
880
10.
000
−0.0
13−0
.087
∗∗∗
−0.0
10−0
.023
−0.0
120.
169∗∗
∗0.
072∗∗
∗0.
081∗∗
∗
28SI
C36
610.
0145
0.11
960
10.
023
0.00
0−0
.058
∗∗∗
−0.0
57∗∗
∗−0
.010
−0.0
170.
208∗∗
∗−0
.003
−0.0
1329
SIC
3674
0.01
510.
1219
01
0.02
2−0
.017
−0.0
47∗∗
∗−0
.072
∗∗∗
−0.0
080.
011
0.12
0∗∗∗
0.05
6∗∗∗
0.06
8∗∗∗
30SI
C37
140.
0259
0.15
890
1−0
.027
0.01
4−0
.094
∗∗∗
0.01
3−0
.066
∗∗∗
0.05
0∗∗∗
0.07
9∗∗∗
−0.0
33∗
−0.0
27∗
31SI
C38
120.
0124
0.11
060
10.
019
0.02
0−0
.084
∗∗∗
0.04
0∗∗0.
017
−0.0
260.
108∗∗
∗−0
.059
∗∗∗
−0.0
55∗∗
∗
32SI
C38
410.
0234
0.15
120
10.
004
0.03
0−0
.100
∗∗∗
−0.0
28∗
−0.0
46∗∗
∗−0
.104
∗∗∗
0.23
8∗∗∗
0.00
60.
000
33SI
C38
450.
0193
0.13
770
10.
000
−0.0
20−0
.031
∗∗∗
−0.0
73∗∗
∗0.
040∗∗
−0.0
61∗∗
∗−0
.015
0.08
2∗∗∗
0.07
6∗∗∗
34SI
C38
610.
0073
0.08
540
10.
004
0.01
6−0
.076
∗∗∗
0.00
10.
082∗∗
∗0.
043∗
0.15
7∗∗∗
−0.0
14−0
.016
35SI
C42
1X0.
0253
0.15
720
10.
005
0.00
9−0
.098
∗∗∗
−0.0
94∗∗
∗0.
045∗∗
∗0.
040∗
0.04
7∗∗∗
−0.0
21−0
.021
36SI
C45
120.
0093
0.09
590
10.
025
0.01
2−0
.071
∗∗∗
−0.0
55∗∗
∗−0
.032
∗0.
003
−0.0
64∗∗
∗−0
.100
∗∗∗
−0.0
96∗∗
∗
37SI
C48
1X0.
0547
0.22
750
1−0
.009
0.01
80.
072∗∗
∗−0
.036
∗∗−0
.102
∗∗∗
−0.1
13∗∗
∗−0
.221
∗∗∗
0.06
2∗∗∗
0.05
3∗∗∗
38SI
C48
330.
0054
0.07
340
10.
006
0.00
0−0
.073
∗∗∗
0.01
2−0
.030
∗−0
.047
∗∗∗
0.14
9∗∗∗
−0.0
72∗∗
∗−0
.069
∗∗∗
39SI
C49
110.
0128
0.11
230
1−0
.013
0.00
6−0
.017
−0.0
26−0
.040
∗∗0.
035∗
−0.2
35∗∗
∗0.
023
0.02
740
SIC
5311
0.02
050.
1417
01
−0.0
01−0
.013
−0.1
13∗∗
∗0.
042∗∗
−0.0
030.
147∗∗
∗0.
069∗∗
∗−0
.026
−0.0
2241
SIC
5411
0.05
990.
2374
01
−0.0
37∗
−0.0
06−0
.143
∗∗∗
−0.0
83∗∗
∗−0
.034
∗0.
238∗∗
∗−0
.195
∗∗∗
−0.0
47∗∗
∗−0
.031
∗
42SI
C58
120.
0567
0.23
120
1−0
.024
0.00
50.
024
−0.0
63∗∗
∗−0
.057
∗∗∗
0.03
4∗−0
.081
∗∗∗
0.00
70.
000
43SI
C60
2X0.
0422
0.20
100
10.
039∗∗
0.01
30.
308∗∗
∗−0
.122
∗∗∗
−0.0
79∗∗
∗0.
044∗∗
−0.3
44∗∗
∗−0
.105
∗∗∗
−0.1
06∗∗
∗
44SI
C62
110.
0193
0.13
770
1−0
.008
−0.0
15−0
.093
∗∗∗
0.01
90.
092∗∗
∗0.
011
0.16
6∗∗∗
−0.0
04−0
.005
45SI
C63
110.
0151
0.12
190
10.
004
−0.0
15−0
.089
∗∗∗
0.15
1∗∗∗
0.06
2∗∗∗
0.11
2∗∗∗
0.01
40.
039∗∗
0.04
1∗∗
46SI
C70
110.
0315
0.17
470
1−0
.014
0.00
2−0
.130
∗∗∗
0.10
0∗∗∗
0.07
7∗∗∗
−0.0
080.
269∗∗
∗−0
.049
∗∗∗
−0.0
52∗∗
∗
47SI
C73
1X0.
0015
0.03
930
10.
013
0.00
0−0
.041
∗∗∗
−0.0
230.
019
−0.0
010.
015
−0.0
42∗∗
−0.0
40∗∗
48SI
C73
720.
0236
0.15
180
1−0
.001
−0.0
070.
051∗∗
∗−0
.091
∗∗∗
−0.0
19−0
.011
−0.0
72∗∗
∗0.
097∗∗
∗0.
088∗∗
∗
49SI
C78
120.
0019
0.04
390
1−0
.011
0.00
0−0
.034
∗∗0.
075∗∗
∗0.
141∗∗
∗0.
061∗∗
∗0.
050∗∗
∗0.
036∗∗
0.03
6∗∗
aB
ivar
iate
corr
elat
ions
for
indu
stry
dum
my
vari
able
som
itted
.T
heR
OA
sam
ple
cont
aine
d43
76to
tal
spel
lsan
dth
eTo
bin’
sq
sam
ple
cont
aine
d14
36to
tal
spel
ls.
∗∗∗
Sign
ifica
ntat
the
0.00
1le
vel
∗∗Si
gnifi
cant
atth
e0.
01le
vel
∗Si
gnifi
cant
atth
e0.
05le
vel
Copyright 2005 John Wiley & Sons, Ltd. Strat. Mgmt. J., 26: 887–911 (2005)
900 R. R. Wiggins and T. W. Ruefli
Tabl
e3.
Des
crip
tive
stat
istic
sfo
ral
lin
dust
ries
incl
udin
gm
odal
and
supe
rior
stra
tast
atis
tics
for
RO
Aan
dTo
bin’
sq
1974
–97
SIC
Indu
stry
nam
e1 N
2A
vgn
RO
A
3To
tal
spel
lsR
OA
4PS
Psp
ells
RO
A
5%
PSP
spel
lsR
OA
6#P
SPfir
ms
RO
A
7PS
Pra
tioR
OA
8M
odal
mea
nR
OA
9M
odal
S.D
.R
OA
10 SP mea
nR
OA
11 SP S.D
.R
OA
12A
vgn
(q)
13 Tota
lsp
ells
q
14 PSP
spel
lsq
15%
PSP
spel
lsq
16#P
SPfir
ms
q
17 PSP
ratio q
18M
odal
mea
nq
19M
odal
S.D
.q
20 SP mea
nq
21 SP S.D
.q
1000
Met
alM
inin
g66
21.4
542
937
8.62
%5
7.58
%−1
2.87
73.7
113
.54
32.7
414
.70
294
72.
38%
11.
52%
2.10
8.44
12.2
522
.45
104x
Gol
dan
dSi
lver
Ore
s18
057
.35
1147
106
9.24
%14
7.78
%−3
2.08
705.
768.
2519
.74
45.7
091
423
2.52
%3
1.67
%−5
.02
243.
216.
4510
.05
1311
Cru
dePe
trol
eum
and
Nat
ural
Gas
739
234.
2546
8532
76.
98%
395.
28%
−9.0
725
7.15
8.26
18.0
217
1.30
3426
157
4.58
%18
2.44
%1.
8410
1.26
10.4
265
.92
1531
Ope
rativ
eB
uild
ers
107
43.6
087
225
2.87
%3
2.80
%0.
5416
.08
9.10
8.03
33.5
567
10
0.00
%0
0.00
%0.
934.
012.
411.
6826
21Pa
per
Mill
s39
23.1
546
355
11.8
8%5
12.8
2%4.
237.
2711
.03
3.24
19.9
539
927
6.77
%3
7.69
%1.
220.
572.
490.
9926
7xPa
per
and
Pape
rboa
rd70
27.1
054
239
7.20
%2
4.29
%3.
7910
.90
12.8
96.
1322
.40
448
419.
15%
34.
29%
1.55
3.89
5.63
12.9
827
11N
ewsp
aper
Publ
ishi
ngan
dPr
intin
g44
17.9
035
817
4.75
%2
4.55
%8.
255.
3012
.23
2.66
14.7
529
519
6.44
%2
4.55
%2.
384.
744.
282.
00
2721
Peri
odic
alPu
blis
hing
3811
.55
231
4519
.48%
410
.53%
−1.7
223
.02
9.65
6.81
8.20
164
3621
.95%
37.
89%
2.21
8.06
3.85
2.40
2731
Boo
kPu
blis
hing
4718
.10
362
4211
.60%
510
.64%
4.09
8.12
11.0
25.
7413
.65
273
72.
56%
12.
13%
1.56
1.01
3.78
2.14
2834
Phar
mac
eutic
als
258
82.6
016
5231
919
.31%
3212
.40%
−16.
6145
.89
10.8
99.
0069
.45
1389
104
7.49
%13
5.04
%4.
1311
.76
12.9
421
.00
2835
InV
itro
InV
ivo
Dia
gnos
tics
112
32.8
065
610
115
.40%
119.
82%
−59.
5448
1.25
−2.8
245
.76
24.7
049
47
1.42
%1
0.89
%3.
4924
.56
13.8
734
.87
2851
Pain
tsan
dA
llied
Prod
ucts
2211
.10
222
2712
.16%
29.
09%
5.59
10.5
210
.91
3.69
8.85
177
84.
52%
14.
55%
1.64
0.88
8.92
25.2
0
2911
Petr
oleu
mR
efini
ng85
43.3
586
78
0.92
%1
1.18
%4.
324.
849.
044.
5635
.85
717
375.
16%
55.
88%
1.11
12.4
511
.49
66.9
630
89M
isc.
Plas
ticPr
oduc
ts10
737
.75
755
7710
.20%
76.
54%
2.36
7.33
9.75
3.40
30.0
060
049
8.17
%6
5.61
%1.
331.
996.
3214
.13
331x
Stee
lW
orks
and
Bla
stFu
rnac
es11
849
.30
986
414.
16%
43.
39%
1.74
10.1
49.
554.
8039
.60
792
688.
59%
65.
08%
0.76
5.20
2.11
1.24
355x
Spec
ial
Indu
stri
alM
achi
nery
160
48.1
596
326
2.70
%4
2.50
%0.
3915
.79
11.0
18.
0339
.60
792
283.
54%
42.
50%
1.16
12.9
55.
8818
.26
357x
Offi
ceE
quip
men
tan
dE
lec.
Com
putin
g55
716
1.30
3226
183
5.67
%22
3.95
%−3
.96
43.7
811
.97
7.34
131.
3026
2696
3.66
%12
2.15
%1.
3849
.62
7.73
62.9
1
365x
Hou
seho
ldA
udio
and
Vid
eoE
quip
men
t87
23.9
547
929
6.05
%4
4.60
%0.
6111
.27
9.61
4.67
18.8
537
719
5.04
%3
3.45
%1.
553.
416.
7915
.26
3661
Tele
phon
ean
dTe
legr
aph
Equ
ipm
ent
164
48.9
597
962
6.33
%8
4.88
%−2
.65
20.7
511
.07
8.62
39.3
078
60
0.00
%0
0.00
%0.
4147
.46
9.52
20.4
7
3674
Sem
icon
duct
ors
and
Rel
ated
Dev
ices
159
50.2
510
0544
4.38
%7
4.40
%1.
5317
.03
12.2
74.
8642
.50
850
161.
88%
21.
26%
2.24
4.31
4.33
6.28
Copyright 2005 John Wiley & Sons, Ltd. Strat. Mgmt. J., 26: 887–911 (2005)
Schumpeter’s Ghost 901
3714
Aut
oPa
rts
and
Acc
esso
ries
133
44.4
088
889
10.0
2%7
5.26
%2.
5520
.65
59.2
510
41.6
435
.95
719
233.
20%
32.
26%
1.43
3.38
3.27
2.21
3812
Nav
igat
ion
and
Gui
danc
eSy
stem
s69
30.4
560
936
5.91
%4
5.80
%3.
6910
.71
11.6
55.
2925
.80
516
122.
33%
22.
90%
2.05
5.03
7.21
11.8
7
3841
Surg
ical
and
Med
ical
Equ
ipm
ent
159
40.8
581
774
9.06
%8
5.03
%−3
.19
45.8
512
.25
7.08
30.3
060
622
3.63
%3
1.89
%4.
4833
.04
19.8
661
.18
3845
Ele
ctro
med
ical
App
arat
us18
550
.75
1015
717.
00%
73.
78%
−8.2
030
.12
10.8
06.
9339
.30
786
243.
05%
31.
62%
6.62
91.7
443
.84
255.
41
3861
Phot
ogra
phic
Equ
ipm
ent
and
Supp
lies
6624
.40
488
275.
53%
34.
55%
−0.3
729
.36
10.3
74.
6318
.05
361
61.
66%
11.
52%
2.23
7.02
6.17
10.8
1
421x
Tru
ckin
g(e
xcep
tlo
cal)
148
42.1
584
391
10.7
9%9
6.08
%1.
6212
.50
9.76
3.85
30.0
560
123
3.83
%3
2.03
%1.
5012
.60
4.59
30.1
645
12A
irlin
es11
033
.80
676
284.
14%
43.
64%
−1.5
620
.00
6.38
9.41
25.2
050
40
0.00
%0
0.00
%1.
606.
414.
589.
5348
1xTe
leph
one
Com
mun
icat
ions
305
117.
0023
4024
010
.26%
278.
85%
5.05
6.56
9.93
4.61
45.6
091
275
8.22
%9
2.95
%2.
1323
.21
11.6
346
.89
4833
Tele
visi
onB
road
cast
Stat
ions
7520
.15
403
235.
71%
34.
00%
2.97
15.0
911
.03
6.35
15.5
531
10
0.00
%0
0.00
%2.
318.
386.
097.
04
4911
Ele
ctri
cal
Serv
ices
168
71.5
514
3148
3.35
%5
2.98
%4.
181.
415.
711.
6763
.55
1271
80.
63%
10.
60%
1.14
0.95
1.64
2.93
5311
Dep
artm
ent
Stor
es78
29.7
559
571
11.9
3%7
8.97
%2.
867.
057.
433.
2122
.45
449
194.
23%
22.
56%
0.92
8.65
2.90
15.6
954
11G
roce
rySt
ores
133
45.0
590
117
819
.76%
1410
.53%
3.26
4.49
9.24
3.45
35.7
071
498
13.7
3%10
7.52
%2.
3538
.93
3.01
1.95
5812
Eat
ing
Plac
es31
691
.75
1835
227
12.3
7%20
6.33
%0.
2313
.82
10.7
86.
6268
.80
1376
282.
98%
51.
58%
2.11
4.71
6.23
36.0
760
2xC
omm
erci
alB
anks
678
203.
3540
6712
02.
95%
131.
92%
0.73
1.37
1.26
2.99
190.
3538
0745
1.18
%6
0.88
%1.
120.
651.
810.
8962
11Se
curi
ties
Bro
kers
and
Dea
lers
107
37.9
575
968
8.96
%7
6.54
%−0
.68
34.8
85.
858.
1430
.95
619
142.
26%
10.
93%
1.20
1.15
3.68
2.74
6311
Lif
eIn
sura
nce
103
33.4
066
848
7.19
%5
4.85
%1.
682.
513.
832.
3531
.35
627
203.
19%
32.
91%
1.00
0.60
2.22
1.29
7011
Hot
els
and
Mot
els
102
35.2
070
411
716
.62%
109.
80%
−1.0
730
.81
7.65
7.95
21.5
543
122
5.10
%2
1.96
%1.
403.
014.
145.
3173
1xA
dver
tisin
gA
genc
ies
6414
.25
285
72.
46%
11.
56%
1.11
15.3
38.
763.
3011
.50
230
00.
00%
00.
00%
1.97
9.26
13.2
025
.71
7372
Prep
acka
ged
Soft
war
e51
275
.00
1500
996.
60%
132.
54%
−4.8
943
.10
15.9
18.
7554
.90
1098
312.
82%
40.
78%
4.83
32.6
714
.04
105.
5378
12M
otio
nPi
ctur
ePr
oduc
tion
102
24.9
049
810
2.01
%1
0.98
%−1
5.27
394.
814.
9415
.34
20.0
040
07
1.75
%1
0.98
%2.
5313
.85
5.72
17.2
7
Tota
ls/A
vera
ges
6772
4220
132
827.
78%
350
5.17
%10
.48
166.
3832
822
1239
3.77
%13
92.
16%
8.65
62.2
7
Copyright 2005 John Wiley & Sons, Ltd. Strat. Mgmt. J., 26: 887–911 (2005)
902 R. R. Wiggins and T. W. Ruefli
on means and averages. In his study referencedearlier, Waring (1996) went so far as to removeoutliers as a means of improving his autoregres-sive models of decay (Waring, 1996: 1262). Ourargument, on the other hand, holds that these veryoutliers, those firms that gained, then possiblylost superior performance, are of primary interest,which is another reason why we eschew autore-gressive models.
After the data were classified by the IKS analy-sis into three performance strata (superior, modal,and inferior), the modal and inferior strata werediscarded, and the rest of the analysis concen-trated solely on those firms in the superior stra-tum. Further, for the corporate-level hazard mod-els, we only include those firms that remain inthe superior stratum for 10 years—the firms thatachieved truly persistent superior economic per-formance. In other words, our analyses were drivenby the small but significant differences betweenthe firms that maintain persistent superior eco-nomic performance and those that attained it butlost it, as opposed to the very large differencesbetween above-average performers and averageand below-average performers used by all previousstudies.
Event history analysis
We tested Hypotheses 1 and 2 by using discretetime event history analysis techniques (Allison,1984; Tuma and Hannan, 1984) to estimate mod-els of the rates at which firms exit the superiorperformance stratum. In the study of discrete statechange processes, event history methods are con-sidered preferable to linear regression models, asthe major problem with linear regression modelsis their failure to account for the timing of statechanges—which may be relevant (Allison, 1995).Moreover, we were interested in the dependence ofthe hazard rate on time, which cannot be readilyaccomplished with linear regression models (Alli-son, 1995).
Event history analysis estimates a hazard func-tion that allows the calculation of the instantaneousrate of change for a firm at time t . In the case ofpersistent superior economic performance (PSP),the hazard function was defined as follows:
h(t) = lim�t→0
Pr[∼PSP t, t + �t |PSPat t]
�t
where Pr[∼PSP t, t + �t |PSPat t] is the proba-bility of a firm exiting the superior performancestratum between time t and time t + �t , if andonly if the firm is in the superior performance stra-tum at time t . Firm transition rates were estimatedusing discrete time maximum likelihood models(Allison, 1984;, 1995), which apply logistic regres-sion to the analysis of time-series data.
Pattern analysis
To test Hypothesis 3 it was necessary to exam-ine the patterns of superior and not-superior per-formance over time. If firms were increasinglyforced by creative destruction to seek a series ofshort-term competitive advantages, those that weremost successful would be expected to concate-nate them in a seamless fashion, one followingthe other, so the effect on performance would notbe distinguishable from that achieved by a singlesustained competitive advantage. Thus the datasethere would not allow for a test of this type ofsuccess. On the other hand, it would be expectedthat superior performing firms which were lesssuccessful in concatenating a series of advantageswould reveal themselves by occasionally failingto achieve it, giving them a period of less thansuperior performance, following which superiorperformance would resume. This would give a per-formance pattern of superior, then not superior,then superior performance over time. If the asser-tions surrounding hypercompetition were true, thispattern should become significantly more preva-lent over time. In the context of the methodologyemployed here, the fraction of firms that wereabove modal performance levels then fell to abelow superior performance level for one 5-yearperiod and then rose back into the superior per-formance strata should increase over the studyperiod. To test Hypothesis 3, therefore, for bothperformance measures the incidence of the patternsuperior performance, then modal or below per-formance, then superior performance was notedin each three-period window as the window wasrolled through the 24 periods in the study. Thesenumbers were then subjected to a 2 × 2 contin-gency analysis that compared the incidence andnon-incidence of the pattern in the first and last10 three-period windows of the study. The likeli-hood ratio chi-square test of association was thenemployed for the patterns produced by ROA andby Tobin’s q.
Copyright 2005 John Wiley & Sons, Ltd. Strat. Mgmt. J., 26: 887–911 (2005)
Schumpeter’s Ghost 903
RESULTS
As the first step toward testing the hypotheses, thetwo sets of 40 industry samples were individuallystratified with the iterative Kolmogorov–Smirnovmethod as previously described. For each samplethis method formed multiple strata of statisticallysignificantly different performance levels. Table 4shows the modal strata means and standard devi-ations for both samples for all 40 industries incolumns 3 and 4 (ROA) and columns 13 and 14(Tobin’s q), and the above-average or superiorperformance (SP) strata means and standard devi-ations in columns 10 and 11 (ROA) and 20 and21 (Tobin’s q). The strata sizes were consistentbetween the two measures of performance. Thesegment-level data were similarly stratified at thethree levels of analysis (industry, corporate, andSBU) to determine the superior performing indus-tries, corporations, and SBUs. We retained only thesuperior performance strata to conduct the analysesto test Hypotheses 1 and 2.
Hypothesis 1: Hypercompetition andpersistence
Hypothesis 1 was represented in the model by thetime variable Period. For both performance mea-sures, the hazard of exiting the persistent supe-rior performance stratum did indeed significantlyincrease over time, as shown in Tables 4 and 5for the corporate-level sample, and Table 6 forthe business unit-level sample. Hypothesis 1 wasthus supported. (Note: the corporate event historymodels were also estimated with non-linear timeaxes, just as the business unit models were, butthe effect in these samples proved to be linear,so only the linear models are reported here.) Ascan be seen from the first column of Tables 4and 5 (All models), the hazard rate for the ROAsample increased more rapidly than the hazardrate for the Tobin’s q sample, indicating that atthe corporate level accounting performance wasmore affected by Schumpeterian dynamics thanwas market performance. Table 6 shows that whilethe hazard rate at the business unit level increasedmore slowly than at the corporate or industrylevel, at all three levels the hazard of losingsuperior performance positions was significantlyincreasing over time (although at a very slightlydecreasing rate, as indicated by the non-linear timeaxis).
Hypothesis 2: Hypercompetition acrossmultiple industries
Because none of the 3- and 4-digit industries con-tained enough spells of persistent superior eco-nomic performance to yield adequate statisticalpower, Hypothesis 2 was examined in two ways.First, the overall samples were divided into ‘high-tech’ industries (SIC codes 357x, 365x, 3661,3674, 481x, and 7372) and ‘low-tech’ industries(all other SIC codes). Second, the 40 industrysamples were aggregated to the 1-digit SIC level,yielding seven 1-digit industries. The ‘low-tech’models shown in Tables 4 and 5 show that forboth performance measures the hazard of exit wasstatistically significantly increasing for the non-high-technology industries over time, although themagnitude of the hazard was lower than for thehigh-tech industries. This supports Hypothesis 2.The industry models (which contain significantlyfewer spells than the total sample and are there-fore less powerful) show more mixed results byperformance measure. Table 4 shows that for onlytwo of the six industries with sufficient data wasthe Tobin’s q Period variable significant (in partbecause these subsamples contain few spells), pro-viding little additional support for Hypothesis 2.However, Table 5 shows that for six of the sevenindustries the ROA Period variable was statisti-cally significant at the 0.05 level or better, pro-viding additional support for Hypothesis 2. Thephenomenon was not limited to high-technologyindustries, although they appear to be affectedmore strongly.
Hypothesis 3: Hypercompetition and series oftemporary competitive advantages
The results for the likelihood ratio chi-square testof association for the patterns (superior, then lessthan superior, then superior performance) pro-duced for ROA and for Tobin’s q are given inTable 7. Here it can be seen that the chi-squaresare significant in both cases at the α = 0.001 level,indicating that the performance pattern is relativelymore prevalent in the last decade of the study thanit was in the prior decade. Thus Hypothesis 3 issupported.
DISCUSSION AND IMPLICATIONS
The results presented above provide evidence thatperiods of sustained competitive advantage, as
Copyright 2005 John Wiley & Sons, Ltd. Strat. Mgmt. J., 26: 887–911 (2005)
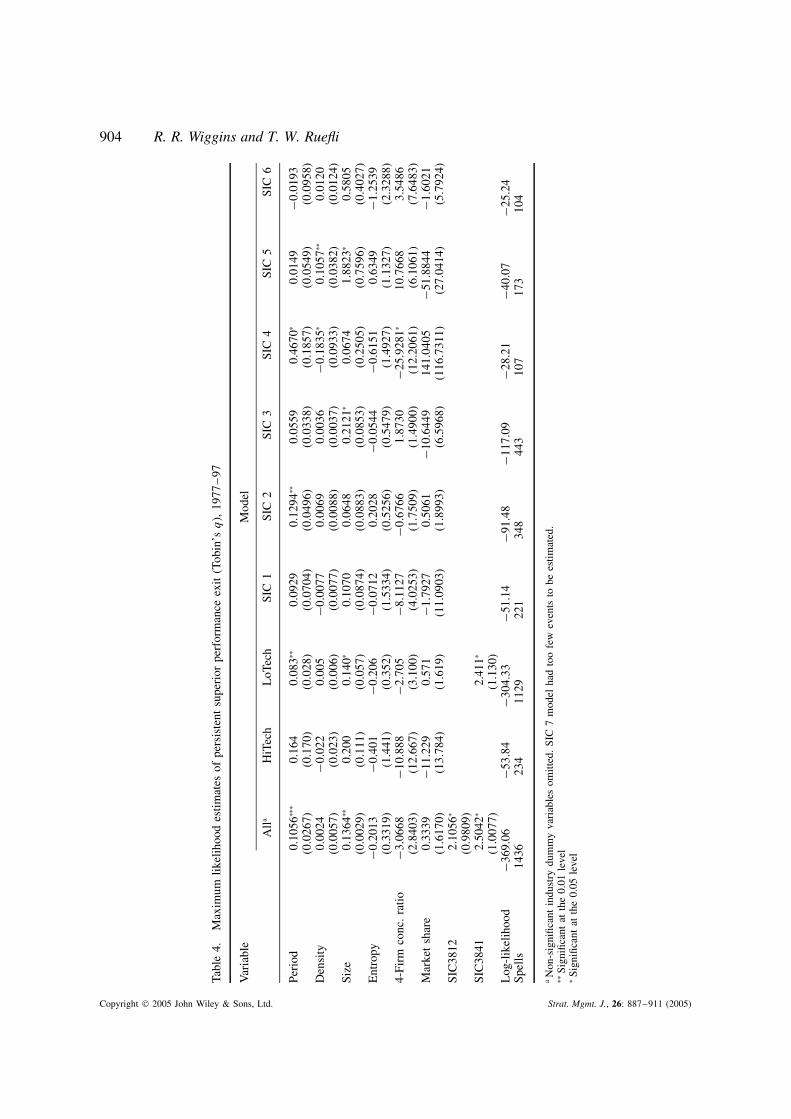
904 R. R. Wiggins and T. W. Ruefli
Tabl
e4.
Max
imum
likel
ihoo
des
timat
esof
pers
iste
ntsu
peri
orpe
rfor
man
ceex
it(T
obin
’sq
),19
77–
97
Var
iabl
eM
odel
All
aH
iTec
hL
oTec
hSI
C1
SIC
2SI
C3
SIC
4SI
C5
SIC
6
Peri
od0.
1056
∗∗∗
0.16
40.
083∗∗
0.09
290.
1294
∗∗0.
0559
0.46
70∗
0.01
49−0
.019
3(0
.026
7)(0
.170
)(0
.028
)(0
.070
4)(0
.049
6)(0
.033
8)(0
.185
7)(0
.054
9)(0
.095
8)D
ensi
ty0.
0024
−0.0
220.
005
−0.0
077
0.00
690.
0036
−0.1
835∗
0.10
57∗∗
0.01
20(0
.005
7)(0
.023
)(0
.006
)(0
.007
7)(0
.008
8)(0
.003
7)(0
.093
3)(0
.038
2)(0
.012
4)Si
ze0.
1364
∗∗0.
200
0.14
0∗0.
1070
0.06
480.
2121
∗0.
0674
1.88
23∗
0.58
05(0
.002
9)(0
.111
)(0
.057
)(0
.087
4)(0
.088
3)(0
.085
3)(0
.250
5)(0
.759
6)(0
.402
7)E
ntro
py−0
.201
3−0
.401
−0.2
06−0
.071
20.
2028
−0.0
544
−0.6
151
0.63
49−1
.253
9(0
.331
9)(1
.441
)(0
.352
)(1
.533
4)(0
.525
6)(0
.547
9)(1
.492
7)(1
.132
7)(2
.328
8)4-
Firm
conc
.ra
tio−3
.066
8−1
0.88
8−2
.705
−8.1
127
−0.6
766
1.87
30−2
5.92
81∗
10.7
668
3.54
86(2
.840
3)(1
2.66
7)(3
.100
)(4
.025
3)(1
.750
9)(1
.490
0)(1
2.20
61)
(6.1
061)
(7.6
483)
Mar
ket
shar
e0.
3339
−11.
229
0.57
1−1
.792
70.
5061
−10.
6449
141.
0405
−51.
8844
−1.6
021
(1.6
170)
(13.
784)
(1.6
19)
(11.
0903
)(1
.899
3)(6
.596
8)(1
16.7
311)
(27.
0414
)(5
.792
4)SI
C38
122.
1056
∗
(0.9
809)
SIC
3841
2.50
42∗
2.41
1∗
(1.0
077)
(1.1
30)
Log
-lik
elih
ood
−369
.06
−53.
84−3
04.3
3−5
1.14
−91.
48−1
17.0
9−2
8.21
−40.
07−2
5.24
Spel
ls14
3623
411
2922
134
844
310
717
310
4
aN
on-s
igni
fican
tin
dust
rydu
mm
yva
riab
les
omitt
ed.
SIC
7m
odel
had
too
few
even
tsto
bees
timat
ed.
∗∗Si
gnifi
cant
atth
e0.
01le
vel
∗Si
gnifi
cant
atth
e0.
05le
vel
Copyright 2005 John Wiley & Sons, Ltd. Strat. Mgmt. J., 26: 887–911 (2005)
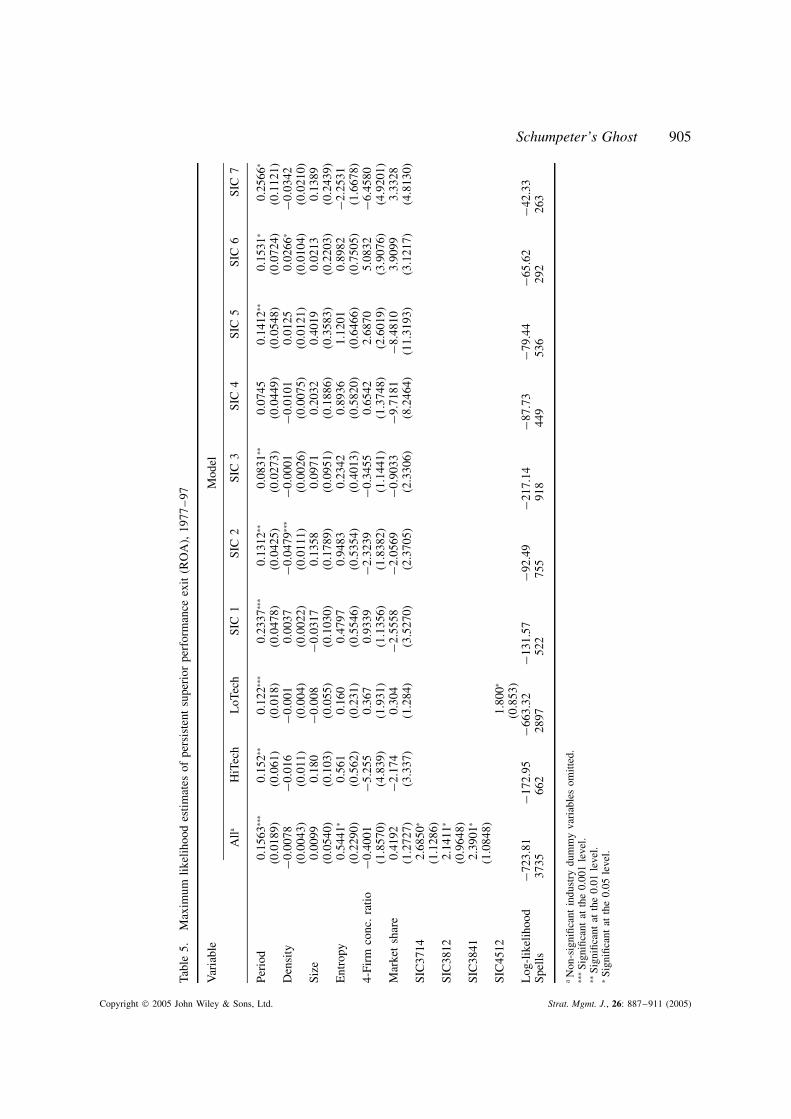
Schumpeter’s Ghost 905
Tabl
e5.
Max
imum
likel
ihoo
des
timat
esof
pers
iste
ntsu
peri
orpe
rfor
man
ceex
it(R
OA
),19
77–
97
Var
iabl
eM
odel
All
aH
iTec
hL
oTec
hSI
C1
SIC
2SI
C3
SIC
4SI
C5
SIC
6SI
C7
Peri
od0.
1563
∗∗∗
0.15
2∗∗0.
122∗∗
∗0.
2337
∗∗∗
0.13
12∗∗
0.08
31∗∗
0.07
450.
1412
∗∗0.
1531
∗0.
2566
∗
(0.0
189)
(0.0
61)
(0.0
18)
(0.0
478)
(0.0
425)
(0.0
273)
(0.0
449)
(0.0
548)
(0.0
724)
(0.1
121)
Den
sity
−0.0
078
−0.0
16−0
.001
0.00
37−0
.047
9∗∗∗
−0.0
001
−0.0
101
0.01
250.
0266
∗−0
.034
2(0
.004
3)(0
.011
)(0
.004
)(0
.002
2)(0
.011
1)(0
.002
6)(0
.007
5)(0
.012
1)(0
.010
4)(0
.021
0)Si
ze0.
0099
0.18
0−0
.008
−0.0
317
0.13
580.
0971
0.20
320.
4019
0.02
130.
1389
(0.0
540)
(0.1
03)
(0.0
55)
(0.1
030)
(0.1
789)
(0.0
951)
(0.1
886)
(0.3
583)
(0.2
203)
(0.2
439)
Ent
ropy
0.54
41∗
0.56
10.
160
0.47
970.
9483
0.23
420.
8936
1.12
010.
8982
−2.2
531
(0.2
290)
(0.5
62)
(0.2
31)
(0.5
546)
(0.5
354)
(0.4
013)
(0.5
820)
(0.6
466)
(0.7
505)
(1.6
678)
4-Fi
rmco
nc.
ratio
−0.4
001
−5.2
550.
367
0.93
39−2
.323
9−0
.345
50.
6542
2.68
705.
0832
−6.4
580
(1.8
570)
(4.8
39)
(1.9
31)
(1.1
356)
(1.8
382)
(1.1
441)
(1.3
748)
(2.6
019)
(3.9
076)
(4.9
201)
Mar
ket
shar
e0.
4192
−2.1
740.
304
−2.5
558
−2.0
569
−0.9
033
−9.7
181
−8.4
810
3.90
993.
3328
(1.2
727)
(3.3
37)
(1.2
84)
(3.5
270)
(2.3
705)
(2.3
306)
(8.2
464)
(11.
3193
)(3
.121
7)(4
.813
0)SI
C37
142.
6850
∗
(1.1
286)
SIC
3812
2.14
11∗
(0.9
648)
SIC
3841
2.39
01∗
(1.0
848)
SIC
4512
1.80
0∗
(0.8
53)
Log
-lik
elih
ood
−723
.81
−172
.95
−663
.32
−131
.57
−92.
49−2
17.1
4−8
7.73
−79.
44−6
5.62
−42.
33Sp
ells
3735
662
2897
522
755
918
449
536
292
263
aN
on-s
igni
fican
tin
dust
rydu
mm
yva
riab
les
omitt
ed.
∗∗∗
Sign
ifica
ntat
the
0.00
1le
vel.
∗∗Si
gnifi
cant
atth
e0.
01le
vel.
∗Si
gnifi
cant
atth
e0.
05le
vel.
Copyright 2005 John Wiley & Sons, Ltd. Strat. Mgmt. J., 26: 887–911 (2005)
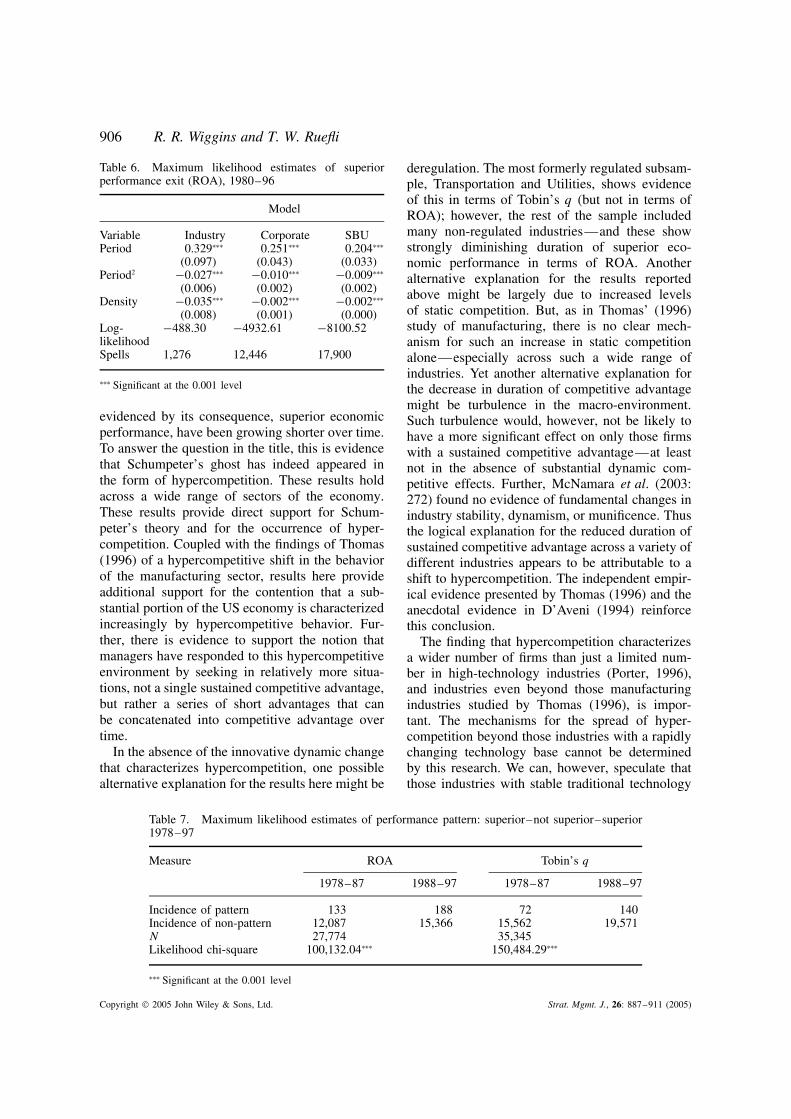
906 R. R. Wiggins and T. W. Ruefli
Table 6. Maximum likelihood estimates of superiorperformance exit (ROA), 1980–96
Model
Variable Industry Corporate SBUPeriod 0.329∗∗∗ 0.251∗∗∗ 0.204∗∗∗
(0.097) (0.043) (0.033)Period2 −0.027∗∗∗ −0.010∗∗∗ −0.009∗∗∗
(0.006) (0.002) (0.002)Density −0.035∗∗∗ −0.002∗∗∗ −0.002∗∗∗
(0.008) (0.001) (0.000)Log- −488.30 −4932.61 −8100.52likelihoodSpells 1,276 12,446 17,900
∗∗∗ Significant at the 0.001 level
evidenced by its consequence, superior economicperformance, have been growing shorter over time.To answer the question in the title, this is evidencethat Schumpeter’s ghost has indeed appeared inthe form of hypercompetition. These results holdacross a wide range of sectors of the economy.These results provide direct support for Schum-peter’s theory and for the occurrence of hyper-competition. Coupled with the findings of Thomas(1996) of a hypercompetitive shift in the behaviorof the manufacturing sector, results here provideadditional support for the contention that a sub-stantial portion of the US economy is characterizedincreasingly by hypercompetitive behavior. Fur-ther, there is evidence to support the notion thatmanagers have responded to this hypercompetitiveenvironment by seeking in relatively more situa-tions, not a single sustained competitive advantage,but rather a series of short advantages that canbe concatenated into competitive advantage overtime.
In the absence of the innovative dynamic changethat characterizes hypercompetition, one possiblealternative explanation for the results here might be
deregulation. The most formerly regulated subsam-ple, Transportation and Utilities, shows evidenceof this in terms of Tobin’s q (but not in terms ofROA); however, the rest of the sample includedmany non-regulated industries—and these showstrongly diminishing duration of superior eco-nomic performance in terms of ROA. Anotheralternative explanation for the results reportedabove might be largely due to increased levelsof static competition. But, as in Thomas’ (1996)study of manufacturing, there is no clear mech-anism for such an increase in static competitionalone—especially across such a wide range ofindustries. Yet another alternative explanation forthe decrease in duration of competitive advantagemight be turbulence in the macro-environment.Such turbulence would, however, not be likely tohave a more significant effect on only those firmswith a sustained competitive advantage—at leastnot in the absence of substantial dynamic com-petitive effects. Further, McNamara et al. (2003:272) found no evidence of fundamental changes inindustry stability, dynamism, or munificence. Thusthe logical explanation for the reduced duration ofsustained competitive advantage across a variety ofdifferent industries appears to be attributable to ashift to hypercompetition. The independent empir-ical evidence presented by Thomas (1996) and theanecdotal evidence in D’Aveni (1994) reinforcethis conclusion.
The finding that hypercompetition characterizesa wider number of firms than just a limited num-ber in high-technology industries (Porter, 1996),and industries even beyond those manufacturingindustries studied by Thomas (1996), is impor-tant. The mechanisms for the spread of hyper-competition beyond those industries with a rapidlychanging technology base cannot be determinedby this research. We can, however, speculate thatthose industries with stable traditional technology
Table 7. Maximum likelihood estimates of performance pattern: superior–not superior–superior1978–97
Measure ROA Tobin’s q
1978–87 1988–97 1978–87 1988–97
Incidence of pattern 133 188 72 140Incidence of non-pattern 12,087 15,366 15,562 19,571N 27,774 35,345Likelihood chi-square 100,132.04∗∗∗ 150,484.29∗∗∗
∗∗∗ Significant at the 0.001 level
Copyright 2005 John Wiley & Sons, Ltd. Strat. Mgmt. J., 26: 887–911 (2005)
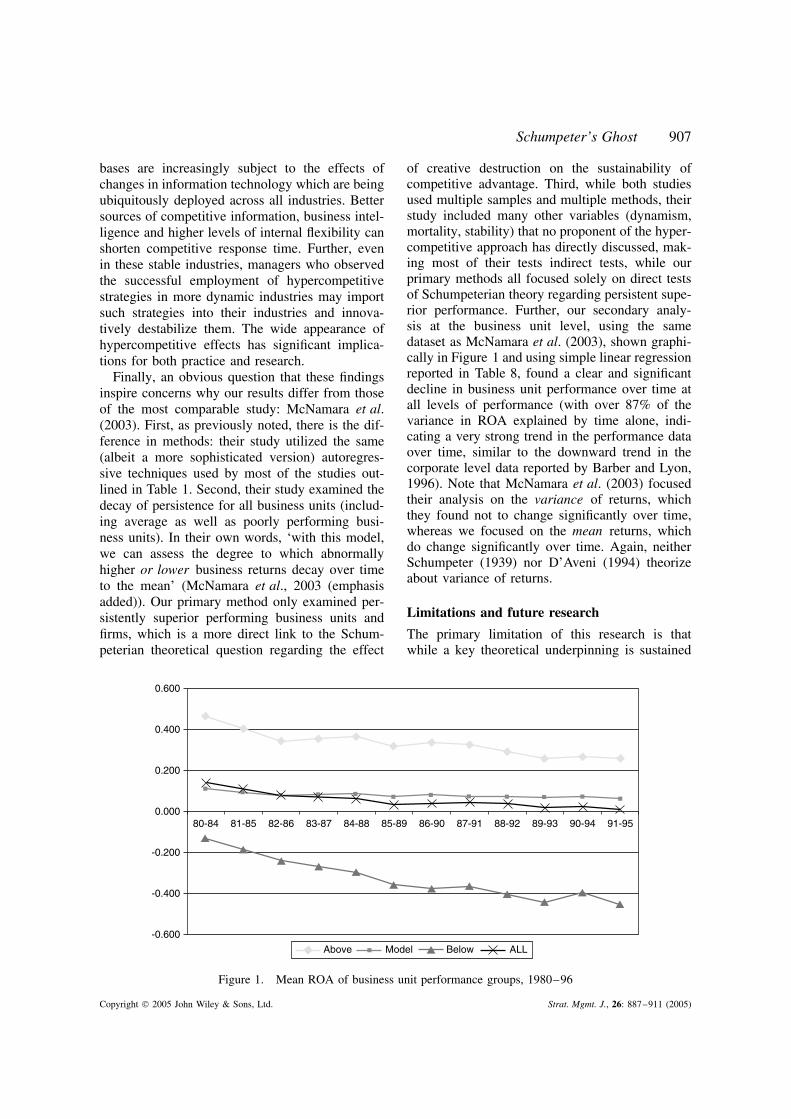
Schumpeter’s Ghost 907
bases are increasingly subject to the effects ofchanges in information technology which are beingubiquitously deployed across all industries. Bettersources of competitive information, business intel-ligence and higher levels of internal flexibility canshorten competitive response time. Further, evenin these stable industries, managers who observedthe successful employment of hypercompetitivestrategies in more dynamic industries may importsuch strategies into their industries and innova-tively destabilize them. The wide appearance ofhypercompetitive effects has significant implica-tions for both practice and research.
Finally, an obvious question that these findingsinspire concerns why our results differ from thoseof the most comparable study: McNamara et al.(2003). First, as previously noted, there is the dif-ference in methods: their study utilized the same(albeit a more sophisticated version) autoregres-sive techniques used by most of the studies out-lined in Table 1. Second, their study examined thedecay of persistence for all business units (includ-ing average as well as poorly performing busi-ness units). In their own words, ‘with this model,we can assess the degree to which abnormallyhigher or lower business returns decay over timeto the mean’ (McNamara et al., 2003 (emphasisadded)). Our primary method only examined per-sistently superior performing business units andfirms, which is a more direct link to the Schum-peterian theoretical question regarding the effect
of creative destruction on the sustainability ofcompetitive advantage. Third, while both studiesused multiple samples and multiple methods, theirstudy included many other variables (dynamism,mortality, stability) that no proponent of the hyper-competitive approach has directly discussed, mak-ing most of their tests indirect tests, while ourprimary methods all focused solely on direct testsof Schumpeterian theory regarding persistent supe-rior performance. Further, our secondary analy-sis at the business unit level, using the samedataset as McNamara et al. (2003), shown graphi-cally in Figure 1 and using simple linear regressionreported in Table 8, found a clear and significantdecline in business unit performance over time atall levels of performance (with over 87% of thevariance in ROA explained by time alone, indi-cating a very strong trend in the performance dataover time, similar to the downward trend in thecorporate level data reported by Barber and Lyon,1996). Note that McNamara et al. (2003) focusedtheir analysis on the variance of returns, whichthey found not to change significantly over time,whereas we focused on the mean returns, whichdo change significantly over time. Again, neitherSchumpeter (1939) nor D’Aveni (1994) theorizeabout variance of returns.
Limitations and future research
The primary limitation of this research is thatwhile a key theoretical underpinning is sustained
0.600
0.400
0.200
0.000
-0.200
-0.400
-0.600
80-84 81-85 82-86 83-87 84-88 85-89 86-90 87-91 88-92 89-93 90-94 91-95
Above Model Below ALL
Figure 1. Mean ROA of business unit performance groups, 1980–96
Copyright 2005 John Wiley & Sons, Ltd. Strat. Mgmt. J., 26: 887–911 (2005)
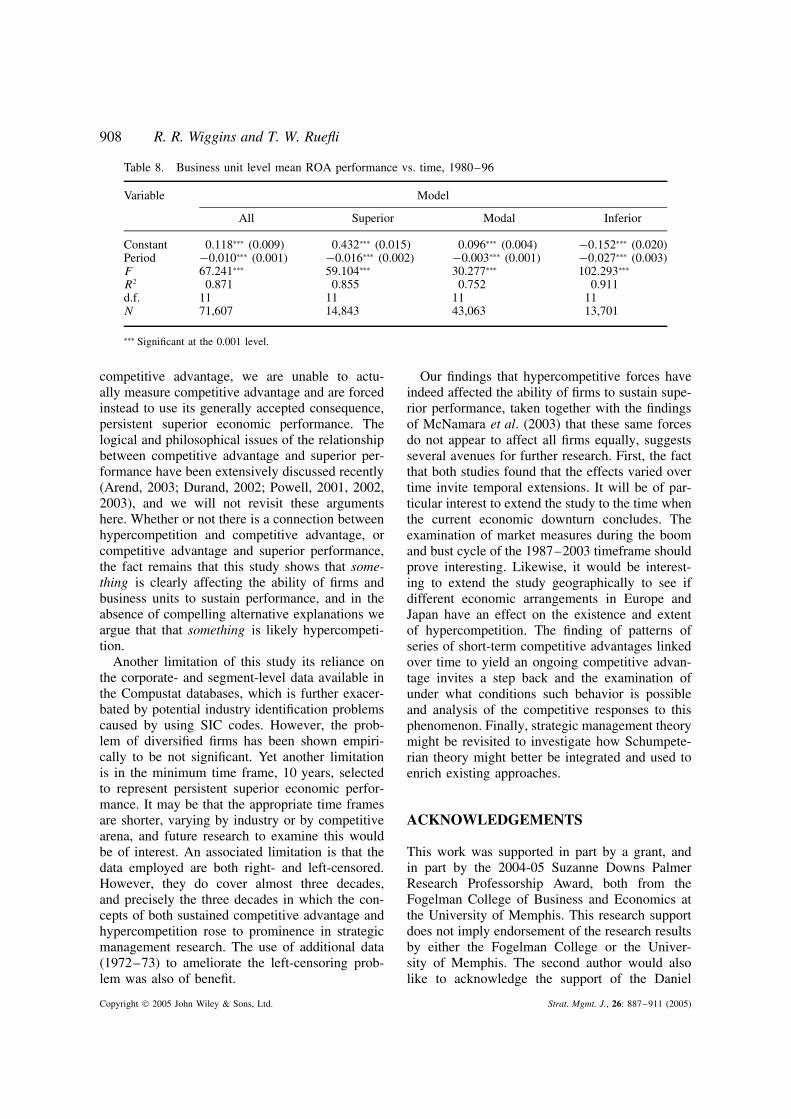
908 R. R. Wiggins and T. W. Ruefli
Table 8. Business unit level mean ROA performance vs. time, 1980–96
Variable Model
All Superior Modal Inferior
Constant 0.118∗∗∗ (0.009) 0.432∗∗∗ (0.015) 0.096∗∗∗ (0.004) −0.152∗∗∗ (0.020)Period −0.010∗∗∗ (0.001) −0.016∗∗∗ (0.002) −0.003∗∗∗ (0.001) −0.027∗∗∗ (0.003)F 67.241∗∗∗ 59.104∗∗∗ 30.277∗∗∗ 102.293∗∗∗
R2 0.871 0.855 0.752 0.911d.f. 11 11 11 11N 71,607 14,843 43,063 13,701
∗∗∗ Significant at the 0.001 level.
competitive advantage, we are unable to actu-ally measure competitive advantage and are forcedinstead to use its generally accepted consequence,persistent superior economic performance. Thelogical and philosophical issues of the relationshipbetween competitive advantage and superior per-formance have been extensively discussed recently(Arend, 2003; Durand, 2002; Powell, 2001, 2002,2003), and we will not revisit these argumentshere. Whether or not there is a connection betweenhypercompetition and competitive advantage, orcompetitive advantage and superior performance,the fact remains that this study shows that some-thing is clearly affecting the ability of firms andbusiness units to sustain performance, and in theabsence of compelling alternative explanations weargue that that something is likely hypercompeti-tion.
Another limitation of this study its reliance onthe corporate- and segment-level data available inthe Compustat databases, which is further exacer-bated by potential industry identification problemscaused by using SIC codes. However, the prob-lem of diversified firms has been shown empiri-cally to be not significant. Yet another limitationis in the minimum time frame, 10 years, selectedto represent persistent superior economic perfor-mance. It may be that the appropriate time framesare shorter, varying by industry or by competitivearena, and future research to examine this wouldbe of interest. An associated limitation is that thedata employed are both right- and left-censored.However, they do cover almost three decades,and precisely the three decades in which the con-cepts of both sustained competitive advantage andhypercompetition rose to prominence in strategicmanagement research. The use of additional data(1972–73) to ameliorate the left-censoring prob-lem was also of benefit.
Our findings that hypercompetitive forces haveindeed affected the ability of firms to sustain supe-rior performance, taken together with the findingsof McNamara et al. (2003) that these same forcesdo not appear to affect all firms equally, suggestsseveral avenues for further research. First, the factthat both studies found that the effects varied overtime invite temporal extensions. It will be of par-ticular interest to extend the study to the time whenthe current economic downturn concludes. Theexamination of market measures during the boomand bust cycle of the 1987–2003 timeframe shouldprove interesting. Likewise, it would be interest-ing to extend the study geographically to see ifdifferent economic arrangements in Europe andJapan have an effect on the existence and extentof hypercompetition. The finding of patterns ofseries of short-term competitive advantages linkedover time to yield an ongoing competitive advan-tage invites a step back and the examination ofunder what conditions such behavior is possibleand analysis of the competitive responses to thisphenomenon. Finally, strategic management theorymight be revisited to investigate how Schumpete-rian theory might better be integrated and used toenrich existing approaches.
ACKNOWLEDGEMENTS
This work was supported in part by a grant, andin part by the 2004-05 Suzanne Downs PalmerResearch Professorship Award, both from theFogelman College of Business and Economics atthe University of Memphis. This research supportdoes not imply endorsement of the research resultsby either the Fogelman College or the Univer-sity of Memphis. The second author would alsolike to acknowledge the support of the Daniel
Copyright 2005 John Wiley & Sons, Ltd. Strat. Mgmt. J., 26: 887–911 (2005)
Schumpeter’s Ghost 909
Stuart Endowment and the Herb Kelleher Cen-ter for Entrepreneurship at the McCombs Schoolof the University of Texas at Austin. The authorswish to thank Jay Barney, Jan Beyer, Ming-JerChen, Kathleen Conner, W. W. Cooper, RichardD’Aveni, Allison Davis-Blake, Janet Dukerich,Kathleen Eisenhardt, Frances Hauge Fabian, RobFolger, Brian Golden, Jovan Grahovac, Ira Har-ris, Michael Hitt, David Jemison, Preston McAfee,Reuben McDaniel, Gerry McNamara, Hao Ma,Richard Makadok, Paul Mang, Robert Nixon, GregNorthcraft, David Schkade, Herb Simon, PaulVaaler, Jack Walters, seminar participants at TexasChristian University, the University of Memphis,the University of Missouri, the University of Texasat Dallas, and the University of Texas at Austin,as well as the anonymous referees for commentsand suggestions on earlier versions of this research.Special thanks to Andy Henderson for method-ological assistance.
REFERENCES
Allison PD. 1984. Event History Analysis: Regression forLongitudinal Event Data . Sage: Beverly Hills, CA.
Allison PD. 1995. Survival Analysis Using the SASSystem: A Practical Guide. SAS Institute: Cary, NC.
Arend RJ. 2003. Revisiting the logical and researchconsiderations of competitive advantage. StrategicManagement Journal 24(3): 279–284.
Argresti A. 1984. Analysis of Ordinal Categorical Data .Wiley: New York.
Bain JS. 1959. Industrial Organization . Wiley: NewYork.
Barber BM, Lyon JD. 1996. Detecting abnormal operat-ing performance: the empirical power and specifica-tion of test statistics. Journal of Financial Economics41(3): 359–399.
Barney JB. 1991. Firm resources and sustained competi-tive advantage. Journal of Management 17: 99–120.
Besanko D, Dranove D, Shanley M. 1996. The Eco-nomics of Strategy . Wiley: New York.
Brown SL, Eisenhardt KM. 1997. The art of continuouschange: linking complexity theory and time-pacedevolution in relentlessly shifting organizations.Administrative Science Quarterly 42(1): 1–34.
Brown SL, Eisenhardt KM. 1998. Competing on theEdge: Strategy as Structured Chaos . Harvard BusinessSchool Press: Boston, MA.
Carey KJ. 1974. Persistence of profitability. FinancialManagement 3(2): 43–48.
Christensen CM. 1997. The Innovator’s Dilemma: WhenNew Technologies Cause Great Firms to Fail . HarvardBusiness School Press: Boston, MA.
Coff RW. 1999. When competitive advantage doesn’tlead to performance: the resource-based view and
stakeholder bargaining power. Organization Science10(2): 119–133.
Conner KR. 1991. A historical comparison of resource-based theory and five schools of thought withinindustrial organization economics: do we have anew theory of the firm? Journal of Management 17:121–154.
Connolly RA, Schwartz S. 1985. The intertemporalbehavior of economic profits. International Journal ofIndustrial Organization 3: 379–400.
Contini B. 1989. Organization, markets and persistenceof profits in Italian industry. Journal of EconomicBehavior and Organization 12: 181–195.
Cool K, Schendel DE. 1988. Performance differencesamong strategic group members. Strategic Manage-ment Journal 9(3): 207–223.
Cubbin J, Geroski P. 1987. The convergence of profitsin the long run: inter-firm and inter-industrycomparisons. Journal of Industrial Economics 35:427–442.
Cubbin J, Geroski PA. 1990. The persistence of profitsin the United Kingdom. In The Dynamics of CompanyProfits , Mueller DC (ed). Cambridge University Press:Cambridge, UK; 147–167.
D’Aveni RA. 1994. Hypercompetition: Managing theDynamics of Strategic Maneuvering . Free Press: NewYork.
D’Aveni RA. 1999. Strategic supremacy through disrup-tion and dominance. Sloan Management Review 40(3):127–135.
Debreu G. 1959. The Theory of Value. Wiley: New York.Droucopoulos V, Lianos TP. 1993. The persistence
of profits in the Greek manufacturing industry.International Review of Applied Economics 7(2):163–176.
Drucker PF. 1983. Schumpeter and Keynes. Forbes 23May, 124–128.
Durand R. 2002. Competitive advantages exist: a critiqueof Powell. Strategic Management Journal 23(9):867–872.
Ferrier WJ, Smith KG, Grimm CM. 1999. The roleof competitive action in market share erosion andindustry dethronement: a study of industry leaders andchallengers. Academy of Management Journal 42(4):372–388.
Fiegenbaum A, Thomas H. 1988. Attitudes towardrisk and the risk–return paradox: prospect theoryexplanations. Academy of Management Journal 31(1):85–106.
Fine CH. 1998. Clockspeed: Winning Industry Control inthe Age of Temporary Advantage. Perseus: Reading,MA.
Foster R, Kaplan S. 2001. Creative Destruction . Double-day: New York.
Geroski PA, Jacquemin A. 1988. The persistence ofprofits: a European comparison. Economic Journal98(391): 375–389.
Goddard JA, Wilson JOS. 1996. Persistence of profits forUK manufacturing and service sector firms. ServiceIndustries Journal 16(2): 105.
Hoskisson RE, Hitt MA, Johnson RA, Moesel DD. 1993.Construct validity of an objective (entropy) categorical
Copyright 2005 John Wiley & Sons, Ltd. Strat. Mgmt. J., 26: 887–911 (2005)
910 R. R. Wiggins and T. W. Ruefli
measure of diversification strategy. Strategic Manage-ment Journal 14(3): 215–235.
Ilinitch AY, Lewin AY, D’Aveni RA. 1998. Managing inTimes of Disorder: Hypercompetitive OrganizationalResponses . Sage: Thousand Oaks, CA.
Jacobson R. 1988. The persistence of abnormal returns.Strategic Management Journal 9(5): 415–430.
Jacobson R. 1992. The ‘Austrian’ school of strategy.Academy of Management Review 17(4): 782–807.
Jacquemin AP, Berry CH. 1979. Entropy measure ofdiversification and corporate growth. Journal ofIndustrial Economics 27(4): 359–369.
Jenny FY, Weber A-P. 1990. The persistence of profitsin France. In The Dynamics of Company Profits ,Mueller DC (ed). Cambridge University Press:Cambridge, UK; 123–126.
Kambhampati US. 1995. The persistence of profitdifferentials in Indian industry. Applied Economics 27:353–361.
Kessides IN. 1990. The persistence of profits inUS manufacturing industries. In The Dynamicsof Company Profits , Mueller DC (ed). CambridgeUniversity Press: Cambridge, UK; 59–76.
Khemani RS, Shapiro DM. 1990. The persistence ofprofitability in Canada. In The Dynamics of CompanyProfits , Mueller DC (ed). Cambridge University Press:Cambridge, UK; 77–104.
Levonian ME. 1994. The persistence of bank profits: whatthe stock market implies. Economic Review—FederalReserve Bank of San Francisco (2): 3–17.
Makadok R. 1998. Can first-mover and early-moveradvantages be sustained in an industry with lowbarriers to entry/imitation? Strategic ManagementJournal 19(7): 683–696.
Mason ES. 1939. Price and production policies of large-scale enterprise. American Economic Review 29:61–74.
Mason ES. 1949. The current state of the monopolyproblem in the United States. Harvard Law Review62: 1265–1285.
McDonald JT. 1999. The determinants of firm profitabil-ity in Australian manufacturing. Economic Record75(229): 115–126.
McGahan AM, Porter ME. 1999. The persistence ofshocks to profitability. Review of Economics andStatistics 81(1): 143–152.
McNamara G, Vaaler PM, Devers C. 2003. Same asit ever was: the search for evidence of increasingcompetition. Strategic Management Journal 24(3):261–278.
Mueller DC. 1977. The persistence of profits above thenorm. Economica 44: 369–380.
Mueller DC. 1986. Profits in the Long Run . CambridgeUniversity Press: Cambridge, UK.
Mueller DC (ed.). 1990. The Dynamics of CompanyProfits . Cambridge University Press: Cambridge, UK.
Nelson RR, Winter SG. 1982. An Evolutionary Theory ofEconomic Change. Belknap Press: Cambridge, MA.
Odagiri H, Yamawaki H. 1990a. The persistence ofprofits in Japan. In The Dynamics of CompanyProfits , Mueller DC (ed). Cambridge University Press:Cambridge, UK; 129–146.
Odagiri H, Yamawaki H. 1990b. The persistence ofprofits: international comparison. In The Dynamicsof Company Profits , Mueller DC (ed). CambridgeUniversity Press: Cambridge, UK; 169–186.
Palepu K. 1985. Diversification strategy, profit perfor-mance and the entropy measure. Strategic Manage-ment Journal 6(3): 239–255.
Perfect SB, Wiles KW. 1994. Alternative constructionsof Tobin’s q: an empirical comparison. Journal ofEmpirical Finance 1: 313–341.
Porter ME. 1980. Competitive Strategy: Techniques forAnalyzing Industries and Competitors . Free Press:New York.
Porter ME. 1985. Competitive Advantage: Creating andSustaining Superior Performance. Free Press: NewYork.
Porter ME. 1996. What is strategy? Harvard BusinessReview 74(1): 61–78.
Powell TC. 2001. Competitive advantage: logical andphilosophical considerations. Strategic ManagementJournal 22(9): 875–888.
Powell TC. 2002. The philosophy of strategy. StrategicManagement Journal 23(9): 873–880.
Powell TC. 2003. Strategy without ontology. StrategicManagement Journal 24(3): 285–291.
Roberts PW. 1999. Product innovation, product-marketcompetition and persistent profitability in theUS pharmaceutical industry. Strategic ManagementJournal 20(7): 655–670.
Ruefli TW, Wiggins RR. 2000. Longitudinal performancestratification: an iterative Kolmogorov–Smirnovapproach. Management Science 46(5): 685–692.
Ruefli TW, Wiggins RR. 2003. Industry, corporate andsegment effects and business performance: a non-parametric approach. Strategic Management Journal24(9): 861–879.
Schohl F. 1990. Persistence of profits in the longrun: a critical extension of some recent findings.International Journal of Industrial Organization 8(3):385–404.
Schumpeter JA. 1939. Business Cycles: A Theoretical,Historical, and Statistical Analysis of the CapitalistProcess . McGraw-Hill: New York.
Schumpeter JA. 1942. Capitalism, Socialism and Democ-racy . Harper: New York.
Schumpeter JA. 1947. The creative response in economichistory. Journal of Economic History 7: 149–159.
Schwalbach J, Mahmood T. 1990. The persistence ofprofits in the Federal Republic of Germany. InThe Dynamics of Company Profits , Mueller DC(ed). Cambridge University Press: Cambridge, UK;105–122.
Starbuck WH. 1993. Strategizing in the real world.International Journal of Technology Management 8:77–86.
Thomas LG III. 1996. Dynamic resourcefulness and thehypercompetitive shift. Organization Science 7(3):221–242.
Tuma NB, Hannan MT. 1984. Social Dynamics: Modelsand Methods . Academic Press: New York.
Copyright 2005 John Wiley & Sons, Ltd. Strat. Mgmt. J., 26: 887–911 (2005)
Schumpeter’s Ghost 911
Varaiya N, Kerin RA, Weeks D. 1987. The relationshipbetween growth, profitability, and firm value. StrategicManagement Journal 8(5): 487–497.
Waring GF. 1996. Industry difference in the persistenceof firm-specific returns. American Economic Review86(5): 1253–1265.
Wiggins RR, Ruefli TW. 2002. Sustained competitiveadvantage: temporal dynamics and the incidence
and persistence of superior economic performance.Organization Science 13(1): 81–105.
Young G, Smith KG, Grimm CM. 1996. ‘Austrian’ andindustrial organization perspectives on firm-levelcompetitive activity and performance. OrganizationScience 7(3): 243–254.
Copyright 2005 John Wiley & Sons, Ltd. Strat. Mgmt. J., 26: 887–911 (2005)