Embed Size (px)
Citation preview
SCHUMPETER’S GHOST:
IS HYPERCOMPETITION MAKING THE BEST OF TIMES SHORTER?
by
Robert R. Wiggins Fogelman College of Business and Economics
University of Memphis Memphis, TN 38152
(901) 678-5719 [email protected]
and
Timothy W. Ruefli
Department of Management Science and Information Systems McCombs School of Business
and IC2 Institute
University of Texas at Austin Austin, TX 78712 (512) 471-9454
Accepted for publication in Strategic Management Journal Pre-press version: Please do not quote or cite until publication
Manuscript SMJ03-5327.FINAL May 5, 2005
SMJ03-5327.FINAL
2
SCHUMPETER’S GHOST:
IS HYPERCOMPETITION MAKING THE BEST OF TIMES SHORTER?
ABSTRACT
At the center of Schumpeter’s theory of competitive behavior is the assertion that competitive
advantage will become increasingly more difficult to sustain in a wide range of industries. More
recently, this assertion has resurfaced in the notion of hypercompetition. This research examines
two large longitudinal samples of firms to discover which industries, if any, exhibit performance
that is consonant with Schumpeterian theory and the assertions of hypercompetition. We find
support for the argument that over time competitive advantage has become significantly harder
to sustain and, further, that the phenomenon is limited neither to high technology industries nor
to manufacturing industries but is seen across a broad range of industries. We also find evidence
that sustained competitive advantage is increasingly a matter not of a single advantage
maintained over time but more a matter of concatenating over time a sequence of advantages.
KEYWORDS: Schumpeter, hypercompetition, performance, persistence, sustainability
SMJ03-5327.FINAL
3
INTRODUCTION
While Schumpeter’s (1942: 84) notion of a “gale of creative destruction” has garnered
the most attention in the research and practitioner literatures, it is the role profit plays in
motivating innovation as a precursor to creative destruction that is the key to his theories.
Schumpeter (1939: 105) said that profit is “the premium put upon successful innovation in
capitalist society and is temporary by nature: it will vanish in the subsequent process of
competition and adaptation.” Drucker (1983) observed:
Schumpeter's Economic Development does what neither the classical economists nor Marx nor Keynes was able to do: It makes profit fulfill an economic function. In the economy of change and innovation, profit, in contrast to Marx and his theory, is not a Mehrwert, a "surplus value" stolen from the workers. On the contrary, it is the only source of jobs for workers and of labor income. The theory of economic development shows that no one except the innovator makes a genuine "profit"; and the innovator's profit is always quite short-lived. But innovation in Schumpeter's famous phrase is also "creative destruction." It makes obsolete yesterday's capital equipment and capital investment. The more an economy progresses, the more capital formation will it therefore need. Thus what the classical economists - or the accountant or the stock exchange - considers "profit" is a genuine cost, the cost of staying in business, the cost of a future in which nothing is predictable except that today's profitable business will become tomorrow's white elephant.
Schumpeter’s gale of creative destruction would create a disequilibrium in which
“practically every enterprise [is] threatened and put on the defensive as soon as it comes into
existence (Schumpeter, 1939: 107).” For decades Schumpeter’s theory was occasionally
mentioned but did not figure prominently in many analyses of business behavior.
Over the past decade, however, there has been increasing attention given to
Schumpeterian theory and to hypercompetition in the academic literature. Primary, of course, is
D’Aveni’s seminal book (1994), where he defines hypercompetition as “an environment
characterized by intense and rapid competitive moves, in which competitors must move quickly
to build advantage and erode the advantage of their rivals.” (1994: 217-218), as well as
SMJ03-5327.FINAL
4
Christensen’s (1997) book on the problems of industry-leading companies facing competition
from upstarts. Beyond that there have been two special issues of Organization Science (July &
August 1996) devoted to hypercompetition, an edited book (Ilinitch et al., 1998) that overlaps
with the special issues, and some articles in academic journals. Few of these research studies
have been empirically based, but those that were will be reviewed below. In particular the
current research and its findings will be compared to McNamara, Vaaler, and Devers (2003)
since it is the most comprehensive and comparable study to date.
The purpose of our study is to add substantially to the base of empirical evidence
concerning Schumpeter’s theory in terms of the nature and magnitude of the claimed shift in the
U.S. economy. Given Schumpeter’s emphasis on the role of profits, the underlying subject of our
study will be a recognized hallmark of traditional firm and industry behavior: sustained
competitive advantage. The reason for this is as D’Aveni (1994: 7) has noted: “The pursuit of
sustainable advantage has long been the focus of strategy.” The key predictions of
Schumpeterian theory for strategy researchers are: (1) that firms are increasingly less able to
sustain a strategic advantage over their competition, (2) that such behavior is characteristic of a
wide range of industries, and (3) that sustained competitive advantage has become less a matter
of finding and sustaining a single competitive advantage and more a case of finding a series of
competitive advantages over time and concatenating them into a sustained competitive
advantage. Thus all of the three key Schumpeterian outcomes cited relate to sustained
competitive advantage.
Our approach will be to develop a theoretical framework and hypotheses that relate
Schumpeterian theory to sustained competitive advantage. We then examine not only 6,772
firms in forty industries over a 25-year period but also all 13,899 business units in 8,806 firms
SMJ03-5327.FINAL
5
over a 17-year period (a superset of the sample employed by the most recent and comparable
study of hypercompetition, McNamara, Vaaler, and Devers (2003)) and identify in a rigorous
way those firms and business units that have been able to maintain, for a sustained period of
time, a competitive advantage in a fashion that yielded superior economic performance. We will
examine these periods of superior performance to determine if, in consonance with
hypercompetition, those periods have become significantly shorter over time—and, if so, for
which groups of industries. Then we will examine these same firms for evidence that sustained
competitive advantage is increasingly not singular, but is instead composed more and more often
of multiple short advantages over time.
THEORETICAL FRAMEWORK AND ANTECEDENT LITERATURE
Historically, traditional theories of strategic management eschewed the Schumpeterian
theory of disequilibrium as a base framework and chose instead the equilibrium-oriented
approach of industrial organization. In so doing they placed emphasis on what Schumpeter
(1947: 153) called the “adaptive response” of managers and on creating a sustained competitive
advantage for a firm. Thus for decades sustained competitive advantage has been a dominant
concept in strategic management research. Emerging from the structure-conduct-performance
paradigm of industrial organization economics (Bain, 1959; Mason, 1939, 1949) and popularized
by the Harvard Business School and the work of Michael Porter (1985), sustained competitive
advantage is the most influential mechanism for explaining the persistence of superior economic
performance.1 The increasingly popular resource-based view of the firm extends the influence of
1 Coff (1999) points out that there may be cases in which firms have a competitive advantage in the market for outputs, but not for inputs—and thus may not realize superior economic performance. We shall explicitly assume that competitive advantage obtains overall for a firm.
SMJ03-5327.FINAL
6
sustained competitive advantage and its result, above-normal returns, by making achieving
sustained competitive advantage the very reason for firms’ existence (Conner, 1991: 132).
A firm’s ability to maintain superior economic performance has a long and varied history
in economic and strategic management research. Neoclassical economics argues that persistent
superior economic performance is an anomaly, a temporary condition that will vanish when
equilibrium is reached (Debreu, 1959). Industrial organization economics argues that any
persistence is the result of industry structure, with mechanisms such as entry barriers preventing
the equilibrium of neoclassical economics from being achieved (Bain, 1959). Evolutionary
economics (Nelson et al., 1982) as well as the related Austrian school of economics (Jacobson,
1992; Schumpeter, 1939) both argued that persistent superior economic performance is the result
of cycles of entrepreneurial innovation and imitation that create a continuing disequilibrium
where some firms can achieve persistence of performance although it will be eventually eroded.
Organizational and strategic management theories have incorporated most of these ideas and
added the concept of sustained competitive advantage (Porter, 1985) that can lead directly to
persistent superior economic performance.
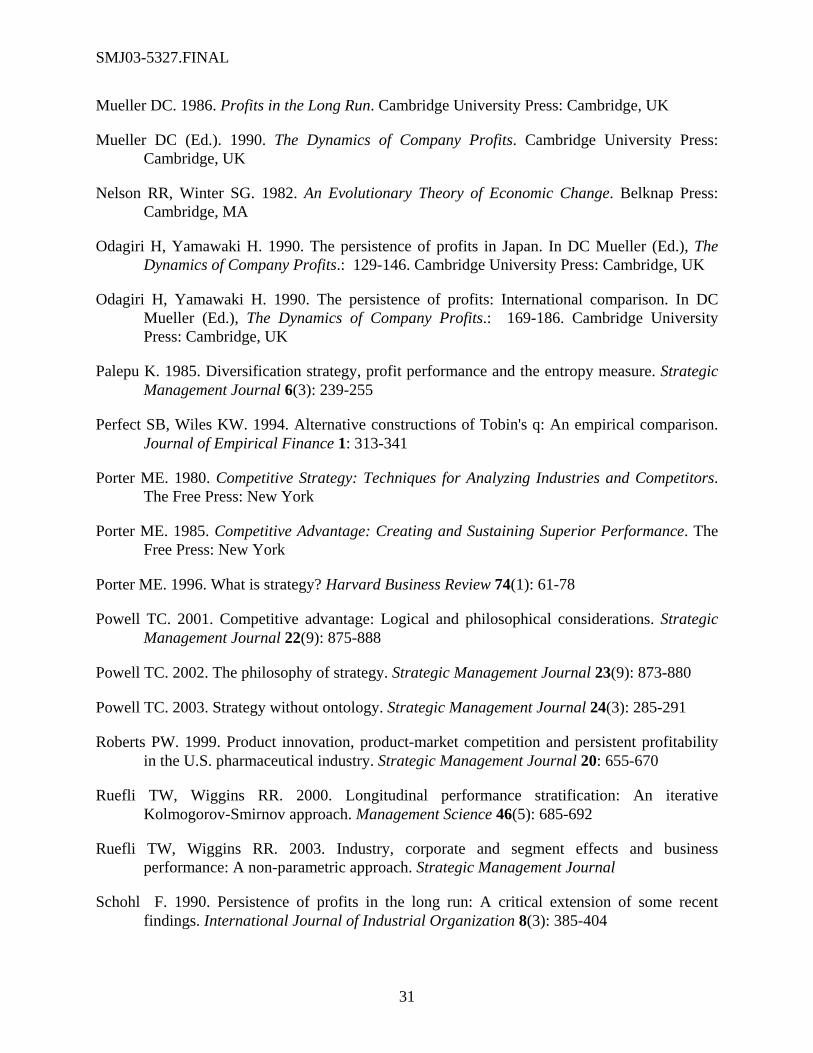
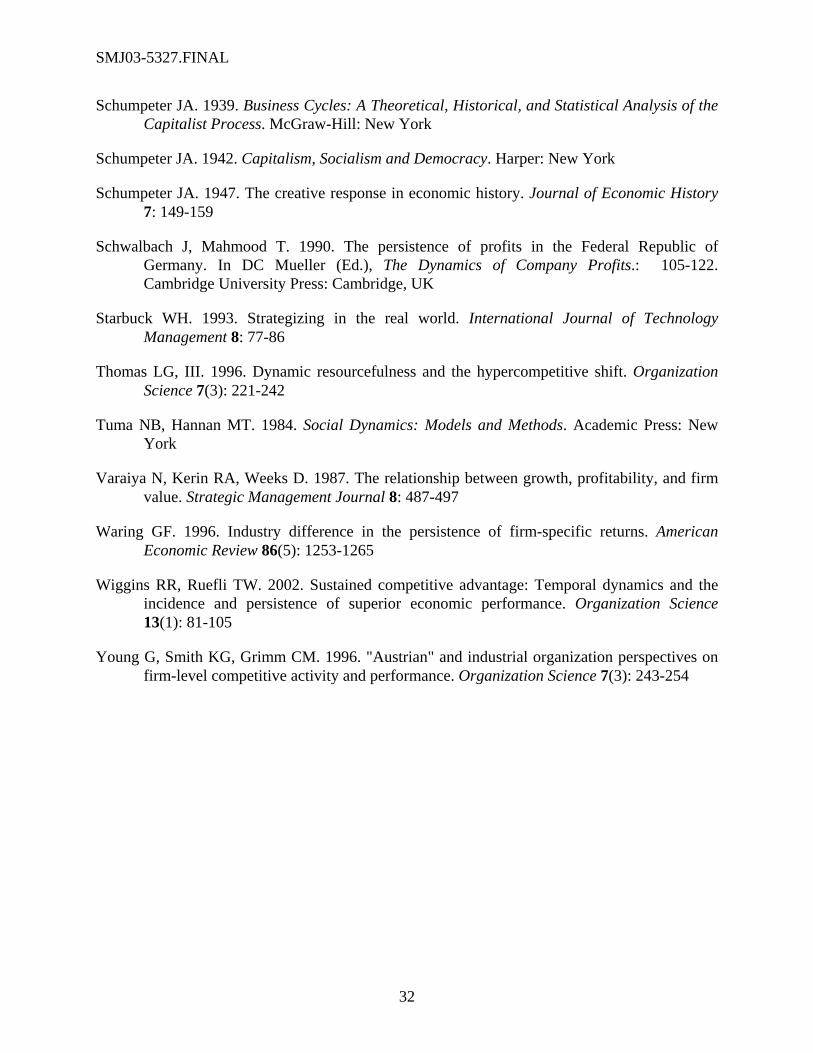
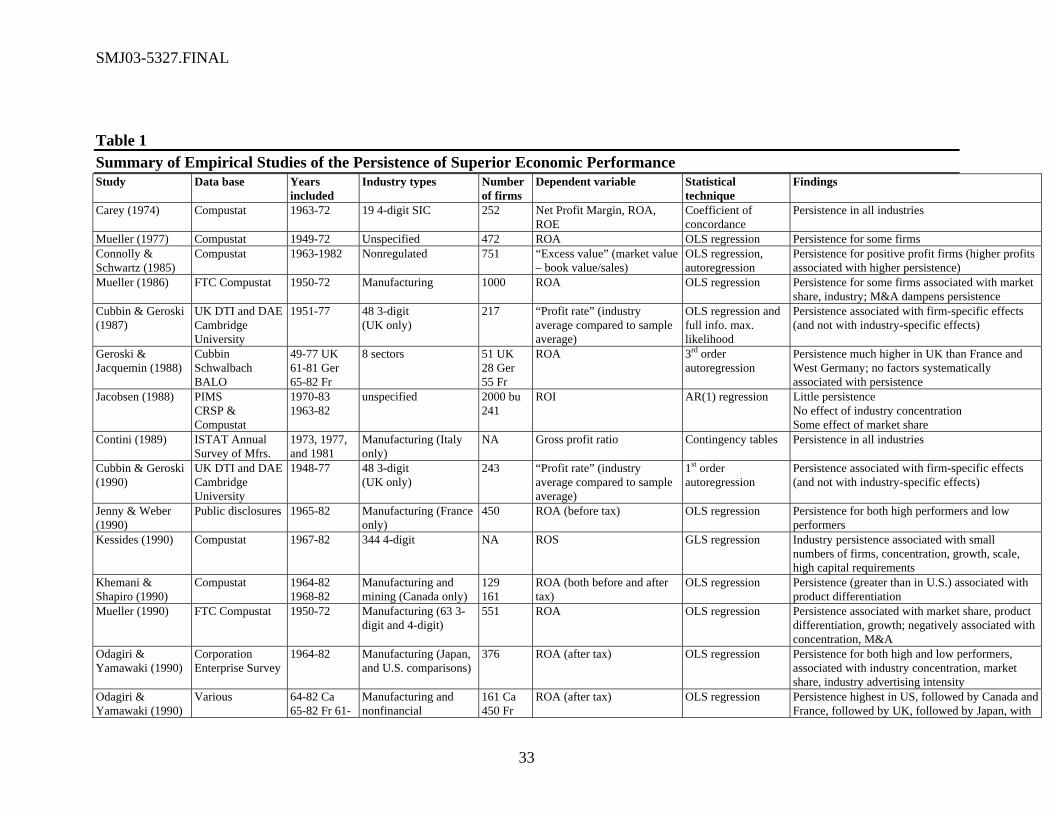
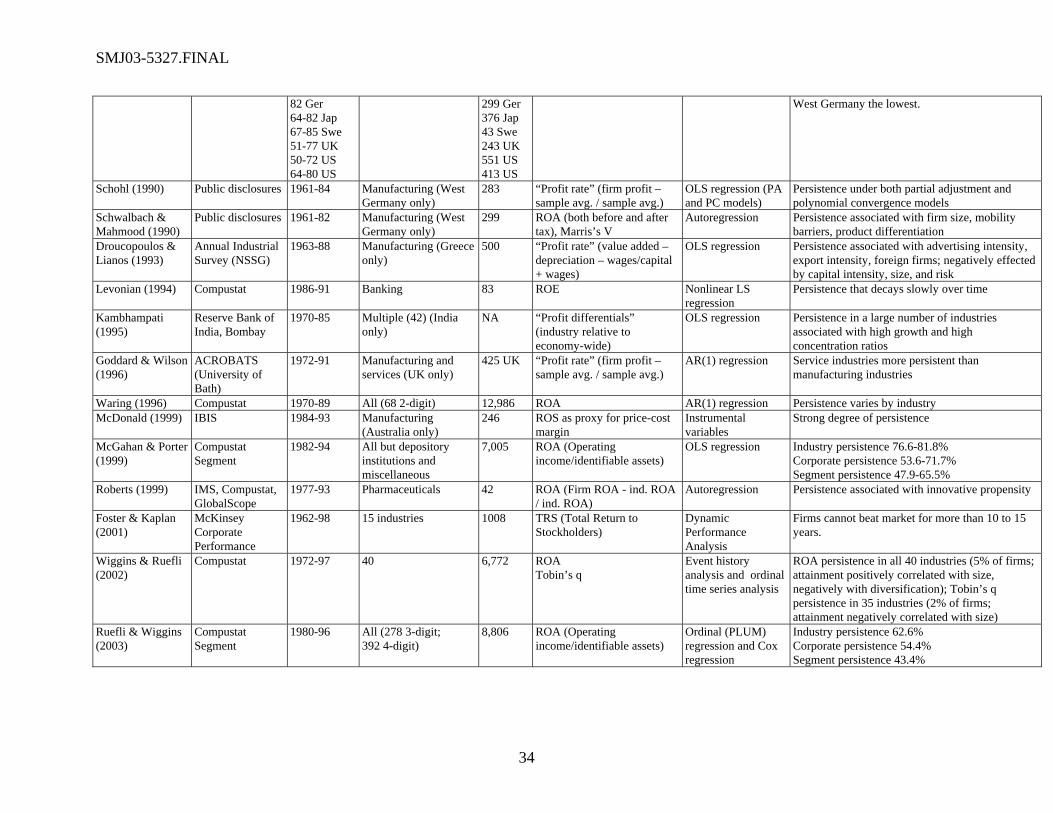
There have been a large number of empirical studies (summarized in Table 1) of the
persistence of economic performance. Some of the major exemplars of this line of research
include Mueller (1986), which, in a time-series regression-based study of ROA of 600 large
industrial firms over the period 1950-1972 utilizing COMPUSTAT and FTC databases, found
that profit levels tended to converge toward the mean, but that the highest-performing firms
converged the most slowly, and some of the high-performing firms’ profitability even increased
over time. Geroski and Jacquemin (1988), Schohl (1990), Droucopoulos and Lianos (1993), and
Goddard and Wilson (1996), all using non-U.S. samples found similar results to Mueller (1986),
SMJ03-5327.FINAL
7
as did Waring (1996) in a large-scale study of 68 U.S. industries. Jacobsen (1988), in a time-
series regression-based study of ROI over the period 1970-1983 utilizing the PIMS SBU-level
database, also found that profit levels converged over time but did not find persistence, and
concluded that “the conditions under which market forces do not drive return back to its
competitive rate seem remote, if present at all” (Jacobsen, 1988: 415). All of these studies were
concerned with the pattern of loss of abnormal profitability positions—but none focused on the
length of time superior performance was maintained nor distinguished between above and below
normal profits. McGahan and Porter (1999) examined shocks to profitability (both positive and
negative positions) and estimated the effects of the factors of industry, firm and business unit
level on the persistence of those shocks, but did not examine either the degree of persistence of
abnormal profitability or its incidence across specific industries. Their methodology relied on an
autoregressive approach that makes assumptions (e.g., that abnormal profits will decay) that we
avoid. Their results neither support nor conflict with results reported here. The primary insight to
be gained from Table 1 is the sheer number of studies that found persistent superior economic
performance. Of the 27 studies listed, only one did not find any evidence of persistence of
performance, and that was Jacobsen (1988), which is also the only study to use the PIMS data
base.
None of these studies examined the effects of time on persistence, and all of them, by
using autoregressive techniques, confounded low and high performance regression and found it
difficult to identify which firms achieve persistence or for how long they sustain it. All of these
previous studies were focused on examining the assumed rate of decay of persistence (both
positive and negative), rather than the timeframes of persistent superior performance—which is
the test of the heart of Schumpeter’s theory and the focus of this study. By using a nonparametric
SMJ03-5327.FINAL
8
methodology that is better suited to the identification of both modal performers and outliers, this
research avoids the problems of the autoregressive time-series methodologies and their
parametric assumptions in particular. Further, the time frame of this research, 1972-1997,
complements the time period (1950-1972) used by Mueller (1986). Finally and importantly, the
present research also supplements the accounting measures of performance used in these prior
studies with a market-based performance measure. Barber & Lyon (1996) showed that the
accounting performance data for all firms in the COMPUSTAT database has been trending down
over time. This latter point calls into question any findings of autoregressive studies of decay of
performance—since such decay could be confounded with the decline of the central tendency of
all firms. However, this decline could also be indicative of precisely the effects of proposed by
Schumpeter.
Some have argued that hypercompetition is so pervasive that “all competitive advantage
is temporary” (Fine, 1998: 30). But not everyone agrees. Michael Porter stated “in many
industries, however, what some call hypercompetition is a self-inflicted wound, not the
inevitable outcome of a changing paradigm of competition” (1996: 61) and that it is most likely
to be limited to a subset of firms in high-technology industries. The question of which of these
arguments should prevail is ultimately an empirical one, and that is the purpose of this research,
to examine this question by a longitudinal examination of the nature of the timing of the loss of
sustained competitive advantage, the scope across industries, and the unitary or multiple nature
of competitive advantage. In short, we seek to test whether there is a basis on which the call for
“advocates of the hypercompetitive paradigm to back up their sweeping generalizations about
the ubiquity of hypercompetition with rigorous large-sample empirical evidence” (Makadok,
1998) can be answered.
SMJ03-5327.FINAL
9
While the above focuses on the state of empirical research on persistent superior
performance, there have also been some investigations specifically into hypercompetition. In the
first notable antecedent empirical test of some of the aspects of hypercompetition, Thomas
(1996) performed a large-scale study, examining over 200 manufacturing industries during the
period from 1958 to 1991 and found that a “hypercompetitive shift” has indeed occurred in this
sector of the U.S. economy. These models used growth rates in stock market value as the
dependent variable, the results came from pooled cross-section time-series data analyzed using
regression-based methodologies, and the sample was restricted to manufacturing firms. Our
study will build on Thomas’ approach, but will use alternate measures and methods to directly
focus on the signature aspects of hypercompetition. Both accounting and market measures of
performance will be employed to provide immediate comparisons with antecedent research.
Longitudinal data will be employed to better enable the examination of possible effects of
hypercompetition over time. We also use a unique stratification methodology applied industry by
industry to identify superior performers and to control for the common effects of general
economic and industry conditions and then employ event history analysis to better discern over
time which firms and which industries are involved in the possible effects of Schumpeterian
dynamics. Further, we include not only manufacturing firms but also mining, natural resource,
transportation, utility, financial, and service firms, thus providing evidence about the scope of
possible hypercompetitive effects.
Another empirical study that bears on hypercompetition is that of Young, Smith and
Grimm (1996) who, in an examination of single business firms in the software industry obtained
results that indicated that competitive moves, unless they were extreme, contributed more to
increased performance than to industry rivalry. These results were extended and greatly
SMJ03-5327.FINAL
10
expanded upon by Ferrier, Smith and Grimm (1999) who, in a paired sample empirical study of
single or dominant business firms, examined the possible market share erosion and dethronement
of market leaders when confronted by challengers. Their findings indicate that across a wide
range of industries market leaders which are faced with relatively more aggressive challengers
are likely to be subject to market share erosion and dethronement as market leader. This finding
is confirmed by Foster and Kaplan (2001) which, working with a McKinsey sample of 1008
firms over 36 years, found that even the most admired firms could not maintain their above-
market performance for more than ten to fifteen years.
The most recent large-scale empirical examination of hypercompetition was assayed by
McNamara, et al. (2003) and is the study most comparable to the one reported here. Their study
of a subset of the firms in this study, covering the period 1977-97, included an autoregressive
model similar to that used by Mueller (1986) and Jacobson (1988), but included an interaction
term to examine changes in the rate of decay of performance (both superior and inferior). This
interaction term was not significantly different from zero, indicating no significant change in the
decay rate over time. These studies also reported no increase in mortality rates, no increasing
trend in industry dynamism, and no decreasing trend in industry munificence. Based on these
findings, they argue that the tendency for researchers to believe in hypercompetition may be a
result of researcher hindsight. While we do not dispute their findings on mortality, dynamism,
and munificence, and we applaud their focus on changes in the rate of decay in their
autoregressive models, we reiterate our arguments about the use of autoregressive models that
admix superior, average, and inferior performers, do not compensate for over-all trends in
performance, require parametric assumptions, and that are sensitive to outliers. Our approach
will be to focus only on the persistent superior performers and any effects on their rate of loss of
SMJ03-5327.FINAL
11
performance. After all, the primary effect mentioned in Schumpeterian theory and argued by
D’Aveni (1994) is increased difficulty in sustaining a competitive advantage. To enhance direct
comparability with McNamara et al. (2003), we will include analyses utilizing the same
COMPUSTAT segment dataset that they (as well as McGahan and Porter (1999)) used.
THE RESEARCH QUESTIONS
Has persistent superior economic performance become more difficult to maintain over
time, as the Schumpeterian theories would suggest? In which industries? Have firms increasingly
sought sustained competitive advantage through concatenation of a set of shorter-term
competitive advantages? These are the chief research questions that will be addressed through
the formulation of hypotheses and via a novel empirical study.
HYPOTHESIS DEVELOPMENT
Hypercompetition and Loss of Persistent Superior Economic Performance
Conventional strategic management theory does not give a prominent role to either
Schumpeterian theory or hypercompetition. Porter (1980; 1985; 1996) has long argued that
classic industrial organization solutions such as “increasing barriers to entry and gaining market
power over rivals, suppliers and buyers will reduce rivalry within an industry” (Ilinitch et al.,
1998: xxvi). Indeed, such reasoning argues that we should see over time an increase in the length
of time that competitive advantage can be maintained. McNamara, et al. (2003) indicate there
has been no change. On the other hand, D’Aveni (1994) clearly argues that hypercompetition is
making it more and more difficult for firms to maintain a competitive advantage. Therefore, we
should see the average period for which firms sustain a competitive advantage decrease over
time. Following Schumpeterian theory and D’Aveni’s line of reasoning, the hypothesis is
proposed:
SMJ03-5327.FINAL
12
Hypothesis 1: Periods of persistent superior economic performance have decreased in
duration over time.
Hypercompetition across Multiple Industries
Schumpeter (1939), followed by D’Aveni (1994: 4), originally argued for the near-
ubiquity of hypercompetition: “There are few industries and companies that have escaped this
shift in competitiveness.” Porter (1996) argued that hypercompetitive effects are likely to be
limited to high technology industries. D’Aveni, in a more recent publication (1999), proposed
that there are four environments of varying turbulence ranging from “equilibrium” to
“disequilibrium.” The latter environment he identifies with hypercompetition, but he does not in
this work specify the degree of prevalence of any of his environments in the economy. To
formulate our next hypothesis we revert to Schumpeter and to D’Aveni’s original position which
leads directly to this formulation:
Hypothesis 2: Hypercompetition is not limited to high technology industries, but occurs
throughout most industries.
Hypercompetition and Series of Temporary Competitive Advantages
D’Aveni specifically stated, “instead of seeking a sustainable advantage, strategy in
hypercompetitive environments now focuses on developing a set of temporary advantages”
(D'Aveni, 1994: 7). He reiterated this when he said, “If companies are not seeking a sustainable
competitive advantage, what is the goal of strategy in hypercompetitive environments? The
primary goal of this new approach to strategy is disruption of the status quo, to seize the
initiative through creating a series of temporary advantages” (D'Aveni, 1994: 10). Brown and
Eisenhardt (1998) also argued that success can only come from a continuous stream of
SMJ03-5327.FINAL
13
temporary advantages when the environment is “relentlessly shifting” (Brown et al., 1997).
These arguments lead directly to the following hypothesis:
Hypothesis 3: Over time firms increasingly have sought to sustain competitive
advantage by concatenating a series of short-term competitive advantages.
METHODS
Data
Data were collected from three primary sources: the COMPUSTAT PC-Plus database
(both active and research files) for the twenty years from 1978 to 1997 inclusive, the
COMPUSTAT Back History database for the five-year period from 1972 to 1977, and the
COMPUSTAT Segment Tapes for 1978-1997. We included data from the COMPUSTAT Back
History database to provide 20 overlapping five-year periods (1974-1997), as well as two
additional years (1972-1973) to alleviate some of the left-censoring problem. SIC codes for firms
that exited the database prior to 1978 are not included in the Back History database; these firms
were classified employing the CRSP/COMPUSTAT Cross Reference database maintained by the
Johnson Graduate School of Management at Cornell University, and also the Moody’s Industrial,
OTC, Transportation, Financial, and Utilities Manuals. Two samples (a firm-level and a
business-unit-level sample) were derived from the primary source data.
Dependent Variables
While the theories used to develop the hypotheses relate to sustained competitive
advantage, we are unable to directly operationalize the concept. Barney (1991: 102), for
example, defines a sustained competitive advantage as a competitive advantage that “continues
to exist after efforts to duplicate that advantage have ceased.” What we can operationalize is the
consequence of sustained competitive advantage, persistent economic performance. While some
SMJ03-5327.FINAL
14
may find this less desirable, it is consistent with the work of Porter, who refers to “long-term
profitability” (Porter 1985, p. 1) and “above-average performance in the long run” (Porter 1985,
p. 11) when discussing the outcomes of sustained competitive advantage.
Two measures were used to operationalize economic performance: return on assets
(ROA), an accounting measure, and Tobin’s q (the ratio of firm market value to the replacement
cost of its assets), a market measure, because some studies have shown results that vary between
accounting and market measures (Hoskisson et al., 1993). ROA (net income divided by total
assets for firms, segment net income divided by identifiable assets for business units) was
selected primarily for comparability with earlier economic and strategic management research in
this area (see Table 1, where most of the studies use ROA as their primary or only measure of
performance). Tobin’s q was selected because, although he did not use it in his study, Mueller
(1990: 8-14) suggested its potential, and because Tobin’s q was utilized by McGahan and Porter
(1999) and Wiggins and Ruefli (2002), and so its inclusion enhances comparability with their
results. Tobin’s q was operationalized as the ratio of market value to the book value of assets.
This ratio has been shown to be not only empirically equivalent (Perfect et al., 1994) but also
theoretically equivalent to Tobin’s q (Varaiya et al., 1987).
Superior economic performance was operationalized as statistically significant above
average economic performance (relative to other firms in the same industry for the firm-level
analyses, and relative to all business units, or all industries, or all firms for the segment-level
analyses) over a five-year period. Note that this is consistent with Besanko, et al. (1996), who
define competitive advantage as a firm outperforming its industry. This was determined using
the Iterative Kolmogorov-Smirnov (IKS) technique which stratifies time-series data into
statistically significantly different levels of performance using iterative comparisons described in
SMJ03-5327.FINAL
15
detail in Ruefli and Wiggins (2000). A rolling five-year window (Cool et al., 1988; Fiegenbaum
et al., 1988) was used for all measures. Since this technique yields ordinal categorical data
(Argresti, 1984), factors such as the common effects of general economic conditions, industry
cycles and product life cycles are controlled in the stratification process.
However, IKS analysis can generate varying numbers of performance strata over time,
which makes longitudinal comparisons difficult. We are interested only in the firms with
performance above the industry or reference set modal stratum. Therefore, as a form of a fortiori
analysis (because it is conservative in regard to the hypotheses being tested), the number of
performance strata was compressed in each time period to three by creating two supersets of
strata: those above the modal stratum and those below the modal stratum. To validate the
stratification supersets, discriminant function analysis was employed in a confirmatory mode on
the industries studied. For these industries, all of the discriminant functions were significant
(p<0.05) for all variables, demonstrating the validity of the superset performance strata.
Persistent superior economic performance at the corporate level was operationalized as
superior economic performance lasting for six or more windows (i.e., a ten-year period),
inasmuch as there were two non-overlapping five-year windows in such a period, which
eliminated potential bias owing to the effect of a single year of outstanding performance. This
establishes a very stringent test for the performance effects of hypercompetition and one that is
tied directly to Schumpeterian theory, in that it is only the significant shortening of the periods
during which only those firms with significant sustained competitive advantage (i.e., over
periods of ten years or more) that will be accepted as evidence. The first five-year window in the
firm-level models is 1977-1981 since that is the first window in which an exit from the persistent
SMJ03-5327.FINAL
16
superior economic performance stratum could occur. For the business unit level data, five years
(one window) was used to enhance comparability with McNamara et al. (2003).
Independent and Control Variables
Because the primary question we are investigating is the change over time of the rate at
which firms lose superior profitability positions, the only independent variable is time period.
The stratification methodology controls for the common effects of general economic conditions,
thus other control variables included market share, industry concentration, firm size,
diversification, industry density, and dummy variables for each industry. These variables were
operationalized as follows. For market share we used the ratio of each firm’s total revenues to
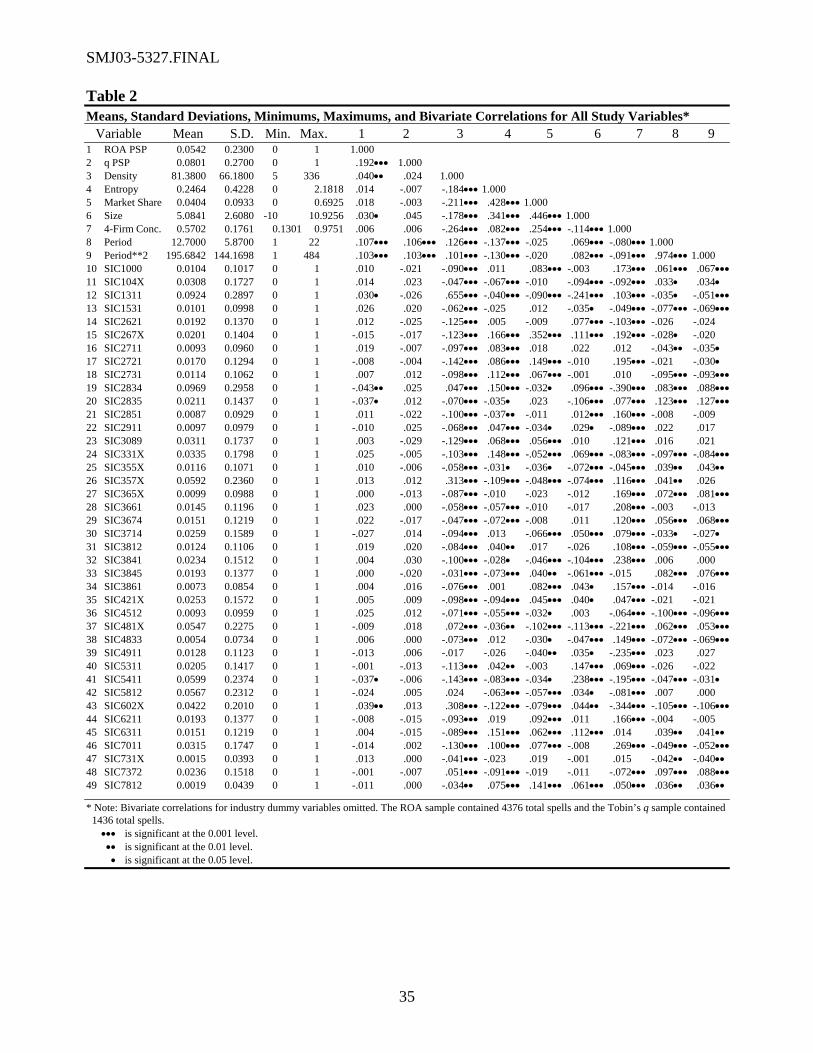
the total revenues of all firms in the industry. Table 2 shows that market share ranged from 0 to
0.69 with a mean across all firms of 0.04. Industry concentration was operationalized by
calculating the four-firm concentration ratio by dividing the combined total revenues of the four
largest firms in each industry by the total revenues of all firms in the industry. As seen in Table
2, the industry four-firm concentration ratio ranged from 0.13 to 0.98, with a mean across all
forty industries of 0.57. For firm size the natural logarithm of total sales was employed. Table 2
shows the range of firm size as –10 to 10.93 with a mean of 5.08. For diversification we used the
Jacquemin-Berry entropy measure of diversification (Jacquemin et al., 1979; Palepu, 1985),
which is defined as
∑=
=n
iii PPE
1)/1ln(
where Pi is the ith segment’s share of the firm’s total sales, which operates in n segments. As
seen in Table 2, entropy ranged from 0 to 2.18 with a mean of 0.25. For density we used the total
number of firms in each industry in each period, which as Table 2 shows ranged from 5 to 336
SMJ03-5327.FINAL
17
with a mean of 81.38. Because the dependent variables represent five-year windows, all of the
control variables were five-year moving averages matched to the dependent variables’ five-year
windows. Finally, the industry dummy variables were coded using the deviation method, which
compares the effect of each dummy variable to the overall effect. The descriptive statistics and
correlations of the study variables are shown in Table 2.
Insert Table 2 about here
Samples
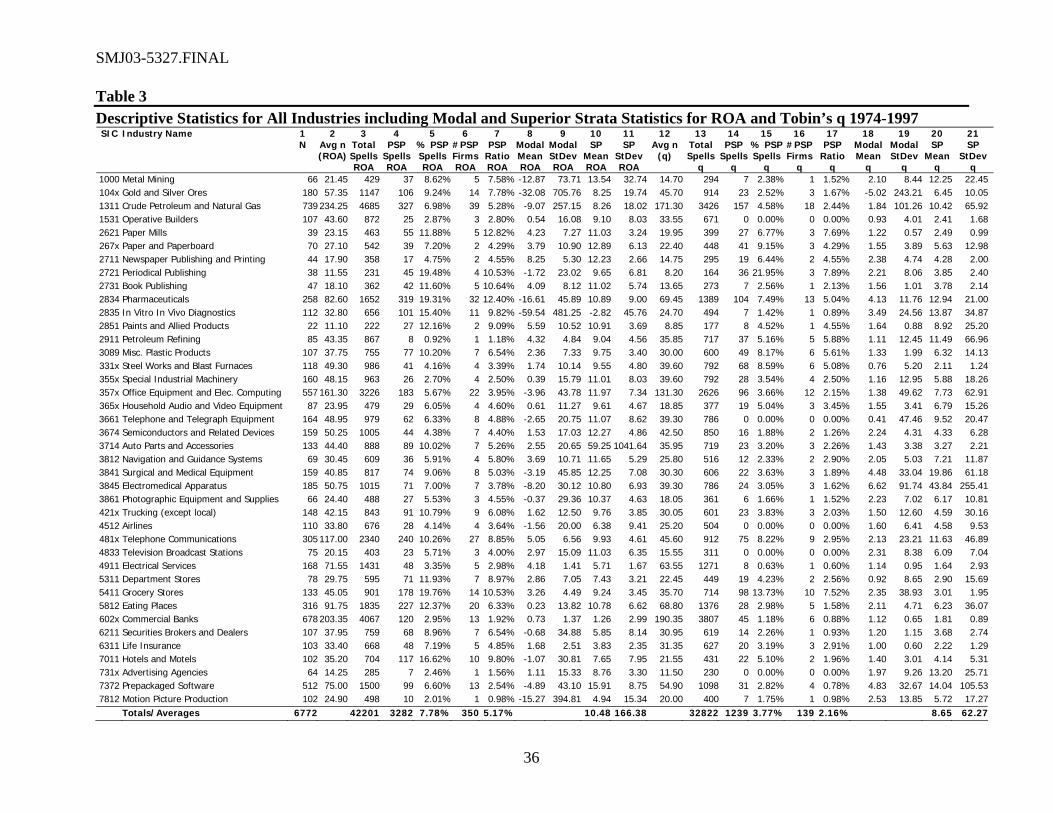
For the firm-level sample we selected the same forty industries (listed in Table 3) used by
Wiggins and Ruefli (2002). The industries in this sample represent 7 out of 10 one-digit SIC
level categories. This sample thus includes an overlap with Thomas’ (1996) sample, although
most of the industries considered are outside the manufacturing sector and is a superset of the
sample used by McNamara, et al. (2003). Table 3 shows the complete firm-level sample, along
with some descriptive statistics. For the segment-level sample we used all of the available
COMPUSTAT segment data, since we were not utilizing regression and therefore did not face
the same methodological issues as McGahan and Porter (1999) and McNamara et al. (2003) and
therefore did not have to screen the data and lose observations.
Insert Table 3 about here
Identification of Superior Performance
In essence, our research concentrates on an outlier or frontier phenomenon (Starbuck,
1993), i.e., the loss of superior economic performance. In order to identify firms that have lost
superior economic performance, we first identified firms that obtained superior economic
performance. Most statistical techniques, however, are based on measures of central tendency,
and consequently their focus is on means and averages. In his study referenced earlier, Waring
SMJ03-5327.FINAL
18
(1996) went so far as to remove outliers as a means of improving his autoregressive models of
decay (Waring, 1996: 1262). Our argument, on the other hand, holds that these very outliers,
those firms that gained, then possibly lost superior performance, are of primary interest, which is
another reason why we eschew autoregressive models.
After the data were classified by the IKS analysis into three performance strata (superior,
modal, and inferior), the modal and inferior strata were discarded, and the rest of the analysis
concentrated solely on those firms in the superior stratum. Further, for the corporate level hazard
models, we only include those firms that remain in the superior stratum for ten years—the firms
that achieved truly persistent superior economic performance. In other words, our analyses were
driven by the small but significant differences between the firms that maintain persistent superior
economic performance and those that attained it but lost it, as opposed to the very large
differences between above average performers and average and below-average performers used
by all previous studies.
Event History Analysis
We tested hypotheses one and two by using discrete time event history analysis
techniques (Allison, 1984; Tuma et al., 1984) to estimate models of the rates at which firms exit
the superior performance stratum. In the study of discrete state change processes, event history
methods are considered preferable to linear regression models, as the major problem with linear
regression models is their failure to account for the timing of state changes — which may be
relevant (Allison, 1995). Moreover, we were interested in the dependence of the hazard rate on
time, which cannot be readily accomplished with linear regression models (Allison, 1995).
SMJ03-5327.FINAL
19
Event history analysis estimates a hazard function that allows the calculation of the
instantaneous rate of change for a firm at time t. In the case of persistent superior economic
performance (PSP), the hazard function was defined as follows:
ttatPSPtttPSPth
t ∆∆+
=→∆
] | , Pr[~)( lim0
where ] | , Pr[~ tatPSPtttPSP ∆+ is the probability of a firm exiting the superior performance
stratum between time t and time t + ∆ t , if and only if the firm is in the superior performance
stratum at time t. Firm transition rates were estimated using discrete time maximum likelihood
models (Allison, 1984; 1995), which apply logistic regression to the analysis of time-series data.
Pattern Analysis
To test hypothesis three it was necessary to examine the patterns of superior and not-
superior performance over time. If firms were increasingly forced by creative destruction to seek
a series of short-term competitive advantages, those that were most successful would be
expected to concatenate them in a seamless fashion, one following the other, so the effect on
performance would not be distinguishable from that achieved by a single sustained competitive
advantage. Thus the data set here would not allow for a test of this type of success. On the other
hand, it would be expected that superior performing firms which were less successful in
concatenating a series of advantages would reveal themselves by occasionally failing to achieve
it, giving them a period of less than superior performance, following which superior performance
would resume. This would give a performance pattern of superior, then not superior, then
superior performance over time. If the assertions surrounding hypercompetition were true, this
pattern should become significantly more prevalent over time. In the context of the methodology
employed here, the fraction of firms that were above modal performance levels then fell to a
SMJ03-5327.FINAL
20
below superior performance level for one five-year period and then rose back into the superior
performance strata should increase over the study period. To test hypothesis three therefore, for
both performance measures the incidence of the pattern: superior performance, then modal or
below performance, then superior performance, was noted in each three-period window as the
window was rolled through the 24 periods in the study. These numbers were then subjected to a
2×2 contingency analysis that compared the incidence and non-incidence of the pattern in the
first and last ten three-period windows of the study. The likelihood ratio chi-square test of
association was then employed for the patterns produced by ROA and by Tobin’s q.
RESULTS
As the first step toward testing the hypotheses, the two sets of forty industry samples
were individually stratified with the iterative Kolmogorov-Smirnov method as previously
described. For each sample this method formed multiple strata of statistically significantly
different performance levels. Table 4 shows the modal strata means and standard deviations for
both samples for all 40 industries in columns 3 and 4 (ROA) and columns 13 and 14 (Tobin’s q),
and the above-average or superior performance (SP) strata means and standard deviations in
columns 10 and 11 (ROA) and 20 and 21 (Tobin’s q). The strata sizes were consistent between
the two measures of performance. The segment level data were similarly stratified at the three
levels of analysis (industry, corporate, and SBU) to determine the superior performing industries,
corporations, and SBUs. We retained only the superior performance strata to conduct the
analyses to test hypotheses one and two.
Hypothesis One: Hypercompetition and Persistence
Hypothesis 1 was represented in the model by the time variable Period. For both
performance measures, the hazard of exiting the persistent superior performance stratum did
SMJ03-5327.FINAL
21
indeed significantly increase over time, as shown in Tables 4 and 5 for the corporate-level
sample, and Table 6 for the business-unit-level sample. Hypothesis one was thus supported.
(Note: the corporate event history models were also estimated with non-linear time axes, just as
the business-unit models were, but the effect in these samples proved to be linear, so only the
linear models are reported here.) As can be seen from the first column of Tables 4 and 5 (the All
models), the hazard rate for the ROA sample increased more rapidly than the hazard rate for the
Tobin’s q sample, indicating that at the corporate level, accounting performance was more
affected by Schumpeterian dynamics than was market performance. Table 6 shows that while the
hazard rate at the business-unit level increased more slowly than at the corporate or industry
levels, at all three levels the hazard of losing superior performance positions was significantly
increasing over time (although at a very slightly decreasing rate, as indicated by the non-linear
time axis).
Insert Tables 4, 5, and 6 about here
Hypothesis Two: Hypercompetition across Multiple Industries
Because none of the three and four-digit industries contained enough spells of persistent
superior economic performance to yield adequate statistical power, Hypothesis Two was
examined in two ways. First, the overall samples were divided into “high tech” industries (SIC
codes 357x, 365x, 3661, 3674, 481x, and 7372) and “low tech” industries (all other SIC codes).
Second, the forty industry samples were aggregated to the one-digit SIC level yielding seven
one-digit industries. The “low tech” models shown in Tables 4 and 5 show that for both
performance measures, the hazard of exit was statistically significantly increasing for the non-
high-technology industries over time, although the magnitude of the hazard was lower than for
the high-tech industries. This supports Hypothesis Two. The industry models (which contain
SMJ03-5327.FINAL
22
significantly fewer spells than the total sample and are therefore less powerful) show more
mixed results by performance measure. Table 4 shows that for only two of the six industries with
sufficient data was the Tobin’s q Period variable significant (in part because these sub-samples
contain few spells), providing little additional support for Hypothesis Two. However, Table 5
shows that for six of the seven industries the ROA Period variable was statistically significant at
the 0.05 level or better, providing additional support for Hypothesis Two. The phenomenon was
not limited to high technology industries, although they appear to be affected more strongly.
Hypothesis Three: Hypercompetition and Series of Temporary Competitive Advantages
The results for the likelihood ratio chi-square test of association for the patterns
(superior, then less-than-superior, then superior performance) produced for ROA and for Tobin’s
q are given in Table 7. Here it can be seen that the chi-squares are significant in both cases at the
α = 0.001 level, indicating that the performance pattern is relatively more prevalent in the last
decade of the study than it was in the prior decade. Thus hypothesis three is supported.
Insert Table 7 about here
DISCUSSION AND IMPLICATIONS
The results presented above provide evidence that periods of sustained competitive
advantage, as evidenced by its consequence, superior economic performance, have been growing
shorter over time. To answer the question in the title, this is evidence that Schumpeter’s ghost
has indeed appeared in the form of hypercompetition. These results hold across a wide range of
sectors of the economy. These results provide direct support for Schumpeter’s theory and for the
occurrence of hypercompetition. Coupled with the findings of Thomas (1996) of a
hypercompetitive shift in the behavior of the manufacturing sector, results here provide
additional support for the contention that a substantial portion of the US economy is
SMJ03-5327.FINAL
23
characterized increasingly by hypercompetitive behavior. Further, there is evidence to support
the notion that managers have responded to this hypercompetitive environment by seeking in
relatively more situations, not a single sustained competitive advantage, but rather a series of
short advantages that can be concatenated into competitive advantage over time.
In the absence of the innovative dynamic change that characterizes hypercompetition,
one possible alternative explanation for the results here might be deregulation. The most
formerly regulated sub-sample, Transportation and Utilities, shows evidence of this in terms of
Tobin’s q (but not in terms of ROA), however, the rest of the sample included many non-
regulated industries—and these show strongly diminishing duration of superior economic
performance in terms of ROA. Another alternative explanation for the results reported above
might be largely due to increased levels of static competition. But, as in Thomas’ (1996) study of
manufacturing, there is no clear mechanism for such an increase in static competition alone—
especially across such a wide range of industries. Yet another alternative explanation for the
decrease in duration of competitive advantage might be turbulence in the macroenvironment.
Such turbulence would, however, not be likely to have a more significant effect on only those
firms with a sustained competitive advantage—at least not in the absence of substantial dynamic
competitive effects. Further, McNamara et al. (2003: 272) found no evidence of fundamental
changes in industry stability, dynamism, or munificence. Thus the logical explanation for the
reduced duration of sustained competitive advantage across a variety of different industries
appears to be attributable to a shift to hypercompetition. The independent empirical evidence
presented by Thomas (1996) and the anecdotal evidence in D’Aveni (1994) reinforce this
conclusion.
SMJ03-5327.FINAL
24
The finding that hypercompetition characterizes a wider number of firms than just a
limited number in high technology industries (Porter, 1996), and industries even beyond those
manufacturing industries studied by Thomas (1996) is important. The mechanisms for the spread
of hypercompetition beyond those industries with a rapidly changing technology base cannot be
determined by this research. We can however speculate that those industries with stable
traditional technology bases are increasingly subject to the effects of changes in information
technology which is being ubiquitously deployed across all industries. Better sources of
competitive information, business intelligence and higher levels of internal flexibility can
shorten competitive response time. Further, even in these stable industries, managers who
observed the successful employment of hypercompetitive strategies in more dynamic industries
may import such strategies into their industries and innovatively destabilize them. The wide
appearance of hypercompetitive effects has significant implications for both practice and
research.
Insert Figure 1 and Table 8 about here
Finally, an obvious question that these findings inspire concerns why our results differ
from those of the most comparable study, McNamara et al. (2003). First, as previously noted,
there is the difference in methods: their study utilized the same (albeit a more sophisticated
version) autoregressive techniques used by most of the studies outlined in Table 1. Second, their
study examined the decay of persistence for all business units (including average as well as
poorly performing business units). In their own words, “with this model, we can assess the
degree to which abnormally higher or lower business returns decay over time to the mean”
(McNamara et al., 2003 (emphasis added)). Our primary method only examined persistently
superior performing business units and firms, which is a more direct link to the Schumpeterian
SMJ03-5327.FINAL
25
theoretical question regarding the effect of creative destruction on the sustainability of
competitive advantage. Third, while both studies used multiple samples and multiple methods,
their study included many other variables (dynamism, mortality, stability) that no proponent of
the hypercompetitive approach has directly discussed, making most of their tests indirect tests,
while our primary methods all focused solely on direct tests of Schumpeterian theory regarding
persistent superior performance. Further, our secondary analysis at the business-unit level, using
the same dataset as McNamara et al. (2003), shown graphically in Figure 1 and using simple
linear regression reported in Table 8, found a clear and significant decline in business unit
performance over time at all levels of performance (with over 87% of the variance in ROA
explained by time alone, indicating a very strong trend in the performance data over time, similar
to the downward trend in the corporate level data reported by Barber and Lyon (1996)). Note
that McNamara et al. (2003) focused their analysis on the variance of returns, which they found
to not change significantly over time, whereas we focused on the mean returns, which do change
significantly over time. Again, neither Schumpeter (1939) nor D’Aveni (1994) theorize about
variance of returns.
Limitations and Future Research
The primary limitation of this research is that while a key theoretical underpinning is
sustained competitive advantage, we are unable to actually measure competitive advantage and
are forced instead to use its generally accepted consequence, persistent superior economic
performance. The logical and philosophical issues of the relationship between competitive
advantage and superior performance have been extensively discussed recently (Arend, 2003;
Durand, 2002; Powell, 2001, 2002, 2003), and we will not revisit these arguments here. Whether
or not there is a connection between hypercompetition and competitive advantage, or
SMJ03-5327.FINAL
26
competitive advantage and superior performance, the fact remains that this study shows that
something is clearly affecting the ability of firms and business units to sustain performance, and
in the absence of compelling alternative explanations, we argue that that something is likely
hypercompetition.
Another limitation of this study its reliance on the corporate and segment level data
available in the COMPUSTAT databases, which is further exacerbated by potential industry
identification problems caused by using SIC codes. However, the problem of diversified firms
has been shown empirically to be not significant. Yet another limitation is in the minimum time
frame, ten years, selected to represent persistent superior economic performance. It may be that
the appropriate time frames are shorter, varying by industry or by competitive arena, and future
research to examine this would be of interest. An associated limitation is that the data employed
are both right and left-censored. However, they do cover almost three decades, and precisely the
three decades in which the concepts of both sustained competitive advantage and
hypercompetition rose to prominence in strategic management research. The use of additional
data (1972-1973) to ameliorate the left-censoring problem was also of benefit.
Our findings that hypercompetitive forces have indeed affected the ability of firms to
sustain superior performance taken together with the findings of McNamara et al. (2003) that
these same forces do not appear to affect all firms equally suggests several avenues for further
research. First, the fact that both studies found that the effects varied over time invite temporal
extensions. It will be of particular interest to extend the study to the time when the current
economic downturn concludes. The examination of market measures during the boom and bust
cycle of the 1987-2003 timeframe should prove interesting. Likewise, it would be interesting to
extend the study geographically to see if different economic arrangements in Europe and Japan
SMJ03-5327.FINAL
27
have an effect on the existence and extent of hypercompetition. The finding of patterns of series
of short-term competitive advantages linked over time to yield an on-going competitive
advantage invites a step back and the examination of under what conditions such behavior is
possible and analysis of the competitive responses to this phenomenon. Finally, strategic
management theory might be revisited to investigate how Schumpeterian theory might better be
integrated and used to enrich existing approaches.
ACKNOWLEDGEMENTS
This work was supported in full or in part by a grant from the Fogelman College of
Business & Economics at the University of Memphis. This research support does not imply
endorsement of the research results by either the Fogelman College or the University of
Memphis. This research was partially funded by a Suzanne Downs Palmer Research
Professorship at the Fogelman College of Business at the University of Memphis. The second
author would also like to acknowledge the support of the Daniel Stuart Endowment and the Herb
Kelleher Center for Entrepreneurship at the McCombs School of The University of Texas at
Austin. The authors wish to thank Jay Barney, Jan Beyer, Ming-Jer Chen, Kathleen Conner, W.
W. Cooper, Richard D’Aveni, Allison Davis-Blake, Janet Dukerich, Kathleen Eisenhardt,
Frances Hauge Fabian, Rob Folger, Brian Golden, Jovan Grahovac, Ira Harris, Michael Hitt,
David Jemison, Preston McAfee, Reuben McDaniel, Gerry McNamara, Hao Ma, Richard
Makadok, Paul Mang, Robert Nixon, Greg Northcraft, David Schkade, Herb Simon, Paul Vaaler,
Jack Walters, seminar participants at Texas Christian University, the University of Memphis, the
University of Missouri, the University of Texas at Austin, and the University of Texas at Dallas,
as well as six anonymous referees for comments and suggestions on earlier versions of this
research. Special thanks to Andy Henderson for methodological assistance.
SMJ03-5327.FINAL
28
REFERENCES
Allison PD. 1984. Event History Analysis: Regression for Longitudinal Event Data. Sage: Beverly Hills, CA
Allison PD. 1995. Survival Analysis Using the SAS System: A Practical Guide. SAS Institute, Inc.: Cary, NC
Arend RJ. 2003. Revisiting the logical and research considerations of competitive advantage. Strategic Management Journal 24(3): 279-284
Argresti A. 1984. Analysis of Ordinal Categorical Data. John Wiley & Sons: New York
Bain JS. 1959. Industrial Organization. Wiley: New York
Barber BM, Lyon JD. 1996. Detecting abnormal operating performance: The empirical power and specification of test statistics. Journal of Financial Economics 41(3): 359-399
Barney JB. 1991. Firm resources and sustained competitive advantage. Journal of Management 17: 99-120
Besanko D, Dranove D, Shanley M. 1996. The Economics of Strategy. John Wiley & Sons, Inc.: New York
Brown SL, Eisenhardt KM. 1997. The art of continuous change: Linking complexity theory and time-paced evolution in relentlessly shifting organizations. Administrative Science Quarterly 42(1): 1-34
Brown SL, Eisenhardt KM. 1998. Competing on the Edge: Strategy as Structured Chaos. Harvard Business School Press: Boston
Carey KJ. 1974. Persistence of profitability. Financial Management 3(2): 43-48
Christensen CM. 1997. The Innovator's Dilemma: When New Technologies Cause Great Firms to Fail. Harvard Business School Press: Cambridge, MA
Conner KR. 1991. A historical comparison of resource-based theory and five schools of thought within industrial organization economics: Do we have a new theory of the firm? Journal of Management 17: 121-154
Connolly RA, Schwartz S. 1985. The intertemporal behavior of economic profits. International Journal of Industrial Organization 3: 379-400
Contini B. 1989. Organization, markets and persistence of profits in Italian industry. Journal of Economic Behavior and Organization 12: 181-195
SMJ03-5327.FINAL
29
Cool K, Schendel DE. 1988. Performance differences among strategic group members. Strategic Management Journal 9(3): 207-223
Cubbin J, Geroski P. 1987. The convergence of profits in the long run: Inter-firm and inter-industry comparisons. Journal of Industrial Economics 35: 427-442
Cubbin J, Geroski PA. 1990. The persistence of profits in the United Kingdom. In DC Mueller (Ed.), The Dynamics of Company Profits. 147-167. Cambridge University Press: Cambridge, UK
D'Aveni RA. 1994. Hypercompetition: Managing the Dynamics of Strategic Maneuvering. The Free Press: New York
D'Aveni RA. 1999. Strategic supremacy through disruption and dominance. Sloan Management Review 40(3): 127-135
Debreu G. 1959. The Theory of Value. Wiley: New York
Droucopoulos V, Lianos TP. 1993. The persistence of profits in the Greek manufacturing industry. International Review of Applied Economics 7(2): 163-176
Drucker PF. 1983. Schumpeter and Keynes, Forbes, 23 May: 124-128
Durand R. 2002. Competitive advantages exist: A critique of Powell. Strategic Management Journal 23(9): 867-872
Ferrier WJ, Smith KG, Grimm CM. 1999. The role of competitive action in market share erosion and industry dethronement: A study of industry leaders and challengers. Academy of Management Journal 42(4): 372-388
Fiegenbaum A, Thomas H. 1988. Attitudes toward risk and the risk-return paradox: Prospect theory explanations. Academy of Management Journal 31(1): 85-106
Fine CH. 1998. Clockspeed: Winning Industry Control in the Age of Tmporary Advantage. Perseus Books: Reading, MA
Foster, R, Kaplan, S. 2001. Creative Destruction, Doubleday, New York.
Geroski PA, Jacquemin A. 1988. The persistence of profits: A European comparison. The Economic Journal: The Journal of the Royal Economic Society 98(391): 375-389
Goddard JA, Wilson JOS. 1996. Persistence of profits for UK manufacturing and service sector firms. The Service Industries Journal 16(2): 105
Hoskisson RE, Hitt MA, Johnson RA, Moesel DD. 1993. Construct validity of an objective (entropy) categorical measure of diversification strategy. Strategic Management Journal 14(3): 215-235
SMJ03-5327.FINAL
30
Ilinitch AY, Lewin AY, D'Aveni RA. 1998. Managing in Times of Disorder: Hypercompetitive Organizational Rresponses. SAGE Publications: Thousand Oaks, CA
Jacobsen R. 1988. The persistence of abnormal returns. Strategic Management Journal 9: 415-430
Jacobson R. 1992. The 'Austrian' school of strategy. Academy of Management Review 17(4): 782-807
Jacquemin AP, Berry CH. 1979. Entropy measure of diversification and corporate growth. The Journal of Industrial Economics 27(4): 359-369
Jenny FY, Weber A-P. 1990. The persistence of profits in France. In DC Mueller (Ed.), The Dynamics of Company Profits: 123-126. Cambridge University Press: Cambridge, UK
Kambhampati US. 1995. The persistence of profit differentials in Indian industry. Applied Economics 27: 353-361
Kessides IN. 1990. The persistence of profits in U.S. manufacturing industries. In DC Mueller (Ed.), The Dynamics of Company Profits: 59-76. Cambridge University Press: Cambridge, UK
Khemani RS, Shapiro DM. 1990. The persistence of profitability in Canada. In DC Mueller (Ed.), The Dynamics of Company Profits: 77-104. Cambridge University Press: Cambridge, UK
Levonian ME. 1994. The persistence of bank profits: What the stock market implies. Economic Review - Federal Reserve Bank of San Francisco(2): 3-17
Makadok R. 1998. Can first-move and early-mover advantages be sustained in an industry with low barriers to entry/imititation? Strategic Management Journal 19(7): 683-696
Mason ES. 1939. Price and production policies of large-scale enterprise. American Economic Review 29: 61-74
Mason ES. 1949. The current state of the monopoly problem in the United States. Harvard Law Review 62: 1265-1285
McDonald JT. 1999. The determinants of firm profitability in Australian manufacturing. The Economic Record 75(229): 115-126
McGahan AM, Porter ME. 1999. The persistence of shocks to profitability. The Review of Economics and Statistics 81(1): 143-152
McNamara G, Vaaler PM, Devers C. 2003. Same as it ever was: The search for evidence of increasing competition. Strategic Management Journal 24(3): 261-278
Mueller DC. 1977. The persistence of profits above the norm. Economica 44: 369-380
SMJ03-5327.FINAL
31
Mueller DC. 1986. Profits in the Long Run. Cambridge University Press: Cambridge, UK
Mueller DC (Ed.). 1990. The Dynamics of Company Profits. Cambridge University Press: Cambridge, UK
Nelson RR, Winter SG. 1982. An Evolutionary Theory of Economic Change. Belknap Press: Cambridge, MA
Odagiri H, Yamawaki H. 1990. The persistence of profits in Japan. In DC Mueller (Ed.), The Dynamics of Company Profits.: 129-146. Cambridge University Press: Cambridge, UK
Odagiri H, Yamawaki H. 1990. The persistence of profits: International comparison. In DC Mueller (Ed.), The Dynamics of Company Profits.: 169-186. Cambridge University Press: Cambridge, UK
Palepu K. 1985. Diversification strategy, profit performance and the entropy measure. Strategic Management Journal 6(3): 239-255
Perfect SB, Wiles KW. 1994. Alternative constructions of Tobin's q: An empirical comparison. Journal of Empirical Finance 1: 313-341
Porter ME. 1980. Competitive Strategy: Techniques for Analyzing Industries and Competitors. The Free Press: New York
Porter ME. 1985. Competitive Advantage: Creating and Sustaining Superior Performance. The Free Press: New York
Porter ME. 1996. What is strategy? Harvard Business Review 74(1): 61-78
Powell TC. 2001. Competitive advantage: Logical and philosophical considerations. Strategic Management Journal 22(9): 875-888
Powell TC. 2002. The philosophy of strategy. Strategic Management Journal 23(9): 873-880
Powell TC. 2003. Strategy without ontology. Strategic Management Journal 24(3): 285-291
Roberts PW. 1999. Product innovation, product-market competition and persistent profitability in the U.S. pharmaceutical industry. Strategic Management Journal 20: 655-670
Ruefli TW, Wiggins RR. 2000. Longitudinal performance stratification: An iterative Kolmogorov-Smirnov approach. Management Science 46(5): 685-692
Ruefli TW, Wiggins RR. 2003. Industry, corporate and segment effects and business performance: A non-parametric approach. Strategic Management Journal
Schohl F. 1990. Persistence of profits in the long run: A critical extension of some recent findings. International Journal of Industrial Organization 8(3): 385-404
SMJ03-5327.FINAL
32
Schumpeter JA. 1939. Business Cycles: A Theoretical, Historical, and Statistical Analysis of the Capitalist Process. McGraw-Hill: New York
Schumpeter JA. 1942. Capitalism, Socialism and Democracy. Harper: New York
Schumpeter JA. 1947. The creative response in economic history. Journal of Economic History 7: 149-159
Schwalbach J, Mahmood T. 1990. The persistence of profits in the Federal Republic of Germany. In DC Mueller (Ed.), The Dynamics of Company Profits.: 105-122. Cambridge University Press: Cambridge, UK
Starbuck WH. 1993. Strategizing in the real world. International Journal of Technology Management 8: 77-86
Thomas LG, III. 1996. Dynamic resourcefulness and the hypercompetitive shift. Organization Science 7(3): 221-242
Tuma NB, Hannan MT. 1984. Social Dynamics: Models and Methods. Academic Press: New York
Varaiya N, Kerin RA, Weeks D. 1987. The relationship between growth, profitability, and firm value. Strategic Management Journal 8: 487-497
Waring GF. 1996. Industry difference in the persistence of firm-specific returns. American Economic Review 86(5): 1253-1265
Wiggins RR, Ruefli TW. 2002. Sustained competitive advantage: Temporal dynamics and the incidence and persistence of superior economic performance. Organization Science 13(1): 81-105
Young G, Smith KG, Grimm CM. 1996. "Austrian" and industrial organization perspectives on firm-level competitive activity and performance. Organization Science 7(3): 243-254
SMJ03-5327.FINAL
33
Table 1 Summary of Empirical Studies of the Persistence of Superior Economic Performance Study Data base Years
included Industry types Number
of firms Dependent variable Statistical
technique Findings
Carey (1974) Compustat 1963-72 19 4-digit SIC 252 Net Profit Margin, ROA, ROE
Coefficient of concordance
Persistence in all industries
Mueller (1977) Compustat 1949-72 Unspecified 472 ROA OLS regression Persistence for some firms Connolly & Schwartz (1985)
Compustat 1963-1982 Nonregulated 751 “Excess value” (market value – book value/sales)
OLS regression, autoregression
Persistence for positive profit firms (higher profits associated with higher persistence)
Mueller (1986) FTC Compustat 1950-72 Manufacturing 1000 ROA OLS regression Persistence for some firms associated with market share, industry; M&A dampens persistence
Cubbin & Geroski (1987)
UK DTI and DAE Cambridge University
1951-77 48 3-digit (UK only)
217 “Profit rate” (industry average compared to sample average)
OLS regression and full info. max. likelihood
Persistence associated with firm-specific effects (and not with industry-specific effects)
Geroski & Jacquemin (1988)
Cubbin Schwalbach BALO
49-77 UK 61-81 Ger 65-82 Fr
8 sectors 51 UK 28 Ger 55 Fr
ROA 3rd order autoregression
Persistence much higher in UK than France and West Germany; no factors systematically associated with persistence
Jacobsen (1988) PIMS CRSP & Compustat
1970-83 1963-82
unspecified 2000 bu 241
ROI AR(1) regression Little persistence No effect of industry concentration Some effect of market share
Contini (1989) ISTAT Annual Survey of Mfrs.
1973, 1977, and 1981
Manufacturing (Italy only)
NA Gross profit ratio Contingency tables Persistence in all industries
Cubbin & Geroski (1990)
UK DTI and DAE Cambridge University
1948-77 48 3-digit (UK only)
243 “Profit rate” (industry average compared to sample average)
1st order autoregression
Persistence associated with firm-specific effects (and not with industry-specific effects)
Jenny & Weber (1990)
Public disclosures 1965-82 Manufacturing (France only)
450 ROA (before tax) OLS regression Persistence for both high performers and low performers
Kessides (1990) Compustat 1967-82 344 4-digit NA ROS GLS regression Industry persistence associated with small numbers of firms, concentration, growth, scale, high capital requirements
Khemani & Shapiro (1990)
Compustat 1964-82 1968-82
Manufacturing and mining (Canada only)
129 161
ROA (both before and after tax)
OLS regression Persistence (greater than in U.S.) associated with product differentiation
Mueller (1990) FTC Compustat 1950-72 Manufacturing (63 3-digit and 4-digit)
551 ROA OLS regression Persistence associated with market share, product differentiation, growth; negatively associated with concentration, M&A
Odagiri & Yamawaki (1990)
Corporation Enterprise Survey
1964-82 Manufacturing (Japan, and U.S. comparisons)
376 ROA (after tax) OLS regression Persistence for both high and low performers, associated with industry concentration, market share, industry advertising intensity
Odagiri & Yamawaki (1990)
Various 64-82 Ca 65-82 Fr 61-
Manufacturing and nonfinancial
161 Ca 450 Fr
ROA (after tax) OLS regression Persistence highest in US, followed by Canada and France, followed by UK, followed by Japan, with
SMJ03-5327.FINAL
34
82 Ger 64-82 Jap 67-85 Swe 51-77 UK 50-72 US 64-80 US
299 Ger 376 Jap 43 Swe 243 UK 551 US 413 US
West Germany the lowest.
Schohl (1990) Public disclosures 1961-84 Manufacturing (West Germany only)
283 “Profit rate” (firm profit – sample avg. / sample avg.)
OLS regression (PA and PC models)
Persistence under both partial adjustment and polynomial convergence models
Schwalbach & Mahmood (1990)
Public disclosures 1961-82 Manufacturing (West Germany only)
299 ROA (both before and after tax), Marris’s V
Autoregression Persistence associated with firm size, mobility barriers, product differentiation
Droucopoulos & Lianos (1993)
Annual Industrial Survey (NSSG)
1963-88 Manufacturing (Greece only)
500 “Profit rate” (value added – depreciation – wages/capital + wages)
OLS regression Persistence associated with advertising intensity, export intensity, foreign firms; negatively effected by capital intensity, size, and risk
Levonian (1994) Compustat 1986-91 Banking 83 ROE Nonlinear LS regression
Persistence that decays slowly over time
Kambhampati (1995)
Reserve Bank of India, Bombay
1970-85 Multiple (42) (India only)
NA “Profit differentials” (industry relative to economy-wide)
OLS regression Persistence in a large number of industries associated with high growth and high concentration ratios
Goddard & Wilson (1996)
ACROBATS (University of Bath)
1972-91 Manufacturing and services (UK only)
425 UK “Profit rate” (firm profit – sample avg. / sample avg.)
AR(1) regression Service industries more persistent than manufacturing industries
Waring (1996) Compustat 1970-89 All (68 2-digit) 12,986 ROA AR(1) regression Persistence varies by industry McDonald (1999) IBIS 1984-93 Manufacturing
(Australia only) 246 ROS as proxy for price-cost
margin Instrumental variables
Strong degree of persistence
McGahan & Porter (1999)
Compustat Segment
1982-94 All but depository institutions and miscellaneous
7,005 ROA (Operating income/identifiable assets)
OLS regression Industry persistence 76.6-81.8% Corporate persistence 53.6-71.7% Segment persistence 47.9-65.5%
Roberts (1999) IMS, Compustat, GlobalScope
1977-93 Pharmaceuticals 42 ROA (Firm ROA - ind. ROA / ind. ROA)
Autoregression Persistence associated with innovative propensity
Foster & Kaplan (2001)
McKinsey Corporate Performance
1962-98 15 industries 1008 TRS (Total Return to Stockholders)
Dynamic Performance Analysis
Firms cannot beat market for more than 10 to 15 years.
Wiggins & Ruefli (2002)
Compustat 1972-97 40 6,772 ROA Tobin’s q
Event history analysis and ordinal time series analysis
ROA persistence in all 40 industries (5% of firms; attainment positively correlated with size, negatively with diversification); Tobin’s q persistence in 35 industries (2% of firms; attainment negatively correlated with size)
Ruefli & Wiggins (2003)
Compustat Segment
1980-96 All (278 3-digit; 392 4-digit)
8,806 ROA (Operating income/identifiable assets)
Ordinal (PLUM) regression and Cox regression
Industry persistence 62.6% Corporate persistence 54.4% Segment persistence 43.4%
SMJ03-5327.FINAL
35
Table 2 Means, Standard Deviations, Minimums, Maximums, and Bivariate Correlations for All Study Variables* Variable Mean S.D. Min. Max. 1 2 3 4 5 6 7 8 9 1 ROA PSP 0.0542 0.2300 0 1 1.000 2 q PSP 0.0801 0.2700 0 1 .192••• 1.000 3 Density 81.3800 66.1800 5 336 .040•• .024 1.000 4 Entropy 0.2464 0.4228 0 2.1818 .014 -.007 -.184••• 1.000 5 Market Share 0.0404 0.0933 0 0.6925 .018 -.003 -.211••• .428••• 1.000 6 Size 5.0841 2.6080 -10 10.9256 .030• .045 -.178••• .341••• .446••• 1.000 7 4-Firm Conc. 0.5702 0.1761 0.1301 0.9751 .006 .006 -.264••• .082••• .254••• -.114••• 1.000 8 Period 12.7000 5.8700 1 22 .107••• .106••• .126••• -.137••• -.025 .069••• -.080••• 1.000 9 Period**2 195.6842 144.1698 1 484 .103••• .103••• .101••• -.130••• -.020 .082••• -.091••• .974••• 1.000 10 SIC1000 0.0104 0.1017 0 1 .010 -.021 -.090••• .011 .083••• -.003 .173••• .061••• .067••• 11 SIC104X 0.0308 0.1727 0 1 .014 .023 -.047••• -.067••• -.010 -.094••• -.092••• .033• .034• 12 SIC1311 0.0924 0.2897 0 1 .030• -.026 .655••• -.040••• -.090••• -.241••• .103••• -.035• -.051••• 13 SIC1531 0.0101 0.0998 0 1 .026 .020 -.062••• -.025 .012 -.035• -.049••• -.077••• -.069••• 14 SIC2621 0.0192 0.1370 0 1 .012 -.025 -.125••• .005 -.009 .077••• -.103••• -.026 -.024 15 SIC267X 0.0201 0.1404 0 1 -.015 -.017 -.123••• .166••• .352••• .111••• .192••• -.028• -.020 16 SIC2711 0.0093 0.0960 0 1 .019 -.007 -.097••• .083••• .018 .022 .012 -.043•• -.035• 17 SIC2721 0.0170 0.1294 0 1 -.008 -.004 -.142••• .086••• .149••• -.010 .195••• -.021 -.030• 18 SIC2731 0.0114 0.1062 0 1 .007 .012 -.098••• .112••• .067••• -.001 .010 -.095••• -.093••• 19 SIC2834 0.0969 0.2958 0 1 -.043•• .025 .047••• .150••• -.032• .096••• -.390••• .083••• .088••• 20 SIC2835 0.0211 0.1437 0 1 -.037• .012 -.070••• -.035• .023 -.106••• .077••• .123••• .127••• 21 SIC2851 0.0087 0.0929 0 1 .011 -.022 -.100••• -.037•• -.011 .012••• .160••• -.008 -.009 22 SIC2911 0.0097 0.0979 0 1 -.010 .025 -.068••• .047••• -.034• .029• -.089••• .022 .017 23 SIC3089 0.0311 0.1737 0 1 .003 -.029 -.129••• .068••• .056••• .010 .121••• .016 .021 24 SIC331X 0.0335 0.1798 0 1 .025 -.005 -.103••• .148••• -.052••• .069••• -.083••• -.097••• -.084••• 25 SIC355X 0.0116 0.1071 0 1 .010 -.006 -.058••• -.031• -.036• -.072••• -.045••• .039•• .043•• 26 SIC357X 0.0592 0.2360 0 1 .013 .012 .313••• -.109••• -.048••• -.074••• .116••• .041•• .026 27 SIC365X 0.0099 0.0988 0 1 .000 -.013 -.087••• -.010 -.023 -.012 .169••• .072••• .081••• 28 SIC3661 0.0145 0.1196 0 1 .023 .000 -.058••• -.057••• -.010 -.017 .208••• -.003 -.013 29 SIC3674 0.0151 0.1219 0 1 .022 -.017 -.047••• -.072••• -.008 .011 .120••• .056••• .068••• 30 SIC3714 0.0259 0.1589 0 1 -.027 .014 -.094••• .013 -.066••• .050••• .079••• -.033• -.027• 31 SIC3812 0.0124 0.1106 0 1 .019 .020 -.084••• .040•• .017 -.026 .108••• -.059••• -.055••• 32 SIC3841 0.0234 0.1512 0 1 .004 .030 -.100••• -.028• -.046••• -.104••• .238••• .006 .000 33 SIC3845 0.0193 0.1377 0 1 .000 -.020 -.031••• -.073••• .040•• -.061••• -.015 .082••• .076••• 34 SIC3861 0.0073 0.0854 0 1 .004 .016 -.076••• .001 .082••• .043• .157••• -.014 -.016 35 SIC421X 0.0253 0.1572 0 1 .005 .009 -.098••• -.094••• .045••• .040• .047••• -.021 -.021 36 SIC4512 0.0093 0.0959 0 1 .025 .012 -.071••• -.055••• -.032• .003 -.064••• -.100••• -.096••• 37 SIC481X 0.0547 0.2275 0 1 -.009 .018 .072••• -.036•• -.102••• -.113••• -.221••• .062••• .053••• 38 SIC4833 0.0054 0.0734 0 1 .006 .000 -.073••• .012 -.030• -.047••• .149••• -.072••• -.069••• 39 SIC4911 0.0128 0.1123 0 1 -.013 .006 -.017 -.026 -.040•• .035• -.235••• .023 .027 40 SIC5311 0.0205 0.1417 0 1 -.001 -.013 -.113••• .042•• -.003 .147••• .069••• -.026 -.022 41 SIC5411 0.0599 0.2374 0 1 -.037• -.006 -.143••• -.083••• -.034• .238••• -.195••• -.047••• -.031• 42 SIC5812 0.0567 0.2312 0 1 -.024 .005 .024 -.063••• -.057••• .034• -.081••• .007 .000 43 SIC602X 0.0422 0.2010 0 1 .039•• .013 .308••• -.122••• -.079••• .044•• -.344••• -.105••• -.106••• 44 SIC6211 0.0193 0.1377 0 1 -.008 -.015 -.093••• .019 .092••• .011 .166••• -.004 -.005 45 SIC6311 0.0151 0.1219 0 1 .004 -.015 -.089••• .151••• .062••• .112••• .014 .039•• .041•• 46 SIC7011 0.0315 0.1747 0 1 -.014 .002 -.130••• .100••• .077••• -.008 .269••• -.049••• -.052••• 47 SIC731X 0.0015 0.0393 0 1 .013 .000 -.041••• -.023 .019 -.001 .015 -.042•• -.040•• 48 SIC7372 0.0236 0.1518 0 1 -.001 -.007 .051••• -.091••• -.019 -.011 -.072••• .097••• .088••• 49 SIC7812 0.0019 0.0439 0 1 -.011 .000 -.034•• .075••• .141••• .061••• .050••• .036•• .036••
* Note: Bivariate correlations for industry dummy variables omitted. The ROA sample contained 4376 total spells and the Tobin’s q sample contained 1436 total spells.
••• is significant at the 0.001 level. •• is significant at the 0.01 level. • is significant at the 0.05 level.
SMJ03-5327.FINAL
36
Table 3 Descriptive Statistics for All Industries including Modal and Superior Strata Statistics for ROA and Tobin’s q 1974-1997 SIC Industry Name 1
N 2
Avg n (ROA)
3 Total Spells ROA
4 PSP
Spells ROA
5 % PSP Spells ROA
6 #PSP Firms ROA
7 PSP
Ratio ROA
8 Modal Mean ROA
9 Modal StDev ROA
10 SP
Mean ROA
11 SP
StDev ROA
12 Avg n
(q)
13 Total Spells
q
14 PSP
Spells q
15 % PSP Spells
q
16 #PSP Firms
q
17 PSP
Ratio q
18 Modal Mean
q
19 Modal StDev
q
20 SP
Mean q
21 SP
StDev q
1000 Metal Mining 66 21.45 429 37 8.62% 5 7.58% -12.87 73.71 13.54 32.74 14.70 294 7 2.38% 1 1.52% 2.10 8.44 12.25 22.45104x Gold and Silver Ores 180 57.35 1147 106 9.24% 14 7.78% -32.08 705.76 8.25 19.74 45.70 914 23 2.52% 3 1.67% -5.02 243.21 6.45 10.051311 Crude Petroleum and Natural Gas 739 234.25 4685 327 6.98% 39 5.28% -9.07 257.15 8.26 18.02 171.30 3426 157 4.58% 18 2.44% 1.84 101.26 10.42 65.921531 Operative Builders 107 43.60 872 25 2.87% 3 2.80% 0.54 16.08 9.10 8.03 33.55 671 0 0.00% 0 0.00% 0.93 4.01 2.41 1.682621 Paper Mills 39 23.15 463 55 11.88% 5 12.82% 4.23 7.27 11.03 3.24 19.95 399 27 6.77% 3 7.69% 1.22 0.57 2.49 0.99267x Paper and Paperboard 70 27.10 542 39 7.20% 2 4.29% 3.79 10.90 12.89 6.13 22.40 448 41 9.15% 3 4.29% 1.55 3.89 5.63 12.982711 Newspaper Publishing and Printing 44 17.90 358 17 4.75% 2 4.55% 8.25 5.30 12.23 2.66 14.75 295 19 6.44% 2 4.55% 2.38 4.74 4.28 2.002721 Periodical Publishing 38 11.55 231 45 19.48% 4 10.53% -1.72 23.02 9.65 6.81 8.20 164 36 21.95% 3 7.89% 2.21 8.06 3.85 2.402731 Book Publishing 47 18.10 362 42 11.60% 5 10.64% 4.09 8.12 11.02 5.74 13.65 273 7 2.56% 1 2.13% 1.56 1.01 3.78 2.142834 Pharmaceuticals 258 82.60 1652 319 19.31% 32 12.40% -16.61 45.89 10.89 9.00 69.45 1389 104 7.49% 13 5.04% 4.13 11.76 12.94 21.002835 In Vitro In Vivo Diagnostics 112 32.80 656 101 15.40% 11 9.82% -59.54 481.25 -2.82 45.76 24.70 494 7 1.42% 1 0.89% 3.49 24.56 13.87 34.872851 Paints and Allied Products 22 11.10 222 27 12.16% 2 9.09% 5.59 10.52 10.91 3.69 8.85 177 8 4.52% 1 4.55% 1.64 0.88 8.92 25.202911 Petroleum Refining 85 43.35 867 8 0.92% 1 1.18% 4.32 4.84 9.04 4.56 35.85 717 37 5.16% 5 5.88% 1.11 12.45 11.49 66.963089 Misc. Plastic Products 107 37.75 755 77 10.20% 7 6.54% 2.36 7.33 9.75 3.40 30.00 600 49 8.17% 6 5.61% 1.33 1.99 6.32 14.13331x Steel Works and Blast Furnaces 118 49.30 986 41 4.16% 4 3.39% 1.74 10.14 9.55 4.80 39.60 792 68 8.59% 6 5.08% 0.76 5.20 2.11 1.24355x Special Industrial Machinery 160 48.15 963 26 2.70% 4 2.50% 0.39 15.79 11.01 8.03 39.60 792 28 3.54% 4 2.50% 1.16 12.95 5.88 18.26357x Office Equipment and Elec. Computing 557 161.30 3226 183 5.67% 22 3.95% -3.96 43.78 11.97 7.34 131.30 2626 96 3.66% 12 2.15% 1.38 49.62 7.73 62.91365x Household Audio and Video Equipment 87 23.95 479 29 6.05% 4 4.60% 0.61 11.27 9.61 4.67 18.85 377 19 5.04% 3 3.45% 1.55 3.41 6.79 15.263661 Telephone and Telegraph Equipment 164 48.95 979 62 6.33% 8 4.88% -2.65 20.75 11.07 8.62 39.30 786 0 0.00% 0 0.00% 0.41 47.46 9.52 20.473674 Semiconductors and Related Devices 159 50.25 1005 44 4.38% 7 4.40% 1.53 17.03 12.27 4.86 42.50 850 16 1.88% 2 1.26% 2.24 4.31 4.33 6.283714 Auto Parts and Accessories 133 44.40 888 89 10.02% 7 5.26% 2.55 20.65 59.25 1041.64 35.95 719 23 3.20% 3 2.26% 1.43 3.38 3.27 2.213812 Navigation and Guidance Systems 69 30.45 609 36 5.91% 4 5.80% 3.69 10.71 11.65 5.29 25.80 516 12 2.33% 2 2.90% 2.05 5.03 7.21 11.873841 Surgical and Medical Equipment 159 40.85 817 74 9.06% 8 5.03% -3.19 45.85 12.25 7.08 30.30 606 22 3.63% 3 1.89% 4.48 33.04 19.86 61.183845 Electromedical Apparatus 185 50.75 1015 71 7.00% 7 3.78% -8.20 30.12 10.80 6.93 39.30 786 24 3.05% 3 1.62% 6.62 91.74 43.84 255.413861 Photographic Equipment and Supplies 66 24.40 488 27 5.53% 3 4.55% -0.37 29.36 10.37 4.63 18.05 361 6 1.66% 1 1.52% 2.23 7.02 6.17 10.81421x Trucking (except local) 148 42.15 843 91 10.79% 9 6.08% 1.62 12.50 9.76 3.85 30.05 601 23 3.83% 3 2.03% 1.50 12.60 4.59 30.164512 Airlines 110 33.80 676 28 4.14% 4 3.64% -1.56 20.00 6.38 9.41 25.20 504 0 0.00% 0 0.00% 1.60 6.41 4.58 9.53481x Telephone Communications 305 117.00 2340 240 10.26% 27 8.85% 5.05 6.56 9.93 4.61 45.60 912 75 8.22% 9 2.95% 2.13 23.21 11.63 46.894833 Television Broadcast Stations 75 20.15 403 23 5.71% 3 4.00% 2.97 15.09 11.03 6.35 15.55 311 0 0.00% 0 0.00% 2.31 8.38 6.09 7.044911 Electrical Services 168 71.55 1431 48 3.35% 5 2.98% 4.18 1.41 5.71 1.67 63.55 1271 8 0.63% 1 0.60% 1.14 0.95 1.64 2.935311 Department Stores 78 29.75 595 71 11.93% 7 8.97% 2.86 7.05 7.43 3.21 22.45 449 19 4.23% 2 2.56% 0.92 8.65 2.90 15.695411 Grocery Stores 133 45.05 901 178 19.76% 14 10.53% 3.26 4.49 9.24 3.45 35.70 714 98 13.73% 10 7.52% 2.35 38.93 3.01 1.955812 Eating Places 316 91.75 1835 227 12.37% 20 6.33% 0.23 13.82 10.78 6.62 68.80 1376 28 2.98% 5 1.58% 2.11 4.71 6.23 36.07602x Commercial Banks 678 203.35 4067 120 2.95% 13 1.92% 0.73 1.37 1.26 2.99 190.35 3807 45 1.18% 6 0.88% 1.12 0.65 1.81 0.896211 Securities Brokers and Dealers 107 37.95 759 68 8.96% 7 6.54% -0.68 34.88 5.85 8.14 30.95 619 14 2.26% 1 0.93% 1.20 1.15 3.68 2.746311 Life Insurance 103 33.40 668 48 7.19% 5 4.85% 1.68 2.51 3.83 2.35 31.35 627 20 3.19% 3 2.91% 1.00 0.60 2.22 1.297011 Hotels and Motels 102 35.20 704 117 16.62% 10 9.80% -1.07 30.81 7.65 7.95 21.55 431 22 5.10% 2 1.96% 1.40 3.01 4.14 5.31731x Advertising Agencies 64 14.25 285 7 2.46% 1 1.56% 1.11 15.33 8.76 3.30 11.50 230 0 0.00% 0 0.00% 1.97 9.26 13.20 25.717372 Prepackaged Software 512 75.00 1500 99 6.60% 13 2.54% -4.89 43.10 15.91 8.75 54.90 1098 31 2.82% 4 0.78% 4.83 32.67 14.04 105.537812 Motion Picture Production 102 24.90 498 10 2.01% 1 0.98% -15.27 394.81 4.94 15.34 20.00 400 7 1.75% 1 0.98% 2.53 13.85 5.72 17.27
Totals/Averages 6772 42201 3282 7.78% 350 5.17% 10.48 166.38 32822 1239 3.77% 139 2.16% 8.65 62.27
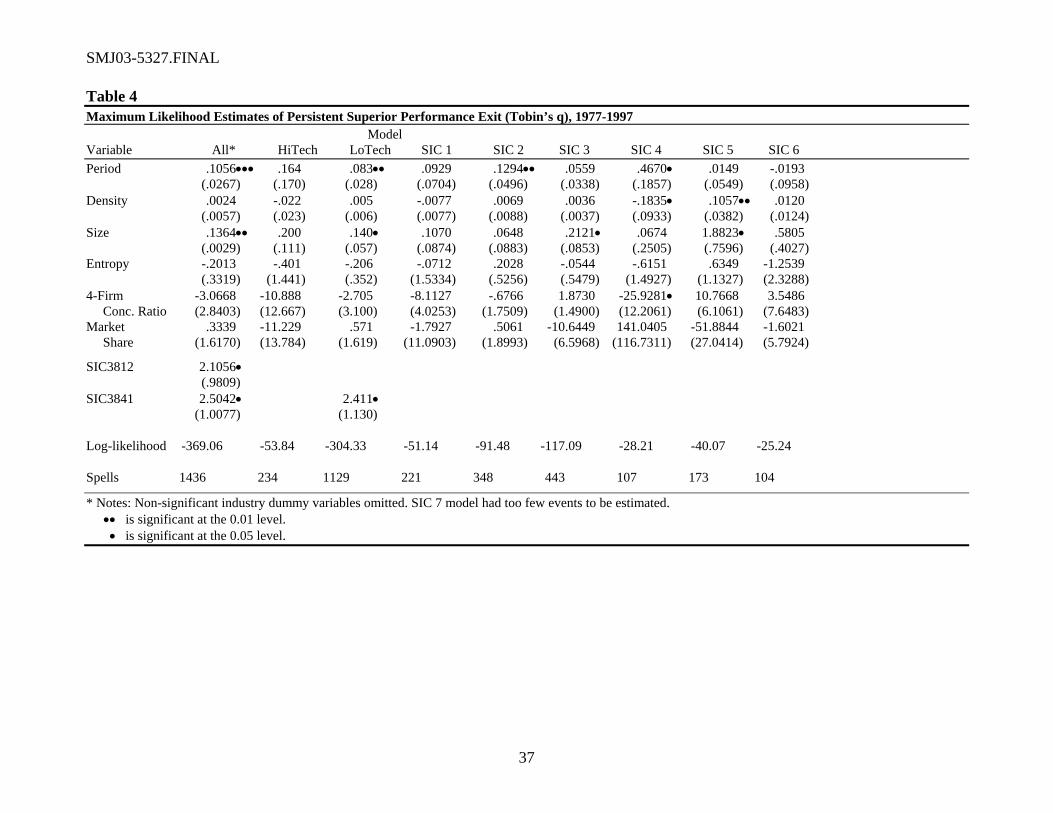
SMJ03-5327.FINAL
37
Table 4 Maximum Likelihood Estimates of Persistent Superior Performance Exit (Tobin’s q), 1977-1997 Model Variable All* HiTech LoTech SIC 1 SIC 2 SIC 3 SIC 4 SIC 5 SIC 6 Period .1056••• .164 .083•• .0929 .1294•• .0559 .4670• .0149 -.0193 (.0267) (.170) (.028) (.0704) (.0496) (.0338) (.1857) (.0549) (.0958) Density .0024 -.022 .005 -.0077 .0069 .0036 -.1835• .1057•• .0120 (.0057) (.023) (.006) (.0077) (.0088) (.0037) (.0933) (.0382) (.0124) Size .1364•• .200 .140• .1070 .0648 .2121• .0674 1.8823• .5805 (.0029) (.111) (.057) (.0874) (.0883) (.0853) (.2505) (.7596) (.4027) Entropy -.2013 -.401 -.206 -.0712 .2028 -.0544 -.6151 .6349 -1.2539 (.3319) (1.441) (.352) (1.5334) (.5256) (.5479) (1.4927) (1.1327) (2.3288) 4-Firm -3.0668 -10.888 -2.705 -8.1127 -.6766 1.8730 -25.9281• 10.7668 3.5486 Conc. Ratio (2.8403) (12.667) (3.100) (4.0253) (1.7509) (1.4900) (12.2061) (6.1061) (7.6483) Market .3339 -11.229 .571 -1.7927 .5061 -10.6449 141.0405 -51.8844 -1.6021 Share (1.6170) (13.784) (1.619) (11.0903) (1.8993) (6.5968) (116.7311) (27.0414) (5.7924)
SIC3812 2.1056• (.9809) SIC3841 2.5042• 2.411• (1.0077) (1.130)
Log-likelihood -369.06 -53.84 -304.33 -51.14 -91.48 -117.09 -28.21 -40.07 -25.24
Spells 1436 234 1129 221 348 443 107 173 104
* Notes: Non-significant industry dummy variables omitted. SIC 7 model had too few events to be estimated. •• is significant at the 0.01 level. • is significant at the 0.05 level.
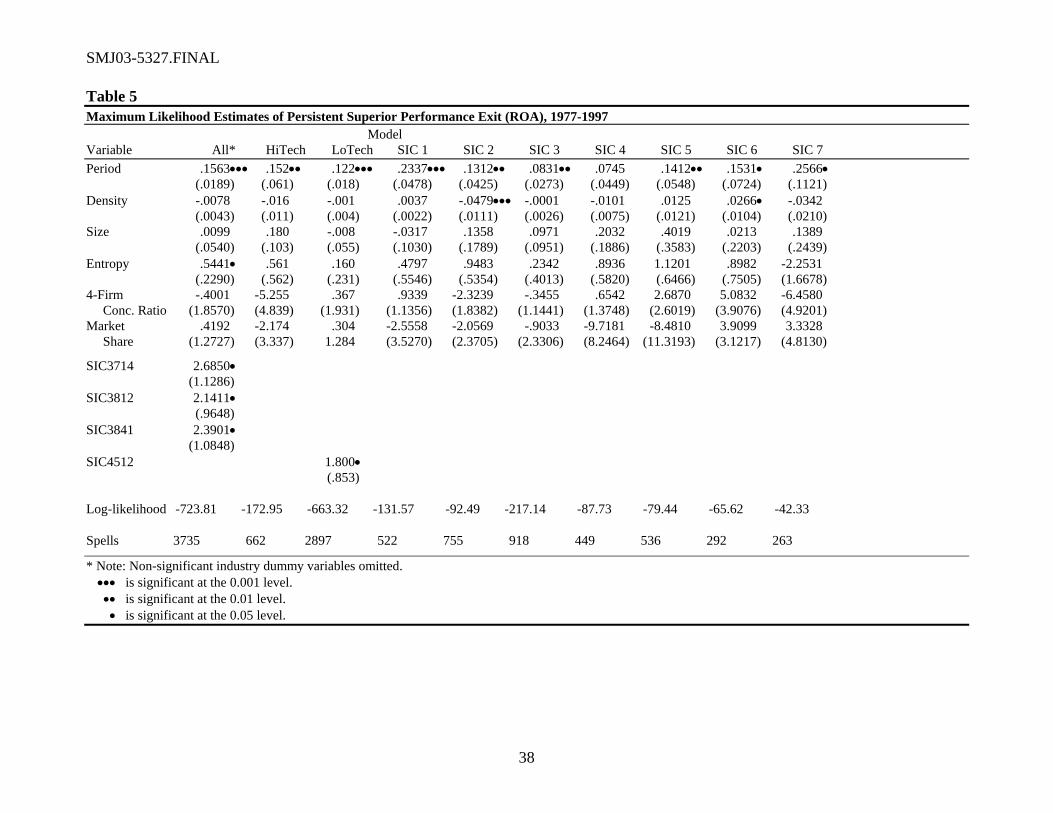
SMJ03-5327.FINAL
38
Table 5 Maximum Likelihood Estimates of Persistent Superior Performance Exit (ROA), 1977-1997 Model Variable All* HiTech LoTech SIC 1 SIC 2 SIC 3 SIC 4 SIC 5 SIC 6 SIC 7 Period .1563••• .152•• .122••• .2337••• .1312•• .0831•• .0745 .1412•• .1531• .2566• (.0189) (.061) (.018) (.0478) (.0425) (.0273) (.0449) (.0548) (.0724) (.1121) Density -.0078 -.016 -.001 .0037 -.0479••• -.0001 -.0101 .0125 .0266• -.0342 (.0043) (.011) (.004) (.0022) (.0111) (.0026) (.0075) (.0121) (.0104) (.0210) Size .0099 .180 -.008 -.0317 .1358 .0971 .2032 .4019 .0213 .1389 (.0540) (.103) (.055) (.1030) (.1789) (.0951) (.1886) (.3583) (.2203) (.2439) Entropy .5441• .561 .160 .4797 .9483 .2342 .8936 1.1201 .8982 -2.2531 (.2290) (.562) (.231) (.5546) (.5354) (.4013) (.5820) (.6466) (.7505) (1.6678) 4-Firm -.4001 -5.255 .367 .9339 -2.3239 -.3455 .6542 2.6870 5.0832 -6.4580 Conc. Ratio (1.8570) (4.839) (1.931) (1.1356) (1.8382) (1.1441) (1.3748) (2.6019) (3.9076) (4.9201) Market .4192 -2.174 .304 -2.5558 -2.0569 -.9033 -9.7181 -8.4810 3.9099 3.3328 Share (1.2727) (3.337) 1.284 (3.5270) (2.3705) (2.3306) (8.2464) (11.3193) (3.1217) (4.8130)
SIC3714 2.6850• (1.1286) SIC3812 2.1411• (.9648) SIC3841 2.3901• (1.0848) SIC4512 1.800• (.853)
Log-likelihood -723.81 -172.95 -663.32 -131.57 -92.49 -217.14 -87.73 -79.44 -65.62 -42.33
Spells 3735 662 2897 522 755 918 449 536 292 263
* Note: Non-significant industry dummy variables omitted. ••• is significant at the 0.001 level. •• is significant at the 0.01 level. • is significant at the 0.05 level.

SMJ03-5327.FINAL
39
Table 6 Maximum Likelihood Estimates of Superior Performance Exit (ROA), 1980-1996 Model Variable Industry Corporate SBU Period 0.329••• 0.251••• 0.204••• (.097) (.043) (.033) Period2 -0.027••• -0.010••• -0.009••• (.006) (.002) (.002) Density -0.035••• -0.002••• -0.002••• (.008) (.001) (.000)
Log-likelihood -488.30 -4932.61 -8100.52
Spells 1,276 12,446 17,900 ••• is significant at the 0.001 level. Table 7 Maximum Likelihood Estimates of Performance Pattern: Superior-Not Superior-Superior 1978-1997
Measure ROA Tobin’s q
1978-87 1988-1997 1978-87 1988-1997 Incidence of pattern 133 188 72 140
Incidence of non-pattern 12087 15366 15562 19571N = 27774 35345
Likelihood chi-square 100132.04••• 150484.29••• ••• is significant at the 0.001 level. Table 8 Business Unit Level Mean ROA Performance Versus Time, 1980-1996 Model Variable All Superior Modal Inferior Constant 0.118••• 0.432••• 0.096••• -0.152••• (.009) (.015) (.004) (.020) Period -0.010••• -0.016••• -0.003••• -0.027••• (.001) (.002) (.001) (.003) F 67.241••• 59.104••• 30.277••• 102.293••• R2 0.871 0.855 0.752 0.911 d.f. 11 11 11 11 N 71,607 14,843 43,063 13,701 ••• is significant at the 0.001 level.
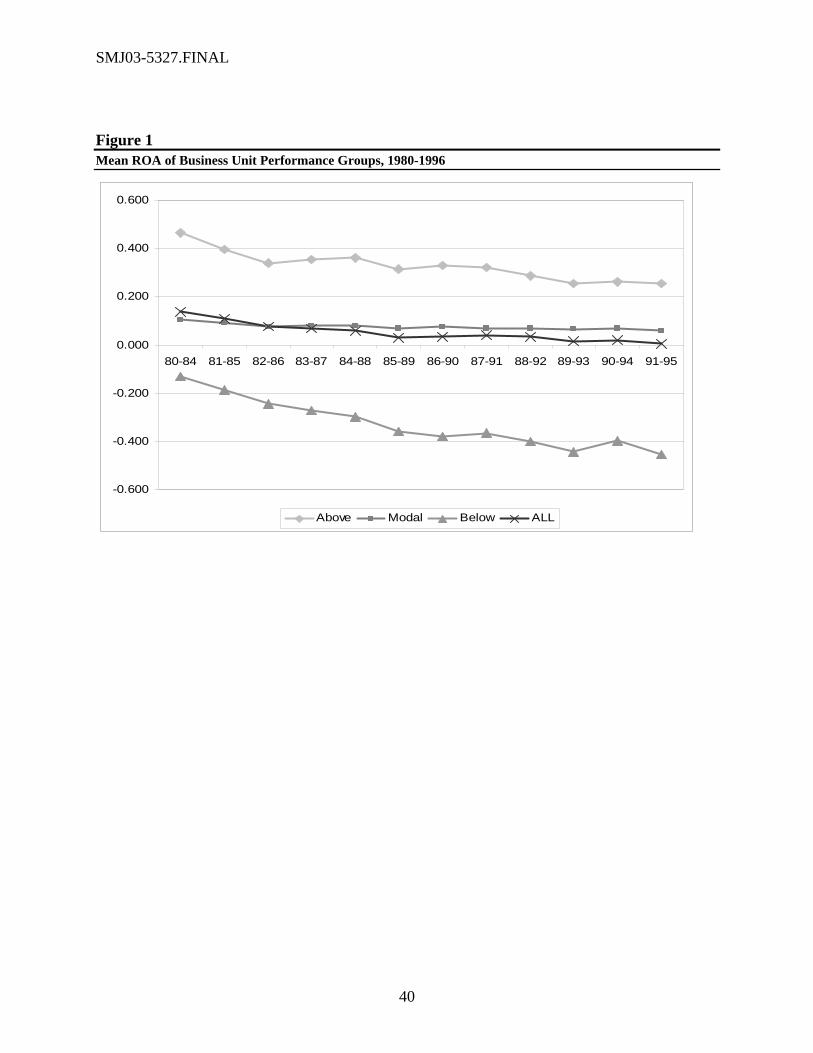
SMJ03-5327.FINAL
40
Figure 1 Mean ROA of Business Unit Performance Groups, 1980-1996
-0.600
-0.400
-0.200
0.000
0.200
0.400
0.600
80-84 81-85 82-86 83-87 84-88 85-89 86-90 87-91 88-92 89-93 90-94 91-95
Above Modal Below ALL