Embed Size (px)
Citation preview

September 2016 | For professional investors or advisers only. *Schroder International Selection Fund is referred to as Schroder ISF throughout the presentation
Schroder ISF*
European Equity
Absolute Return
October 2016
James Freeman | Product Manager

Fund Manager
Steve Cordell – Fund Manager
Moved across to Schroders as part of the takeover of Cazenove Capital
in July 2013
Originally joined Cazenove Capital in 2002
A senior member of the Pan-European equity team and manager of the
Schroder European Opportunities Fund, Schroder ISF European Equity
Absolute Return, Schroder ISF European Opportunities, Schroder ISF
European Equity (ex. UK) and Schroder European Absolute
Target fund
Previously at HSBC Asset Management (Europe) Ltd where he was
responsible for several retail and institutional Pan-European portfolios
Has 22 years of investment experience, including over 12 years
managing absolute return funds
1
Source: Schroders
19/10/2016 17:54:28

UK and European Equities Well resourced team of over 50 professionals
2
Source: Schroders, as at 30 September 2016 1 Includes two Global Analysts with full global sector coverage that make a significant contribution to UK and European equity portfolios
Head of UK and European Equities
Rory Bateman
Specialist / Quality
12 Pan European Sector Analysts1
Business Cycle Blend
Global Head of Equities
Nicky Richards
Value Small & Mid Cap Dynamic Small
5
Fund Managers /
Analysts
8
Fund Managers /
Analysts
9
Fund Managers /
Analysts
6
Fund Managers /
Analysts
6
Fund Managers /
Analysts
3
Fund Managers /
Analysts
8 Pan European Equity Product Team, 6 Equity traders, 5 Fund Management Assistants

Business cycle team
3
Source: Schroders, as at 31 July 2016
Pan European team with shared research responsibilities
Matt Hudson
Head of Pan-European Business Cycle
Investment team and product responsibilities
Matt Hudson Michael Zorko (UK Equity & Income)
Steve Cordell Nitin Bhalotia (Pan Europe)
Lionel Rayon Thibault Levacher (Pan Europe, High Alpha)
James Sym James Rutland (Pan Europe & Income)

Schroder ISF European Equity Absolute Return
HFRI Equity Long/Short
HFRI Equity Market Neutral
HFRI Fund of Funds
MSCI World
FTSE World Europe
JPM World Gov Bonds
0%
1%
2%
3%
4%
5%
6%
7%
8%
9%
0% 2% 4% 6% 8% 10% 12% 14% 16%
Annual return
Annual Volatility
Why consider alternatives? Risk return reward – Schroder ISF European Equity Absolute Return
4
Source: Schroders, Datastream and HFRI. As at 31 August 2016. Schroder ISF European Equity Absolute Return was launched in February 2014 to accommodate a transfer of
shareholders from the Cazenove fund to the Schroder ISF SICAV. Prior to 11 February 2014 the fund uses the track record of Cazenove European Equity Absolute Return Fund
(launched on 30/10/2003) as a performance track record.
Targeting positive
returns, net of fees,
independent of market
conditions
A portfolio diversifier
Low market correlation
Broadly market neutral
Daily priced UCITS
SICAV structure
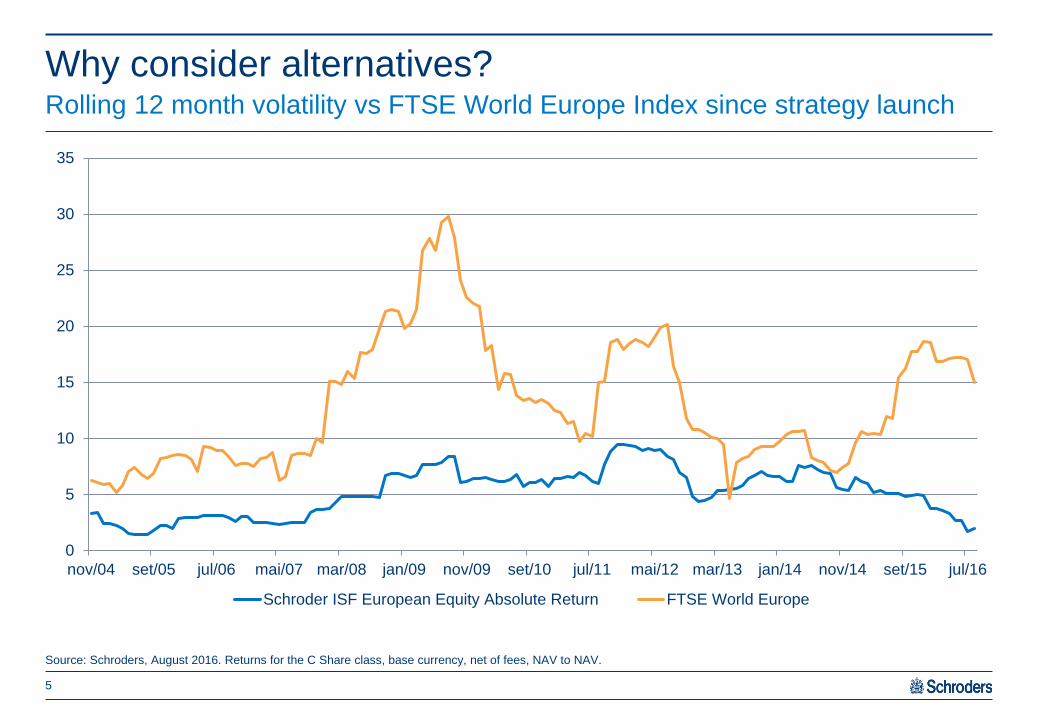
Why consider alternatives? Rolling 12 month volatility vs FTSE World Europe Index since strategy launch
Source: Schroders, August 2016. Returns for the C Share class, base currency, net of fees, NAV to NAV.
5
0
5
10
15
20
25
30
35
nov/04 set/05 jul/06 mai/07 mar/08 jan/09 nov/09 set/10 jul/11 mai/12 mar/13 jan/14 nov/14 set/15 jul/16
Schroder ISF European Equity Absolute Return FTSE World Europe

Worst market monthly drawdowns vs. fund
Protecting capital in market drawdowns Schroder ISF European Equity Absolute Return
Source: Schroders, August 2016. Returns for the C Share class, base currency, net of fees, NAV to NAV.
-11,6
-10,1 -10,8
-13,2
-6,7
-9,4
-4,8
-10,4
-4,8
-6,0
-5,2 -4,5
-8,3
-5,2 -6,2
2,2 1,5 0,9
6,0
-1,1 -0,6 -0,7 -1,3
4,7
-0,1
0,1
-0,1
0,0 1,0
-0,6
-16,0
-12,0
-8,0
-4,0
0,0
4,0
8,0
jan 08 jun 08 set 08 out 08 nov 08 fev 09 mai 10 ago 11 set 11 mai 12 jun 13 jun 15 ago 15 dez 15 jan 16
FTSE World Europe Schroder ISF European Equity Absolute Return
6

Investment process

Business cycle – a pragmatic approach
Analyse sensitivity of companies’ earning streams to business cycle
Use leading indicators to assess where we are in the business cycle
This will determine how much risk we want in the portfolio
The beta of the portfolio should therefore change through the different phases of the cycle
Stock selection will usually be the key driver of return except at turning points in the cycle
8
Source: BofAML European Quantitative Strategy
19/10/2016 17:54:28

‘Designed to deliver consistent performance’
Business cycle
Sector market divides are not homogenous. They do not necessarily help us determine the behaviour of these
stocks within the cycle
Define the beta of stocks and allocate them to seven style groupings:
Pragmatic approach combining top-down macro view with earnings based security selection
Avoid permanent style/size bias
Demand for products and services changes throughout the business cycle
Operational gearing of companies impacts profitability of companies
9
Source: Schroders
19/10/2016 17:54:28
Commodity cyclicals Growth Financials Growth defensives
Consumer cyclicals Value defensives
Industrial cyclicals
HIGH BETA LOW BETA

Stock selection…variability is predictable
Long
Market
Short
Growth defensive
Growth
Value defensives
Commodity cyclicals
Interest rate sensitive
Consumer cyclicals
Industrial cyclicals
Value defensive
Growth defensive
Growth
Consumer cyclicals
Commodity cyclicals
Interest rate sensitive
Industrial cyclicals
Consumer cyclicals
Industrial cyclicals
Interest rate sensitive
Commodity cyclicals
Growth
Value defensives
Growth defensives
Commodity cyclicals
Industrial cyclicals
Growth
Consumer cyclicals
Interest rate sensitive
Growth defensives
Value defensive
Typical longs
Typical shorts
Slowdown Recession Recovery Expansion
Source: Schroders
10

IFO business cycle indicator
EZ Composite PMI vs. Money Supply
How we determine turning points in the business cycle
11
Source: Top & Bottom RHS: JP Morgan and Datastream as at September 2016. Bottom LHS: Bloomberg as at September 2016.
US Corporate High Yield Bond yields also key
-10,0
-5,0
0,0
5,0
10,0
15,0
35
40
45
50
55
60
65
98 99 00 01 02 03 04 05 06 07 08 09 10 11 12 13 14 15 16
Eurozone Composite PMIM1, deflated using HICP, %y/y (brought forward by 9m)
-50%-40%-30%-20%-10%0%10%20%30%40%50%
-25%
-15%
-5%
5%
15%
25%
07 08 09 10 11 12 13 14 15 16
European Cyclicals rel to Defensives (%3mom)
US 10y Bdy %3mom (rhs)
-0,2
-0,15
-0,1
-0,05
0
0,05
0,1
0,15
0,2
-40%
-30%
-20%
-10%
0%
10%
20%
30%
40%
99 00 01 02 03 04 05 06 07 08 09 10 11 12 13 14 15 16
Europe Cyclicals rel to Defensives (%6mom) IFO (%6mom, rhs)

Portfolio construction
12
Pan-European Equity
strategy meeting
Portfolio
Position sizing
Stock selection process
7 style tilts
Strength of view
Potential returns
Stock volatility
Quantitative screening
Qualitative screening
Stock opportunities analysed more in depth
Where are we?
Where are we going?
Tilts weighting to reflect our business
cycle view
Avoid permanent style/size bias
Diversified portfolio
Beta changes through cycle
Emphasis
50%
50%
Source: Schroders

EPS momentum
Price momentum
Valuation
Leverage
Analyst revisions
Databases: Bloomberg, Reuters, Datastream,
FactSet, Mirabaud Securities
Qualitative and quantitative screening of the
stock universe is undertaken in order to detect
potential opportunities
Looking for turning points in relative revisions Quantitative analysis
Stock selection process
13
Source: Mirabaud Securities, Schroders, as at September 2016
19/10/2016 17:54:28
AP Moeller - Maersk

Three types of trades 1. Business cycle
Source: Schroders, JP Morgan, as at September 2016
Business cycle factors
Long: A cyclical
Short: A defensive
Business cycle trades
50 – 90%
Trade
range
Example:
IFO business cycle indicator
14

Three types of trades 2. Relative value
Source: Schroders, Bloomberg, 9 September 2016. This is for illustrative purposes only.
Security analysis
Long: Boliden
Short: Antofagasta
Relative value trades
0 – 10%
15

Three types of trades 3. Directional – earnings revisions
Source: Schroders, Bloomberg, September 2016. This is for illustrative purposes only.
Security analysis
Long: Micro Focus International
Short: Ingenico
Directional trades
20 – 50%
16

Performance and
positioning

Schroder ISF European Equity Absolute Return
Source: Schroders, as at 31 August 2016. Returns from 2003 to 11 February 2014, quoted are for Cazenove European Equity Absolute Return Fund C Class, net of fees. Returns
from 11 February 2014 onwards, are for Schroder ISF European Equity Absolute Return C Class, base currency, net of fees, NAV to NAV. *FTSE World Europe TR Index
Fund Jan Feb Mar April May June July Aug Sep Oct Nov Dec Annual Index*
2016 -0.64 -0.27 -0.12 -0.21 -0.84 0.05 0.03 -1.33 -3.30% -2.64%
2015 3.75 1.04 0.98 -1.38 2.05 -0.13 1.90 0.05 -0.52 -0.47 -0.44 1.05 +8.04% +8.84%
2014 0.45 2.45 -1.24 -3.01 0.00 -0.93 -0.40 0.30 2.82 -0.31 0.61 -0.21 +0.43% +7.53%
2013 2.25 -1.13 -1.38 1.49 2.94 0.09 2.90 -1.47 3.00 4.25 1.71 1.08 +16.68% +19.99%
2012 1.65 -0.49 0.28 1.82 -0.08 1.92 1.11 0.56 1.15 3.41 3.39 0.32 +16.00% +18.77%
2011 2.07 -1.17 -2.31 0.86 1.78 -1.21 -2.45 -1.25 4.75 4.29 -4.06 -1.03 -0.14% -8.50%
2010 0.03 -1.19 -0.75 -2.67 -0.71 1.51 -3.64 0.88 -3.06 0.49 -2.56 -0.60 -11.72% +11.70%
2009 0.70 -0.60 -1.62 -2.93 0.71 -0.93 2.40 3.23 0.56 -1.75 -1.37 1.76 -0.04% +33.18%
2008 2.18 -1.37 -1.15 0.96 0.47 1.55 1.74 0.90 0.89 6.04 -1.09 0.11 +11.58% -43.24%
2007 2.06 -0.22 0.99 0.83 0.45 1.33 -0.01 0.88 -0.04 2.84 2.89 0.38 +13.05% +3.63%
2006 2.77 1.59 0.94 0.95 -0.25 0.46 0.82 0.38 1.09 0.22 -0.55 0.50 +9.26% +20.67%
2005 1.04 1.04 0.31 0.61 0.57 0.62 1.12 1.02 -0.25 -0.57 1.09 1.02 +7.89% +23.87%
2004 2.87 0.01 -0.40 -0.18 -0.52 1.17 0.52 0.63 0.57 0.37 1.20 1.79 +8.28% +12.57%
2003 1.41 +1.41% +2.77%
Performance
18

Schroder ISF European Equity Absolute Return Gross and Net exposure
Source: Schroders as at 31 August 2016. Performance shown for C Acc share class, net of fees, NAV to NAV. *Strategy launched 30 October 2003.
Since Launch*
Volatility (% p.a.) 5.6 Net performance 103.8%
Correlation with FTSE World Europe Index 0.09 Net annualised return 5.7%
Sharpe ratio 0.7 Fund size €479.1m
Average gross exposure (%) Average net exposure [Beta Adjusted] (%)
0
25
50
75
100
125
150
175
200
-30
-20
-10
0
10
20
30
40
50
60
70
de
z/0
3m
ar/
04
jun/0
4set/04
de
z/0
4m
ar/
05
jun/0
5set/05
de
z/0
5m
ar/
06
jun/0
6set/06
de
z/0
6m
ar/
07
jun/0
7set/07
de
z/0
7m
ar/
08
jun/0
8set/08
de
z/0
8m
ar/
09
jun/0
9set/09
de
z/0
9m
ar/
10
jun/1
0set/10
de
z/1
0m
ar/
11
jun/1
1set/11
de
z/1
1m
ar/
12
jun/1
2set/12
de
z/1
2m
ar/
13
jun/1
3set/13
de
z/1
3m
ar/
14
jun/1
4set/14
de
z/1
4m
ar/
15
jun/1
5set/15
de
z/1
5m
ar/
16
jun/1
6set/16
Average net exposure [Beta Adjusted] (%)(lhs) Average gross exposure (%)(rhs)

Schroder ISF European Equity Absolute Return characteristics
Top 10 long positions and business cycle positioning
Stock name % of NAV
Micro Focus 3.6
Nexity 3.5
Imerys 3.5
Rentokil Initial 3.4
Sage Group 3.2
Ahold Delhaize 2.6
Imperial Brands 2.5
Com Hem 2.2
Orange 2.1
Thyssen Krupp 2.1
Source: Schroders 30 September 2016. The securities shown are for illustrative purposes only and not a recommendation to buy or sell shares.
Sector Gross weight (%) Net weight (%)
Commodity cyclical 9.3 3.6
Industrial cyclical 20.2 2.6
Consumer cyclical 8.1 -5.3
Financial 20.0 4.1
Value defensive 18.3 7.7
Growth defensive 18.2 -8.5
Growth 16.8 2.2
20

Schroder ISF European Equity Absolute Return
Source: Schroders 30 September 2016, (ex cash)
21
Country % breakdown by Gross and Net exposure
-6,2
-5,9
-4,6
-2,7
-1,2
-1,2
-1,1
0,1
1,5
3,5
4,2
4,3
5,4
7,6
-10,0 -5,0 0,0 5,0 10,0
Future
Germany
Switzerland
Italy
Belgium
Portugal
Finland
Norway
Denmark
Spain
Sweden
Netherlands
United Kingdom
France
Net wgt %
1,1
1,2
1,6
1,9
4,6
5,1
6,0
6,2
6,9
7,4
9,6
20,5
21,6
30,3
0,0 10,0 20,0 30,0 40,0
Finland
Portugal
Norway
Belgium
Spain
Italy
Denmark
Future
Netherlands
Switzerland
Sweden
France
Germany
United Kingdom
Gross wgt %

Market outlook

The Global Earnings Cycle is turning up… …but will it follow through?
23
Source: Citigroup, September 2016
Global EPS revisions Pro Cyclical Rotation
40
50
60
70
80
90
100
02 03 04 05 06 07 08 09 10 11 12 13 14 15 16
12m Fwd EPSCyc/Def
Yes No No No ? Yes
First 10%
-0,8
-0,6
-0,4
-0,2
0
0,2
0,4
02 03 04 05 06 07 08 09 10 11 12 13 14 15 16
Yes No No No ? Yes
First 10%

Bond yields begin to close the gap… …as deflation fears ease
24
Source: Bloomberg, September 2016
Cyclical vs Defensives and bond yields Citi inflation surprise index
-20
-15
-10
-5
0
5
10
15
20
25
30
92
93
94
95
96
97
98
99
100
101
102
103
104
105
mar 16 abr 16 mai 16 jun 16 jul 16 ago 16 set 16
European Cyclicals vs Defensives
German 10Y bund yields (bp) - rhs

Banks finally start to perform as Value turns up
25
Source: LHS: Bloomberg & J.P. Morgan RHS: Datastream & J.P. Morgan. September 2016
Bond yields are also important for Value/Growth call… European Banks’ performance and German Bunds
0,9%
1,4%
1,9%
2,4%
2,9%
3,4%
3,9%
4,4%
4,9%
65
70
75
80
85
90
95
100
07 08 09 10 11 12 13 14 15 16
MSCI Europe Value vs Growth (TR) US 10Y Bond Yields (rhs)
-0,3%
-0,2%
-0,1%
0,0%
0,1%
0,2%
0,3%
0,4%
0,5%
0,6%
70
75
80
85
90
95
100
jan 16 fev 16 mar 16 abr 16 mai 16 jun 16 jul 16 ago 16 set 16
European banks relative German bund yields (rhs)

Bund yield curve begins to steepen as ECB defers further stimulus…
…more fiscal, less monetary now?
26
Source: Bloomberg, J.P. Morgan, September 2016
Eurozone credit impulse index vs retail sales Bund yield curve steepens
-4%
-3%
-2%
-1%
1%
2%
3%
4%
5%
-11
-9
-7
-5
-3
-1
1
3
5
7
00 01 02 03 04 05 06 07 08 09 10 11 12 13 14 15 16
Eurozone credit impulse Eurozone retail sales %yoy, rhs

Will US fiscal policy move US long bond yields?
27
Source: Goldman Sachs, September 2016

Western leading indicators losing momentum…
28
Source: BAML & Bloomberg, September 2016

Is Long Banks / Short Cyclicals the solution?
29
Source: LHS: Datastream & J.P. Morgan RHS: IBES & J.P. Morgan. September 2016
Cyclicals 12m Fwd P/E relative to Banks Banks vs Cyclicals and bond yields
1,3
1,4
1,5
1,6
1,7
1,8
1,9
2,0
2,1
2,2
2,3
75
80
85
90
95
100
jan 16 fev 16 mar 16 abr 16 mai 16 jun 16 jul 16 ago 16 set 16
Banks relative to Cyclicals US 10Y Bond Yields
0,9
1,0
1,1
1,2
1,3
1,4
1,5
1,6
1,7
1,8
1,9
95 96 97 98 99 00 01 02 03 04 05 06 07 08 09 10 11 12 13 14 15 16
Europe Cyclicals 12m Fwd P/E relative to Banks
Median
+1stdev
-1stdev

Risk management
Source: Schroders
Leverage and Stock controls
Max 250% gross exposure
(typical range 100 – 175%)
Max 50% net exposure (typically up to
+/-25%)
Will not invest in unquoted stocks
Normal positions <5% NAV
Typically 30 – 50 holdings on each
side of the balance sheet
Independent monitoring
Daily VaR monitoring and stress
testing done in-house
Fortnightly factor analysis
Monthly analysis of realised
performance
Monthly liquidity analysis
Size, style, hedging
Unconstrained sector positioning
Bias to large and midcap
No automatic stop loss
Will use CFDs
Use of futures and ETFs
Selective investment in European
markets
Can buy options or write calls
30
Schroder ISF European Equity Absolute Return
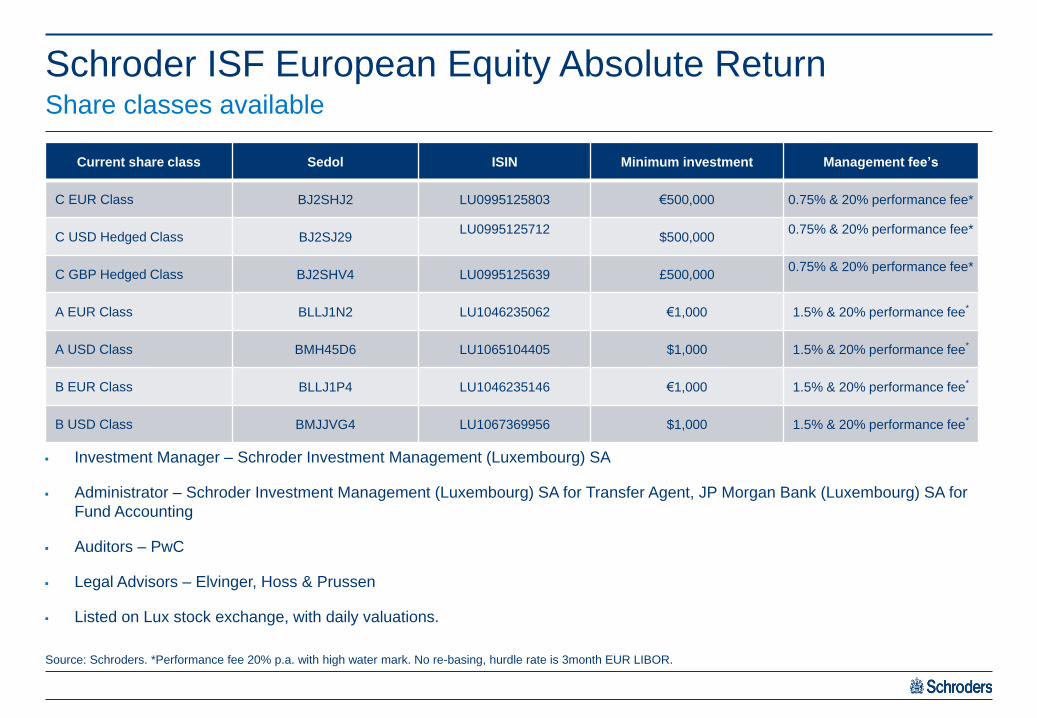
Source: Schroders. *Performance fee 20% p.a. with high water mark. No re-basing, hurdle rate is 3month EUR LIBOR.
Current share class Sedol ISIN Minimum investment Management fee’s
C EUR Class BJ2SHJ2 LU0995125803 €500,000 0.75% & 20% performance fee*
C USD Hedged Class BJ2SJ29 LU0995125712
$500,000
0.75% & 20% performance fee*
C GBP Hedged Class BJ2SHV4 LU0995125639 £500,000 0.75% & 20% performance fee*
A EUR Class BLLJ1N2 LU1046235062 €1,000 1.5% & 20% performance fee*
A USD Class BMH45D6 LU1065104405 $1,000 1.5% & 20% performance fee*
B EUR Class BLLJ1P4 LU1046235146 €1,000 1.5% & 20% performance fee*
B USD Class BMJJVG4 LU1067369956 $1,000 1.5% & 20% performance fee*
Investment Manager – Schroder Investment Management (Luxembourg) SA
Administrator – Schroder Investment Management (Luxembourg) SA for Transfer Agent, JP Morgan Bank (Luxembourg) SA for
Fund Accounting
Auditors – PwC
Legal Advisors – Elvinger, Hoss & Prussen
Listed on Lux stock exchange, with daily valuations.
Share classes available

Why consider alternatives? Conclusion
Returns competitive with equities
Volatility less than half the equity market
Proven ability to protect capital in big market falls
Process designed to be flexible enough to cope with varying business
cycles
32
Source: Schroders
19/10/2016 17:54:33

For professional advisers only. This material is not suitable for retail clients.
This document does not constitute an offer to anyone, or a solicitation by anyone, to subscribe for shares of Schroder International Selection Fund (the “Company”). Nothing in this
document should be construed as advice and is therefore not a recommendation to buy or sell shares.
Subscriptions for shares of the Company can only be made on the basis of its latest Key Investor Information Document and prospectus, together with the latest audited annual
report (and subsequent unaudited semi-annual report, if published), copies of which can be obtained, free of charge, from Schroder Investment Management (Luxembourg) S.A.
An investment in the Company entails risks, which are fully described in the prospectus.
Past performance is not a reliable indicator of future results, prices of shares and the income from them may fall as well as rise and investors may not get the amount originally
invested.
Schroders has expressed its own views and opinions in this document and these may change.
Risk considerations: The capital is not guaranteed. All equity forward sales are with a single counterparty. In case of default, the relevant equities will be sold in the market and
this may affect performance. Investments denominated in a currency other than that of the share-class may not be hedged. The market movements between those currencies will
impact the share-class.
The fund may hold indirect short exposure in anticipation of a decline of prices of these exposures or increase of interest rate. There is no guarantee that a financial derivative
contract will achieve its intended outcome, even if the terms of the contract are completely satisfied.
Third Party Data Disclaimer: Third party data is owned or licensed by the data provider and may not be reproduced or extracted and used for any other purpose without the data
provider's consent. Third party data is provided without any warranties of any kind. The data provider and issuer of the document shall have no liability in connection with the third
party data. The Prospectus and/or www.schroders.com contains additional disclaimers which apply to the third party data. FTSE International Limited (“FTSE”) © FTSE (2016).
“FTSE®” is a trade mark of London Stock Exchange Plc and The Financial Times Limited and is used by FTSE International Limited under licence. All rights in the FTSE indices
and / or FTSE ratings vest in FTSE and/or its licensors. Neither FTSE nor its licensors accept any liability for any errors or omissions in the FTSE indices and / or FTSE ratings or
underlying data. No further distribution of FTSE Data is permitted without FTSE’s express written consent.
Issued in October 2016 by Schroder Investment Management Ltd., 31, Gresham Street, EC2V 7QA, who is authorised and regulated by the Financial Conduct Authority. For your
security, all telephone calls are recorded. PEE00222
Important information
33
This material was prepared by Schroder Investment Management, in response to a request from the client sent to Schroder and should not be understood as an
analysis of any securities, advertising material, offer to purchase or sell, offer or recommendation of any financial assets or investment. The purpose of this
material is exclusively informative and does not include investment objectives, financial conditions or the particular and specific needs of any shareholders or other
investors. The opinions stated in this material pertain to Schroder and may change at any time. The opinions are based on the date of their submission and do not
encompass any fact that may have arisen after this date, hence, Schroder is not compelled to update this material to reflect such provisions after the submission
of the same. This material is for exclusive Financial Intermediary, Institutional and Consultant and should not be used as support material by other individuals.
THIS MATERIAL IS HIGHLY CONFIDENTIAL AND SHOULD NOT BE REPRODUCED OR DISTRIBUTED, ENTIRELY OR PARTIALLY, TO PERSONS
OTHER THAN THE ORIGINAL RECIPIENTS. The Fund and the distribution of the shares of the same are not registered at the Brazilian Securities Commission
"CVM", and therefore do not meet certain requirements and procedures usually observed in public offerings of securities registered with the CVM, with which
investors in Brazilian capital markets may be familiar. For this reason, the access of the investors to certain information regarding the Fund may be restricted.
SCHRODER DOES NOT GUARANTEE PERFORMANCE.
Important information
34


![IN THE COURT OF HON'BLE SHRI JUSTICE P.N ... WP/391/2016 MOHIT S/O SH # MS MEGHA D/O: ANURAG S. BHALOTIA ] # BHAVANA M. KASARE ORDERS ON LETTER I.W.NO. 21085/16. [LETTE /R R RECD](https://img.pdfslide.us/doc/110x75/5adfcf247f8b9a6e5c8c9bb6/in-the-court-of-honble-shri-justice-pn-wp3912016-mohit-so-sh-ms-megha.jpg)