Embed Size (px)
Citation preview
This PDF is a selection from a published volume from theNational Bureau of Economic Research
Volume Title: The Economics of School Choice
Volume Author/Editor: Caroline M. Hoxby, editor
Volume Publisher: University of Chicago Press
Volume ISBN: 0-226-35533-0
Volume URL: http://www.nber.org/books/hox03-1
Conference Date: February 22-24, 2001
Publication Date: January 2003
Title: School Vouchers. Results from Randomized Experiments
Author: Paul Peterson, William Howell, Patrick J. Wolf,David Campbell
URL: http://www.nber.org/chapters/c10087
107
In the past decade much has been learned about the way in which schoolvouchers affect low-income families and their children. Ten years ago, theempirical information available about this widely debated question cameprimarily from a flawed public school choice intervention attempted inAlum Rock, California during the 1960s (Bridge and Blackman 1978; El-
4School VouchersResults from RandomizedExperiments
Paul E. Peterson, William G. Howell, Patrick J. Wolf,and David E. Campbell
Paul E. Peterson is the Henry Lee Shattuck Professor of Government and director of theProgram on Education Policy and Governance at Harvard University. William G. Howell isassistant professor of government at Harvard University. Patrick J. Wolf is assistant professorof public policy at Georgetown University. David E. Campbell is assistant professor of politi-cal science at Notre Dame University.
The authors wish to thank the principals, teachers, and staff at the private schools in Day-ton, Washington, and New York City who assisted in the administration of tests and ques-tionnaires. We also wish to thank the SCSF, PACE, and WSF for cooperating fully with theseevaluations. Kristin Kearns Jordan, Tom Carroll, and other members of the SCSF staff as-sisted with data collection in New York City. John Blakeslee, Leslie Curry, Douglas Dewey,Laura Elliot, Heather Hamilton, Tracey Johnson, John McCardell, and Patrick Purtill of theWashington Scholarship Fund provided similar cooperation. T. J. Wallace and Mary LynnNaughton, staff members of Parents Advancing Choice in Education, provided valuable as-sistance with the Dayton evaluation. Chester E. Finn, Bruno Manno, Gregg Vanourek, andMarci Kanstoroom of the Fordham Foundation, Edward P. St. John of Indiana University,and Thomas Lasley of the University of Dayton provided valuable suggestions throughoutvarious stages of the research design and data collection. We wish to thank especially DavidMyers of Mathematical Policy Research, a principal investigator of the evaluation of the NewYork School Choice Scholarship Program; his work on the New York evaluation has influ-enced in many important ways the design of the Washington and Dayton evaluations. Wethank William McCready, Robin Bebel, Kirk Miller, and other members of the staff of thePublic Opinion Laboratory at Northern Illinois University for their assistance with data col-lection, data processing, conduct of the lottery, and preparation of baseline and year-onefollow-up data. We are particularly grateful to Tina Elacqua, Matthew Charles, and BrianHarrigan for their key roles in coordinating data collection efforts.
We received helpful advice from Paul Hill, Christopher Jencks, Derek Neal, Donald Rock,and Donald Rubin. Daniel Mayer and Julia Chou were instrumental in preparing the NewYork City survey and test score data and executing many of the analyses reported in the paper.
more 1990). In the early and mid-1990s, however, new voucher programssprouted across the country in such cities as Milwaukee, Cleveland, Indi-anapolis, and San Antonio. Initially, the evaluations of these innovationswere limited by the quality of the data or the research procedures employed.Often, planning for the evaluation began after the experiment was underway, which made it impossible to gather baseline data or to ensure the for-mation of an appropriate control group. As a result, the quality of the datacollected was not as high as researchers normally would prefer.1
Despite their limitations, these early evaluations provided program oper-ators and evaluation teams with opportunities to learn the problems andpitfalls accompanying the study of school vouchers. Subsequent evalua-tions of voucher programs in New York, Washington, D.C., and Dayton,Ohio have been designed in such a way as to allow for the collection ofhigher-quality information about student test score outcomes and parentalassessments of public and private schools. Because vouchers in these citieswere awarded by lot, program evaluations could be designed as randomizedfield trials. Prior to conducting the lotteries, the evaluation team collectedbaseline data on student test scores and family background characteristics.One, two, and three years later, the evaluation team again tested the stu-dents and asked parents about their children’s school experiences.2 In theabsence of response biases that are conditional on treatment status, any sta-tistically significant differences between students offered a voucher andthose not offered a voucher may be attributed to the intervention, becauseaverage student initial abilities and family backgrounds are similar between
108 Paul E. Peterson, William G. Howell, Patrick J. Wolf, and David E. Campbell
Additional research assistance was provided by Rachel Deyette, Jennifer Hill, and MartinWest; Antonio Wendland, Tom Polseno, Shelley Weiner, Lilia Halpern, and Micki Morris pro-vided staff assistance.
These evaluations have been supported by grants from the following foundations: AchelisFoundation, Bodman Foundation, Lynde and Harry Bradley Foundation, William DonnerFoundation, Thomas B. Fordham Foundation, Milton and Rose D. Friedman Foundation,John M. Olin Foundation, David and Lucile Packard Foundation, Smith-Richardson Foun-dation, Spencer Foundation, and Walton Family Foundation. The methodology, analyses ofdata, reported findings, and interpretations of findings are the sole responsibility of the au-thors of this report and are not subject to the approval of SCSF, WSF, PACE, or of any foun-dation providing support for this research.
1. Disparate findings have emerged from these studies. For example, one analysis of the Mil-waukee choice experiment found test score gains in reading and math, particularly after stu-dents had been enrolled for three or more years, whereas another study found gains only inmath, and a third found gains in neither subject. See Greene, Peterson, and Du (1998); Rouse(1997); and Witte (1997). On the Cleveland program, see Greene, Howell, and Peterson (1998)and Metcalf et al. (1998). Greene, Peterson, and Du (1998) report results from analyses of ex-perimental data; the other studies are based upon analyses of nonexperimental data.
2. Results from the Dayton evaluation after one year are reported in Howell and Peterson(2000). Second-year results for Dayton are described in West, Peterson, and Campbell (2001).First-year results for Washington are reported in Wolf, Howell, and Peterson (2000). Second-year results for Washington are reported in Wolf, Peterson, and West (2001). First-year resultsfrom the New York City evaluation are reported in Peterson et al. (1999). Second-year resultsfrom New York City are described in David Myers et al. (2000). All of the occasional papersmentioned in this note are available at [http://data.fas.harvard.edu/pepg/].

the two groups. Students and families who were evaluated entered privateschool in grades two through five in New York City and grades two througheight in Washington, D.C. and Dayton (and other parts of MontgomeryCounty, Ohio).3 This chapter reports programmatic impacts on student testscores, parents’ satisfaction with their child’s school, and parent reports ofthe characteristics of the schools the child attended.
4.1 The Three Voucher Programs
The design of the three voucher programs was similar in key respects,thereby allowing the evaluation team to combine results from the separateevaluations of these programs. All were privately funded; all were targetedat students from low-income families, most of whom lived within the cen-tral city; and all provided partial vouchers, which the family was expectedto supplement from other resources. All students included in the evaluationhad previously been attending public schools. The programs, however, diddiffer in size, timing, and certain administrative details. In this section wedescribe the main characteristics of the School Choice Scholarships Foun-dation program in New York City, the Washington Scholarship Fund pro-gram in Washington, D.C., and the Parents Advancing Choice in Educa-tion program in the Dayton metropolitan area.
4.1.1 The School Choice Scholarships FoundationProgram in New York City
In February 1997, the School Choice Scholarships Foundation (SCSF)announced that it would provide 1,300 scholarships worth up to $1,400 an-nually for at least three years to children from low-income families then at-tending public schools. The scholarship could be applied toward the cost ofattending a private school, either religious or secular. After announcing theprogram, SCSF received initial applications from over 20,000 students be-tween February and late April 1997.
To be eligible for a scholarship, children had to be entering grades onethrough five, live in New York City, attend a public school at the time of ap-plication, and come from families with incomes low enough to qualify forthe U.S. government’s free or reduced school lunch program. To ascertaineligibility, students and an adult member of their family were asked to at-tend verification sessions during which family income and the child’s publicschool attendance were documented.
Subsequent to the lottery, SCSF assisted families in identifying possibleprivate schools their children might attend. By the end of the first year,
School Vouchers 109
3. Baseline data from the D.C. and Dayton evaluations are reported in Peterson et al. (1998).Baseline data for New York City are reported in Peterson et al. (1997). Both of these reportsare available at [http://data.fas.harvard.edu/pepg/].
about 82 percent of the students participating in the evaluation were usinga scholarship; 79 percent of the participating students used the voucher fortwo full years, and 70 percent for three full years.4
4.1.2 The Parents Advancing Choice inEducation Program in Dayton, Ohio
In the spring of 1998, Parents Advancing Choice in Education (PACE),a privately funded nonprofit corporation, offered low-income familieswithin the Dayton metropolitan area an opportunity to win a scholarshipto help defray the costs of attending the school of their choice. Eligible ap-plicants participated in a lottery in which winners were offered a scholar-ship that could be used at participating private and public schools in Day-ton and in other parts of Montgomery County, Ohio. Students enteringkindergarten through twelfth grade qualified. For the 1998–99 school year,PACE offered scholarships to 515 students who were in public schools and250 students who were already enrolled in private schools.
The program was announced in January 1998. Based on census data andadministrative records, program operators estimated that approximately32,000 students met the program’s income and eligibility requirements. ThePACE program accepted preliminary applications from over 3,000 stu-dents, of whom 1,500 attended sessions where administrators verified theireligibility for a scholarship, students took the Iowa Test of Basic Skills(ITBS), and parents completed questionnaires. These verification sessionswere held in February, March, and April 1998. The lottery was then con-ducted on 29 April 1998.
During the first year of the program, the PACE scholarships covered 50percent of tuition at a private school, up to a maximum award of $1,200.Support was guaranteed for eligible students for at least four years; in ad-dition, the program expects to support students through the completion ofhigh school, provided funds remain available. Scholarship amounts wereaugmented beginning in 1999 as a result of additional funds available toPACE and support for the program by the Children’s Scholarship Fund, anationwide school choice scholarship program.
Among the public school students offered a scholarship, 78 percent of thestudents participating in the evaluation attended a private school in the pro-gram’s first year, and 60 percent were in private schools after two years.
4.1.3 The Washington Scholarship Fund Program in Washington, D.C.
The Washington Scholarship Fund (WSF), a privately funded schoolvoucher program, was originally established in 1993. At that time, a limitednumber of scholarships, which could be used at a private school of the fam-
110 Paul E. Peterson, William G. Howell, Patrick J. Wolf, and David E. Campbell
4. For a description of the kinds of private schools voucher students attended, see Howellet al. (2002).
ily’s choice, were offered to students from low-income families. By the fallof 1997, WSF was serving approximately 460 children at 72 private schools.The WSF then received a large infusion of new funds from two philanthro-pists, and a major expansion of the program was announced in October1997. Both general news announcements and paid advertising were used topublicize the enlarged school choice scholarship program. The WSF an-nounced that, in the event that applications exceeded scholarship resources,winners would be chosen by lottery. The program expanded further in 1999with support from the Children’s Scholarship Fund.
To qualify, applicants had to reside in Washington, D.C. and be enteringgrades K-8 in the fall of 1998. The WSF awarded parents with incomes ator below the poverty line vouchers that equaled 60 percent of tuition or$1,700, whichever was less. Families with incomes above the poverty line re-ceived smaller scholarships. The maximum amount of tuition support forhigh school students was $2,200. The WSF has said that it will attempt tocontinue tuition support to the children in its program for at least threeyears and, if funds are available, until they complete high school. No fam-ily with income above 2.7 times the poverty line was eligible for support.
Over 7,500 telephone applications to the program were received betweenOctober 1997 and March 1998; in response to invitations sent by WSF, over3,000 applicants attended verification and testing sessions. The lottery se-lecting scholarship winners was held in April 1998. The WSF awarded over1,000 new scholarships that year, with 811 going to students not previouslyin a private school.
Provided they gained admission, scholarship students could attend anyprivate school in the Washington area. During the 1998–99 school year, stu-dents participating in the evaluation attended seventy-two different privateschools. Of those students offered scholarships who participated in the eval-uation, 68 percent attended a private school in the first year of the program.Take-up rates declined to 47 percent in the second year and to just 29 per-cent at the end of the third year.
4.2 Evaluation Procedures
The evaluation procedures used in all three evaluations conform to thoseused in randomized field trials. The evaluation team collected baseline dataprior to the lottery, administered the lottery, and then collected follow-upinformation one and two years later. This section details the steps taken tocollect the relevant information.
4.2.1 Baseline Data Collection
During the eligibility verification sessions attended by voucher appli-cants, students in first grade and higher took the Iowa Test of Basic Skills(ITBS) in reading and mathematics. The sessions took place during the
School Vouchers 111
months of February, March, and April, immediately prior to the voucherlottery, and generally lasted about two hours. The sessions were held inprivate-school classrooms, where schoolteachers and administrators servedas proctors under the overall supervision of the evaluation team and pro-gram sponsors. The producer of the ITBS graded the tests.5 Students ingrades four through eight also completed a short questionnaire about theirschool experiences.
While children were being tested, adults accompanying them filled outsurveys that asked about their satisfaction with their children’s schools,their involvement in their children’s education, and their demographic char-acteristics. Parents completed these questionnaires in rooms separate fromthose used for testing. Administrators explained that individual responsesto the questionnaire would be held in strict confidence. Respondents hadconsiderable time to complete their surveys, and administrators were avail-able to answer questions about the meaning of particular items. Extensiveinformation from these surveys has been reported elsewhere.6
Over 5,000 public-school students participated in baseline testing inNew York City. After vouchers were awarded, 960 families were selected atrandom from those who did not win the lottery to comprise a control groupof approximately 960 families.7
In Dayton, 1,440 students were tested at baseline, and 1,232 parent ques-tionnaires were completed. Of the 1,440 students, 803 were not at the timeattending a private school; of the 1,232 parent questionnaires, 690 werecompleted by parents of students who were not attending a private school.Follow-up testing information is reported only for families whose childrenattended public schools at the time of application.
In Washington, D.C., 2,023 students were tested at baseline; 1,928 parentsurveys asking questions about each child were completed; 938 student sur-veys were completed. Of the 2,023 students tested, 1,582 were not attendinga private school at the time of application for a scholarship; of the 1,928 par-ent questionnaires, 1,446 were completed by parents whose children werenot then attending a private school. Follow-up testing and survey informa-tion was obtained only from families with children then in public schools.
4.2.2 The Lottery
The evaluation team conducted the lotteries in May 1997 in New YorkCity and April 1998 in Dayton and D.C. Program operators notified lottery
112 Paul E. Peterson, William G. Howell, Patrick J. Wolf, and David E. Campbell
5. The assessment used in this study is Form M of the Iowa Tests of Basic Skills, Copyright(c) 1996 by The University of Iowa, published by The Riverside Publishing Company, 425Spring Lake Drive, Itasca, Illinois 60143-2079. All rights reserved.
6. See Howell et al. (2002). Prior reports include Peterson et al. (1999); Myers et al. (2000);Howell and Peterson (2000); West, Peterson, and Campbell (2001); Wolf, Howell, and Peter-son (2000); Wolf, Peterson, and West (2001). All reports available at [http://data.fas.harvard.edu/pepg/].
7. Exact procedures for the formation of the control group are described in Hill, Rubin, andThomas (1998).
winners shortly thereafter. If a family was selected, all children in that fam-ily entering eligible grades were offered a scholarship. Separate lotterieswere held in Dayton and D.C. for students then in public and privateschools, ensuring random assignment to test and control groups of thosefamilies participating in the evaluation.
In New York City, Mathematica Policy Research (MPR) administeredthe lottery; SCSF announced the winners. The SCSF decided in advance toallocate 85 percent of the scholarships to applicants from public schoolswhose average test scores were less than the citywide median. Consequently,applicants from these schools, who represented about 70 percent of all ap-plicants, were assigned a higher probability of winning a scholarship. In theinformation reported in the tables, results have been adjusted by weightingcases differentially so that they can be generalized to all eligible applicantswho would have come to the verification sessions had they been invited, re-gardless of whether or not they attended a low-performing school.
Because vouchers were allocated by a lottery conducted by the evaluationteam, those offered scholarships should not be expected to differ signifi-cantly from members of the control group (those who did not win a schol-arship). For all three cities, baseline data confirm this expectation. For in-stance, in D.C., the baseline test scores of those entering grades two througheight who were offered a voucher averaged 29.6 national percentile pointsin reading and 23.3 in mathematics; those not offered the scholarshipscored, on average, 30.6 national percentile points in reading and 23.1points in math. As in D.C., the demographic characteristics of those offeredvouchers in Dayton and New York did not differ significantly from thecharacteristics of those who were not offered a voucher.8
4.2.3 Collection of Follow-Up Information
The annual collection of follow-up information commenced in New YorkCity in the spring of 1998 and in Dayton and D.C. in the spring of 1999.Data collection procedures were similar across cities.
In New York City, testing and questionnaire administration proceduresreplicated those followed at baseline. Adult members of the family com-pleted surveys that asked a wide range of questions about the educationalexperiences of their oldest child within the age range eligible for a scholar-ship. Students completed the ITBS and short questionnaires. Both thevoucher students and students in the control group were tested in locationsother than the school they were then attending.
The SCSF conditioned the renewal of scholarships on participation inthe evaluation. Also, non–scholarship winners selected to become membersof the control group were compensated for their expenses and told that theycould automatically reapply for a new lottery if they participated in these
School Vouchers 113
8. For a more extended discussion on these matters, see the initial reports for each city citedin notes 2 and 3.
follow-up sessions. Detailed response rate information for the follow-upsurvey and testing sessions is reported in appendix A.
In Washington, D.C. and Dayton, the evaluation team began collectingfollow-up information between late February and late April of 1999. As inNew York, the procedures used to obtain follow-up data were essentiallythe same as those used to collect baseline data. Students again took theITBS in mathematics and reading. Caretakers accompanying the childrencompleted surveys that asked a wide range of questions about the educa-tional experiences of the children. Students in grades four through eightalso completed a questionnaire that asked about their experiences at school.Testing and questionnaire administration procedures were similar to thosethat had been followed at baseline.9 The Dayton evaluation was concludedafter two years; in D.C., however, a third-year follow-up collection of test-ing and survey information was conducted in 2001.
To obtain a high participation rate in the follow-up data collection effort,those who had declined the offer of a voucher and members of the controlgroup were compensated for their expenses. They were also told in Wash-ington, D.C. that if they participated in the follow-up sessions, they would beincluded in a new lottery. In Dayton, a second lottery was promised as a re-ward for participating in the first follow-up session. In the second year, how-ever, Dayton families were only given financial rewards for participation.
Because test score results from the second and third years of the evalua-tion differ significantly between African American students and those fromother ethnic backgrounds, the ethnic composition of the students partici-pating in the evaluation is particularly salient. Forty-two percent of the stu-dents participating in the second year of the evaluation in New York Citywere African Americans. In Dayton and D.C., 74 percent and 95 percentwere African American, respectively. Hispanic students participating in thesecond year of the evaluation constituted 51 percent of the total in New YorkCity, 2 percent in Dayton, and 4 percent in Washington, D.C. Finally, 5 per-cent of the students participating in the evaluation in New York City werewhite. In Dayton and D.C., 24 percent and 1 percent were white, respectively.The remaining students came from a variety of other ethnic backgrounds.
4.3 Data Analysis and Reporting Procedures
The evaluation takes advantage of the fact that a lottery was used toaward scholarships. As a result, it is possible to compare two groups of stu-
114 Paul E. Peterson, William G. Howell, Patrick J. Wolf, and David E. Campbell
9. Difficulties were encountered in the administration of the first-year follow-up test at theinitial pilot session in Washington, D.C. Test booklets were not available at the testing site forscholarship students in grades three through eight. Copies of the test arrived eventually, butthe amount of time available for testing may have been foreshortened. Significant effects onreading scores are not apparent, but significant effects on math performance are evident,probably because the math test was the last to be administered. Statistical adjustments in thetest score analysis take into account the special circumstances of the pilot session.
dents that were similar, on average, except that members of the controlgroup were not offered a scholarship. Any statistically significant differ-ences between the two groups may be attributed to the school experience,not the child’s initial ability or family background, which were essentiallythe same at baseline. One possible threat to the validity of this causal infer-ence would be differential response patterns to follow-up testing by mem-bers of the treatment and control groups based on conditions that devel-oped after they were tested at baseline.10 We discuss that possibility inappendix A (see also Howell et al. 2002; Howell and Peterson 2002).
This paper provides data that help answer two questions. The first is whatthe impact on educational outcomes was of an offer of a voucher to low-income families residing within a large central city. This is the intention-to-treat or ITT effect of the voucher. The ITT effect compares educational out-comes of those who were offered a voucher to the outcomes of those whowere not offered a voucher. To compute program impacts on children’s testscores, we estimated a statistical model that took into account students’treatment or control group status as well as baseline reading and math testscores. Baseline test scores were included to (a) adjust for minor baselinedifferences between the treatment and control groups on the achievementtests, and (b) to increase the precision of the estimated impacts.
Generalization from these results has the important disadvantage of as-suming that usage rates of scholarships are fixed. Depending upon the size ofthe scholarship, the time the scholarship is offered, and the marketing of theprogram as a whole, however, usage rates might be highly variable. Conse-quently, we report ITT results for test scores in appendix B. In the text of thischapter we report answers to a second question: What was the impact on ed-ucational experiences, parental satisfaction, and test score performances ofstudents from low-income families residing within a large central city one,two, and three years after switching from a public to a private school? This isthe treatment-on-the-treated or TOT effect of the voucher. The answer to thisquestion requires a comparison between those students who were offeredvouchers and switched from a public to a private school with public-schoolstudents who would have switched to a private school had they been offered avoucher. To compute the program’s impact on those who used a scholarshipto attend a private school, we estimated two-stage least squares models. Theinstrument is the voucher lottery, which is highly correlated with attendance ata private school, but because it is randomly determined, is obviously uncorre-lated with the error term in the second-stage equation. As a result, the modelyields an unbiased estimate of the effects of switching to a private school.11
The paper reports the TOT impact on students school experiences,parental satisfaction, and test score performance of a switch from a public
School Vouchers 115
10. We are indebted to Derek Neal for calling this interesting contingency to our attention.11. This procedure is discussed in Angrist, Imbens, and Rubin (1996). The procedure, widely
used by statisticians to correct for selection effects, was used to estimate the effects of actualclass size reduction in Tennessee; see Krueger (1999).

to a private school for one, two, and three years. Second- and third-year re-sults compare those in private schools for two or three years with compa-rable members of the control group that were not in private school for twoand three years, respectively.
4.4 Test Score Findings
We compare the performance of public and private school students onthe ITBS in reading and mathematics, as well as their combined perfor-mance in both subject areas. Scores range between 0 and 100 National Per-centile Ranking (NPR) points, with the national median located at the 50thpercentile. The results reported below represent the first student achieve-ment information from randomized field trials on the effects of schoolvouchers. However, they do not so much break new ground as build upon abody of research that has explored the differences between schooling forlow-income minorities in the public and private sectors.
4.4.1 Prior Research
Studies of attainment levels and test performance of students in publicand private schools usually find that low-income and African Americanstudents attending private schools outperform their public school peers.According to a recent analysis of 12,000 students in the National Longitu-dinal Survey of Youth, for instance, even when adjustments are made forfamily background, students from all racial and ethnic groups are morelikely to go to college if they attended a Catholic school; however, the effectsare the greatest among urban minorities (Neal 1997). This study’s findingsare consistent with others’ (Evans and Schwab 1993; Figlio and Stone1999). After reviewing the literature on school effects on learning, Uni-versity of Wisconsin Professor John Witte (1996) concludes that theempirical literature “indicate[s] a substantial private school advantage interms of completing high school and enrolling in college, both very impor-tant events in predicting future income and well-being. Moreover, . . . theeffects were most pronounced for students with achievement test scores inthe bottom half of the distribution” (167).
Even the most careful of studies, however, can take into account only ob-served family background characteristics. They cannot be sure that theyhave controlled for an intangible factor—the willingness of parents to payfor their child’s tuition, and all that this implies about the importance theyplace on education. As a result, it remains unclear whether the findings fromthese studies describe actual differences between public and private schoolsor simply differences in the kinds of students and families attending them.12
116 Paul E. Peterson, William G. Howell, Patrick J. Wolf, and David E. Campbell
12. Major studies finding positive educational benefits from attending private schools in-clude Coleman, Hoffer, and Kilgore (1982) and Chubb and Moe (1997). Critiques of thesestudies have been prepared by Goldberger and Cain (1982) and Wilms (1985).
The best solution to the self-selection problem is the random assignmentof students to test and control groups. Until recently, evaluations of voucherprograms have not utilized a random-assignment research design andtherefore have not overcome the possible selection problems. Privatelyfunded programs in Indianapolis, San Antonio, and Milwaukee admittedstudents on a first-come, first-served basis. In the state-funded program inCleveland, although scholarship winners were initially selected by means ofa lottery, eventually all applicants were offered a scholarship, thereby pre-cluding the conduct of a randomized experiment. The public Milwaukeeprogram did award vouchers by a lottery, but data collection was incom-plete.13
As a consequence, the findings presented here on New York, D.C., andDayton provide a unique opportunity to examine the effects of schoolvouchers on students from low-income families who live in central cities. Incontrast to prior studies, random assignment was conducted by the evalua-tion team, follow-up test-score information was obtained from about one-half to four-fifths of the students who participated in the lottery, and base-line data provided information that allowed the analysts to adjust fornon-response.
4.4.2 Impacts of Private-School Attendance on Test Scores
In interpreting the findings reported below, emphasis is placed on the es-timated effects of attending a private school on combined test scores for allthree cities, taken together. Because of minor fluctuations in data collec-tion, average estimates from more than one city provide a better indicationof programmatic effects than do the results from any one city. Also, whenstudent performance is estimated on the basis of one-hour testing sessions,combined test score performance of students on the reading and math testsis a better indicator of student achievement than either test separately. The-oretically, the more test items used to evaluate performance, the more likelyit is that one will estimate performance accurately. Empirically, perfor-mances on the two tests are highly correlated with one another (r equalsabout 0.7). In addition, results from the two tests, when combined together,were found to be more stable across time and from place to place, indicat-ing that combining results from the two tests reduces what is probably idio-syncratic variations in observations of student performance.14
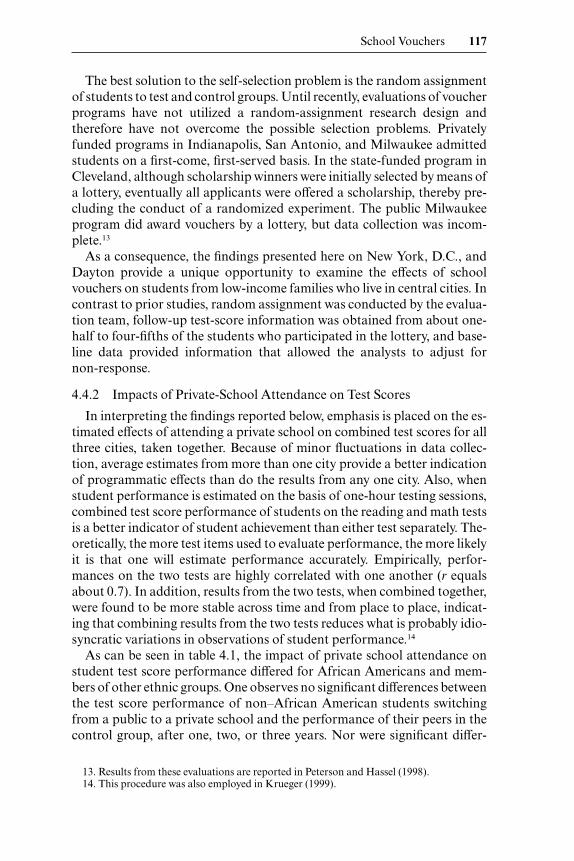
As can be seen in table 4.1, the impact of private school attendance onstudent test score performance differed for African Americans and mem-bers of other ethnic groups. One observes no significant differences betweenthe test score performance of non–African American students switchingfrom a public to a private school and the performance of their peers in thecontrol group, after one, two, or three years. Nor were significant differ-
School Vouchers 117
13. Results from these evaluations are reported in Peterson and Hassel (1998).14. This procedure was also employed in Krueger (1999).
ences observed in these students’ reading and math tests, considered sepa-rately.
The effects of switching to a private school on African American studentsdiffered markedly from the effects on students from other ethnic back-grounds. In the three cities, taken together, African American students whoswitched from public to private schools scored, after one year, 3.9 NPRpoints higher on the combined math and reading tests, and, after two andthree years, 6.3 percentile and 6.6 points higher, respectively, than theAfrican American students in the control group. Again, these are the aver-age results for the three cities combined, weighting each city estimate in in-verse proportion to its respective variance.
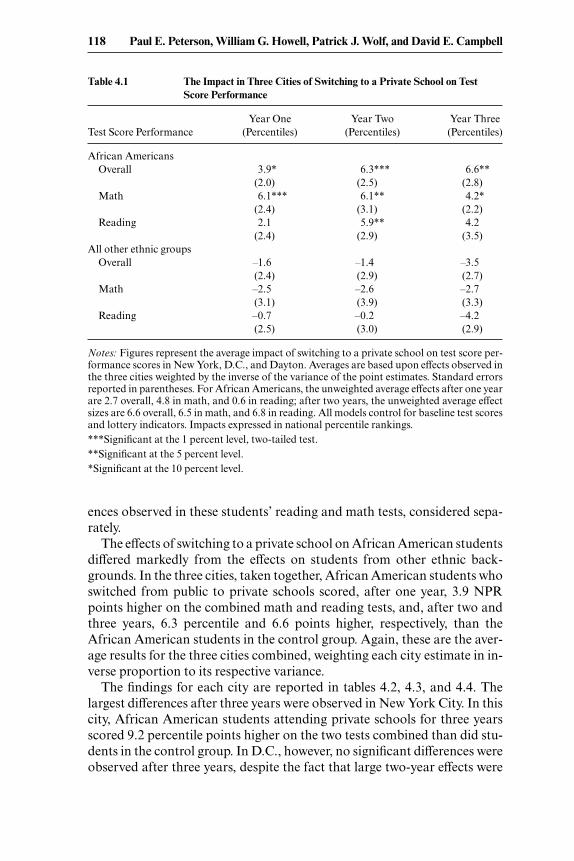
The findings for each city are reported in tables 4.2, 4.3, and 4.4. Thelargest differences after three years were observed in New York City. In thiscity, African American students attending private schools for three yearsscored 9.2 percentile points higher on the two tests combined than did stu-dents in the control group. In D.C., however, no significant differences wereobserved after three years, despite the fact that large two-year effects were
118 Paul E. Peterson, William G. Howell, Patrick J. Wolf, and David E. Campbell
Table 4.1 The Impact in Three Cities of Switching to a Private School on TestScore Performance
Year One Year Two Year ThreeTest Score Performance (Percentiles) (Percentiles) (Percentiles)
African AmericansOverall 3.9* 6.3*** 6.6**
(2.0) (2.5) (2.8)Math 6.1*** 6.1** 4.2*
(2.4) (3.1) (2.2)Reading 2.1 5.9** 4.2
(2.4) (2.9) (3.5)All other ethnic groups
Overall –1.6 –1.4 –3.5(2.4) (2.9) (2.7)
Math –2.5 –2.6 –2.7(3.1) (3.9) (3.3)
Reading –0.7 –0.2 –4.2(2.5) (3.0) (2.9)
Notes: Figures represent the average impact of switching to a private school on test score per-formance scores in New York, D.C., and Dayton. Averages are based upon effects observed inthe three cities weighted by the inverse of the variance of the point estimates. Standard errorsreported in parentheses. For African Americans, the unweighted average effects after one yearare 2.7 overall, 4.8 in math, and 0.6 in reading; after two years, the unweighted average effectsizes are 6.6 overall, 6.5 in math, and 6.8 in reading. All models control for baseline test scoresand lottery indicators. Impacts expressed in national percentile rankings.***Significant at the 1 percent level, two-tailed test.**Significant at the 5 percent level.*Significant at the 10 percent level.
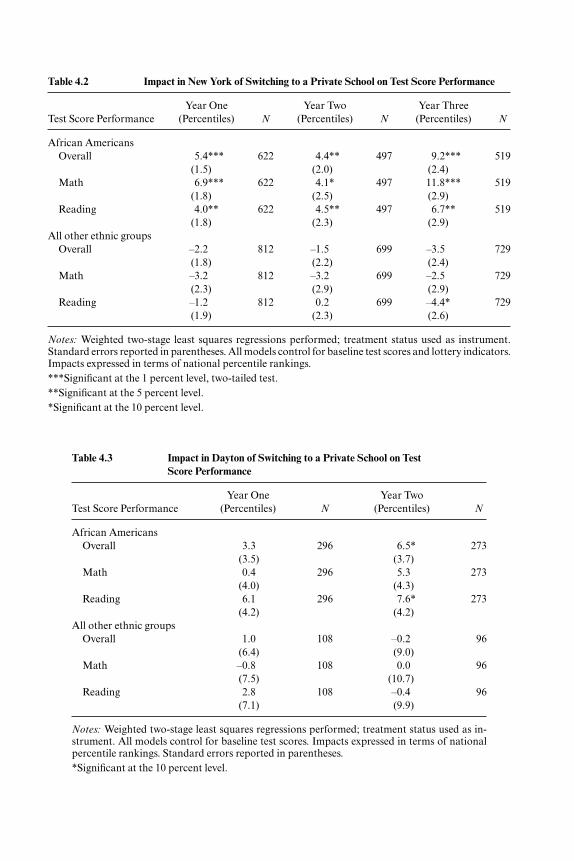
Table 4.2 Impact in New York of Switching to a Private School on Test Score Performance
Year One Year Two Year ThreeTest Score Performance (Percentiles) N (Percentiles) N (Percentiles) N
African AmericansOverall 5.4*** 622 4.4** 497 9.2*** 519
(1.5) (2.0) (2.4)Math 6.9*** 622 4.1* 497 11.8*** 519
(1.8) (2.5) (2.9)Reading 4.0** 622 4.5** 497 6.7** 519
(1.8) (2.3) (2.9)All other ethnic groups
Overall –2.2 812 –1.5 699 –3.5 729(1.8) (2.2) (2.4)
Math –3.2 812 –3.2 699 –2.5 729(2.3) (2.9) (2.9)
Reading –1.2 812 0.2 699 –4.4* 729(1.9) (2.3) (2.6)
Notes: Weighted two-stage least squares regressions performed; treatment status used as instrument.Standard errors reported in parentheses. All models control for baseline test scores and lottery indicators.Impacts expressed in terms of national percentile rankings.***Significant at the 1 percent level, two-tailed test.**Significant at the 5 percent level.*Significant at the 10 percent level.
Table 4.3 Impact in Dayton of Switching to a Private School on TestScore Performance
Year One Year TwoTest Score Performance (Percentiles) N (Percentiles) N
African AmericansOverall 3.3 296 6.5* 273
(3.5) (3.7)Math 0.4 296 5.3 273
(4.0) (4.3)Reading 6.1 296 7.6* 273
(4.2) (4.2)All other ethnic groups
Overall 1.0 108 –0.2 96(6.4) (9.0)
Math –0.8 108 0.0 96(7.5) (10.7)
Reading 2.8 108 –0.4 96(7.1) (9.9)
Notes: Weighted two-stage least squares regressions performed; treatment status used as in-strument. All models control for baseline test scores. Impacts expressed in terms of nationalpercentile rankings. Standard errors reported in parentheses.*Significant at the 10 percent level.
observed. In Dayton, the difference in combined test score performance was6.5 percentile points after two years, the total duration of the evaluation.
The trend over time also varies from one city to the next. As can be seenin table 4.2, in New York City, substantial test score differences betweenAfrican American students in private and public schools appear at the endof the first year (5.4 percentile points) and attenuate slightly in the secondyear (4.4 points) but increase to 9.2 percentile points in year three. In thiscity, test score gains appeared to grow over time.
In Dayton, there was a steady upward trend in the combined test scoreperformance of African Americans between years one and two. Table 4.3shows that African American students who switched from public to privateschools performed 3.3 percentile points higher on the combined test in yearone and 6.5 percentile points higher in year two. Once again, a model of ac-cumulated gains could account for the findings.
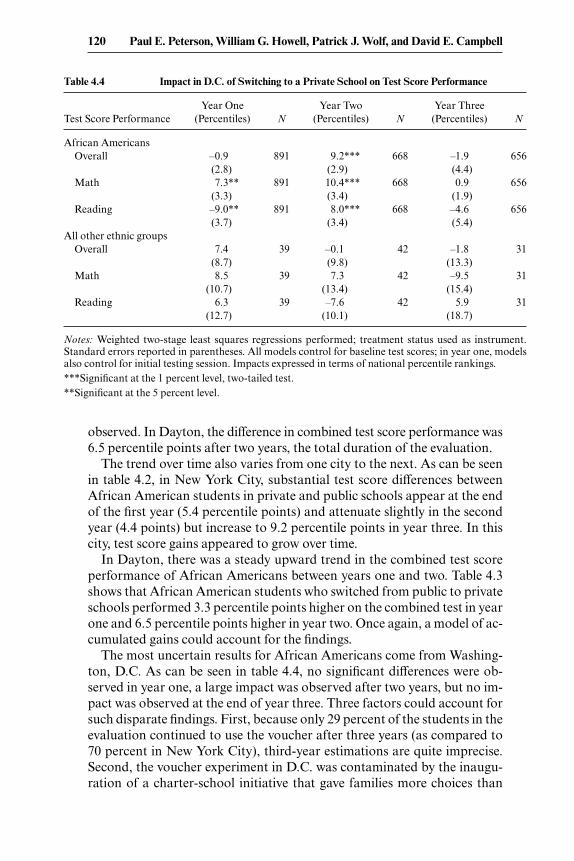
The most uncertain results for African Americans come from Washing-ton, D.C. As can be seen in table 4.4, no significant differences were ob-served in year one, a large impact was observed after two years, but no im-pact was observed at the end of year three. Three factors could account forsuch disparate findings. First, because only 29 percent of the students in theevaluation continued to use the voucher after three years (as compared to70 percent in New York City), third-year estimations are quite imprecise.Second, the voucher experiment in D.C. was contaminated by the inaugu-ration of a charter-school initiative that gave families more choices than
120 Paul E. Peterson, William G. Howell, Patrick J. Wolf, and David E. Campbell
Table 4.4 Impact in D.C. of Switching to a Private School on Test Score Performance
Year One Year Two Year ThreeTest Score Performance (Percentiles) N (Percentiles) N (Percentiles) N
African AmericansOverall –0.9 891 9.2*** 668 –1.9 656
(2.8) (2.9) (4.4)Math 7.3** 891 10.4*** 668 0.9 656
(3.3) (3.4) (1.9)Reading –9.0** 891 8.0*** 668 –4.6 656
(3.7) (3.4) (5.4)All other ethnic groups
Overall 7.4 39 –0.1 42 –1.8 31(8.7) (9.8) (13.3)
Math 8.5 39 7.3 42 –9.5 31(10.7) (13.4) (15.4)
Reading 6.3 39 –7.6 42 5.9 31(12.7) (10.1) (18.7)
Notes: Weighted two-stage least squares regressions performed; treatment status used as instrument.Standard errors reported in parentheses. All models control for baseline test scores; in year one, modelsalso control for initial testing session. Impacts expressed in terms of national percentile rankings.***Significant at the 1 percent level, two-tailed test.**Significant at the 5 percent level.
those available in New York City; indeed, 17 percent of the treatment groupand 24 percent of the control group in D.C. attended charter schools in thethird year of the evaluation. Finally, the differences in the third-year resultsmight be attributed to the more established private sector in New York Citythan in Washington, D.C. Catholic schools, the major provider of privateeducation in the two cities, are better endowed and historically more rootedin the northern port city, whose Catholic, immigrant population dates backto the early nineteenth century.15
4.4.3 Interpreting the Magnitude of the Test Score Effects
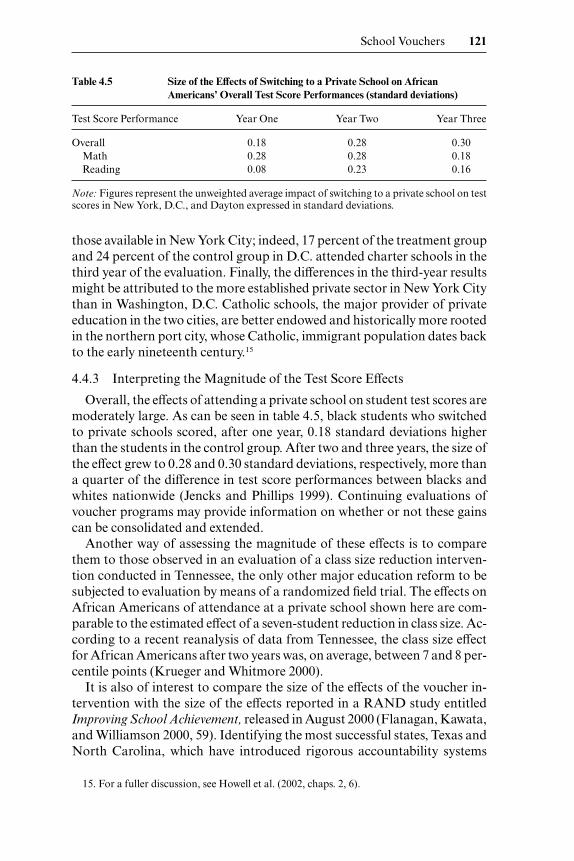
Overall, the effects of attending a private school on student test scores aremoderately large. As can be seen in table 4.5, black students who switchedto private schools scored, after one year, 0.18 standard deviations higherthan the students in the control group. After two and three years, the size ofthe effect grew to 0.28 and 0.30 standard deviations, respectively, more thana quarter of the difference in test score performances between blacks andwhites nationwide (Jencks and Phillips 1999). Continuing evaluations ofvoucher programs may provide information on whether or not these gainscan be consolidated and extended.
Another way of assessing the magnitude of these effects is to comparethem to those observed in an evaluation of a class size reduction interven-tion conducted in Tennessee, the only other major education reform to besubjected to evaluation by means of a randomized field trial. The effects onAfrican Americans of attendance at a private school shown here are com-parable to the estimated effect of a seven-student reduction in class size. Ac-cording to a recent reanalysis of data from Tennessee, the class size effectfor African Americans after two years was, on average, between 7 and 8 per-centile points (Krueger and Whitmore 2000).
It is also of interest to compare the size of the effects of the voucher in-tervention with the size of the effects reported in a RAND study entitledImproving School Achievement, released in August 2000 (Flanagan, Kawata,and Williamson 2000, 59). Identifying the most successful states, Texas andNorth Carolina, which have introduced rigorous accountability systems
School Vouchers 121
15. For a fuller discussion, see Howell et al. (2002, chaps. 2, 6).
Table 4.5 Size of the Effects of Switching to a Private School on AfricanAmericans’ Overall Test Score Performances (standard deviations)
Test Score Performance Year One Year Two Year Three
Overall 0.18 0.28 0.30Math 0.28 0.28 0.18Reading 0.08 0.23 0.16
Note: Figures represent the unweighted average impact of switching to a private school on testscores in New York, D.C., and Dayton expressed in standard deviations.
that involve statewide testing, the study finds what it says are “remarkable”one-year gains in math scores in these states of “as much as 0.06 to 0.07standard deviation[s] per year”—or 0.18 to 0.21 over three years. The three-year effects of the school voucher intervention on black students observedhere are somewhat larger.
4.4.4 Cost-Benefit Analysis
What are these test score gains for African Americans likely to mean interms of future economic benefits? Richard Murname and his colleagueshave calculated the effects of math achievement on future earnings (Mur-name et al. 2000). According to one estimate, a 0.30 standard deviation in-crease in average math achievement, if sustained, will yield a 5 percent gainin earnings seven to ten years after the student finishes high school. If anAfrican American student in the control group was expected to earn about$30,000 a year in his late twenties, a comparable student who had switchedfrom public to private school would be expected to earn an additional$1,500 per year.
This suggests that investments in vouchers might yield a moderate rate ofreturn for African American families. Why, then, don’t families make thisinvestment on their own? If a control group family had simply absorbed thecost of the voucher (on average, about $1,200), even a rough calculation ofthe rate of return suggests that it would be an attractive investment, pro-vided that families can borrow moneys at conventional rates. Credit con-straints are a possible explanation for the decision not to utilize a privateschool on the part of control group families. Private lenders may be reluc-tant to make long-term loans at conventional lending rates to low-incomeborrowers, who may be high credit risks. If families can borrow the moneyonly at rates charged to high-risk users of bank cards, then the rate of returnon an investment in private schooling, although probably still positive,would be considerably less attractive—unless a family perceives nonpecu-niary benefits of a private education.
Clearly, though, the lower the initial costs, the more attractive an invest-ment in private schooling becomes. When a voucher reduces the amountthat needs to be borrowed from around $2,400 a year (a rough estimate ofthe average cost of private school tuition, fees, books, and uniforms in thesecities) to half that amount, families may decide that the benefits of an in-vestment in private schooling now outweigh the costs. Perhaps this explainswhy a small voucher induced many low-income families to make the addi-tional investment, even when members of a similarly situated control group(who did not receive the voucher offer) were less likely to do so.16
122 Paul E. Peterson, William G. Howell, Patrick J. Wolf, and David E. Campbell
16. A careful analysis of this question would require a fuller examination of the probableeconomic benefits of test score gains, the cost of private schooling, and the interest rates facedby various classes of potential borrowers.
4.4.5 Additional Methodological Considerations
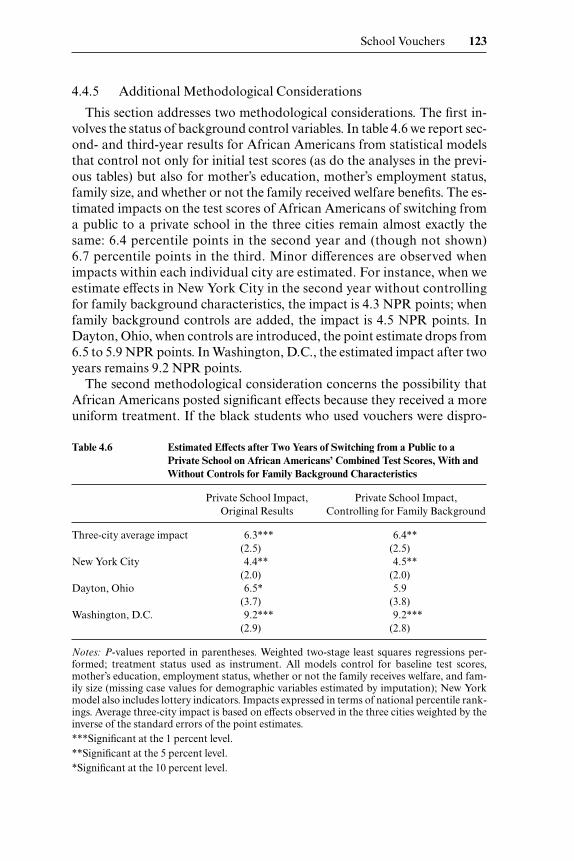
This section addresses two methodological considerations. The first in-volves the status of background control variables. In table 4.6 we report sec-ond- and third-year results for African Americans from statistical modelsthat control not only for initial test scores (as do the analyses in the previ-ous tables) but also for mother’s education, mother’s employment status,family size, and whether or not the family received welfare benefits. The es-timated impacts on the test scores of African Americans of switching froma public to a private school in the three cities remain almost exactly thesame: 6.4 percentile points in the second year and (though not shown)6.7 percentile points in the third. Minor differences are observed whenimpacts within each individual city are estimated. For instance, when weestimate effects in New York City in the second year without controllingfor family background characteristics, the impact is 4.3 NPR points; whenfamily background controls are added, the impact is 4.5 NPR points. InDayton, Ohio, when controls are introduced, the point estimate drops from6.5 to 5.9 NPR points. In Washington, D.C., the estimated impact after twoyears remains 9.2 NPR points.
The second methodological consideration concerns the possibility thatAfrican Americans posted significant effects because they received a moreuniform treatment. If the black students who used vouchers were dispro-
School Vouchers 123
Table 4.6 Estimated Effects after Two Years of Switching from a Public to aPrivate School on African Americans’ Combined Test Scores, With andWithout Controls for Family Background Characteristics
Private School Impact, Private School Impact,Original Results Controlling for Family Background
Three-city average impact 6.3*** 6.4**(2.5) (2.5)
New York City 4.4** 4.5**(2.0) (2.0)
Dayton, Ohio 6.5* 5.9(3.7) (3.8)
Washington, D.C. 9.2*** 9.2***(2.9) (2.8)
Notes: P-values reported in parentheses. Weighted two-stage least squares regressions per-formed; treatment status used as instrument. All models control for baseline test scores,mother’s education, employment status, whether or not the family receives welfare, and fam-ily size (missing case values for demographic variables estimated by imputation); New Yorkmodel also includes lottery indicators. Impacts expressed in terms of national percentile rank-ings. Average three-city impact is based on effects observed in the three cities weighted by theinverse of the standard errors of the point estimates.***Significant at the 1 percent level.**Significant at the 5 percent level.*Significant at the 10 percent level.

portionately concentrated in a small number of good private schools, ortheir peers in the control group concentrated disproportionately in a fewbad public schools, the error term in the estimation of private school effectswould be smaller for African Americans than for other students. Thiswould increase the probability that one would observe significant impactson African American test scores, but not on those of other ethnic groups.
For two reasons, however, we doubt this explanation has much traction.First, the size of the standard errors is not all that differentiates the effects forAfrican Americans and members of the other ethnic groups. For Latinos inNew York and whites in Dayton, the point estimates consistently hoveraround zero, whereas for African Americans in both cities the point estimatesare quite large. Second, when surveying the private school attendance pat-terns of students from different ethnic groups, one finds little evidence thattreatment effects were more uniform for some groups than others. AfricanAmericans, for the most part, did not attend a relatively smaller number ofpublic or private schools than did members of other ethnic groups.17
4.5 Parent Satisfaction
Most studies have found that families who use vouchers to attend an areaprivate school are much more satisfied with their schooling than are fami-lies who remain in public schools.18 The results presented in table 4.7 con-firm these earlier findings. A significantly higher proportion of privateschool parents were “very satisfied” with the following aspects of theirschools: school safety, teaching, parental involvement, class size, school
124 Paul E. Peterson, William G. Howell, Patrick J. Wolf, and David E. Campbell
17. Since information about the distribution of students among schools is available from thefirst year of the Dayton evaluation, we were able to estimate the extent to which African Amer-icans and non–African Americans were subject to uniform treatment simply by dividing thenumber of students in a category by the number of schools they attended. On the whole, wefound fairly low uniformity of treatment and not much difference between racial groups. Forboth African American and non–African American students receiving treatment, the degreeof concentration among schools was, on average, just three students. Among students in thecontrol group, the degree of concentration was 3 students per school for African Americansand 1.3 students for non–African Americans. According to this estimation, then, some differ-ence in the degree of concentration between African American and non–African Americanstudents is evident, but the difference is not large.
One may also estimate the degree of uniformity of treatment by examining the percentageof students in the three schools serving the largest number of students. When one estimates inthis way, one again finds some difference between treatment and control groups. However, inthis case it is the non–African Americans who appear the most concentrated. A total of 37 per-cent of the African American treatment students enrolled in just three schools, as comparedto 15 percent of the African American members of the control group. For non–African Amer-icans, these figures were 56 percent and 16 percent, respectively. According to this estimate, thenonblack members of the Dayton experiment experienced a more uniform dose of treatmentthan did the black students in the study.
18. A summary of findings from earlier studies is available in Peterson (1998, 18). Schneideret al. (1998) finds higher levels of parental satisfaction within New York City public schoolswhen parents are given a choice of school.
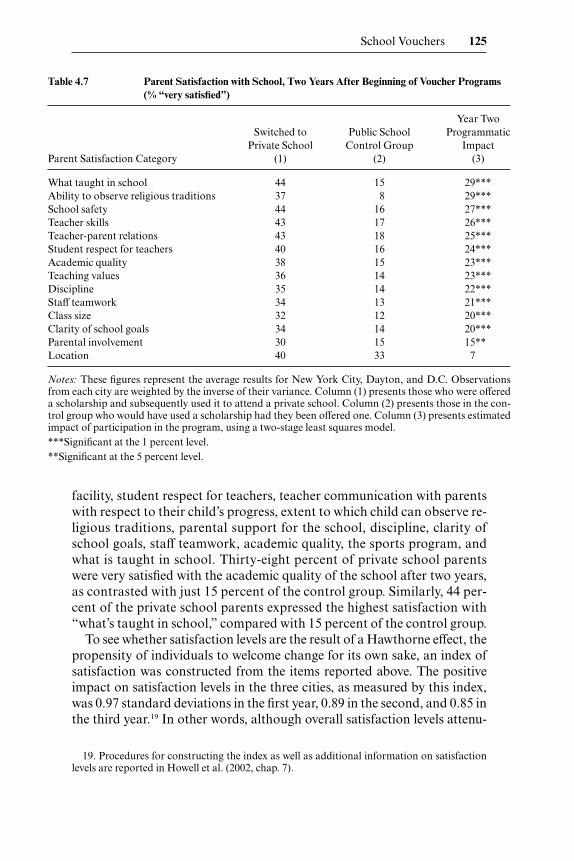
facility, student respect for teachers, teacher communication with parentswith respect to their child’s progress, extent to which child can observe re-ligious traditions, parental support for the school, discipline, clarity ofschool goals, staff teamwork, academic quality, the sports program, andwhat is taught in school. Thirty-eight percent of private school parentswere very satisfied with the academic quality of the school after two years,as contrasted with just 15 percent of the control group. Similarly, 44 per-cent of the private school parents expressed the highest satisfaction with“what’s taught in school,” compared with 15 percent of the control group.
To see whether satisfaction levels are the result of a Hawthorne effect, thepropensity of individuals to welcome change for its own sake, an index ofsatisfaction was constructed from the items reported above. The positiveimpact on satisfaction levels in the three cities, as measured by this index,was 0.97 standard deviations in the first year, 0.89 in the second, and 0.85 inthe third year.19 In other words, although overall satisfaction levels attenu-
School Vouchers 125
Table 4.7 Parent Satisfaction with School, Two Years After Beginning of Voucher Programs(% “very satisfied”)
Year TwoSwitched to Public School Programmatic
Private School Control Group ImpactParent Satisfaction Category (1) (2) (3)
What taught in school 44 15 29***Ability to observe religious traditions 37 8 29***School safety 44 16 27***Teacher skills 43 17 26***Teacher-parent relations 43 18 25***Student respect for teachers 40 16 24***Academic quality 38 15 23***Teaching values 36 14 23***Discipline 35 14 22***Staff teamwork 34 13 21***Class size 32 12 20***Clarity of school goals 34 14 20***Parental involvement 30 15 15**Location 40 33 7
Notes: These figures represent the average results for New York City, Dayton, and D.C. Observationsfrom each city are weighted by the inverse of their variance. Column (1) presents those who were offereda scholarship and subsequently used it to attend a private school. Column (2) presents those in the con-trol group who would have used a scholarship had they been offered one. Column (3) presents estimatedimpact of participation in the program, using a two-stage least squares model.***Significant at the 1 percent level.**Significant at the 5 percent level.
19. Procedures for constructing the index as well as additional information on satisfactionlevels are reported in Howell et al. (2002, chap. 7).
ated slightly from the first to the second and third years of the evaluation,Hawthorne effects appear minimal.
4.6 Other Voucher Impacts
Although test score performance and parental satisfaction are the out-comes of greatest interest to most observers, parental surveys providedadditional information about the impacts of voucher opportunities onselected characteristics of the schools attended by students. Significantdifferences were identified in the school facilities available to students,school size, class size, school climate, homework assignment practices, andschool communication with families.
4.6.1 School Facilities
Public school expenditures eclipse private school expenditures. Nation-wide, the average private school expenditures per pupil in 1993–94 were es-timated at $3,116, considerably less than the $6,653 spent, on average, onpublic school pupils (Coulson 1999, 277). In part, this disparity is due to thewider array of services that public schools provide their students. Nonethe-less, even when adjustments are made for the kinds of services rendered,public schools in New York City, Dayton, and D.C. spend roughly twice asmuch as private schools.
Per-pupil expenditures for both Catholic and public schools were avail-able for schools in three boroughs of New York City.20 In comparing ex-penditures, the amount spent by New York public schools for all items thatdid not clearly have a private school counterpart was deducted. Amongother things, deductions were taken for all monies spent on transportation,special education, school lunch, other ancillary services, and the cost of fi-nancing the far-flung bureaucracy that runs the citywide, boroughwide,and districtwide operations of the New York City public schools.
All these deductions from public school expenditures amounted to no lessthan 40 percent of the cost of running the New York City public schools.However, even after all these and other deductions were taken, publicschools were still spending over $5,000 per pupil each year, more than twicethe $2,400 spent on similar services in New York City’s Catholic schools.
In Washington, D.C., the median tuition at the private schools attendedby the scholarship students included in the evaluation was $3,113 in theyear 1998–99.21 The average is substantially higher than the median becauseof the high tuition charged by a few independent schools, such as Sidwell
126 Paul E. Peterson, William G. Howell, Patrick J. Wolf, and David E. Campbell
20. Estimates are based on information about Catholic schools in Manhattan, the Bronx,and Brooklyn from an unpublished memorandum submitted to the Program on EducationPolicy and Governance from the New York archdiocese in August 1999. Public school expen-diture by school for the city of New York is available on the Board of Education website.
21. Private school tuition rates were estimated in part from information provided in Coer-per and Mersereau (1998). For schools not listed in this volume, information was obtained in
School Vouchers 127
Table 4.8 Size and Quality of School Facilities, One Year After Beginning of VoucherPrograms (%)
Switched to Public School ProgrammaticPrivate School Control Group Impact
Parental Reports (1) (2) (3)
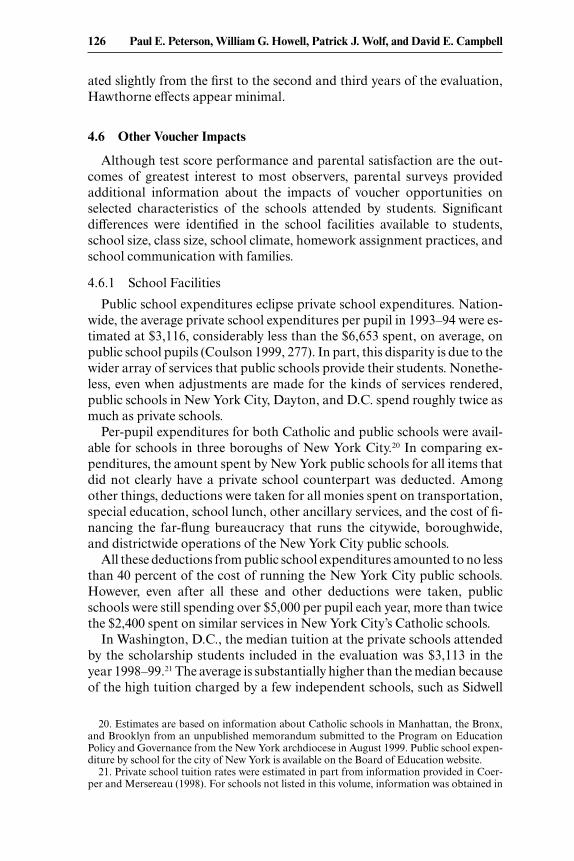
Average school size 278 450 –172***Average class size 20 23 –3***Percentage satisfied with school facilities 28 9 19***Percentage with the following resources:
Special programs for non-English speakers 43 71 –28***Nurses’ office 75 94 –19***Special programs for learning disabled 67 81 –14***Cafeteria 86 96 –10***Child counselor 77 85 –8***Library 92 96 –5**Gym 88 88 0Special programs for advanced learners 59 58 1Arts program 82 81 1Computer lab 86 84 2Music program 88 84 4After-school program 91 86 6**Individual tutors 70 54 16***
Notes: See notes to table 4.7.
Friends, which charged the Clintons over $15,000 per year for their daugh-ter’s tuition. Assuming that the ratio of tuition to total educational expen-diture in Washington, D.C. is the same as in the three boroughs in NewYork City discussed previously, private educational expenditures, on aver-age, totaled roughly $4,000. Again, considering only those services and pro-grams that both public and private schools cover, adjusted per-pupil ex-penditures in Washington public schools reached $8,185, as estimated fromdata for the 1995–96 school year.22
Much the same patterns emerge in Dayton. In 1998–99, students in theDayton voucher program paid, on average, $2,600 in tuition, whereas theDayton public school system spend an adjusted average of $5,528 per pupil.
Parental reports help explain these expenditure data. According to theparental surveys, private schools were less likely to have a library, a nurse’soffice, a cafeteria, child counselors, and special programs for non–Englishspeakers and students with learning problems (see table 4.8). The greatestdifference was for programs for non-English-speaking students. Forty-
telephone conversations with school staff. Some schools have a range of tuition charges, de-pending on the number of students from the family attending the school and other factors. Thetuition used for this calculation is the maximum charged by the school. The tuition also in-cludes all fees, except for the registration fee, which is ordinarily treated as partial payment to-ward tuition. Figures are weighted proportionate to the number of students in the evaluationattending a particular school. Public school expenditure includes the costs of transportationand special education, which may not be provided by private schools.
22. Data taken from the U.S. Department of Education (2000).

three percent of the private school parents reported such a program in theirschool, compared with 71 percent of the control group parents. Similarly,75 percent of the private school parents reported their school had a nurse’soffice, as compared to 94 percent of public school parents. Public schoolsare also larger. In some instances, either no significant differences were de-tected or private school parents reported more services. The two groups ofparents did not differ in their reports of the availability of a gym, a com-puter laboratory, art and music programs, and special programs for ad-vanced learners. Private school parents, meanwhile, were more likely to saytheir school had individual tutors and an after-school program.
Despite the more limited financial resources of the private school, par-ents reported that their children attended classes with an average of twentystudents, as compared to twenty-three in public schools (Peterson, Myers,and Howell 1998, table 5). However, the reduction in class size was onlythree students, considerably less than the amount generally thought to benecessary to achieve significant gains from class size reduction.23 As esti-mated by parents, the effect of choosing the private sector was to reduce theaverage size of the school by 172 students or nearly 40 percent—from an av-erage of 450 students to 278 students.
4.6.2 School Climate
In their study of public and private schools, John Chubb and Terry Moe(1990) found that the educational environment of private schools was moreconducive to learning than that of public schools. They pointed out thatpublic schools are governed by state laws, federal regulations, school boardrequirements, and union-contract rules that impose multiple and not al-ways consistent obligations on teachers and principals. Because they mustrespond to numerous legal and contractual requirements, school adminis-trators and teachers focus more on rule compliance than on educationalmission, undermining the morale of educators whose original objective wasto help children learn.
The problem, Chubb and Moe say, is particularly prevalent in big-cityschools. Urban private schools operate with greater autonomy, focus moredirectly on their educational mission, and, as a result, achieve a higher de-gree of internal cohesion. To do otherwise would jeopardize their survivalas fragile institutions dependent upon the annual recruitment of new stu-dents. As a consequence, principals and teachers in the private sector enjoyhigher morale. Their interactions with one another and with their studentsare more positive, fostering a more effective learning environment.
Our findings confirm Chubb and Moe’s. If parent reports are accurate, the
128 Paul E. Peterson, William G. Howell, Patrick J. Wolf, and David E. Campbell
23. The reduction in class size in the Tennessee experiment was an average of approximatelyseven to eight students (Krueger 1999). For further discussion of this point, see Howell et al.(2002, 158–64).
School Vouchers 129
Table 4.9 Parents’ Perceptions of School Climate, One Year After Beginning of VoucherPrograms (%)
Switched to Public School ProgrammaticPrivate School Control Group Impact
Reported by Parents as Serious Problem (1) (2) (3)
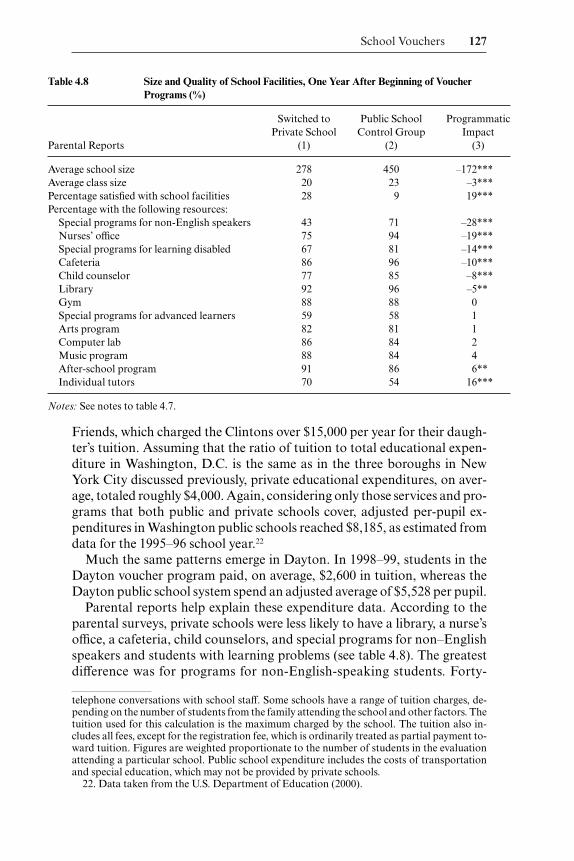
Fighting 32 63 –31***Kids missing class 26 48 –22***Tardiness 33 54 –21***Kids destroying property 22 42 –20***Cheating 26 39 –13***
Notes: See notes to table 4.7.
Table 4.10 Homework, One Year After Beginning of Voucher Programs (%)
Switched to Public School ProgrammaticPrivate School Control Group Impact
Reported by Parents (1) (2) (3)
Child has more than one hour of homework 72 56 16***
Difficulty of homework appropriate for child 90 72 18***
Notes: See notes to table 4.7.
scholarship programs in New York, D.C., and Dayton had a major impacton the daily life of students at school. As table 4.9 shows, public school par-ents were more likely to report that the following were serious problems attheir school: students destroying property, tardiness, missing classes, fighting,cheating, and racial conflict. For example, 32 percent of the private schoolparents thought that fighting was a serious problem at their school versus63 percent of the control group. Thirty-three percent of parents perceived tar-diness as a problem, as compared to 54 percent of the control group. No morethan 22 percent of private school parents, but 42 percent of the control group,said that destruction of property was a serious problem at their school.
4.6.3 Homework and Parental Communication
Thomas Hoffer, Andrew Greeley, and James Coleman (1985) have at-tributed the higher level of student performance in private schools to theamount of homework expected of students and to the frequency of com-munication between schools and parents. The reports by parents are con-sistent with their interpretation.24 Table 4.10 shows that 72 percent ofprivate school parents reported that their child had at least an hour of
24. For very similar first-year results, see Peterson, Myers, and Howell (1998), table 9.
homework a day, whereas only 56 percent of the control group parents re-ported a similar amount of homework. Private school parents were alsomore likely to say the homework was appropriate for their child. Seventy-two percent of the control group parents gave this response, as compared to90 percent of private-school parents.
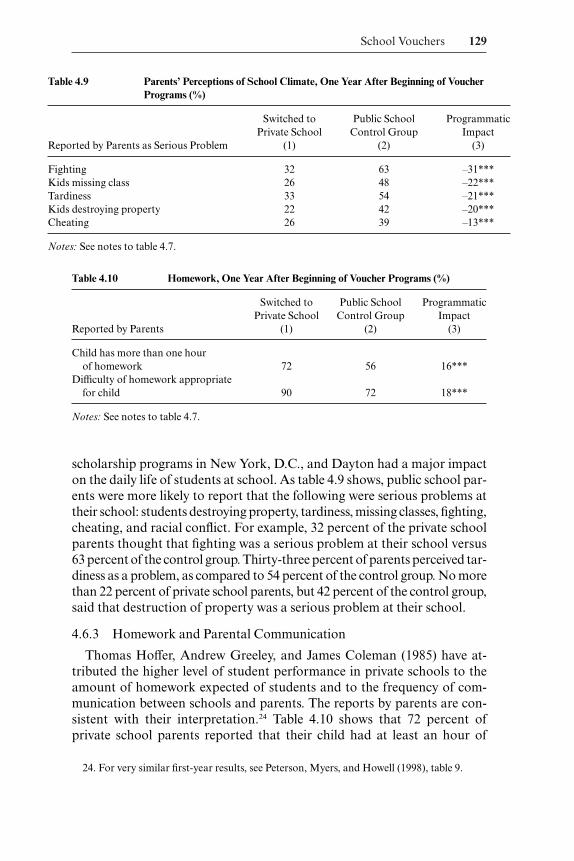
Compared with control-group parents, parents of students in privateschools also said that they received more communication from their schoolabout their child. The results presented in table 4.11 indicate that a higherpercent of private school parents versus control group parents reported thefollowing: being more informed about student grades halfway through thegrading period; being notified when their child is sent to the office the firsttime for disruptive behavior; speaking to classes about their jobs; partici-pating in instruction; receiving notes about their child from the teacher; re-ceiving a newsletter about what is going on in school; and regular parent-teacher conferences.
4.7 Conclusions
Because random assignment to test and control groups assures that allsignificant effects may be attributed to the intervention, and not to the stu-dents’ initial abilities or their family backgrounds, randomized field trialsare the best available tool for detecting the effects of an educational inter-vention. Nonetheless, when one interprets the findings from the evaluationof any one program in a particular city, generalizations to a larger universeare problematic. Conditions specific to that place or minor fluctuations intesting conditions might skew results in one direction or another.
Still, when similar results emerge from evaluations of school voucher pro-
130 Paul E. Peterson, William G. Howell, Patrick J. Wolf, and David E. Campbell
Table 4.11 School Communication with Parents, One Year After Beginning of VoucherPrograms (%)
Switched to Public School ProgrammaticPrivate School Control Group Impact
Reported by Parents (1) (2) (3)
Parents receive newsletter 88 68 20***Parents participate in instrument 68 50 18***Parents notified of disruptive behavior 91 77 14***Parents receive notes from teacher 93 78 14***Parents speak to classes about jobs 44 33 11**Parents regularly informed about
student grades 93 84 9**Parent open houses held at school 95 90 5**Regular parent-teacher conferences 95 90 5**
Notes: See notes to table 4.7.
grams in three sites in different parts of the United States, they provide astronger basis for drawing conclusions and generalizing to larger populations.Thus, the average impact across the three sites may provide a reasonable esti-mate of the likely initial impact of a school voucher initiative elsewhere.
In the three cases, taken together, we found effects of school vouchersonly on the average test performance of African American students. Afri-can American students who switched from public to private schools in thethree cities scored after two years, on average, approximately 6.3 percen-tile points higher on the ITBS than comparable African Americans whoremained in public schools. After three years, private school attendance intwo cities had an impact of 6.6 percentile points, an effect of 0.30 standarddeviations.
At this point we do not know why the gains from switching to a privateschool are evident for African American students after two and three years,but not for students from other ethnic backgrounds. However, parents re-ported that private schools are smaller in size, maintain a better disciplin-ary climate, ask students to do more homework, maintain closer commu-nication with families, and have somewhat smaller classes (about 3 fewerpupils). These school characteristics may be particularly helpful to studentswho are African American.
One must qualify any generalizations from the results of this pilot pro-gram to a large-scale voucher program that would involve all children in alarge urban school system. Only a small fraction of low-income students inthese three cities’ schools were offered vouchers, and these voucher studentsconstituted only a small proportion of the students attending privateschools in these cities. A much larger program could conceivably have quitedifferent program outcomes.
Still, slightly larger voucher programs initially directed at low-incomefamilies would attract those families with the greatest interest in exploringan educational alternative, exactly the group that applied for a voucher inthese three cities. Thus, positive consequences of school choice reportedherein may prove encouraging to those who seek to extend and expandschool choices for low-income, inner-city families, and negative findingsmay indicate problems that need to be addressed. It is hoped that additionalcareful research will accompany larger programs established by private phi-lanthropists and public authorities.
Appendix A
Response Rates
To promote high response rates, voucher program operators either requiredor strongly urged recipients to participate in testing sessions if they wished
School Vouchers 131

to have their voucher renewed for the next school year. In addition, evalua-tion teams offered financial incentives and new opportunities to win avoucher to encourage members of the control group and members of thetreatment group who remained in public schools to return for follow-uptesting.25 Still, substantial numbers of students were not tested at the end ofone, two, and three years.
Response rates were 100 percent at baseline, because families and stu-dents were not entered into the lottery unless they provided baseline in-formation. Response rates after one year were 82 percent in New York, 56percent in Dayton, and 63 percent in Washington, D.C. After two years,response rates in the three cities were 66 percent, 49 percent, and 50 per-cent, respectively. After three years, response rates were 67 percent in NewYork and 60 percent in Washington, D.C. Response rates were similarfor treatment and control groups in all three cities.26 The largest differencewas in New York City in the second year, where the treatment group’s re-sponse rate was 7 points higher than the control group rate.27
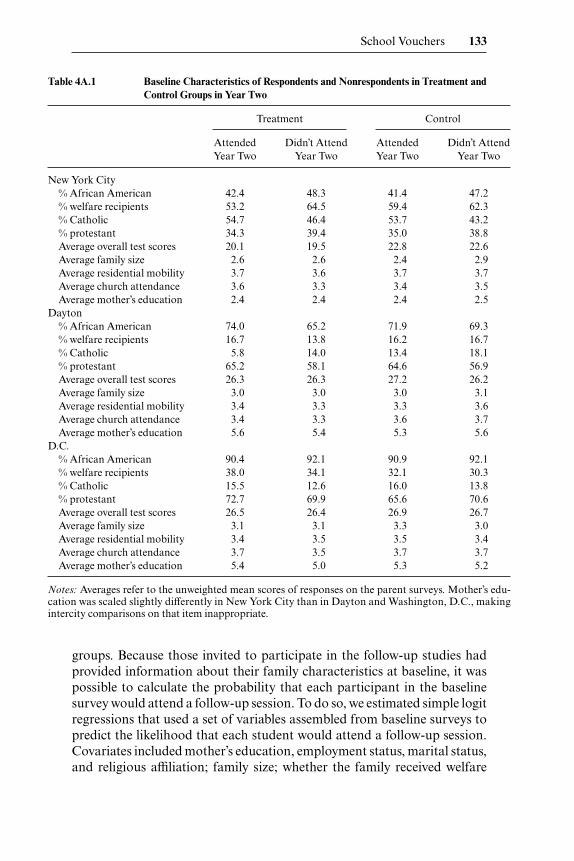
Comparisons of baseline test scores and background characteristics re-veal only minor differences between respondents and nonrespondents in allthree cities. Table 4A.1 presents, for example, baseline data on respondentsand nonrespondents in the treatment and control groups after two years inthe three cities; separate comparisons for African Americans are includedin table 4A.2. Some differences in race, welfare, and religious orientationwere detected, but they point in different directions in different cities and donot appear to systematically produce a more advantaged group of respon-dents in the treatment group or a particularly disadvantaged control group.In all three cities, inter-group differences in test scores, religious identifica-tion, residential mobility rates, church attendance, and family size were es-sentially nonexistent.
To adjust for the bias associated with nonresponse, in each year and citywe generated weights for parents and students in the treatment and control
132 Paul E. Peterson, William G. Howell, Patrick J. Wolf, and David E. Campbell
25. In New York City and Washington, D.C., families in the control group were entered ina new lottery if they attended follow-up testing in years one and two. In Dayton, control groupfamilies were entered in a new lottery after the first year of the program; in year two, they wereoffered higher compensation instead. Families that began the study as members of a controlgroup were dropped from the evaluation if they subsequently won a follow-up lottery. Al-though this was necessary to preserve the random design of the evaluation, excluding suchfamilies had the effect of reducing the size of the control groups slightly. Although families thatdid complete the surveys may be systematically different from those that did not, dropping therandomly selected subset of survey respondents should only decrease the efficiency of the es-timates, not bias the findings. In D.C. in year three, all control group families and all those thatdid not use the initial vouchers offered them were offered a voucher.
26. The one exception here concerns the year-two evaluation in New York City, in which thetreatment group’s response rate was 7 points higher than the control group’s rate.
27. These response rates are similar to those in other randomized field trials that follow stu-dents over time. In his reanalysis of data from the Tennessee class size study, for example,Krueger (1999), while not providing annual attrition rates, reports that “only half the studentswho entered the project in kindergarten were present for all grades K-3” (506).
groups. Because those invited to participate in the follow-up studies hadprovided information about their family characteristics at baseline, it waspossible to calculate the probability that each participant in the baselinesurvey would attend a follow-up session. To do so, we estimated simple logitregressions that used a set of variables assembled from baseline surveys topredict the likelihood that each student would attend a follow-up session.Covariates included mother’s education, employment status, marital status,and religious affiliation; family size; whether the family received welfare
School Vouchers 133
Table 4A.1 Baseline Characteristics of Respondents and Nonrespondents in Treatment andControl Groups in Year Two
Treatment Control
Attended Didn’t Attend Attended Didn’t AttendYear Two Year Two Year Two Year Two
New York City% African American 42.4 48.3 41.4 47.2% welfare recipients 53.2 64.5 59.4 62.3% Catholic 54.7 46.4 53.7 43.2% protestant 34.3 39.4 35.0 38.8Average overall test scores 20.1 19.5 22.8 22.6Average family size 2.6 2.6 2.4 2.9Average residential mobility 3.7 3.6 3.7 3.7Average church attendance 3.6 3.3 3.4 3.5Average mother’s education 2.4 2.4 2.4 2.5
Dayton% African American 74.0 65.2 71.9 69.3% welfare recipients 16.7 13.8 16.2 16.7% Catholic 5.8 14.0 13.4 18.1% protestant 65.2 58.1 64.6 56.9Average overall test scores 26.3 26.3 27.2 26.2Average family size 3.0 3.0 3.0 3.1Average residential mobility 3.4 3.3 3.3 3.6Average church attendance 3.4 3.3 3.6 3.7Average mother’s education 5.6 5.4 5.3 5.6
D.C.% African American 90.4 92.1 90.9 92.1% welfare recipients 38.0 34.1 32.1 30.3% Catholic 15.5 12.6 16.0 13.8% protestant 72.7 69.9 65.6 70.6Average overall test scores 26.5 26.4 26.9 26.7Average family size 3.1 3.1 3.3 3.0Average residential mobility 3.4 3.5 3.5 3.4Average church attendance 3.7 3.5 3.7 3.7Average mother’s education 5.4 5.0 5.3 5.2
Notes: Averages refer to the unweighted mean scores of responses on the parent surveys. Mother’s edu-cation was scaled slightly differently in New York City than in Dayton and Washington, D.C., makingintercity comparisons on that item inappropriate.
benefits; whether the student was African American; the student’s baselinemath score; whether the student had a learning disability; and whether thestudent had experienced disciplinary problems.28
To allow for as much flexibility as possible, separate logit models were es-timated for treatment and control group members. For illustrative pur-poses, table 4A.3 reports the results in Washington, D.C. after two years.Similar results were obtained for other cities and other years.29 For the mostpart, the family and student characteristics had a similar impact on re-
134 Paul E. Peterson, William G. Howell, Patrick J. Wolf, and David E. Campbell
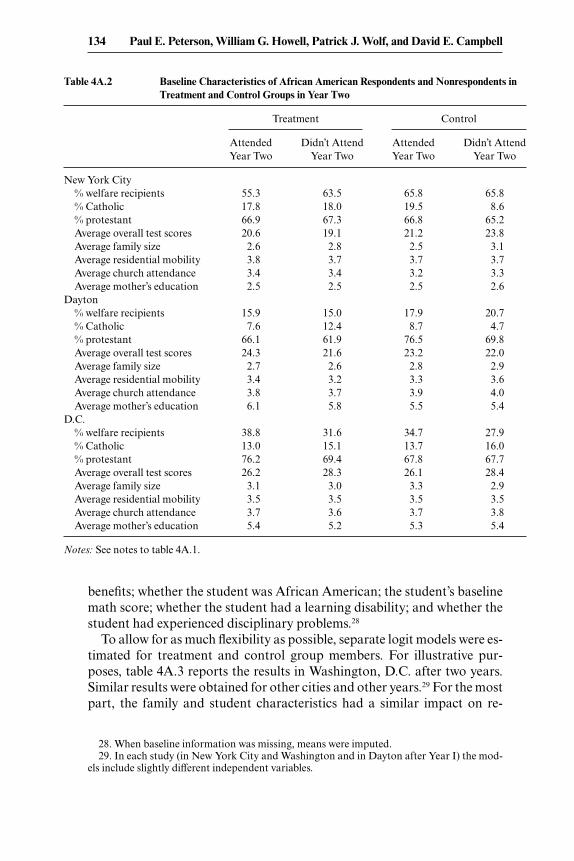
Table 4A.2 Baseline Characteristics of African American Respondents and Nonrespondents inTreatment and Control Groups in Year Two
Treatment Control
Attended Didn’t Attend Attended Didn’t AttendYear Two Year Two Year Two Year Two
New York City% welfare recipients 55.3 63.5 65.8 65.8% Catholic 17.8 18.0 19.5 8.6% protestant 66.9 67.3 66.8 65.2Average overall test scores 20.6 19.1 21.2 23.8Average family size 2.6 2.8 2.5 3.1Average residential mobility 3.8 3.7 3.7 3.7Average church attendance 3.4 3.4 3.2 3.3Average mother’s education 2.5 2.5 2.5 2.6
Dayton% welfare recipients 15.9 15.0 17.9 20.7% Catholic 7.6 12.4 8.7 4.7% protestant 66.1 61.9 76.5 69.8Average overall test scores 24.3 21.6 23.2 22.0Average family size 2.7 2.6 2.8 2.9Average residential mobility 3.4 3.2 3.3 3.6Average church attendance 3.8 3.7 3.9 4.0Average mother’s education 6.1 5.8 5.5 5.4
D.C.% welfare recipients 38.8 31.6 34.7 27.9% Catholic 13.0 15.1 13.7 16.0% protestant 76.2 69.4 67.8 67.7Average overall test scores 26.2 28.3 26.1 28.4Average family size 3.1 3.0 3.3 2.9Average residential mobility 3.5 3.5 3.5 3.5Average church attendance 3.7 3.6 3.7 3.8Average mother’s education 5.4 5.2 5.3 5.4
Notes: See notes to table 4A.1.
28. When baseline information was missing, means were imputed.29. In each study (in New York City and Washington and in Dayton after Year I) the mod-
els include slightly different independent variables.
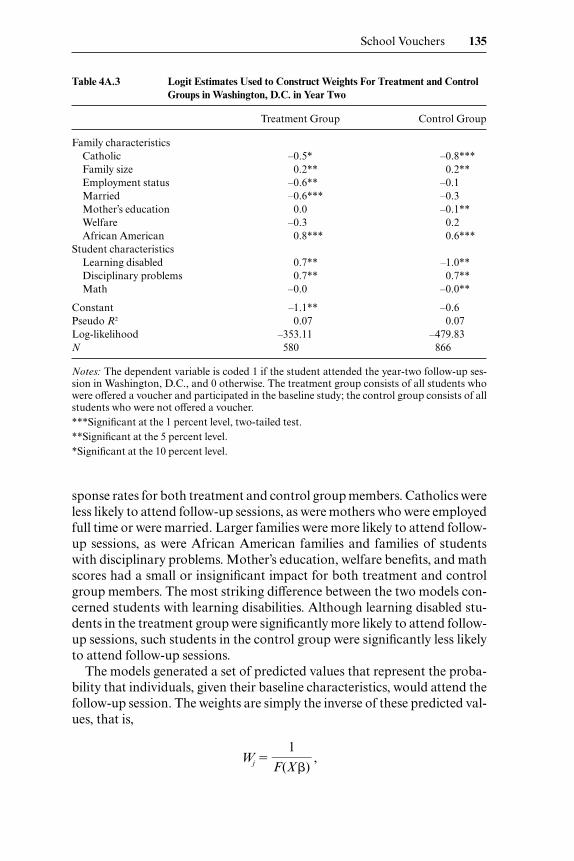
sponse rates for both treatment and control group members. Catholics wereless likely to attend follow-up sessions, as were mothers who were employedfull time or were married. Larger families were more likely to attend follow-up sessions, as were African American families and families of studentswith disciplinary problems. Mother’s education, welfare benefits, and mathscores had a small or insignificant impact for both treatment and controlgroup members. The most striking difference between the two models con-cerned students with learning disabilities. Although learning disabled stu-dents in the treatment group were significantly more likely to attend follow-up sessions, such students in the control group were significantly less likelyto attend follow-up sessions.
The models generated a set of predicted values that represent the proba-bility that individuals, given their baseline characteristics, would attend thefollow-up session. The weights are simply the inverse of these predicted val-ues, that is,
Wj � �F(X
1
�)� ,
School Vouchers 135
Table 4A.3 Logit Estimates Used to Construct Weights For Treatment and ControlGroups in Washington, D.C. in Year Two
Treatment Group Control Group
Family characteristicsCatholic –0.5* –0.8***Family size 0.2** 0.2**Employment status –0.6** –0.1Married –0.6*** –0.3Mother’s education 0.0 –0.1**Welfare –0.3 0.2African American 0.8*** 0.6***
Student characteristicsLearning disabled 0.7** –1.0**Disciplinary problems 0.7** 0.7**Math –0.0 –0.0**
Constant –1.1** –0.6Pseudo R2 0.07 0.07Log-likelihood –353.11 –479.83N 580 866
Notes: The dependent variable is coded 1 if the student attended the year-two follow-up ses-sion in Washington, D.C., and 0 otherwise. The treatment group consists of all students whowere offered a voucher and participated in the baseline study; the control group consists of allstudents who were not offered a voucher.***Significant at the 1 percent level, two-tailed test.**Significant at the 5 percent level.*Significant at the 10 percent level.
where F( ) is the model’s logistic distribution function. The range of pos-sible values for Wj was then capped so that the highest weight was four timesthe value of the lowest. (This restriction affected only a handful of obser-vations.) The weights were then rescaled so that the sum of the weightsequaled the sum of the total number of actual observations.30
To generate the weights, we could use only observable characteristics asrecorded in parent surveys. To the extent that there were unmeasured or un-observable characteristics that encouraged some families, but not others, toattend follow-up sessions, the weights may not have eliminated the bias as-sociated with nonresponse. However, in order for response bias to explainour findings, three conditions would have to hold. First, respondents wouldneed to differ from nonrespondents on an unmeasured factor that influ-enced test performance. Second, the difference would have to be larger forone group (treatment or control) than for the other. Third, the differencewould have to hold for black students but not for students of other ethnicgroups. Although we cannot rule out the possibility that all three conditionsexisted in our study, we find it unlikely enough to be reasonably confidentthat response bias did not artificially generate the results we report.
It is possible that change in academic performance over time rather thanbaseline characteristics affected the likelihood that different subgroupswithin the treatment and control groups would attend subsequent testingsessions. If treatment group families that did not benefit from vouchersdropped out of the study while control group families that were sufferingmost in public schools continued to attend follow-up sessions consistently,then observed impacts may be somewhat inflated.
Three questions deserve consideration. Did gains in test scores from base-line to year one (two) decrease the probability that members of the controlgroup would attend the year-two (-three) testing session? Did gains increasethe probability that members of the treatment group would attend the year-two (-three) testing session? And were the differences in observed impacts onresponse rates for the treatment and control groups statistically significant?
Table 4A.4 estimates a series of logistic regressions that answer these ques-tions. The dependent variable identifies whether a student attended the year-two (-three) follow-up session. The covariates include baseline math and read-ing test scores, the change in the total test score from baseline to year one (two), and the change interacted with treatment status. Separate models were runfor African Americans and members of other ethnic groups. At the bottomof each column we report the probability that we can reject the following threenull hypotheses: (a) Changes in test scores have a statistically insignificant ef-fect on attendance at subsequent testing sessions for the control group; (b) theeffect for the treatment group is statistically insignificant; and (c) the differ-ences in observed effects for the two groups are not statistically significant.
136 Paul E. Peterson, William G. Howell, Patrick J. Wolf, and David E. Campbell
30. Weights for New York City, as provided by Mathematica Policy Research.

Tab
le 4
A.4
Eff
ect o
f Cha
nge
in T
est S
core
s fr
om B
asel
ine
to Y
ear
One
and
Tw
o on
the
Lik
elih
ood
Tha
t Stu
dent
s A
tten
d S
ubse
quen
t Tes
ting
Ses
sion
s
Was
hing
ton,
D
.C.
New
Yor
k C
ity
Day
ton
Yea
r Tw
oY
ear
Thr
eeY
ear
Two
Yea
r Tw
oA
tten
danc
eA
tten
danc
eA
tten
danc
eA
tten
danc
e
Bla
cks
Lat
inos
Bla
cks
Lat
inos
Bla
cks
Bla
cks
Whi
tes
Y1-
base
line
–0.0
05–0
.001
...
0.00
2–0
.012
0.00
1Y
2-ba
selin
e..
. ..
. –0
.023
*–0
.004
...
...
...
(Y1-
B)*
trea
t0.
004
0.00
6..
. ..
. 0.
002
0.02
3*–0
.004
(Y2-
B)*
trea
t..
. ..
. 0.
031*
0.00
4..
. ..
. ..
. B
asel
ine
mat
h–0
.003
0.01
2*0.
007
0.00
2–0
.001
0.00
1–0
.003
Bas
elin
e re
adin
g0.
007
–0.0
040.
006
–0.0
08–0
.001
0.00
30.
004
N62
370
949
761
289
129
810
8L
og-l
ikel
ihoo
d–3
55.8
1–3
55.6
8–2
12.4
0–1
91.1
3–5
80.5
5–1
89.5
2–7
0.39
Pse
udo-
R2
0.00
0.01
0.02
0.00
0.00
0.01
0.00
Pfo
r H
0: B
1=
00.
630.
910.
090.
760.
790.
210.
94P
for
H0:
B1
+ B
2=
00.
900.
570.
500.
960.
500.
280.
79P
for
H0:
B2
= 0
0.77
0.46
0.07
0.78
0.79
0.07
0.79
Not
es:L
ogit
regr
essi
on m
odel
s per
form
ed o
n un
wei
ghte
d da
ta. Y
1-ba
selin
e re
fers
to th
e ch
ange
in th
e to
tal m
ath
and
read
ing
test
sco
res f
rom
bas
elin
e to
yea
r one
;Y
2-ba
selin
e re
fers
to c
hang
e fr
om b
asel
ine
to y
ear
two.
(Y1-
B)*
off
ered
vou
cher
is a
n in
tera
ctio
n te
rm b
etw
een
one
vari
able
that
is th
e di
ffer
ence
bet
wee
n ye
ar o
nean
d ba
selin
e te
st s
core
s an
d an
othe
r va
riab
le th
at in
dica
tes
whe
ther
a s
tude
nt w
as o
ffer
ed a
vou
cher
. The
dep
ende
nt v
aria
ble
is c
oded
1 if
the
stud
ent a
tten
ded
ei-
ther
the
seco
nd- o
r th
ird-
year
follo
w-u
p se
ssio
n.**
*Sig
nifi
cant
at t
he 1
per
cent
leve
l, tw
o-ta
iled
test
.**
Sign
ifica
nt a
t the
5 p
erce
nt le
vel.
*Sig
nifi
cant
at t
he 1
0 pe
rcen
t lev
el.

On the whole, the signs of the coefficients are in the expected direction.Gains in test scores from baseline to years one and two increased the prob-ability that members of the treatment group attended the subsequent test-ing session and decreased the probability for members of the control group.The only models that generated statistically significant impacts, however,were for African Americans in New York after three years and for AfricanAmericans in Dayton after two years. None of the observed impacts forHispanics were statistically significant in any year or city.
The model that predicts year-three attendance for African Americans inNew York City generated the largest effects. Holding all variables at theirmeans, the model predicted that 83 percent of the students who attendedthe year-two session would attend the year-three session. An increase of 10NPR points from baseline to year two translated into a 3 percentage pointdrop in the probability that a control group member would attend the year-three testing session and a 1 percentage point increase in the probabilitythat a member of the treatment group would attend the year-three follow-up session. Unless weighting adjusted for these differences, this responsepattern may have marginally contributed to the positive estimate of voucherimpacts on test scores.
In New York City, eighty-two African American students who had at-tended the year-two testing session failed to show up in year three. The datapresented above suggest that those individuals consisted disproportionatelyof control group members whose scores decreased from baseline to yeartwo and treatment group members whose scores increased, possibly inflat-ing the estimated impact of attending a private school. To further exploretheir influence on estimated impacts, we imputed year-three test scores forthose individuals based on their treatment status, baseline test scores, testscore changes between baseline and year two, and the year-three weights.Although the observed impacts do drop in magnitude, they remain sta-tistically significant. When we examined only those African Americanstudents who attended the year-three follow-up session, the estimated im-pact of switching from a public to a private school at year three was 5.4 NPRpoints, with 515 observations and a t-statistic of 3.7. When we looked at thesame population but then imputed year-three test scores for those studentswho showed up in year two but not in year three, the size of the estimatedimpact of attending a private school dropped to 8.0 NPR points, with at-statistic of 3.0.31
Another way of estimating the effects of response rates on outcomes is todistinguish between earlier and later respondents. Not all participants came
138 Paul E. Peterson, William G. Howell, Patrick J. Wolf, and David E. Campbell
31. King et al. (2001). The point estimates reported come from weighted regressions: Im-puted weights for missing observations in year three were constrained to have positive values.Impacts generated from unweighted regressions using imputed values and observables also arecomparable.
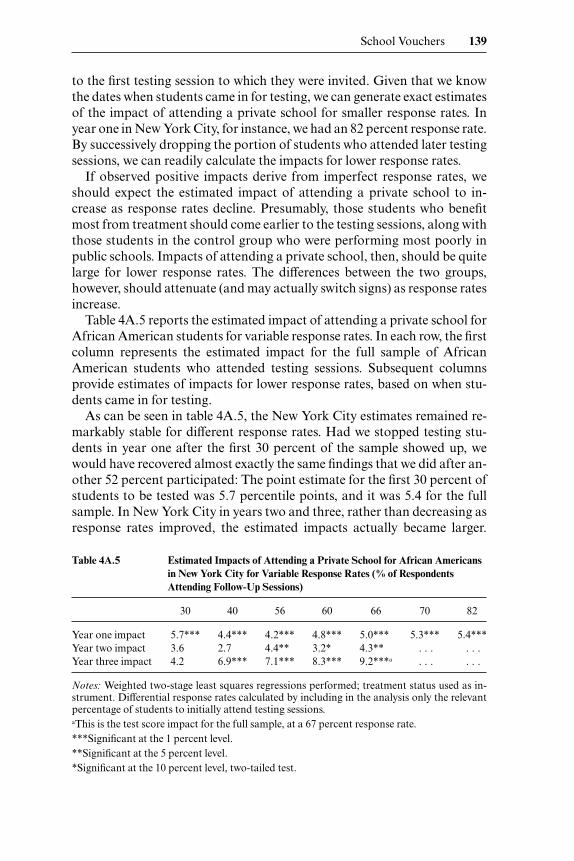
to the first testing session to which they were invited. Given that we knowthe dates when students came in for testing, we can generate exact estimatesof the impact of attending a private school for smaller response rates. Inyear one in New York City, for instance, we had an 82 percent response rate.By successively dropping the portion of students who attended later testingsessions, we can readily calculate the impacts for lower response rates.
If observed positive impacts derive from imperfect response rates, weshould expect the estimated impact of attending a private school to in-crease as response rates decline. Presumably, those students who benefitmost from treatment should come earlier to the testing sessions, along withthose students in the control group who were performing most poorly inpublic schools. Impacts of attending a private school, then, should be quitelarge for lower response rates. The differences between the two groups,however, should attenuate (and may actually switch signs) as response ratesincrease.
Table 4A.5 reports the estimated impact of attending a private school forAfrican American students for variable response rates. In each row, the firstcolumn represents the estimated impact for the full sample of AfricanAmerican students who attended testing sessions. Subsequent columnsprovide estimates of impacts for lower response rates, based on when stu-dents came in for testing.
As can be seen in table 4A.5, the New York City estimates remained re-markably stable for different response rates. Had we stopped testing stu-dents in year one after the first 30 percent of the sample showed up, wewould have recovered almost exactly the same findings that we did after an-other 52 percent participated: The point estimate for the first 30 percent ofstudents to be tested was 5.7 percentile points, and it was 5.4 for the fullsample. In New York City in years two and three, rather than decreasing asresponse rates improved, the estimated impacts actually became larger.
School Vouchers 139
Table 4A.5 Estimated Impacts of Attending a Private School for African Americansin New York City for Variable Response Rates (% of RespondentsAttending Follow-Up Sessions)
30 40 56 60 66 70 82
Year one impact 5.7*** 4.4*** 4.2*** 4.8*** 5.0*** 5.3*** 5.4***Year two impact 3.6 2.7 4.4** 3.2* 4.3** . . . . . . Year three impact 4.2 6.9*** 7.1*** 8.3*** 9.2***a . . . . . .
Notes: Weighted two-stage least squares regressions performed; treatment status used as in-strument. Differential response rates calculated by including in the analysis only the relevantpercentage of students to initially attend testing sessions.aThis is the test score impact for the full sample, at a 67 percent response rate.***Significant at the 1 percent level.**Significant at the 5 percent level.*Significant at the 10 percent level, two-tailed test.
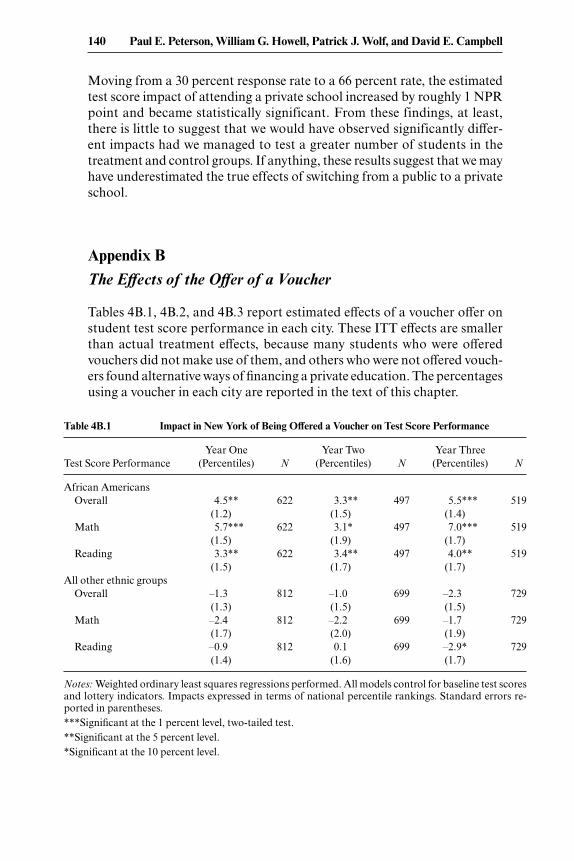
Moving from a 30 percent response rate to a 66 percent rate, the estimatedtest score impact of attending a private school increased by roughly 1 NPRpoint and became statistically significant. From these findings, at least,there is little to suggest that we would have observed significantly differ-ent impacts had we managed to test a greater number of students in thetreatment and control groups. If anything, these results suggest that we mayhave underestimated the true effects of switching from a public to a privateschool.
Appendix B
The Effects of the Offer of a Voucher
Tables 4B.1, 4B.2, and 4B.3 report estimated effects of a voucher offer onstudent test score performance in each city. These ITT effects are smallerthan actual treatment effects, because many students who were offeredvouchers did not make use of them, and others who were not offered vouch-ers found alternative ways of financing a private education. The percentagesusing a voucher in each city are reported in the text of this chapter.
140 Paul E. Peterson, William G. Howell, Patrick J. Wolf, and David E. Campbell
Table 4B.1 Impact in New York of Being Offered a Voucher on Test Score Performance
Year One Year Two Year ThreeTest Score Performance (Percentiles) N (Percentiles) N (Percentiles) N
African AmericansOverall 4.5** 622 3.3** 497 5.5*** 519
(1.2) (1.5) (1.4)Math 5.7*** 622 3.1* 497 7.0*** 519
(1.5) (1.9) (1.7)Reading 3.3** 622 3.4** 497 4.0** 519
(1.5) (1.7) (1.7)All other ethnic groups
Overall –1.3 812 –1.0 699 –2.3 729(1.3) (1.5) (1.5)
Math –2.4 812 –2.2 699 –1.7 729(1.7) (2.0) (1.9)
Reading –0.9 812 0.1 699 –2.9* 729(1.4) (1.6) (1.7)
Notes: Weighted ordinary least squares regressions performed. All models control for baseline test scoresand lottery indicators. Impacts expressed in terms of national percentile rankings. Standard errors re-ported in parentheses.***Significant at the 1 percent level, two-tailed test.**Significant at the 5 percent level.*Significant at the 10 percent level.
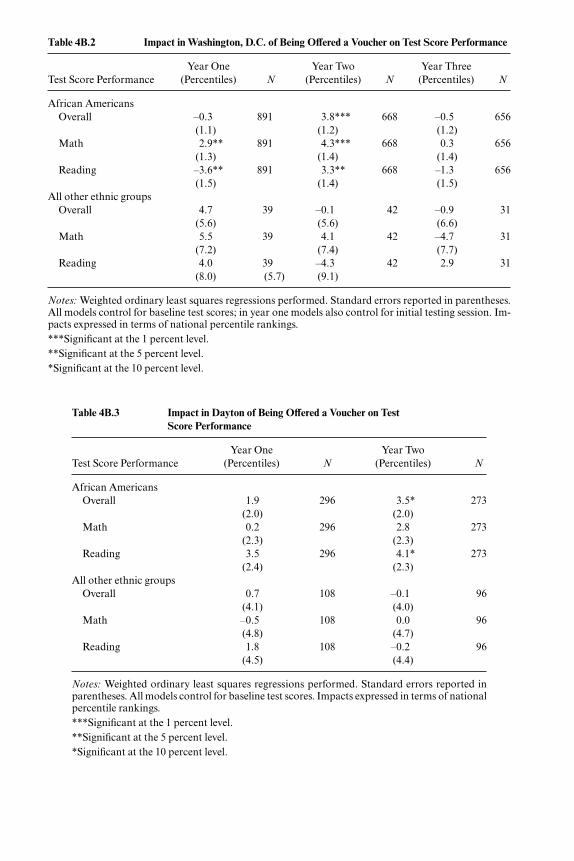
Table 4B.2 Impact in Washington, D.C. of Being Offered a Voucher on Test Score Performance
Year One Year Two Year ThreeTest Score Performance (Percentiles) N (Percentiles) N (Percentiles) N
African AmericansOverall –0.3 891 3.8*** 668 –0.5 656
(1.1) (1.2) (1.2)Math 2.9** 891 4.3*** 668 0.3 656
(1.3) (1.4) (1.4)Reading –3.6** 891 3.3** 668 –1.3 656
(1.5) (1.4) (1.5)All other ethnic groups
Overall 4.7 39 –0.1 42 –0.9 31(5.6) (5.6) (6.6)
Math 5.5 39 4.1 42 –4.7 31(7.2) (7.4) (7.7)
Reading 4.0 39 –4.3 42 2.9 31(8.0) (5.7) (9.1)
Notes: Weighted ordinary least squares regressions performed. Standard errors reported in parentheses.All models control for baseline test scores; in year one models also control for initial testing session. Im-pacts expressed in terms of national percentile rankings.***Significant at the 1 percent level.**Significant at the 5 percent level.*Significant at the 10 percent level.
Table 4B.3 Impact in Dayton of Being Offered a Voucher on Test Score Performance
Year One Year TwoTest Score Performance (Percentiles) N (Percentiles) N
African AmericansOverall 1.9 296 3.5* 273
(2.0) (2.0)Math 0.2 296 2.8 273
(2.3) (2.3)Reading 3.5 296 4.1* 273
(2.4) (2.3)All other ethnic groups
Overall 0.7 108 –0.1 96(4.1) (4.0)
Math –0.5 108 0.0 96(4.8) (4.7)
Reading 1.8 108 –0.2 96(4.5) (4.4)
Notes: Weighted ordinary least squares regressions performed. Standard errors reported inparentheses. All models control for baseline test scores. Impacts expressed in terms of nationalpercentile rankings.***Significant at the 1 percent level.**Significant at the 5 percent level.*Significant at the 10 percent level.
References
Angrist, Joshua D., Guido W. Imbens, and Donald B. Rubin. 1996. Identification ofcausal effects using instrumental variables. Journal of the American Statistical As-sociation 91:444–62.
Bridge, R. J., and J. Blackman. 1978. Family choice in education. Vol. 4 of A study ofalternatives in American education. Santa Monica, Calif.: RAND Corporation.
Chaplin, Duncan D. 1998. Raising standards: The effects of high school math andscience courses on future earnings. Virginia Journal of Social Policy and Law 6 (1):111–26.
Chubb, John E., and Terry M. Moe. 1990. Politics, markets, and America’s schools.Washington, D.C.: Brookings Institution.
Coerper, Lois H., and Shirley W. Mersereau. 1998. Independent school guide forWashington, D.C. and surrounding area. 11th ed. Chevy Chase, Md.: IndependentSchool Guides.
Coleman, James S., Thomas Hoffer, and Sally Kilgore. 1982. High school achieve-ment. New York: Basic Books.
Coulson, Andrew J. 1999. Market education: The unknown history. New Brunswick,N.J.: Social Philosophy and Policy Center and Transaction Publishers.
Elmore, Richard. 1990. Choice as an instrument of public policy: Evidence from ed-ucation and health care. In Choice and control in American education, Vol. 1: Thetheory of choice and control in American education, ed. W. Clune and J. Witte, 285–318. New York: Falmer.
Evans, William N., and Robert M. Schwab. 1993. Who benefits from private educa-tion? Evidence from quantile regressions. University of Maryland, Departmentof Economics. Working Paper.
Figlio, David, and Joe Stone. 1999. Are private schools really better? In Research inlabor economics, vol. 16, ed. Soloman W. Polachek and John Robst, 115–40. Stam-ford, Conn.: JAI Press.
Flanagan, Ann, Jennifer Kawata, and Stephanie Williamson. 2000. Improving stu-dent achievement: What NAEP test scores tell us. Santa Monica, Calif.: RANDCorporation.
Goldberger, Arthur S., and Glen G. Cain. 1982. The causal analysis of cognitive out-comes in the Coleman, Hoffer, and Kilgore report. Sociology of Education 55(April-July): 103–22.
Greene, Jay P., William G. Howell, and Paul E. Peterson. 1998. Lessons from theCleveland scholarship program. In Learning from school choice, ed. Paul E. Pe-terson and Bryan C. Hassel, 357–92, Washington, D.C.: Brookings Institution.
Greene, Jay P., Paul E. Peterson, and Jiangtao Du. 1998. School choice in Milwau-kee: A randomized experiment. In Learning from school choice, ed. Paul E. Peter-son and Bryan C. Hassel, 335–56. Washington, D.C.: Brookings Institution.
Hill, Jennifer, Donald B. Rubin, and Neal Thomas. 1998. The design of the NewYork school choice scholarship program evaluation. Paper presented at theAmerican Political Science Association annual meeting. 31 August, Boston,Massachusetts.
Hoffer, Thomas, Andrew Greeley, and James Coleman. 1985. Achievement growthin public and Catholic schools. Sociology of Education 58 (April): 74–97.
Howell, William G., and Paul E. Peterson. 2000. School choice in Dayton, Ohio: Anevaluation after one year. Harvard University, Program on Education Policy andGovernance. Occasional paper, February.
Howell, William G., Paul E. Peterson, Patrick J. Wolf, and David Campbell. 2002.
142 Paul E. Peterson, William G. Howell, Patrick J. Wolf, and David E. Campbell
The education gap: Vouchers and urban schools. Washington, D.C.: Brookings In-stitution.
Jencks, Christopher, and Meridith Phillips, ed. 1999. The black-white test score gap.Washington, D.C.: Brookings Institution.
King, Gary, James Honaker, Anne Joseph, and Kenneth Scheve. 2001. Analyzingincomplete political science data: An alternative algorithm for multiple imputa-tion. American Political Science Review 95 (1): 46–69.
Krueger, Alan. 1999. Experimental estimates of education production functions.Quarterly Journal of Economics 114:497–533.
Krueger, Alan, and Diane Whitmore. 2000. Would smaller classes help close theblack-white achievement gap? Paper presented at conference entitled Closing theGap: Promising Strategies for Reducing the Achievement Gap. February, Wash-ington, D.C.
Metcalfe, Kim K., William J. Boone, Frances K. Stage, Todd L. Chilton, PattyMuller, and Polly Tait. 1998. A comparative evaluation of the Cleveland scholar-ship and tutoring grant program: Year one: 1996–97. Bloomington, Ind.: IndianaUniversity School of Education, Smith Research Center.
Murname, Richard, John B. Willet, Yves Duhaldeborde, and John H. Tyler. 2000.How important are the cognitive skills of teenagers in predicting subsequentearnings? Journal of Policy Analysis and Management 19 (4): 547–68.
Myers, David, Paul E. Peterson, Daniel Mayer, Julia Chou, and William P. Howell.2000. School choice in New York City after two years: An evaluation of the schoolchoice scholarships program. Harvard University, Program on Education Policyand Governance. Occasional paper, September.
Neal, Derek. 1997. The effects of Catholic secondary schooling on educationalachievement. Journal of Labor Economics 15 (1): 98–123.
Peterson, Paul E. 1998. School choice: A report card. In Learning from school choice,ed. Paul E. Peterson and Bryan C. Hassel, 3–32. Washington, D.C.: Brookings In-stitution.
Peterson, Paul E., Jay P. Greene, William G. Howell, and William McCready. 1998.Initial findings from an evaluation of school choice programs in Dayton, Ohioand Washington, D.C. Harvard University, Program on Education Policy andGovernance. Occasional paper, October.
Peterson, Paul E., and Bryan C. Hassel, ed. 1998. Learning from school choice. Wash-ington, D.C.: Brookings Institution.
Peterson, Paul E., David E. Myers, Josh Haimson, and William G. Howell. 1997.Initial findings from the evaluation of the New York school choice scholarshipsprogram. Harvard University, Program on Education Policy and Governance.Occasional paper, November.
Peterson, Paul E., David E. Myers, and William G. Howell. 1998. An evaluation ofthe New York City school choice scholarships program: The first year. HarvardUniversity, Program on Education Policy and Governance. Occasional Paper,October.
Peterson, Paul E., David E. Myers, William G. Howell, and Daniel P. Mayer. 1999.The effects of school choice in New York City. Chap. 12 in Earning and learning:How schools matter, ed. Susan B. Mayer and Paul E. Peterson. Washington, D.C.:Brookings Institution.
Rouse, Cecilia. 1997. Private school vouchers and student achievement: An evalua-tion of the Milwaukee parental choice program. Princeton University, Depart-ment of Economics. Working Paper.
Schneider, Mark, Paul Teske, Melissa Marschall, and Christine Roch. 1998.Tiebout, school choice, allocative and productive efficiency. Paper presented at
School Vouchers 143
the annual meeting of the American Political Science Association. 3–6 Septem-ber, Boston, Mass.
U.S. Department of Education, Office of Educational Research and Improvement,National Center for Education Statistics. 2000. Common core of data, school years1993–94 through 1997–98. Washington, D.C.: U.S. Department of Education.
West, Martin R., Paul E. Peterson, and David E. Campbell. 2001. School choice inDayton, Ohio after two years. Harvard University, Program on Education Policyand Governance. Occasional paper, August.
Wilms, Douglas J. 1985. Catholic school effects on academic achievement: New ev-idence from high school and beyond follow-up study. Sociology of Education 58:98–114.
Witte, John F. 1996. School choice and student performance. In Holding schools ac-countable: Performance-based reform in education, ed. Helen F. Ladd, 149–76.Washington, D.C.: Brookings Institution.
———. 1997. Achievement effects of the Milwaukee voucher program. Paper pre-sented at the annual meeting of the American Economics Association. January,New Orleans, La.
Wolf, Patrick J., William G. Howell, and Paul E. Peterson. 2000. School choice inWashington, D.C.: An evaluation after one year. Harvard University, Program onEducation Policy and Governance. Occasional paper, February.
Wolf, Patrick J., Paul E. Peterson, and Martin R. West. 2001. Results of a schoolvoucher experiment: The case of Washington, D.C. after two years. Harvard Uni-versity, Program on Education Policy and Governance. Occasional paper, Au-gust.
144 Paul E. Peterson, William G. Howell, Patrick J. Wolf, and David E. Campbell