Embed Size (px)
Citation preview
NBER WORKING PAPER SERIES
SCHOOL RESOURCES AND EDUCATIONAL OUTCOMES IN DEVELOPING COUNTRIES:A REVIEW OF THE LITERATURE FROM 1990 TO 2010
Paul W. GlewweEric A. HanushekSarah D. Humpage
Renato Ravina
Working Paper 17554http://www.nber.org/papers/w17554
NATIONAL BUREAU OF ECONOMIC RESEARCH1050 Massachusetts Avenue
Cambridge, MA 02138October 2011
This paper benefited from comments by participants at the conference on "Education Policy in DevelopingCountries: What Do We Know, and What Should We Do to Understand What We Don’t Know?"University of Minnesota, February 2011. The views expressed herein are those of the authors and donot necessarily reflect the views of the National Bureau of Economic Research.
NBER working papers are circulated for discussion and comment purposes. They have not been peer-reviewed or been subject to the review by the NBER Board of Directors that accompanies officialNBER publications.
© 2011 by Paul W. Glewwe, Eric A. Hanushek, Sarah D. Humpage, and Renato Ravina. All rightsreserved. Short sections of text, not to exceed two paragraphs, may be quoted without explicit permissionprovided that full credit, including © notice, is given to the source.
School Resources and Educational Outcomes in Developing Countries: A Review of the Literaturefrom 1990 to 2010Paul W. Glewwe, Eric A. Hanushek, Sarah D. Humpage, and Renato RavinaNBER Working Paper No. 17554October 2011JEL No. H4,I25,J24,O15
ABSTRACT
Developing countries spend hundreds of billions of dollars each year on schools, educational materialsand teachers, but relatively little is known about how effective these expenditures are at increasingstudents’ years of completed schooling and, more importantly, the skills that they learn while in school.This paper examines studies published between 1990 and 2010, in both the education literature andthe economics literature, to investigate which specific school and teacher characteristics, if any, appearto have strong positive impacts on learning and time in school. Starting with over 9,000 studies, 79are selected as being of sufficient quality. Then an even higher bar is set in terms of econometric methodsused, leaving 43 “high quality” studies. Finally, results are also shown separately for 13 randomizedtrials. The estimated impacts on time in school and learning of most school and teacher characteristicsare statistically insignificant, especially when the evidence is limited to the “high quality” studies.The few variables that do have significant effects – e.g. availability of desks, teacher knowledge ofthe subjects they teach, and teacher absence – are not particularly surprising and thus provide littleguidance for future policies and programs.
Paul W. GlewweDept of Applied Economics, U of MN1994 Buford Ave.St. Paul MN [email protected]
Eric A. HanushekHoover InstitutionStanford UniversityStanford, CA 94305-6010and [email protected]
Sarah D. HumpageUniversity of MinnesotaSt. Paul MN [email protected]
Renato RavinaUniversity of MinnesotaSt. Paul MN [email protected]
1
I. Introduction and Motivation
Economists and other researchers have accumulated a large amount of evidence that
education increases workers’ productivity and thus increases their incomes.1 There are also
many non-monetary benefits of education, such as improved health status and lowered crime
Lochner (2011)). Finally, at the country level there is also a large amount of evidence that
education increases the rate of economic growth (Hanushek and Woessmann (2008)). These
analyses all highlight the value of improving a country’s human capital and provide the
motivation for developing countries to invest in the skills of their populations. They do not,
however, indicate which types of specific investments should be pursued.
Policymakers in developing countries have quite generally accepted the message of these
benefits from improved human capital and have greatly increased their funding of education. As
seen in Table 1, since 1980 real government expenditures on education doubled in Latin America
and Sub-Saharan Africa, almost tripled in the Middle East, and increased by more than five-fold
in East Asia and by almost eight-fold in South Asia. International development agencies have
also called for greater resources to be devoted to education, and have increased their levels of
assistance for education projects in recent years, as shown in Table 2.
The most consistent focus of investment has been on increasing primary and secondary
school enrollment rates, with the ultimate goal of higher levels of educational attainment. The
increases in enrollment over the past three decades, particularly at the primary level, have been
quite dramatic. From 1980 to 2008 primary and secondary enrollment rates have increased in all
1 The majority of this work, following the seminal studies of Jacob Mincer (1970, (1974), has focused on how school attainment relates to individual earnings, and there are now estimates of the return to schooling for a majority of countries in the world (Psacharopoulos and Patrinos (2004)). More recent work has added measures of achievement to this (e.g., Mulligan (1999), Murnane, Willett, Duhaldeborde, and Tyler (2000), and Lazear (2003)), although little of this relates to developing countries (see, however, Hanushek and Zhang (2009)).
2
regions of the developing world (Table 3), so that by 2008 gross primary enrollment rates were
at or above 100 percent in all regions, and gross secondary enrollment rates were above 50
percent in all regions except Sub-Saharan Africa.2 Similarly, Table 4 shows that primary school
completion rates increased in all regions from 1991 to 2008, and were close to 100 percent in all
regions except for South Asia and Sub-Saharan Africa.
Much of the increased funding for education, particularly in the earlier periods, took the
form of building and staffing schools in areas where no school previously existed, reflecting the
simple fact that it is hard to go to school if no school exists. Moreover, there is ample evidence
that enrollment increases when the distance to the nearest school decreases. When increased
spending on existing schools makes them more attractive, either by reducing school fees and
other direct costs of schooling or by improving the quality of the educational opportunities they
provide, enrollment would be expected to increase further.3
More recently, however, attention has begun to swing toward the quality of schools and
the achievement of students – and here the evidence on outcomes is decidedly more mixed.
Over the past decade, it has become possible to follow changes in student performance on tests
offered by the Programme for International Student Assessment (PISA). While student learning
appears to be increasing in several countries, this tendency is not universal. More specifically,
Table 5 presents evidence on learning among 15 year old students in 12 countries (of which 7 are
in Latin America). Examining trends from 2000 to 2009, five countries show clear upward
trends (Chile, Colombia, Peru, Tunisia and Turkey), while the rest show either mixed or even
decreasing trends. At the aggregate level, it may simply be that expanded enrollment brings in
2 Gross enrollment rates compare numbers of school children to the size of a specific age cohort so that grade repetition, late enrollment, and the like can lead to gross enrollment rates over 100 percent. 3 Hanushek, Lavy, and Hitomi (2008) find that school dropout decisions are very responsive to the quality of the school (in terms of value-added to achievement).
3
progressively less able and less qualified students, who then pull down the average score. Yet
some countries with mixed or declining trends did not show large increases in school enrollment,
and were increasing real expenditures per student on education. For example, in Argentina the
gross secondary school enrollment rate has been about 85 percent from 1998 to 2007, and
spending per pupil was somewhat higher in 2004-06 than in 1998-2000; yet test scores in 2007
were lower than in 2000. Similarly, Brazil’s progress has been uneven at best, yet it experienced
only a moderate increase in secondary school enrollment (7-13 percentage points) from 2000 to
2007, and real spending on education steadily increased over time.4
The concern about quality becomes more significant in analyses of the impact on student
learning (achievement) of demand side programs that stimulate increased enrollment. A recent
survey of high quality analyses of currently popular demand side programs – fee reductions,
conditional cash transfers, and school nutrition programs – the higher enrollment induced by
these programs was not accompanied by increased achievement (Hanushek (2008)).5 It is natural
to think that bringing students into school must certainly increase their learning and achievement,
but this impact may be limited to new students who were not previously in school with no effect
(or even a negative effect) on current students.
This discussion is related to a substantial body of literature, particularly for developed
countries, that suggests that money alone is not the answer to increase student learning.
Specifically, for developed countries there is substantial research indicating that overall
expenditures, and common school initiatives funded by those expenditures such as lower class
4 See the World Bank’s World Development Indicators. Note that Brazil’s gross (net) secondary school enrollment rate increased from 99 (66) in 1999 to 106 (79) in 2005, Educational expenditures (in terms of real U.S. $ per secondary student) increased from, on average, about 1340 (350) from 1998 to 2000 to about 1510 (500) from 2004 to 2006 in Argentina (Brazil). 5 The only demand side program that increased achievement was a Kenyan scholarship program that directly related incentives to achievement (Kremer, Miguel, and Thornton (2009)).
4
sizes or more educated teachers, are not closely related to student outcomes.6 Similar findings,
although not as strong, come from the research on schools in developing countries (Fuller and
Clarke (1994), Harbison and Hanushek (1992), Hanushek (1995)).
In response to findings that increased educational spending has had little effect on student
performance, many policymakers and researchers in both developed and developing countries
have advocated changing the way that schools are run – such as changing the incentives faced by
teachers (and by students) and, more generally, changing the way that schools are organized.
Yet it is still possible that spending that changes basic school and teacher characteristics,
if properly directed, could play a role in improving students’ educational outcomes in developing
countries. Thus it is useful to review the more recent literature on school spending and
resources, extending the prior reviews that covered studies through the early 1990s. Indeed,
significant numbers of new studies have appeared since 1990.
More importantly, many of the newer studies employ much stronger research designs
than were previously used. The appreciation of researchers for the difficulty of obtaining clear
estimates of causal impacts has grown considerably over the past two decades. The sensitivity to
these issues, along with more care about the underlying methodological approach, suggests that
the new studies may in fact yield conclusions different from those drawn on the older research.
This paper examines both the economics literature and the education literature published
in the last two decades to assess the extent to which school and teacher characteristics have a
causal impact on student learning and enrollment. More specifically, this paper reviews the
literature that attempts to estimate the impact of school infrastructure and pedagogical materials
6 These conclusions have been controversial, and much has been written about the interpretation of the evidence. For a review of the inconsistencies of effects, see Hanushek (2003). For the range of opinions, see, for example, Burtless (1996), Mishel and Rothstein (2002), and Ehrenberg, Brewer, Gamoran, and Willms (2001).
5
(such as electricity, condition of the building, desks, blackboards and textbooks), teacher
characteristics (education, training, experience, sex, subject knowledge, and ethnicity), and
school organization (pupil-teacher ratio, teaching methods, decentralized management, and
teacher contracts and working conditions) on student enrollment and learning.
The remainder of this paper is organized as follows. The next section describes a simple
interpretive framework. This is followed by a description of the parameters of this review and of
how studies were selected for inclusion. Finally, we present the results of our review and draw
conclusions about priorities for future research.
II. Interpreting the Research on Basic Education Inputs
The overarching conceptual framework employed here considers schools as “factories”
that produce “learning” using various school and teacher characteristics as “inputs”. This is the
production function approach introduced early in microeconomics courses. However, the actual
application and interpretation in education differs from the simple textbook treatment.
The reasoning underlying this conceptual framework is that the process by which
cognitive skills are learned is determined by many different factors, and production functions are
expressions, in simple terms, of this process. The relationship can be very flexible, allowing for
almost any learning process. In this sense, an education production function always exists,
although its existence does not guarantee that one can estimate it.
In the ideal case, if one can estimate this relationship, one can use information on the
costs of school characteristics, classroom materials, and even teacher characteristics to select the
combination of these that is most effective in increasing enrollment and/or student performance
6
(e.g. increase in test scores per dollar spent) given a limited budget. In theory, this could also
apply to pedagogical practices, which have implementation costs.
A. Relationships of Interest. It is useful to step back to consider what relationships are
of interest and how those relationships interact with households’ behavior. The theory of the
firm, where analyses of production functions are generally introduced, takes the perspective of a
decision maker who optimally chooses the combination of inputs for his or her firm. But this
perspective ignores a key reality of education: students and parents -- both important inputs into
achievement – also make their own decisions in response to the school decision maker’s choices.
To begin, assume that the parents of the child maximize, subject to constraints, a (life-
cycle) utility function. The main arguments in the utility function are consumption of goods and
services (including leisure) at different points in time, and each child’s years of schooling and
learning. The constraints faced are the production function for learning, the impacts of years of
schooling and of skills obtained on the future labor incomes of children, a life-cycle budget
constraint, and perhaps some credit constraints or an agricultural production function (for which
child labor is one possible input). Following Glewwe and Kremer (2006), the production function
for learning (a structural relationship) can be depicted as:
A = a(S, Q, C, H, I) (1)
where A is skills learned (achievement), S is years of schooling, Q is a vector of school and teacher
characteristics (inputs that raise school quality), C is a vector of child characteristics (including
“innate ability”), H is a vector of household characteristics, and I is a vector of school inputs under
the control of parents, such as children’s daily attendance and purchases of textbooks and other
7
school supplies. Although children acquire many different skills in school, little is lost by treating
A as a single variable.
Assume that all elements in the vectors C and H (which include parental tastes for
schooling, parental education, and children’s “ability”) are exogenous. Some child characteristics
that affect education outcomes (such as child health) may be endogenous; they can be treated as
elements of I, all of which are endogenous.
In the simplest scenario, only one school is available and parents can do nothing to change
that school’s characteristics. Thus all variables in Q are exogenous to the household. Parents
choose S and I (subject to the above-mentioned constraints) to maximize household utility, which
implies that years of schooling S and schooling inputs I can be expressed as general functions of
the four vectors of exogenous variables:
S = f(Q, C, H, P) (2)
I = g(Q, C, H, P) (3)
where prices related to schooling (such as tuition, other fees, and prices of textbooks and
uniforms), which are also exogenous, are denoted by the vector P.
Inserting (2) and (3) into (1) gives the reduced form equation for (A):
A = h(Q, C, H, P) (4)
This reduced form equation is a causal relationship, but it is not a textbook production function
because it reflects household preferences and includes prices among its arguments.
8
The more realistic assumption that households can choose from more than one school
implies that Q and P are endogenous even if they are fixed for any given school. In this scenario,
households maximize utility with respect to each schooling choice, and then choose the school
that leads to the highest utility. Conditional on choosing that school, they choose S and I, as in
the case where there is only one school from which to choose.
Policymakers are primarily concerned with the impact of school and teacher characteristics
(Q) and prices related to schooling (P) on years of schooling (S) and eventual academic
achievement (A). For example, reducing class size can be seen as a change in one element of Q,
and changing tuition fees can be seen as altering one component of P. Equations (2) and (4)
show how changes in the P variables would affect S and A. In addition, equation (2) also shows
how changes in school and teacher quality (Q) affect students’ years of schooling (S).
Turning to the impact of school quality variables (Q) on student learning, there are two
distinct relationships. To see this, consider a change in one element of Q, call it Qi. Equation (1)
shows how changes in Qi affect A when all other explanatory variable are held constant, and thus
provides the partial derivative of A with respect to Qi. In contrast, equation (4) provides the
total derivative of A with respect to Qi because it allows for changes in S and I in response to the
change in Qi.7 Parents may respond to higher school quality by increasing their provision of
educational inputs such as textbooks. Alternatively, if they consider higher school quality a
substitute for those inputs, they may decrease those inputs.
The fact that parental actions may reduce or reinforce school decisions may help to
explain a portion of the prior inconsistencies in estimating the impact of school resources.
Indeed, different studies could obtain different estimates of the impacts of the Q variables on
7 For an early development of this idea, see Kim (2001).
9
student learning because some studies estimate the production function, that is equation (1),
while others estimate the reduced form relationship in equation (4), and it is quite possible that
impacts of the Q variables will be different in these two equations.
When examining the impact of school quality (Q) on academic skills (A), are the impacts
in equation (1) or equation (4) most useful for policy purposes? Equation (4) is useful because it
shows what will actually happen to A after a change in one or more element in Q. In contrast,
equation (1) will not show this because it does not account for changes in S and I in response to
changes in Q and P. Yet the impact in equation (1) is also of interest because it may better
capture overall welfare effects. Intuitively, if parents respond to an increase in Qi by, for
example, reducing purchases of inputs I, they will be able to raise household welfare by
purchasing more of some other good or service that raises utility. The impact of Q on A in
equation (4) (i.e. the total derivative) reflects the drop in A due to the reduction in I, but it does
not account for the increase in household welfare from the increased purchase of other goods or
services. In contrast, the structural impact measured in equation (1) ignores both effects. Since
these two effects have opposing impacts on household welfare, they tend to cancel each other
out, so the overall welfare effect is reasonably approximated by the change in A measured in
equation (1). This is explained more formally in Glewwe, Kremer, Moulin, and Zitzewitz
(2004).
B. Estimation Problems and Potential Solutions. Many published studies in both the
economics literature and the education literature attempt to estimate the impact of school and
teacher characteristics on enrollment and learning, but these attempts face a number of serious
estimation challenges.
10
Consider estimation of a simple linear specification of the production function in
equation (1):
A = β0 + β1S + βQ1Q1 + βQ2Q2 + … + βC1C1 + βC2C2 + … (1′)
+ βH1H1 + βH2H2 + … + βI1I1 + βI2I2 + … + uA
where each variable in Q, C, H and I is shown explicitly.8 An “error term”, uA, is added, for
several reasons. First, data never exist for all variables in Q, C, H, and I, so uA accounts for all
unobserved variables. Second, uA indicates that (1′) is only a linear approximation of (1). Third,
observed test scores (A) may measure actual skills with error, so uA includes measurement errors
in the “true” A. Finally, the explanatory variables in (1′) may also have measurement errors,
which are also included in uA.
The causal impacts of the observed variables in (1′) on learning, the β coefficients, can be
consistently estimated by ordinary least squares (OLS) only if uA is uncorrelated with ALL the
observed “explanatory” variables. Unfortunately, under a range of circumstances, uA is likely to
be correlated with those variables.
The potential pitfalls of statistical analysis aimed at uncovering the causal impact of
various factors on achievement are now fairly well understood. They are the subject of graduate
courses in evaluation methods as well as critiques of existing research. For detailed discussions,
see Glewwe (2002) and Glewwe and Kremer (2006); the rest of this section summarizes both the
problems and the potential solutions.
8 A common first assumption made in much of the existing literature is that equation (1) can be approximated by a linear function; this assumption is not particularly restrictive. The estimation generally relies on the model being linear in the parameters, and a variety of specifications that are nonlinear in the variables can be accommodated by this specification, say by adding adding squared or interaction terms to the variables in (1).
11
The most common generic concerns are omitted variable bias, sample selection,
endogenous program placement, and measurement errors. Turning to the first concern, if major
inputs to achievement are omitted from the estimation of equation (1), they will end up in uA. If
these omitted factors are correlated with the included variables, bias is introduced, with the bias
being proportional to the importance of the omitted factors (their coefficient in equation (1)) and
their correlation with the included factors. Similarly, school and teacher factors often affect
which children attend school and how their parents make decisions about their schooling (see,
for example, Hanushek, Lavy, and Hitomi (2008)). School quality could also be correlated with
uA if governments improve schools that have unobserved education problems (Pitt, Rosenzweig,
and Gibbons (1993)). Governments may also raise school quality in areas with good education
outcomes, if those areas have political influence (World_Bank (2001). The former causes
underestimation of school quality variables’ impacts on learning, while the latter causes
overestimation.9 Finally, measurement error – a ubiquitous problem that can be particularly severe
in developing countries – can bias estimates, often pushing estimates toward zero and making
factors look insignificant.
Considerable effort has now gone into how to deal with these problems. Besides better
measurement to correct errors in variables, the essential thrust has been to develop estimation
methods that ensure that uA is uncorrelated with the variables of interest. Most significant in recent
decades has been the design of experiments that work to ensure this, i.e., the use of randomized
control trials (RCTs); see, for example, Kremer (2003). But other methods such as regression
discontinuity (RD) designs and panel data methods have also been pursued to achieve the same
9 This type of problem has also been prominent in many discussions of the estimation of teacher effects in the U.S. literature. If school principals assign teachers to classrooms based on unobserved characteristics of the teachers, the ability to estimate the impact of teachers may be affected; see Rothstein (2010) and Rivkin (2008).
12
goal. While these are the subject of considerable current research, there are also good reviews and
discussions of them elsewhere (e.g., Imbens and Wooldridge (2009), and Blundell and Dias
(2009)). The important fact for our purposes is that these approaches have begun to appear in the
literature on achievement in developing countries. And we explicitly include this literature in our
review below.
III. Scope of Review
We now move to the heart of this study – reviewing relevant research on the determinants
of student achievement and time in school in developing countries. This review is, however,
more limited than that statement might suggest. First, it focuses on studies from 1990 to 2010
and does not return to prior studies that have been reviewed elsewhere. Second, it focuses only
on primary and secondary education, and thus it does not include pre-primary, vocational or
post-secondary education (see Attanasio and Meghir, 2011, for a review of the evidence on pre-
primary education). Third, the primary outcome of interest is student learning (usually measured
in terms of test scores), although we also consider school enrollment (including related
phenomena such as daily attendance and years of schooling attained).10 Finally, this paper will
not examine school policies related to incentives for students and parents (since this is covered
by Behrman, Parker, and Todd (2011)), school organization and management (covered by
Galiani and Perez-Truglia (2011)), the relative performance of private and public schools
10 Of the 79 papers eventually examined (see below for details), only one examined grade repetition, which is an indirect measure of student learning. Yet repetition can also depend on school policies and other factors (such as crowding in particular grades) and so it is a noisy measure of student learning. Because of this problem, and the lack of studies that examined repetition, we exclude studies of repetition in our analysis of the determinants of student learning. (The sole paper that examined repetition also has regressions with test scores as the dependent variable, so it remains one of the 79 studies.)
13
(MacLeod and Urquiola (2011)) and school policies that affect child health (Alderman and
Bleakley (2011)).
The rest of this section explains how the vast literatures in economics and education were
searched. The objective of the review process was to identify as many relevant, high-quality
papers as possible. The strategy was to search a wide variety of sources, and then systematically
eliminate individual papers that do not meet a series of criteria for relevance and quality. The
first step was to conduct the search for journal articles published between 1990 and 2010 using
two search engines that cover the economics and education literatures, respectively: EconLit and
the Education Resources Information Center (ERIC). The search was conducted during October
and November of 2010; for this reason, papers that were not yet available at that time are not
included in this review. The authors searched for papers that listed both “education” as a key
word, and any one of a list of 72 educational inputs as keyword (see Appendix I for this list).
Because of the overwhelming number of papers found in ERIC using these search terms (over
half a million), the search was limited to papers that also included the name of at least one
developing country or the term “developing country” or “developing countries” in the abstract.
Developing countries are defined as in the International Monetary Fund’s list of emerging and
developing countries, as published in its World Economic Outlook Report, published in April
2010.
This search yielded a total of about 9,000 articles. Two of the authors reviewed each of
the 9,000 articles individually, selecting those that looked potentially relevant based on the
information found in the abstract (and, in some cases, looking at the introduction or conclusion
of the paper). Based on reviews of the abstracts only, papers that did not focus on developing
countries, or that did not estimate the impact of a school-level (or teacher level) variable on
14
students’ educational outcomes, were eliminated. Papers selected by either of these two authors
were included in the next phase of the review; this winnowing process reduced the total number
of papers to 307.11
In addition to published papers, the authors also searched several prominent series of
working papers in economics: National Bureau of Economic Research (NBER) working papers;
World Bank Policy Research working papers; the Institute for the Study of Labor (IZA); the
Center for Economic and Policy Research (CEPR); and the CESIfo Research Network. Papers
listed as education papers on the Abdul Latif Jameel Poverty Action Lab’s website were also
searched. Working papers published before 2005 were not included, as it was assumed that high
quality working papers written before 2005 should have been published by 2010. When the
same paper appears both as a working paper and as a journal article, only the journal article was
included. Using this process, 29 working papers were added to the 307 published articles. All
four authors reviewed the abstracts of this large group of papers and narrowed the sample to 253
by eliminating duplicate papers and papers that did not focus on one or more of the following
factors that affect students’ educational outcomes: school infrastructure and pedagogical
materials; teacher (and principal) characteristics; and school organization.
In the second phase, the authors read each of the 253 papers (in contrast to first phase,
when only abstracts were read) to obtain further information about each study. During this
phase, additional papers were eliminated for lack of relevance. These fell into three categories:
1. The paper’s focus was not on a developing country (this was not clear in the abstracts of some
papers); 2. The paper focused on an education policy unrelated to school infrastructure and
11 In the economics literature, most papers that included education as a keyword were studies of the impacts of education on some other social phenomenon, as opposed to studies that investigated the impacts of other factors on education outcomes.
15
pedagogical materials, teacher (and principal) characteristics, and school organization; and 3.
The paper did not include quantitative analysis of the impact of a school or teacher characteristic
on students’ educational outcomes. A little more than half of the 253 papers chosen in the first
stage were eliminated at this stage, which reduced the studies considered to 112.
In a third phase, the remaining 112 papers were reviewed for their quality, considering
both the econometric methodology used and, when appropriate, covariates included in the
analysis. All articles that were based on a randomized controlled trial (RCT) were retained, as
these studies avoid, or at least minimize, many of the estimation problems discussed in Section
II. Further, estimates based on a difference in differences (DD) regression, regression
discontinuity design (RDD), or matching methods were also included. Finally, papers that used
other, simpler quantitative methods (e.g. OLS) and included at least one general family
background variable (e.g. parental schooling or household income) and school expenditure per
pupil, or one family background variable, one teacher variable, and at least one additional school
variable, were included. By excluding papers that did not meet these restrictions, the sample was
reduced to 79 papers (listed in Appendix II).
A fourth and final phase of the review made further quality distinctions. We examined
further all papers that did not use an RCT, DD or RDD estimation method. Of these, 36 papers
that relied on ordinary least squares analysis of cross-sectional data failed to employ any more
sophisticated methodology to control for potential omitted variable or endogeneity bias (such as
instrumental variables or selection correction methods) and these were deemed to be of lower
quality. While results are presented for all 79 studies, a separate analysis is also done for the 43
papers considered to be “high quality” by this more stringent methodological criterion. The
evolution of the sample is summarized in Table 6.
16
IV. What Have We Learned from Studies of Education in Developing Countries Since 1990?
Based on these quality distinctions, this study presents three sets of results that focus on
student learning, as measured by test scores. In subsection A, the results of all 79 studies are
summarized. In subsection B, the results of the 43 studies that passed the higher quality bar are
separately reviewed. Subsection C shows only results from 13 randomized control trials.
Finally, Subsection D examines studies that investigate the determinants of time in school
(attendance, years of schooling, etc.) outcomes.
Obviously, there is an inevitable tradeoff between raising the standard one sets for a
study to be credible and the number of studies one has for drawing general conclusions. In
particular, when the review is limited to studies that used randomized control trials there are only
13 studies that examined school and teacher characteristics, while there are dozens of school and
teacher characteristics (including pedagogical practices) in which one may be interested. A
related issue is how many studies of a particular school or teacher characteristic are needed to be
included in the summary tables. We have set a low limit of requiring only two studies, which
some readers may argue is too low; yet it is easy for any reader to exclude some of the rows in
the summary tables that are deemed to have too few studies. The exception to this rule is the
subsection that focuses on randomized trials; all studies are included, even when there is only
one study that examined a particular school or teacher characteristic.
Our review of the literature falls into the general category of “meta-analysis,” or the
systematic combining of results from multiple studies. These techniques have been employed
for over a century, with the most intense work found in reviews of medical research. More
recently, however, various forms of meta-analysis have been applied to education research (see,
17
for example, Hedges and Olkin (1985) for an early application to the education literature). Meta-
analysis can be used for many different purposes, including generalizing to wider populations,
understanding the heterogeneity of effects, and improved statistical power. Here we do not
undertake any formal statistical analyses of the study results because we are interested in the
simplest issue: do studies find consistent impacts of school resources and pedagogical factors on
student achievement?
The general literature on meta-analysis does, however, raise one potentially serious issue
related to our review, that of “publication bias.” In particular, if authors tend to submit studies
with positive (or negative) findings more frequently than those with null findings, or if editors
and journals are more likely to publish articles with significant results, our review of the
published work may overstate the statistical significance of any particular factor.
This problem may be less important in our review than in other areas for meta-analysis,
but in the end we are unable to assess its importance. The reason for potentially less impact here
is that many of the statistical studies reviewed here attempt to estimate the impacts of multiple
factors – such as pupil-teacher ratios along with the impact of textbooks and of teacher
experience. Thus, a given publication can easily contain a mixture of significant and
insignificant factors, whereas a medical publication that addresses a single effect (e.g., the
treatment outcome related to a specific drug) will be more focused on the significance or
insignificance of this single parameter. Nonetheless, we do not present any quantitative analysis
of how publication bias may affect our review.
A. Summary Results from All 79 Studies. This section casts the widest possible net,
examining the impacts of over 30 school and teacher characteristics on student test scores. It is
convenient to divide these school and teacher characteristics into three broad types: 1. School
18
infrastructure and pedagogical supplies; 2. Teacher (and principal) characteristics; and 3. School
organization. In some cases, one could debate whether a particular characteristic belongs in one
category or another (e.g. contract teachers could be thought of as a teacher characteristic or a
school organization characteristic); in such cases an admittedly somewhat arbitrary assignment is
made, but of course the conclusions drawn regarding any particular school or teacher
characteristic do not depend on which of these three categories it has been assigned.
Table 7 summarizes the findings of the 79 studies in terms of the impact of the first broad
type of variables on students’ test scores. Within this broad type, the variables are ordered by the
number of estimates available from these 79 studies, starting with those with the largest number
of estimates. Note that many studies present multiple estimates of the impact of the same
variable, because of multiple estimation methods or multiple subsamples. In general, different
estimation methods or estimations based on different subgroups (for example boys and girls, or
different grades) were counted as separate estimates, but adding or removing a few variables for
the same estimation method (or a similarly minor change) was not counted as a separate
estimate. In cases in which an author presents results from multiple estimations, but argues that
one is a more reliable set of estimates than the others, only the author’s preferred estimate is
included. This is likely to result in an overrepresentation of results from studies that present
multiple estimation methods and do not indicate which method is the preferred one. In order to
allow the reader to give equal weight to studies, that is not to give a large weight to a single
study that produced many different estimates of the impact of the same variable, the numbers in
parentheses show how many separate publications found a particular impact. Finally, note that
for any given estimate, there are five possible classifications: significantly negative,
insignificantly negative, zero (or insignificant but sign not reported), insignificantly positive and
19
significantly positive. A 10 percent significance level cut-off was used; while this relatively
generous definition of statistical significance will classify more findings as significant, it is
possible that some results that would have fit this criterion are omitted from the analysis since
some authors may not have presented results that are significant only at the 10 percent level.
1. School Infrastructure and Pedagogical Materials. Turning to the results, Table 7
summarizes the findings for eight different school infrastructure and pedagogical material
variables. By far the most commonly estimated impact is that for textbooks and workbooks;
there are 60 estimates from 21 different studies. (The numbers in parentheses add up to 33, but
this reflects the fact that some studies found different effects using different estimation methods
or different subsamples, and thus a single study can appear in parentheses more than once; the
last column in the table gives the total number of studies.) Although these studies are not
unanimous in their estimates, most of them (36) find positive effects, and most of these (26) are
significantly positive. This is what almost anyone would expect, and the number of estimates
that are negative and significant is quite small (four estimates from three studies).12 Thus this
evidence strongly suggests that textbooks and similar materials (workbooks, exercise books)
increase student learning.
The next most commonly estimated impacts are those of basic furniture (desks, tables and
chairs) and of computers and electronic games. The evidence in Table 7 suggests that adequate
amounts of desks, tables and chairs raise student test scores, as common sense would suggest.
12 A significantly negative effect is not necessarily an error; it could be that some textbooks or workbooks were not well written, or not well matched to the students, and that this caused problems. More generally, one should expect some heterogeneity in the impacts. Given our 10% significance level standard, if a certain school variable had zero impact in all schools one should find that 90% of estimates are not significantly different from zero, while 5% are significantly negative and 5% are significantly positive. As will be seen, there are some cases where more than 5% are significantly positive and more than 5% are significantly negative; such a result suggests heterogeneity in the impacts due to differences across countries and across schools within the same country.
20
More specifically, of the 28 estimates from eight studies, none is negative and 15 are positive (of
which 8 are significantly positive). The evidence is even stronger if one counts studies instead of
individual estimates (the 13 estimates of zero impact are all from a single study); all but one
study finds a positive impact, and four of the eight find significantly positive impacts. In
contrast, the results for computers and related materials are less clear; 18 of the 26 estimates are
statistically insignificant (and they are almost evenly divided between negative and insignificant
and positive and insignificant), while seven are significantly positive and one is significantly
negative. Given that computers can be relatively expensive, this suggests caution when deciding
whether scarce funds for education should be used to purchase computers and related products.
Another commonly estimated school characteristic is electricity.13 One would expect a
positive effect, since electric lighting should help students read and see the blackboard, and it
may also help by providing power for other useful items (e.g. fans to keep the classroom cooler).
Of the fifteen estimates in Table 7, only three are negative (and none is significantly negative)
while twelve are positive (of which six are significantly positive). A similar result holds if one
counts the number of studies with these results; of the six studies only two find negative impacts
(neither of which is significant) while five find positive but insignificant impacts and two find
significantly positive impacts. Thus the evidence gives fairly strong support to the proposition
that providing electricity to schools increases student learning.
13 While electricity could simply be an general indicator of the physical condition of the school, most of the six studies that examined the impact of electricity included other measures of the physical condition of the school. We tend to interpret electricity literally, although it may just be one of the most important, and most accurately measured, dimensions of the quality of school facilities.
21
Similarly positive effects are found for general indices of school “infrastructure” and for
blackboards (and other visual aids).14 Again, this is what one would expect. Turning to a more
costly school characteristic, school libraries also appear to have generally positive impacts on
student learning as measured by test scores; this is particularly the case when each study is given
equal weight (five of the six studies found a significantly positive effect, while only one found a
significantly negative effect). Finally, it is also the case that high quality walls, roofs and floors
appear to lead to better outcomes: five of the six estimates are positive, and two of the five are
significantly positive (the sole negative estimate is not significant).
2. Teacher (and Principal) Characteristics. Table 8 summarizes the findings from the
79 studies for teacher and principal characteristics. The most commonly examined characteristic
is the teacher’s level of education; there are 72 separate estimates from 24 distinct studies. Of
these estimates, 46 found a positive impact on student learning, and 24 of these were
significantly positive. In contrast, only 15 estimates were negative, and only four of these were
significantly negative. Counting the number of studies (as opposed to distinct parameter
estimates) in each category gives similar results; only three studies found significantly negative
effects while eleven found significantly positive effects. Thus, as one would expect, the results
generally support the proposition that providing more educated teachers raises students’ test
scores. Similarly, teacher experience seems to have a positive effect, but the evidence is not
quite as strong. More specifically, 43 of the 63 estimates found no statistically significant
impact, although of the 20 that did almost all (17) found a significantly positive effect.15
14 In almost all of the school infrastructure studies, the index counts whether schools have some or all of the following: library, cafeteria, science labs, playground, and computer labs. As mentioned previously, electricity could also be part of a general infrastructure measure. 15 Note that both of these findings about teacher characteristics are very much at odds with the U.S. evidence. In the U.S., where all teachers have bachelor’s degrees and the focus is on advanced degrees, there is virtually no evidence
22
A more direct measure of teacher competence is teachers’ knowledge of the subjects that
they teach. The 79 studies include 33 estimates of the impact of teacher knowledge, as measured
by teacher test scores, on student learning. Almost all (29 out of 33) found positive effects, and
most of these positive effects (18) were statistically significant. The evidence is not quite as
strong if one examines number of studies instead of number of estimates (seven studies found
significantly positive effects while only two studies’ findings were significantly negative), but it
is still strong and thus supports the common sense notion that teachers who better understand the
subjects they teach are better at increasing their students’ learning.
One teacher characteristic that has more ambiguous effects is whether the teacher is
female. There are 39 estimates, of which 13 are negative (and 6 of these are significant) and 24
are positive (and 12 are significant). While positive impacts are more common than negative
ones, when one counts the number of studies the results are even more ambiguous: four found
significant negative effects, while five found significantly positive effects. Overall, there is little
support for any systematic difference in teacher effectiveness by gender.16
The next most common teacher variable in the 79 studies is in-service teacher training.
Of the 29 estimates, 17 are insignificant (10 are negative and 7 are positive) while 11 are
significantly positive and only 1 is significantly negative. Giving each study equal weight leads
to a similar conclusion. Overall, in-service teacher training appears to have a strong positive
impact on student learning.
that more education for the teachers helps. Similarly, experience past the first few years has no effect. See Hanushek (2003). 16 There is currently a debate about the effectiveness of single sex schools and, implicitly, that female teachers may have a larger impact on girls than boys (see Billger (2009), Kaufman and Yin (2009), Park and Behrman (2010)). However, in all but one of the studies examined here estimates are not given separately for male and female students, and the sole exception found no difference.
23
The last two teacher variables are a general index of teacher quality and whether the
teacher has a teaching degree (as opposed to a general degree).17 Of the 14 estimates of indices
of teacher quality, none is negative, eight are zero (or insignificant but of unknown sign) and six
are significantly positive. A similar result holds if one gives each study equal weight, although
there are only two studies. This suggests that indices of teacher quality have strong positive
impacts on student learning. In contrast, the two studies that considered whether a teacher had a
teaching degree yield less clear conclusions. Of the six estimates from the two studies, two are
insignificantly negative, two have point estimates close to zero, and two have significantly
positive impacts. The same distribution holds if one gives each study equal weight.
Two principal characteristics were examined in several different studies: years of
experience and level of education, and their impacts appear to be different. In particular, years
of experience had a positive impact in five of the six estimates, and of the five positive estimates
two were statistically significant (the sole negative estimate was not significant). Giving each
study equal weight does not change this finding. In contrast, of the six estimates of the impact of
the principal’s level of education, two were significantly negative, one was significantly positive,
and the other three were not statistically significant (and the same general result holds if each
study is given equal weight). Thus principal experience appears to lead to increased student
learning, but there is no clear evidence that the same is true of principal education.
3. School Organization. Table 9 examines the third general category of school and
teacher variables, school organization. These variables focus on how schools are organized, as
opposed to the basic characteristics of schools and teachers. By far the most common variable of
this type in the literature is class size, that is the pupil-teacher ratio; there were 101 separate 17 The 14 estimates of teacher quality come from two studies, which define teacher quality in terms of an index of teacher experience, level of education, and scores on math and reading tests.
24
estimates from 29 different studies.18 Intuitively, one would expect the pupil-teacher ratio to
have a negative effect on student learning, and that was the case in 59 of the 101 estimates,
although only 30 of the 59 were statistically significant. Another 39 estimates had an unexpected
positive sign, but only 15 of these were statistically significant. In terms of numbers of studies,
instead of numbers of estimates, 26 studies found a negative impact, of which 13 were
significantly negative, and 21 found a positive impact, of which 9 were significantly positive.
Overall, these estimates suggest that increases in class size usually have negative impacts
on student learning, as one would expect, but the finding that 9 of the 29 studies found a
significantly positive effect suggests caution. These positive effects could reflect either random
chance or estimation problems; an example of the latter is that schools that are of high quality
due to unobserved characteristics will attract more students, raising the pupil teacher ratio and
thus leading to a positive correlation between that ratio and student test scores. Nonetheless, the
frequency of “unexpected” positive impacts, even in developing countries where pupil-teacher
ratios can be very large, is similar to the findings for developed countries (Hanushek (2003)).
Clearer results are seen in the next two variables: teacher absenteeism and teacher assigns
homework. As one would expect, for teacher absenteeism 13 of the 15 estimates are negative,
and 7 of the 13 are significantly negative. None of the 15 estimates is positive, although two are
insignificant and of unknown sign (the paper did not report the signs of the insignificant results).
In contrast, but also as expected, teacher assignment of homework generally has positive impacts
on students’ test scores. Of the 16 estimates, 12 are significantly positive and only four are
negative (and none is significantly negative). The main caveat is that these findings are less
18 In the United States, pupil-teacher ratios and class sizes can diverge noticeably because teachers have fewer class meetings than students have courses, because teachers perform a variety of nonteaching duties, and so forth. This divergence is likely to be less important for schools in developing countries.
25
strong when each of the five studies is given equal weight: three are significantly positive and
two are insignificantly negative.
School provision of meals has been used in many developing countries to achieve two
distinct goals: improved child health and increased student learning. Four of the 79 studies
examined the impact of school meals on student test scores, producing 13 distinct estimates. The
evidence is inconclusive; seven estimates are negative, of which four are significantly negative,
while six estimates are positive (all of which are statistically significant). Considering the
number of studies gives a somewhat more positive impact; only one found a significantly
negative impact, while two found insignificantly negative impacts and three found significantly
positive impacts. Even so, the evidence does not provide strong support for this intervention, at
least as a means to raise student learning, and school meal programs have the disadvantage that
they can be relatively expensive.
The next two school organization practices yield unambiguous results. The first is one
that is unavoidable in small, rural schools: multi-grade teaching, where one teacher teaches more
than one grade in the same classroom. There are 21 estimates of its impact, based on only four
distinct studies. Four estimates (all from the same study) show a significantly negative effect,
while seven estimates yield positive effects (of which two, from two different studies, are
statistically significant). Overall, these results are decidedly ambiguous, and the actual impact
may vary given other factors, such as class size and teacher characteristics. In contrast, results
are relatively unambiguous, and in the expected direction, for hours of the school day; six of the
eight estimates are positive, and four are significantly positive (although when studies are given
equal weight the distribution of the findings is less clear cut).
26
The results for tutoring are more ambiguous; while four of the five estimates are positive,
and two of these four are significantly positive, when studies are equally weighted two of the
three studies show a positive effect, of which one is significant, but the third shows a
significantly negative effect. While intuitively one would think that tutoring should help, and
would not have any negative effects, it could be that the tutors are simply the students’ teachers,
who may be curtailing effort during the school day to obtain paying students for their tutoring
classes (for a general discussion, see Dang and Rogers (2008). Participation in tutoring may also
be an indicator that the student needs extra help, i.e., that achievement is causing tutoring rather
than the other way around.
The next two school organization variables focus on teacher pay: teacher salary and
whether the teacher is a contract teacher. There are only six estimates of the impact of teacher
salary, but all are positive and two are significantly positive, which may indicate that higher
salary raises teacher morale or leads to better selection into teaching. The findings for contract
teachers, however, indicate a possible contradiction. These teachers are hired on short-term
contracts and, in general, have relatively low qualifications, less experience, little or no benefits,
and lower salaries, a combination that might superficially suggest that these teachers would be
less effective.19 Yet five of the six estimates yield positive impacts, and four of them are
significantly positive (although the results are more ambiguous when weighted by publication).
The counterbalancing force behind the positive impact of contract teachers, according to several
researchers, is that they have much stronger incentives to perform well than regular teachers,
who are insulated from performance concerns by civil services rules. Thus, even with lower
salaries, they are induced to perform well in school (perhaps so that they can subsequently get a
19 For a detailed review and analysis of recent research on contract teachers, see Galiani and Perez-Truglia (2011).
27
regular teaching position with its higher salary and greater job security). Overall, the teacher
salary results are consistent with pay inducing more teacher effort or leading to better selection
into teaching, although the interpretation is ambiguous because much of the variation in salaries
comes from pay for different characteristics rather than identifying the impact of increasing or
decreasing the overall salary schedule for teachers.
There are only three estimates in Table 9 regarding the impact of overall school
expenditures per pupil, but the results are somewhat puzzling; in two of the three cases, the
estimated effect is significantly negative (an unexpected effect), while in the other it is
significantly positive. This measure is somewhat difficult to interpret. It could simply reflect
compensatory funding – i.e., schools that are doing poorly get additional funds. And, it is also
possible that the estimated negative effects arise because other school characteristics are included
in the regression; in both studies from which these estimates come (Nannyonjo (2007); Du and
Hu (2008)) several other school and teacher characteristics are included in the regression. Again,
however, there is little overall evidence to support a strong positive impact of school
expenditures, a repeated finding in a wide range of reviews for developed countries (Hanushek
(2003)).
The next two school variables have rather inconclusive results. The cost of enrolling in
school could have a negative effect if it interferes with schooling (a child may be excluded from
school until fees are paid) or if it leads to a reduction in home-supplied pedagogical materials,
but the evidence in Table 9 is inconclusive. Similarly, the overall size of the school has no clear
tendency, and it is not clear a priori what the sign of the effect should be.
The next two variables focus on specific elements of pedagogical style: group work and
whether the teacher gives examples in class. Overall, group work seems to have a positive
28
impact on students’ test scores. In contrast, teachers giving examples in class is more ambiguous
(five estimates are positive, of which three are significantly positive, but two are significantly
negative).
The last school organization variable in Table 9 is student attendance. All eight estimates
from the two studies that examined student attendance are significantly positive. This, of course,
is quite plausible, and it shows that for a few variables the results are clear and unambiguous
B. Summary Results from 43 Higher Quality Studies. This section repeats the
analysis of the last section but drops 36 studies that were deemed to be of lower quality because
they used simple OLS on cross-sectional data without attempting to use any of the more
sophisticated methods to address the potential estimation problems. As in the previous
subsection, results are shown only if the same school or teacher characteristic was examined in
two or more separate studies.
1. School Infrastructure and Pedagogical Materials. The first panel in Table 10 shows
summary results for seven different school infrastructure and pedagogical material variables (the
school infrastructure index was dropped because it was considered by only one of the 43
studies). As in subsection A, the most common estimated effect is that for textbooks and
workbooks; there are 21 estimates from 8 different studies. While intuitively one would expect
that these items would increase student learning, the estimated effects are far from unanimous:
slightly less than half of the estimates (9 out of 21) find positive effects, but only three of these
are significantly positive (and one is significantly negative). Thus, after dropping less rigorous
studies, the evidence that textbooks and similar materials (workbooks, exercise books) increase
student learning is quite weak.
29
In contrast to textbooks and workbooks, the evidence in Table 10 supports much more
strongly the hypothesis that desks, tables and chairs raise student test scores. More specifically,
all seven estimates are positive, and three of them are significantly positive. On the other hand.
the results for computers and related materials are at best only weakly supportive: 17 of the 22
estimates are statistically insignificant (and they are almost evenly divided between negative and
insignificant and positive and insignificant), but of the five that are statistically significant four
are significantly positive. These results suggest caution when advocating the introduction of
computers and related devices, especially if they are relatively expensive.
The next most commonly estimated school characteristic is electricity. While the
evidence when all 79 studies were examined strongly supported the proposition that providing
electricity to schools increases student learning, this finding completely disappears when less
rigorous studies are dropped: all six estimates are insignificant, of which three are negative and
three are positive. This result is somewhat counterintuitive, but it suggests that the impact of
providing electricity (or, more generally, better school facilities) may not be very strong.
The findings for blackboards (and other visual aids) are generally positive. More
specifically, while four of the six estimates are positive, and two are significantly positive, the
two significantly positive results are from a single study. The results for libraries are almost
unanimous: four of the six estimates are significantly positive, and none is significantly negative.
The last school infrastructure variable is the quality of the schools walls, roofs and
ceilings. When all 79 studies were considered, they offered strong support that improvements in
these school characteristics raised students’ test scores. The evidence in Table 10, based on only
the higher quality studies, also strongly supports this conclusion (since all of the estimates in
Table 7 are still in Table 10).
30
2. Teacher Characteristics. The second panel of Table 10 summarizes the findings from
the 43 higher quality studies for teacher characteristics. (There are no results for principal
characteristics because none had more than one higher quality study.) The first characteristic,
the teacher’s level of education, has ambiguous results; of the 13 estimates 10 are statistically
insignificant (and evenly divided between insignificantly positive and insignificantly negative),
and while two of the other three are significantly positive the third is significantly negative.
Counting the number of studies in each category gives similarly ambiguous results. These
results stand in sharp contrast to those when all 79 studies were included; once lower quality
studies are eliminated there is little evidence that teachers’ level of education has any impact on
student test scores. There is some evidence that teacher experience has a positive effect; 17 of
the 28 estimates found positive effects, and 5 of the 17 are significantly positive (and only one is
significantly negative). Yet with 22 of the 28 estimates being statistically insignificant (and
these are almost even split between insignificantly negative and insignificantly positive), there is
only weak evidence that teacher experience has a beneficial effect, especially when one focuses
on the number of studies (the numbers in parentheses).
In contrast to teachers’ education and experience, more direct measures of their
competence, their knowledge of the subjects that they teach, shows very strong positive effects.
More specifically, of the 20 estimates of the impact of teacher knowledge (as measured by test
scores) on student learning, all are positive and 13 are significantly positive, which provides very
strong support to the hypothesis that teacher knowledge plays a very large role in student
learning.
As when all 79 studies are examined, teacher gender has an ambiguous impact within the
43 highest quality studies. There are eight estimates: six are statistically insignificant (although
31
five of these are positive and only one is negative), one is significantly negative and one is
significantly positive. Looking at the counts of studies does not alter the ambiguous results.
The last teacher characteristic in the middle panel of Table 10 is in-service teacher
training. Of the six estimates of its impact, three are significantly positive and three are negative
but insignificant. Thus the evidence at best provides only moderate support to the hypothesis
that in-service teacher training has a positive impact on students’ test scores.
3. School Organization. The third panel of Table 10 examines seven school organization
variables (nine of the variables that were in Table 7 have been dropped because they were not
included in two or more high quality studies). As in subsection A, by far the most commonly
estimated impact is that of the pupil-teacher ratio; there are 46 separate estimates from 14
different studies. As with the 79 studies examined above, most of the estimates are negative,
with 32 (70 percent) of the 46 showing a negative impact, which is a higher percentage than
when the 79 studies were examined (58 percent). In addition, 14 of the 32 are significantly
negative, while only three are significantly positive. In terms of numbers of studies, however,
the results are not as decisive. In particular, five studies found significantly negative effects
while three studies found a significantly positive effect. Overall, these results again suggest that
increases in class size usually have negative impacts on student learning, as one would expect,
but this is not always the case. Another interpretation is that the effect is negative but it is quite
small, so that random variation in estimates often yield positive point estimates, which on
occasion are significantly positive.
In contrast, the results for teacher absenteeism are clearly negative. Of the six different
estimates, all are negative and four are significantly negative. This finding also holds when each
study is given equal weight.
32
Turning to school meals, the evidence is scarce and remains ambiguous. In particular,
there are only three estimates from two studies; one study presents two estimates that are
significantly positive but the other study finds only an insignificantly negative impact.
The next school organization variable is multi-grade classrooms; there are ten estimates
of its impact, although they are based on only two distinct studies. Four estimates (all from the
same study) show a significantly negative effect, while six find positive effects, although only
one of the six is significantly positive. Overall, these results are decidedly ambiguous, as was
the case when all 79 studies were examined.
The next two variables in Table 10, hours of the school day and tutoring, also have
unambiguous results. Regarding the former, all four estimates (from two different studies) are
significantly positive. The results for tutoring are almost as unambiguous and equally plausible:
all four estimates are positive and two are significantly positive. This is less ambiguous than was
the case when all 79 studies were examined.
Finally, for contract teachers, the results are identical to those in Table 7 because all the
79 studies that examined the impact of contract teachers were found to be sufficiently rigorous to
be in the 43 higher quality studies. Again, if one gives equal weight to each estimate, contract
teachers appear to have strong positive impacts on students’ test scores, but, if one gives equal
weight to studies, the results are more ambiguous.
C. Results from 13 Randomized Control Trials. This subsection presents the results
from 13 randomized control trials (RCTs) that altered school characteristics. As noted above, the
RCT methodology is best suited for analysis of specific programs or resources that can be
identified and manipulated easily within an experiment. Thus, the evidence in this section
focuses on a more limited set of inputs; indeed, there are no results for teacher or principal
33
characteristics, which are difficult to randomize. Unlike the previous subsections, results are
shown even if there is only one study for a given school or teacher characteristic, since there are
very few RCTs available.
1. School Infrastructure and Pedagogical Materials. The first three rows in Table 11
show results for three different general school infrastructure and pedagogical material
characteristics that have been analyzed using randomized trials: textbooks, computers and flip
charts. Two studies examined textbooks, one in the Philippines Tan, Lane, and Lassibille
(1999)) and one in Kenya Glewwe, Kremer, and Moulin (2009)). Overall, the results suggest no
impact of providing textbooks; none of the four estimates is positive, and none is statistically
significant. This is consistent with the weak results found above (subsection B) for the 43 higher
quality studies.
The next variable in Table 11 is the availability of computers and related electronic media
(internet connections, educational video games, etc.). Five different RCTs have examined the
use of these types of materials. The results have been rather mixed, which is consistent with the
findings of the 43 high quality studies. Of the 20 separate estimates, eight were negative (but
only one significantly so) and twelve have been positive (of which three were significantly
positive).
To understand the variation in results, it is useful to examine each of these five studies.
Banerjee, Cole, Duflo, and Linden (2007) evaluate an intervention in Indian primary schools in
which school teachers received training on how to use educational mathematics software in the
classroom. In treatment schools, students used the software for two hours a week. After two
years of the treatment, students in treatment schools were found to score significantly higher on
math tests than students in the control group, but there was no significant difference in language
34
scores. In contrast, Osorio and Linden (2009) evaluated the Computers for Education program in
Colombia and found less positive results. In this program, teachers receive computers as well as
eight months of training on how to use the computers in the classroom. In the schools in their
sample, teachers were trained on how to use the computers to support language education.
Pooling results across grades 3 through 9, there were no significant results of the intervention on
any of the eight math and language skills evaluated. Disaggregated by grade, there are significant
positive effects in grade 9 and significantly negative effects in grade 8.
Linden (2008) evaluated a computer-assisted learning program in India and also found
mixed results. When students used computers instead of interacting with classroom teachers for
part of the day, the intervention had a significant negative effect on test outcomes. Students that
used the computer program after school as a complement to their classroom experience,
however, showed some (albeit insignificant) improvement. In another study conducted in India,
Inamdar (2004) evaluated a program that consisted on installing “Minimally Invasive Education
kiosks” in rural Indian schools. These kiosks have internet connected computers installed where
children can explore without any adult direct intervention. Students in the experimental group
obtained better results in Grade 8 computers examination. Note, however, that the sample size of
this investigation is quite small, collecting information for a total of only 103 students.
Finally, Rosas et al. (2003) evaluated the effects of introducing educational videogames
in a sample of primary schools in disadvantaged areas of Chile. These videogames cover basic
mathematics and reading comprehension, and they were designed for first and second grade
students. The results indicate the children in the experimental group performed better in
mathematics, Spanish and spelling.
35
The last RCT that examined a school infrastructure variable is that of Glewwe, Kremer,
Moulin, and Zitzewitz (2004), who examined the impact of flip charts in Kenya. As seen in
Table 11, the results were disappointing, with a negative but statistically insignificant impact.
Note that this result does not necessarily contradict the results in the previous subsection for the
43 high quality studies. In particular, recall that only two of the six estimates were significantly
positive.
2. School Organization. Several RCTs have been conducted that examine the ways in
which school are organized. Muralidharan and Sundararaman (2008) examine the impact of
class size on achievement in India. In this paper, class size is reduced in schools that were
randomly assigned to receive an extra contract teacher. That paper presents five estimates of the
impact of class size on student achievement; three are significantly negative while two are
negative but not significant. More specifically, the effect of class size on combined math and
language test scores is significantly negative in grades one through three, but not in grades four
and five. While these findings are consistent with what one would expect, the authors cannot
separate out the class size effect from the contract teacher effect. Moreover, it is only one study,
and thus it is hard to generalize.
One RCT has considered the impact of providing school meals. Tan, Lane, and
Lassibille (1999)) found a negative but insignificant effect of this type of program in the
Philippines. Tutoring has also been examined by a randomized trial, the study of the Balsakhi
tutoring program in India by Banerjee, Cole, Duflo, and Linden (2007). That study found that
providing tutors to children who are falling behind in the curriculum greatly increased their test
scores.
36
Turning to contract teachers, Muralidharan and Sundararaman (2008) present four
estimates of the impact of contract teachers on student performance, and all four are significantly
positive. This is somewhat more positive than the average over the 43 high quality studies.
However, recall from the discussion of this paper above that the contract teacher was an “extra”
teacher. For this reason, the effect that is found could also be, at least in part, a class size effect.
Another RCT conducted in India, Pandey, Goyal, and Sundararaman (2009), examined
the impact of community information campaigns on students’ test scores. The study presents 14
different estimates of impacts on reading, writing and math tests, varying by grade and state, but
all are statistically insignificant except for one that is significantly positive. Overall, there is
little evidence that these campaigns had sizeable effects on students’ test scores.
A final school organization variable is the provision of merit-based scholarships. The
single RCT study, conducted by Kremer, Miguel, and Thornton (2009), provides two estimates,
both of which are positive with one being statistically significantly.
D. Impact of School and Teacher Variables on Time in School. Almost all (69) of
the 79 studies examined above focused on student test scores as the outcome of interest. Yet 18
of these studies also examined time in school variables, such as daily attendance, current
enrolment and years in school. This subsection reviews the findings of these 18 studies on these
time in school variables. It is of course necessary to interpret these studies with added caution,
because a variety of programs aimed directly at enrolment and attainment—such as many
conditional cash transfer programs – have failed to lead to added learning (see the review in
Hanushek (2008)). Simply increasing time in school without commensurate additions to
learning and achievement has little value (Hanushek and Woessmann (2008)).
37
1. All 79 Studies. Table 12 summarizes the findings when all 79 studies are examined (of
which 18 examined time in school), for all school or teacher variables found in at least two
separate studies. The first five lines examine school infrastructure and pedagogical material
variables. The first examines textbooks and workbooks, for which there are seven estimates
from four distinct studies. These seven estimates yielded only two significant results:
textbooks/workbooks lead to increased time in school. While this is intuitively plausible, the
other five estimates are insignificant, of which two are negative and two are positive (and one is
insignificant but of unknown sign). Thus it appears that textbooks do not have a strong effect on
students’ time in school.
The next two school infrastructure variables are whether the school has a library and the
condition of its roof, walls and floors. There are only two estimates, from two distinct studies,
for school library, but they are both statistically significant, in the same direction, and intuitively
plausible: school libraries increase the time the students spend in school. Only two separate
studies examined the impact of the quality of the physical building (roof, wall and floor) on
students’ time in school. Of these, one found a significantly positive effect while the other found
an insignificantly negative effect. This lack of agreement, as well as the small number of
studies, prevents any general conclusions from being drawn.
The next infrastructure variable, building new schools, has a more consistent set of
findings. Of the five distinct estimates, all are positive and four are significantly positive. A
similar finding holds when one gives each of the three studies from which these estimates come
equal weight. All three had at least one set of estimates with a significantly positive impact, and
only one had a positive but insignificant impact. Of course, these finding is of little surprise;
building new schools (which in effect reduces the distance to the nearest school, and may also
38
reduce capacity constraints) should increase enrollment on eventual years of completed
schooling.
Finally, a general school quality index was used in two separate studies. Together there
are five sets of estimates. All five show positive effects, and four of the five are statistically
significant. Yet the evidence is somewhat less strong if one gives each study equal weight; one
study’s estimates were significantly positive while the other study’s results had a significantly
positive impact and an insignificantly positive impact. More importantly, the school quality
index in one paper is composed of several different variables, so it is unclear which variables are
the most important, and in the other paper school quality is a school fixed effect from a previous
estimation, which also does not indicate what school characteristics determine school quality.
Table 12 presents results for three teacher characteristics: education level, experience and
in-service teacher training. For teachers’ level of education there are five estimates from four
distinct studies that point to ambiguous results: only one of the five is statistically insignificant.
While that one significant estimate is in the expected direction – more educated teachers lead
students’ to spend more time in school – the other four are statistically insignificant, with two
negative and two positive.
The findings for teacher experience are puzzling. While on the one hand six of the seven
estimates are positive and two are significantly positive, the one that is negative is significantly
negative, so that when one considers only the estimates that are statistically significant one is
negative and two are positive. Thus there seems to be a positive impact, but it may be prudent to
examine only the studies that are of higher quality (which is done below).
Finally, the three estimates of the impact of in-service teacher training are similar but
give an unexpected result: all three are negative and one is significantly negative. Given that
39
there are only two studies, one cannot draw a strong conclusion. Yet it is reasonable to conclude
that the small amount of evidence that exists provides no support for the conjecture that in-
service teacher training leads to increased student time in school.
The last three variables in Table 12 focus on school organization. For the first, the pupil-
teacher ratio, five of the seven estimates are statistically insignificant (of which three are
negative and two are positive). The two that are significant, which are from the same study,
show a positive impact. At first glance, this is an unexpected result; a higher pupil-teacher ratio
would have a negative effect on learning and so would make time in school less valuable. On
the other hand, schools that are attractive for unobserved reasons will increase student enrollment
and years of schooling, which will lead to a positive correlation between time in school and the
pupil-teacher ratio that is not necessarily a causal effect. This makes it difficult for any study
(with the possible exception of a randomized trial) to determine the impact of the pupil-teacher
ratio on time spent in school.
The cost of enrolling in school (e.g. tuition) should have little direct effect on learning,
but other things being equal it should reduce time spent in school. Of the six estimates shown in
Table 12, five are negative while only one is positive. However, all six of the estimates are
statistically insignificant, so there is not strong evidence that a higher cost of enrolling in school
will lead to lower enrollment and reduced years of completed schooling. As with the pupil-
teacher ratio, there could be serious estimation problems; schools that are more expensive may
be attractive in unobserved ways, which will lead to upward bias of the impact of the cost of
attending school.
40
Finally, two studies examined merit based scholarships, producing three sets of estimates.
Two estimates are positive while one is negative, yet none of the estimates is statistically
significant. Thus there is no clear impact of merit scholarships on time spent in school.
2. The 43 High Quality Studies. Table 13 also examines the impacts of school and
teacher variables on students’ time in school, but it considers only the 43 high quality studies, of
which 14 examined the impacts of those variables on time in school. Turning to school
infrastructure and pedagogical materials, the results are identical to those in Table 12 for
textbooks and workbooks, roof, walls and floors, and building new schools, because for those
categories all of the studies were high quality studies. In contrast, neither library nor school
quality index appears because neither had two or more high quality studies.
The results pertaining to teacher characteristics in Table 13 are also almost identical to
those in Table 12; of the three types of teacher characteristics considered (teacher education
teacher experience, and teacher in-service training) almost all of the studies are high quality
studies. The only exception is teacher experience, yet even here four of the five studies from the
full set of 79 are high quality studies; for these four studies the impact of teacher experience on
time in school is mixed, with one study finding a significant positive effect, another finding a
significant negative effect, and three finding positive but insignificant effects.
Finally, for the three school organization variables (pupil-teacher ratio, cost of attending
and merit-based scholarships) the results in Table 13 are identical to those in Table 12 since all
of the studies for each of those variables are considered to be high quality studies.
3. The 13 Randomized Trials. Lastly, Table 14 examines six randomized control trials
that have estimated impacts of school and teacher variables on students’ time in school. Two of
these studies examined the impact of providing textbooks or workbooks; two of the three
41
estimates in these two studies found significantly positive effects. There were also two studies of
the impact of building new schools; both found significantly positive impacts on time in school.
In contrast, there is no significant impact of merit based scholarships, with one estimate
insignificantly negative and the other insignificantly positive. Similarly, the one estimate of
school-provided meals is statistically insignificant.
VI. Conclusion and Priorities for Future Research
By describing the results sequentially by specific items and quality of studies, it is
difficult to see the overall picture. The results across this review of the literature from 1990 to
2010 are summarized in Tables 15 and 16. Table 15 does this for the results of studies that focus
on students learning, as measured by test scores, while Table 16 does the same for the results for
students’ time in school.
Table 15 summarizes the impacts of 35 different school and teacher variables on student
learning. When all 79 studies are examined, about half of these variables seem to have clear
negative or positive impacts on student learning. However, when the evidence is limited to the
43 high quality studies, only a few inputs appear to have unambiguous results.
Perhaps the clearest finding is that having a fully functioning school – one with better
quality roofs, walls or floors, with desks, tables and chairs, and with a school library – appears
conducive to student learning. Of course, these attributes may partially be signaling an interest
in, and commitment to, providing a quality education. On the personnel side, the most consistent
results reflect having teachers with greater knowledge of the subjects they teach, having a longer
42
school day, and providing tutoring. Additionally, and again unsurprising, it makes a difference if
the teacher shows up for work; teacher absence has a clear negative effect on learning.
Randomized trials arguably provide the most rigorous evidence, but for most variables
there is either no study at all, or at most one study. Thus, it is currently difficult to draw general
conclusions from the available results. Somewhat surprisingly, however, for the two variables
with more than one RCT (textbooks/workbooks and computers), no clear results have been
found.
On the other hand, perhaps the most useful conclusion to draw for policy is that there is
little empirical support for a wide variety of school and teacher characteristics that some
observers may view as priorities for school spending. While one could argue that the absence of
strong results simply reflects insufficient data (low statistical power) to detect systematic effects,
it could also be the case that most of the effects are themselves small. Quite plausibly, part of
the ambiguity comes from heterogeneous treatment effects, where the impact of various inputs
depends importantly on the local circumstances, demands, and capacities.
Turning to Table 16, there is also meager evidence at best for what can be done to
increase students’ time in school and attainment.20 Focusing on the 43 high quality studies, only
two findings receive fairly clear support: building more schools increases students’ time in
school, and in-service teacher training reduces student time in school. The latter result is
unexpected and admittedly is based on only two studies, but it may reflect that in-service teacher
training takes teachers out of the classroom, so that the primary effect is similar to that of teacher
absence. The randomized trials to date again provide insufficient evidence for clear policy
20 One exception to this lack of evidence is the finding that conditional cash transfer programs induce greater school attendance. This is discussed in detail in Behrman, Parker, and Todd (2011).
43
directions, although if many more were conducted it is possible that clearer policy conclusions
could be drawn.
Taken as a whole, these studies are consistent with much of the current policy discussion
that the focus should shift from basic school and teacher characteristics to changing incentives in
schools and permitting more local decision making; if the effects are generally small or if they
depend on, say, local capacity, it is then difficult to set overall resource policies at the national or
international level. Indeed, the variation in results may reflect that some interventions work well
in some contexts but have no effect, or even negative effects, in other contexts. This evidence
would be consistent with cross-country evidence that generally indicates positive effects from
more local autonomy in decision making (at least when there is also an accountability system in
place); see Hanushek and Woessmann (2011).
This state of affairs raises the question about the value of research on the effect of basic
school and teacher characteristics on student learning and time in school. The various research
efforts have led to many ambiguous results – either because there are few consistent results or
because the methodological problems are too large. A deeper appreciation for the
methodological issues in obtaining causal estimates has emerged in the past two decades. Both
the inconsistent results from past work and the distinct possibility of rather deep methodological
problems suggest that a continued quest for identifying the specific inputs of teachers and
schools from cross-sectional analyses of samples of convenience is unlikely to lead to strong
policy guidance.
But a complementary conclusion is that conducting research into policy relevant aspects
of schooling often requires early researcher involvement in the design and data collection before
programs or policies are introduced. For several classes of policy issues – largely ones involving
44
well-identified programs and specific resources – obtaining randomized or quasi-randomized
observations is key to instilling confidence in research results. RCTs provide the easiest to
understand research design, and it is probably the case that researchers have historically under-
invested in their use. At the same time, actually implementing these can be time-consuming,
difficult, and expensive – leading to a limited number of such analyses to date, although a larger
number are either currently underway or will soon be started.
Two other kinds of approaches offer promise. First, the availability of panel data
provides the possibility of addressing a wider range of issues while still being sensitive to the
threats to statistical analysis. For example, much of the recent analysis of large panels of
administrative data in the U.S. has shown how panel data techniques can reduce analytical
problems while opening up a much wider range of analyses.
Second, with the cooperation of government policy makers, randomization in the
implementation of education programs across villages or over time can provide the kinds of
variation that are needed to evaluate the impacts of these programs. This approach is distinct
from researcher-driven RCTs because the programs being evaluated are chosen by the
government. Further, given sufficient training, governments can evaluate these interventions
with no need to bring in expatriate academic researchers. More specifically, this approach builds
on local ideas for programs that local policy makers believe are likely to lead to improvements,
and it also capitalizes on the fact that funding for many programs is frequently insufficient to
introduce a new program across all possible locations. By staggering the introduction of a given
program over time, it is possible to develop a built-in control group to assess the impact of that
program. But here is where early involvement (by either higher level decision makers or outside
researchers) is essential, because, for example, giving the program first to the most politically
45
powerful locales or to the most needy locales (as opposed to a random selection of locales)
reduces, if not eliminates, the analytical possibilities.
Part of future success in designing and implementing effective education policies is
introducing an evaluation mindset. The absence of interest in learning about the efficacy of new
programs or policies is not restricted to developing countries, but is indeed present in developed
countries. But the evidence to date reviewed in this paper underscores the importance of this
perspective. This review of existing evidence suggests little in the form of “best policies” that
can readily be introduced through central provision or through regulatory approaches. This
realization implies that progress is likely to proceed with local experimentation built on local
knowledge and capacities. Yet local experimentation is unlikely to be successful unless there is
a process of evaluation that works to continue the policies and programs that rigorous
evaluations demonstrate are successful and to discontinue those that such evaluations indicate are
unsuccessful.
One other aspect of this review deserves mention. Nothing has been said along the way
about the costs of any programs. Clearly, effective policy needs to consider both the benefit side
and the cost side, particularly in developing countries where resource constraints are binding at
low levels. However, very few of the existing evaluations have provided solid information about
costs of programs and policies. This topic is further addressed by Dhaliwal, Duflo, Glennerster,
and Tulloch (2011).
At the beginning of this paper we noted that education, and especially the skills
developed through high-quality education, can have an enormous positive impact on
individuals’ lives and on countries’ economic growth. Yet education is a complicated process,
and in both developed and developing countries policymakers and researchers are trying to
46
understand which policies are most likely to improve education outcomes. In this review we
have found that, despite a large and increasingly sophisticated literature, remarkably little is
known about the impact of education policies on student outcomes in developing countries.
There are two likely reasons for this. The first is that what works best may vary considerably
across countries and even within countries, which implies that future research should attempt to
understand which policies work best in which settings. The second is that much of the literature
has focused on basic school and teacher characteristics, when in fact the ways that schools are
organized may matter most. Such a conclusion implies that future research should focus on how
schools are organized and the incentives faced by teachers, administrators, parents and students.
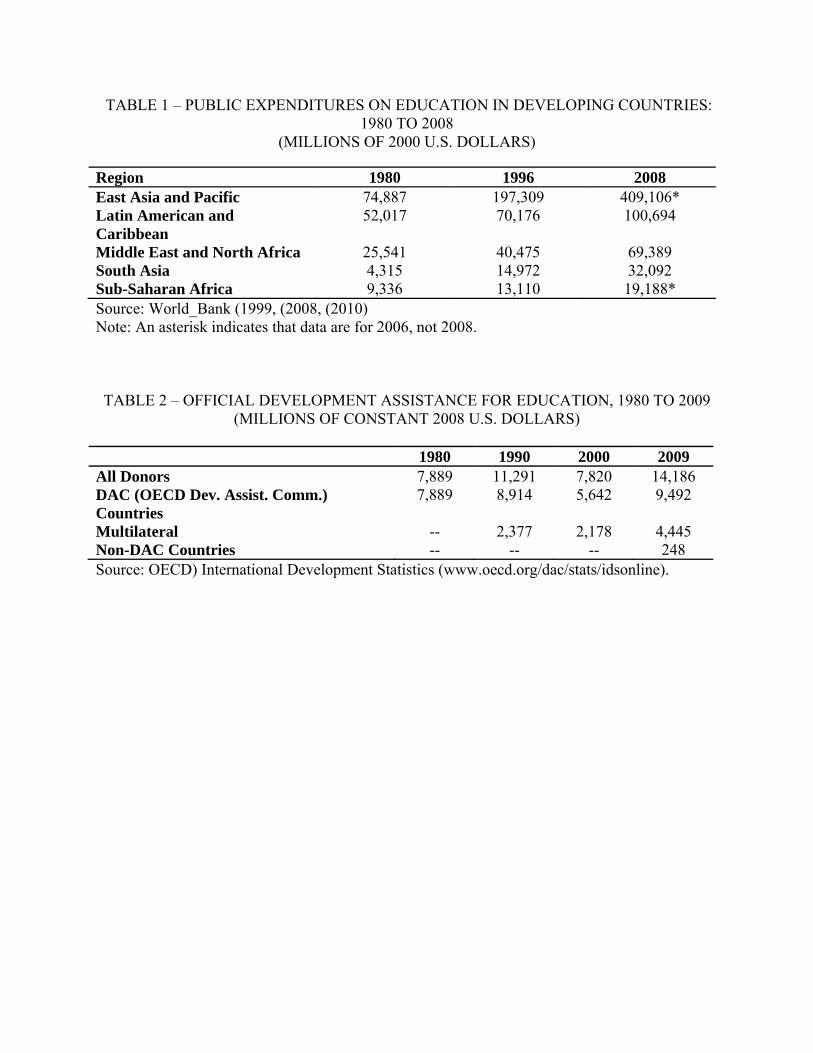
TABLE 1 – PUBLIC EXPENDITURES ON EDUCATION IN DEVELOPING COUNTRIES: 1980 TO 2008
(MILLIONS OF 2000 U.S. DOLLARS)
Region 1980 1996 2008 East Asia and Pacific 74,887 197,309 409,106* Latin American and Caribbean
52,017 70,176 100,694
Middle East and North Africa 25,541 40,475 69,389 South Asia 4,315 14,972 32,092 Sub-Saharan Africa 9,336 13,110 19,188* Source: World_Bank (1999, (2008, (2010) Note: An asterisk indicates that data are for 2006, not 2008. TABLE 2 – OFFICIAL DEVELOPMENT ASSISTANCE FOR EDUCATION, 1980 TO 2009
(MILLIONS OF CONSTANT 2008 U.S. DOLLARS) 1980 1990 2000 2009 All Donors 7,889 11,291 7,820 14,186 DAC (OECD Dev. Assist. Comm.) Countries
7,889 8,914 5,642 9,492
Multilateral -- 2,377 2,178 4,445 Non-DAC Countries -- -- -- 248 Source: OECD) International Development Statistics (www.oecd.org/dac/stats/idsonline).
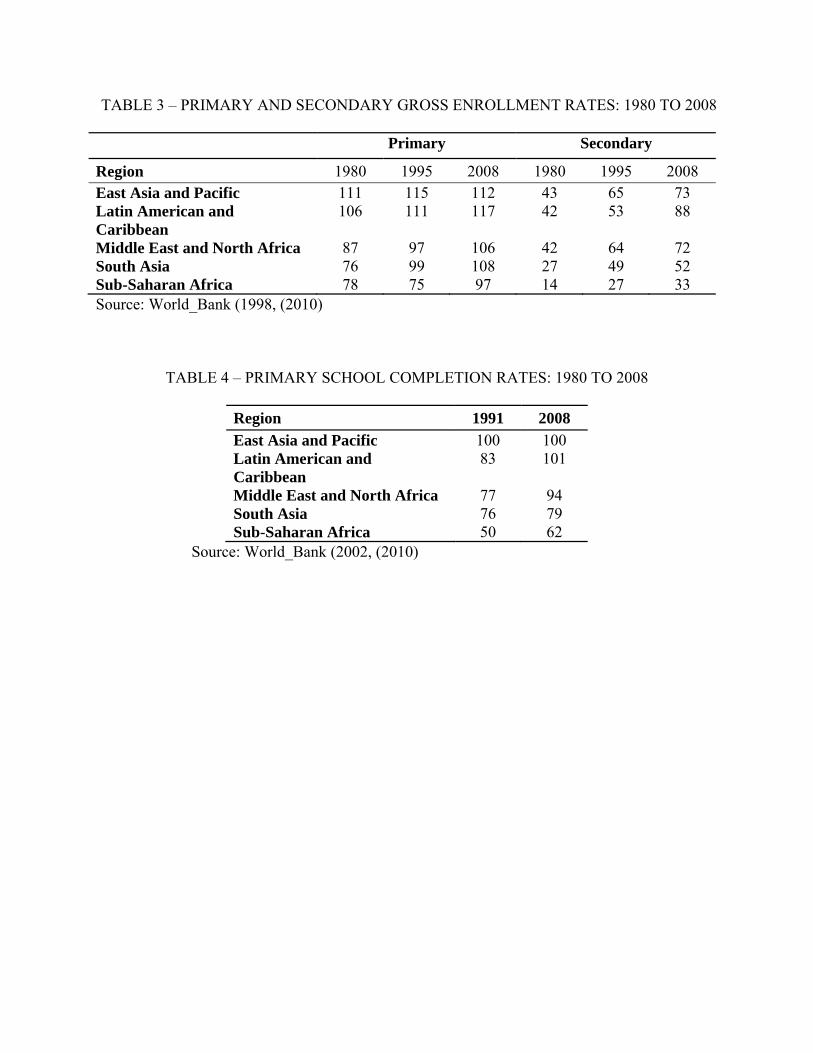
TABLE 3 – PRIMARY AND SECONDARY GROSS ENROLLMENT RATES: 1980 TO 2008
Primary Secondary
Region 1980 1995 2008 1980 1995 2008 East Asia and Pacific 111 115 112 43 65 73 Latin American and Caribbean
106 111 117 42 53 88
Middle East and North Africa 87 97 106 42 64 72 South Asia 76 99 108 27 49 52 Sub-Saharan Africa 78 75 97 14 27 33 Source: World_Bank (1998, (2010)
TABLE 4 – PRIMARY SCHOOL COMPLETION RATES: 1980 TO 2008
Region 1991 2008
East Asia and Pacific 100 100 Latin American and Caribbean
83 101
Middle East and North Africa 77 94 South Asia 76 79 Sub-Saharan Africa 50 62
Source: World_Bank (2002, (2010)
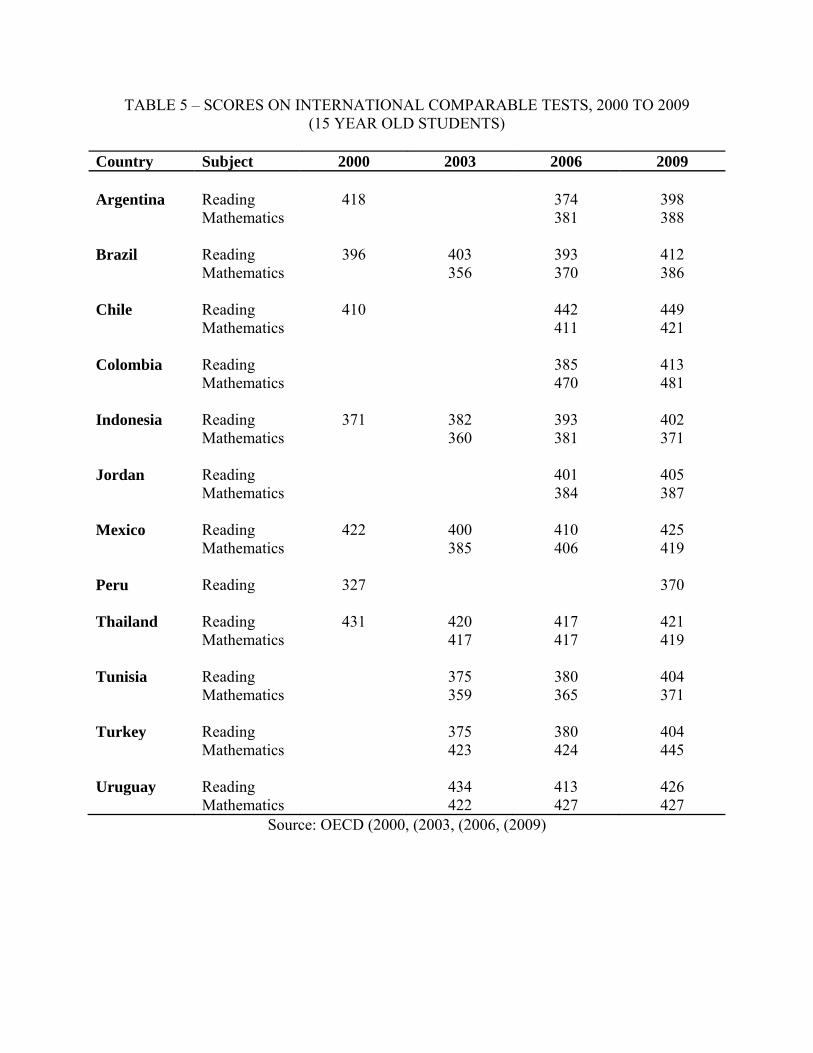
TABLE 5 – SCORES ON INTERNATIONAL COMPARABLE TESTS, 2000 TO 2009 (15 YEAR OLD STUDENTS)
Country Subject 2000 2003 2006 2009 Argentina Reading 418 374 398 Mathematics 381 388 Brazil Reading 396 403 393 412 Mathematics 356 370 386 Chile Reading 410 442 449 Mathematics 411 421 Colombia Reading 385 413 Mathematics 470 481 Indonesia Reading 371 382 393 402 Mathematics 360 381 371 Jordan Reading 401 405 Mathematics 384 387 Mexico Reading 422 400 410 425 Mathematics 385 406 419 Peru Reading 327 370 Thailand Reading 431 420 417 421 Mathematics 417 417 419 Tunisia Reading 375 380 404 Mathematics 359 365 371 Turkey Reading 375 380 404 Mathematics 423 424 445 Uruguay Reading 434 413 426 Mathematics 422 427 427
Source: OECD (2000, (2003, (2006, (2009)
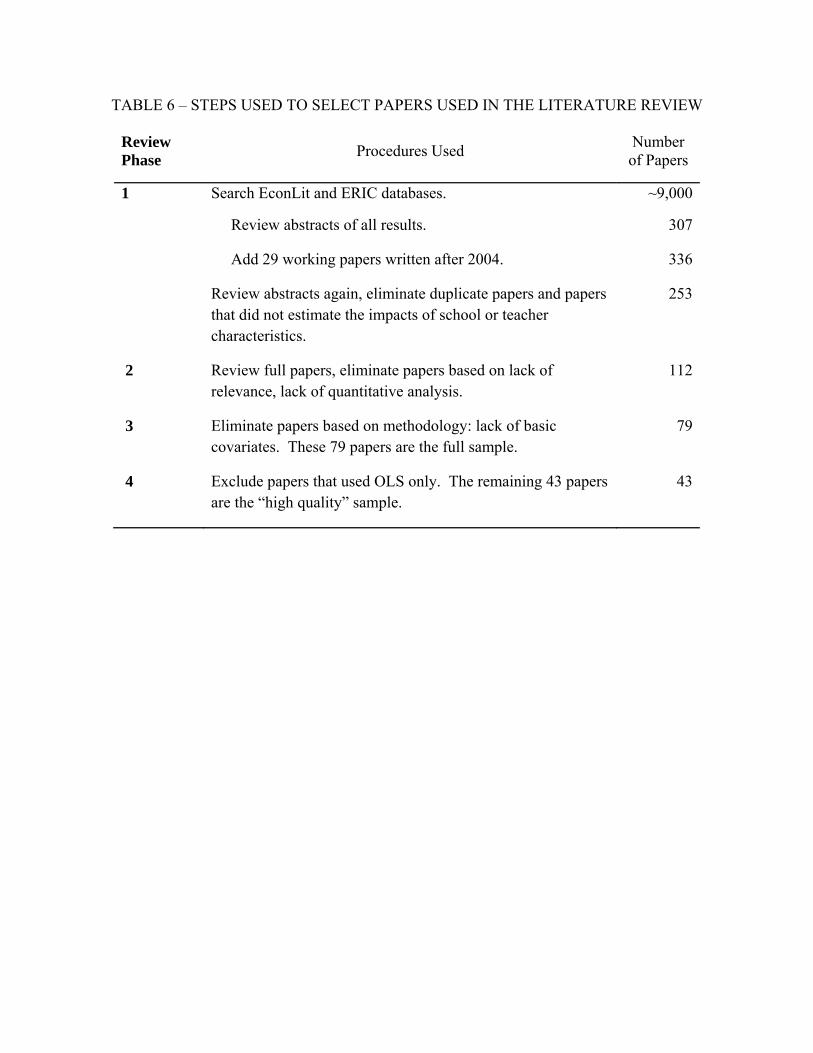
TABLE 6 – STEPS USED TO SELECT PAPERS USED IN THE LITERATURE REVIEW
Review Phase
Procedures Used Number of Papers
1 Search EconLit and ERIC databases. ~9,000
Review abstracts of all results. 307
Add 29 working papers written after 2004. 336
Review abstracts again, eliminate duplicate papers and papers that did not estimate the impacts of school or teacher characteristics.
253
2 Review full papers, eliminate papers based on lack of relevance, lack of quantitative analysis.
112
3 Eliminate papers based on methodology: lack of basic covariates. These 79 papers are the full sample.
79
4 Exclude papers that used OLS only. The remaining 43 papers are the “high quality” sample.
43
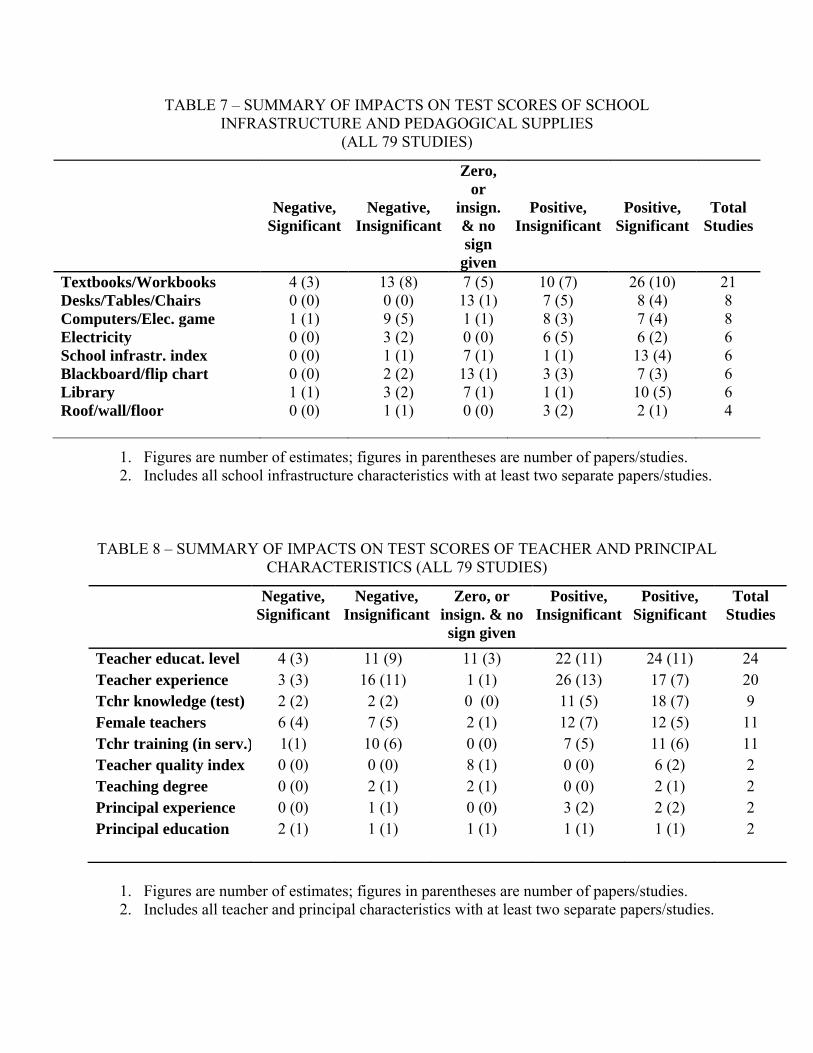
TABLE 7 – SUMMARY OF IMPACTS ON TEST SCORES OF SCHOOL INFRASTRUCTURE AND PEDAGOGICAL SUPPLIES
(ALL 79 STUDIES)
Negative,
SignificantNegative,
Insignificant
Zero, or
insign. & no sign
given
Positive, Insignificant
Positive, Significant
Total Studies
Textbooks/Workbooks 4 (3) 13 (8) 7 (5) 10 (7) 26 (10) 21 Desks/Tables/Chairs 0 (0) 0 (0) 13 (1) 7 (5) 8 (4) 8 Computers/Elec. game 1 (1) 9 (5) 1 (1) 8 (3) 7 (4) 8 Electricity 0 (0) 3 (2) 0 (0) 6 (5) 6 (2) 6 School infrastr. index 0 (0) 1 (1) 7 (1) 1 (1) 13 (4) 6 Blackboard/flip chart 0 (0) 2 (2) 13 (1) 3 (3) 7 (3) 6 Library 1 (1) 3 (2) 7 (1) 1 (1) 10 (5) 6 Roof/wall/floor 0 (0) 1 (1) 0 (0) 3 (2) 2 (1) 4
1. Figures are number of estimates; figures in parentheses are number of papers/studies. 2. Includes all school infrastructure characteristics with at least two separate papers/studies.
TABLE 8 – SUMMARY OF IMPACTS ON TEST SCORES OF TEACHER AND PRINCIPAL CHARACTERISTICS (ALL 79 STUDIES)
Negative, Significant
Negative, Insignificant
Zero, or insign. & no sign given
Positive, Insignificant
Positive, Significant
Total Studies
Teacher educat. level 4 (3) 11 (9) 11 (3) 22 (11) 24 (11) 24 Teacher experience 3 (3) 16 (11) 1 (1) 26 (13) 17 (7) 20 Tchr knowledge (test) 2 (2) 2 (2) 0 (0) 11 (5) 18 (7) 9 Female teachers 6 (4) 7 (5) 2 (1) 12 (7) 12 (5) 11 Tchr training (in serv.) 1(1) 10 (6) 0 (0) 7 (5) 11 (6) 11 Teacher quality index 0 (0) 0 (0) 8 (1) 0 (0) 6 (2) 2 Teaching degree 0 (0) 2 (1) 2 (1) 0 (0) 2 (1) 2 Principal experience 0 (0) 1 (1) 0 (0) 3 (2) 2 (2) 2 Principal education 2 (1) 1 (1) 1 (1) 1 (1) 1 (1) 2
1. Figures are number of estimates; figures in parentheses are number of papers/studies. 2. Includes all teacher and principal characteristics with at least two separate papers/studies.
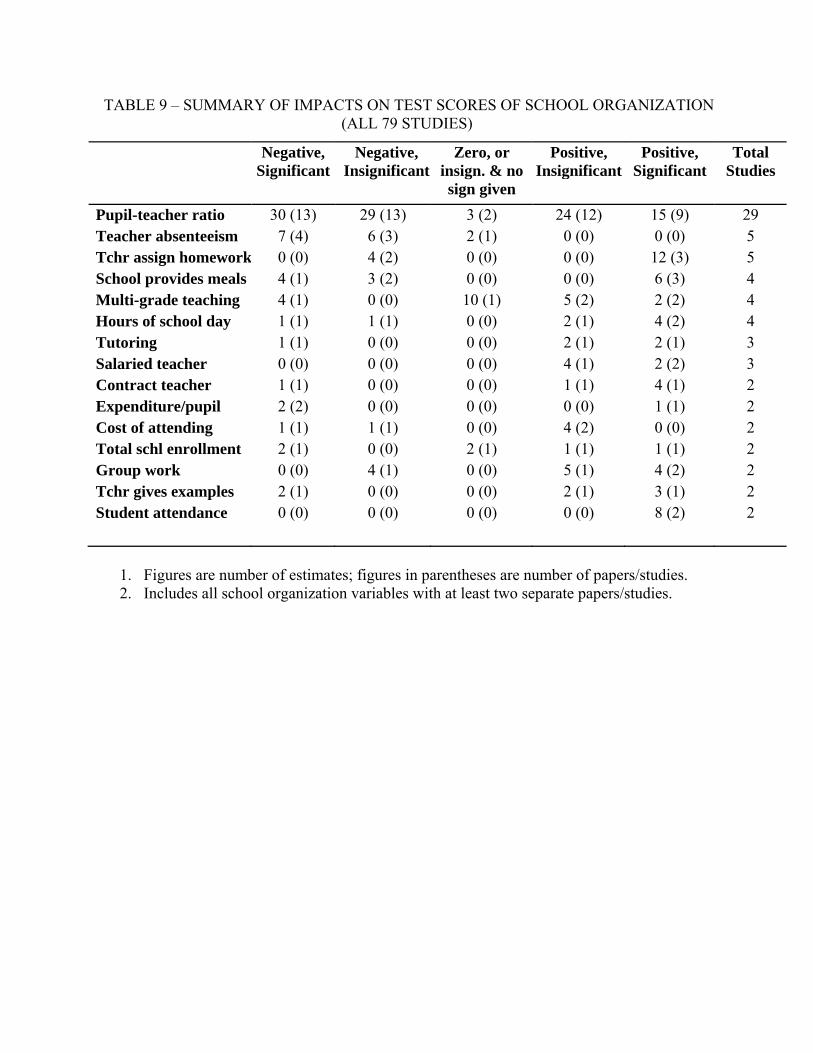
TABLE 9 – SUMMARY OF IMPACTS ON TEST SCORES OF SCHOOL ORGANIZATION (ALL 79 STUDIES)
Negative, Significant
Negative, Insignificant
Zero, or insign. & no sign given
Positive, Insignificant
Positive, Significant
Total Studies
Pupil-teacher ratio 30 (13) 29 (13) 3 (2) 24 (12) 15 (9) 29 Teacher absenteeism 7 (4) 6 (3) 2 (1) 0 (0) 0 (0) 5 Tchr assign homework 0 (0) 4 (2) 0 (0) 0 (0) 12 (3) 5 School provides meals 4 (1) 3 (2) 0 (0) 0 (0) 6 (3) 4 Multi-grade teaching 4 (1) 0 (0) 10 (1) 5 (2) 2 (2) 4 Hours of school day 1 (1) 1 (1) 0 (0) 2 (1) 4 (2) 4 Tutoring 1 (1) 0 (0) 0 (0) 2 (1) 2 (1) 3 Salaried teacher 0 (0) 0 (0) 0 (0) 4 (1) 2 (2) 3 Contract teacher 1 (1) 0 (0) 0 (0) 1 (1) 4 (1) 2 Expenditure/pupil 2 (2) 0 (0) 0 (0) 0 (0) 1 (1) 2 Cost of attending 1 (1) 1 (1) 0 (0) 4 (2) 0 (0) 2 Total schl enrollment 2 (1) 0 (0) 2 (1) 1 (1) 1 (1) 2 Group work 0 (0) 4 (1) 0 (0) 5 (1) 4 (2) 2 Tchr gives examples 2 (1) 0 (0) 0 (0) 2 (1) 3 (1) 2 Student attendance 0 (0) 0 (0) 0 (0) 0 (0) 8 (2) 2
1. Figures are number of estimates; figures in parentheses are number of papers/studies. 2. Includes all school organization variables with at least two separate papers/studies.
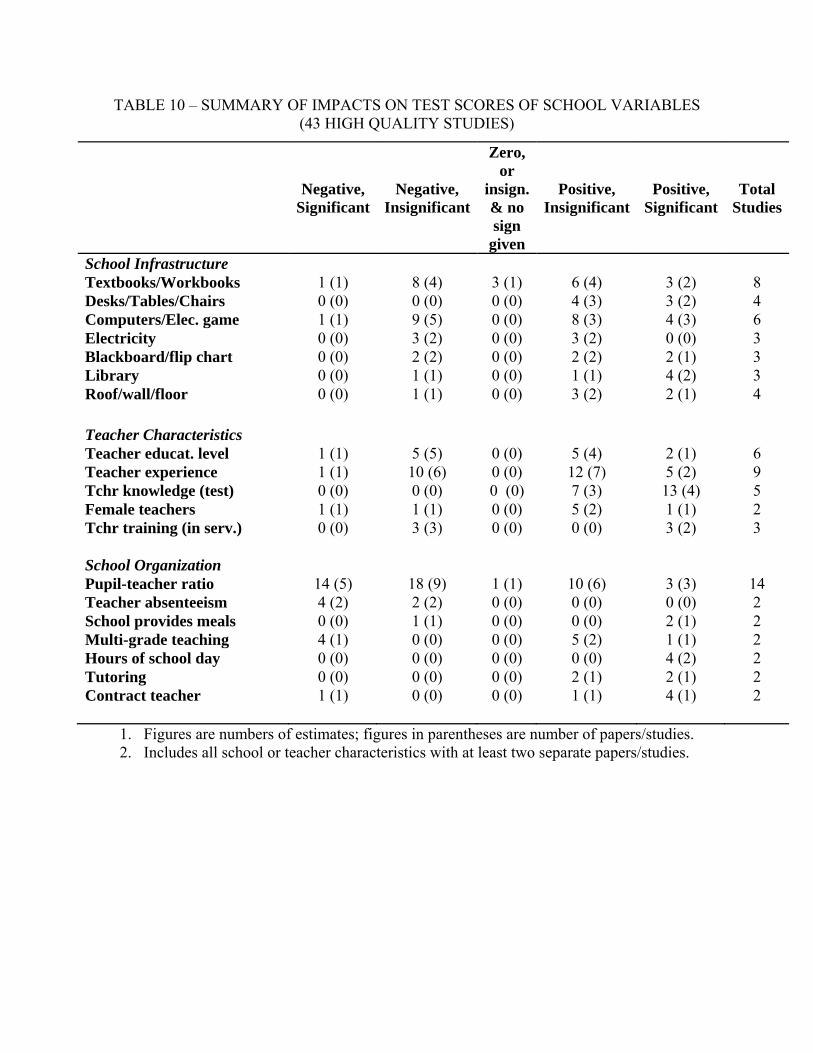
TABLE 10 – SUMMARY OF IMPACTS ON TEST SCORES OF SCHOOL VARIABLES (43 HIGH QUALITY STUDIES)
Negative,
SignificantNegative,
Insignificant
Zero, or
insign. & no sign
given
Positive, Insignificant
Positive, Significant
Total Studies
School Infrastructure Textbooks/Workbooks 1 (1) 8 (4) 3 (1) 6 (4) 3 (2) 8 Desks/Tables/Chairs 0 (0) 0 (0) 0 (0) 4 (3) 3 (2) 4 Computers/Elec. game 1 (1) 9 (5) 0 (0) 8 (3) 4 (3) 6 Electricity 0 (0) 3 (2) 0 (0) 3 (2) 0 (0) 3 Blackboard/flip chart 0 (0) 2 (2) 0 (0) 2 (2) 2 (1) 3 Library 0 (0) 1 (1) 0 (0) 1 (1) 4 (2) 3 Roof/wall/floor 0 (0) 1 (1) 0 (0) 3 (2) 2 (1) 4
Teacher Characteristics Teacher educat. level 1 (1) 5 (5) 0 (0) 5 (4) 2 (1) 6 Teacher experience 1 (1) 10 (6) 0 (0) 12 (7) 5 (2) 9 Tchr knowledge (test) 0 (0) 0 (0) 0 (0) 7 (3) 13 (4) 5 Female teachers 1 (1) 1 (1) 0 (0) 5 (2) 1 (1) 2 Tchr training (in serv.) 0 (0) 3 (3) 0 (0) 0 (0) 3 (2) 3 School Organization Pupil-teacher ratio 14 (5) 18 (9) 1 (1) 10 (6) 3 (3) 14 Teacher absenteeism 4 (2) 2 (2) 0 (0) 0 (0) 0 (0) 2 School provides meals 0 (0) 1 (1) 0 (0) 0 (0) 2 (1) 2 Multi-grade teaching 4 (1) 0 (0) 0 (0) 5 (2) 1 (1) 2 Hours of school day 0 (0) 0 (0) 0 (0) 0 (0) 4 (2) 2 Tutoring 0 (0) 0 (0) 0 (0) 2 (1) 2 (1) 2 Contract teacher 1 (1) 0 (0) 0 (0) 1 (1) 4 (1) 2
1. Figures are numbers of estimates; figures in parentheses are number of papers/studies. 2. Includes all school or teacher characteristics with at least two separate papers/studies.
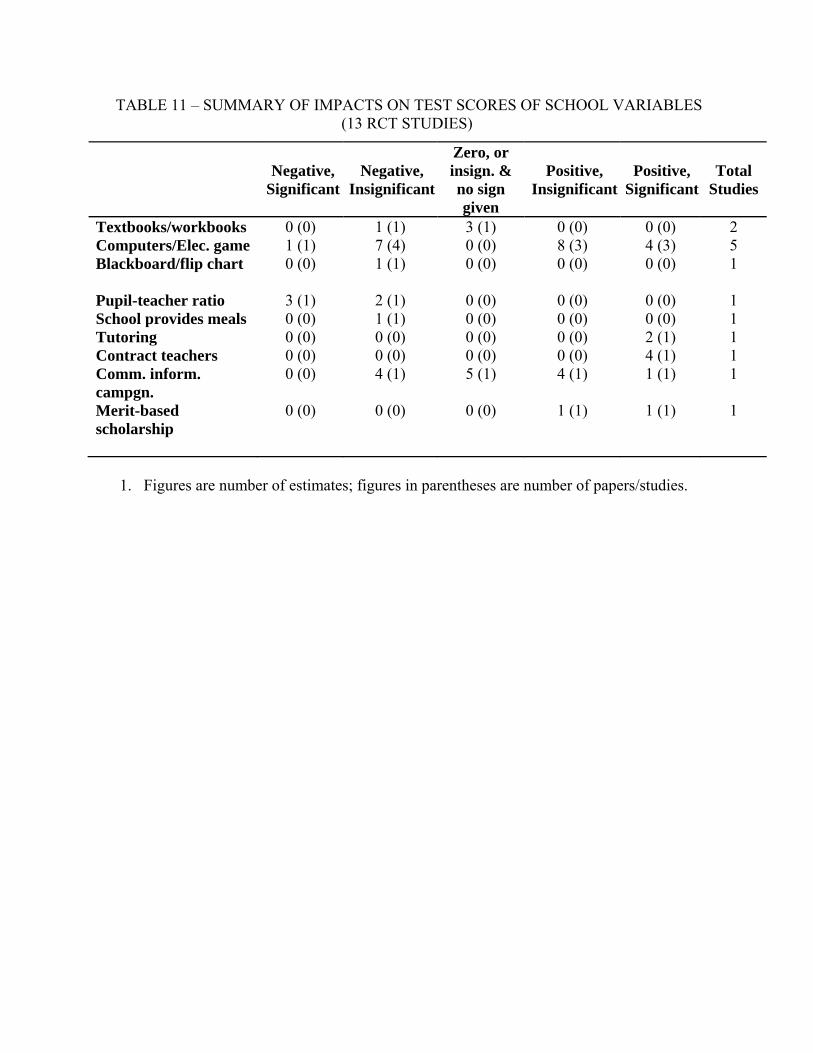
TABLE 11 – SUMMARY OF IMPACTS ON TEST SCORES OF SCHOOL VARIABLES (13 RCT STUDIES)
Negative,
SignificantNegative,
Insignificant
Zero, or insign. & no sign given
Positive, Insignificant
Positive, Significant
Total Studies
Textbooks/workbooks 0 (0) 1 (1) 3 (1) 0 (0) 0 (0) 2 Computers/Elec. game 1 (1) 7 (4) 0 (0) 8 (3) 4 (3) 5 Blackboard/flip chart 0 (0) 1 (1) 0 (0) 0 (0) 0 (0) 1 Pupil-teacher ratio 3 (1) 2 (1) 0 (0) 0 (0) 0 (0) 1 School provides meals 0 (0) 1 (1) 0 (0) 0 (0) 0 (0) 1 Tutoring 0 (0) 0 (0) 0 (0) 0 (0) 2 (1) 1 Contract teachers 0 (0) 0 (0) 0 (0) 0 (0) 4 (1) 1 Comm. inform. campgn.
0 (0) 4 (1) 5 (1) 4 (1) 1 (1) 1
Merit-based scholarship
0 (0) 0 (0) 0 (0) 1 (1) 1 (1) 1
1. Figures are number of estimates; figures in parentheses are number of papers/studies.
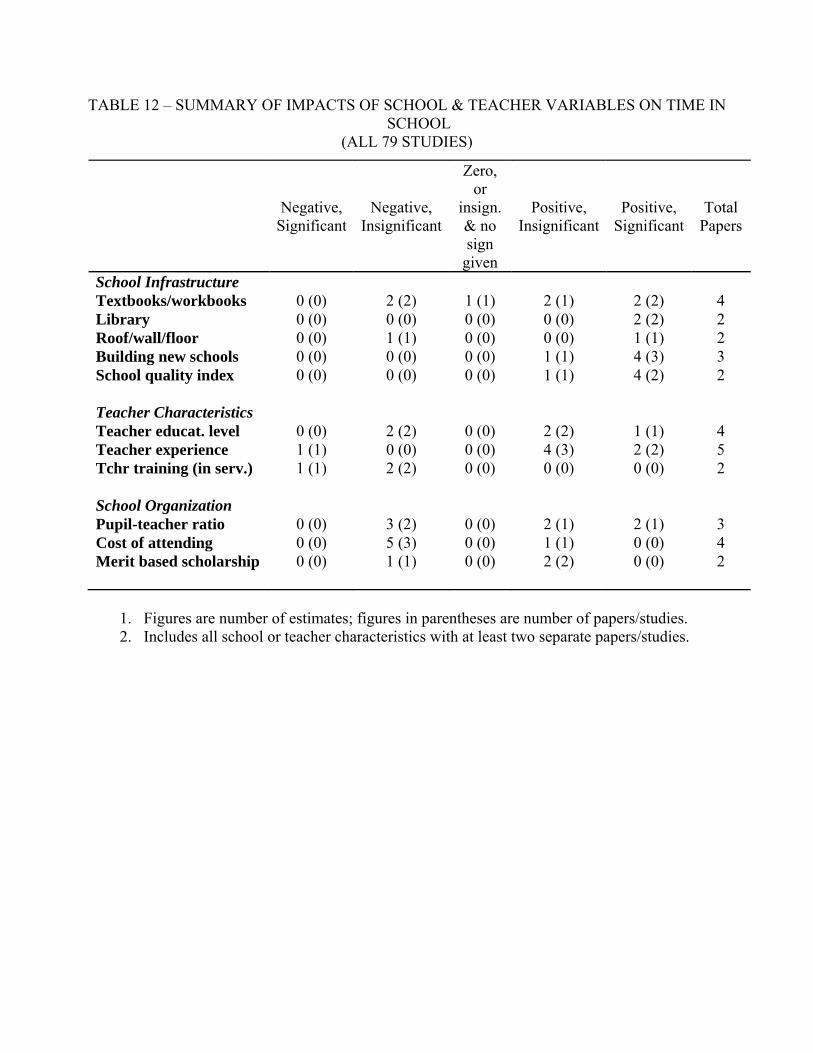
TABLE 12 – SUMMARY OF IMPACTS OF SCHOOL & TEACHER VARIABLES ON TIME IN SCHOOL
(ALL 79 STUDIES)
Negative,
SignificantNegative,
Insignificant
Zero, or
insign. & no sign
given
Positive, Insignificant
Positive, Significant
Total Papers
School Infrastructure Textbooks/workbooks 0 (0) 2 (2) 1 (1) 2 (1) 2 (2) 4 Library 0 (0) 0 (0) 0 (0) 0 (0) 2 (2) 2 Roof/wall/floor 0 (0) 1 (1) 0 (0) 0 (0) 1 (1) 2 Building new schools 0 (0) 0 (0) 0 (0) 1 (1) 4 (3) 3 School quality index 0 (0) 0 (0) 0 (0) 1 (1) 4 (2) 2 Teacher Characteristics Teacher educat. level 0 (0) 2 (2) 0 (0) 2 (2) 1 (1) 4 Teacher experience 1 (1) 0 (0) 0 (0) 4 (3) 2 (2) 5 Tchr training (in serv.) 1 (1) 2 (2) 0 (0) 0 (0) 0 (0) 2 School Organization Pupil-teacher ratio 0 (0) 3 (2) 0 (0) 2 (1) 2 (1) 3 Cost of attending 0 (0) 5 (3) 0 (0) 1 (1) 0 (0) 4 Merit based scholarship 0 (0) 1 (1) 0 (0) 2 (2) 0 (0) 2
1. Figures are number of estimates; figures in parentheses are number of papers/studies. 2. Includes all school or teacher characteristics with at least two separate papers/studies.
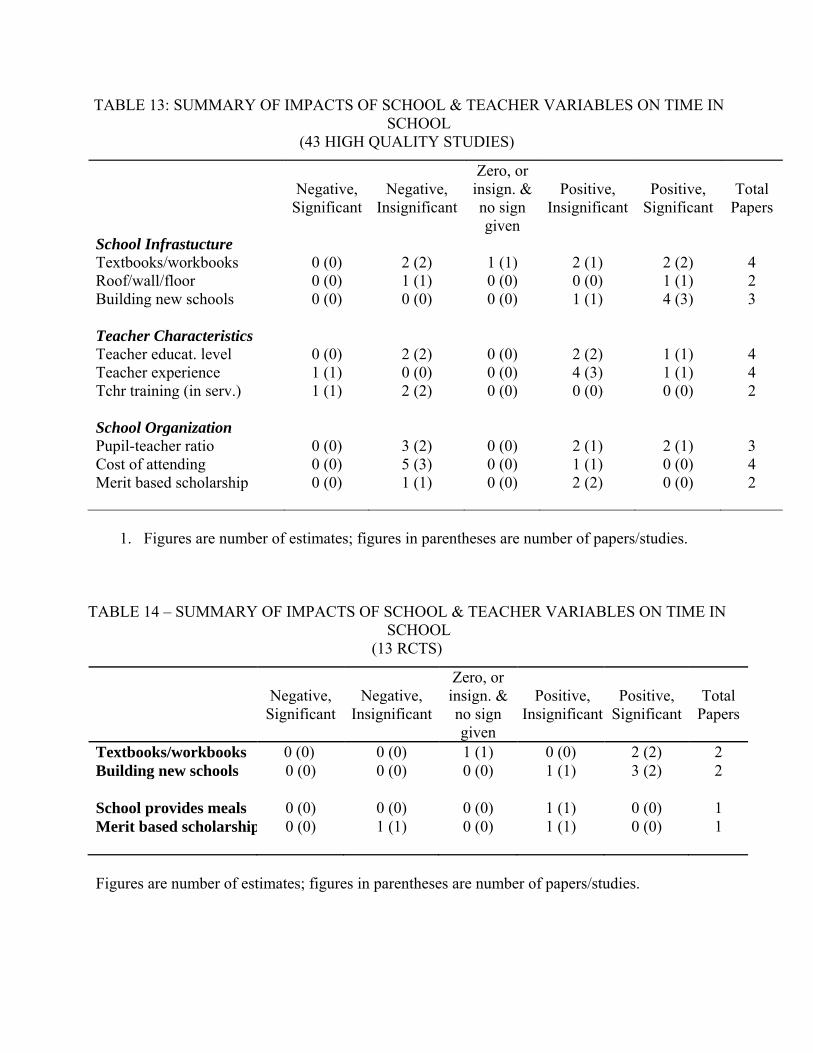
TABLE 13: SUMMARY OF IMPACTS OF SCHOOL & TEACHER VARIABLES ON TIME IN SCHOOL
(43 HIGH QUALITY STUDIES)
Negative,
SignificantNegative,
Insignificant
Zero, or insign. & no sign given
Positive, Insignificant
Positive, Significant
Total Papers
School Infrastucture Textbooks/workbooks 0 (0) 2 (2) 1 (1) 2 (1) 2 (2) 4 Roof/wall/floor 0 (0) 1 (1) 0 (0) 0 (0) 1 (1) 2 Building new schools 0 (0) 0 (0) 0 (0) 1 (1) 4 (3) 3 Teacher Characteristics Teacher educat. level 0 (0) 2 (2) 0 (0) 2 (2) 1 (1) 4 Teacher experience 1 (1) 0 (0) 0 (0) 4 (3) 1 (1) 4 Tchr training (in serv.) 1 (1) 2 (2) 0 (0) 0 (0) 0 (0) 2 School Organization Pupil-teacher ratio 0 (0) 3 (2) 0 (0) 2 (1) 2 (1) 3 Cost of attending 0 (0) 5 (3) 0 (0) 1 (1) 0 (0) 4 Merit based scholarship 0 (0) 1 (1) 0 (0) 2 (2) 0 (0) 2
1. Figures are number of estimates; figures in parentheses are number of papers/studies.
TABLE 14 – SUMMARY OF IMPACTS OF SCHOOL & TEACHER VARIABLES ON TIME IN SCHOOL
(13 RCTS)
Negative,
Significant Negative,
Insignificant
Zero, or insign. & no sign given
Positive, Insignificant
Positive, Significant
Total Papers
Textbooks/workbooks 0 (0) 0 (0) 1 (1) 0 (0) 2 (2) 2 Building new schools 0 (0) 0 (0) 0 (0) 1 (1) 3 (2) 2 School provides meals 0 (0) 0 (0) 0 (0) 1 (1) 0 (0) 1 Merit based scholarship 0 (0) 1 (1) 0 (0) 1 (1) 0 (0) 1
Figures are number of estimates; figures in parentheses are number of papers/studies.
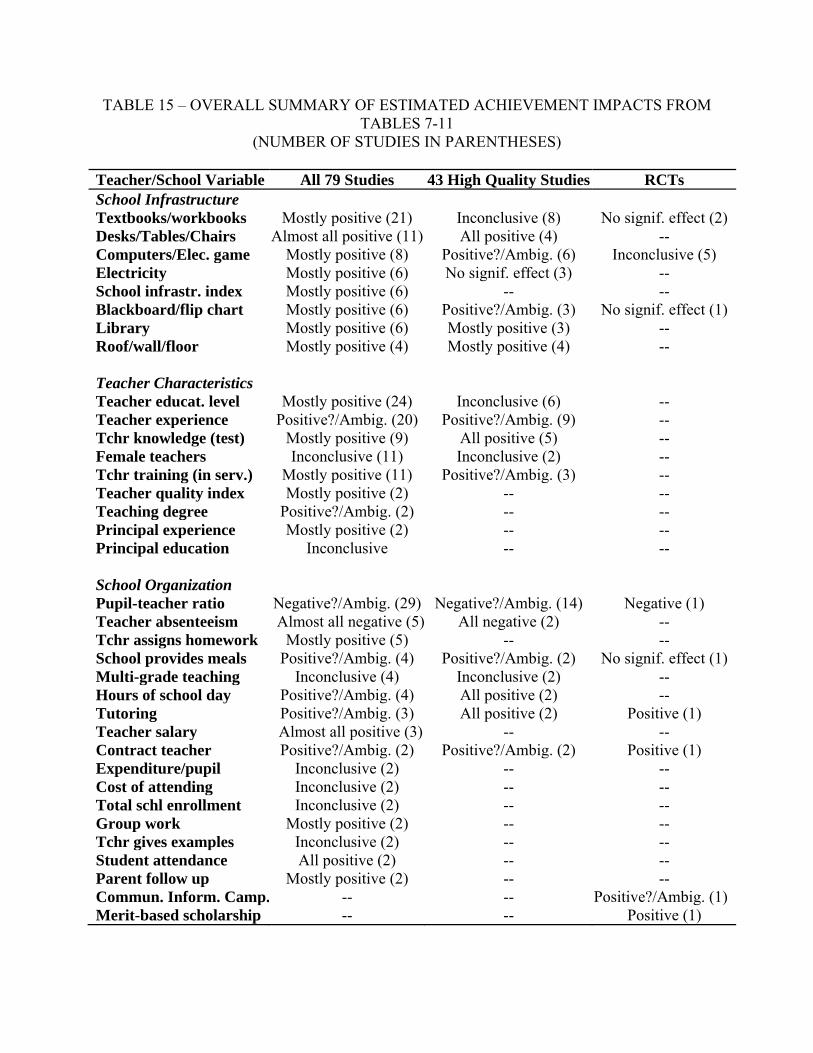
TABLE 15 – OVERALL SUMMARY OF ESTIMATED ACHIEVEMENT IMPACTS FROM TABLES 7-11
(NUMBER OF STUDIES IN PARENTHESES) Teacher/School Variable All 79 Studies 43 High Quality Studies RCTs School Infrastructure Textbooks/workbooks Mostly positive (21) Inconclusive (8) No signif. effect (2) Desks/Tables/Chairs Almost all positive (11) All positive (4) -- Computers/Elec. game Mostly positive (8) Positive?/Ambig. (6) Inconclusive (5) Electricity Mostly positive (6) No signif. effect (3) -- School infrastr. index Mostly positive (6) -- -- Blackboard/flip chart Mostly positive (6) Positive?/Ambig. (3) No signif. effect (1) Library Mostly positive (6) Mostly positive (3) -- Roof/wall/floor Mostly positive (4) Mostly positive (4) -- Teacher Characteristics Teacher educat. level Mostly positive (24) Inconclusive (6) -- Teacher experience Positive?/Ambig. (20) Positive?/Ambig. (9) -- Tchr knowledge (test) Mostly positive (9) All positive (5) -- Female teachers Inconclusive (11) Inconclusive (2) -- Tchr training (in serv.) Mostly positive (11) Positive?/Ambig. (3) -- Teacher quality index Mostly positive (2) -- -- Teaching degree Positive?/Ambig. (2) -- -- Principal experience Mostly positive (2) -- -- Principal education Inconclusive -- -- School Organization Pupil-teacher ratio Negative?/Ambig. (29) Negative?/Ambig. (14) Negative (1) Teacher absenteeism Almost all negative (5) All negative (2) -- Tchr assigns homework Mostly positive (5) -- -- School provides meals Positive?/Ambig. (4) Positive?/Ambig. (2) No signif. effect (1) Multi-grade teaching Inconclusive (4) Inconclusive (2) -- Hours of school day Positive?/Ambig. (4) All positive (2) -- Tutoring Positive?/Ambig. (3) All positive (2) Positive (1) Teacher salary Almost all positive (3) -- -- Contract teacher Positive?/Ambig. (2) Positive?/Ambig. (2) Positive (1) Expenditure/pupil Inconclusive (2) -- -- Cost of attending Inconclusive (2) -- -- Total schl enrollment Inconclusive (2) -- -- Group work Mostly positive (2) -- -- Tchr gives examples Inconclusive (2) -- -- Student attendance All positive (2) -- -- Parent follow up Mostly positive (2) -- -- Commun. Inform. Camp. -- -- Positive?/Ambig. (1) Merit-based scholarship -- -- Positive (1)
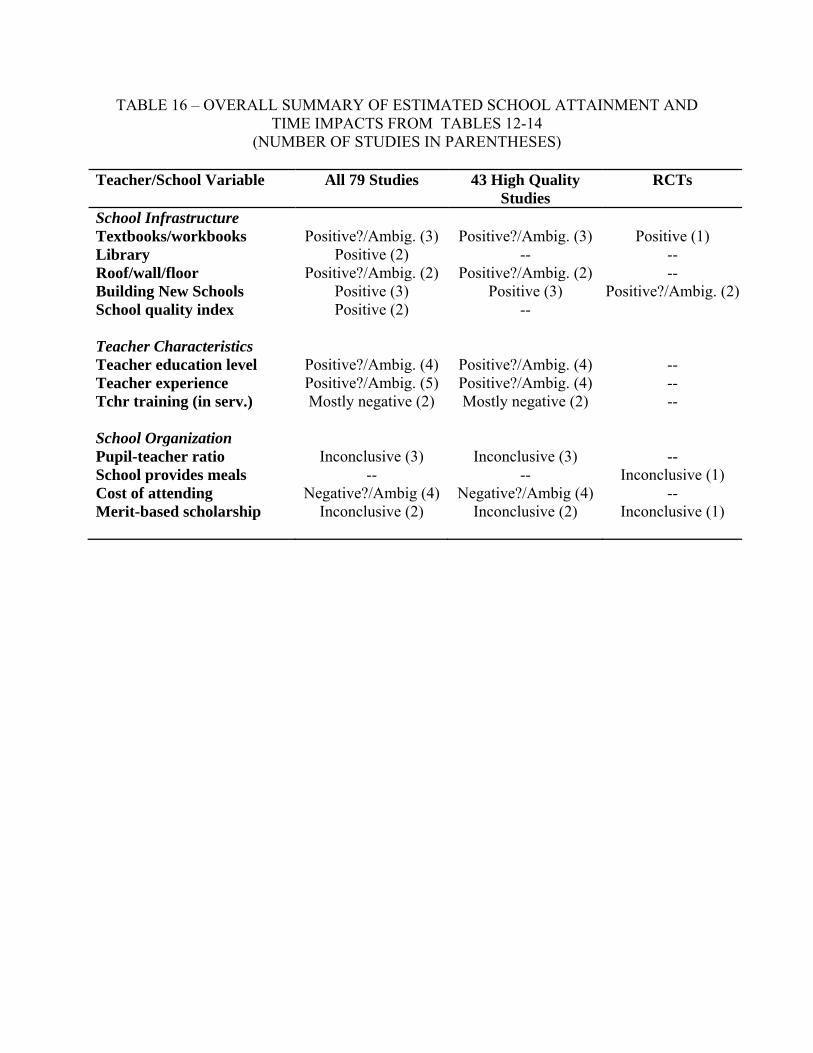
TABLE 16 – OVERALL SUMMARY OF ESTIMATED SCHOOL ATTAINMENT AND TIME IMPACTS FROM TABLES 12-14
(NUMBER OF STUDIES IN PARENTHESES) Teacher/School Variable All 79 Studies 43 High Quality
Studies RCTs
School Infrastructure Textbooks/workbooks Positive?/Ambig. (3) Positive?/Ambig. (3) Positive (1) Library Positive (2) -- -- Roof/wall/floor Positive?/Ambig. (2) Positive?/Ambig. (2) -- Building New Schools Positive (3) Positive (3) Positive?/Ambig. (2)School quality index Positive (2) -- Teacher Characteristics Teacher education level Positive?/Ambig. (4) Positive?/Ambig. (4) -- Teacher experience Positive?/Ambig. (5) Positive?/Ambig. (4) -- Tchr training (in serv.) Mostly negative (2) Mostly negative (2) -- School Organization Pupil-teacher ratio Inconclusive (3) Inconclusive (3) -- School provides meals -- -- Inconclusive (1) Cost of attending Negative?/Ambig (4) Negative?/Ambig (4) -- Merit-based scholarship Inconclusive (2) Inconclusive (2) Inconclusive (1)
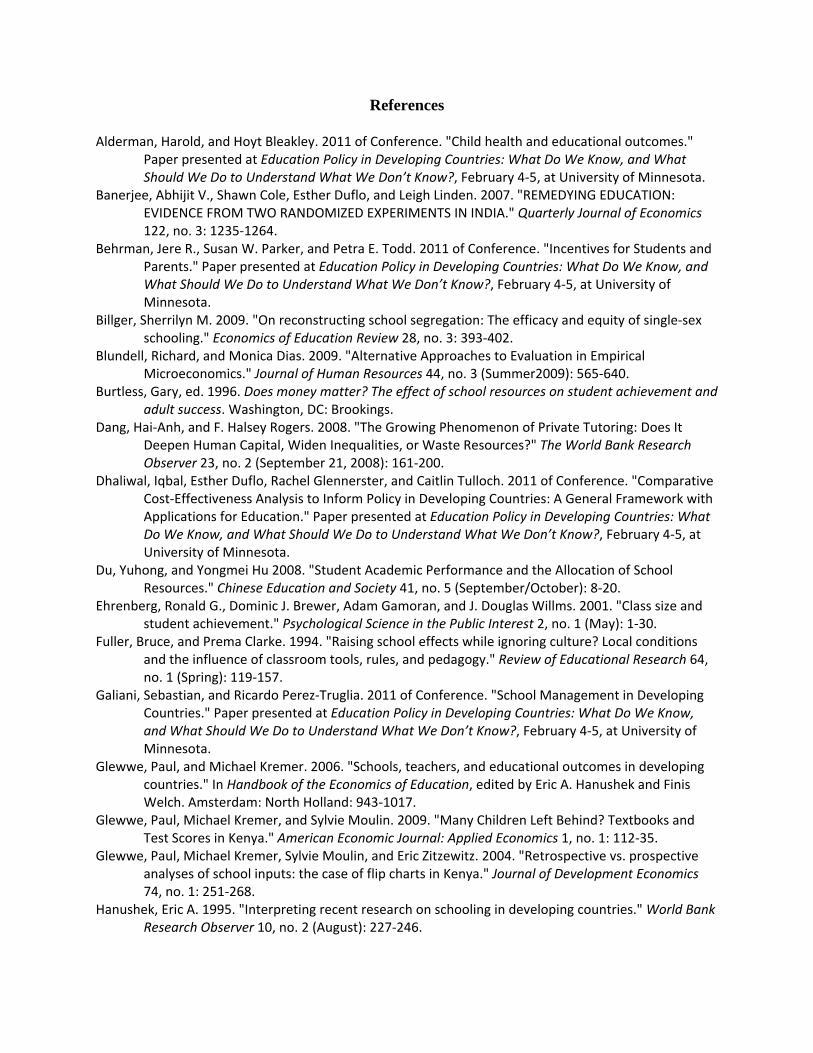
References Alderman, Harold, and Hoyt Bleakley. 2011 of Conference. "Child health and educational outcomes."
Paper presented at Education Policy in Developing Countries: What Do We Know, and What Should We Do to Understand What We Don’t Know?, February 4‐5, at University of Minnesota.
Banerjee, Abhijit V., Shawn Cole, Esther Duflo, and Leigh Linden. 2007. "REMEDYING EDUCATION: EVIDENCE FROM TWO RANDOMIZED EXPERIMENTS IN INDIA." Quarterly Journal of Economics 122, no. 3: 1235‐1264.
Behrman, Jere R., Susan W. Parker, and Petra E. Todd. 2011 of Conference. "Incentives for Students and Parents." Paper presented at Education Policy in Developing Countries: What Do We Know, and What Should We Do to Understand What We Don’t Know?, February 4‐5, at University of Minnesota.
Billger, Sherrilyn M. 2009. "On reconstructing school segregation: The efficacy and equity of single‐sex schooling." Economics of Education Review 28, no. 3: 393‐402.
Blundell, Richard, and Monica Dias. 2009. "Alternative Approaches to Evaluation in Empirical Microeconomics." Journal of Human Resources 44, no. 3 (Summer2009): 565‐640.
Burtless, Gary, ed. 1996. Does money matter? The effect of school resources on student achievement and adult success. Washington, DC: Brookings.
Dang, Hai‐Anh, and F. Halsey Rogers. 2008. "The Growing Phenomenon of Private Tutoring: Does It Deepen Human Capital, Widen Inequalities, or Waste Resources?" The World Bank Research Observer 23, no. 2 (September 21, 2008): 161‐200.
Dhaliwal, Iqbal, Esther Duflo, Rachel Glennerster, and Caitlin Tulloch. 2011 of Conference. "Comparative Cost‐Effectiveness Analysis to Inform Policy in Developing Countries: A General Framework with Applications for Education." Paper presented at Education Policy in Developing Countries: What Do We Know, and What Should We Do to Understand What We Don’t Know?, February 4‐5, at University of Minnesota.
Du, Yuhong, and Yongmei Hu 2008. "Student Academic Performance and the Allocation of School Resources." Chinese Education and Society 41, no. 5 (September/October): 8‐20.
Ehrenberg, Ronald G., Dominic J. Brewer, Adam Gamoran, and J. Douglas Willms. 2001. "Class size and student achievement." Psychological Science in the Public Interest 2, no. 1 (May): 1‐30.
Fuller, Bruce, and Prema Clarke. 1994. "Raising school effects while ignoring culture? Local conditions and the influence of classroom tools, rules, and pedagogy." Review of Educational Research 64, no. 1 (Spring): 119‐157.
Galiani, Sebastian, and Ricardo Perez‐Truglia. 2011 of Conference. "School Management in Developing Countries." Paper presented at Education Policy in Developing Countries: What Do We Know, and What Should We Do to Understand What We Don’t Know?, February 4‐5, at University of Minnesota.
Glewwe, Paul, and Michael Kremer. 2006. "Schools, teachers, and educational outcomes in developing countries." In Handbook of the Economics of Education, edited by Eric A. Hanushek and Finis Welch. Amsterdam: North Holland: 943‐1017.
Glewwe, Paul, Michael Kremer, and Sylvie Moulin. 2009. "Many Children Left Behind? Textbooks and Test Scores in Kenya." American Economic Journal: Applied Economics 1, no. 1: 112‐35.
Glewwe, Paul, Michael Kremer, Sylvie Moulin, and Eric Zitzewitz. 2004. "Retrospective vs. prospective analyses of school inputs: the case of flip charts in Kenya." Journal of Development Economics 74, no. 1: 251‐268.
Hanushek, Eric A. 1995. "Interpreting recent research on schooling in developing countries." World Bank Research Observer 10, no. 2 (August): 227‐246.
Hanushek, Eric A. 2003. "The failure of input‐based schooling policies." Economic Journal 113, no. 485 (February): F64‐F98.
Hanushek, Eric A. 2008. "Incentives for efficiency and equity in the school system." Perspektiven der Wirtschaftspolitik 9, no. Special Issue: 5‐27.
Hanushek, Eric A., Victor Lavy, and Kohtaro Hitomi. 2008. "Do students care about school quality? Determinants of dropout behavior in developing countries." Journal of Human Capital 1, no. 2 (Spring): 69‐105.
Hanushek, Eric A., and Ludger Woessmann. 2008. "The role of cognitive skills in economic development." Journal of Economic Literature 46, no. 3 (September): 607‐668.
Hanushek, Eric A., and Ludger Woessmann. 2011. "The economics of international differences in educational achievement." In Handbook of the Economics of Education, Vol. 3, edited by Eric A. Hanushek, Stephen Machin, and Ludger Woessmann. Amsterdam: North Holland: 89‐200.
Hanushek, Eric A., and Lei Zhang. 2009. "Quality‐consistent estimates of international schooling and skill gradients." Journal of Human Capital 3, no. 2 (Summer): 107‐143.
Harbison, Ralph W., and Eric A. Hanushek. 1992. Educational performance of the poor: lessons from rural northeast Brazil. New York: Oxford University Press.
Hedges, Larry V., and Ingram Olkin. 1985. Statistical methods for meta‐analysis. San Diego, CA: Academic Press.
Imbens, Guido W., and Jeffrey M. Wooldridge. 2009. "Recent Developments in the Econometrics of Program Evaluation." Journal of Economic Literature 47, no. 1 (March): 5‐86.
Inamdar, Parimala. 2004. "Computer skills development by children using "hole in the wall" facilities in rural India " Australasian Journal of Educational Technology 20, no. 3.
Kaufman, Julia, and Liqun Yin. 2009. "What matters for Chinese girls’ behavior and performance in school: An investigation of co‐educational and single‐sex schooling for girls in urban China." International Perspectives on Education and Society 10.
Kim, Hong‐Kyun. 2001. "Is there a crowding‐out effect between school expenditure and mother's child care time?" Economics of Education Review 20, no. 1 (February): 71‐80.
Kremer, Michael. 2003. "Randomized evaluations of educational programs in developing countries: Some lessons." American Economic Review 93, no. 2 (May): 102‐104.
Kremer, Michael, Edward Miguel, and Rebecca Thornton. 2009. "Incentives to learn." Review of Economics and Statistics 91, no. 3 (August): 437‐456.
Lazear, Edward P. 2003. "Teacher incentives." Swedish Economic Policy Review 10, no. 3: 179‐214. Linden, Leigh. 2008. "Complement or substitute? The effect of technology on student achievement in
India." JPAL Working Paper. Lochner, Lance. 2011. "Non‐Production Benefits of Education: Crime, Health, and Good Citizenship." In
Handbook of the Economics of Education, edited by Eric A. Hanushek, Stephen Machin, and Ludger Woessmann. Amsterdam: North Holland: 183‐282.
MacLeod, W. Bentley, and Miguel Urquiola. 2011 of Conference. "Competition and Educational Productivity: Incentives Writ Large." Paper presented at Education Policy in Developing Countries: What Do We Know, and What Should We Do to Understand What We Don’t Know?, February 4‐5, at University of Minnesota.
Mincer, Jacob. 1970. "The distribution of labor incomes: a survey with special reference to the human capital approach." Journal of Economic Literature 8, no. 1 (March): 1‐26.
Mincer, Jacob. 1974. Schooling, experience, and earnings. New York: NBER. Mishel, Lawrence, and Richard Rothstein, eds. 2002. The class size debate. Washington, DC: Economic
Policy Institute.
Mulligan, Casey B. 1999. "Galton versus the human capital approach to inheritance." Journal of Political Economy 107, no. 6, pt. 2 (December): S184‐S224.
Muralidharan, Karthik, and Venkatesh Sundararaman. 2008. "Contract Teachers: Experimental evidence from India." JPAL Working Paper.
Murnane, Richard J., John B. Willett, Yves Duhaldeborde, and John H. Tyler. 2000. "How important are the cognitive skills of teenagers in predicting subsequent earnings?" Journal of Policy Analysis and Management 19, no. 4 (Fall): 547‐568.
Nannyonjo, Harriet. 2007. "Education Inputs in Uganda: An Analysis of Factors Influencing Learning Achievement in Grade Six." World Bank Policy Research Paper No. 98. Washington, DC: World Bank.
OECD. "International Development Statistics. OECD. 2000. "Knowledge and skills for life: First results from PISA 2000." OECD. 2003. "Learning for tomorrow's world: First results from PISA 2003." OECD. 2006. "PISA 2006: Science competencies for tomorrow's world." OECD. 2009. "PISA 2009 Results: What students know and can do." Osorio, Felipe, and Leigh Linden. 2009. "The use and misuse of computers in education: evidence from a
randomized experiment in Colombia " The World Bank Policy Research Working Paper Series. Pandey, Priyanka, Sangeeta Goyal, and Venkatesh Sundararaman. 2009. "Community participation in
public schools: impact of information campaigns in three Indian states." Education Economics 17, no. 3: 355‐375.
Park, Hyunjoon, and Jere R. Behrman. 2010. "Causal Effects of Single‐Sex Schools on College Attendance: Random Assignment in Korean High Schools." PSC Working Paper Series.
Pitt, Mark M., Mark R. Rosenzweig, and Donna M. Gibbons. 1993. "The Determinants and Consequences of the Placement of Government Programs in Indonesia." The World Bank Economic Review 7, no. 3 (September 1, 1993): 319‐348.
Psacharopoulos, George, and Harry A. Patrinos. 2004. "Returns to investment in education: a further update." Education Economics 12, no. 2 (August): 111‐134.
Rivkin, Steven G. 2008. "Value Added Analysis and Education Policy." Calder Briefs Washington: Center for Analysis of Longitudinal Data in Education Research.
Rosas, Ricardo, Miguel Nussbaum, Patricio Cumsille, Vladimir Marianov, Mónica Correa, Patricia Flores, Valeska Grau, Francisca Lagos, Ximena López, Verónica López, Patricio Rodriguez, and Marcela Salinas. 2003. "Beyond Nintendo: design and assessment of educational video games for first and second grade students." Computers & Education 40, no. 1: 71‐94.
Rothstein, Jesse. 2010. "Teacher quality in educational production: Tracking, decay, and student achievement." Quarterly Journal of Economics 125, no. 1 (February): 175‐214.
Tan, Jee‐Peng, Julia Lane, and Gerard Lassibille. 1999. "Student Outcomes in Philippine Elementary Schools: An Evaluation of Four Experiments." The World Bank Economic Review 13, no. 3: 493‐508.
World_Bank. 1998. "World Bank Development Indicators 1998." World_Bank. 1999. "World Bank Development Indicators 1999." World_Bank. 2001. "World Bank Development Report 2000/2001: Attacking Poverty. World_Bank. 2002. "World Bank Development Indicators 2002." World_Bank. 2008. "World Bank Development Indicators 2008." World_Bank. 2010. "World Bank Development Indicators 2010."
Appendix I: Search Terms The methodology used to search for papers is described in detail in Section III of the paper. This appendix reports the specific search terms used. The search terms used to search EconLit from 1990 to 2010 are as follows. The code “KW” refers to a key word. KW=education and KW=("class size" OR "school size" OR "Student teacher ratio" OR "Pupil teacher ratio" OR "School expenditure*" OR “expenditure per pupil” OR "texbook*" OR "instructional material*" OR "Workbook*" OR "exercise book*" OR "computer*" OR "laptop*" OR "internet" OR "school infrastructure" OR "Facilities" OR "Building condition*" OR "Laborator*" OR "lab" OR "labs" OR "Librar*" OR "Desk*" OR "Teaching tools" OR "teaching guide*" OR "blackboard*" OR "chalk*" OR "electricity" OR "table*" OR "bench*" OR "chair*" OR "roof*" OR "wall*" OR "floor*" OR "window*" OR "bathroom*" OR "plumbing" OR "teacher quality" OR "teacher efficacy" OR "teacher knowledge" OR "teacher salar*" OR "teacher training" OR "teacher experience" OR "teacher education" OR "teacher absenteeism" OR "teacher gender" OR "class preparation" OR "lesson planning" OR "homework" OR "evaluation" OR "follow-up" OR "monitoring of pupil performance" OR "testing" OR "remedial program*" OR "teaching practices" OR "instructional time" OR "length of instructional program" OR "hours" OR "school day" OR "curriculum" OR "principal quality" OR "principal training" OR "principal education" OR "principal experience" OR "staff assessment*" OR "teacher assessment" OR "school inspection*" OR "parent* involvement" OR "production function" OR "school resources" OR "school inputs" OR "School quality" OR "Pedagogical inputs" OR "pedagogical resources") These search terms yielded over half a million results in ERIC. To narrow the results to a reasonable number, results in ERIC were further limited to articles that included the name of at least one developing country or related term in the abstract. The search terms used to limit results accordingly are as follows. The code AB refers to abstract. AB=("developing countr*" OR "Least-Developed Countries" OR "Afghanistan" OR "Albania" OR "Algeria" OR "Angola" OR "Antigua and Barbuda" OR "Argentina" OR "Armenia" OR "Azerbaijan" OR "Bahamas" OR "Bahrain" OR "Bangladesh" OR "Barbados" OR "Belarus" OR "Belize" OR "Benin" OR "Bhutan" OR "Bolivia" OR "Bosnia and Herzegovina" OR "Botswana" OR "Brazil" OR "Brunei Darussalam" OR "Bulgaria" OR "Burkina Faso" OR "Burundi" OR "Cambodia" OR "Cameroon" OR "Cape Verde" OR "Central African Republic" OR "Chad" OR "Chile" OR "China" OR "Colombia" OR "Comoros" OR "Congo" OR "Costa Rica" OR "Côte d'Ivoire" OR "Croatia" OR "Djibouti" OR "Dominica" OR "Dominican Republic" OR "Ecuador*" OR "Egypt*" OR "El Salvador" OR “Salvadoran” OR "Equatorial Guinea" OR "Eritrea" OR "Estonia*" OR "Ethiopia*" OR "Fiji*" OR "Gabon*" OR "Gambia*" OR "Georgia*" OR "Ghana*" OR "Grenada*" OR "Guatemala*" OR "Guinea" OR "Guinea-Bissau" OR "Guyana" OR "Haiti" OR "Honduras" OR "Hungary" OR "India" OR "Indonesia" OR "Iran" OR "Iraq" OR "Jamaica" OR "Jordan" OR "Kazakhstan" OR "Kenya" OR "Kiribati" OR "Kosovo" OR "Kuwait" OR "Kyrgyz Republic" OR "Lao People's Democratic Republic" OR "Latvia" OR "Lebanon" OR "Lesotho" OR "Liberia" OR "Libya" OR "Lithuania" OR "Macedonia" OR "Madagascar" OR "Malawi" OR "Malaysia" OR "Maldives" OR "Mali" OR "Mauritania" OR "Mauritius" OR "Mexico" OR "Moldova" OR "Mongolia" OR "Montenegro"
OR "Morocco" OR "Mozambique" OR "Myanmar" OR "Namibia" OR "Nepal" OR Nicaragua" OR "Niger" OR "Nigeria" OR "Yugoslav" OR "Oman" OR "Pakistan" OR "Panama" OR "Papua New Guinea" OR "Paraguay" OR "Peru" OR "Philippines" OR "Poland" OR "Qatar" OR "Romania" OR "Russia" OR "Rwanda" OR "Samoa" OR "São Tomé and Príncipe" OR "Saudi Arabia" OR "Senegal" OR "Serbia" OR "Seychelles" OR "Sierra Leone" OR "Solomon Islands" OR "South Africa" OR "Sri Lanka" OR "St. Kitts and Nevis" OR "St. Lucia" OR "St. Vincent and the Grenadines" OR "Sudan" OR "Suriname" OR "Swaziland" OR "Syrian Arab Republic" OR "Tajikistan" OR "Tanzania" OR "Thailand" OR "Timor-Leste" OR "Togo" OR "Tonga" OR "Trinidad and Tobago" OR "Tunisia" OR "Turkey" OR "Turkmenistan" OR "Uganda" OR "Ukraine" OR "United Arab Emirates" OR "Uruguay" OR "Uzbekistan" OR "Vanuatu" OR "Venezuela" OR "Vietnam" OR "Yemen" OR "Zambia" OR "Zimbabwe" OR "North Korea" OR "Cuba") and not AB=("U.S." OR "U.K." OR "Europe" OR "US" OR "UK" OR "Japan" OR "Canada" OR "Australia)
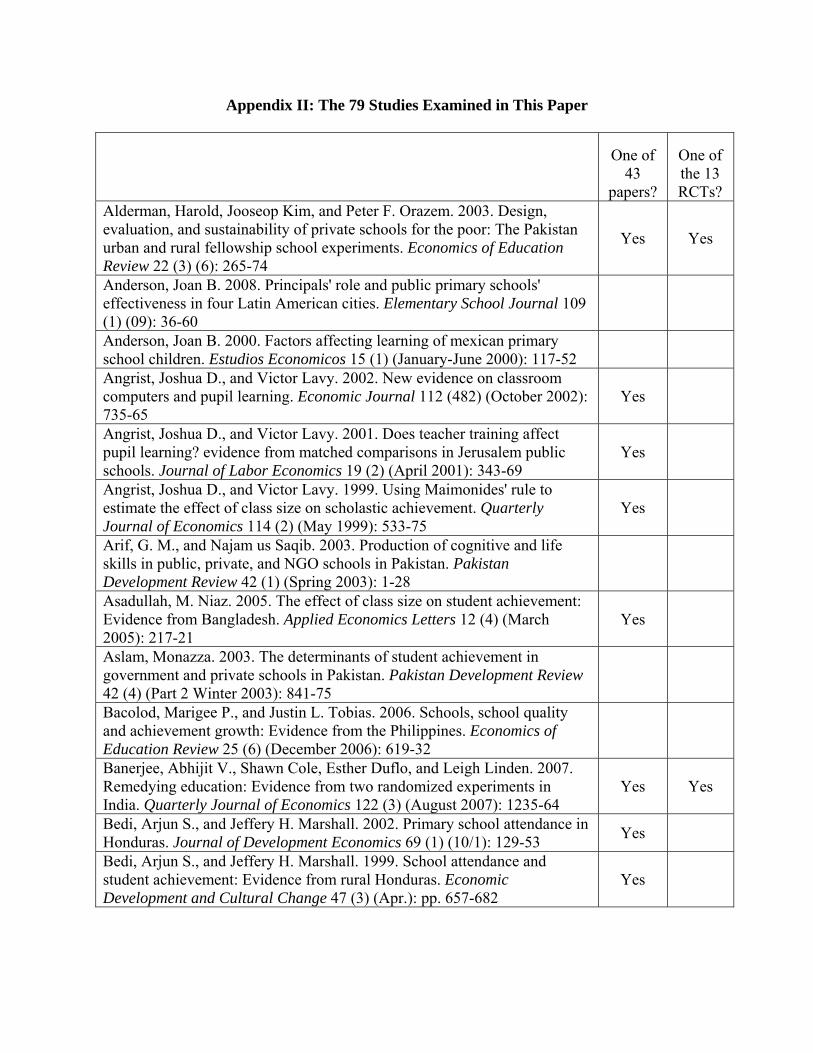
Appendix II: The 79 Studies Examined in This Paper
One of 43
papers?
One of the 13 RCTs?
Alderman, Harold, Jooseop Kim, and Peter F. Orazem. 2003. Design, evaluation, and sustainability of private schools for the poor: The Pakistan urban and rural fellowship school experiments. Economics of Education Review 22 (3) (6): 265-74
Yes Yes
Anderson, Joan B. 2008. Principals' role and public primary schools' effectiveness in four Latin American cities. Elementary School Journal 109 (1) (09): 36-60
Anderson, Joan B. 2000. Factors affecting learning of mexican primary school children. Estudios Economicos 15 (1) (January-June 2000): 117-52
Angrist, Joshua D., and Victor Lavy. 2002. New evidence on classroom computers and pupil learning. Economic Journal 112 (482) (October 2002): 735-65
Yes
Angrist, Joshua D., and Victor Lavy. 2001. Does teacher training affect pupil learning? evidence from matched comparisons in Jerusalem public schools. Journal of Labor Economics 19 (2) (April 2001): 343-69
Yes
Angrist, Joshua D., and Victor Lavy. 1999. Using Maimonides' rule to estimate the effect of class size on scholastic achievement. Quarterly Journal of Economics 114 (2) (May 1999): 533-75
Yes
Arif, G. M., and Najam us Saqib. 2003. Production of cognitive and life skills in public, private, and NGO schools in Pakistan. Pakistan Development Review 42 (1) (Spring 2003): 1-28
Asadullah, M. Niaz. 2005. The effect of class size on student achievement: Evidence from Bangladesh. Applied Economics Letters 12 (4) (March 2005): 217-21
Yes
Aslam, Monazza. 2003. The determinants of student achievement in government and private schools in Pakistan. Pakistan Development Review 42 (4) (Part 2 Winter 2003): 841-75
Bacolod, Marigee P., and Justin L. Tobias. 2006. Schools, school quality and achievement growth: Evidence from the Philippines. Economics of Education Review 25 (6) (December 2006): 619-32
Banerjee, Abhijit V., Shawn Cole, Esther Duflo, and Leigh Linden. 2007. Remedying education: Evidence from two randomized experiments in India. Quarterly Journal of Economics 122 (3) (August 2007): 1235-64
Yes Yes
Bedi, Arjun S., and Jeffery H. Marshall. 2002. Primary school attendance in Honduras. Journal of Development Economics 69 (1) (10/1): 129-53
Yes
Bedi, Arjun S., and Jeffery H. Marshall. 1999. School attendance and student achievement: Evidence from rural Honduras. Economic Development and Cultural Change 47 (3) (Apr.): pp. 657-682
Yes
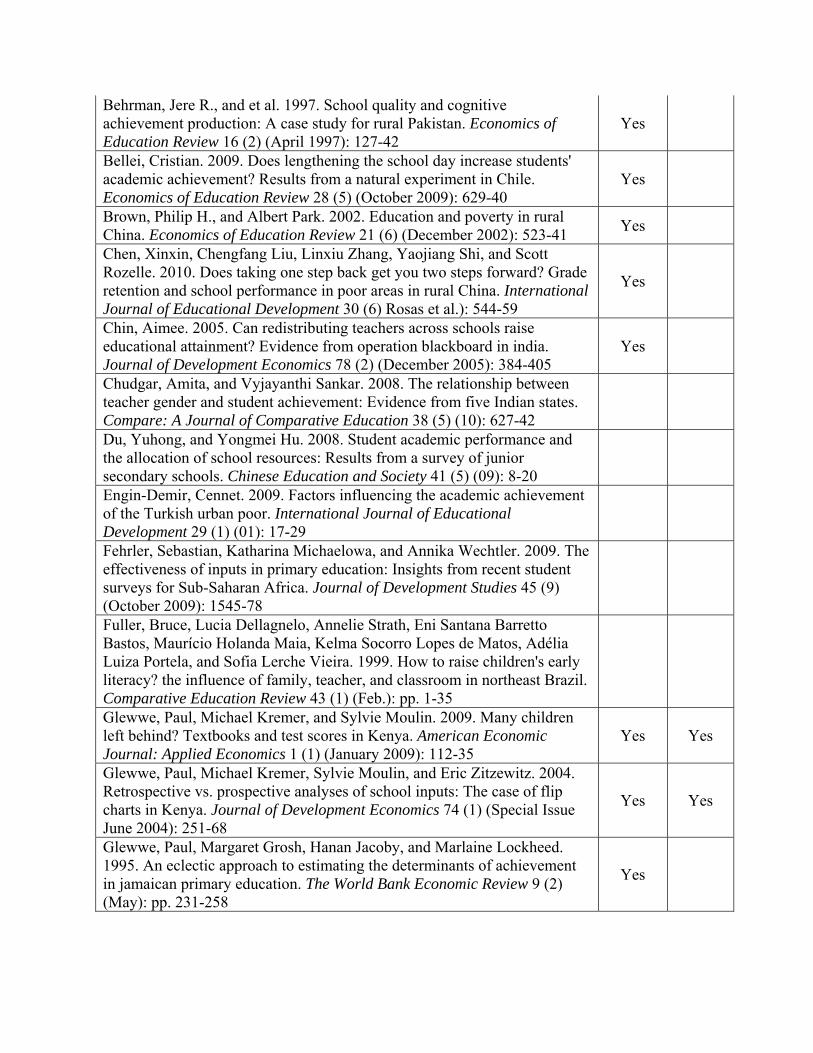
Behrman, Jere R., and et al. 1997. School quality and cognitive achievement production: A case study for rural Pakistan. Economics of Education Review 16 (2) (April 1997): 127-42
Yes
Bellei, Cristian. 2009. Does lengthening the school day increase students' academic achievement? Results from a natural experiment in Chile. Economics of Education Review 28 (5) (October 2009): 629-40
Yes
Brown, Philip H., and Albert Park. 2002. Education and poverty in rural China. Economics of Education Review 21 (6) (December 2002): 523-41
Yes
Chen, Xinxin, Chengfang Liu, Linxiu Zhang, Yaojiang Shi, and Scott Rozelle. 2010. Does taking one step back get you two steps forward? Grade retention and school performance in poor areas in rural China. International Journal of Educational Development 30 (6) Rosas et al.): 544-59
Yes
Chin, Aimee. 2005. Can redistributing teachers across schools raise educational attainment? Evidence from operation blackboard in india. Journal of Development Economics 78 (2) (December 2005): 384-405
Yes
Chudgar, Amita, and Vyjayanthi Sankar. 2008. The relationship between teacher gender and student achievement: Evidence from five Indian states. Compare: A Journal of Comparative Education 38 (5) (10): 627-42
Du, Yuhong, and Yongmei Hu. 2008. Student academic performance and the allocation of school resources: Results from a survey of junior secondary schools. Chinese Education and Society 41 (5) (09): 8-20
Engin-Demir, Cennet. 2009. Factors influencing the academic achievement of the Turkish urban poor. International Journal of Educational Development 29 (1) (01): 17-29
Fehrler, Sebastian, Katharina Michaelowa, and Annika Wechtler. 2009. The effectiveness of inputs in primary education: Insights from recent student surveys for Sub-Saharan Africa. Journal of Development Studies 45 (9) (October 2009): 1545-78
Fuller, Bruce, Lucia Dellagnelo, Annelie Strath, Eni Santana Barretto Bastos, Maurício Holanda Maia, Kelma Socorro Lopes de Matos, Adélia Luiza Portela, and Sofia Lerche Vieira. 1999. How to raise children's early literacy? the influence of family, teacher, and classroom in northeast Brazil. Comparative Education Review 43 (1) (Feb.): pp. 1-35
Glewwe, Paul, Michael Kremer, and Sylvie Moulin. 2009. Many children left behind? Textbooks and test scores in Kenya. American Economic Journal: Applied Economics 1 (1) (January 2009): 112-35
Yes Yes
Glewwe, Paul, Michael Kremer, Sylvie Moulin, and Eric Zitzewitz. 2004. Retrospective vs. prospective analyses of school inputs: The case of flip charts in Kenya. Journal of Development Economics 74 (1) (Special Issue June 2004): 251-68
Yes Yes
Glewwe, Paul, Margaret Grosh, Hanan Jacoby, and Marlaine Lockheed. 1995. An eclectic approach to estimating the determinants of achievement in jamaican primary education. The World Bank Economic Review 9 (2) (May): pp. 231-258
Yes
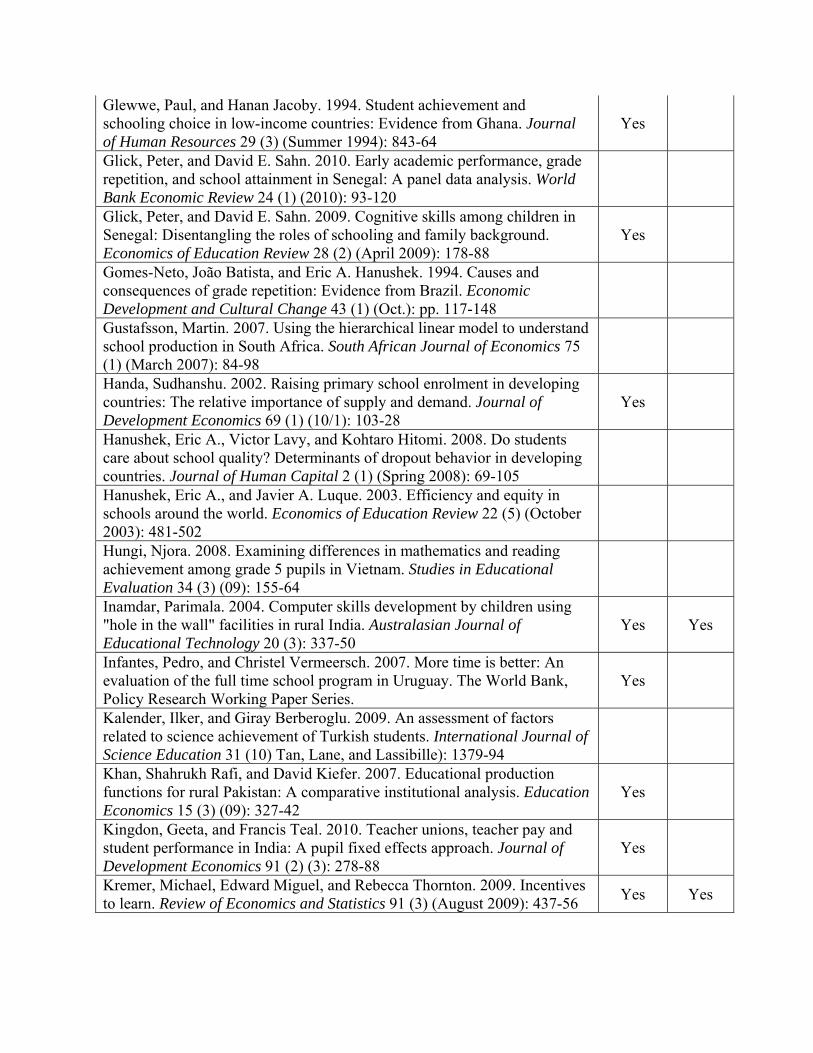
Glewwe, Paul, and Hanan Jacoby. 1994. Student achievement and schooling choice in low-income countries: Evidence from Ghana. Journal of Human Resources 29 (3) (Summer 1994): 843-64
Yes
Glick, Peter, and David E. Sahn. 2010. Early academic performance, grade repetition, and school attainment in Senegal: A panel data analysis. World Bank Economic Review 24 (1) (2010): 93-120
Glick, Peter, and David E. Sahn. 2009. Cognitive skills among children in Senegal: Disentangling the roles of schooling and family background. Economics of Education Review 28 (2) (April 2009): 178-88
Yes
Gomes-Neto, João Batista, and Eric A. Hanushek. 1994. Causes and consequences of grade repetition: Evidence from Brazil. Economic Development and Cultural Change 43 (1) (Oct.): pp. 117-148
Gustafsson, Martin. 2007. Using the hierarchical linear model to understand school production in South Africa. South African Journal of Economics 75 (1) (March 2007): 84-98
Handa, Sudhanshu. 2002. Raising primary school enrolment in developing countries: The relative importance of supply and demand. Journal of Development Economics 69 (1) (10/1): 103-28
Yes
Hanushek, Eric A., Victor Lavy, and Kohtaro Hitomi. 2008. Do students care about school quality? Determinants of dropout behavior in developing countries. Journal of Human Capital 2 (1) (Spring 2008): 69-105
Hanushek, Eric A., and Javier A. Luque. 2003. Efficiency and equity in schools around the world. Economics of Education Review 22 (5) (October 2003): 481-502
Hungi, Njora. 2008. Examining differences in mathematics and reading achievement among grade 5 pupils in Vietnam. Studies in Educational Evaluation 34 (3) (09): 155-64
Inamdar, Parimala. 2004. Computer skills development by children using "hole in the wall" facilities in rural India. Australasian Journal of Educational Technology 20 (3): 337-50
Yes Yes
Infantes, Pedro, and Christel Vermeersch. 2007. More time is better: An evaluation of the full time school program in Uruguay. The World Bank, Policy Research Working Paper Series.
Yes
Kalender, Ilker, and Giray Berberoglu. 2009. An assessment of factors related to science achievement of Turkish students. International Journal of Science Education 31 (10) Tan, Lane, and Lassibille): 1379-94
Khan, Shahrukh Rafi, and David Kiefer. 2007. Educational production functions for rural Pakistan: A comparative institutional analysis. Education Economics 15 (3) (09): 327-42
Yes
Kingdon, Geeta, and Francis Teal. 2010. Teacher unions, teacher pay and student performance in India: A pupil fixed effects approach. Journal of Development Economics 91 (2) (3): 278-88
Yes
Kremer, Michael, Edward Miguel, and Rebecca Thornton. 2009. Incentives to learn. Review of Economics and Statistics 91 (3) (August 2009): 437-56
Yes Yes
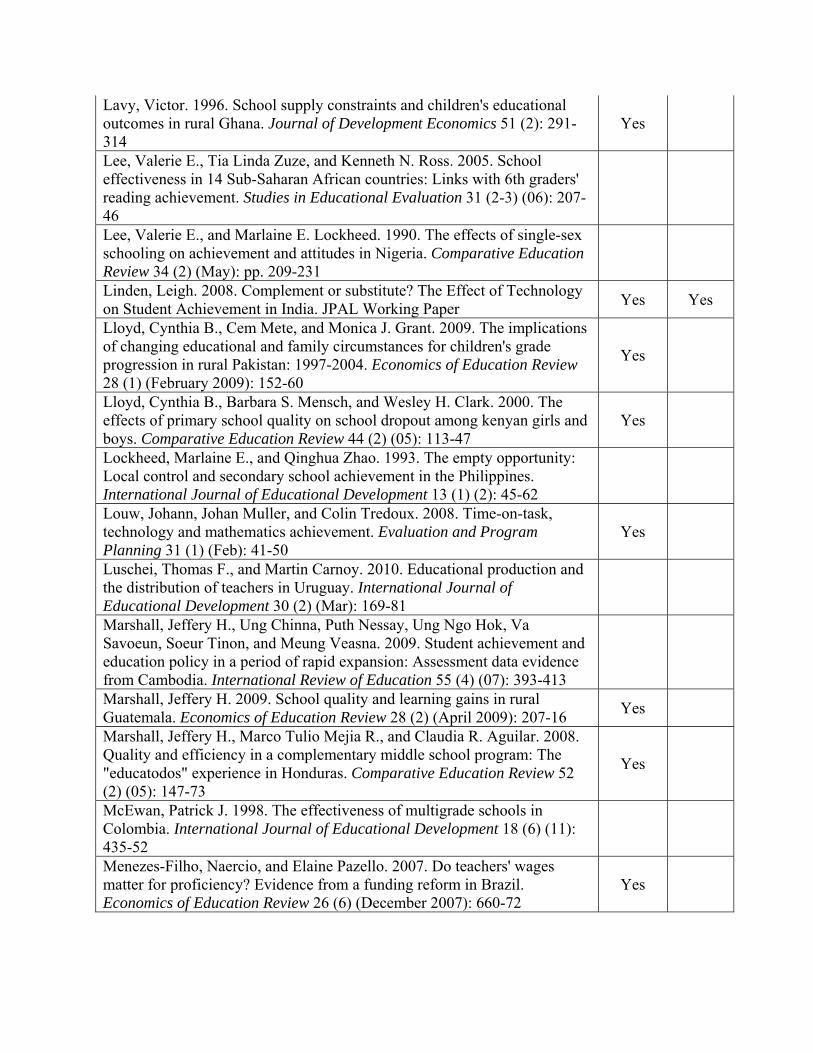
Lavy, Victor. 1996. School supply constraints and children's educational outcomes in rural Ghana. Journal of Development Economics 51 (2): 291-314
Yes
Lee, Valerie E., Tia Linda Zuze, and Kenneth N. Ross. 2005. School effectiveness in 14 Sub-Saharan African countries: Links with 6th graders' reading achievement. Studies in Educational Evaluation 31 (2-3) (06): 207-46
Lee, Valerie E., and Marlaine E. Lockheed. 1990. The effects of single-sex schooling on achievement and attitudes in Nigeria. Comparative Education Review 34 (2) (May): pp. 209-231
Linden, Leigh. 2008. Complement or substitute? The Effect of Technology on Student Achievement in India. JPAL Working Paper
Yes Yes
Lloyd, Cynthia B., Cem Mete, and Monica J. Grant. 2009. The implications of changing educational and family circumstances for children's grade progression in rural Pakistan: 1997-2004. Economics of Education Review 28 (1) (February 2009): 152-60
Yes
Lloyd, Cynthia B., Barbara S. Mensch, and Wesley H. Clark. 2000. The effects of primary school quality on school dropout among kenyan girls and boys. Comparative Education Review 44 (2) (05): 113-47
Yes
Lockheed, Marlaine E., and Qinghua Zhao. 1993. The empty opportunity: Local control and secondary school achievement in the Philippines. International Journal of Educational Development 13 (1) (2): 45-62
Louw, Johann, Johan Muller, and Colin Tredoux. 2008. Time-on-task, technology and mathematics achievement. Evaluation and Program Planning 31 (1) (Feb): 41-50
Yes
Luschei, Thomas F., and Martin Carnoy. 2010. Educational production and the distribution of teachers in Uruguay. International Journal of Educational Development 30 (2) (Mar): 169-81
Marshall, Jeffery H., Ung Chinna, Puth Nessay, Ung Ngo Hok, Va Savoeun, Soeur Tinon, and Meung Veasna. 2009. Student achievement and education policy in a period of rapid expansion: Assessment data evidence from Cambodia. International Review of Education 55 (4) (07): 393-413
Marshall, Jeffery H. 2009. School quality and learning gains in rural Guatemala. Economics of Education Review 28 (2) (April 2009): 207-16
Yes
Marshall, Jeffery H., Marco Tulio Mejia R., and Claudia R. Aguilar. 2008. Quality and efficiency in a complementary middle school program: The "educatodos" experience in Honduras. Comparative Education Review 52 (2) (05): 147-73
Yes
McEwan, Patrick J. 1998. The effectiveness of multigrade schools in Colombia. International Journal of Educational Development 18 (6) (11): 435-52
Menezes-Filho, Naercio, and Elaine Pazello. 2007. Do teachers' wages matter for proficiency? Evidence from a funding reform in Brazil. Economics of Education Review 26 (6) (December 2007): 660-72
Yes
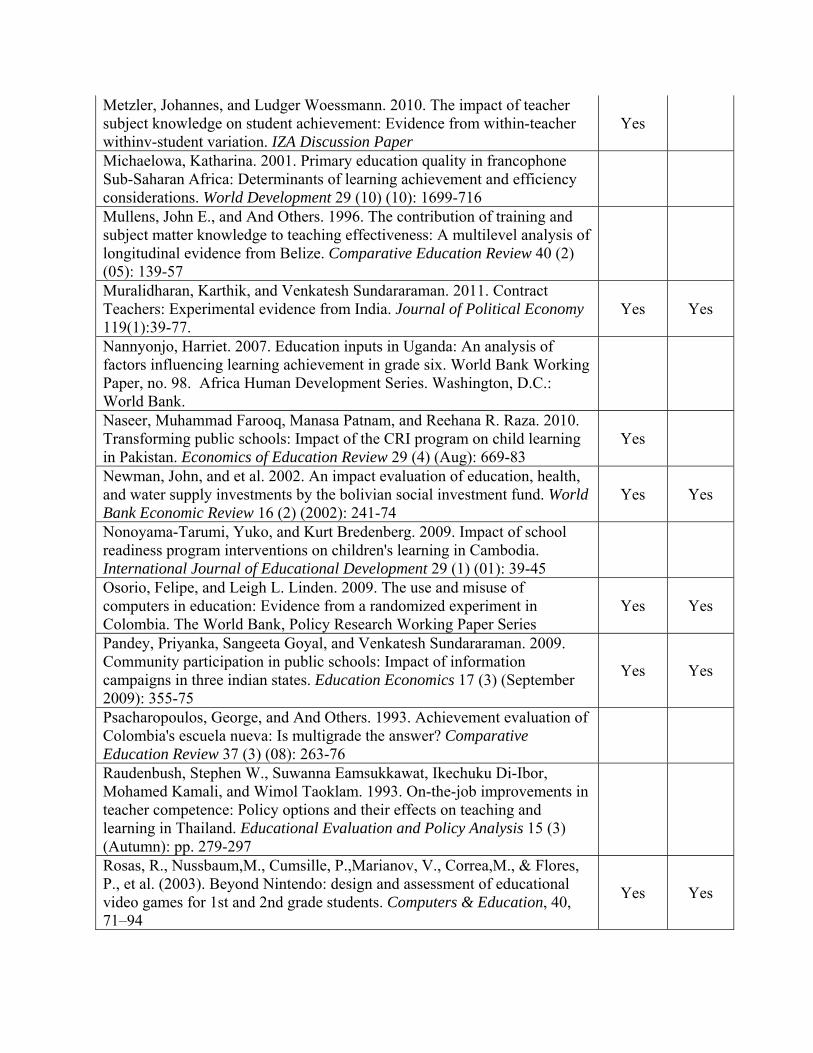
Metzler, Johannes, and Ludger Woessmann. 2010. The impact of teacher subject knowledge on student achievement: Evidence from within-teacher withinv-student variation. IZA Discussion Paper
Yes
Michaelowa, Katharina. 2001. Primary education quality in francophone Sub-Saharan Africa: Determinants of learning achievement and efficiency considerations. World Development 29 (10) (10): 1699-716
Mullens, John E., and And Others. 1996. The contribution of training and subject matter knowledge to teaching effectiveness: A multilevel analysis of longitudinal evidence from Belize. Comparative Education Review 40 (2) (05): 139-57
Muralidharan, Karthik, and Venkatesh Sundararaman. 2011. Contract Teachers: Experimental evidence from India. Journal of Political Economy 119(1):39-77.
Yes Yes
Nannyonjo, Harriet. 2007. Education inputs in Uganda: An analysis of factors influencing learning achievement in grade six. World Bank Working Paper, no. 98. Africa Human Development Series. Washington, D.C.: World Bank.
Naseer, Muhammad Farooq, Manasa Patnam, and Reehana R. Raza. 2010. Transforming public schools: Impact of the CRI program on child learning in Pakistan. Economics of Education Review 29 (4) (Aug): 669-83
Yes
Newman, John, and et al. 2002. An impact evaluation of education, health, and water supply investments by the bolivian social investment fund. World Bank Economic Review 16 (2) (2002): 241-74
Yes Yes
Nonoyama-Tarumi, Yuko, and Kurt Bredenberg. 2009. Impact of school readiness program interventions on children's learning in Cambodia. International Journal of Educational Development 29 (1) (01): 39-45
Osorio, Felipe, and Leigh L. Linden. 2009. The use and misuse of computers in education: Evidence from a randomized experiment in Colombia. The World Bank, Policy Research Working Paper Series
Yes Yes
Pandey, Priyanka, Sangeeta Goyal, and Venkatesh Sundararaman. 2009. Community participation in public schools: Impact of information campaigns in three indian states. Education Economics 17 (3) (September 2009): 355-75
Yes Yes
Psacharopoulos, George, and And Others. 1993. Achievement evaluation of Colombia's escuela nueva: Is multigrade the answer? Comparative Education Review 37 (3) (08): 263-76
Raudenbush, Stephen W., Suwanna Eamsukkawat, Ikechuku Di-Ibor, Mohamed Kamali, and Wimol Taoklam. 1993. On-the-job improvements in teacher competence: Policy options and their effects on teaching and learning in Thailand. Educational Evaluation and Policy Analysis 15 (3) (Autumn): pp. 279-297
Rosas, R., Nussbaum,M., Cumsille, P.,Marianov, V., Correa,M., & Flores, P., et al. (2003). Beyond Nintendo: design and assessment of educational video games for 1st and 2nd grade students. Computers & Education, 40, 71–94
Yes Yes
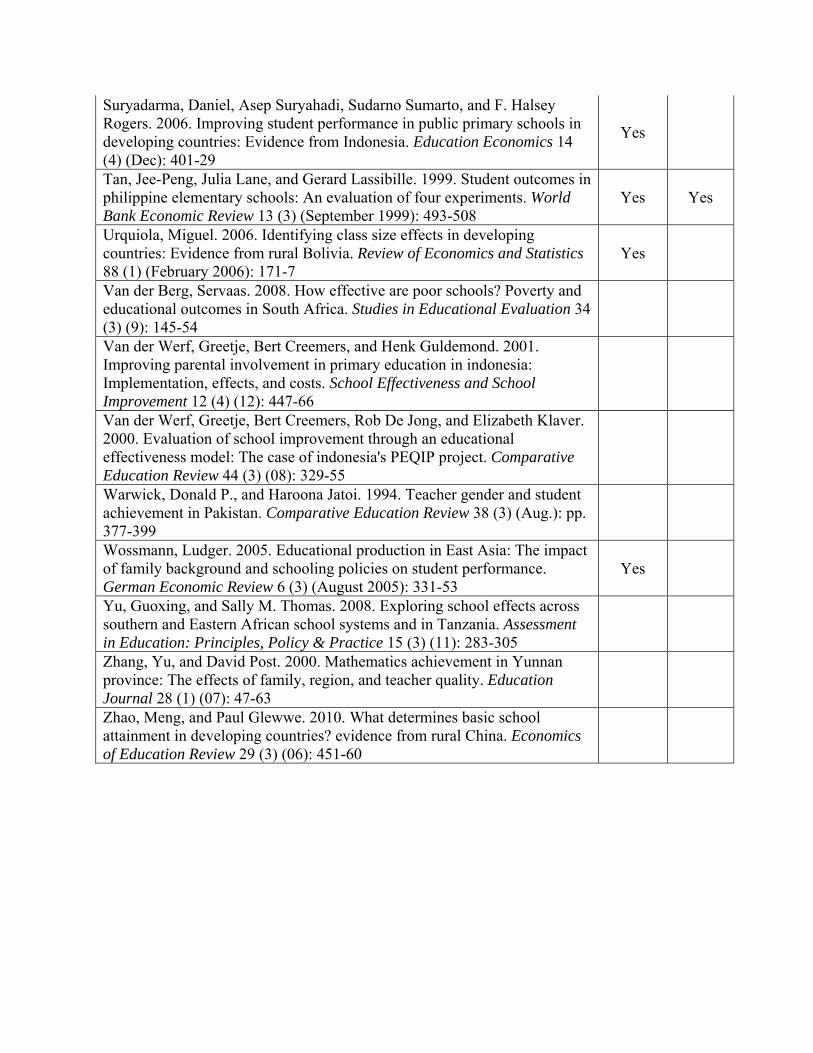
Suryadarma, Daniel, Asep Suryahadi, Sudarno Sumarto, and F. Halsey Rogers. 2006. Improving student performance in public primary schools in developing countries: Evidence from Indonesia. Education Economics 14 (4) (Dec): 401-29
Yes
Tan, Jee-Peng, Julia Lane, and Gerard Lassibille. 1999. Student outcomes in philippine elementary schools: An evaluation of four experiments. World Bank Economic Review 13 (3) (September 1999): 493-508
Yes Yes
Urquiola, Miguel. 2006. Identifying class size effects in developing countries: Evidence from rural Bolivia. Review of Economics and Statistics 88 (1) (February 2006): 171-7
Yes
Van der Berg, Servaas. 2008. How effective are poor schools? Poverty and educational outcomes in South Africa. Studies in Educational Evaluation 34 (3) (9): 145-54
Van der Werf, Greetje, Bert Creemers, and Henk Guldemond. 2001. Improving parental involvement in primary education in indonesia: Implementation, effects, and costs. School Effectiveness and School Improvement 12 (4) (12): 447-66
Van der Werf, Greetje, Bert Creemers, Rob De Jong, and Elizabeth Klaver. 2000. Evaluation of school improvement through an educational effectiveness model: The case of indonesia's PEQIP project. Comparative Education Review 44 (3) (08): 329-55
Warwick, Donald P., and Haroona Jatoi. 1994. Teacher gender and student achievement in Pakistan. Comparative Education Review 38 (3) (Aug.): pp. 377-399
Wossmann, Ludger. 2005. Educational production in East Asia: The impact of family background and schooling policies on student performance. German Economic Review 6 (3) (August 2005): 331-53
Yes
Yu, Guoxing, and Sally M. Thomas. 2008. Exploring school effects across southern and Eastern African school systems and in Tanzania. Assessment in Education: Principles, Policy & Practice 15 (3) (11): 283-305
Zhang, Yu, and David Post. 2000. Mathematics achievement in Yunnan province: The effects of family, region, and teacher quality. Education Journal 28 (1) (07): 47-63
Zhao, Meng, and Paul Glewwe. 2010. What determines basic school attainment in developing countries? evidence from rural China. Economics of Education Review 29 (3) (06): 451-60