Embed Size (px)
Citation preview

Comprehensive Annual Financial Report
For the Fiscal Year Ended June 30, 2011
Independent School District No. 347
Willmar, Minnesota NCA accredited
Preparing All Students for a Successful Tomorrow

(1)
COMPREHENSIVE ANNUAL FINANCIAL REPORT For the Fiscal Year ended June 30, 2011
WILLMAR PUBLIC SCHOOLS INDEPENDENT SCHOOL DISTRICT NO. 347
611 5th Street SW Willmar, Minnesota 56201-3218
Prepared by
Business Office Staff

(2)
INTRODUCTORY SECTION

(3)
WILLMAR PUBLIC SCHOOLS INDEPENDENT SCHOOL DISTRICT 347
TABLE OF CONTENTS JUNE 30, 2011
I. INTRODUCTORY SECTION
School Board and Administration 5 Organizational Chart 6 Letter of Transmittal 7 Certificate of Excellence in Financial Reporting 14 Certificate of Achievement for Excellence in Financial Reporting 15
II. FINANCIAL SECTION
Independent Auditor’s Report 17
Management’s Discussion and Analysis 19
Basic Financial Statements Statement of Net Assets 35 Statement of Activities 36 Balance Sheet – Governmental Funds 37 Reconciliation of the Governmental Funds Balance Sheet to
the Statement of Net Assets 38 Statement of Revenues, Expenditures, and Changes in Fund Balances – Governmental Funds 39 Reconciliation of the Statement of Revenues, Expenditures, and
Changes in Fund Balances of Governmental Funds to the Statement of Activities 40
Statement of Revenues, Expenditures, and Changes in Fund Balances – Budget and Actual – General Fund 41 Statement of Revenues, Expenditures, and Changes in Fund Balances – Budget and Actual – Food Service Special Revenue Fund 42 Statement of Revenues, Expenditures, and Changes in Fund Balances – Budget and Actual – Community Service Special Revenue Fund 43 Statement of Net Assets – Proprietary Fund 44 Statement of Revenues, Expenses, and Changes in Net Assets – Proprietary Fund 45 Statement of Cash Flows – Proprietary Fund 46 Statement of Fiduciary Net Assets 47 Statement of Changes in Fiduciary Net Assets 47 Notes to the Financial Statements (These notes are an integral part
of the Basic Financial Statements) 48
Required Supplementary Information Schedules of Funding Progress and Employer Contributions
for Postemployment Benefit Plans 78
Supplementary Information Schedule of Revenues, Expenditures, and Changes in Fund Balances –
Budget and Actual – Debt Service Fund 80

(4)
WILLMAR PUBLIC SCHOOLS INDEPENDENT SCHOOL DISTRICT 347
TABLE OF CONTENTS (continued) III. STATISTICAL SECTION (Unaudited) Net Assets by Component 82
Expenses, Program Revenues, and Net (Expense)/Revenue 83 General Revenues and Total Change in Net Assets 84 Fund Balances, Governmental Funds 85
Governmental Funds Revenues 86 Governmental Funds Expenditures and Debt Service Ratio 87
Governmental Funds Other Financing Sources and Uses and Net Change in Fund Balances 88 Assessed Value and Actual Value of Taxable Property 89 Direct and Overlapping Property Tax Rates 90 Principal Property Tax Payers 91 Property Tax Levies and Collections 92 Outstanding Debt by Type 93 Direct and Overlapping Governmental Activities Debt 94 Legal Debt Margin Information 95 Ratios of Outstanding Debt by Type 96 Demographic and Economic Statistics 97
Principal Employers 98 Full-Time-Equivalent District Employees by Type 99
Operating Statistics 100 Teacher Base Salaries 101 School Building Information – Owned Buildings 102 Schedule of Insurance Coverage 104
(5)
COMPREHENSIVE ANNUAL FINANCIAL REPORT
FISCAL YEAR ENDED JUNE 30, 2011
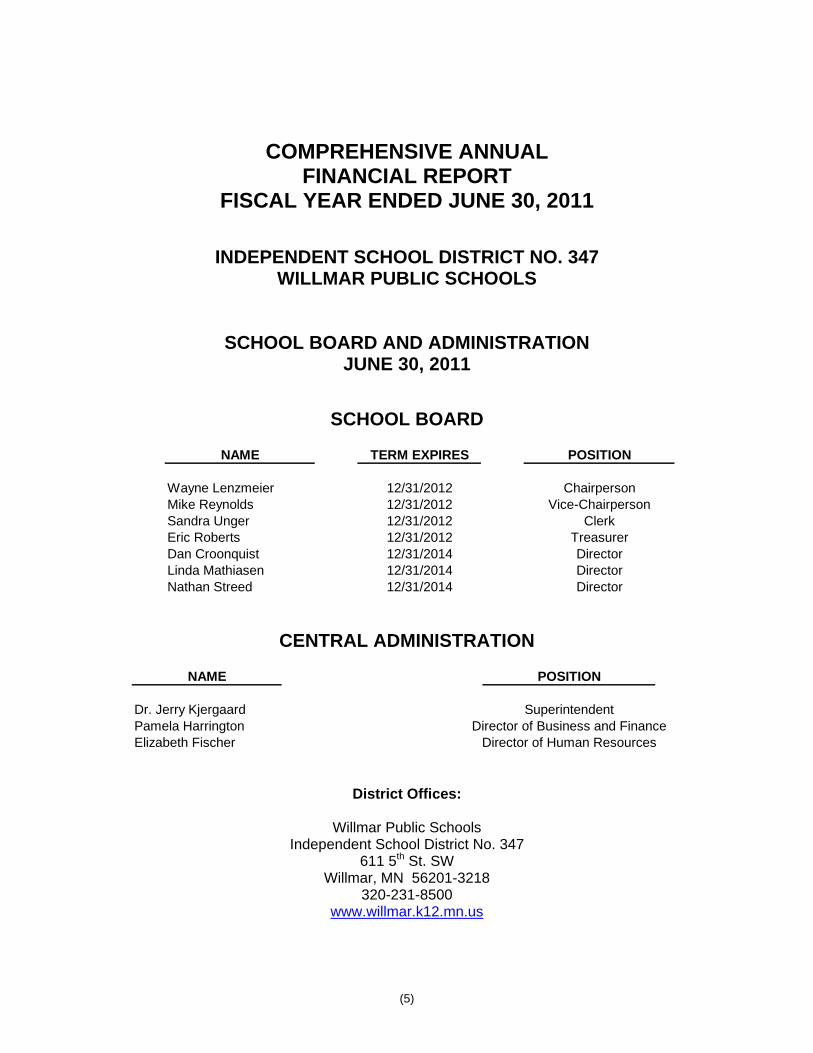
INDEPENDENT SCHOOL DISTRICT NO. 347 WILLMAR PUBLIC SCHOOLS
SCHOOL BOARD AND ADMINISTRATION JUNE 30, 2011
SCHOOL BOARD
NAME TERM EXPIRES POSITION
Wayne Lenzmeier 12/31/2012 ChairpersonMike Reynolds 12/31/2012 Vice-ChairpersonSandra Unger 12/31/2012 ClerkEric Roberts 12/31/2012 TreasurerDan Croonquist 12/31/2014 DirectorLinda Mathiasen 12/31/2014 DirectorNathan Streed 12/31/2014 Director
CENTRAL ADMINISTRATION
NAME POSITION
Dr. Jerry Kjergaard SuperintendentPamela Harrington Director of Business and FinanceElizabeth Fischer Director of Human Resources
District Offices:
Willmar Public Schools Independent School District No. 347
611 5th St. SW Willmar, MN 56201-3218
320-231-8500 www.willmar.k12.mn.us

(6)
INDEPENDENT SCHOOL DISTRICT NO. 347 WILLMAR PUBLIC SCHOOLS
ORGANIZATIONAL CHART
JUNE 30, 2011

(This page intentionally left blank)

(7)
November 14, 2011 To: Citizens of Independent School District 347 Members of the Board of Education Employees of the District INTRODUCTION The Comprehensive Annual Financial Report of Willmar Public Schools – Independent School District No. 347 (District) is submitted for the fiscal year (FY) ended June 30, 2011. The enclosed information is accurate in all material respects and reported in a manner that fairly presents the District’s financial position and results of operations. The District Administration accepts full responsibility for the accuracy, completeness and fairness of this presentation. This report is prepared in conformance with United States Generally Accepted Accounting Principles (GAAP). This report is also consistent with legal reporting requirements of the State of Minnesota. In addition to meeting legal requirements, this report is intended to present a comprehensive summary of significant financial data to meet the needs of citizens, taxpayers, employees, financial institutions, and the School Board. Since the implementation of Governmental Accounting Standards Board (GASB) Statement No. 34, the readers of this financial report will notice that the two main financial statements created by this standard, the Statement of Net Assets along with the Statement of Activities, do not contain numerous columns for various funds that have been included in past governmental financial statements. These two statements consolidate much of the information contained in fund-based financial statements of the past into two statements which help to answer the question: “Is the District better or worse off financially than it was in the previous year?” A comparison of net assets should help the reader in answering that question. Also required as part of the “Required Supplementary Information” by GASB Statement No. 34 is a “Management’s Discussion and Analysis” (MD&A) which allows the District to explain in layman’s terms its financial position and results of operations of the past fiscal year. REPORT FORMAT The comprehensive annual financial report is presented in three sections. Introductory Section – includes this letter of transmittal, an organizational chart, and a list of School Board members and administrative personnel. The Introductory Section is not audited. Financial Section – includes the independent auditor’s report, Management’s Discussion and Analysis (MD&A), basic financial statements, notes to the financial statements, required supplementary information and supplementary information. Statistical Section – includes selected financial, demographic and economic information, generally presented on a multi-year comparative basis. The Statistical Section is not audited.
Independent School District 347611 SW 5th St., Willmar, MN 56201
Phone: 320/231-8500 Fax: 320/231-8504
www.willmar.k12.mn.us
JERRY L. KJERGAARD, Ed. D., Superintendent PAMELA J. HARRINGTON, Director of Business and Finance
ELIZABETH A.FISCHER, Director of Human Resources

(8)
REPORTING ENTITY AND ITS SERVICES Independent School District No. 347, also known as the Willmar Public Schools, is an instrumentality of the State of Minnesota established to function as an educational institution. The District is an independent entity governed by an elected seven member School Board. The School Board has the power and duty to set budgets, certify tax levies, issue debt and perform other tasks necessary to the operation of the District. The District is subject to the oversight of the Minnesota Department of Education. The District does not have any component units. The District, established in 1881, serves the communities of Blomkest, Kandiyohi, Pennock and Willmar. The District is located in west-central Minnesota, approximately 100 miles west of the Minneapolis/St. Paul metropolitan area. The District encompasses an area of approximately 149,294 acres in Kandiyohi County with an estimated population of 24,605 citizens, including a population of 19,610 in Willmar. All school buildings are located in Willmar. The District currently operates eight owned buildings with a total square footage of 844,888 square feet and an average age of over 55 years, with the oldest building built in 1924. The Willmar Public Schools enrollment for FY 2011 is 3,987 ADM’s (Average Daily Membership). The District projects that enrollment will level off with just slight variations up or down from year to year. More detailed enrollment information is included in the Financial Section in the MD&A. The District provides a full range of public education services appropriate to our students in grade levels ranging from pre-kindergarten through grade 12. These services include regular and enriched academic education, special education and career/vocational education. Food service and transportation are provided as supporting programs. The District’s community education program includes Early Childhood and Family Education programs, Adult Basic Education programs, School Readiness and a wide variety of classes for lifelong learning experiences for children and adults. ECONOMIC CONDITION AND OUTLOOK The area is feeling the impact of the economic recession. The City of Willmar serves as a regional center for medical care, retail, trade, education and small industries. The diversity of the economic base had provided stability. Willmar is seeing more and more housing foreclosures and homes sitting vacant. Businesses have laid off staff or reduced hours. It seems to be better for the District when businesses reduce hours versus laying off staff because families are less likely to look for employment outside of the District. The City of Willmar was named an “All American City” in June 2005 by the National Civic League. Since 1949, only 18 Minnesota cities have received this significant honor. Willmar has experienced some economic downturns and the unemployment rate has increased from 5.9% in 2010 to 6.0% in 2011. Some companies have opted to reduce employees work weeks in lieu of full layoffs. With the exception of voter approved operating and bond referendums, the District is dependent on the State of Minnesota for its revenue authority. Recent experience demonstrates that legislated revenue increases are not sufficient to meet instructional program needs and increased costs due to inflation. As a result of these pressures, the District has had to rely on a property tax referendum to support its educational programs. The voters approved an operating referendum in 2001, scheduled to expire in calendar year 2012. An increase in revenues from the 2001 operating referendum began in FY 2003. The voters approved an additional operating referendum in 2008 that began in FY 2010. In November 2011, the District will ask the voters to renew the expiring operating referendum from 2001 and replace it with a referendum of an equal amount for nine years. In addition to passing the operating referendum, the School Board cut $1.8 million in expenditures from the FY 2002 Budget. Additional budget cuts (primarily personnel) were enacted for FY 2006 ($800,000) and FY 2007 ($771,000). The District carefully added approximately $800,000 in programming and services to positively impact student learning during the FY 2008 school year. The budget was reduced $1,300,000 for FY 2009. Budget reductions again occurred for the FY 2010 school year in the amount of $2.7 million and for FY 2011 in the amount of $1.7 million. The District will continue to be proactive in its financial management by seeking all available sources of revenue, responding to enrollment changes, controlling expenditures and seeking maximum efficiencies. Continued use of state of the art enrollment and long-range financial planning software, a Finance Advisory Committee (including

(9)
community members), updated budgeting processes, and a business office culture of continuous improvement all will continue contributing towards the quest for financial stability into the future. The financial future for the District looks challenging. The 2009 Legislature approved a freeze in the General Education formula for 2009-2010 and 2010-2011. The result of this funding formula freeze is budget reductions and decrease of services provided to students. The District received some state funding replacement in 2009-10 in form of the American Recovery and Reinvestment Act of 2009 stabilization funding. Accordingly, the District continues to utilize sophisticated enrollment and financial planning tools, along with detailed and conservative budgeting and budget monitoring processes. The District will continue to seek all available sources of funding, balance revenue to expenditures, and maintain systems that ensure financial stability. If state funding remains below inflation levels, General Fund budget deficits will grow and the fund balance will decline in subsequent years. The 2011 legislature increased the basic formula allowance $50 for 2011-12 and $50 for 2012-13. MISSION STATEMENT
Preparing All Students for a Successful Tomorrow
Purposeful Thinker Effective Communicator
Self Directed Learner Productive Group Participant
Responsible Citizen
Long Term District Wide Goal
Increase the academic proficiency of all students through effective instruction and appropriate curriculum and assessments in partnership with all staff as well as parents, guardians and community members.
In order to meet our mission and reach our goal it is understood that we must all work collaboratively to provide
for the social, physical and emotional well being of every child. The School Board reviewed and revised the major District-wide goals in FY 2010:
Improve student lives Achievement for all students Fiscally responsible stewardship Strengthen school/community relationships to improve learning for all students
A copy of the strategic plan document based on the above goals is available in the District Office or from a building Administrator. FINANCIAL AND BUDGETARY CONTROL The District complies with the Uniform Financial Accounting and Reporting Standards (UFARS) for Minnesota schools. UFARS, established in 1976, dictates a modified accrual basis of accounting. An audited annual financial report is required to be provided to the Minnesota Department of Education by December 31, subsequent to the year end on June 30. The District has established and maintained internal controls designed to ensure that the assets of the District are protected from theft, misuse or losses. These controls are also designed to ensure that adequate accounting data are compiled to allow for the preparation of financial statements in conformity with U.S. generally accepted accounting principles (GAAP) and Minnesota UFARS. The internal control system is designed to provide reasonable, but not absolute, assurance that these objectives are met. The concept of reasonable assurance recognizes that: 1) the cost of a control should not exceed the benefits likely to be derived, and 2) the valuation of the costs and benefits requires estimates and judgments by management.

(10)
Minnesota school finance law requires that the budget fiscal year begin July 1 and end June 30. The District develops a General Fund Budget, Food Service Fund Budget, Community Service Fund Budget, Debt Service Budget and other necessary budgets on an annual basis. The budget process is comprised of five phases – planning, preparation, adoption, implementation, and evaluation. Planning and preparation for the FY 2011 budget began in December of 2009 with approval of the budget development plan and analysis of the student enrollment trend. The current enrollment status provided the data to update allocations for site non-payroll budgets. Expenditure estimates were updated both on a site basis and district-wide in the spring. An enrollment projection was developed in early April and provided the key data for the budget’s revenue projection. The FY 2011 Budget was adopted in June of 2010 and implemented on July 1, 2010. The District completes a budget revision during the fiscal year normally in April. To accurately track and report financial activities with a focus on site responsibility, approximately 9,193 account codes have been defined in the District’s chart of accounts. The District’s budget and financial management practices are evidenced by the following District policies:
Fund Balance Policy #714: Requires the District to strive for a minimum General Fund unassigned fund balance of 6% of the annual operating budget. When the unassigned fund balance is equal to or less than 6% of the expenditure budget, the administration shall alert the School Board and propose alternative measures such as, seeking additional funds through a referendum and/or reducing expenditures by curtailing program services. This policy also includes guidance related to GASB 54 which changes the classifications and parameters of fund balances. The fund balance categories are assigned, committed, nonspendable, restricted and unassigned.
Budgeting Policy #709 and 709.1: Requires the District to comply with the budget process as explained above.
MAJOR INITIATIVES
Fiscal and Operational Integrity
The District is committed to maintaining the General Fund according to Board Fund Balance Policy. The Willmar Public Schools is also committed to implementing and maintaining systems that ensure financial stability and operational efficiency. Due to the combined effort of the Community, School Board, staff and students, the District’s General Fund has remained at a reasonable and responsible level. The District’s sound fiscal management has a long-term positive impact on the student success. A sophisticated long-range financial planning model, a detailed enrollment projection model, a Finance Advisory Committee, enhanced communication, consistently improved financial accuracy and compliance, and improved budgeting and accounting processes all have played a role in the District’s financial stability. The District encourages constituents to look closely at the financial performance and management. The District welcomes the opportunity to be fully accountable to the School Board, Staff and Community. Major fiscal and operational initiatives from FY 2011 include:
The School Board decreased the FY 2012 Budget in June 2011. Positions were reduced due to the completion of American Recovery and Reinvestment Act funding.
Sale of Washington Building on April 22, 2011. In an effort to be fiscally responsible, the District sold the Washington Building to the Affiliated Community Medical Center.
Three National Financial Awards and one State Financial Award were received in 2011 – See the
Financial Awards section on page 12 for more information.

(11)
The Food & Nutrition Services Department received the federal Fresh Fruits and Veggies Grant – The Fresh Fruits and Veggies program provided an afternoon snack of fruits and vegetables to be served in both of the elementary schools.
Planning of an operating referendum question for November 2011 – The District began planning for
an operating referendum question that will be posed to the public in November 2011. The referendum would renew a current referendum set to expire in FY 2013.
Mandarin Chinese program in the Senior High expanded – The Mandarin Chinese program in the
Senior High continues to be very successful. The District was awarded a very prestigious grant that put a teacher from China in a Senior High classroom teaching Chinese in FY 2010 and FY 2012.
Student Achievement
The District’s mission is “To Prepare All Students for a Successful Tomorrow.” That mission is met with an intense effort at all levels of the Willmar Public Schools.
In order to have our mission become a reality, academic standards of the Willmar Public Schools are high. We use the Minnesota state standards in Mathematics, English Language Arts, Social Studies, Science and Art as the core of our curriculum. We use national or international standards in Business, Industrial Technology, Agriculture, World Languages, Health, Physical Education and Music.
Teaching our students to become contributing members of our society is also a high priority. Students, teachers and support staff participate in many community-building initiatives, such as service clubs, and volunteer activities. Character education is an integrated and important part of the education of all students.
Our high school leads all area schools in offering Advanced Placement (AP) opportunities in numerous subject areas. All students in grades 2 – 8 take the Northwest Educational Assessment (NWEA) exams three times a year in reading and mathematics. Students in grades 9-10 also take these tests, as appropriate to their course of study. Growth is measured individually, as well as by classroom and districtwide. Opportunities for remediation and acceleration are available. In addition to national standardized tests and state assessments, formative and summative assessments are an expectation for all classroom teachers for all students.
The federal No Child Left Behind (NCLB) law requires schools to demonstrate that students are meeting Adequate Yearly Progress (AYP) goals. This progress is measured by the Minnesota Comprehensive Assessments (MCA). Each year the achievement bar is set higher for districts, leading to the goal of all students being proficient in reading and math by 2013-2014. Due to the state shutdown in July, AYP results were not available at the time of this report.
Student Achievement Programs & Improvements:
Continue to offer all-day, everyday kindergarten to better serve the needs our young learners as well as to attempt to close the achievement gap early.
Continue to use NWEA testing in math and reading in grades 2-10 as a means of assessing student growth, as well as program and instructional quality. Use the NWEA science test at the middle school and high school, as appropriate to grade and course. Pilot NWEA testing in kindergarten.
Maintain and update a comprehensive strategic work plan that addresses goals and objectives for all District sites.
Continue to offer a Mandarin Chinese language class at the Senior High School in FY 2011-12. Curriculum maps are developed according to the curriculum review cycle. They are available on the
District website. This provides public awareness of curriculum content, assessment and implementation of standards.
Continue to offer Project Lead the Way during the 2011-12 school year. Staff continues to be trained in this pre-engineering course of study.
Maintain an active Curriculum Advisory Committee comprised of interested community members, parents and students.

(12)
Provide Targeted Services summer and after-school programming for students needing academic and social development. Enrollment in the program is very strong.
The District Site Council is involved in staff development activities and the funding of teacher-generated “Best Practices” initiatives.
Gifted and Talented Education dollars are used for enrichment activities at the building level. This allows the District to provide additional opportunities for students needing acceleration and enrichments.
Capitalize on volunteers, foundations, and the Parent-Teacher-Student-Association’s willingness to bring value added opportunities to students via curriculum enhancements, student life enhancements, and hundreds of hours of assistance in the classroom.
CASH MANAGEMENT Temporary cash balances during the year are invested in various securities per the District Investment Policy and statute. The District uses a twelve month cash flow projection, updated monthly, to guide investment terms. The District’s investment policy is structured to minimize risk while maintaining a competitive yield. Accordingly, deposits are either insured by federal depository insurance or collateralized in compliance with Minnesota statutes. Investment yield during FY 2011 ranged from 0.07% to 1.40%, resulting in a total net return of $39,820. DEBT ADMINISTRATION As of June 30, 2011, the District had net bonded debt (including bond premiums) of $8,145,811, well below the legal limit of $261,766,925, or fifteen percent of the actual value of all taxable property in the District. Outstanding bonds are reviewed on a continuous basis by the District and its bond consultant to determine if refunding is feasible. The District’s bond rating is at the Aa3 level. RISK MANAGEMENT The District maintains a comprehensive risk management program that includes a property/casualty insurance program specifically designed to meet school district needs. Other key aspects of the risk management program include a health & safety consultation arrangement, an active health & safety committee, annual safety inspections and periodic review of policies to assure regulatory compliance and adherence to legal constructs. INDEPENDENT AUDIT District policy and state statutes require an annual financial audit by independent certified public accountants. The District engaged Conway, Deuth & Schmiesing, PLLP to conduct the annual audit. The District also engaged Conway, Deuth & Schmiesing, PLLP to perform the audit of its federal programs in accordance with U.S. Office of Management and Budget (OMB) Circular A-133, Audits of States, Local Governments, and Non-Profit Organizations. The District’s federal programs are discussed in a report separate from the comprehensive annual financial report. FINANCIAL AWARDS The Association of School Business Officials (ASBO) International awarded the Certificate of Excellence in Financial Reporting to the District for its Comprehensive Annual Financial Report for the fiscal year ended June 30, 2010. This is the sixth year in a row the District received this award. Achieving recognition by this program provides a clear indication of the District’s high standards for financial reporting and financial stewardship. It is the belief that this current report conforms to the Certificate of Excellence program requirements. This report will be submitted to ASBO to determine its eligibility for the certificate. The Government Finance Officers Association of the United States and Canada (GFOA) awarded a Certificate of Achievement for Excellence in Financial Reporting to the Willmar Public Schools for its comprehensive annual financial report for the fiscal year ended June 30, 2010. This was the sixth year that the District has achieved this prestigious award. In order to be awarded a Certificate of Achievement, a government must publish an easily readable and efficiently organized comprehensive annual financial report. This report must satisfy both generally accepted accounting principles and applicable legal requirements. A Certificate of Achievement is valid for a period of one year only. It is the belief that this current comprehensive annual financial report continues to meet
(13)
the Certificate of Achievement Program’s requirements and it is being submitted to the GFOA to determine its eligibility for another certificate. ASBO awarded the Meritorious Budget Award to the District for its FY 2008, FY 2009, FY 2010 and FY 2011 Original Budgets. The Meritorious Budget Award is the highest form of recognition in budgeting for school districts. The award is presented after the document has been through a comprehensive review by an independent panel of budget professionals. The review not only critiques the budget document using rigorous criteria but also provides feedback with suggested comments for improvements. The Minnesota Department of Education awarded a School Finance Award for FY 2011 to the Willmar Public Schools for its exhibition of sound fiscal health and financial management policies and procedures. The award is based on compliance with state statute on a number of finance issues and other means of demonstrating fiscal health. The District has received the award in FY 2004, FY 2005, FY 2008, FY 2009, FY 2010 and FY 2011. ACKNOWLEDGEMENTS Preparation of this report could not have been accomplished without the efficient and dedicated services of the Business Office staff. We very much appreciate the hard work and expertise from our auditors, Conway, Deuth & Schmiesing, PLLP. Their work has been instrumental in the preparation of this document. Finally, thanks also go to Sam Modderman, Kandiyohi County Auditor/Treasurer and his staff for their assistance with this report. We would like to express our appreciation to the School Board for the interest and support in planning and conducting the financial operations of the District in a responsible and progressive manner. Sincerely,
Dr. Jerry Kjergaard Pam Harrington Superintendent Director of Business and Finance

(14)

(15)

(This page intentionally left blank)

(16)
FINANCIAL SECTION

To The Board of EducationIndependent School District #347Willmar, Minnesota
(17)
As discussed in the notes to the basic financial statements, the District adopted the provisions of Governmental Accounting Standards Board Statement No. 54, Fund Balance Reporting and Governmental Fund Type Definitions for the year ended June 30, 2011. Adoption of the provisions of this statement results in significant changes to the classifications of the components of fund balance.
INDEPENDENT AUDITOR'S REPORT
We have audited the accompanying financial statements of the governmental activities, each major fund, and the aggregate remaining fund information of Independent School District #347, Willmar, Minnesota, as of and for the year ended June 30, 2011, which collectively comprise the District’s basic financial statements as listed in the table of
contents. These financial statements are the responsibility of the District's management. Our responsibility is to express opinions on these financial statements based on our audit. The prior year partial comparative information has been derived from the District's 2010 financial statements and, in our report dated November 8, 2010, we expressed unqualified opinions on the respective financial statements of the governmental activities, each major fund, and the aggregate remaining fund information.
We conducted our audit in accordance with auditing standards generally accepted in the United States of America and the standards applicable to financial audits contained in Government Auditing Standards, issued by the Comptroller General of the United States. Those standards require that we plan and perform the audit to obtain reasonable assurance about whether the financial statements are free of material misstatement. An audit includes examining, on a test basis, evidence supporting the amounts and disclosures in the financial statements. An audit also includes assessing the accounting principles used and the significant estimates made by management, as well as evaluating the overall financial statement presentation. We believe that our audit provides a reasonable basis for our opinions.
In our opinion, the financial statements referred to above present fairly, in all material respects, the respective financial position of the governmental activities, each major fund, and the aggregate remaining fund information of Independent School District #347, Willmar, Minnesota, as of June 30, 2011, and the respective changes in financial position, and cash flows, where applicable, thereof and the respective budgetary comparison for the General Fund and the Food Service and Community Service Special Revenue Funds for the year then ended in conformity with accounting principles generally accepted in the United States of America.

Independent School District #347Page 2
CONWAY, DEUTH & SCHMIESING, PLLPCertified Public AccountantsWillmar, Minnesota
November 14, 2011
(18)
Our audit was conducted for the purpose of forming opinions on the financial statements that collectively comprise the District's basic financial statements as a whole. The Introductory Section, individual fund financial statement, and Statistical Section are presented for purposes of additional analysis and are not a required part of the financial statements. The individual fund financial statement is the responsibility of management and was derived from and relate directly to the underlying accounting and other records used to prepare the financial statements. The information has been subjected to the auditing procedures applied in the audit of the financial statements and certain additional procedures, including comparing and reconciling such information directly to the underlying accounting and other records used to prepare the financial statements or to the financial statements themselves, and other additional procedures in accordance with auditing standards generally accepted in the United States of America. In our opinion, the information is fairly stated in all material respects in relation to the financial statements as a whole. The Introductory and Statistical Sections have not been subjected to the auditing procedures applied in the audit of the basic financial statements and, accordingly, we do not express an opinion or provide any assurance on them.
Accounting principles generally accepted in the United States of America require that the Management's Discussion and Analysis and the Schedules of Funding Progress and Employer Contributions as listed in the table of contents be presented to supplement the basic financial statements. Such information, although not a part of the basic financial statements, is required by the Governmental Accounting Standards Board, who considers it to be an essential part of financial reporting for placing the basic financial statements in an appropriate operational, economic, or historical context. We have applied certain limited procedures to the required supplementary information in accordance with auditing standards generally accepted in the United States of America, which consisted of inquiries of management about the methods of preparing the information and comparing the information for consistency with management's responses to our inquiries, the basic financial statements, and other knowledge we obtained during our audit of the basic financial statements. We do not express an opinion or provide any assurance on the information because the limited procedures do not provide us with sufficient evidence to express an opinion or provide any assurance.
In accordance with Government Auditing Standards, we have also issued our report dated November 14, 2011, on our consideration of the District's internal control over financial reporting and on our tests of its compliance with certain provisions of laws, regulations, contracts, and grant agreements and other matters. The purpose of that report is to describe the scope of our testing of internal control over financial reporting and compliance and the results of that testing, and not to provide an opinion on the internal control over financial reporting or on compliance. That report is an integral part of an audit performed in accordance with Government Auditing Standards and should be considered in assessing the results of our audit.

INDEPENDENT SCHOOL DISTRICT #347
MANAGEMENT’S DISCUSSION AND ANALYSIS YEAR ENDED JUNE 30, 2011
(19)
This section of Willmar Public Schools – Independent School District No. 347’s (District) annual financial report presents management’s discussion of the District’s financial performance during the fiscal year (FY) ending June 30, 2011. Please read it in conjunction with the District’s financial statements, which follow this section. The Management’s Discussion and Analysis (MD&A) is an element of a reporting model that is required by the Governmental Accounting Standard Board’s (GASB) Statement No. 34 – Basic Financial Statements – and Management’s Discussion and Analysis – for State and Local Governments issued in June 1999. Statement No. 34 contains significant requirements that enhance financial reporting. These requirements are also designed to make annual reports easier for the public to understand and more useful to stakeholders. Specifically, Statement No. 34 establishes reporting requirements that include financial statements, expanded disclosure, and supplemental information, including the MD&A (this section). FINANCIAL REVIEW
Key financial items for the 2010-2011 fiscal year include the following: The General Fund unassigned fund balance again exceeded the School Board’s fund balance
goal of 6% of expenditures with a fund balance of $5,900,273, equivalent to 14.2% of expenditures. The fund balance also exceeded the revised budget estimate of $5,137,511 or 12.1% of expenditures. The additional fund balance is attributed to the settlement of the lawsuit related to the high school building and to strategic under spending of budgeted expenditures in the areas of purchased services and supplies. The increased fund balance puts the district in a position to better weather the economical financial storm that continues to impact revenue and cash flow.
Net Assets increased 16.0% from the prior year due to the decrease of current and long-term
liabilities and the increased unassigned fund balance as discussed above.
The combined Governmental Funds fund balance increased by 26.2%, or $2,092,392.
The overall net decrease to the District’s long-term liabilities was $1,893,942, or 12.0%.
Enrollment decreased by 45 ADM’s (Average Daily Membership) in FY 2011. The District expects enrollment to increase and decrease slightly each year as enrollment remains fairly level.
Four Financial Awards: The District’s comprehensive annual financial report for the year ended June 30th, 2010 was awarded several prestigious financial reporting awards by the Government Finance Officers Association of the United States and Canada (GFOA) and the Association of School Business Officials International (ASBO). The District’s Original 2010-11 Budget received the ASBO Meritorious Budget Award. The District also received the Minnesota Department of Education 2011 School Finance Award.

INDEPENDENT SCHOOL DISTRICT #347
MANAGEMENT’S DISCUSSION AND ANALYSIS YEAR ENDED JUNE 30, 2011
(20)
OVERVIEW OF THE FINANCIAL STATEMENTS
The financial section of the annual report consists of three parts. They are: Independent Auditor’s Report, Required Supplementary information which includes the Management’s Discussion and
Analysis (this section), and Basic financial statements
The basic financial statements include two kinds of statements that present different views of the District:
The government-wide financial statements, including the Statement of Net Assets and the Statement of Activities, provide both short-term and long-term information about the District’s overall financial status.
The remaining statements are fund financial statements that focus on individual parts of the District, reporting the District’s operations in more detail than the government-wide statements. The District maintains three groups of fund financial statements. They are:
o The governmental funds statements tell how basic services such as regular and
special education were financed in the short-term as well as what remains for future spending.
o Proprietary funds statements offer short and long-term financial information about the activities the District operates like businesses.
o Fiduciary funds statements provide information about the financial relationships in which the District acts solely as a trustee or agent for the benefit of others to whom the resources belong.
The financial statements also include notes that explain some of the information in the statements and provide more detailed data. Government-wide Statements
The government-wide statements (Statement of Net Assets and Statement of Activities) report information about the District as a whole using accounting methods similar to those used by private sector companies. The Statement of Net Assets includes all of the District’s assets and liabilities. All of the current year’s revenues and expenses are accounted for in the Statement of Activities regardless of when cash is received or paid. The two government-wide statements report the District’s net assets and how they have changed. Net assets – the difference between the District’s assets and liabilities – is one way to measure the District’s financial health or position.
Over time, increases or decreases in the District’s net assets are an indicator of whether its financial position is improving or deteriorating, respectively.
To assess the overall health of the District, one needs to consider additional non-financial factors such as changes in the District’s property tax base and the condition of school buildings and other facilities.

INDEPENDENT SCHOOL DISTRICT #347
MANAGEMENT’S DISCUSSION AND ANALYSIS YEAR ENDED JUNE 30, 2011
(21)
OVERVIEW OF THE FINANCIAL STATEMENTS (CONTINUED)
In the government-wide financial statements the District’s activities are shown in one category titled Governmental Activities:
Governmental Activities – Most of the District’s basic services are included here, such as regular and special education, transportation, administration, food service, and community education. Property taxes and state aids finance most of these activities.
Fund Financial Statements
The fund financial statements provide more detailed information about the District’s funds – focusing on its most significant or “major” funds – rather than the District as a whole. Funds are accounting devices the District uses to keep track of specific sources of funding and spending on particular programs:
Some funds are required by State law and by bond covenants. The District establishes other funds to control and manage money for particular purposes, such
as a Scholarship fund to manage scholarship money. The District has three kinds of funds:
Governmental funds – The District’s basic services are included in governmental funds, which generally focus on: 1) how cash and other financial assets that can readily be converted to cash flow in and out, and 2) the balances left at year-end that are available for spending. Consequently, the governmental funds statements provide a detailed short-term view that helps to determine whether there are more or fewer financial resources that can be spent in the near future to finance the District’s programs. Because this information does not encompass the additional long-term focus of the government-wide statements, additional information (reconciliation schedules) is provided following the governmental funds statements that explains the relationship (or differences) between these two types of financial statement presentations.
Proprietary funds – Services for which the District charges a fee are generally reported in proprietary funds. Proprietary funds are reported in the same way as the government-wide statements. The District’s sole Proprietary fund is an internal service fund.
o The District uses internal service funds to report activities that provide supplies and services for the District’s other programs and activities. The District currently has one internal service fund for the dental self-insurance program.
Fiduciary funds – The District is a trustee, or fiduciary, for assets that belong to others, such as the Private-Purpose Trust Fund. This fund accounts for scholarship gifts and bequests. The District is responsible for ensuring that the assets reported in these funds are used only for their intended purposes and by those to whom the assets belong. The District’s fiduciary activities are reported in a separate Statement of Fiduciary Net Assets and Statement of Changes in Fiduciary Net Assets. These activities are excluded from the government-wide financial statements because the District cannot use these assets to finance its operations.

INDEPENDENT SCHOOL DISTRICT #347
MANAGEMENT’S DISCUSSION AND ANALYSIS YEAR ENDED JUNE 30, 2011
(22)
FINANCIAL ANALYSIS OF THE DISTRICT AS A WHOLE
Net Assets. As noted earlier, net assets may serve over time as a useful indicator of a government’s financial position. The District’s combined net assets were $26,233,525 on June 30, 2011. This was an increase of 16.00% from the previous year (see Table A-1 below).
The largest portion of the District’s net assets (83.6%) reflects its investment in capital assets (e.g., land, buildings and improvements, furniture, and equipment net of accumulated depreciation); less any related outstanding debt (such as general obligation bonds) used to acquire those assets. The District uses these capital assets to provide services to students; consequently, these assets are not available for future spending. Although the District’s investment in its capital assets is reported net of related debt, it should be noted that the resources needed to repay this debt must be provided from other sources, since the capital assets themselves cannot be used to liquidate these liabilities. Unrestricted net assets is primarily the District’s unassigned fund balance offset by the liability for future severance and health benefits, which is not fully funded.
Percentage2011 2010 Change
Current and Other Assets 19,410,640$ 18,922,373$ 2.58%Capital Assets 30,068,631 30,423,263 -1.17% Total Assets 49,479,271 49,345,636 0.27%
Current Liabilities 9,344,615$ 10,935,245$ -14.55%Long-term Liabilities 13,901,131 15,795,073 -11.99% Total Liabilities 23,245,746 26,730,318 -13.04%
Net Assets Invested in Capital Assets Net of Related Debt 21,922,820$ 20,076,453$ 9.20% Restricted 2,714,707 1,767,076 53.63% Unrestricted 1,595,998 771,789 106.79% Total Net Assets 26,233,525$ 22,615,318$ 16.00%
Governmental Activities
Table A-1The District's Net Assets

INDEPENDENT SCHOOL DISTRICT #347
MANAGEMENT’S DISCUSSION AND ANALYSIS YEAR ENDED JUNE 30, 2011
(23)
FINANCIAL ANALYSIS OF THE DISTRICT AS A WHOLE (CONTINUED)
A summary of the revenues and expenses for the last two fiscal years is presented in Table A-2 below.
Percentage2011 2010 Change
RevenuesProgram Revenues Charges for Services 2,310,914$ 2,258,163$ 2.34% Operating Grants and Contributions 17,035,838 18,501,962 -7.92% Capital Grants and Contributions 561,149 605,372 -7.31%General Revenues Property Taxes 8,464,670 6,352,927 33.24% Unrestricted State Aid 21,954,037 21,636,016 1.47% Investment Earnings 39,820 46,183 -13.78% Other 332,417 12,484 2562.74% Total Revenues 50,698,845 49,413,107 2.60%
Expenses Administration 1,524,753$ 1,653,919$ -7.81% District Support Services 1,115,708 949,578 17.50% Regular Instruction 21,090,133 20,103,140 4.91% Vocational Education Instruction 801,446 883,686 -9.31% Special Education Instruction 7,557,654 7,752,733 -2.52% Instructional Support Services 2,411,922 2,243,858 7.49% Pupil Support Services 3,457,085 3,538,480 -2.30% Sites and Buildings 4,215,561 3,508,797 20.14% Fiscal and Other Fixed Costs Programs 127,098 130,321 -2.47% Food Service 2,390,350 2,359,800 1.29% Community Service 2,257,943 2,064,867 9.35% Interest and Fiscal Charges on Long-Term Liabilities 363,922 464,890 -21.72% Total Expenses 47,313,575 45,654,069 3.63%
Excess (Deficiency) before Special Item 3,385,270 3,759,038 -9.94%
Special Item Gain on Sale of Land and Building 232,937 100.00%
Change in Net Assets 3,618,207$ 3,759,038$ -3.75% Beginning Net Assets 22,615,318 18,856,280 19.94% Ending Net Assets 26,233,525$ 22,615,318$ 16.00%
Governmental Activities for the fiscal year ended June 30,
Table A-2Change in Net Assets

INDEPENDENT SCHOOL DISTRICT #347
MANAGEMENT’S DISCUSSION AND ANALYSIS YEAR ENDED JUNE 30, 2011
(24)
FINANCIAL ANALYSIS OF THE DISTRICT AS A WHOLE (CONTINUED)
Changes in Net Assets. The District’s total revenues were $50,698,845 for the year ended June 30, 2011. This is a 2.60% increase from the prior year’s revenues. The District had one-time proceeds from the sale of land and a building, as well as, the settlement of a lawsuit related to the construction of the high school. Unrestricted State aid along with local property taxes accounted for 60.0% of the total revenue for the year (see Figure A-1 below). Another 39.7% came from restricted state, federal and local program revenues and the remaining 0.7% from earnings on investments and other. Total revenues surpassed expenses, increasing net assets $3,618,207 from last year. The District has been mindful of its spending due to the potential for future budget reductions.
The District’s total expenditures for programs and services were $47,313,575 for the year ended June 30, 2011. This is a 3.63% increase from the prior year’s expenses. The District’s expenses are predominantly related to student education (77.0%). (See Figure A-2). The purely administrative activities of the District accounted for just 3.2% of total costs.

INDEPENDENT SCHOOL DISTRICT #347
MANAGEMENT’S DISCUSSION AND ANALYSIS YEAR ENDED JUNE 30, 2011
(25)
FINANCIAL ANALYSIS OF THE DISTRICT AS A WHOLE (CONTINUED)
The net cost of all governmental activities is their total costs less program revenues applicable to each category. The total cost of all governmental activities for this year was $47,313,575. Table A-3 presents the costs of twelve major District activities such as instruction, food service and others. The table also shows each activity’s net cost (total cost less fees generated by the activities and intergovernmental aid provided for specific programs).
The users of the District’s programs paid for 4.8%, or $2,310,914 of the costs.
The federal and state governments subsidized certain programs with grants and contributions. This totaled $17,596,987, or 37.2% of the total costs for 2010-2011.
The remainder of the District’s costs ($27,405,674), however, were paid for by: 1) state taxpayers based on the statewide education aid formula, 2) by District taxpayers, and 3) by investment earnings.
Percentage Percentage2011 2010 Change 2011 2010 Change
Administration 1,524,753$ 1,653,919$ -7.81% 1,510,103$ 1,648,919$ -8.42% District Support Services 1,115,708 949,578 17.50% 1,072,403 907,759 18.14% Regular Instruction 21,090,133 20,103,140 4.91% 12,208,462 9,923,072 23.03% Vocational Education Instruction 801,446 883,686 -9.31% 759,024 818,649 -7.28% Special Education Instruction 7,557,654 7,752,733 -2.52% 2,319,969 2,546,266 -8.89% Instructional Support Services 2,411,922 2,243,858 7.49% 1,869,825 1,638,483 14.12% Pupil Support Services 3,457,085 3,538,480 -2.30% 3,359,942 3,445,307 -2.48% Sites and Buildings 4,215,561 3,508,797 20.14% 3,600,681 2,831,646 27.16% Fiscal and Other Fixed Costs Programs 127,098 130,321 -2.47% 127,098 130,321 -2.47% Food Service 2,390,350 2,359,800 1.29% (146,368) (208,558) -29.82% Community Service 2,257,943 2,064,867 9.35% 360,613 141,818 154.28% Interest and Fiscal Charges on Long-Term Liabilities 363,922 464,890 -21.72% 363,922 464,890 -21.72% Total 47,313,575$ 45,654,069$ 3.63% 27,405,674$ 24,288,572$ 12.83%
Total Cost of Services Net Cost of Services
Table A-3Change in Net Assets

INDEPENDENT SCHOOL DISTRICT #347
MANAGEMENT’S DISCUSSION AND ANALYSIS YEAR ENDED JUNE 30, 2011
(26)
FINANCIAL ANALYSIS OF THE DISTRICT’S FUNDS
The financial performance of the District as a whole is reflected in its governmental funds. At the end of the 2010-2011 fiscal year, the District’s governmental funds reported a combined fund balance of $10,063,625, a 26.2% increase from last year’s ending fund balance of $7,971,233. Revenues for the District’s governmental funds totaled $50,726,242 while total expenditures were $48,914,014. Other financing sources and the special item totaled $280,164. As a result, the District completed the year with an excess of revenues, other financing sources and special item over expenditures of $2,092,392. Discussion about each governmental fund follows. A summary of the revenues and expenditures reported on the governmental fund financial statements for the past two years appears in Table A-4 below:
Other Fund BalanceFinancing Increase
Sources(Uses)Revenues Expenditures and Special Item (Decrease)
General Fund 43,334,980$ 41,639,948$ 280,164$ 1,975,196$ Food Service Fund 2,540,507 2,425,425 115,082 Community Service Fund 2,283,602 2,252,741 30,861 Debt Service Fund 2,567,153 2,595,900 (28,747) Totals 50,726,242$ 48,914,014$ 280,164$ 2,092,392$
Other Fund BalanceFinancing Increase
Revenues Expenditures Sources(Uses) (Decrease)
General Fund 42,068,352$ 40,313,101$ 2,100$ 1,757,351$ Food Service Fund 2,570,666 2,359,800 210,866 Community Service Fund 2,241,563 2,027,701 213,862 Debt Service Fund 2,504,529 2,589,700 (85,171) Totals 49,385,110$ 47,290,302$ 2,100$ 2,096,908$
2010
Table A-4Revenues and Expenditures - Governmental Funds
2011

INDEPENDENT SCHOOL DISTRICT #347
MANAGEMENT’S DISCUSSION AND ANALYSIS YEAR ENDED JUNE 30, 2011
(27)
GENERAL FUND
The General Fund is used by the District to record the primary operations of providing educational services to students from kindergarten through grade 12. Pupil transportation activities and capital and major maintenance projects are also included in the General Fund. Enrollment. Funding for Minnesota school districts is largely driven by enrollment. The majority of Minnesota school districts are facing declining enrollment. Over the last five years, the District has averaged an annual 0.6% decline in the number of students. Figure A-3, below, shows that the number of students has generally decreased steadily since FY 2007 with enrollment increasing slightly in FY 2009 and declining again in the years that follow. The District expects enrollment to increase and decrease slightly each year as enrollment remains fairly level.
In general, the District has been experiencing enrollment decline which has been a function of demographic trends affecting the majority of Minnesota school districts. These trends include a decline in the number of households with children, lower overall populations of children, and increased mobility. In addition, the District also faces typical enrollment challenges from open enrollment options, drop outs and competition from local private schools and home schooling options. Looking into the near future, demographic trends point to a more level enrollment trend. The grade level sizes are evening out. However, the leveling out will include slight increases or decreases to enrollment each year. Willmar has experienced some small impacts to enrollment due to the difficult economic times the country is facing. A few businesses have laid off employees and some have relocated to places where there is work.

INDEPENDENT SCHOOL DISTRICT #347
MANAGEMENT’S DISCUSSION AND ANALYSIS YEAR ENDED JUNE 30, 2011
(28)
GENERAL FUND (CONTINUED)
The following table presents a summary of General Fund revenues:
Total General Fund revenue increased $1,266,628, or 3.0%, from the previous year. Basic general education revenue is determined by a state per student funding formula. Other state-authorized revenue, including operating levy referendum, involves an equalized mix of property tax and state aid revenue. Therefore, the mix of property tax and state aid can change significantly from year to year without any net change in revenue. Property taxes in 2011 were $1,848,239, or 49.4%, more than the prior year. The increase is mainly the result of a tax shift mandated by the state legislature. The legislature required district’s to recognize a portion for 2012 taxes in 2011 while decreasing state aid for the amount of the tax recognition. Interest earnings decreased $3,293 from the prior year as a result of declining interest rates due to the nationwide economic recession. Other local sources increased $378,948 due to the settlement of a lawsuit. The decrease to federal sources is a result of the of phase out of American Recovery and Reinvestment Act funds. The following table presents a summary of General Fund expenditures:
Amount PercentageSources 2011 2010 Difference Change
Local Sources Property Taxes 5,588,685$ 3,740,446$ 1,848,239$ 49.4% Interest Earnings 23,574 26,867 (3,293) -12.3% Other 1,520,443 1,141,495 378,948 33.2%State Sources 32,619,042 32,000,209 618,833 1.9%Federal Sources 3,583,236 5,159,335 (1,576,099) -30.5% Total General Fund Revenues 43,334,980$ 42,068,352$ 1,266,628$ 3.0%
Table A-5General Fund Revenues
Year Ended June 30,
Amount PercentageExpenditures 2011 2010 Difference Change
Salaries 23,944,081$ 23,671,721$ 272,360$ 1.2%Employee Benefits 7,554,843 7,429,186 125,657 1.7%Purchased Services 7,417,357 6,426,371 990,986 15.4%Supplies and Materials 1,573,048 1,282,198 290,850 22.7%Capital Expenditures 902,541 1,341,055 (438,514) -32.7%Other Expenditures 248,078 162,570 85,508 52.6% Total General Fund Expenditures 41,639,948$ 40,313,101$ 1,326,847$ 3.3%
Table A-6General Fund Expenditures
Year Ended June 30,

INDEPENDENT SCHOOL DISTRICT #347
MANAGEMENT’S DISCUSSION AND ANALYSIS YEAR ENDED JUNE 30, 2011
(29)
GENERAL FUND (CONTINUED)
Total General Fund expenditures increased $1,326,847 or 3.3% from the previous year. Salaries and employee benefits increased due to the addition of jobs related to federal Education Jobs funding. Benefits also increased due to the jobs created by the federal Education Jobs funding. The District continues to proactively pursue various cost containment measures to minimize the effect of rising health insurance premiums on the costs of the District’s employee compensation packages. Combined non-payroll expenditures (Purchased Services, Supplies & Materials, Capital Expenditures and Other Expenditures) increased $928,830 or 10.1%, compared to last year. The increase is mainly due to a shift between capital expenditures and purchased services. In 2010, an additional wing was added to Roosevelt Elementary School and was categorized as a capital expenditure. In 2011, many repair and maintenance projects were completed at the buildings and those projects are categorized as purchased services. Supplies increased due to reinstatement of a portion of the curriculum buy cycle. In summary, 2010-2011 General Fund revenues, other financing sources and special item exceeded General Fund expenditures by $1,975,196. As a result, the total fund balance is $8,326,208 at June 30, 2011. After deducting statutory reserves, committed constraints and nonspendable items, the unassigned fund balance increased from $4,798,469 on June 30, 2010 to $5,900,273 on June 30, 2011. Figure A-4, below, depicts the General Fund unassigned fund balance as a percentage of expenditures for fiscal years 2007 - 2011:
The graph above describing the District’s unassigned fund balance trend, offers the single best measure of the District’s overall financial health. The unassigned fund balance of $5,900,273 on June 30, 2011 represents 14.17% of annual expenditures.

INDEPENDENT SCHOOL DISTRICT #347
MANAGEMENT’S DISCUSSION AND ANALYSIS YEAR ENDED JUNE 30, 2011
(30)
GENERAL FUND (CONTINUED)
The District closely monitors the General Fund unassigned fund balance through use of a detailed financial planning model, initiating necessary budget revisions during the year and with monthly budget analysis. The School Board has adopted a formal fund balance policy to maintain a minimum 6 percent (as a percentage of expenditures) fund balance in the General Fund unassigned fund. General Fund Budgetary Highlights
The District is required to adopt an operating budget prior to the beginning of its fiscal year (July 1). Over the course of the year, the District revised the annual operating budget once. The budget amendment usually falls into two categories:
Implementing budgets for specially funded projects, which may include grants, adjusting staffing and various instructional building allocations based on enrollment, and budgeting for certain unspent funds that are required to be carried over from fiscal year 2010.
Changes in appropriations for significant unbudgeted costs.
While the District’s final budget for the General Fund anticipated that revenues, other financing sources and special item would exceed expenditures by $720,037, the actual results for the year show that revenues, other financing sources and special item exceeded expenditures by $1,975,196. The main reasons for the variance were due to the settlement of the lawsuit related to the high school building and due to strategic under spending of budgeted expenditures in the areas of purchased services and supplies to help reduce the necessity for future reductions.
FOOD SERVICE FUND
The Food Service Fund revenue for 2010-2011 totaled $2,540,507 and expenditures were $2,425,425, resulting in a fund balance increase of $115,082. This fund balance improvement was primarily a result of continued effective cost control in an effort to finance future kitchen remodel projects. The June 30, 2011 Food Service fund balance is $608,790. The Food Service Fund is anticipating the fund balance to remain steady or decline slightly as kitchen remodel projects continue in phases for 2011-2012. COMMUNITY SERVICE FUND
In 2010-2011, total revenues for the Community Service Fund were $2,283,602 and total expenditures were $2,252,741 resulting in a fund balance increase of $30,861. The Community Service fund balance as of June 30, 2011 is $524,763. Community Service continues to monitor the fund balance and make adjustments that allow for the optimal level of programming for the District.
DEBT SERVICE FUND
Revenues and expenditures for the District’s Debt Service Fund are tied directly to the District’s bond principal and interest payment schedules. The Debt Service Fund expenditures exceeded revenues by $28,747 in 2010-2011. The resulting fund balance decrease leaves the Debt Service Fund with a fund balance of $603,864 at June 30, 2011. This fund balance is only available for meeting future debt service obligations.

INDEPENDENT SCHOOL DISTRICT #347
MANAGEMENT’S DISCUSSION AND ANALYSIS YEAR ENDED JUNE 30, 2011
(31)
CAPITAL ASSET AND DEBT ADMINISTRATION Capital Assets
By the end of 2011, the District had net capital assets of $30,068,631 representing a broad range of capital assets, including school buildings, computer and audio-visual equipment, and other equipment for various instructional programs (see Table A-7 below). Total depreciation expense for the year was $1,321,363. More detailed information about capital assets can be found in Note 4 to the financial statements.
Construction Plans
The School Board has postponed any activity related to a potential bond referendum for facility needs due to the need to address revenue stability through an operating referendum. The School Board will continue to meet in a workshop setting with other local governmental entities annually to be apprised of other projects coming up in the District that will impact constituents of the city, county, and school district. Long-term Liabilities
At year-end, the District had $8,145,811 in general obligation bonds outstanding including bond premium. This is a decrease of 21.3% from the previous year - as shown in Table A-8. The District continues to pay down its debt, retiring $2,100,000 of outstanding bonds in the year ending June 30, 2011. The District implemented the Governmental Accounting Standards Board Statement No. 45 Accounting and Financial Reporting by Employers for Postemployment Benefits Other Than Pensions (GASB 45) during fiscal year 2009. The GASB 45 estimated liability is $981,886 at June 30, 2011. The District also has $4,757,215 in compensated absences payable and $16,219 in pension benefits payable at June 30, 2011. Other postemployment benefits payable consist of postemployment health insurance benefits available to employees as specified in the employee's employment contract upon retirement. Health benefits have been paid by the General Fund. Pension benefits payable consist of pension benefit payments available to employees as specified in the employee's employment contract upon retirement. Pension benefits are paid by the General and Special Revenue Funds. Compensated absences payable consists of unused vacation at June 30, 2011 and other compensated absences paid at retirement for certain employees based on the employment contract. In the past, vacation expense has been paid by the General, Food Service, and the Community Service Funds. Overall, the District’s outstanding long-term liabilities decreased by 12.0% in fiscal year 2011. More
PercentageAssets 2011 2010 Change
Capital Assets Not Being Depreciated 685,162$ 623,282$ 9.9%Land Improvements 3,141,819 3,146,715 -0.2%Buildings and Improvements 47,599,839 47,341,605 0.5%Equipment 6,010,787 6,006,397 0.1% Less: Accumulated Depreciation (27,368,976) (26,694,736) 2.5% Total Net Capital Assets 30,068,631$ 30,423,263$ -1.2%
Table A-7The District's Capital Assets
Year Ended June 30,

INDEPENDENT SCHOOL DISTRICT #347
MANAGEMENT’S DISCUSSION AND ANALYSIS YEAR ENDED JUNE 30, 2011
(32)
CAPITAL ASSET AND DEBT ADMINISTRATION (CONTINUED) detailed information about the District’s long-term liabilities is presented in Note 5 to the financial statements.
FACTORS BEARING ON THE DISTRICT’S FUTURE With the exception of a voter-approved operating referendum, the District is dependent on the State of Minnesota for its revenue authority. Recent experience demonstrates that legislated revenue increases have not been sufficient to meet instructional needs and increased costs due to inflation. The District has made significant spending reductions to remain fiscally responsible. The 2009 Legislative Session was completed in May 2009. The basic formula for 2009-2010 was held flat for the 2009-2010 and 2010-2011 school years. The 2011 Legislative Session resulted in a basic formula increase of $50 per year for 2011-12 and 2012-13. There is still quite a bit of concern regarding education funding in the future. In addition, the country has gone into an economic recession. The federal government enacted the American Recovery and Reinvestment Act of 2009 (ARRA) to provide additional money to states, schools, businesses, etc. The District benefited from the ARRA money in the 2009-2010 and 2010-2011 school years. The federal government also enacted the Education Jobs act to provide additional money to schools for 2010-2011. The state is no longer delaying aid payments to meet its cash flow needs but it has increased the amount of current revenue held back from 30% to 40% which is causing many districts to borrow money to meet obligations. Due to this change, the District will be issuing Aid Anticipation Certificates in the amount of $3,438,321 on August 25, 2011 to help meet the cash flow needs of the District during 2011-12. The District went to the voters in November 2008 to ask for additional operating revenue. The first operating referendum question passed and revenue increased $201.51 per pupil. The District went to the voters in November 2010 to ask the voters to revoke the soon to be expiring $498.49 per pupil operating referendum and replace it with a new $898.49 per pupil operating referendum. This operating referendum failed. The District will again go to voters in November 2011 to ask the voters to renew the $498.49 operating levy that is expiring. If the operating referendum passes the money will not be available to the District until the 2012-2013 school year. The Willmar area has felt the impact of the recession but continues to develop in some areas. Many businesses have reduced staff in order to remain viable during this economic crisis. The District feels the impact when service is slower or goods are no longer received in a timely manner. Willmar Electric Service reduced staff over the past year. Film Drop, Crown Floral, Gilday’s and other businesses
Beginning Ending Due WithinLong-Term Liabilities Balance Additions Reductions Balance One Year
Bonds Payable 9,935,000$ $ 2,100,000$ 7,835,000$ 2,200,000$ Bond Premium 411,810 100,999 310,811 100,999 Other Postemployment Benefits Payable 640,270 726,670 385,054 981,886 Pension Benefits Payable 28,149 69,106 81,036 16,219 Compensated Absences Payable 4,779,844 528,089 550,718 4,757,215 551,230 Total 15,795,073$ 1,323,865$ 3,217,807$ 13,901,131$ 2,852,229$
Table A-8The District's Long-Term Liabilities

INDEPENDENT SCHOOL DISTRICT #347
MANAGEMENT’S DISCUSSION AND ANALYSIS YEAR ENDED JUNE 30, 2011
(33)
FACTORS BEARING ON THE DISTRICT’S FUTURE (CONTINUED) closed their doors this year. Little Caesar’s, AT&T and Late Bloomers opened businesses in Willmar during the year. The District will strive to maintain its longstanding commitment to academic excellence and educational opportunity for students within a framework of financial fiduciary responsibility. CONTACTING THE DISTRICT’S FINANCIAL MANAGEMENT
This financial report is designed to provide District citizens, taxpayers, customers, investors and creditors with a general overview of the District’s finances and to demonstrate the District’s accountability for the money it receives. If you have questions about this report or need additional financial information, contact the Business Office, Independent School District 347, 611 5th St SW, Willmar, MN 56201-3297, visit the Finance section of the District website at www.willmar.k12.mn.us (click on District, Finance, and Finance Home), or contact Pam Harrington, Director of Business and Finance, at [email protected] or 320-231-8511.

(34)
BASIC FINANCIAL STATEMENTS
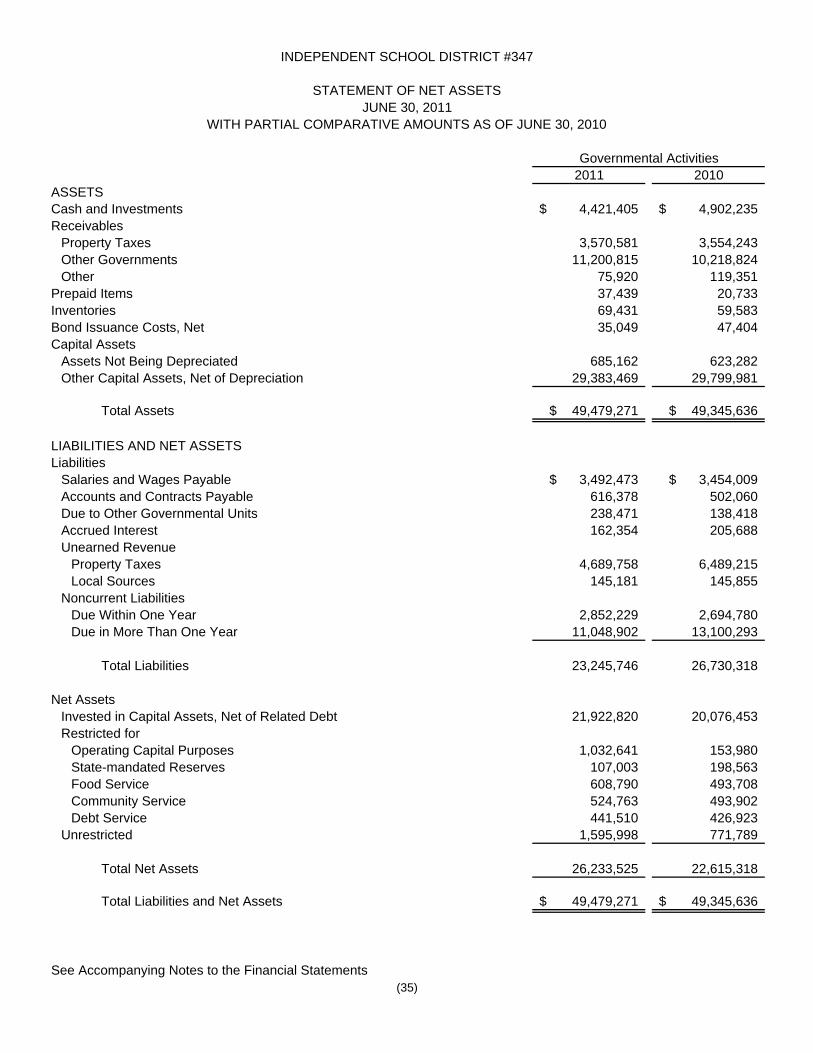
2011 2010ASSETSCash and Investments 4,421,405$ 4,902,235$ Receivables
Property Taxes 3,570,581 3,554,243 Other Governments 11,200,815 10,218,824 Other 75,920 119,351
Prepaid Items 37,439 20,733 Inventories 69,431 59,583 Bond Issuance Costs, Net 35,049 47,404 Capital Assets
Assets Not Being Depreciated 685,162 623,282 Other Capital Assets, Net of Depreciation 29,383,469 29,799,981
Total Assets 49,479,271$ 49,345,636$
LIABILITIES AND NET ASSETSLiabilities
Salaries and Wages Payable 3,492,473$ 3,454,009$ Accounts and Contracts Payable 616,378 502,060 Due to Other Governmental Units 238,471 138,418 Accrued Interest 162,354 205,688 Unearned Revenue
Property Taxes 4,689,758 6,489,215 Local Sources 145,181 145,855
Noncurrent LiabilitiesDue Within One Year 2,852,229 2,694,780 Due in More Than One Year 11,048,902 13,100,293
Total Liabilities 23,245,746 26,730,318
Net AssetsInvested in Capital Assets, Net of Related Debt 21,922,820 20,076,453 Restricted for
Operating Capital Purposes 1,032,641 153,980 State-mandated Reserves 107,003 198,563 Food Service 608,790 493,708 Community Service 524,763 493,902 Debt Service 441,510 426,923
Unrestricted 1,595,998 771,789
Total Net Assets 26,233,525 22,615,318
Total Liabilities and Net Assets 49,479,271$ 49,345,636$
See Accompanying Notes to the Financial Statements(35)
Governmental Activities
INDEPENDENT SCHOOL DISTRICT #347
STATEMENT OF NET ASSETSJUNE 30, 2011
WITH PARTIAL COMPARATIVE AMOUNTS AS OF JUNE 30, 2010

2010Net (Expense) Net (Expense)Revenue and Revenue andChanges in Changes inNet Assets Net Assets
Operating CapitalCharges Grants and Grants and Governmental Governmental
Expenses for Services Contributions Contributions Activities ActivitiesGOVERNMENTAL ACTIVITIESAdministration 1,524,753$ $ 14,650$ $ (1,510,103)$ (1,648,919)$ District Support Services 1,115,708 43,305 (1,072,403) (907,759) Regular Instruction 21,090,133 517,442 8,364,229 (12,208,462) (9,923,072) Vocational Education Instruction 801,446 5,250 37,172 (759,024) (818,649) Special Education Instruction 7,557,654 159,857 5,077,828 (2,319,969) (2,546,266) Instructional Support Services 2,411,922 5,654 536,443 (1,869,825) (1,638,483) Pupil Support Services 3,457,085 97,143 (3,359,942) (3,445,307) Sites and Buildings 4,215,561 33,173 20,558 561,149 (3,600,681) (2,831,646) Fiscal and Other Fixed Costs Programs 127,098 (127,098) (130,321) Food Service 2,390,350 795,104 1,741,614 146,368 208,558 Community Service 2,257,943 794,434 1,102,896 (360,613) (141,818) Interest and Fiscal Charges on Long-term Liabilities 363,922 (363,922) (464,890)
Total Governmental Activities 47,313,575$ 2,310,914$ 17,035,838$ 561,149$ (27,405,674) (24,288,572)
GENERAL REVENUESProperty Taxes Levied for
General Purposes 5,574,219 3,764,583 Community Service 539,070 289,627 Debt Service 2,351,381 2,298,717
State Aid not Restricted to Specific Purposes 21,954,037 21,636,016 Interest Earnings 39,820 46,183 Miscellaneous 332,417 12,484 SPECIAL ITEM - Gain on Sale of Land and Building 232,937
Total General Revenues and Special Item 31,023,881 28,047,610
Change in Net Assets 3,618,207 3,759,038
NET ASSETS, BEGINNING OF YEAR 22,615,318 18,856,280
NET ASSETS, END OF YEAR 26,233,525$ 22,615,318$
See Accompanying Notes to the Financial Statements
Program Revenues
(36)
2011
INDEPENDENT SCHOOL DISTRICT #347
STATEMENT OF ACTIVITIESYEAR ENDED JUNE 30, 2011
WITH PARTIAL COMPARATIVE AMOUNTS FOR THE YEAR ENDED JUNE 30, 2010

(This page intentionally left blank)

Food Community DebtGeneral Service Service Service 2011 2010
ASSETSCash and Investments 1,530,682$ 631,404$ 418,277$ 1,770,504$ 4,350,867$ 4,812,754$ Receivables
Current Property Taxes 1,978,191 199,921 1,329,181 3,507,293 3,463,508 Delinquent Property Taxes 35,425 3,427 24,436 63,288 90,735 Due from Other Minnesota School Districts 119,662 5,039 124,701 278,024 Due from Minnesota Department of Education 10,162,489 185 266,033 58,204 10,486,911 8,910,296 Due from Federal through Minnesota Department of Education 497,595 34,572 5,002 537,169 998,087 Due from Federal Government Received Directly 29,567 Due from Other Governmental Units 49,836 2,198 52,034 2,850 Other Receivables 65,301 10,619 75,920 119,351
Prepaid Items 35,541 1,217 681 37,439 20,733 Inventories 50,750 18,681 69,431 59,583
Total Assets 14,525,472$ 703,915$ 893,341$ 3,182,325$ 19,305,053$ 18,785,488$
LIABILITIES AND FUND BALANCELiabilities
Salaries and Wages Payable 3,361,365$ 24,151$ 106,957$ $ 3,492,473$ 3,454,009$ Accounts and Contracts Payable 556,074 27,700 28,483 612,257 496,023 Due to Other Governmental Units 217,133 21,338 238,471 138,418 Deferred Revenue
Property Taxes Levied for Subsequent Year 1,938,249 197,484 2,554,025 4,689,758 6,489,215 Delinquent Property Taxes 35,425 3,427 24,436 63,288 90,735 Local Sources 91,018 43,274 10,889 145,181 145,855
Total Liabilities 6,199,264 95,125 368,578 2,578,461 9,241,428 10,814,255
Fund Balance Nonspendable 86,291 19,898 681 106,870 80,316 Restricted 1,139,644 588,892 524,082 603,864 2,856,482 1,972,764 Committed 1,200,000 1,200,000 1,200,000 Unassigned 5,900,273 5,900,273 4,718,153
Total Fund Balance 8,326,208 608,790 524,763 603,864 10,063,625 7,971,233
Total Liabilities and Fund Balance 14,525,472$ 703,915$ 893,341$ 3,182,325$ 19,305,053$ 18,785,488$
See Accompanying Notes to the Financial Statements(37)
Total Governmental Funds
INDEPENDENT SCHOOL DISTRICT #347
BALANCE SHEETGOVERNMENTAL FUNDS
JUNE 30, 2011WITH PARTIAL COMPARATIVE AMOUNTS AS OF JUNE 30, 2010
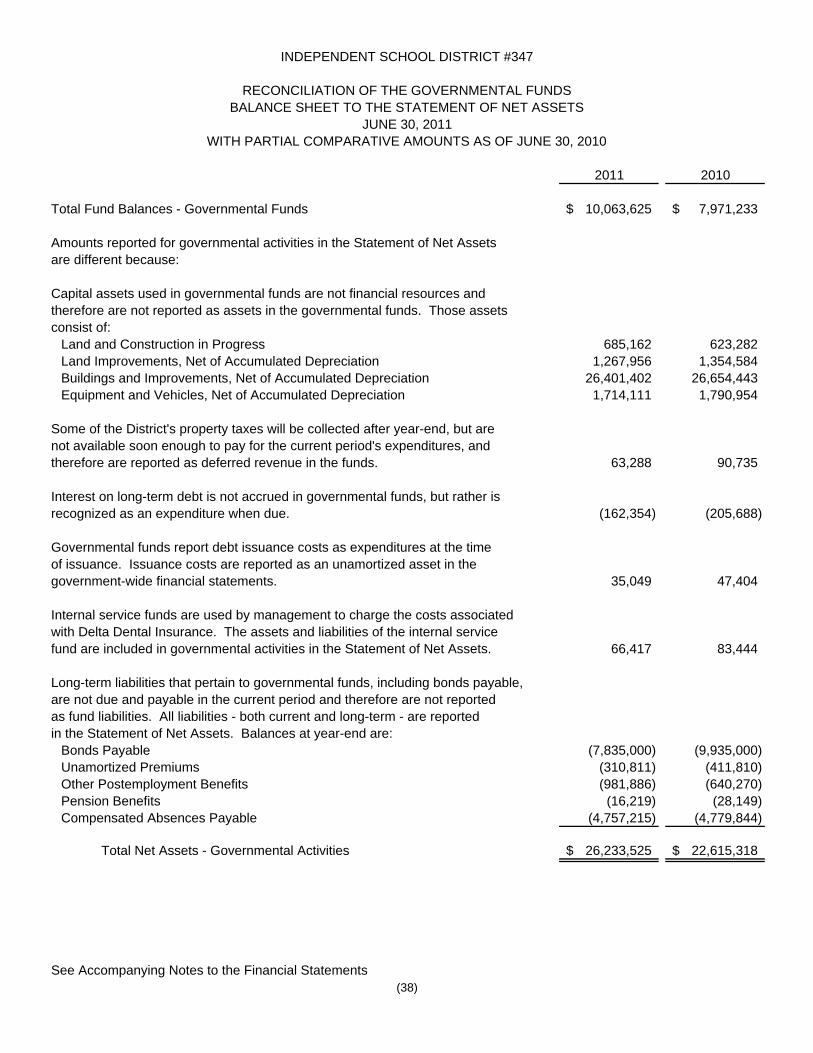
2011 2010
Total Fund Balances - Governmental Funds 10,063,625$ 7,971,233$
Amounts reported for governmental activities in the Statement of Net Assetsare different because:
Capital assets used in governmental funds are not financial resources andtherefore are not reported as assets in the governmental funds. Those assetsconsist of:
Land and Construction in Progress 685,162 623,282 Land Improvements, Net of Accumulated Depreciation 1,267,956 1,354,584 Buildings and Improvements, Net of Accumulated Depreciation 26,401,402 26,654,443 Equipment and Vehicles, Net of Accumulated Depreciation 1,714,111 1,790,954
Some of the District's property taxes will be collected after year-end, but arenot available soon enough to pay for the current period's expenditures, andtherefore are reported as deferred revenue in the funds. 63,288 90,735
Interest on long-term debt is not accrued in governmental funds, but rather isrecognized as an expenditure when due. (162,354) (205,688)
Governmental funds report debt issuance costs as expenditures at the timeof issuance. Issuance costs are reported as an unamortized asset in thegovernment-wide financial statements. 35,049 47,404
Internal service funds are used by management to charge the costs associatedwith Delta Dental Insurance. The assets and liabilities of the internal servicefund are included in governmental activities in the Statement of Net Assets. 66,417 83,444
Long-term liabilities that pertain to governmental funds, including bonds payable,are not due and payable in the current period and therefore are not reportedas fund liabilities. All liabilities - both current and long-term - are reportedin the Statement of Net Assets. Balances at year-end are:
Bonds Payable (7,835,000) (9,935,000) Unamortized Premiums (310,811) (411,810) Other Postemployment Benefits (981,886) (640,270) Pension Benefits (16,219) (28,149) Compensated Absences Payable (4,757,215) (4,779,844)
Total Net Assets - Governmental Activities 26,233,525$ 22,615,318$
See Accompanying Notes to the Financial Statements(38)
INDEPENDENT SCHOOL DISTRICT #347
RECONCILIATION OF THE GOVERNMENTAL FUNDSBALANCE SHEET TO THE STATEMENT OF NET ASSETS
JUNE 30, 2011WITH PARTIAL COMPARATIVE AMOUNTS AS OF JUNE 30, 2010

Food Community DebtGeneral Service Service Service 2011 2010
REVENUESLocal Sources
Property Taxes 5,588,685$ $ 540,297$ 2,363,135$ 8,492,117$ 6,326,095$ Interest Earnings 23,574 2,794 3,448 10,004 39,820 46,183 Other 1,520,443 812,445 993,860 3,326,748 2,984,274
State Sources 32,619,042 175,246 710,113 194,014 33,698,415 33,255,049 Federal Sources 3,583,236 1,550,022 35,884 5,169,142 6,773,509
Total Revenues 43,334,980 2,540,507 2,283,602 2,567,153 50,726,242 49,385,110
EXPENDITURESCurrent
Administration 1,487,485 1,487,485 1,557,761 District Support Services 1,100,077 1,100,077 942,076 Regular Instruction 19,558,378 19,558,378 18,880,393 Vocational Education Instruction 822,816 822,816 780,689 Special Education Instruction 7,361,512 7,361,512 7,468,689 Instructional Support Services 2,158,543 2,158,543 2,111,164 Pupil Support Services 3,546,214 24,184 3,570,398 3,567,247 Sites and Buildings 4,576,145 4,576,145 3,551,207 Fiscal and Other Fixed Costs Programs 126,236 126,236 129,459 Food Service 2,354,264 2,354,264 2,246,359 Community Service 2,208,894 2,208,894 1,973,659
Capital Outlay 902,542 71,161 19,663 993,366 1,491,899 Debt Service
Principal 2,100,000 2,100,000 1,995,000 Interest and Fiscal Charges 495,900 495,900 594,700
Total Expenditures 41,639,948 2,425,425 2,252,741 2,595,900 48,914,014 47,290,302 Excess (Deficiency) of Revenues Over (Under) Expenditures 1,695,032 115,082 30,861 (28,747) 1,812,228 2,094,808
OTHER FINANCING SOURCES (USES)Sale of Equipment 50 50 2,100
SPECIAL ITEMProceeds from Sale of Land and Building 280,114 280,114
Net Change in Fund Balances 1,975,196 115,082 30,861 (28,747) 2,092,392 2,096,908
FUND BALANCE, BEGINNING OF YEAR 6,351,012 493,708 493,902 632,611 7,971,233 5,874,325
FUND BALANCE, END OF YEAR 8,326,208$ 608,790$ 524,763$ 603,864$ 10,063,625$ 7,971,233$
See Accompanying Notes to the Financial Statements
WITH PARTIAL COMPARATIVE AMOUNTS FOR THE YEAR ENDED JUNE 30, 2010
Total Governmental Funds
(39)
INDEPENDENT SCHOOL DISTRICT #347
STATEMENT OF REVENUES, EXPENDITURES AND CHANGES IN FUND BALANCESGOVERNMENTAL FUNDS
YEAR ENDED JUNE 30, 2011

2011 2010
Total Net Change in Fund Balances - Governmental Funds 2,092,392$ 2,096,908$
Amounts reported for governmental activities in the Statement of Activities aredifferent because:
Capital outlay is reported in governmental funds as expenditures. However, in theStatement of Activities, the cost of those assets is allocated over the estimateduseful lives as depreciation expense.
Capital Outlay 1,037,044 1,276,703 Depreciation Expense (1,321,363) (1,324,584) Cost of Capital Assets Disposed (717,436) (91,529) Accumulated Deprecation Related to Disposed Capital Assets 647,123 68,884
The governmental funds report bond proceeds as financing sources, while repaymentof bond principal is reported as an expenditure. In the Statement of Net Assets,however, issuing debt increases long-term liabilities and does not affect theStatement of Activities and repayment of principal reduces the liability. Also,governmental funds report the effect of issuance costs and premiums when debt isfirst issued, whereas these amounts are deferred and amortized in the Statement ofActivities. Interest is recognized as an expenditure in the governmental funds when itis due. In the Statement of Activities, however, interest expense is recognized as itaccrues, regardless of when it is due. The net effect of these differences is as follows:
Payment of Bond Principal 2,100,000 1,995,000 Change in Accrued Interest Expense 43,334 41,166 Amortization of Bond Issuance Costs (12,355) (12,355) Amortization of Bond Premium 100,999 100,999
Delinquent property taxes receivable will be collected this year, but are not availablesoon enough to pay for the current period's expenditures, and therefore are deferredin the funds. (27,447) 25,897
In the Statement of Activities, certain operating expenses - pension, other post-employment benefits and compensated absences - are measured by the amounts earned during the year. In the governmental funds, however, expenditures for these items are measured by the amount of financial resources used (essentially, the amounts actually paid). (307,057) (410,035)
An internal service fund is used to charge the costs associated with Delta Dentalinsurance. The net change in net assets of the fund is reported with governmental activities. (17,027) (8,016)
Change in Net Assets - Governmental Activities 3,618,207$ 3,759,038$
See Accompanying Notes to the Financial Statements(40)
INDEPENDENT SCHOOL DISTRICT #347
RECONCILIATION OF THE STATEMENT OF REVENUES, EXPENDITURESAND CHANGES IN FUND BALANCES OF GOVERNMENTAL FUNDS TO THE STATEMENT OF ACTIVITIES
YEAR ENDED JUNE 30, 2011WITH PARTIAL COMPARATIVE AMOUNTS FOR THE YEAR ENDED JUNE 30, 2010

2010Over (Under)
FinalOriginal Final Actual Budget Actual
REVENUESLocal Sources
Property Taxes 3,831,482$ 3,834,999$ 5,588,685$ 1,753,686$ 3,740,446$ Interest Earnings 25,683 23,884 23,574 (310) 26,867 Other 1,064,442 1,129,836 1,520,443 390,607 1,141,495
State Sources 34,371,739 34,209,842 32,619,042 (1,590,800) 32,000,209 Federal Sources 2,710,716 3,676,068 3,583,236 (92,832) 5,159,335
Total Revenues 42,004,062 42,874,629 43,334,980 460,351 42,068,352
EXPENDITURESCurrent
Administration 1,475,350 1,521,705 1,487,485 (34,220) 1,557,761 District Support Services 1,058,969 1,125,832 1,100,077 (25,755) 942,076 Regular Instruction 19,436,678 19,931,649 19,558,378 (373,271) 18,880,393 Vocational Education Instruction 729,812 842,786 822,816 (19,970) 780,689 Special Education Instruction 7,503,137 7,490,414 7,361,512 (128,902) 7,468,689 Instructional Support Services 2,071,785 2,127,846 2,158,543 30,697 2,111,164 Pupil Support Services 3,477,284 3,617,573 3,546,214 (71,359) 3,550,608 Sites and Buildings 4,528,509 4,759,507 4,576,145 (183,362) 3,551,207 Fiscal and Other Fixed Costs Programs 150,000 130,000 126,236 (3,764) 129,459
Capital Outlay 436,916 887,444 902,542 15,098 1,341,055
Total Expenditures 40,868,440 42,434,756 41,639,948 (794,808) 40,313,101
Excess (Deficiency) of RevenuesOver (Under) Expenditures 1,135,622 439,873 1,695,032 1,255,159 1,755,251
OTHER FINANCING SOURCES (USES)Sale of Equipment 50 50 2,100
SPECIAL ITEMProceeds from Sale of Land and Building 280,114 280,114
Net Change in Fund Balances 1,135,622$ 720,037$ 1,975,196 1,255,159$ 1,757,351
FUND BALANCE, BEGINNING OF YEAR 6,351,012 4,593,661
FUND BALANCE, END OF YEAR 8,326,208$ 6,351,012$
See Accompanying Notes to the Financial Statements
INDEPENDENT SCHOOL DISTRICT #347
STATEMENT OF REVENUES, EXPENDITURES AND CHANGES IN FUND BALANCES
2011
(41)
BUDGET AND ACTUALGENERAL FUND
YEAR ENDED JUNE 30, 2011WITH PARTIAL COMPARATIVE AMOUNTS FOR THE YEAR ENDED JUNE 30, 2010
Budgeted Amounts

2010Over (Under)
FinalOriginal Final Actual Budget Actual
REVENUESLocal Sources
Interest Earnings 1,456$ 1,456$ 2,794$ 1,338$ 2,308$ Other-Primarily Meal Sales 790,656 810,455 812,445 1,990 809,821
State Sources 180,333 176,260 175,246 (1,014) 180,270 Federal Sources 1,209,370 1,516,314 1,550,022 33,708 1,578,267
Total Revenues 2,181,815 2,504,485 2,540,507 36,022 2,570,666
EXPENDITURESCurrent
Food Service 2,114,991 2,353,410 2,354,264 854 2,246,359 Capital Outlay 246,500 134,727 71,161 (63,566) 113,441
Total Expenditures 2,361,491 2,488,137 2,425,425 (62,712) 2,359,800
Net Change in Fund Balances (179,676)$ 16,348$ 115,082 98,734$ 210,866
FUND BALANCE, BEGINNING OF YEAR 493,708 282,842
FUND BALANCE, END OF YEAR 608,790$ 493,708$
See Accompanying Notes to the Financial Statements
INDEPENDENT SCHOOL DISTRICT #347
STATEMENT OF REVENUES, EXPENDITURES AND CHANGES IN FUND BALANCES
2011
(42)
BUDGET AND ACTUALFOOD SERVICE SPECIAL REVENUE FUND
YEAR ENDED JUNE 30, 2011WITH PARTIAL COMPARATIVE AMOUNTS FOR THE YEAR ENDED JUNE 30, 2010
Budgeted Amounts

2010Over (Under)
FinalOriginal Final Actual Budget Actual
REVENUESLocal Sources
Property Taxes 354,412$ 350,823$ 540,297$ 189,474$ 288,475$ Interest Earnings 2,364 3,915 3,448 (467) 3,438 Other-Primarily Tuition and Fees 857,817 902,801 993,860 91,059 1,032,958
State Sources 867,498 906,853 710,113 (196,740) 880,785 Federal Sources 30,000 35,587 35,884 297 35,907
Total Revenues 2,112,091 2,199,979 2,283,602 83,623 2,241,563
EXPENDITURESCurrent
Pupil Support Services 16,381 24,574 24,184 (390) 16,639 Community Service 2,098,753 2,094,453 2,208,894 114,441 1,973,659
Capital Outlay 6,600 14,919 19,663 4,744 37,403
Total Expenditures 2,121,734 2,133,946 2,252,741 118,795 2,027,701
Net Change in Fund Balances (9,643)$ 66,033$ 30,861 (35,172)$ 213,862
FUND BALANCE, BEGINNING OF YEAR 493,902 280,040
FUND BALANCE, END OF YEAR 524,763$ 493,902$
See Accompanying Notes to the Financial Statements
INDEPENDENT SCHOOL DISTRICT #347
STATEMENT OF REVENUES, EXPENDITURES AND CHANGES IN FUND BALANCES
2011
(43)
BUDGET AND ACTUALCOMMUNITY SERVICE SPECIAL REVENUE FUND
YEAR ENDED JUNE 30, 2011WITH PARTIAL COMPARATIVE AMOUNTS FOR THE YEAR ENDED JUNE 30, 2010
Budgeted Amounts

Governmental Activities-
2011 2010ASSETSCurrent Assets
Cash and Investments 70,538$ 89,481$
LIABILITIES AND NET ASSETSCurrent Liabilities
Accounts Payable 4,121$ 6,037$
Net AssetsUnrestricted 66,417 83,444
Total Liabilities and Net Assets 70,538$ 89,481$
See Accompanying Notes to the Financial Statements(44)
Internal Service Fund
INDEPENDENT SCHOOL DISTRICT #347
STATEMENT OF NET ASSETSPROPRIETARY FUND
JUNE 30, 2011WITH COMPARATIVE AMOUNTS AS OF JUNE 30, 2010

2011 2010OPERATING REVENUESCharges for Services 225,750$ 222,199$
OPERATING EXPENSESDental Insurance Claim Payments 215,380 203,653 General Administration Costs 27,397 26,562
Total Operating Expenses 242,777 230,215
Net Change in Net Assets (17,027) (8,016)
NET ASSETS, BEGINNING OF YEAR 83,444 91,460
NET ASSETS, END OF YEAR 66,417$ 83,444$
See Accompanying Notes to the Financial Statements(45)
Governmental Activities-
INDEPENDENT SCHOOL DISTRICT #347
STATEMENT OF REVENUES, EXPENSES AND CHANGES IN NET ASSETSPROPRIETARY FUND
YEAR ENDED JUNE 30, 2011WITH COMPARATIVE AMOUNTS FOR THE YEAR ENDED JUNE 30, 2010
Internal Service Fund

2011 2010CASH FLOWS FROM OPERATING ACTIVITIESReceipts from Interfund Services Provided 225,750$ 222,199$ Payments for Administrative Costs (27,627) (27,179) Payments for Dental Fees and Insurance Claims (217,066) (208,403)
Net Increase (Decrease) in Cash and Cash Equivalents (18,943) (13,383)
CASH AND CASH EQUIVALENTS, BEGINNING OF YEAR 89,481 102,864
CASH AND CASH EQUIVALENTS, END OF YEAR 70,538$ 89,481$
RECONCILIATION OF OPERATING INCOME (LOSS) TO CASH FLOWSFROM OPERATING ACTIVITIESOperating Income (Loss) (17,027)$ (8,016)$ Adjustments to Reconcile Operating Income (Loss) to Net Cash Provided(Used) by Operating Activities
Increase (Decrease) inAccounts Payable (1,916) (5,367)
Net Cash Provided (Used) By Operating Activities (18,943)$ (13,383)$
See Accompanying Notes to the Financial Statements
Governmental Activities-
(46)
Internal Service Fund
INDEPENDENT SCHOOL DISTRICT #347
STATEMENT OF CASH FLOWSPROPRIETARY FUND
YEAR ENDED JUNE 30, 2011WITH COMPARATIVE AMOUNTS FOR THE YEAR ENDED JUNE 30, 2010

Private-Purpose
Trust FundASSETSCash and Investments 34,755$ Interest Receivable 347
Total Assets 35,102$
NET ASSETSHeld in Trust for Scholarships 35,102$
Private-Purpose
Trust FundADDITIONSInterest Earnings 486$
DEDUCTIONSScholarship Obligations 2,300
Change in Net Assets (1,814)
NET ASSETS, BEGINNING OF YEAR 36,916
NET ASSETS, END OF YEAR 35,102$
See Accompanying Notes to the Financial Statements
YEAR ENDED JUNE 30, 2011
(47)
INDEPENDENT SCHOOL DISTRICT #347
STATEMENT OF FIDUCIARY NET ASSETSJUNE 30, 2011
STATEMENT OF CHANGES IN FIDUCIARY NET ASSETS

NOTE 1. SUMMARY OF SIGNIFICANT ACCOUNTING POLICIES
A. REPORTING ENTITY
B. GOVERNMENT-WIDE AND FUND FINANCIAL STATEMENTS
INDEPENDENT SCHOOL DISTRICT #347
NOTES TO THE FINANCIAL STATEMENTSJUNE 30, 2011
The financial statements of Independent School District #347 have been prepared in conformity with accounting principles generally accepted in the United States of America (GAAP) as applied to governmental units. The Governmental Accounting Standards Board (GASB) is the accepted standard setting body for establishing governmental accounting and financial reporting principles. The GASB pronouncements are recognized as accounting principles generally accepted in the United States of America. The more significant of the government's accounting policies are described below.
The Independent School District #347 Board of Education ("District") is the basic level of government which has the financial accountability and control over all activities related to the public school education for the Willmar Public School District. The District receives funding from local, state, and federal sources and must comply with the expenditure requirements of these funding source entities.
The government-wide financial statements (i.e., the Statement of Net Assets and the Statement of Activities) display information about the reporting government as a whole. These statements include all the financial activities of the District except for fiduciary funds. Fiduciary funds are only reported at the fund financial statement level.
Student activities are determined primarily by student participants under the guidance of an adult and are generally conducted outside school hours. The School Board has a fiduciary responsibility in establishing broad policies and ensuring that appropriate financial records are maintained for student activities. However, in accordance with Minnesota Statutes, the District's School Board has not elected to control or exercise oversight responsibility with respect to the underlying student activities. Accordingly, the student activity accounts are not included in these financial statements.
(48)
The financial statements present the District and its component units. The District includes all funds, organizations, institutions, agencies, departments and offices that are not legally separate from such. Component units are legally separate organizations for which the elected officials of the District are financially accountable and are included within the financial statements of the District because of the significance of their operational or financial relationships with the District.
The District is considered financially accountable for a component unit if it appoints a voting majority of the organization's governing body and it is able to impose its will on the organization by significantly influencing the programs, projects, activities or level of services performed or provided by the organization, or there is a potential for the organization to provide specific financial benefits to or impose specific financial burdens on the District.
As a result of applying the component unit definition criteria above, it has been determined the District has no component units.

INDEPENDENT SCHOOL DISTRICT #347
NOTES TO THE FINANCIAL STATEMENTSJUNE 30, 2011
NOTE 1. SUMMARY OF SIGNIFICANT ACCOUNTING POLICIES (Cont'd)
B. GOVERNMENT-WIDE AND FUND FINANCIAL STATEMENTS (Cont'd)
C. MEASUREMENT FOCUS AND BASIS OF ACCOUNTING
Separate financial statements are provided for governmental, proprietary and fiduciary funds. Major individual governmental funds are reported as separate columns in the fund financial statements. Fiduciary funds are presented in the fiduciary fund financial statements by type. Since by definition, fiduciary fund assets are being held for the benefit of a third party and cannot be used for activities or obligations of the District, these funds are excluded from the government-wide financial statements.
As a general rule, the effect of interfund activity has been eliminated from the government-wide financial statements. Elimination of all charges would distort the direct costs and program revenue reported for the various functions concerned.
The Statement of Activities demonstrates the degree to which the direct expenses of a given function or segment are offset by program revenues. Direct expenses are those that are clearly identifiable with a specific function or segment. Program revenues include charges to customers or applicants who purchase, use, or directly benefit from goods, services, or privileges provided by a given function or segment and grants and contributions that are restricted to meeting the operational or capital requirements of a particular function or segment. Taxes and other items not properly included among program revenues are reported instead as general revenues.
The Internal Service Fund is presented in the proprietary fund financial statements. Because the principal user of the internal services is the District's governmental activities, the financial statement of the internal service fund is consolidated into the governmental activities column when presented in the government-wide financial statements. The cost of these services is reported in the appropriate functional activity.
Proprietary funds distinguish operating revenues and expenses from nonoperating items. Operating revenues and expenses generally result from providing services and producing and delivering goods in connection with a proprietary fund's principal ongoing operations. The principal operating revenue of the District's internal service fund is charges to customers for service. Operating expenses for the internal service fund include the cost of services. All revenues and expenses not meeting this definition are reported as nonoperating revenues and expenses.
(49)
The accounting and financial reporting treatment applied is determined by its measurement focus and basis of accounting. The government-wide financial statements are reported using the economic resources measurement focus and the accrual basis of accounting, as are proprietary fund and fiduciary fund financial statements. Revenues are recorded when earned and expenses are recorded when a liability is incurred, regardless of the timing or related cash flows. Property taxes are generally recognized as revenues in the fiscal year for which they are levied, except for amounts advance recognized in accordance with a statutory "tax shift" described later in these notes. Grants and similar items are recognized when all eligibility requirements imposed by the provider have been met.

INDEPENDENT SCHOOL DISTRICT #347
NOTES TO THE FINANCIAL STATEMENTSJUNE 30, 2011
NOTE 1. SUMMARY OF SIGNIFICANT ACCOUNTING POLICIES (Cont'd)
C. MEASUREMENT FOCUS AND BASIS OF ACCOUNTING (Cont'd)
Description of Funds
Major Governmental Funds:
Expenditures generally are recorded when a liability is incurred, as under accrual accounting. However, debt service expenditures, as well as expenditures related to compensated absences and claims and judgments, are recorded only when payment is due. The District does not use encumbrances for either budgeting or financial reporting purposes.
(50)
The District reports deferred revenue on its combined balance sheet. Deferred revenues arise when a potential revenue does not meet both the "measurable" and "available" criteria for recognition in the current period. Deferred revenues also arise when resources are received by the District before it has a legal claim to them, as when grant monies are received prior to incurring the qualifying expenditures. In subsequent periods when both revenue recognition criteria are met or when the District has a legal claim to the resources, the liability for deferred revenue is removed from the combined balance sheet and revenue is recognized.
The existence of the various District funds has been established by the State of Minnesota, Department of Education. The accounts of the District are organized on the basis of funds, each of which is considered a separate accounting entity. A description of the funds included in this report is as follows:
The Food Service Special Revenue Fund accounts for all activities associated with the preparation and serving of regular and incidental meals, lunches or snacks in connection with school activities.
The General Fund is used to account for all financial resources except those required to be accounted for in another fund. It includes the general operations and pupil transportation activities of the District, as well as the capital related activities such as maintenance of facilities, equipment purchases, health and safety projects, and disabled accessibility projects.
It is generally the District's policy to use restricted resources first, then unrestricted resources as they are needed when an expense is incurred for purposes for which both restricted and unrestricted net assets are available.
Property tax revenue is generally considered as available if collected within 60 days after year-end. State revenue is recognized in the year to which it applies according to Minnesota Statutes and accounting principles generally accepted in the United States of America. Minnesota Statutes include state aid funding formulas for specific fiscal years. Federal revenue is recorded in the year in which the related expenditure is made. Food service sales, community education tuition, and other miscellaneous revenue (except interest earnings) are recorded as revenues when received because they are generally not measurable until then. Interest earnings are recorded when earned because they are measurable and available. A six-month availability period is generally used for other fund revenue.
The governmental fund financial statements are accounted for using the current financial resources measurement focus and the modified accrual basis of accounting, in which revenues are recognized when they become measurable and available. Revenues are considered to be measurable when the amount of the transaction can be determined and available when they are collectible within the current period or soon enough thereafter to pay liabilities of the current period.

INDEPENDENT SCHOOL DISTRICT #347
NOTES TO THE FINANCIAL STATEMENTSJUNE 30, 2011
NOTE 1. SUMMARY OF SIGNIFICANT ACCOUNTING POLICIES (Cont'd)
C. MEASUREMENT FOCUS AND BASIS OF ACCOUNTING (Cont'd)
Proprietary Fund:
Fiduciary Fund:
D. BUDGETS AND BUDGETARY ACCOUNTING
Unencumbered expenditure appropriations lapse at year-end. Encumbrances are generally not recorded.
(51)
The Community Service Special Revenue Fund accounts for services provided to residents in the areas of recreation, civic activities, nonpublic pupils, veterans, adult or early childhood programs or other similar services.
The Private-Purpose Trust Fund is used to account for trust arrangements under which principal and income benefits individuals, private organizations, or other governments. This fund accounts for gifts and bequests that are to be used for scholarships.
The Internal Service Fund accounts for financing of goods or services provided by one department to other departments or agencies of the government, or to other governments, on a cost-reimbursement basis. The District's Internal Service Fund accounts for the District's dental self-insurance program. The self-insurance costs are charged to the various funds based on established premium rates.
Budgets presented in this report for comparison to actual amounts are presented in accordance with accounting principles generally accepted in the United States of America. Each June, the School Board adopts an annual budget for the following fiscal year for the General, Food Service, Community Service, and Debt Service Funds. The approved budget is published in summary form in the District's legal newspaper by November 30 of each year. Reported budget amounts represent the amended budget as adopted by the School Board. Legal budgetary control is at the fund level.
The Debt Service Fund is used to account for the accumulation of resources for, and the payment of, long-term debt principal, interest, and related costs.
Procedurally, in establishing the budgetary data reflected in these financial statements, the Superintendent submits to the School Board prior to July 1, a proposed operating budget for the fiscal year commencing July 1. The operating budget includes proposed expenditures and the means to finance them. The budget is legally enacted by School Board action. Revisions to budgeted amounts must be approved by the School Board.
Budget provisions for the Debt Service Fund are set by state law governing required debt service levels.
Total fund expenditures in excess of the budget require approval of the School Board. Spending control is established by the amount of expenditures budgeted for the fund, but management control is exercised at line item levels.

INDEPENDENT SCHOOL DISTRICT #347
NOTES TO THE FINANCIAL STATEMENTSJUNE 30, 2011
NOTE 1. SUMMARY OF SIGNIFICANT ACCOUNTING POLICIES (Cont'd)
E. ASSETS, LIABILITIES AND EQUITY
Cash and Investments:
Accounts Receivable:
Current Property Taxes Receivable:
Delinquent Property Taxes Receivable:
Prepaid Items:
Inventories:
Property Taxes Levied for Subsequent Years:
Cash and investments consist of demand deposit accounts, non-negotiable certificates of deposit and a repurchase agreement. Investments are recorded at fair value.
For purposes of the Statement of Cash Flows, the District considers cash in bank and all highly liquid instruments (including restricted assets) to be cash and cash equivalents in its proprietary fund.
Current levies of local taxes, less the amount recognized as revenue in the current period, including portions assumed by the state which will be recognized as revenue in the next fiscal year beginning July 1, 2011, are included in this account to indicate that, while they are current assets, they will not be recognized as revenue until the following year.
Accounts receivable represents amounts receivable from individuals, firms, and corporations for goods and services furnished by the District. No substantial losses are anticipated from present receivable balances, therefore, no allowance for uncollectible accounts is deemed necessary. The only receivables not expected to be collected within one year are current property taxes receivable.
(52)
Delinquent property taxes receivable represent taxes collectible in the years 2004 to 2010 that remain uncollected at June 30, 2011. They are equally offset by a deferred revenue amount in the liabilities of the fund financial statements.
Current property taxes receivable represent current real and personal property tax levies, certified the previous December and collectible in the current calendar year, which have not been received by the District.
Inventories are recorded using the consumption method of accounting and consist of paper, purchased food and supplies. Food, paper and supply purchases are recorded at invoice cost, computed on a first-in, first-out method.
Certain payments to vendors reflect costs applicable to future accounting periods and are recorded as prepayments. Prepaid items are reported using the consumption method and recorded as an expense or expenditure at the time of consumption.
Cash balances from all funds of the District are pooled and invested, to the extent available, in allowable cash management accounts. Earnings from such accounts are allocated to the respective funds on the basis of applicable cash balance participation by each fund.

INDEPENDENT SCHOOL DISTRICT #347
NOTES TO THE FINANCIAL STATEMENTSJUNE 30, 2011
NOTE 1. SUMMARY OF SIGNIFICANT ACCOUNTING POLICIES (Cont'd)
E. ASSETS, LIABILITIES AND EQUITY (Cont'd)
Capital Assets:
Capital assets not being depreciated include land and construction in progress.
Long-Term Obligations:
Accrued Employee Benefits:Vacation Pay:
Sick Pay:Substantially all District employees are entitled to sick leave at various rates. For certain employees, unused sick leave enters into the calculation of severance pay upon termination.
The District does not possess any material amounts of intangible capital assets.
Tangible and intangible capital assets are recorded in the government-wide financial statements, but are not reported in the fund financial statements. Capital assets are depreciated using the straight-line method over their estimated useful lives. Since surplus assets are sold for an immaterial amount when declared as no longer needed for public school purpose by the District, no salvage value is taken into consideration for depreciation purposes. Useful lives vary from 20 to 50 years for land improvements and buildings, and 5 to 15 years for equipment.
In the government-wide financial statements, long-term debt and other long-term obligations are reported as liabilities in the applicable governmental activities. Bond premiums and discounts, as well as issuance costs, are deferred and amortized over the life of the bonds using the effective interest method. Bonds payable are reported net of the applicable bond premium or discount. Bond issuance costs, if material, are reported as an asset and amortized over the term of the related debt.
Tangible and intangible capital assets are capitalized at historical cost, or estimated historical cost for assets where actual historical cost is not available. Donated assets are recorded as capital assets at their estimated fair market value at the date of donation. The District maintains a threshold level of $5,000 for capitalizing tangible and intangible capital assets. The cost of normal maintenance and repairs that do not add to the value of the asset or materially extend asset lives are not capitalized.
The District does not possess any material amounts of infrastructure capital assets. Items such as sidewalks and other land improvements are considered to be part of the cost of buildings or other improvable property.
In the fund financial statements, governmental fund types recognize bond premiums and discounts, as well as bond issuance costs, during the current period. The face amount of debt issued is reported as other financing sources. Premiums received on debt issuances are reported as other financing sources while discounts on debt issuances are reported as other financing uses. Issuance costs, whether or not withheld from the actual debt proceeds received, are reported as debt service expenditures.
Employees earn annual vacation pay at rates dependent upon each employee group labor contract. All outstanding unpaid vacation pay is payable upon termination of employment. At June 30, 2011, unpaid vacation pay totaling $176,352 is recorded in the financial statements.
(53)

INDEPENDENT SCHOOL DISTRICT #347
NOTES TO THE FINANCIAL STATEMENTSJUNE 30, 2011
NOTE 1. SUMMARY OF SIGNIFICANT ACCOUNTING POLICIES (Cont'd)
E. ASSETS, LIABILITIES AND EQUITY (Cont'd)
Accrued Employee Benefits: (Cont'd)Secretarial Staff:
Library Clerical Staff and General Paraprofessionals:
Special Needs Paraprofessionals and Sign Language Interpreters:
Food Service Staff:
Administrators:
Teachers:
An unused sick leave payment is available to special needs paraprofessionals and sign language interpreters who have completed at least 15 years of continuous service with the District and are at least 58 years of age. An eligible individual will receive an amount equal to 75% of the number of unused accumulated sick leave days multiplied by the employee's daily rate of pay, not to exceed 805 hours, less any TSA match the District contributed. Employees hired after July 1, 2002 will not be eligible for an unused sick leave payment.
An unused sick leave payment is available to food service staff who have completed at least 15 years of continuous service with the District and are at least 55 years of age. An eligible individual will receive an amount equal to 75% of the number of unused accumulated sick leave hours multiplied by the employee's hourly rate of pay, not to exceed 430 hours.
An unused sick leave payment is available to administrators who have completed at least 10 years of continuous service with the District and are at least 55 years of age but not more than 65 years of age. An eligible administrator will receive an amount equal to the number of unused accumulated sick leave days multiplied by the employee's daily rate of pay, not to exceed 175 days, less any TSA match the District contributed. Administrators hired after July 1, 2000 are not eligible for an unused sick leave payment.
An unused sick leave payment is available to library clerical staff and general paraprofessionals who have completed at least 15 years of continuous service with the District and are at least 55 years of age. An eligible individual will receive an amount equal to 75% of the number of unused accumulated sick leave days multiplied by the employee's daily rate of pay, not to exceed 115 days.
An unused sick leave payment is available to secretaries who have completed at least 15 years of continuous service with the District and are at least 55 years of age. An eligible individual will receive an amount equal to 75% of the number of unused accumulated sick leave hours multiplied by the employee's hourly rate of pay, not to exceed 600 hours, less any TSA match the District contributed. Employees hired after July 1, 2000 are not eligible for an unused sick leave payment.
(54)
An unused sick leave payment is available to teachers who have completed at least 15 years of continuous service with the District and are at least 55 years of age. An eligible teacher will receive an amount equal to 50% of the number of unused accumulated sick leave days multiplied by the employee's daily rate of pay, not to exceed 90 days. Furthermore, an eligible teacher will receive an amount equal to the teacher's number of years of service multiplied by four and the employee's daily rate of pay, not to exceed 100 days. The maximum combined total payment shall not exceed 150 days. Any TSA match the District contributed will be deducted from the payment. Teachers hired after July 1, 2000 are not eligible for this benefit.

INDEPENDENT SCHOOL DISTRICT #347
NOTES TO THE FINANCIAL STATEMENTSJUNE 30, 2011
NOTE 1. SUMMARY OF SIGNIFICANT ACCOUNTING POLICIES (Cont'd)
E. ASSETS, LIABILITIES AND EQUITY (Cont'd)
Accrued Employee Benefits: (Cont'd)Custodians:
Confidential Employees:
Other Postemployment Benefits:
Deferred Revenue:
Fund Balance:
In addition to the deferred revenues described previously, the District has reported deferred revenues for excess tax increment financing receipts in the General Fund.
(55)
The District adopted the provisions of Governmental Accounting Standards Board Statement No. 54, Fund Balance Reporting and Governmental Fund Type Definitions for the year ended June 30, 2011. This standard changed fund balance classifications within the fund level statements.
An unused sick leave payment is available to confidential employees who have completed at least 15 years of continuous service with the District and are at least 55 years of age. An eligible individual will receive an amount equal to 75% of the number of unused accumulated sick leave hours multiplied by the employee's hourly rate of pay, not to exceed 805 hours, less any TSA match the District contributed. Employees hired after July 1, 2004 are not eligible for an unused sick leave payment.
Nonspendable - consists of amounts that cannot be spent because they are either not in spendable form or are legally or contractually required to be maintained intact, such as, inventories and prepaid items.
Restricted - consists of amounts related to externally imposed constraints established by creditors, grantors or contributors; or constraints imposed by state statutory provisions.
In the fund financial statements, fund balance is divided into five classifications based primarily on the extent to which the District is bound to observe constraints imposed upon the use of resources reported in governmental funds. These classifications are as follows:
Custodians shall earn ten days of severance pay credit for each full year of service, with accumulation to 150 days. Upon resignation of the employee at age 55 or older, the District shall pay severance equal to 75% of an employee's accumulated severance pay days up to a maximum of 112.5 days, at the employee's daily rate of pay.
Under the terms of previous employment contracts, when certain qualified employees retired between the ages of 55 to 65, the District provided life and health insurance benefits which would cease when such employees attain the age of 65. This benefit is no longer available to employees; however, the District continues to pay health insurance for qualified individuals that retired when this benefit was in effect. All premiums are funded on a pay-as-you-go basis.

INDEPENDENT SCHOOL DISTRICT #347
NOTES TO THE FINANCIAL STATEMENTSJUNE 30, 2011
NOTE 1. SUMMARY OF SIGNIFICANT ACCOUNTING POLICIES (Cont'd)
E. ASSETS, LIABILITIES AND EQUITY (Cont'd)
Fund Balance: (Cont'd)
Net Assets:
F. REVENUES AND EXPENDITURES
Revenues:
Net assets represent the difference between assets and liabilities in the government-wide, proprietary fund, and fiduciary fund financial statements. Net assets invested in capital assets, net of related debt consists of capital assets, net of accumulated depreciation, reduced by the outstanding balance of any long-term debt used to build or acquire the capital assets. Net assets are reported as restricted in the government-wide financial statements when there are limitations imposed on their use through external restrictions by creditors, grantors, or laws or regulations of other governments.
Property tax levies are established by the Board of Education in December each year and are certified to the County for collection in the following calendar year. In Minnesota, counties act as collection agents for all property taxes. The County spreads all levies over taxable property. Such taxes become a lien on January 1. Taxes are due on May 15 and October 15. The County generally remits taxes to the District at periodic intervals as they are collected. A portion of property taxes levied is paid through various state tax credits which are included in revenue from state sources in the financial statements.
Committed - consists of amounts that are constrained for specific purposes that are internally imposed by formal action of the Board of Education. Those committed amounts cannot be used for any other purpose unless the Board removes or changes the specified use by taking the same type of action it employed to previously commit those amounts. These constraints are established by Resolution of the Board of Education.
Assigned - consists of amounts intended to be used by the District for specific purposes but do not meet the criteria to be classified as restricted or committed. In governmental funds other than the General Fund, assigned fund balance represents the remaining amount that is not restricted or committed. In the General Fund, assigned amounts represent intended uses established by the governing body itself or by an official to which the governing body delegates the authority. Pursuant to School Board Policy, the Director of Business and Finance is authorized to establish assignments of fund balance.
Unassigned - is the residual classification for the General Fund and also reflects negative residual amounts in other funds.
The District uses restricted amounts to be spent first when both restricted and unrestricted fund balance is available. Additionally, the District would first use committed, then assigned, and lastly unassigned amounts of unrestricted fund balance when expenditures are made.
The Board of Education has formally adopted a fund balance policy for the General Fund. The District's policy is to strive to maintain a minimum unassigned fund balance of 6% of the General Fund.
(56)

INDEPENDENT SCHOOL DISTRICT #347
NOTES TO THE FINANCIAL STATEMENTSJUNE 30, 2011
NOTE 1. SUMMARY OF SIGNIFICANT ACCOUNTING POLICIES (Cont'd)
F. REVENUES AND EXPENDITURES (Cont'd)
Expenditures:
G. USE OF ESTIMATES
H. PRIOR YEAR INFORMATION
Expenditure recognition for governmental fund types is limited to amounts represented by current liabilities. Noncurrent liabilities are not recognized as governmental fund expenditures or liabilities.
In accordance with State law, the current tax shift consists of an amount equal to 31% of the District's 2000 Pay 2001 operating referendum which is frozen at $184,153 for the District. For the year ended June 30, 2011, State law is also requiring recognition of 48.6% or $1,835,237 of the current operating referendum and all other levies other than Career Technical and Reemployment Insurance. Career Technical and Reemployment Insurance are recognized early based on statutory requirements in the amounts of $78,320 and $103,693, respectively.
Generally, tax revenue is recognized in the fiscal year ending June 30, following the calendar year in which the tax levy is collectible, while the current calendar year tax levy is recorded as deferred revenue (property taxes levied for subsequent year). The majority of District revenue in the General Fund (and to a lesser extent in the District's Community Service Special Revenue Fund) is determined annually by statutory funding formulas. The total revenue allowed by these formulas is then allocated between taxes and state aids by the Legislature based on education funding priorities. Changes in this allocation are periodically accompanied by a change in property tax revenue recognition referred to as the "tax shift."
(57)
Taxes that remain unpaid are classified as delinquent taxes receivable. Revenue from these delinquent property taxes that is not collected within 60 days of year-end is deferred because it is not known to be available to finance the operations of the District in the current year. No allowance for uncollectible taxes has been provided as such amounts are not expected to be material. Current levies of local taxes, less the amount recognized as revenue in the current period, including portions assumed by the State which will be recognized as revenue in the next fiscal year beginning July 1, 2011, are included in Property Taxes Levied for Subsequent Year to indicate that, while they are current assets, they will not be recognized as revenue until the following year.
The preparation of financial statements in conformity with accounting principles generally accepted in the United States of America requires management to make estimates and assumptions that affect the reported amounts of assets and liabilities and disclosure of contingent assets and liabilities at the date of the financial statements and the reported amounts of revenues and expenses during the reporting period. Actual results could differ from those estimates.
The basic financial statements include certain prior-year partial comparative information in total but not at the level of detail required for a presentation in conformity with generally accepted accounting principles. Accordingly, such information should be read in conjunction with the government's financial statements for the year ended June 30, 2010, from which the partial information was derived.

INDEPENDENT SCHOOL DISTRICT #347
NOTES TO THE FINANCIAL STATEMENTSJUNE 30, 2011
NOTE 2. STEWARDSHIP, COMPLIANCE, AND ACCOUNTABILITY
A. EXCESS OF EXPENDITURES OVER BUDGET
Expenditures Budget Excess
Community Service Special Revenue Fund 2,252,741$ 2,133,946$ 118,795$
NOTE 3. CASH AND INVESTMENTS
Cash and investments as of June 30, 2011, are as follows:
BookBalance
Governmental ActivitiesCash and Investments
Pooled Cash in Checking Accounts 332,584$ Petty Cash 469 Individual Fund Savings Account 5,346 Non-negotiable Certificates of Deposit 250,000 Repurchase Agreement 3,833,006
Total Cash and Investments 4,421,405$
Fiduciary FundCash and Investments
Pooled Cash in Checking Accounts 1,255$ Non-negotiable Certificates of Deposit 33,500
Total Cash and Investments 34,755$
A. DEPOSITS
(58)
Custodial Credit Risk. Custodial credit risk is the risk that in the event of bank failure, the District's deposits may not be returned to it. Minnesota Statutes require all District deposits be protected by insurance, surety bond, or collateral. The market value of collateral pledged must equal 110 percent of the deposits not covered by insurance or bonds.
Authorized collateral includes treasury bills, notes and bonds; issues of U.S. government agencies; general obligations of a state or local government rated "A" or better and revenue obligations of a state or local government rated "AA" or better; unrated general obligation securities of the District; irrevocable standby letters of credit issued by the Federal Home Loan Bank; and certificates of deposit. Minnesota Statutes require that securities pledged as collateral be held in safekeeping in a restricted account at the Federal Reserve Bank or in an account at a trust department of a commercial bank or other financial institution that is not owned or controlled by the financial institution furnishing the collateral.
Budgetary control for governmental funds is established by each fund's total appropriations. Expenditures exceeded appropriations for the following fund for the year ended June 30, 2011.

INDEPENDENT SCHOOL DISTRICT #347
NOTES TO THE FINANCIAL STATEMENTSJUNE 30, 2011
NOTE 3. CASH AND INVESTMENTS (Cont'd)
A. DEPOSITS (Cont'd)
B. INVESTMENTS
Custodial Credit Risk. For an investment, this is the risk that in the event of the failure of the counterparty, the District will not be able to recover the value of its investments or collateral securities that are in the possession of an outside party. The District's investment policy on custodial credit risk states securities shall be held in third party safekeeping by an institution designated as custodial agent. The institution or dealer shall issue a safekeeping receipt to the District listing the specific instrument, the name of the issuer, the name in which the security is held, the rate, the maturity, serial numbers and other distinguishing marks, and other pertinent information related to the securities held.
Interest Rate Risk. This is the risk that the market value of securities will fall due to the changes in market interest rates. The District's policy states investment maturities shall be scheduled to coincide with projected District cash flow needs, taking into account large routine or scheduled expenditures, as well as anticipated receipt dates of anticipated revenues. Maturities for short-term and long-term investments shall be timed according to anticipated need. Within these parameters, portfolio maturities shall be staggered to avoid undue concentration of assets and a specific maturity sector. The maturities selected shall provide for stability of income and reasonable liquidity. The District's investment in the repurchase agreement does not have a specific maturity date but is cancelable by giving the institution 30 days notice.
Credit Risk. This is the risk that an issuer or other counterparty to an investment will not fulfill its obligations. The District may invest in the following types of investments as authorized by Minn. Stat. §§118A.04 and 118A.05: securities which are direct obligations or are guaranteed or insured issues of the United States, its agencies, its instrumentalities or organizations created by an act of Congress, except mortgage-backed securities defined as "high risk" by Minn. Stat. §118A.04, subd. 6; mutual funds through shares of registered investment companies provided the mutual fund receives certain ratings depending on its investments; general obligations of the State of Minnesota and its municipalities, and in certain state agency and local obligations of Minnesota and other states provided such obligations have certain specified bond ratings by a national bond rating service; bankers' acceptances of United States banks; commercial paper issued by United States corporations or their Canadian subsidiaries that is rated in the highest quality category by two nationally recognized rating agencies and matures in 270 days or less; and with certain restrictions, in repurchase agreements, securities lending agreements, joint powers investment trusts, and guaranteed investment contracts.
Concentration Risk. This is the risk of loss attributed to the magnitude of an investment in a single issuer. The District's investment policy states the District shall diversify its investments to avoid incurring unreasonable risks inherent in over investing in specific instruments, individual financial institutions or maturities. More than 5 percent of the District's investments are in the repurchase agreement. The repurchase agreement is 100% of the District's investments.
(59)
FNMA is the security underlying the repurchase agreement. FNMA is rated AAA by Moody's and AA+ by Standard and Poor's.
As of June 30, 2011, the District's deposits were sufficiently covered by insurance. The District does not have a policy that further limits its collateral choices.

INDEPENDENT SCHOOL DISTRICT #347
NOTES TO THE FINANCIAL STATEMENTSJUNE 30, 2011
NOTE 4. CAPITAL ASSETS
Capital asset activity for the year ended June 30, 2011, was as follows:
Beginning EndingBalance Increase Decrease Balance
Governmental ActivitiesCapital Assets, Not Being Depreciated
Land 623,282$ $ (5,764)$ 617,518$ Construction in Progress 67,644 67,644
Total Capital Assets, NotBeing Depreciated 623,282 67,644 (5,764) 685,162
Capital Assets, Being DepreciatedLand Improvements 3,146,715 33,009 (37,905) 3,141,819 Buildings and Improvements 47,341,605 701,546 (443,312) 47,599,839 Equipment 6,006,397 234,845 (230,455) 6,010,787
Total Capital Assets,Being Depreciated 56,494,717 969,400 (711,672) 56,752,445
Less Accumulated Depreciation forLand Improvements (1,792,131) (118,454) 36,722 (1,873,863) Buildings and Improvements (20,687,162) (907,410) 396,135 (21,198,437) Equipment (4,215,443) (295,499) 214,266 (4,296,676)
Total Accumulated Depreciation (26,694,736) (1,321,363) 647,123 (27,368,976)
Total Capital Assets BeingDepreciated, Net 29,799,981 (351,963) (64,549) 29,383,469
Governmental ActivitiesNet Capital Assets 30,423,263$ (284,319)$ (70,313)$ 30,068,631$
Depreciation expense was charged to functions/programs as follows:
Governmental ActivitiesAdministration 226$ District Support Services 874 Regular Instruction 1,034,849 Vocational Education Instruction 11,362 Special Education Instruction 4,737 Instructional Support Services 15,234 Pupil Support Services 27,195 Sites and Buildings 206,432 Fiscal and Other Fixed Cost Programs 862 Community Service 19,592
Total depreciation expense - Governmental Activities 1,321,363$
(60)

INDEPENDENT SCHOOL DISTRICT #347
NOTES TO THE FINANCIAL STATEMENTSJUNE 30, 2011
NOTE 5. LONG-TERM DEBT
A. COMPONENTS OF LONG-TERM DEBT
Original FinalAmount Maturity Interest BalanceIssued Date Rate Outstanding
Governmental ActivitiesGeneral Obligation Bonds
Refunding Bonds, Series 2005A 16,265,000$ 02/01/15 5.00% 7,625,000$ Capital Facilities, Series 2007A 495,000 02/01/13 4.00% 210,000
Total General Obligation Bonds 7,835,000 Bond Premium - Net 310,811 Other Postemployment Benefits Payable 981,886 Pension Benefits Payable 16,219 Compensated Absences Payable 4,757,215
Total Governmental Activities 13,901,131$
B. MINIMUM DEBT PAYMENTS
Year EndingJune 30, Principal Interest
2012 2,200,000$ 389,650$ 2013 2,315,000 280,700 2014 2,320,000 166,000 2015 1,000,000 50,000
7,835,000$ 886,350$
The District has issued general obligation school building bonds to finance the construction of capital facilities or refinance previous bond issues. Assets of the Debt Service Fund, together with scheduled future tax levies, are dedicated for the retirement of these bonds. These levies are subject to reduction if fund balance amounts exceed limitations imposed by Minnesota law.
(61)
Minimum annual principal and interest payments required to retire long-term debt, not including other postemployment benefits payable, pension benefits payable and compensated absences payable are as follows:
General Obligation Bonds

INDEPENDENT SCHOOL DISTRICT #347
NOTES TO THE FINANCIAL STATEMENTSJUNE 30, 2011
NOTE 5. LONG-TERM DEBT (Cont'd)
C. DESCRIPTION OF LONG-TERM DEBT
General Obligation Bonds:
Other Postemployment Benefits Payable:
Pension Benefits Payable:
Compensated Absences Payable:Compensated absences payable consists of unused vacation at June 30, 2011 and other compensated absences paid at retirement for certain employees based on the employment contract. In the past, compensated absences have been paid by the General, Food Service, and the Community Service Funds.
On June 15, 2007, the District issued $495,000 of General Obligation Capital Facilities Bonds, Series 2007A. The proceeds of this issue were used to finance various school roofing and parking lot improvements. Capital facilities revenues under Minnesota Statute Section 124.2455, are dedicated to the retirement of these bonds. In the event the capital facilities revenues are not sufficient, the District will levy property taxes for the deficiency.
On November 1, 2005, the District issued $16,265,000 of General Obligation Refunding Bonds, Series 2005A to advance refund the General Obligation Refunding Bonds, Series 1997A. The bonds are due in varying annual installments each February 1 from February 1, 2007 through February 1, 2015, with interest at a rate of 5.00% due semi-annually on February 1 and August 1. The District reduced its total debt service payments by $1,098,563 and obtained an economic gain (difference between the present value of the debt service payments on the old and new debt) of $916,043. Future ad valorem tax levies are dedicated to the retirement of these bonds.
Pension benefits payable consist of pension benefit payments available to employees as specified in the employee's employment contract upon retirement. Pension benefits are paid by the General and Special Revenue Funds.
Other postemployment benefits payable consist of postemployment health insurance benefits available to employees as specified in the employee's employment contract upon retirement. Health benefits have been paid by the General Fund.
(62)

INDEPENDENT SCHOOL DISTRICT #347
NOTES TO THE FINANCIAL STATEMENTSJUNE 30, 2011
NOTE 5. LONG-TERM DEBT (Cont'd)
D. CHANGES IN LONG-TERM DEBT
The following table summarizes changes in long-term debt during the year ended June 30, 2011:
DueBeginning Ending Within Balance Additions Reductions Balance One Year
Governmental ActivitiesBonds Payable 9,935,000$ $ (2,100,000)$ 7,835,000$ 2,200,000$ Bond Premium 411,810 (100,999) 310,811 100,999 Other Postemployment
Benefits Payable 640,270 726,670 (385,054) 981,886 Pension Benefits
Payable 28,149 69,106 (81,036) 16,219 Compensated Absences
Payable 4,779,844 528,089 (550,718) 4,757,215 551,230 Total Governmental
Activities 15,795,073$ 1,323,865$ (3,217,807)$ 13,901,131$ 2,852,229$
In addition, the District has available a $750,000 line of credit with a local financial institution. The line bears interest at variable rates (4.5% at June 30, 2011) and is unsecured. This line matures on December 31, 2011. There is no balance outstanding under this arrangement as of June 30, 2011.
(63)

INDEPENDENT SCHOOL DISTRICT #347
NOTES TO THE FINANCIAL STATEMENTSJUNE 30, 2011
NOTE 6. FUND BALANCE
Food Community DebtGeneral Service Service Service Total
NonspendablePrepaid Items 35,541$ 1,217$ 681$ $ 37,439$ Inventories 50,750 18,681 69,431
Total Nonspendable 86,291 19,898 681 0 106,870
RestrictedStaff Development 72,998 72,998 Operating Capital 1,032,641 1,032,641 Community Education 286,487 286,487 E.C.F.E. 41,122 41,122 Gifted and Talented 33,501 33,501 School Readiness 45,699 45,699 Adult Basic Education 96,658 96,658 Safe Schools 504 504 Other Fund Activities 588,892 54,116 603,864 1,246,872
Total Restricted 1,139,644 588,892 524,082 603,864 2,856,482
CommittedSeverance 1,200,000 1,200,000
Unassigned 5,900,273 5,900,273 8,326,208$ 608,790$ 524,763$ 603,864$ 10,063,625$
Fund Equity:
A. RESTRICTED FOR STAFF DEVELOPMENT
B. RESTRICTED FOR GIFTED AND TALENTED
Certain portions of fund balance are restricted based on state requirements to track special program funding, to provide for funding on certain long-term liabilities, or as required by other outside parties. The following is a summary of the potential restricted fund balances for the governmental funds:
(64)
In accordance with state statute, the District was not required but chose to restrict 0.75% of basic General Education revenue for staff development. The cumulative excess of such revenues over staff development expenditures is reported as a restriction of fund balance in the General Fund.
Portions of the District's fund balance are nonspendable, restricted due to legal restrictions, committed by Board action, or unassigned. The following is a summary of fund balance components at June 30, 2011.
The fund balance restriction represents accumulated resources available to provide gifted and talented programming in accordance with funding made available for that purpose.

INDEPENDENT SCHOOL DISTRICT #347
NOTES TO THE FINANCIAL STATEMENTSJUNE 30, 2011
NOTE 6. FUND BALANCE (Cont'd)
C. RESTRICTED FOR OPERATING CAPITAL
D. RESTRICTED FOR BASIC SKILLS PROGRAMS
E. RESTRICTED FOR COMMUNITY EDUCATION
F. RESTRICTED FOR E.C.F.E. (EARLY CHILDHOOD AND FAMILY EDUCATION)
G. RESTRICTED FOR SCHOOL READINESS
H. RESTRICTED FOR AREA LEARNING CENTERS
I. RESTRICTED FOR ADULT BASIC EDUCATION
J. RESTRICTED FOR SAFE SCHOOLS
This fund balance restriction represents accumulated resources available to provide services for early childhood family education programming.
The District levies taxes and receives state aid to be used for the purchase of equipment, books and vehicles and to purchase, rent, improve, and repair school facilities as allowed by state statute. The cumulative excess of such revenues over equipment and facilities expenditures is reported as a restriction of fund balance in the General Fund.
The fund balance restriction represents accumulated resources available to provide for basic skills programming in accordance with funding made available for that purpose.
The fund balance restriction represents accumulated resources available to provide school readiness programming in accordance with funding made available for that purpose.
The fund balance restriction represents accumulated resources available to provide adult basic education programming in accordance with funding made available for that purpose.
The fund balance restriction represents unspent resources available from the safe schools levy.
The fund balance restriction represents up to 90% of the accumulated resources available to provide alternative programming in accordance with funding made available for that purpose.
The fund balance restriction represents accumulated resources available to provide general community education programming.
(65)

INDEPENDENT SCHOOL DISTRICT #347
NOTES TO THE FINANCIAL STATEMENTSJUNE 30, 2011
NOTE 7. DEFINED BENEFIT PENSION PLANS - STATEWIDE
A. TEACHERS RETIREMENT ASSOCIATION
Plan Description:
PercentageBasic 1st ten years of service 2.2% per year
All years after 2.7% per year
Coordinated 1st ten years if service years are prior to July 1, 2006 1.2% per year
1st ten years if service years are July 1, 2006 or after 1.4% per year
All other years of service if service years are prior to 1.7% per yearJuly 1, 2006
All other years of service if service years are July 1, 2006 1.9% per yearor after
With these provisions:
a.
b. 3% per year early retirement reduction factors for all years under normal retirement age.
c.
All teachers employed by the District are covered by defined benefit plans administered by the Teachers Retirement Association (TRA). TRA members belong to either the Coordinated or the Basic Plan. Coordinated Plan members are covered by Social Security and Basic Plan members are not. All new members must participate in the Coordinated Plan. The plans are established and administered in accordance with Minnesota Statutes, Chapters 354 and 356.
Substantially all employees of the District are required by State law to belong to pension plans administered by the Teachers Retirement Association (TRA) or Public Employees Retirement Association (PERA), all of which are administered on a statewide basis.
Two methods are used to compute benefits for TRA's Coordinated and Basic Plan members. Members first employed before July 1, 1989, receive the greater of the Tier I or Tier II benefits as described:
-or-
(66)
Normal retirement age is 65 with less than 30 years of allowable service and age 62 with 30 or more years of allowable service.
Tier I Step Rate Formula
Unreduced benefits for early retirement under a Rule-of-90 (age plus allowable service equals 90 or more).
TRA provides retirement benefits as well as disability benefits to members, and benefits to survivors upon death of eligible members. Benefits are established by Minnesota Statute and vest after three years of service credit. The defined retirement benefits are based on a member's highest average salary for any five consecutive years of allowable service, age, and a formula multiplier based on years of credit at termination of service.

INDEPENDENT SCHOOL DISTRICT #347
NOTES TO THE FINANCIAL STATEMENTSJUNE 30, 2011
NOTE 7. DEFINED BENEFIT PENSION PLANS - STATEWIDE (Cont'd)
A. TEACHERS RETIREMENT ASSOCIATION (Cont'd)
Tier II:
Funding Policy:
For years of service prior to July 1, 2006, a level formula of 1.7 percent per year for coordinated members and 2.7 percent per year for basic members. For years of service July 1, 2006 and after, a level formula of 1.9 percent per year for Coordinated members and 2.7 for Basic members applies. Actuarially equivalent early retirement reduction factors with augmentation are used for early retirement before the normal age of 65. These reduction factors average approximately 4 to 5.5 percent per year.
Teachers Retirement Association
800.657.3853
Minnesota Statutes Chapter 354 sets the rates for the employee and employer contributions. These statutes are established and amended by the state legislature. Coordinated and Basic Plan members are required to contribute 5.5 percent and 9.0 percent, respectively, of their annual covered salary as employee contributions. The TRA employer contribution rates are 5.5 percent for Coordinated members and 9.5 percent for Basic members. Total covered payroll salaries for all TRA members statewide during the fiscal year ended June 30, 2010 was approximately $3.79 billion. TRA covered payroll for all members statewide for the fiscal years ended June 30, 2009 and June 30, 2008 were $3.76 billion and $3.65 billion, respectively.
St. Paul, MN 55103-4000651.296.6449
60 Empire Drive, Suite 400
(67)
Six different types of annuities are available to members upon retirement. The No Refund Life Plan is a lifetime annuity that ceases upon the death of the retiree - no survivor annuity is payable. A retiring member may also choose to provide survivor benefits to a designated beneficiary(ies) by selecting one of the five plans which have survivorship features. Vested members may also leave their contributions in the TRA Fund upon termination of service in order to qualify for a deferred annuity at retirement age. Any member terminating service is eligible for a refund of their employee contributions plus interest.
The benefit provisions stated apply to active plan participants. Vested, terminated employees who are entitled to benefits but not yet receiving them are bound by the provisions in effect at the time they last terminated their public service.
TRA publicly issues a Comprehensive Annual Financial Report (CAFR) presenting financial statements, supplemental information on funding levels, investment performance, and further information on benefits provisions. The report may be accessed at the TRA web site www.minnesotatra.org. Alternatively, a copy of the report may be obtained by writing or calling TRA:
Members first employed after June 30, 1989, receive only the Tier II calculation with a normal retirement age that is their retirement age for full Social Security retirement benefits, but not to exceed age 66.

INDEPENDENT SCHOOL DISTRICT #347
NOTES TO THE FINANCIAL STATEMENTSJUNE 30, 2011
NOTE 7. DEFINED BENEFIT PENSION PLANS - STATEWIDE (Cont'd)
A. TEACHERS RETIREMENT ASSOCIATION (Cont'd)
B. PUBLIC EMPLOYEES RETIREMENT ASSOCIATION OF MINNESOTA
Plan Description:
GERF members belong to either the Coordinated Plan or the Basic Plan. Coordinated Plan members are covered by Social Security and Basic Plan members are not. All new members must participate in the Coordinated Plan.
PERA provides retirement benefits as well as disability benefits to members, and benefits to survivors upon death of eligible members. Benefits are established by state statute, and vest after three years of credited service. The defined retirement benefits are based on a member's highest average salary for any five successive years of allowable service, age, and years of credit at termination of service.
The 2010 Legislature approved employee and employer contribution rate increases to be phased-in over a four-year period beginning July 1, 2011. Employee and employer contribution rates will rise 0.5% each year of the four-year period. Beginning July 1, 2014, TRA Coordinated employee and employer contribution rates will each be 7.5%.
The District contributions for the years ending June 30, 2011, 2010, and 2009 were $1,052,827, $1,027,781, and $1,066,607, respectively, equal to the required contributions for each year as set by state statute.
All full-time and certain part-time employees (other than teachers) of the District are covered by defined benefit plans administered by the Public Employees Retirement Association of Minnesota (PERA). PERA administers the General Employees Retirement Fund (GERF), which is a cost-sharing, multiple-employer retirement plan. This plan is established and administered in accordance with Minnesota Statutes, Chapters 353 and 356.
(68)
Two methods are used to compute benefits for PERA's Coordinated and Basic Plan members. The retiring member receives the higher of a step-rate benefit accrual formula (Method 1) or a level accrual formula (Method 2). Under Method 1, the annuity accrual rate for a Basic Plan member is 2.2 percent of average salary for each of the first 10 years of service and 2.7 percent for each remaining year. The annuity accrual rate for a Coordinated Plan member is 1.2 percent of average salary for each of the first 10 years and 1.7 percent for each remaining year. Under Method 2, the annuity accrual rate is 2.7 percent of average salary for Basic Plan members and 1.7 percent for Coordinated Plan members for each year of service. For all GERF members hired prior to July 1, 1989 whose annuity is calculated using Method 1, a full annuity is available when age plus years of service equal 90.
There are different types of annuities available to members upon retirement. A single-life annuity is a lifetime annuity that ceases upon the death of the retiree--no survivor annuity is payable. There are also various types of joint and survivor annuity options available which will be payable over joint lives.
Normal retirement age is 65 for Basic and Coordinated members hired prior to July 1, 1989. Normal retirement age is the age for unreduced Social Security benefits capped at 66 for Coordinated members hired on or after July 1, 1989. A reduced retirement annuity is also available to eligible members seeking early retirement.

INDEPENDENT SCHOOL DISTRICT #347
NOTES TO THE FINANCIAL STATEMENTSJUNE 30, 2011
NOTE 7. DEFINED BENEFIT PENSION PLANS - STATEWIDE (Cont'd)
B. PUBLIC EMPLOYEES RETIREMENT ASSOCIATION OF MINNESOTA (Cont'd)
Funding Policy:
NOTE 8. OTHER POSTEMPLOYMENT BENEFIT PLAN
A. PLAN DESCRIPTION
The benefit provisions stated in the previous paragraphs of this section are current provisions and apply to active plan participants. Vested, terminated employees who are entitled to benefits but are not receiving them yet are bound by the provisions in effect at the time they last terminated their public service.
At June 30, 2009, the District adopted Governmental Accounting Standards Board (GASB) Statement No. 45, Accounting and Financial Reporting for Employers for Postemployment Benefits Other than Pensions. This implementation allows the District to report its liability for other postemployment benefits consistent with established generally accepted accounting principles and to reflect an actuarially determined liability for the present value of projected future benefits for retired and active employees on the financial statements.
The District's contributions to the Public Employees Retirement Fund for the years ending June 30, 2011, 2010, and 2009, were $426,034, $406,472, and $410,012, respectively. The District's contributions were equal to the contractually required contributions for each year as set by state statute.
Members may also leave their contributions in the fund upon termination of public service in order to qualify for a deferred annuity at retirement age. Refunds of contributions are available at any time to members who leave public service, but before retirement benefits begin.
The District operates a single-employer retiree benefit plan ("the Plan") that provides health, life and dental insurance to eligible employees and their families through the District's health insurance plan. There are 631 active participants and 84 retired participants. Benefit and eligibility provisions are established through negotiations between the District and various unions representing District employees and are renegotiated each two-year bargaining period. The Plan does not issue a publicly available report.
(69)
PERA issues a publicly available financial report that includes financial statements and required supplementary information for GERF. That report may be obtained on the Internet at www.mnpera.org, by writing to PERA at 60 Empire Drive #200, St. Paul, Minnesota, 55103-2088 or by calling (651) 296-7460 or 1-800-652-9026.
Minnesota Statutes Chapter 353 sets the rates for employer and employee contributions. These statutes are established and amended by the state legislature. The District makes annual contributions to the pension plans equal to the amount required by state statutes. GERF Basic Plan members and Coordinated Plan members were required to contribute 9.1% and 6.0%, respectively, of their annual covered salary in 2010. In 2010, the District was required to contribute the following percentages of annual covered payroll: 11.78% for Basic Plan members and 7% for Coordinated Plan members. Employer contribution rates for the Coordinated Plan increased to 7.25% effective January 1, 2011.

INDEPENDENT SCHOOL DISTRICT #347
NOTES TO THE FINANCIAL STATEMENTSJUNE 30, 2011
NOTE 8. OTHER POSTEMPLOYMENT BENEFIT PLAN (Cont'd)
B. FUNDING POLICY
C. ANNUAL OPEB COST AND NET OPEB OBLIGATION
Annual Required Contribution 738,086$ Interest on Net OPEB Obligation 25,611 Adjustment to Annual Required Contribution (37,027)
Annual OPEB Cost (Expense) 726,670 Contributions Made (385,054)
Increase in Net OPEB Obligation 341,616 Net OPEB Obligation - Beginning of Year 640,270 Net OPEB Obligation - End of Year 981,886$
PercentageAnnual of Annual
Fiscal Year Annual Plan Sponsor OPEB Cost Net OPEBEnded OPEB Cost Contribution Contributed Obligation
6/30/2011 726,670$ 385,054$ 53% 981,886$ 6/30/2010 695,999 339,551 49% 640,270 6/30/2009 506,567 222,745 44% 283,822
D. FUNDED STATUS AND FUNDING PROGRESS
The District's annual OPEB cost, the percentage of the annual OPEB cost contributed to the Plan and the net OPEB obligation for 2011 and the preceding two years was:
The District's annual other postemployment benefit (OPEB) cost (expense) is calculated based on the annual required contribution (ARC), an amount actuarially determined in accordance with the parameters of GASB Statement No. 45. The ARC represents a level of funding that, if paid on an ongoing basis, is projected to cover normal cost each year and amortize any un-funded actuarial liabilities over a period not to exceed thirty years. The following table shows the components of the District's annual OPEB cost for the year, the amount actually paid from the plan, and changes in the District's net OPEB obligation.
(70)
As of July 1, 2009, the most recent actuarial valuation date, the plan was zero percent funded. The actuarial accrued liability for benefits was $6,228,886 and the actuarial value of assets was $0, resulting in an unfunded actuarial accrued liability (UAAL) of $6,228,886. The covered payroll (annual payroll of active employees covered by the Plan) was $22,444,970 and the ratio of the UAAL to the covered payroll of 27.8%.
Contribution requirements are also negotiated between the District and union representatives. The District contributes 0% - 100% of the cost of current-year premiums for eligible retired plan members and their spouses. For fiscal year 2011, the District contributed $385,054 to the Plan.

INDEPENDENT SCHOOL DISTRICT #347
NOTES TO THE FINANCIAL STATEMENTSJUNE 30, 2011
NOTE 8. OTHER POSTEMPLOYMENT BENEFIT PLAN (Cont'd)
D. FUNDED STATUS AND FUNDING PROGRESS (Cont'd)
E. ACTUARIAL METHODS AND ASSUMPTIONS
NOTE 9. SUPPLEMENTAL PENSION PLAN
A. PLAN DESCRIPTION
(71)
The District engaged an actuary to determine the District's liability for its supplemental pension plan in accordance with Governmental Accounting Standards Board (GASB) Statement No. 27 as of July 1, 2009.
Projections of benefits for financial reporting purposes are based on the substantive plan (the plan as understood by the employer and plan members) and include the types of benefits provided at the time of each valuation and the historical pattern of sharing of benefit costs between the employer and plan members to that point. The actuarial methods and assumptions used include techniques that are designed to reduce the effects of short-term volatility in actuarial accrued liabilities and the actuarial value of assets, consistent with the long-term perspective of the calculations.
In the July 1, 2009 actuarial valuation, the projected unit credit actuarial cost method was used. The actuarial assumption included a 4.0% investment rate of return (net of administrative expenses), which is a blended rate of the expected long-term investment returns on plan assets and on the employer's own investments calculated based on the funded level of the plan at the valuation date. The initial healthcare trend rate was 9.5% reduced by decrements to an ultimate rate of 5% after nine years. The UAAL is being amortized as a level dollar amount on an open basis. The remaining amortization period at June 30, 2011 was 30 years.
Actuarial valuations of an ongoing plan involve estimates of the value of reported amounts and assumptions about the probability of occurrence of events far into the future. Examples include assumptions about future employment, mortality, and healthcare cost trends. Amounts determined regarding the funded status of the Plan and the annual required contributions of the employer are subject to continual revision as actual results are compared with past expectations and new estimates are made about the future. The Schedule of Funding Progress, presented as required supplementary information following the notes to the financial statements, presents multiyear trend information about whether the actuarial value of plan assets is increasing or decreasing over time relative to the actuarial accrued liabilities for benefits.
The District provides pension benefits to certain eligible employees through a single-employer defined benefit plan administered by the District. The plan does not issue a publicly available financial report. All pension benefits are based on contractual agreements with employees and employee groups. Eligibility for these benefits is based on years of service and/or minimum age requirements. These contractual agreements do not include any specific contribution or funding requirements. These benefits are summarized as follows:

INDEPENDENT SCHOOL DISTRICT #347
NOTES TO THE FINANCIAL STATEMENTSJUNE 30, 2011
NOTE 9. SUPPLEMENTAL PENSION PLAN (Cont'd)
A. PLAN DESCRIPTION (Cont'd)
B. FUNDING POLICY
C. ANNUAL PENSION COST AND NET PENSION OBLIGATION
Annual Required Contribution 69,608$ Interest on Net Pension Obligation 1,126 Adjustment to Annual Required Contribution (1,628)
Annual Pension Cost (Expense) 69,106 Contributions Made (81,036)
Decrease in Net Pension Obligation (11,930) Net Pension Obligation - Beginning of Year 28,149 Net Pension Obligation - End of Year 16,219$
PercentageAnnual of Annual
Fiscal Year Annual Plan Sponsor Pension Cost Net PensionEnded Pension Cost Contribution Contributed Obligation
6/30/2011 69,106$ 81,036$ 117% 16,219$ 6/30/2010 67,980 39,831 59% 28,149
The District's annual pension cost (expense) is calculated based on the annual required contribution (ARC), an amount actuarially determined in accordance with the parameters of GASB Statement 27. The ARC represents a level of funding that, if paid on an ongoing basis, is projected to cover normal cost each year and amortize any unfunded actuarial liabilities over a period not to exceed thirty years. The following table shows the components of the District's annual pension cost for the year, the amount actually paid from the plan, and changes in the District's net pension obligation.
As described in Note 1.E., teachers who have completed at least 15 years of continuous service with the District and are at least 55 years of age are eligible for a severance payment. A portion of that payment is based on the teacher's number of years of service multiplied by four and the employee's daily rate of pay. Twenty-five percent of this payment is paid to the employee's Special Pay Deferral Plan and the remaining 75% is placed into the employee's Health Care Savings Plan. The 25% is considered a pension benefit.
The District's annual pension cost, the percentage of the annual pension cost contributed to the Plan and the net pension obligation for 2011 and the preceding year was:
The Superintendent is eligible for a pension benefit upon termination of employment of 10 days pay for each year of service, up to 100 days.
Payments under the plan are made on a pay-as-you-go basis. There are no invested plan assets accumulated for payment of future benefits. The General Fund and Special Revenue Funds are used for funding of all pension benefits. The District makes all contributions.
(72)

INDEPENDENT SCHOOL DISTRICT #347
NOTES TO THE FINANCIAL STATEMENTSJUNE 30, 2011
NOTE 9. SUPPLEMENTAL PENSION PLAN (Cont'd)
D. FUNDED STATUS AND FUNDING PROGRESS
E. ACTUARIAL METHODS AND ASSUMPTIONS
Actuarial valuations of an ongoing plan involve estimates of the value of reported amounts and assumptions about the probability of occurrence of events far into the future. Examples include assumptions about future employment and mortality. Amounts determined regarding the funded status of the Plan and the annual required contributions of the employer are subject to continual revision as actual results are compared with past expectations and new estimates are made about the future. The Schedule of Funding Progress, presented as required supplementary information following the notes to the financial statements, presents multiyear trend information about whether the actuarial value of plan assets is increasing or decreasing over time relative to the actuarial accrued liabilities for benefits.
In the July 1, 2009 actuarial valuation, the projected unit credit actuarial cost method was used. The actuarial assumption included a 4.0% investment rate of return (net of administrative expenses), which is a blended rate of the expected long-term investment returns on plan assets and on the employer's own investments calculated based on the funded level of the plan at the valuation date. The projected salary increase is 3% per year. The UAAL is being amortized as a level dollar amount on an open basis. The remaining amortization period at June 30, 2011 was 30 years.
As of July 1, 2009, the most recent actuarial valuation date, the plan was zero percent funded. The actuarial accrued liability for benefits was $606,725, and the actuarial value of assets was $0, resulting in an unfunded actuarial accrued liability (UAAL) of $606,725. The annual covered payroll for active employees covered by the Plan in the actuarial valuation was $22,444,970 for a ratio of UAAL to covered payroll of 2.7%.
Projections of benefits for financial reporting purposes are based on the substantive plan (the plan as understood by the employer and plan members) and include the types of benefits provided at the time of each valuation and the historical pattern of sharing of benefit costs between the employer and plan members to that point. The actuarial methods and assumptions used include techniques that are designed to reduce the effects of short-term volatility in actuarial accrued liabilities and the actuarial value of assets, consistent with the long-term perspective of the calculations.
(73)

INDEPENDENT SCHOOL DISTRICT #347
NOTES TO THE FINANCIAL STATEMENTSJUNE 30, 2011
NOTE 10. SELF-INSURED DENTAL PLAN
The liability for unpaid claims is included in the Internal Service Fund as accounts payable.
FY 2011 FY 2010Unpaid Claims, Beginning of Year $ 6,037 $ 11,404 Incurred Claims 215,380 203,653 Claims Payments (cash basis) (217,296) (209,020)
Unpaid Claims, End of Year $ 4,121 $ 6,037
NOTE 11. OPERATING LEASES
Total rent expenditures includes the following:
Maintenance equipment $ 6,825 Facilities 41,256 Office equipment 102,975 Vehicles 12,327 Miscellaneous rental 36,280
Total $ 199,663
Future minimum lease payments due under existing operating leases are as follows:
$ 115,876 69,682 30,273
Total 215,831$
2012
The District has elected to self-insure their employee dental insurance program. The District has entered into an agreement with an insurance company to provide stop-loss insurance to limit the losses on individual and aggregate claims and to provide claims processing and other administrative duties. The individual stop-loss amount is $1,200 per participant. The District established an internal service fund to account for contributions from other funds for dental insurance and to establish a reserve for catastrophic losses. Contributions during the year were based on maximum claims before reinsurance is effective. The amounts charged to expenses include administrative fees, stop-loss insurance premiums, claims paid and accruals for claims incurred but not paid at year end. The District recorded expenses of $242,777 for the year ended June 30, 2011 which includes administrative costs of $27,397.
2013
Year Ending June 30,
2014
The District is committed under long-term operating leases for the rental of office equipment and vehicles. Office equipment is leased under varying terms, with leases running through January 2014. Vehicles are leased under varying terms with leases running through March 2013.
(74)

INDEPENDENT SCHOOL DISTRICT #347
NOTES TO THE FINANCIAL STATEMENTSJUNE 30, 2011
NOTE 12. COMMITMENTS AND CONTINGENCIES
A. FEDERAL AND STATE PROGRAMS
NOTE 13. RISK MANAGEMENT
NOTE 14. JOINT POWERS AGREEMENT
There has been no significant reduction in insurance coverage from the previous year in any of the District's policies. Settled claims resulting from these risks have not exceeded insurance coverage in any of the past three fiscal years.
(75)
The District and the City of Willmar have entered into a Joint Powers agreement to collaborate and coordinate in the provision of social, educational, vocational and recreational services to members of the community. It is the intention of the parties to offer these services collaboratively and to coordinate their service programs in order to eliminate duplication of services and in order to maximize the effectiveness of the services provided. The Joint Powers Entity is governed by the Joint Powers Board, which includes five members appointed by the City Council, five members appointed by the School Board, and two students, one recommended by the Senior High School Student Council and one recommended by the Middle School Student Council, to be approved and appointed by the City Council and School Board. One School Board member, one City Council member, the City Administrator and the Superintendent of Schools shall serve as ex-officio members to the Board.
The District employs an individual to administer community education, which is in the Community Service Fund. The City is responsible for providing adult and youth recreation programs, adult and youth athletic programs and administer the daily operations of the Dorothy A. Olson Aquatic Center. The District is responsible for providing necessary facilities, services, and employees to provide Early Childhood and Adult Basic Education programs. This agreement is perpetual but may be canceled upon six months written notice by either party.
Amounts received or receivable from federal and state agencies are subject to agency audit and adjustment. Any disallowed claims, including amounts already collected, may constitute a liability of the applicable fund. The amount, if any, of funds which may be disallowed by the agencies cannot be determined at this time although the District expects such amounts, if any, to be immaterial.
The District has joined together with other school districts in Minnesota in the South Central - West Central Service Cooperative Gross Self-Insured Health Insurance Plan, a public entity risk pool currently operating as common risk management and insurance program for member districts. The District pays an annual premium to this plan for its health insurance coverage. These premiums are used to purchase reinsurance through commercial companies. The administrators of the plan believe assessment to participating districts for future losses sustained is extremely remote.
The District is exposed to various risks of loss related to torts; theft of, damage to, and destruction of assets; errors and omissions; injuries to employees; natural disasters and workers' compensation. To mitigate these risks, the District has obtained commercial property and casualty insurance and workers' compensation coverage. The District pays an annual premium with no additional assessments.

INDEPENDENT SCHOOL DISTRICT #347
NOTES TO THE FINANCIAL STATEMENTSJUNE 30, 2011
NOTE 15. RECLASSIFICATIONS
NOTE 16. SPECIAL ITEM
NOTE 17. OTHER EVENT
NOTE 18. SUBSEQUENT EVENT
Proceeds from the settlement of a lawsuit were received during the year ended June 30, 2011. This event is infrequent and is not reported as a Special or Extraordinary Item since the decision was not within the control of management.
On August 25, 2011, the District issued $3,438,321 G.O. Aid Anticipation Certificates of Indebtedness, Series 2011B with an interest rate of 2.0%.
During the year ended June 30, 2011, the District sold the land and building formerly operated as Washington School. The proceeds are recognized as a Special Item on the Statement of Revenues, Expenditures and Changes in Fund Balances and as a Special Item on the Statement of Activities.
Certain prior year financial statement amounts have been reclassified to conform to current year's presentation. This includes restated prior year fund balance classifications within each fund to conform with the requirements of GASB 54. There was no affect on Net Assets or Fund Balance.
(76)

(77)
REQUIRED SUPPLEMENTARY INFORMATION

Actuarial UAAL as a Actuarial Accrued Annual Percentage
Actuarial Value of Liability Unfunded Funded Covered of CoveredValuation Assets (AAL) AAL Ratio Payroll Payroll
Date (a) (b) (b-a) (a/b) (c) ((b-a)/c)
Pension7/1/2009 $ 606,725$ 606,725$ 0.0% 22,444,970$ 2.7%
Other Postemployment Benefits7/1/2009 $ 6,228,886$ 6,228,886$ 0.0% 22,444,970$ 27.8%7/1/2008 4,382,890 4,382,890 0.0% 23,498,643 18.7%
AnnualYear Ended Required Employer Percentage Net
June 30, Contribution Contribution Contributed Obligation
Pension2011 69,608$ 81,036$ 116.4% 16,219$ 2010 67,980 39,831 58.6% 28,149
Other Postemployment Benefits2011 738,086$ 385,054$ 52.2% 981,886$ 2010 701,059 339,551 48.4% 640,270 2009 506,567 222,745 44.0% 283,822
Required Supplementary Information - See Auditor's Report
The District implemented GASB Statement No. 27 for fiscal year ended June 30, 2010. The District implemented GASB Statement No. 45 for fiscal year ended June 30, 2009. Information for prior years is not available.
INDEPENDENT SCHOOL DISTRICT #347
SCHEDULES OF FUNDING PROGRESS AND EMPLOYER CONTRIBUTIONS
YEAR ENDED JUNE 30, 2011
(78)
Schedule of Funding Progress
Schedule of Employer Contributions
FOR POSTEMPLOYMENT BENEFIT PLANS

(79)
SUPPLEMENTARY INFORMATION

2010Over (Under)
FinalOriginal Final Actual Budget Actual
REVENUESLocal Sources
Property Taxes 2,342,276$ 2,342,046$ 2,363,135$ 21,089$ 2,297,174$ Interest Earnings 12,836 10,615 10,004 (611) 13,570
State Sources 193,785 194,014 194,014 193,785
Total Revenues 2,548,897 2,546,675 2,567,153 20,478 2,504,529
EXPENDITURESDebt Service
Bond Principal 2,100,000 2,100,000 2,100,000 1,995,000 Bond Interest 493,650 493,650 493,650 592,450 Paying Agent Fees and Other 2,400 2,250 2,250 2,250
Total Expenditures 2,596,050 2,595,900 2,595,900 0 2,589,700
Net Change in Fund Balances (47,153)$ (49,225)$ (28,747) 20,478$ (85,171)
FUND BALANCE, BEGINNING OF YEAR 632,611 717,782
FUND BALANCE, END OF YEAR 603,864$ 632,611$
Supplementary Information - See Auditor's Report
INDEPENDENT SCHOOL DISTRICT #347
SCHEDULE OF REVENUES, EXPENDITURES AND CHANGES IN FUND BALANCES
2011
(80)
BUDGET AND ACTUALDEBT SERVICE FUND
YEAR ENDED JUNE 30, 2011WITH PARTIAL COMPARATIVE AMOUNTS FOR THE YEAR ENDED JUNE 30, 2010
Budgeted Amounts

(81)
STATISTICAL SECTION (Unaudited)
This part of the comprehensive annual financial report presents detailed information as a context for understanding what the information in the financial statements, note disclosures, and required supplementary information says about the government’s overall financial health. Contents: Page
Financial TrendsThese schedules contain trend information to help the reader understand how the School District’s financial information and well-being have changed over time. 82-88
Revenue CapacityThese schedules contain information to help the reader assess the School District’s most significant local revenue source, the property tax. 89-92
Debt CapatityThese schedules present information to help the reader assess the affordability of the School District's current levels of outstanding debt and the School District's ability to issue additional debt in the future. 93-96
Demographic and Economic InformationThese schedules offer demographic and economic indicators to help the reader understand the environment within which the School District's financial activities take place. 97-98
Operating Information
These schedules contain service and infrastructure data to help the reader understand how the information in the School District's financial report relates to the services the School District provides and the activities it performs. 99-104
Sources: Unless otherwise noted, the information in these schedules is derived from the comprehensive annual financial reports for the relevant year.

(This page intentionally left blank)

2003 2004 2005 2006 2007 2008 2009 2010 2011
Governmental activities
Invested in Capital Assets, Net of Related Debt 11,314,674$ 12,018,714$ 13,049,010$ 14,125,996$ 15,416,819$ 16,590,276$ 18,050,980$ 20,076,453$ 21,922,820$
Restricted 1,693,277 1,998,553 1,112,183 1,507,933 2,015,439 1,657,445 1,618,837 1,767,076 2,714,707
Unrestricted 1,645,748 3,394,013 3,598,111 4,326,318 2,025,780 774,030 (813,537) 771,789 1,595,998
Total Net Assets 14,653,699$ 17,411,280$ 17,759,304$ 19,960,247$ 19,458,038$ 19,021,751$ 18,856,280$ 22,615,318$ 26,233,525$
Note: The District implemented GASB Statement 34 in 2003. This information is not available for previous fiscal years.
Source: District Records
Fiscal Year
(accrual basis of accounting)Last Nine Fiscal Years
Net Assets by ComponentWillmar Public Schools
(82)
(This page intentionally left blank)

2003 2004 2005 2006 2007 2008 2009 2010 2011
Expenses
Governmental activities:
Administration 1,192,060$ 1,199,931$ 1,366,717$ 1,366,558$ 1,614,112$ 1,544,907$ 1,605,548$ 1,653,919$ 1,524,753$
District Support Services 1,493,396 798,273 871,804 860,710 919,392 885,154 986,334 949,578 1,115,708
Regular Instruction 15,612,289 17,896,044 19,331,810 18,967,468 19,617,570 21,704,551 21,236,601 20,103,140 21,090,133
Vocational Education Instruction 1,009,389 956,619 994,894 815,835 627,729 730,195 892,498 883,686 801,446
Special Education Instruction 6,967,950 7,354,987 8,106,444 8,314,732 7,731,391 8,055,217 8,355,384 7,752,733 7,557,654
Instructional Support Services 1,857,142 2,000,604 1,844,924 2,163,593 2,047,363 2,492,349 2,332,636 2,243,858 2,411,922
Pupil Support Services 2,529,455 2,683,324 2,947,488 3,094,558 3,233,078 3,397,152 3,607,987 3,538,480 3,457,085
Sites and Buildings 3,233,977 3,256,881 3,340,607 3,845,392 4,586,523 4,722,635 4,083,773 3,508,797 4,215,561
Fiscal and Other Fixed Cost Programs 300,954 264,007 223,001 314,062 240,254 159,340 130,872 130,321 127,098
Food Service 1,638,630 1,846,894 2,066,305 1,928,250 1,961,452 2,208,624 2,233,289 2,359,800 2,390,350
Community Service 1,753,628 1,673,941 2,182,154 1,990,208 2,049,275 2,094,012 2,054,760 2,064,867 2,257,943
Interest and Fiscal Charges on
Long-Term Liabilities 1,164,807 1,094,590 1,007,896 883,672 829,447 645,553 560,304 464,890 363,922
Total School District Expenses 38,753,677 41,026,095 44,284,044 44,545,038 45,457,586 48,639,689 48,079,986 45,654,069 47,313,575
Program Revenues
Governmental Activities:
Charges for Services:
Food Service 689,411 669,556 679,110 721,303 773,994 773,685 768,762 794,307 795,104
Community Service 463,623 591,610 722,223 702,499 690,843 667,133 702,200 774,253 794,434
Other 1,408,142 1,406,909 1,462,064 2,150,099 1,443,146 602,918 627,294 689,603 721,376
Operating Grants and Contributions 13,288,073 13,043,811 14,061,382 14,902,344 14,945,418 15,705,789 15,442,107 18,501,962 17,035,838
Capital Grants and Contributions 994,427 1,006,214 877,479 847,130 652,077 697,859 638,414 605,372 561,149
Total governmental program revenues 16,843,676 16,718,100 17,802,258 19,323,375 18,505,478 18,447,384 18,178,777 21,365,497 19,907,901
Net (Expense)/Revenue
Total primary governmental net expense (21,910,001)$ (24,307,995)$ (26,481,786)$ (25,221,663)$ (26,952,108)$ (30,192,305)$ (29,901,209)$ (24,288,572)$ (27,405,674)$
Note: The District implemented GASB Statement 34 in 2003. This information is not available for previous fiscal years.
Source: District Records
Fiscal Year
(accrual basis of accounting)Last Nine Fiscal Years
Expenses, Program Revenues, and Net (Expense)/RevenueWillmar Public Schools
(83)

(This page intentionally left blank)

2003 2004 2005 2006 2007 2008 2009 2010 2011
Net (Expense)/Revenue
Total primary governmental net expense (21,910,001)$ (24,307,995)$ (26,481,786)$ (25,221,663)$ (26,952,108)$ (30,192,305)$ (29,901,209)$ (24,288,572)$ (27,405,674)$
General Revenues and Changes in Net Assets
Governmental Activities:
Property Taxes Levied for
General Purposes 1,450,890 2,077,862 1,646,005 1,168,340 2,408,339 2,776,231 3,029,678 3,764,583 5,574,219
Community Service 74,427 242,495 284,300 125,599 246,165 281,805 279,779 289,627 539,070
Debt Service 2,218,386 2,250,811 2,330,594 2,157,880 2,264,179 2,349,549 2,064,562 2,298,717 2,351,381
State Aid Not Restricted to Specific Purposes 22,545,637 22,383,185 22,475,565 23,523,078 23,461,186 23,903,451 24,228,781 21,636,016 21,954,037
Earnings on Investments 178,094 110,285 96,235 418,315 491,828 408,458 123,545 46,184 39,820
Miscellaneous 11,158 938 3,358 29,394 128,986 36,524 9,393 12,485 332,417
Special Item - Gain on Sale of Land and Building 232,937
Total General Revenues 26,478,592 27,065,576 26,836,057 27,422,606 29,000,683 29,756,018 29,735,738 28,047,612 31,023,881
Change in Net Assets
Total primary government 4,568,591$ 2,757,581$ 354,271$ 2,200,943$ 2,048,575$ (436,287)$ (165,471)$ 3,759,040$ 3,618,207$
Note: The District implemented GASB Statement 34 in 2003. This information is not available for previous fiscal years.
Source: District Records
Fiscal Year
(accrual basis of accounting)Last Nine Fiscal Years
General Revenues and Total Change in Net AssetsWillmar Public Schools
(84)

(This page intentionally left blank)

2002 2003 2004 2005 2006 2007 2008 2009 2010 2011
General Fund
Nonspendable 70,044$ 204,230$ 318,792$ 70,584$ 89,871$ 49,999$ 91,348$ 59,660$ 59,948$ 86,291$
Restricted 474,291 765,013 622,520 482,151 760,800 887,394 546,685 633,167 352,543 1,139,644
Committed 593,870 892,461 872,617 840,077 1,200,000 1,200,000 1,200,000 1,200,000 1,200,000 1,200,000
Unassigned 154,170 3,260,730 5,039,668 5,055,393 5,261,943 5,741,785 4,277,454 2,700,834 4,738,521 5,900,273
Total General Fund 1,292,375$ 5,122,434$ 6,853,597$ 6,448,205$ 7,312,614$ 7,879,178$ 6,115,487$ 4,593,661$ 6,351,012$ 8,326,208$
All Other Governmental Funds
Nonspendable
Special Revenue Funds 17,801$ 41,606$ 65,668$ 35,215$ 32,564$ 30,739$ 37,337$ 44,076$ 20,368$ 20,579$
Restricted
Building Construction Fund - - 362,950 - - 412,873 - - - -
Debt Service Fund 993,012 907,371 840,804 760,111 835,384 902,774 965,982 717,782 632,611 603,864
Special Revenue Funds 588,107 588,884 584,133 236,755 289,248 507,251 420,829 518,806 967,242 1,112,974
Total all other governmental funds 1,598,920$ 1,537,861$ 1,853,555$ 1,032,081$ 1,157,196$ 1,853,637$ 1,424,148$ 1,280,664$ 1,620,221$ 1,737,417$
Note: The District implemented GASB Statement 54 in 2011. Prior years are reclassified into the GASB Statement 54 categories based on the guidance issued by
the Minnesota Department of Education and policies adopted by the Board of Education.
Source: District Records
(modified accrual basis of accounting)Last Ten Fiscal Years
Fund Balances, Governmental FundsWillmar Public Schools
Fiscal Year
(85)

(This page intentionally left blank)

2002 2003 2004 2005 2006 2007 2008 2009 2010 2011
Federal sources:
Federal grants 1,740,341$ 1,892,894$ 2,415,250$ 2,976,667$ 2,585,904$ 1,742,649$ 1,946,008$ 1,790,446$ 5,195,242$ 3,619,120$
Food Service 693,669 689,411 942,719 997,882 1,058,230 1,111,782 1,242,815 1,348,149 1,578,267 1,550,022
Total Federal sources 2,434,010 2,582,305 3,357,969 3,974,549 3,644,134 2,854,431 3,188,823 3,138,595 6,773,509 5,169,142
State sources:
General Education 26,390,524 32,194,247 31,101,721 31,476,589 33,264,022 34,111,061 34,914,994 35,233,235 32,000,209 32,619,042
Food Service 66,109 212,584 112,955 173,595 163,578 159,811 189,131 190,237 180,270 175,246
Community Service 818,547 737,513 740,561 657,680 851,693 796,112 883,652 894,151 880,785 710,113
Debt Service 221,383 412,767 403,534 353,315 254,848 248,457 233,315 190,518 193,785 194,014
Total State sources 27,496,563 33,557,111 32,358,771 32,661,179 34,534,141 35,315,441 36,221,092 36,508,141 33,255,049 33,698,415
Local sources:
Property Taxes 6,452,868 3,754,328 4,576,808 4,257,657 3,457,394 4,931,199 5,395,510 5,356,117 6,326,095 8,492,117
Food Service sales 706,428 689,411 669,556 680,903 721,303 780,817 775,699 782,746 809,821 812,445
Other Revenues 4,341,421 2,748,688 2,825,273 3,058,007 4,370,010 3,303,957 2,515,070 2,111,015 2,220,636 2,554,123
Total Local sources 11,500,717 7,192,427 8,071,637 7,996,567 8,548,707 9,015,973 8,686,279 8,249,878 9,356,552 11,858,685
Total Revenues 41,431,290$ 43,331,843$ 43,788,377$ 44,632,295$ 46,726,982$ 47,185,845$ 48,096,194$ 47,896,614$ 49,385,110$ 50,726,242$
Source: District Records
(modified accrual basis of accounting)Last Ten Fiscal Years
Governmental Funds RevenuesWillmar Public Schools
Fiscal Year
(86)

(This page intentionally left blank)

2002 2003 2004 2005 2006 2007 2008 2009 2010 2011
Administration 956,951$ 1,188,380$ 1,372,933$ 1,367,749$ 1,396,790$ 1,543,232$ 1,546,127$ 1,740,466$ 1,557,761$ 1,487,485$
District Support Services 1,334,089 1,496,621 739,775 848,471 855,165 959,115 872,978 946,171 942,076 1,100,077
Regular Instruction 14,601,423 14,834,612 16,834,677 18,410,539 17,799,589 18,220,574 19,967,831 19,565,445 18,880,393 19,558,378
Vocational Education Instruction 940,051 1,016,872 956,050 996,008 855,159 612,387 744,309 857,961 780,689 822,816
Special Education Instruction 6,636,753 6,965,758 7,385,608 8,050,284 8,303,384 7,593,015 8,112,649 8,357,364 7,468,689 7,361,512
Instructional Support Services 1,705,627 1,786,264 1,852,514 1,728,040 2,036,393 1,953,089 2,398,440 2,273,127 2,111,164 2,158,543
Pupil Support Services 2,418,043 2,531,695 2,674,200 3,048,342 3,098,484 3,158,359 3,393,865 3,587,103 3,567,247 3,570,398
Sites and Buildings 2,960,877 3,310,991 3,160,351 3,511,193 3,840,955 4,781,520 4,624,367 4,010,687 3,551,207 4,576,145
Fiscal and Other Fixed Costs 373,925 300,092 263,146 222,139 313,200 239,392 158,478 130,010 129,459 126,236
Food Service 1,495,274 1,630,041 1,741,815 1,959,951 1,877,669 1,951,394 2,156,016 2,213,875 2,246,359 2,354,264
Community Service 1,571,652 1,761,632 1,663,488 1,951,640 2,037,256 2,025,813 2,094,107 1,994,607 1,973,659 2,208,894
Capital Outlay - - 842,400 983,668 784,338 1,181,461 1,731,512 1,363,308 1,491,899 993,366
Debt Service
Principal 700,000 1,545,000 1,620,000 1,740,000 1,600,000 1,505,425 1,820,000 1,835,000 1,995,000 2,100,000
Interest and Fiscal Charges 2,113,398 1,195,935 1,150,213 1,043,915 1,057,910 1,028,138 763,830 686,800 594,700 495,900
Total Expenditures 37,808,063$ 39,563,893$ 42,257,170$ 45,861,939$ 45,856,292$ 46,752,914$ 50,384,509$ 49,561,924$ 47,290,302$ 48,914,014$
Debt Service as a percentage of
noncapital expenditures N/A 6.97% 6.61% 6.19% 5.87% 5.48% 5.24% 5.18% 5.63% 5.42%
Source: District Records
(modified accrual basis of accounting)Last Ten Fiscal Years
Governmental Funds Expenditures and Debt Service RatioWillmar Public Schools
Fiscal Year
(87)

(This page intentionally left blank)

2002 2003 2004 2005 2006 2007 2008 2009 2010 2011
Excess of revenues over
(under) expenditures 3,623,227$ 3,767,950$ 1,531,208$ (1,229,644)$ 870,690$ 432,931$ (2,288,315)$ (1,665,310)$ 2,094,808$ 1,812,228$
Other Financing Sources (Uses)
Insurance Recovery Proceeds - - 938 2,778 24,574 203,846 93,136 - - -
Sale of Bonds Proceeds - - 1,389,711 - 16,265,000 495,000 - - - -
Bond Premium - - - - 913,760 2,242 - - - -
Payment to Refunded Bond Escrow Agent (21,407,927) - (875,000) - (17,085,000) - - - - -
Sale of Capital Assets - 1,050 - - 500 - - - 2,100 50
Total Other Financing Sources (Uses) (21,407,927) 1,050 515,649 2,778 118,834 701,088 93,136 - 2,100 50
Special Items
Proceeds from Sale of Land and Building - - - - - 128,986 1,999 - - 280,114
Total Special Items - - - - - 128,986 1,999 - - 280,114
Net Change in Fund Balances (17,784,700)$ 3,769,000$ 2,046,857$ (1,226,866)$ 989,524$ 1,263,005$ (2,193,180)$ (1,665,310)$ 2,096,908$ 2,092,392$
Source: District Records
(modified accrual basis of accounting)Last Ten Fiscal Years
Governmental Funds Other Financing Sources and Uses and Net Change in Fund BalancesWillmar Public Schools
Fiscal Year
(88)

(This page intentionally left blank)

Tax Capacity
For Taxes Taxable as a Percentage Total Direct
Collectible Agricultural Non-Agricultural Personal Tax Increment Total Taxable Market Value of Market Value Tax Rate
2002 1,495,010$ 9,678,935$ 177,535$ (116,286)$ 11,235,194$ 840,410,870$ 1.34% 24.656
2003 1,587,299 10,015,812 220,226 (114,863) 11,708,474 884,638,900 1.32% 25.149
2004 1,713,199 10,589,903 257,189 (100,081) 12,460,210 942,034,900 1.32% 25.826
2005 1,982,217 11,817,783 281,114 (31,314) 14,049,800 1,050,845,800 1.34% 23.799
2006 2,296,089 13,000,522 312,655 (32,968) 15,576,298 1,163,814,004 1.34% 23.441
2007 2,632,195 14,547,853 307,961 (35,833) 17,452,176 1,293,283,775 1.35% 22.798
2008 2,946,724 15,839,210 305,981 (49,567) 19,042,348 1,393,141,350 1.37% 20.354
2009 3,174,815 16,719,425 304,326 (22,865) 20,175,701 1,459,461,675 1.38% 20.713
2010 3,551,015 17,455,668 317,290 (22,865) 21,301,108 1,484,886,925 1.43% 20.019
2011 3,491,560 17,645,655 359,697 (22,865) 21,474,047 1,499,389,950 1.43% 20.103
Source: State of Minnesota School Tax Report, Kandiyohi County Auditor
Willmar Public SchoolsAssessed Value and Actual Value of Taxable Property
Last Ten Fiscal Years
Tax Capacity Valuation
(89)

For Taxes Referendum General Kandiyohi City of
Collectible Purposes Purposes Total County Willmar
2002 0.157 24.499 24.656 79.752 26.355
2003 0.155 24.994 25.149 81.338 24.584
2004 0.114 25.712 25.826 79.176 26.196
2005 0.103 23.696 23.799 70.608 26.265
2006 0.132 23.309 23.441 65.319 24.102
2007 0.130 22.693 22.823 60.414 25.623
2008 0.125 20.229 20.354 56.711 28.236
2009 0.168 20.545 20.713 56.878 28.163
2010 0.172 19.847 20.019 53.358 28.642
2011 0.173 19.930 20.103 55.943 29.285
Source: Kandiyohi County Auditor
District Direct Rates Overlapping Rates
Willmar Public SchoolsDirect and Overlapping Property Tax Rates
Last Ten Fiscal Years(rate per $1,000 of assessed value)
(90)

% OF TOTAL % OF TOTAL
NET TAX NET TAX
2011 NET CAPACITY 2002 NET CAPACITY
TAXPAYER TAX CAPACITY RANK 21,474,047 TAX CAPACITY RANK 11,235,194
Pioneer Health Systems, Inc. (Aff Comm) $211,894 1 0.99% $200,862 1 1.79%
Wal-Mart Stores, Inc 204,654 2 0.95% - 0.00%
Kandi Land 1999, LLC 186,990 3 0.87% 195,866 2 1.74%
Menard, Inc. 186,474 4 0.87% - 0.00%
Mills Properties, Inc. 136,485 5 0.64% - 0.00%
BNSF Railway Company 125,924 6 0.59% 97,306 5 0.87%
Jennie-O Turkey Store, Inc. 115,136 7 0.54% 124,792 3 1.11%
Willmar Poultry Farms, Inc. 108,708 8 0.51% 76,452 6 0.68%
Alliance Pipeline 103,180 9 0.48% 102,402 4 0.91%
Christianson Ag, Inc. 99,732 10 0.46% - 0.00%
Minnegasco (Centerpoint) - 0.00% 67,542 7 0.60%
Torgerson Properties - 0.00% 63,306 8 0.56%
Sunrise Village - 0.00% 55,689 9 0.50%
Dayton Hudson Corp. - 0.00% 53,308 10 0.47%
TOTAL $1,267,283 5.90% $836,663 7.45%
Source: Kandiyohi County Auditor
2011 2002
Willmar Public SchoolsPrincipal Property Tax Payers
Current Year and Nine Years Ago
(91)

Adjusted Delinquent
For Taxes Net % of Tax % of
Collectible Levy (1) Amount (2) Levy Collections Amount Levy
2002 3,749,176$ 3,676,820$ 98.07% 66,186$ 3,743,006$ 99.84%
2003 3,962,277 3,902,664 98.50% 52,110 3,954,774 99.81%
2004 3,938,930 3,887,832 98.70% 97,362 3,932,234 99.83%
2005 4,058,509 4,007,232 98.74% 47,974 4,055,206 99.92%
2006 4,807,017 4,742,834 98.66% 53,404 4,796,238 99.78%
2007 5,292,329 5,222,338 98.68% 39,311 5,261,649 99.42%
2008 5,276,103 5,199,412 98.55% 31,266 5,230,678 99.14%
2009 6,283,379 6,177,075 98.31% 49,659 6,226,734 99.10%
2010 6,470,465 6,385,725 98.69% 48,380 6,434,105 99.44%
2011 6,577,742 3,383,869 51.44% 0 3,383,869 51.44%
Source: Kandiyohi County Auditor
Note 2: A portion of the total levy is paid through various property tax credits which are paid through state aids and have been included in collections.
Note 1: Beginning with the levy collectible in FY 2003, the general education levy is eliminated due to the state's effort to fund general education entirely through state aid.
Willmar Public SchoolsProperty Tax Levies and Collections
Last Ten Fiscal Years
Total Collections to DateCollected within the Fiscal Year of
the Levy
(92)

Aid & Tax Total % of
Fiscal Bonded Anticipation EPA Primary Personal Per
Year Debt (2) Certificates Loan Government Income1 Capita1
2002 23,395,000$ 3,975,120$ 20,425 27,390,545$ 2.36% 670$
2003 21,855,000 8,475,687 15,425 30,346,112 2.55% 739
2004 20,752,395 2,537,065 10,425 23,299,885 1.86% 568
2005 19,010,000 0 5,425 19,015,425 1.40% 465
2006 16,595,000 3,957,811 425 20,553,236 1.45% 503
2007 15,585,000 0 0 15,585,000 1.04% 381
2008 13,765,000 0 0 13,765,000 0.85% 336
2009 11,930,000 0 0 11,930,000 0.75% 290
2010 9,935,000 0 0 9,935,000 N/A 235
2011 7,835,000 0 0 7,835,000 N/A 185
N/A = not available.
Source: District Records
Note 1: Details regarding the District's current outstanding debt can be found in the notes to basic financial statements.
1 See the Schedule of Demographic and Economic Statistics for personal income and population data. These ratios were calculated using personal income and population for the prior calendar year.
Willmar Public SchoolsOutstanding Debt by Type (1)
Last Ten Fiscal Years
(93)

G.O. Estimated
Bonded Applicable Estimated Share of Direct
Governmental Unit (1) Debt Percentage (2) and Overlapping Debt
Kandiyohi County 43,340,000$ 44.33% 19,214,009$
Cities:
Kandiyohi 220,000 100.00% 220,000
Pennock 675,000 100.00% 675,000
Willmar 10,780,000 100.00% 10,780,000
Subtotal, overlapping debt 30,889,009
District direct debt 7,835,000
Total direct and overlapping debt 38,724,009$
Source: Kandiyohi County Auditor
Note 1: Only those taxing jurisdictions with general obligation debt outstanding are included in this section.
Note 2: Estimated Applicable Percentage is determined by dividing the Tax Capacity of Portion Within the School District by the Tax Capacity of the Entire Governmental Unit.
Willmar Public SchoolsDirect and Overlapping Governmental Activities Debt
As of June 30, 2011
(94)
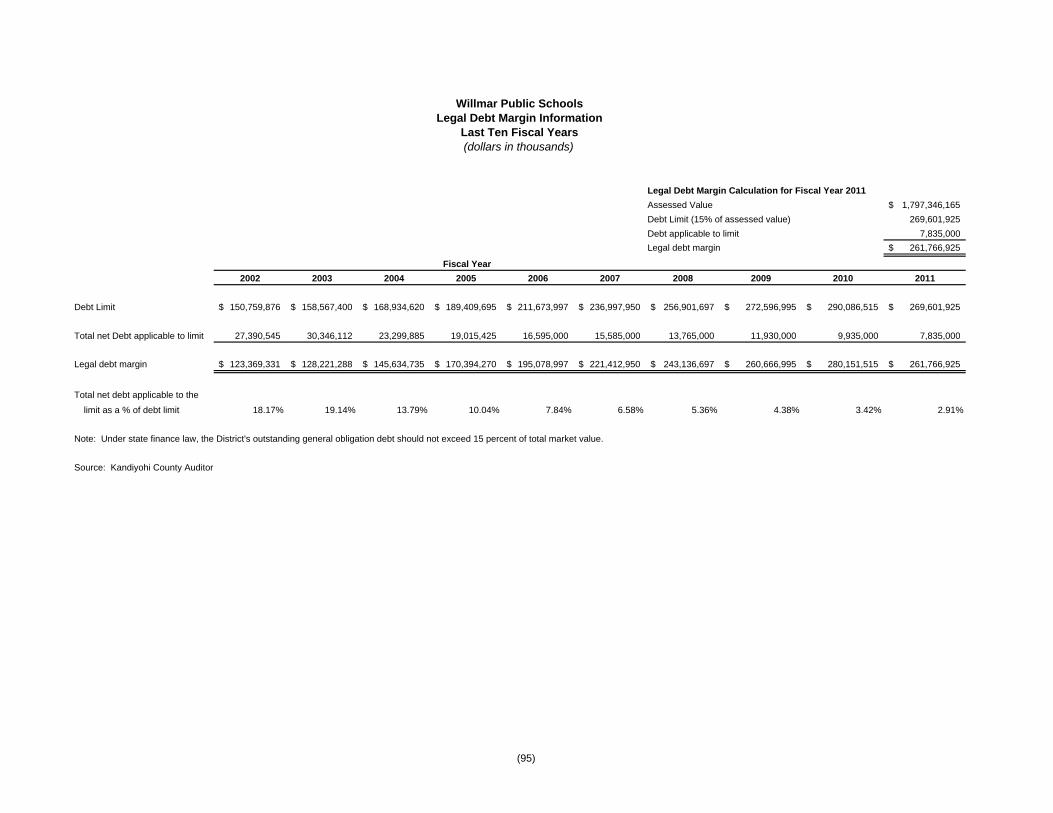
Legal Debt Margin Calculation for Fiscal Year 2011
Assessed Value 1,797,346,165$
Debt Limit (15% of assessed value) 269,601,925
Debt applicable to limit 7,835,000
Legal debt margin 261,766,925$
2002 2003 2004 2005 2006 2007 2008 2009 2010 2011
Debt Limit 150,759,876$ 158,567,400$ 168,934,620$ 189,409,695$ 211,673,997$ 236,997,950$ 256,901,697$ 272,596,995$ 290,086,515$ 269,601,925$
Total net Debt applicable to limit 27,390,545 30,346,112 23,299,885 19,015,425 16,595,000 15,585,000 13,765,000 11,930,000 9,935,000 7,835,000
Legal debt margin 123,369,331$ 128,221,288$ 145,634,735$ 170,394,270$ 195,078,997$ 221,412,950$ 243,136,697$ 260,666,995$ 280,151,515$ 261,766,925$
Total net debt applicable to the
limit as a % of debt limit 18.17% 19.14% 13.79% 10.04% 7.84% 6.58% 5.36% 4.38% 3.42% 2.91%
Note: Under state finance law, the District's outstanding general obligation debt should not exceed 15 percent of total market value.
Source: Kandiyohi County Auditor
Fiscal Year
Willmar Public SchoolsLegal Debt Margin Information
Last Ten Fiscal Years(dollars in thousands)
(95)

Less: Amounts Percentage of
General Restricted to Actual Value % of
Fiscal Obligation Repaying of Taxable Personal Per
Year Bonds Principal Total Property Income Capita
2002 23,395,000$ 993,012$ 22,401,988$ 2.23% 1.93% 544$
2003 21,855,000 907,371 20,947,629 1.98% 1.76% 512
2004 20,752,395 840,804 19,911,591 1.77% 1.59% 485
2005 19,010,000 760,111 18,249,889 1.45% 1.35% 445
2006 16,595,000 835,384 15,759,616 1.12% 1.11% 385
2007 15,585,000 902,774 14,682,226 0.93% 0.98% 359
2008 13,765,000 965,982 12,799,018 0.75% 0.79% 313
2009 11,930,000 717,782 11,212,218 0.62% 0.70% 274
2010 9,935,000 632,611 9,302,389 0.48% N/A 226
2011 7,835,000 603,864 7,231,136 0.40% N/A 171
N/A = not available
Source: District Records and Bureau of Economic Analysis - U.S. Dept. of Commerce.
Note: Details regarding the District's outstanding debt can be found in the notes to basic financial statements.
1 See Schedule of Demographic and Economic Statistics for personal income and population data. These ratios were calculated using personal income and population for the prior calendar year.
Willmar Public SchoolsRatios of Outstanding Debt by Type
Last Ten Fiscal Years
General Bonded Debt Outstanding
(96)

Fiscal Personal Per Capita Unemployment
Year Population Income Personal Income Rate
2002 40,893 1,162,600,000$ 28,430$ 3.80%
2003 41,043 1,188,070,000 28,947 4.20%
2004 41,013 1,251,755,000 30,521 4.20%
2005 40,936 1,355,537,000 33,114 3.50%
2006 40,861 1,421,774,000 34,795 3.40%
2007 40,870 1,493,125,000 36,534 4.10%
2008 40,959 1,612,334,000 39,365 4.50%
2009 41,123 1,595,120,000 38,789 7.00%
2010 42,239 N/A N/A 5.90%
2011 42,239 N/A N/A 6.00%
N/A = not available
Source: Bureau of Economic Analysis - U.S. Department of Commerce,
Bureau of Labor Statistics, U.S. Census Bureau, and
Minnesota Department of Employment and Economic Development
Kandiyohi County
Willmar Public SchoolsDemographic and Economic Statistics
Last Ten Fiscal Years
(97)

% OF % OF
TOTAL TOTAL
EMPLOYMENT EMPLOYMENT
TAXPAYER EMPLOYEES RANK 23,102 EMPLOYEES RANK 22,987
Jennie-O Turkey Store, Inc. 1,500 1 6.49% 2,200 1 9.57%
Rice Memorial Hospital 912 2 3.95% 925 2 4.02%
Willmar Public Schools 819 3 3.55% 730 3 3.18%
Affiliated Community Medical Centers 558 4 2.42% 557 5 2.42%
Divine House 475 5 2.06% 0.00%
Kandiyohi County 433 6 1.87% 421 6 1.83%
Bethesda Homes 350 7 1.52% 400 7 1.74%
Walmart 340 8 1.47% 0.00%
Ridgewater College 235 9 1.02% 568 4 2.47%
Willmar Poultry Co. 225 10 0.97% 0.00%
Cashwise 0.00% 325 9 1.41%
BNSF Railroad 0.00% 270 10 1.17%
Willmar Regional Treatment Center 0.00% 400 8 1.74%
TOTAL 5,847 25.31% 6,796 29.56%
N/A = not available
Source: Minnesota Department of Employment and Economic Development and Springsted, Inc.
2011 2002
Willmar Public SchoolsPrincipal Employers
Current Year and Nine Years Ago
(98)

2004 2005 2006 2007 2008 2009 2010 2011Instruction
Teachers 335.0 333.5 331.0 327.0 338.0 322.7 307.5 339.0Title Teachers 17.0 15.5 17.5 16.5 17.0 15.0 15.0 19.0Deans of Students 4.0 4.0 4.0 3.0 5.0 4.0 4.0 2.0
Total Instruction 356.0 353.0 352.5 346.5 360.0 341.7 326.5 360.0
SupportPrincipals and District Administration 10.0 10.0 10.0 10.0 10.0 9.0 9.0 7.0Directors & Community Education 8.0 8.0 8.0 6.0 6.0 6.0 6.0 9.0Secretaries 16.5 16.5 16.5 16.0 20.0 20.0 18.5 19.0Custodians 27.0 26.0 25.5 24.5 27.0 27.0 27.0 26.0Food Service 28.0 28.0 30.0 30.0 30.0 30.0 28.0 28.0Clerical/Non-affiliated 45.0 44.5 44.5 44.5 42.0 42.0 38.0 45.0Paraprofessionals 119.0 118.5 110.0 99.0 102.0 97.0 78.0 106.0
Total Support 253.5 251.5 244.5 230.0 237.0 231.0 204.5 240.0
Total 609.5 604.5 597.0 576.5 597.0 572.7 531.0 600.0
Note: Information prior to 2004 is not readily available.
Source: District Records
Fiscal Year
Last Eight Fiscal YearsFull-Time-Equivalent District Employees by Type
Willmar Public Schools
(99)

Cost Teaching Pupil- % of Students
Fiscal Operating Per % Staff Teacher Receiving Free or
Year Enrollment (1) Expenditures (2) Pupil Change FTE's Ratio (3) Reduced- Price Meals
2002 4,335 34,232,553$ 7,897$ -5.18% N/A N/A 38.2%
2003 4,259 36,051,061 8,465 7.19% N/A N/A 40.9%
2004 4,195 38,834,939 9,257 9.37% 356.0 11.8 41.2%
2005 4,093 42,452,947 10,372 12.04% 353.0 11.6 43.0%
2006 4,103 42,312,009 10,312 -0.57% 352.5 11.6 44.5%
2007 4,077 43,352,344 10,633 3.11% 346.5 11.8 46.4%
2008 4,038 46,629,456 11,548 8.60% 360.0 11.2 46.9%
2009 4,076 45,960,727 11,276 -2.35% 341.7 11.9 48.0%
2010 4,032 43,519,178 10,793 -4.28% 326.5 12.3 50.3%
2011 3,987 45,703,206 11,463 6.20% 360.0 11.1 51.4%
N/A = not available.
Note 1: Enrollment is measured by Average Daily Membership per the Minnesota Department of Education.
Note 2: Operating Expenditures are total districtwide expenditures less debt service and operating capital.
Note 3: This data is computed by dividing total Enrollment by total Teaching Staff FTE's.
Source: District Records and Minnesota Department of Education
Willmar Public SchoolsOperating Statistics
Last Ten Fiscal Years
(100)

Fiscal Minimum Maximum
Year Salary Salary
2002 $28,309 $54,799
2003 29,500 56,178
2004 29,800 56,658
2005 30,100 57,138
2006 30,550 58,735
2007 32,435 59,585
2008 33,132 60,931
2009 34,159 62,820
2010 34,159 62,820
2011 34,159 62,820
Note: Amounts do not include fringe benefits such as pension, health insurance, disability, etc.
Source: District Records
Willmar Public SchoolsTeacher Base SalariesLast Ten Fiscal Years
(101)

(This page intentionally left blank)

2002 2003 2004 2005 2006 2007 2008 2009 2010 2011SchoolPreK - ElementaryJefferson (1953)
Square Feet 46,833 46,833 46,833 46,833 46,833 46,833 46,833 46,833 46,833 46,833Enrollment 225 200 245 247 252 258 253 264 32 33Acres 2.5 2.5 2.5 2.5 2.5 2.5 2.5 2.5 2.5 2.5
Kennedy (1958)Square Feet 150,665 150,665 150,665 150,665 150,665 150,665 150,665 150,665 150,665 150,665Enrollment 948 921 758 752 755 796 802 854 910 908Acres 23.7 23.7 23.7 23.7 23.7 23.7 23.7 23.7 23.7 23.7
Lafayette (1939) (sold June 15, 2007)Square Feet 22,953 22,953 22,953 22,953 22,953 0 0 0 0 0Enrollment 0 0 0 0 0 0 0 0 0 0Acres 2.3 2.3 2.3 2.3 2.3 0 0 0 0 0
Lincoln (1924) (closed 2010)Square Feet 46,004 46,004 46,004 46,004 46,004 46,004 46,004 46,004 46,004 46,004Enrollment 329 321 319 326 326 325 313 254 0 0Acres 2.4 2.4 2.4 2.4 2.4 2.4 2.4 2.4 2.4 2.4
Roosevelt (1987)Square Feet 95,000 95,000 95,000 95,000 95,000 95,000 95,000 95,000 105,000 105,000Enrollment 642 635 740 709 683 698 720 767 883 906Acres 24.0 24.0 24.0 24.0 24.0 24.0 24.0 24.0 24.0 24.0
Washington (1951) (sold April 22, 2011)Square Feet 30,916 30,916 30,916 30,916 30,916 30,916 30,916 30,916 30,916 0Enrollment 24 23 24 22 22 23 25 25 29 0Acres 4.7 4.7 4.7 4.7 4.7 4.7 4.7 4.7 4.7 0
Fiscal Year
Willmar Public SchoolsSchool Building Information - Owned Buildings
Last Ten Fiscal Years
(102)

(This page intentionally left blank)

2002 2003 2004 2005 2006 2007 2008 2009 2010 2011SecondaryMiddle School (1967)
Square Feet 154,380 154,380 154,380 154,380 154,380 154,380 154,380 154,380 154,380 154,380Enrollment 675 644 637 623 648 609 539 552 871 868Acres 28.7 28.7 28.7 28.7 28.7 28.7 28.7 28.7 28.7 28.7
Senior High (1997)Square Feet 267,000 267,000 267,000 267,000 267,000 267,000 267,000 267,000 267,000 267,000Enrollment 1,250 1,278 1,267 1,254 1,261 1,195 1,226 1,198 1,175 1,114Acres 193.0 193.0 193.0 193.0 193.0 193.0 193.0 193.0 193.0 193.0
Garfield (1930)Square Feet 25,536 25,536 25,536 25,536 25,536 25,536 25,536 25,536 25,536 25,536Enrollment 140 112 101 84 67 89 72 69 77 77Acres 2.6 2.6 2.6 2.6 2.6 2.6 2.6 2.6 2.6 2.6
WEAC (1939)Square Feet 49,470 49,470 49,470 49,470 49,470 49,470 49,470 49,470 49,470 49,470Enrollment 17 18 18 16 15 7 0 0 0 0Acres 2.4 2.4 2.4 2.4 2.4 2.4 2.4 2.4 2.4 2.4
N/A = not available
Source: District Records and Minnesota Department of Education
Fiscal Year
Willmar Public SchoolsSchool Building Information - Owned Buildings (continued)
Last Ten Fiscal Years
(103)

Insured through
Agent & Ins. Co.
Insurable Risk or Risk Pool Policy Period Coverage Limits Deductible
Hanover Gen. Agg. $2,000,000
General Liability Insurance 7/1/10 - 7/1/11 Each Occ. $1,000,000 $1,000/ee
Company
Hanover Liability $1,000,000 $250 to
Automotive Liability Insurance 7/1/10 - 7/1/11 Uninsured $1,000,000 $500
Company Under… $1,000,000
Hanover Occurance $2,000,000
Commercial Excess Insurance 7/1/10 - 7/1/11 Aggregate $2,000,000 na
Company
Hanover Claim $1,000,000
School Leaders E & O Insurance 7/1/10 - 7/1/11 Aggregate $1,000,000 $1,000
Company
Hanover
Basic Property (all risk) Insurance 7/1/10 - 7/1/11 Varies by type of property $5,000
Company
Hanover
Boiler and Machinery Insurance 7/1/10 - 7/1/11 $173,039,632 $5,000
Company
Hanover
Inland Marine Insurance 7/1/10 - 7/1/11 Various types of property na
Company
Hanover Accident $500,000
Workers' Compensation Insurance 7/1/10 - 7/1/11 Disease $500,000 na
Company Disease $500,000 ee
Hanover
Crime Insurance 7/1/10 - 7/1/11 Theft, etc. $100,000 $500
Company
Source: District records
Schedule of Insurance Coverage
Willmar Public Schools
For the Year Ended June 30, 2011
(104)