Embed Size (px)
Citation preview

School of Surgery
First metatarsophalangeal joint range of motion: influence of ankle joint position and gastrocsoleus muscle stretching.
Ian Graham North
BSc (Podiatry)
Post Grad Dip (Podiatry)
This thesis is presented for the degree of Master of Medical Science within the
School of Surgery, at The University of Western Australia, 2008.

i
ABSTRACT
First metatarsophalangeal joint (MTPJ1) motion is an important factor in normal
weight transference during walking. Disruptions to normal range can influence
joints both proximal and distal to the MTPJ1, potentially leading to pain and
dysfunction. Whilst the MTPJ1 has been investigated significantly, the
numerous methodologies described to quantify range of motion can be
questioned and makes comparisons difficult. Range of MTPJ1 motion is
commonly assessed in a clinical setting to determine pathology as well as to
make decisions on appropriate intervention. The anatomical and biomechanical
influence of tendo Achilles load and MTPJ1 motion has been well described;
however few studies measuring MTPJ1 range control for Achilles load or
describe ankle joint positioning. Further to this the effects of reducing tendo
Achilles stiffness on MTPJ1 extensions has yet to be investigated. The purpose
of this study was to describe a technique to quantify passive MTPJ1 extension
and to determine the influence of ankle joint position on joint range. Secondly
the effect of calf muscle stretching on MTPJ1 range was also investigated. The
information gathered will assist both research and clinical protocols for
quantifying MTPJ1 range, and provide a greater understanding of the anatomic
and biomechanical relationship between tendo Achilles load and MTPJ1
extension.
In order to fulfil the purposes of the study it was necessary to establish a
reliable methodology to quantify non weight bearing MTPJ1 extension.
Reliability testing was undertaken in three parts. First the appropriate number of
load un-load cycles was determined to produce statistically stable measures of
joint range. It was determined that beyond six load un-load cycles there was no
statistical significant difference in degrees of motion at the MTPJ1 representing
satisfactory joint conditioning. The second part of the reliability testing
determined the same day test re-test intra-rater reliability which was deemed to
be high (ICC 3, 1 0.89-0.99) across all derived variables. Test re-test intra-rater
reliability across one week was similarly good to high for all derived variables
(ICC 3, 1 0.76-0.98) with the exception of derived variable ankle joint dorsi flexion
at 10 Newtons (ICC 3, 1 0.23) which was low due to the actual low values in
degrees of motion.

ii
The influence of ankle joint position on MTPJ1 extension was investigated using
37 subjects [21 females and 16 males] with a mean age of 28 years.
Measurement of MTPJ1 extension was made in degrees at 10 and 30 Newton’s
across three ankle joint positions, namely ankle joint neutral, ankle joint dorsi
flexed and ankle joint plantar flexed. Data were analysed using paired t-tests.
The results indicated a statistical difference between MTPJ1 across each ankle
joint position, with a 90% and 70% reduction in the mean MTPJ1 range
between ankle joint plantar flexed to ankle joint dorsi flexed for 10 and 30
Newtons respectively.
Comparisons were made between left and right feet which indicated a trend
towards increased MTPJ1 range on the right limb with statistical significant
reached for variables ankle joint dorsi flexed at 10 Newton’s and ankle joint
neutral, ankle joint dorsi flexed and ankle joint plantar flexed at 30 Newtons.
Females appeared to display greater MTPJ1 range compared to males. There
was a statistical difference for variables ankle joint neutral and ankle joint
plantar flexion at 10 and 30 Newtons.
The study also investigated the immediate effect of a one minute calf muscle
stretch on MTPJ1 extension and ankle joint range as well the effect of the same
calf stretch performed twice daily over one week. Eleven subjects [7 males and
4 females] with a mean age of 29 years participated in this study. One limb was
randomly assigned as the stretch leg with the contralateral limb acting as the
control. The results demonstrated a statistically significant increase in joint
range immediately following a one minute stretch for variables ankle joint range
of motion as well as MTPJ1 extension for ankle joint plantar flexed at 10
Newton’s and ankle joint neutral and plantar flexed at 30 Newtons. No
significant differences were noted in ankle or MTPJ1 range of motion in either
the control group on immediate re-testing, or in both groups after a one week
stretch program.
The findings of this study support those documented in the literature pertaining
to the ankle joint position, tendo Achilles load and plantar fascial stiffness to
MTPJ1 range of motion. Increased stiffness at the MTPJ1 was noted dependant

iii
on ankle joint position from ankle joint plantar flexion through to ankle joint
dorsiflexion. This appears most likely due to increases in tendo Achilles load
and subsequent forces transmitted to the plantar aponeurosis. The present
study also demonstrated a trend towards increased joint extensibility and limb
dominance. The study also supports previous literature into gender differences
and joint extensibility, with a positive trend towards increased MTPJ1 range
evident in the female subjects tested. The study also demonstrated the
immediate effect of calf muscle stretching on ankle and MTPJ1 range of motion.
It remains however unclear as to the exact mechanisms involved in producing
increased joint range be it reflex inhibition or actual changes to the viscoelastic
properties of the soft tissues. Despite this, no changes were evident following a
one week stretching program, which supports previous literature describing a
short lag time before soft tissues revert to baseline length properties following a
single stretch session.

iv
ACKNOWLEDGEMENTS
I would like to express my appreciation to:
My supervisors, Professor Kevin Singer, Head of the Centre for Musculoskeletal
Studies (CMS) UWA, and Associate Professor Alan Bryant, Head of Podiatric
Medicine UWA for their commitment to my work from an academic view point as
well as the personal after hours work in helping me through this research
process. I would also like to thank Associate Professor Gary Allison School of
Physiotherapy, Curtin University for providing some equipment and guidance
through the initial period of this research. Also, a special thank you to Ray Smith
CMS UWA for his technical advice and computer programming skills used
throughout the work.
My family and friends for their ongoing support and constant asking of “how’s
your study going”, for which I found great motivation.
All the participants who volunteered their time for the study, including my
colleagues at Willetton Physiotherapy and Podiatry clinic who I used extensively
during the pilot stages.
Finally and most importantly, my partner Kaye Hosking and our children Riley
and Brianna, who have supported me wholeheartedly throughout this project.
Without such great support I would never have completed this thesis.

v
DECLARATION OF ORIGINALITY
This thesis is presented for the degree of Master of Medical Science of The
University of Western Australia. Studies were undertaken between February
2006 and July 2008, through the Centre for Musculoskeletal Studies, School of
Surgery.
The pilot studies and final research study were developed in association with
my thesis supervisors, who were involved in editing this thesis. I have
performed all the experimental work and analyses of results independently.
I declare that all material presented in this thesis is original, apart from the work
from other sources which has been acknowledged within the text. Review of the
relevant literature to the thesis has been included up to July 2008.
Ian Graham North July 2008
vi
TABLE OF CONTENTS
PAGE
ABSTRACT i
ACKNOWLEDGEMENTS iv
DECLARATION OF ORIGINALITY v
TABLE OF CONTENTS vi
LIST OF TABLES xi
LIST OF FIGURES xiv
LIST OF ABBREVIATIONS xvi
DEFINITION OF TERMS xvii
CHAPTER ONE
DEVELOPMENT OF THE PROBLEM 1.0 Introduction 1
1.1 Statement of the problem and purpose of the study 1
1.1.1 Pilot Study: Weight bearing MTPJ1 extension 3
1.2 Significance of study 5
1.3 Research questions 5
1.4 Summary 6
CHAPTER TWO
REVIEW OF THE LITERATURE
2.0 INTRODUCTION 7
2.1 First Metatarsophalangeal Joint Anatomy 7
2.2 First Metatarsophalangeal ROM 9
2.3 Plantar Fascia and Windlass Mechanics. 11
2.4 MTPJ1- Pathology 12
2.4.1 Hallux rigidus 12
2.4.2 Functional hallux limitus 13
2.4.3 Plantar Fasciitis 13
2.4.4 Diabetes Mellitus and Limited Joint Mobility 14
2.5 Ankle Joint Position and MTPJ1. 15
2.6 Effects of Muscle Stretching 17

vii
2.7 Symmetry and Laterality 19
2.8 Assessment of foot type 20
2.9 Summary 21
CHAPTER THREE
METHODOLOGY 3.0 Introduction 22
3.1 Pilot Studies 22
3.2 Non-weight bearing Instrument methodology 22
Part One: Instrument development 24
3.3 Series I: Number of joint cycles 24
3.3.1 Description 24
3.3.2 Sample 25
3.3.3 Data 25
3.3.4 Derived Variables 25
3.3.5 Results 26
3.3.6 Summary 27
3.4 Series II- Test re-test reliability (same day) 28
3.4.1 Description 28
3.4.2 Sample 28
3.4.3 Data 28
3.4.4 Derived variables 28
3.4.5 Results 29
3.4.6 Summary 29
3.5 Series III- Test retest reliability (one week) 29
3.5.1 Description 29
3.5.2 Sample 30
3.5.3 Data 30
3.5.4 Derived variables 30
3.5.5 Results 30
3.5.6 Summary 31
Part Two: Normal series 31
3.6 Study design and subjects 31
3.6.1 Recruitment 31
3.7 Data collection procedures 32

viii
3.7.1 Inclusion criteria 32
3.7.2 Exclusion criteria 32
3.7.3 Ethical Considerations 32
3.7.4 Data collection 33
3.7.5 Procedures 33
3.7.5.1 Foot Posture Index (FPI-6) 33
3.7.5.2 Ankle Joint Range of Motion 33
3.7.5.3 MTPJ1 ROM 35
3.7.5.4 Data processing 35
3.7.5.5 Analysis of Data 35
Part Three: Stretching series 36
3.8 Study design and subjects 36
3.8.1 Recruitment 37
3.9 Data collection procedures 37
3.9.1 Inclusion criteria 37
3.9.2 Exclusion criteria 37
3.9.3 Ethical Considerations 37
3.9.4 Data collection 37
3.9.5 Procedures 38
3.9.5.1 Foot Posture Index 38
3.9.5.2 Ankle Joint Range of Motion 38
3.9.5.3 MTPJ1 38
3.9.5.4 Calf muscle stretching 38
CHAPTER FOUR
RESULTS 4.0 Introduction 40
4.1 Demographics 40
4.2 Normality 41
4.3 Laterality 41
4.4 Gender differences 42
4.5 Ankle joint position and MTPJ1 ROM 43
4.6 Foot posture 46
4.7 Calf MTU stretching and MTPJ1 ROM 49
ix
CHAPTER FIVE
DISCUSSION 5.0 Introduction 54
5.1 Research questions 54
5.1.1 Reliability of methodology 54
5.1.2 Ankle joint position and MTPJ1 ROM 56
5.1.3 Gender differences in ROM 57
5.1.4 Laterality 58
5.1.5 Foot posture and MTPJ1 ROM 59
5.1.6 Calf MTU stretching and MTPJ1 ROM 60
5.1.7 Limitations and recommendations for further
study 62
CHAPTER SIX
CONCLUSIONS 6.0 Introduction 65
6.1 Conclusions 65
REFERENCES 67
APPENDIX 1
Development of measurement tool: Weight bearing test set up 88
APPENDIX 2 Raw data MTPJ1 Cycles 96
APPENDIX 3 Summary of Analysis of Variance Analyses: MTPJ1 cycles. 99
APPENDIX 4 MTPJ1 ROM test retest raw data 103
APPENDIX 5
MTPJ1 ROM: test retest over one week raw data 104
APPENDIX 6
Information Sheet 105
APPENDIX 7
Consent Form for Participants 107
x
APPENDIX 8
MTPJ1 ROM Data Recording Sheet 109
APPENDIX 9
Foot Posture Index (FPI-6) – Collection Form 110
APPENDIX 10
Ankle joint ROM pilot study: WBLT 111
APPENDIX 11
Stretch instructions and participation diary 116
APPENDIX 12
MTPJ1 ROM Raw Data: (part two) 117
APPENDIX 13
Raw data: Stretch and control cohorts; baseline, re-test (same day) and
retest (one week) 123

xi
LIST OF TABLES TABLE: PAGE
Table 3.1: Least Significance Difference (Scheffé) between the mean
of the groups of cycles 2,3,4; 7,8,9 and 12,13,14. 26
Table 3.2: Intraobserver ICC values,95% Confidence Limits, and
SEM for MTPJ1 motion for each force and ankle position
measured on the same day. 29
Table 3.3: Intraobserver ICC values,95% Confidence Limits, and
SEM for MTPJ1 motion for each force and ankle position
measured across time (one week). 31
Table 4.1: Demographic data including ankle joint range and foot
posture for Part two of the study investigating ankle joint
position and MTPJ1 ROM. 41
Table 4.2: Demographic data foot posture for Part three of the study
investigating calf MTU stretching and MTPJ1 ROM across
ankle joint positions. 41
Table 4.3: Results of paired t-tests comparing left and right feet for
derived variables WBLT and ankle joint position across
loads 10 and 30 Newtons. 42
Table 4.4: Mean, standard deviation (SD), T values, p values, 95%
lower and upper confidence intervals (CI), and mean
difference for dependent variables between male and
female subjects from paired t tests. (21 female – 16 male) 43
Table 4.5: The mean, standard deviation (SD), minimum, maximum
and range of dependent variables for part two of the study
investigating ankle joint position on MTPJ1 ROM. (all
measurements are in degrees). 44
Table 4.6: Paired t-test results between dependant variables; MTPJ1
ROM and ankle joint position and force (Newton’s)
demonstrating a highly significant change in MTPJ1
extension between ankle joint positions. 44

xii
Table 4.7: Mean and standard deviation of ankle joint (WBLT) and
MTPJ1 ROM across ankle joint positions and loads;
according to foot type as determined by the FPI-6. 47
Table 4.8: Paired t-test analyses between foot types (FPI-6) for
derived variables for ankle joint ROM (WBLT) and MTPJ1
ROM. 48
Table 4.9: The mean and standard deviation (SD) of dependent
variables and paired t-tests for the stretch group in part
three of the study investigating the effect of a one minute
calf MTU stretch on MTPJ1 and ankle joint ROM
measured on the same day.(all measures are in degrees) 50
Table 4.10: The mean and standard deviation (SD) of dependent
variables and paired t-tests for the stretch group in part
three of the study investigating the effect of a one minute
calf MTU stretch on MTPJ1 and ankle joint ROM
measured at one week.(all measures are in degrees) 51
Table 4.11: The mean and standard deviation (SD) of dependent
variables and paired t-tests for the control group in part
three of the study investigating the effect of a one minute
calf MTU stretch on MTPJ1 and ankle joint ROM
measured on the same day.(all measures are in degrees) 52
Table 4.12: The mean and standard deviation (SD) of dependent
variables and paired t-tests for the control group in part
three of the study investigating the effect of a one minute
calf MTU stretch on MTPJ1 and ankle joint ROM
measured at one week.(all measures are in degrees) 52
Table 4.13: T values, p values, 95% confidence intervals (CI), and
mean difference for dependent variables; ankle joint
position at 10N, between stretch and control groups at
base line, repeat test (same day) and repeat test (one
week). 53

xiii
Table 4.14: T values, p values, 95% confidence intervals (CI), and
mean difference for dependent variables; ankle joint
position at 30N, between stretch and control groups at
base line, repeat test (same day) and repeat test (one
week). 53
xiv
LIST OF FIGURES FIGURE: PAGE
Figure 1.1: Outline of research steps summarising the development of
research questions, methodology and sections of
investigation. 4
Figure 2.1: Anatomy of the first metatarsophalangeal joint. 8
Figure 2.2: Initiation of the windlass mechanism via tightening of the
plantar aponeurosis accompanied with MTPJ1 extension. 12
Figure 3.1: MTPJ1passive extension using a force transducer
perpendicular to the axis and a potentiometer to
simultaneously record force/angle data. 23
Figure 3.2: Mean and 95% Confidence Intervals for MTPJ1 extension
through 15 cycles for loads 10N and 30N across three
ankle joint positions measured in degrees. 26
Figure 3.3: Mean difference and 95% confidence intervals for cycles
7,8,9. Derived variables 10 and 30N across the three
ankle joint positions. 27
Figure 3.4: Weight Bearing Lunge Test (WBLT) using a digital
inclinometer to measure angle from vertical. 34
Figure 3.5: Design and flow of participation through part III of the
study investigating the effect of calf MTU stretching on
MTPJ1 ROM. 36
Figure 3.6: Static calf MTU stretch. Subjects maintained full knee
extension whilst moving the hips anteriorly until a non
painful stretch was felt. Subjects were instructed to hold
the stretch for 30 seconds. 39
Figure 3.7: Cyclic calf MTU stretch, where subjects lunged their knee
forward and back to resistance. Subjects were instructed
to move at approximately one cycle per second for 30
repetitions. 39
xv
Figure 4.1: Box plot of MTPJ1 extension for ankle joint positions
neutral (AJN); dorsi flexed (AJDF) and plantar flexed
(AJPF) at 10N force (A) and 30N force (B). 45
Figure 4.2: Representation of variables obtained from force-angle
data of a single participant (subject 8). (A) The
displacement (angle) at force 10 and 30 Newtons for each
ankle joint position: AJDF (Ankle joint dorsi flexed); AJN
(Ankle joint neutral); AJPF (Ankle joint plantar flexed) (B)
The MTPJ1 passive stiffness defined as the ratio of
change in force to change in displacement determined
using a linear best fit model. 46
Figure 4.3: Comparison of mean MTPJ1 extension for ankle joint
positions, neutral, dorsi flexed and plantar flexed
(AJN;AJDF; AJPF) at 10 Newton’s (A) and 30 Newton’s
(B) of force by foot type determined by FPI-6. 49

xvi
LIST OF ABBREVIATIONS
AJDF: Ankle joint dorsi flexed
AJN: Ankle joint neutral
AJPF: Ankle joint plantar flexed
BMI: Body mass index
FnHL: Functional hallux limitus
FPI: Foot posture index
HL: Hallux limitus
MTPJ1: First metatarsophalangeal joint
MTU: Musculoskeletal unit
N: Newton
Nm: Newton meter
ROM: Range of motion
WBLT: Weight bearing lunge test

xvii
DEFINITION OF TERMS
‘Body mass index’ (BMI): Refers to the body weight (kg) divided by the square
of the barefoot height (m).
‘Dorsiflexion’: Flexion or bending of the foot or ankle towards the extensor
aspect of the limb in the sagittal plane.(1)
‘First metatarsophalangeal joint’ (MTPJ1): Articulation of the first metatarsal and
proximal phalanx including the sesamoidal complex.(2)
‘Functional hallux limitus’ (FnHL): Refers to a reduced range of motion at the
MTPJ1 during weight bearing with normal range available during non weight
bearing examination.(3)
‘Foot Posture Index’ (FPI-6): A six criterion assessment tool used to quantify
static foot posture in a clinical setting.(4,5)
‘Hallux’: Refers to the big toe as a whole, incorporating the proximal and distal
phalanges.(2)
‘Hallux limitus’ (HL): Refers to a reduced or limited range of motion, particularly
extension, at the MTPJ1 due to progressive joint degeneration.(6)
‘Laterality’: The relationship and preferential use of one side in voluntary motor
acts.(1)
‘Passive range of motion’: Motion occurring around a joint not produced by
active efforts.(1)
‘Plantar flexion’: Flexion or bending of the foot or ankle towards the flexor
aspect of the limb in the sagittal plane.(1)
‘Stiffness’: Term used to describe the deformation of properties under the
influence of external force. (7)

xviii
‘Viscoelastic’: Describes a materials response to stress. If it returns to its
original pre stress geometrical shape it is said to be elastic, if it does not it is
said to be viscous. Tendons for example are sensitive to different strain rates
and our viscoelastic.(8,9)
‘Weight bearing lunge test’ (WBLT): Reliable method of quantifying ankle joint
range of motion particularly Soleus muscle length.(10)
‘Windlass mechanism’: Term used to describe the effect of the plantar fascia
being wound around the MTPJ1 during extension resulting in arch height
increase and inversion of the rear foot.(11)

1
CHAPTER ONE DEVELOPMENT OF THE PROBLEM
1.0 Introduction
First metatarsophalangeal joint (MTPJ1) motion is well recognised in its
importance to normal foot function and weight transference throughout the gait
cycle.(3,12-14) Dysfunction to the mechanics of the MTPJ1 can lead to
pathologies both proximal and distal to the joint.(15-17) Interventions aimed at
improving MTPJ1 function such as manipulation or mobilisation, orthotic therapy
and surgery are common practice, however further investigation is required to
quantify the mechanics of the MTPJ1 to determine clinical outcomes of such
interventions. Measurement of MTPJ1 range is non-standardised and is
reflected in the literature by way of large variances in quoted normal range
values.(18, 19) Few studies report on ankle joint position when measuring MTPJ1
ROM. Also lacking within the literature is information regarding the load
deformation characteristics of the MTPJ1 in normal subjects.
The functional and anatomical association between the calf muscle tendinous
unit (MTU), the plantar aponeurosis and MTPJ1 ROM has been described.(20-27)
To the author’s knowledge, clinical intervention by way of gastrocsoleus
stretching on MTPJ1 function has not been investigated to date. Recognition of
the effect of ankle joint position and calf MTU stiffness on MTPJ1 ROM will
provide further direction to specific clinical interventions and protocols to
enhance joint function.
Chapter One introduces the rationale behind the present investigation,
highlighting the nature of the problem, purposes and significance of the study,
assumptions, limitations, and relevant terminology. The research hypotheses
are outlined and a summary of the chapter is provided.
1.1 Statement of the problem and purpose of the study
Measurement of MTPJ1 ROM is commonly performed by clinicians to
determine pathology as well as to assess interventions. Controversy exists
within the literature as to a standard, reliable and valid method of measuring
MTPJ1 and what a normal value for MTPJ1 ROM should represent. Historically,

2
non weight bearing measures are taken using goniometers, however little
attention has focussed on joint displacement under load or the joint ‘stiffness’.
The viscoelastic nature of the joint means there is an amount of joint creep due
to stretch and relaxation of the soft tissue structures through the load un-load
cycles. To date no study has quantified the preconditioning aspects of the
MTPJ1 in terms of the number of joint displacement cycles required to minimise
this creep effect to produce reliable measures of range of motion.
Understanding joint stiffness may hold greater clinical relevance than actual
peak joint ranges as static measures of joint range are poorly correlated to
dynamic range.(28)
The anatomical and functional relationship between the Achilles tendon, plantar
fascia and first metatarsophalangeal joint has been outlined within the
literature.(21,25,89,90) Similarly the effect of gastrocsoleus stretching and ankle
joint ROM has been extensively investigated. Radford et al (29),in a systematic
review of the effect of gastrocsoleus stretching and ankle joint ROM, reported a
statistical improvement in ROM, however the actual increase in range was
relatively small. The clinical significance of these findings remains unclear. Calf
MTU stretching is a common clinical tool used in such pathologies as plantar
fasciitis and those with Type 2 diabetes where limited joint mobility can lead to
gait changes.(30, 31) Improved clinical outcomes are common, despite a relatively
small increase in ankle joint range produced by stretching. The elastic series
effect of increasing gastrocsoleus muscle length or reducing tendo Achilles
stiffness on MTPJ1 ROM has not been investigated. Such improvements in
ankle ROM may represent a concomitant improvement in MTPJ1 function and
therefore favourable gait changes throughout propulsion.
In light of these problems the present investigation contains four main purposes:
i. To develop a methodology to quantify MTPJ1 passive extension ROM and
investigate the reliability of this method in non weight bearing, using
asymptomatic normal subjects.
ii. To determine the effect of joint creep on MTPJ1 passive extension using
the developed methodology and to quantify the effect of joint conditioning
when measuring MTPJ1 passive extension.
3
iii. To examine the effect of ankle joint position on MTPJ1 passive extension
ROM. Three ankle joint positions will be tested namely; ankle joint plantar
flexion (AJPF), ankle joint dorsi flexion (AJDF) and ankle joint neutral
(AJN). Ankle joint neutral is described as the foot being ninety degrees to
the long axis of the tibia, with AJPF and AJDF measured ten degrees
respectively from this neutral position.
iv. To determine the short and medium term effects of a specific calf MTU
stretch on MTPJ1 passive extension ROM. To satisfy this purpose subjects
without MTPJ1 pathology will be measured before, immediately after a calf
MTU stretch and again after a one week home stretching regime.
1.1.1 Pilot Study: Weight bearing MTPJ1 extension
The preliminary focus for this investigation was to examine the influence of foot
orthoses and their various design parameters on MTPJ1 ROM. To achieve this,
a weight bearing methodology was required. Appendix 1 outlines this initial work
and testing regime for weight bearing measurement of MTPJ1 extension.
Test re-test reliability was performed together with the influence of foot orthoses
on MTPJ1 extension. A large degree of measurement error was noted in the
methodology which deemed it unsuitable for detecting any significant
intervention effect from the influence of foot orthoses.
It was hypothesised that the influence of postural sway, in particular the
recruitment of lower limb muscles had a large impact on the stiffness though the
MTPJ1 during testing. Hallux extension cycles during weight bearing appeared
to shift the body’s centre of mass anteriorly and posteriorly thus muscle
recruitment was necessary for maintenance of equilibrium, however myogenic
activity was not investigated. A degree of within trial and between trial errors
seen in this methodology appeared to be influenced by compensatory postural
muscle activation due to anteroposterior perturbations during testing.(32) This
highlighted the intricate inter relationship between Achilles tendon load and
MTPJ1 extension.

4
This experience formed the basis for the thesis with further work quantifying the
effect of ankle joint position, or tendo Achilles load, and MTPJ1 extension,
together with the subsequent effect of interventions used to reduce tendo
Achilles and calf MTU stiffness, on MTPJ1 extension ROM. Figure 1.1 outlines
the progression of the research towards answering the specific research
questions.
Figure 1.1: Outline of research steps summarising the development of research questions, methodology and sections of investigation.
Non weight bearing assessment of MTPJ1 extension: Reliability testing. • Influence of joint conditioning • Same day reliability • Reliability over time
Non weight bearing MTPJ1 ROM and the effects of ankle joint position in healthy asymptomatic adults. [N=73 feet]
The immediate and longer term effects of calf MTU stretching on ankle joint and MTPJ1 ROM, in healthy asymptomatic adults.
Case control study design [N=11 feet]
Weight bearing assessment of MTPJ1 ROM and the effects of foot orthoses design parameters on joint extensibility.
• development of technique • calibration of instrumentation • customisation of computer software
Technique deemed unreliable due to muscle
activation throughout perbutations.

5
1.2 Significance of study
It is hoped the findings of this study will contribute to a greater understanding of
MTPJ1 function and its inter relationship with ankle joint position and tendo
Achilles loading. The presented results of MTPJ1 ROM demonstrate greater
validity as the methodology presented incorporates known values of joint pre
conditioning as well as exact moments acting across the joint, something
lacking in previous studies. The clinical intervention of calf MTU stretching,
which is commonly advocated in many clinical presentations, has been shown
to improve ankle joint range. Whilst these values appear clinically small,
changes to MTPJ1 extension may provide insight into improved clinical
outcomes, potentially due to gait improvements throughout propulsion.
A number of assumptions were made within this study. Firstly the study
assumes that there is a direct inter relationship between tendo Achilles load and
passive MTPJ1 ROM. Additionally, whilst efforts were made to produce true
passive movements no control for intra subject muscle influences were made.
1.3 Research questions
Results of pilot work and review of the literature resulted in the following
research questions to be investigated:
i. Is the developed methodology for measuring MTPJ1 ROM and stiffness
reliable compared to established clinical protocols?
ii. How many joint pre-conditioning trials are required to provide stable
measures of MTPJ1 extension?
iii. Does ankle joint position significantly affect MTPJ1 passive extension and
stiffness in asymptomatic normal subjects?
iv. Are there gender differences with MTPJ1 ROM or stiffness in
asymptomatic normal subjects?
v. Are there symmetrical or limb dominance differences with MTPJ1 ROM or
stiffness in asymptomatic normal subjects?
vi. Does foot posture influence MTPJ1 ROM?
vii. Does static and cyclic calf MTU stretches improve MTPJ1 range of motion
and stiffness in asymptomatic normal subjects?

6
1.4 Summary
The purpose of this investigation was to provide information on the effects of
ankle joint position and MTPJ1 passive extension in the population studied,
together with the effects of short term musculotendinous stretching to putatively
improve MTPJ1 range. The above research questions will be answered using
the developed methodology which incorporates simultaneous angle and force
data as the MTPJ1 is passively extended across three ankle joint positions. The
findings of this thesis will be discussed in relation to information concerning the
clinical influence of calf MTU load and MTPJ1 function. Limitations and
recommendations for further work will also be presented.
7
CHAPTER TWO REVIEW OF THE LITERATURE
2.0 Introduction
The following chapter provides a synopsis of the relevant literature, searched
through data bases such as PubMed and Google scholar up until July 2008,
which relates to the first metatarsophalangeal joint and areas pertinent to the
present investigation. Anatomy of the MTPJ1 is presented together with
descriptions of normal and abnormal function. Methodologies used to quantify
MTPJ1 ROM are outlined as well as a description of assessment tools
described in the literature to quantify foot shapes and postures. Pathologies
affecting MTPJ1 ROM both intrinsically and extrinsically are discussed as they
relate to this investigation. Secondly the inter relationship between the calf
MTU, plantar aponeurosis and MTPJ1 function is presented. Finally, review of
the phenomenon of laterality and its relevance to the present investigation is
outlined. Gender differences in joint extensibility are also discussed as are the
effects of stretching on the mechanical properties of the musculotendinous unit
and joint range of motion.
2.1 First Metatarsophalangeal Joint Anatomy
The first metatarsophalangeal joint consists of the articulations of the head of
the first metatarsal and the proximal phalanx of the hallux. The sesamoidal
complex, made up of two sesamoid bones, is located in grooves beneath the
plantar aspect of the first metatarsal head. They assist in the movement of the
joint by allowing the metatarsal head to glide posteriorly during plantar flexion.
MTPJ1 is a synovial, modified hinge joint with primarily sagittal plane motion
available i.e. plantar flexion and dorsi flexion. Small amounts of motion are seen
in the transverse plane (adduction and adduction) with no normal available
motion seen in the frontal plane (inversion and eversion).(12)
Fig 2.1 illustrates the complex array of ligamentous structures supporting the
first metatarsophalangeal joint. This includes on the medial aspect of the joint
the tibial collateral, tibial sesamoid and plantar tibial sesamoid ligaments. These
intra-articular ligaments are mirrored on the lateral side by the fibular collateral,
fibular sesamoid and plantar fibular sesamoidal ligaments. Supporting these

8
structures are an intersesamoidal ligament, the joint capsule and the deep
plantar transverse ligaments.(2)
Soft tissue structures surrounding the joint include the extensor hallucis longus
tendon located dorso lateral to the midline of the joint, the extensor hallucis
brevis lateral to this tendon and a small tendinous slip from extensor hallucis
longus medially, referred to as extensor hallucis capsularis. Located plantar to
the MTPJ1 is the tendon of flexor hallucis longus, which courses between the
sesamoid bones to insert into the plantar aspect of the distal phalanx. The
tendon of flexor hallucis brevis muscle connects plantarly into the sesamoid
bones and becomes continuous with the plantar sesamoidal ligaments to insert
into the plantar aspect of the proximal phalanx of the hallux. The intrinsic
musculature includes the abductor hallucis and adductor hallucis muscles,
which respectively approach medially and laterally to the joint attaching into the
medial and lateral sesamoid bones.(2) The plantar aponeurosis lies superficial to
the muscles of the plantar foot, with the distal slip blending with the flexor
hallucis and brevis tendons, terminating at the distal and proximal hallux
phalanx respectively.
Figure 2.1: Anatomy of the first metatarsophalangeal joint (Adapted from Hetherington, 1994) (33)

9
2.2 First Metatarsophalangeal ROM
Motion of MTPJ1 has been extensively investigated using both live subjects and
cadaver specimens. Studies have examined MTPJ1 function both statically and
dynamically as well as during passive and active motion. Various techniques
reported include weight bearing and non weight bearing protocols and there are
marked differences in terms of equipment sophistications. Due to variations in
quantifying MTPJ1 motion there is a reciprocal variation in reported normal
ranges of joint motion.(18,34) These differences are further extended by a lack of
agreement within the literature as to reference or starting positions to measure
angulations. For example, using the plantar plane of the foot as opposed to the
toe referenced to the shaft of the first metatarsal will produce lower figures,
given the declination of the first metatarsal.(34,35)
It is generally accepted that for normal walking around 60-75 degrees of hallux
extension is required at the terminal propulsive phase of gait.(12,35) However
others have noted less MTPJ1 extension is required during gait in normal
subjects.(28,36,37) Reports within the literature for clinical dorsiflexion range of
motion values for the MTPJ1 vary between 65 and 110 degrees.(18,34,35,38,39)
Non weight bearing techniques have been shown to demonstrate good
reliability however these may lack clinical relevance.(40) Measuring the dynamic
range of motion of MTPJ1 is technically more difficult and has limitations within
a clinical setting.
Traditionally a standard goniometer is used to quantify MTPJ1 ROM. The
reliability of measuring MTPJ1 ROM using a goniometer has shown moderate
to high intra-rater reliability.(35,41,42) Buell et al (34) in a radiographic study
compared clinical measures to lateral radiographs for MTPJ1 ROM in twenty
feet and report a good correlation between goniometer measurements and
radiographic angles for MTPJ1 ROM. However their methodology for clinical
evaluation of joint range relied on skin markings and assisted dorsiflexion did
not control for ankle joint positioning or torque applied across the joint.
Fluoroscopy has been used to determine range of motion dynamically however
this is limited by ignoring out of plane motion and malalignment of anatomical
segments that can cause distortion of angular data.(43,44)
10
Umberger et al (45) developed a reliable and valid method of measuring three-
dimensional motion of MTPJ1 dynamically. Nawoczenski et al (28) used an
electromagnetic goniometer which demonstrated a strong correlation between
static active range of motion to that of dynamic range.
The methodologies used to quantify static MTPJ1 range of motion have often
ignored the effect or otherwise of force and velocity used during testing. These
aspects potentially have a large influence on joint range due to the viscoelastic
nature of the biological tissues being tested. Few studies have described or
measured the effect of joint creep, symmetry, laterality or the concept of
circadian variation. Measuring the force required to move a joint through its
range appears more clinically relevant than end range or peak joint angles as
studies demonstrate less than peak values are needed for normal gait.(28, 36, 37)
Joint stiffness, describing angular resistance to an external force, has had little
attention paid to it with regards to MTPJ1 mechanics. Paton (46) attempted to
estimate the moment applied to the hallux during weight bearing extension by
comparing the force used during testing against a spring balance. Given the
known distance of the applied force to the determined joint axis an estimated
dorsiflexion moment of 1.76Nm was established. Unfortunately the amount of
force necessary to dorsi flex the hallux during weight bearing incrementally
increases with angular change and it is unclear whether this moment value is at
the initiation of hallux extension or at peak ROM. Birke et al (17) investigated the
torque range of motion and stiffness of MTPJ1 in diabetics and non diabetics.
Using an electro goniometer, strain gauge and microcomputer they were able to
develop a stress strain curve for normal subjects and for those with hallux and
plantar ulceration. Measurements were taken at an angle corresponding to a
particular force demonstrating a reduction in range of motion between those
with hallux ulceration versus normal subjects. Goldsmith et al (47) measured
force versus displacement of the first metatarsophalangeal joint and ankle joint
in controls and diabetics subjects and found a statistically non significant trend
towards an increase in flexibility following a home-based stretching programme.
Perez et al (48) used a three dimensional tracking system to measure angle
along with a pulley system tensioned at 40 Newtons of force to measure MTPJ1
dorsiflexion range in cadaver specimens to assess the effect of hallux motion
following first tarsometatarsal arthrodesis. The system controlled for physiologic

11
axial load through the tibia to simulate weight bearing as well as extrinsic
tendon loads. Whilst the methodology appears useful the clinical relevance of
their results should be viewed cautiously as only five specimens were tested.
2.3 Plantar Fascia and Windlass Mechanics.
The plantar fascia or aponeurosis is a deep fibrous layer on the sole of the foot
attached proximally, primarily at the medial calcaneal tubercle and extending
distally to attach to the bases of the phalanges, especially the hallux. Its
function is to attenuate shock and retain elastic energy through its viscoelastic
properties as well as provide structural support to the medial column of the foot,
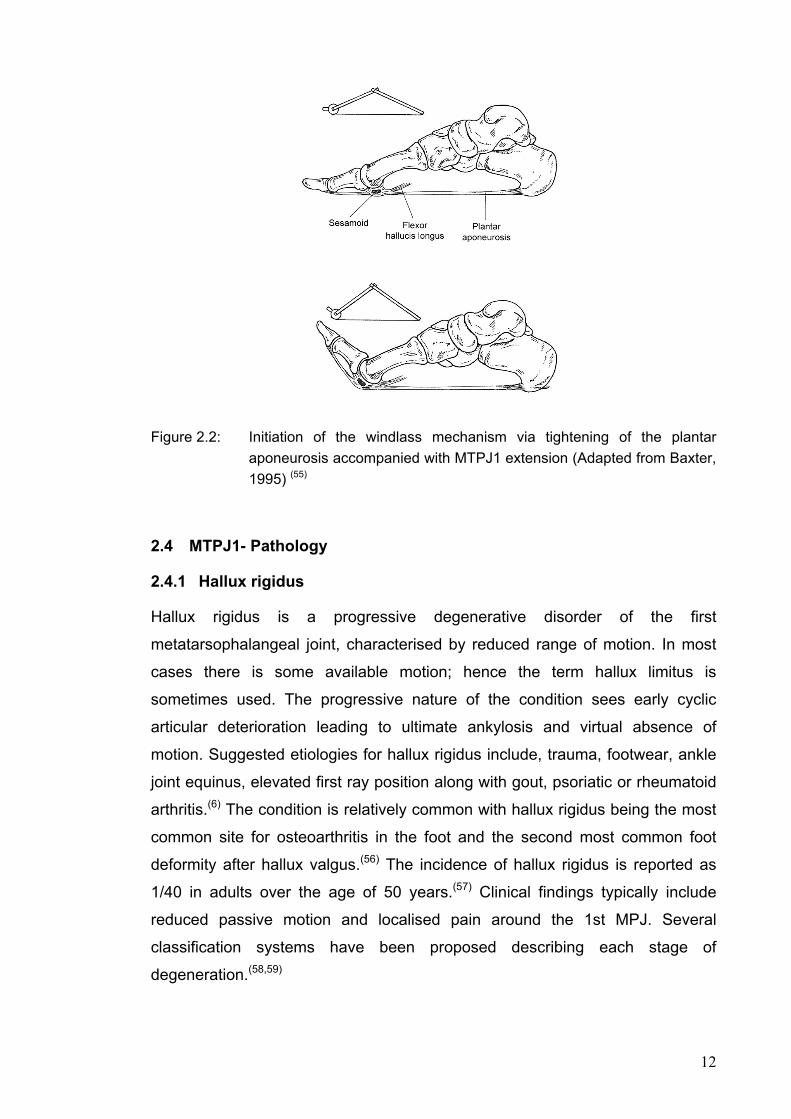
particularly during mid stance and propulsion phases of gait.(49-51) With heel rise
the first metatarsophalangeal joint is extended resulting in the distal plantar
fascia being wound around the metatarsal head, in effect shortening the
distance between the hallux and the heel due to the medial longitudinal arch
rising. The term ‘windlass mechanism’ describes this phenomenon. It provides
support to the foot by creating a supination moment across the sub talar joint
and externally rotating the lower leg. This supportive mechanism is crucial
during the propulsive phase of gait and for normal function.
Disruptions to normal windlass mechanics have been described. Medial
longitudinal arch collapse, early heel rise as well as knee and lower back
pathologies have been associated with dysfunctional windlass mechanics. (13,16)
MTPJ1 motion appears critical for normal windlass mechanics and
abnormalities to the plantar fascia are said to impede MTPJ1 range of motion.
Thickening of the proximal plantar fascia has been demonstrated in diabetic feet
and appears associated with reduced MTPJ1 ROM and increased plantar
pressures throughout gait.(31,52,53) Allen and Gross (54) compared hallux
extension and muscle strength in normal subjects and those presenting with
plantar fasciitis. They found a significant decrease in flexor muscle strength,
however no significant difference in MTPJ1 extension. Their methodology used
a semi weight bearing technique and did not control for the amount of force
used to measure the MTPJ1 ROM.
12
Figure 2.2: Initiation of the windlass mechanism via tightening of the plantar
aponeurosis accompanied with MTPJ1 extension (Adapted from Baxter, 1995) (55)
2.4 MTPJ1- Pathology
2.4.1 Hallux rigidus
Hallux rigidus is a progressive degenerative disorder of the first
metatarsophalangeal joint, characterised by reduced range of motion. In most
cases there is some available motion; hence the term hallux limitus is
sometimes used. The progressive nature of the condition sees early cyclic
articular deterioration leading to ultimate ankylosis and virtual absence of
motion. Suggested etiologies for hallux rigidus include, trauma, footwear, ankle
joint equinus, elevated first ray position along with gout, psoriatic or rheumatoid
arthritis.(6) The condition is relatively common with hallux rigidus being the most
common site for osteoarthritis in the foot and the second most common foot
deformity after hallux valgus.(56) The incidence of hallux rigidus is reported as
1/40 in adults over the age of 50 years.(57) Clinical findings typically include
reduced passive motion and localised pain around the 1st MPJ. Several
classification systems have been proposed describing each stage of
degeneration.(58,59)
13
2.4.2 Functional hallux limitus
The term functional hallux limitus describes the situation where there is a
reduced range of hallux extension during weight bearing, particularly terminal
stance phase of gait, whereas normal available range is present in non-weight
bearing examination.(3,16) Little or no structural joint degeneration is evident.
Normal MTPJ1 ROM is critical during the propulsive phase of gait when the
body’s centre of mass is moving forward. Restriction in this normal motion can
lead to compensations to proximal foot and lower limb joints, namely midtarsal
joint pronation.(13,60) Shoe and orthoses with specific design parameters have
been used in the management of functional hallux limitus.(14,61,62)
2.4.3 Plantar Fasciitis
Plantar fasciitis is a common cause of foot pain and discomfort with estimates of
the condition affecting around ten percent of the United States population over
the course of a lifetime.(67) It is described as a degenerative, inflammatory
process primarily affecting the proximal attachment of the plantar
aponeurosis.(54,63-67) Others however consider the condition to be non-
inflammatory but more degenerative in nature with histological findings lacking
inflammatory cells.(68,69) Typical clinical presentation includes pain palpable over
the plantar medial tubercle extending through the medial longitudinal arch, heel
pain on first rising and often post static dyskinesia.
Multifactorial in nature, it is believed to be due to excessive strain of the plantar
fascia during heel rise and propulsive phase of gait. It appears more prevalent
in females than males and is correlated to restricted ankle joint range of motion
and increased body weight.(67)
Disruptions to the plantar fascia are easily demonstrated by high resolution
ultrasound imaging, with thickening of the proximal plantar fascia considered
diagnostic. Normal plantar fascia thickness is reported as ranging between 2.0-
5.9mm, with fasciitis cases ranging from 3.9 - 9.1mm in thickness.(64,70,71)
An array of management strategies are presented within the literature including;
rest, anti-inflammatory modalities, stretching of the plantar fascia and
gastrocsoleus complex, footwear modification, orthoses to control foot

14
mechanics particularly compressive and tensile loads, extracorporeal shock
wave therapy and surgical trans-section in recalcitrant cases.(63,67)
2.4.4 Diabetes Mellitus and Limited Joint Mobility
Diabetes mellitus is a progressive endocrine disorder which is common in
western societies and impacts enormously both economically and individually.
Foot complications, such as ulceration and amputation, associated with
diabetes are a significant factor to this burden. There are several ways diabetes
affects the foot and lower limb including changes to vascular supply and
disruption to peripheral nerve function. Also recognized within the literature are
the changes to soft tissues and the subsequent effects to joint mobility.(72)
Many studies have demonstrated that diabetics have limited joint mobility when
compared to controls.(73-77) It is postulated that this phenomenon is a result of
nonenzymatic glycosolation of collagen from chronic hyperglycemia, the result
being stiffening of joint ligaments and surrounding structures.(78-80)
Investigation of diabetic and non diabetics populations have demonstrated
thickening of both the plantar aponeurosis and Tendo Achilles.(31,52,81,82) It is
thought that this thickening of the plantar aponeurosis would concomitantly
result in contracture which in turn may lead to an accentuated arch height via
the windlass mechanism and lead to a more rigid foot. The literature
demonstrates a significant reduction in ankle joint range of motion and MTPJ1
range of motion in diabetic subjects due to increased stiffness of these
structures.(31,73,83) Limited joint mobility and subsequent gait changes evident in
this population can relate to higher magnitudes of plantar pressures which can
be independent of body weight.(53)
Turner et al (84) compared passive ROM with dynamic motion of the ankle and
MTPJ1 and demonstrated an increase in joint stiffness in diabetics with passive
motion however no significant differences in ROM were seen during dynamic
testing. It is hypothesized that diabetics adopt varying gait strategies to
modulate their forward progression such as shortening their stride length.(30)
These changes pose a significant risk factor for foot ulceration. Diabetics with
restricted MTPJ1 ROM have been shown to be more likely to suffer a
15
breakdown on the hallux, most likely due to disruption of normal weight
transference throughout propulsion and a subsequent increase in plantar
vertical and shear stress.(17,53,74,79,84-86)
Intervention to reduce the stiffness of the ankle and MTPJ1 seems prudent in
reducing plantar pressures and improving gait. Goldsmith et al (47) ,by way of a
one month unsupervised home stretching protocol demonstrated a reduction in
peak plantar pressures in diabetic subjects compared with non diabetics.
Interestingly this trend was greater in the dominant limb as compared to the non
dominant limb. Garcia and Lund (87) describe the use of a motorised phlebo-
pump, which passively dorsi flexes the ankle thirty times per minute via motor
driven paddles. In a series of case studies it was suggested daily use of this
device to dorsi flex the ankle improved perfusion to the leg and foot thus
improving healing times for diabetic ulcers. The authors’ failed to report the
effects of this cyclic mobilization on the ankle joint and tendo Achilles stiffness
or on subsequent gait and loading patterns, as this may have also contributed
to improved tissue healing conditions. Vascular improvement via active and
passive mobilization of the MTPJ1 have also been reported by Elsner (88), who
describe a ‘toe-ankle pump’ for venous blood flow via the close anatomical
relationship between the MTPJ1 joint capsule and venous system. A significant
increase in venous flow was reported following five minutes of active movement
of the MTPJ1, which may also have clinical relevance in diabetic populations
with limitations to MTPJ1 range.
2.5 Ankle Joint Position and MTPJ1.
Ankle joint position has been shown to affect MTPJ1 mechanics. Anatomically
the gastrocsoleus muscle complex and tendo Achilles demonstrate connectivity
to the plantar fascia. Using cadaver models and 3D reconstruction, Milz, et al (25) demonstrated via histological sections of the Achilles tendon that as the
Achilles tendon is loaded, forces are directed towards the plantar fascia via
highly orientated trabeculae in the calcaneum. Snow et al (89) similarly using
cadaver specimens described connectivity between the tendo Achilles and
plantar fascia in neonatal, adult and foetal feet with the continuation of fibres
diminishing with age to superficial periosteal fibres from tendon to fascia.
Sarrafian (20) demonstrated that as the tibia is flexed forward over the ankle joint

16
the plantar aponeurosis is loaded resulting in MTPJ1 ROM limitation. Similarly
Carlson et al (21) measured an incremental increase in plantar fascial strain with
increased tendo Achilles load and increased MTPJ1 extension in cadaver
specimens using an extensometer. Regression analyses revealed a greater
strain on the plantar fascia with toe extension than increased tendo Achilles
load.
Cheung et al (90), describe the influence of tendo Achilles load on plantar fascia
tension using finite element analyses. The results demonstrate that as tendo
Achilles load is increased greater force is transferred through the plantar fascia,
with almost a third of this transmitted through the first ray. Erdemir et al (23)
,using a cadaver model also described a positive correlation between plantar
fascial tension and Achilles tendon load in simulated stance phase of gait.
Demonstrated in these studies was a distal shift in ground reaction force as
Achilles load was increased as well as a reduction in arch height of the foot,
similar to the results described by Thordarson et al (91). Deformation of the arch
height results in increased plantar fascia tension, as seen in normal weight
bearing. However Cheung et al (90) report a two times greater straining effect on
the plantar fascia than bodyweight alone. So whilst arch deformation increases
plantar fascia tension, the load through the tendo Achilles appears to be of
greater influence. This is supported by Flanigan et al (92), who reported a
significant increase in stretch through the plantar fascia with ankle joint
dorsiflexion in non weight bearing cadaver specimens.
Despite the fact that ankle joint position influences plantar fascial stiffness, it is
surprising that several studies measuring MTPJ1 ROM do not report or control
for ankle joint position.(12,19,34,41,42)
Ankle joint and muscle stiffness has been shown to influence first ray (1st
metatarsal-cuneiform joint) function. Johnson and Christensen (24) ,described
increased Achilles loads on first ray function in cadaver specimens and reported
decreased peroneus longus muscle activity and greater medial column
collapse. MTPJ1 extension has also been shown to be limited if the first
metatarsal is dorsi flexed, due to increased tensile stress on the plantar
fascia.(19)

17
With medial longitudinal arch collapse, an increase in dorsiflexion moment
acting on the first metatarsal is seen due to higher ground reaction forces during
stance. This causes blocking of the MTPJ1, so therefore foot postures,
particularly pes planus or a valgus heel position, appear to negatively influence
MTPJ1 ROM.(93) The association between pes planus and restricted MTPJ1
extension is further demonstrated in subjects with Rheumatoid arthritis where
disruption to the flexor hallucis longus tendon is present.(94) Grebing and
Coughlin (95) also report on the effect of ankle joint position and first ray mobility
and demonstrated a decrease in mobility with ankle joint dorsiflexion.
The effect of ankle joint position and MTPJ1 mechanics is yet to be quantified
and seems important to determine so that clinical and research protocols can
be established. Subtle changes to the osseous alignment and viscoelastic
series of the lower leg and foot is likely to significantly influence MTPJ1
mechanics and hence the influence of calf MTU stretching requires further
investigation.
2.6 Effects of Muscle Stretching
Limitations to joint range of motions impacts negatively on the efficiency of body
movements. The passive extensibility of muscle is integral to joint range of
motion and joint stability. Muscle stretching has been investigated extensively to
assist clinicians make decisions about the effectiveness of such intervention on
pain relief, function and injury risk. Variables most often investigated include
passive extensibility, passive stiffness, muscle power output and joint range of
motion / muscle length. There remains some confusion as to the exact effects of
short and long term muscle stretching and the mechanisms behind myogenic
changes, nor is there an agreed protocol for length of stretching regimes for
clinical and research scenarios.(96)
Duration of stretch is a key area of investigation. The stress relaxation of a
muscle appears relatively rapid with almost half of the stretch effect returned to
baseline after two minutes.(97) Others report muscle stiffness returning to
baseline after one hour.(98) However increases in joint range of motion have
been detected following individual stretching programs spanning several
weeks.(99-101) It has been hypothesised that stretching over longer periods
18
changes the ‘stretch tolerance’ rather than other passive properties and
viscoelasticity of muscle.(98) This seems to result from either an analgesic effect
of stretching or from increases in muscle strength over time due to a muscle
hypertrophy.
In a literature review of the effects of stretching Shrier (96),found that a single
static stretch of 15–30 seconds duration was sufficient for most people to
increase joint range of motion. Longer hold times may produce greater gains (102) with the most important myogenic changes found early in the stretch
cycle.(103,104)
Controversy exists regarding the effectiveness of muscle stretching and injury
prevention. Restriction in ankle joint motion has been suggested to increase the
incidence of injury (63,105,106) and systematic review of the literature found a small
but statistically significant increase in ankle joint range of motion with
stretching.(29) Other studies suggest the use of stretching has no role in
decreasing the risk of injury (107,108) and indeed can cause detrimental effects to
performance, particularly muscle power output.(109,110)
Recent studies have described the benefits of a tissue specific stretch for
plantar fasciitis and has shown this technique to be superior to traditional calf
stretching in terms of pain and function associated with chronic heel pain.(111,112)
The technique involves the ankle and metatarsophalangeal joints being dorsi
flexed for thirty seconds. Cadaver testing has confirmed that greater stretch to
the plantar fascia is achieved with ankle joint dorsiflexion and MTPJ1
extension.(92)
There are several stretching techniques described in the literature and include
static weight bearing and non weight bearing, ballistic stretches and PNF
stretches.(113) Differences in the viscoelastic response and properties of muscle
tendinous units have been demonstrated between static and cyclic
stretches.(114-116) Investigation into the elastic properties of the calf muscle
tendon unit revealed both ballistic and static stretches result in increased range
of motion. However static stretches seem to reduce muscle passive resistive
torque whilst ballistic stretches appear to reduce tendo Achilles stiffness.(114)
Herbert et al(117) described changes to muscle and tendon length during passive

19
ankle joint dorsiflexion, attributing 27% of the overall length change to changes
in muscle length with the majority of extensibility due to the Achilles tendon or
other structures.
There also appears to be a strong gender relationship with muscle extensibility
and joint ranges of motion, particularly in the lower limb. Investigations into knee
and ankle range of motion and flexor muscle stiffness have suggested male
muscle shows greater resistance to length changes which therefore may
contribute to greater joint stability.(118-120) It remains unclear whether males
respond more favourably to stretching than females.
2.7 Symmetry and Laterality
Few studies have reported on symmetry and laterality of foot joint motions.
Studies involving the foot are often encouraged to test one side under the
assumption that symmetry exists, simplifying data collection. It has been
suggested that choosing to include both left and right side measurements may
inadvertently improve sample power and hence reduce statistical integrity.(121)
Whilst others argue relevant clinical information such as laterality could be lost
without testing both limbs.(122,123)
Debate remains as to the prevalence of asymmetry during gait and whether or
not such asymmetry can be attributed to laterality.(124) Maupas et al (125)
demonstrated asymmetric knee joint movement in normal subjects using
electrogoniometry, however laterality was found to be independent of the
asymmetry. Sadeghi (126),who investigated symmetry of gait in twenty healthy
males, suggested that global gait symmetry exists during gait when looking at
left and right sagittal plane movements of the entire lower limb. However local
asymmetry existed between segments of the lower limb according to specific
functional tasks or stage of gait. The suggestion made was that these local
asymmetries are compensatory in nature to produce an overall global
symmetry.
Symmetry and laterality behaviour of MTPJ1 during passive non-weight bearing
extension is yet to be defined in healthy adults.

20
2.8 Assessment of foot type
Foot morphology has often been associated with musculoskeletal injury.(127)
Overuse injuries have been reported in supinated (128,129) and pronated (130,131)
feet and often ortho mechanical intervention such as foot orthoses are
prescribed.(132) Other prospective studies have found no association between
foot morphology, static measures and increased injury risk.(133) It is
hypothesised that different foot types will behave differently to ortho mechanical
intervention, for example foot orthoses or taping, hence investigating the effects
of such intervention requires classification of foot types.(134) Categorisation of
the foot for research purposes is fundamentally difficult as the foot is a complex
multi-segmented body part.
Traditionally foot ink prints have been used to characterise the foot and medial
longitudinal arch across the pronation to supination continuum. The Chippaux-
Smirak and Staheli Arch Index are two such examples. Both require large
changes in foot posture to produce changes in the index scores, questioning
their validity.(135) Recent work by Urry and Wearing (136) has shown the use of
force plates to determine foot morphology to be less accurate than ink foot
impressions. These measures used to determine foot posture do not meet
acceptable validity and reliability rigour. Skin movement artefact and goniometer
measurement error are typically cited as contributing large sources or error
when catergorising foot types.(137)
The Foot Posture Index (FPI-6) developed by Redmond (138) is an observation
tool to quantify foot posture variation. It has the distinct advantage of not relying
on two dimensional measurements or the validity of the sub talar neutral
position. The FPI-6 allows clinicians to quantify foot posture in a relaxed stance
position without manipulation of the foot whilst being able to distinguish multi-
segment and multi-planar positions of the foot. The FPI-6 replaced the FPI-8
which had eight individual criteria. During validity testing it was shown that two
of the original eight criteria were problematic, thus the instrument was modified
to comprise six criteria measured on a five point scale (-2 to +2). These include:
1) talar head palpation, 2) supra and infra malleolar curves, 3) inversion and
eversion of the calcaneus, 4) talonavicular prominence, 5) congruence of the
medial longitudinal arch, and 6) abduction and adduction of the forefoot on the

21
rear foot. (5,139) Reliability testing has been described for both the original FP1-8
and FPI-6 instruments with high intra-rater reliability values reported; ICC’s 0.72
and 0.86 by Evans et al (140) and greater than 0.90 by Cornwall et al (4). Inter
rater reliability however is reported as being moderate with ICC values ranging
between 0.52 and 0.65.(4,140)
Classifying foot types will provide important information to the proposed thesis.
Patterns of MTPJ1 motion as they relate to foot morphology can be examined.
The FPI-6 is a valid, clinically useful tool to classify foot postures along the
pronation–supination continuum.
2.9 Summary
The literature reviewed has described normal and abnormal function of the
MTPJ1 and the relationship to the gait cycle, together with associated
pathologies.
Highlighted within the literature is a lack of standardised methodology to
quantify MTPJ1 ROM both clinically and in research settings. This lack of
agreement with measuring MTPJ1 ROM accounts for the wide variance in
reported normal range values described. The importance of a known force
being applied to the hallux during testing and the influence of ankle joint position
to quantify MTPJ1 ROM has been largely ignored.
The presented literature supports the functional and anatomical interaction
between the calf MTU and MTPJ1 ROM via the plantar aponeurosis. Stretching
protocols have been described with most demonstrating a small increase in
ankle joint ROM. Various stretch techniques, such as static and cyclic, are also
described and it appears that each may have an influence on the elastic series
of the lower limb.
The influence of ankle joint position on MTPJ1 ROM and the magnitude of
change remain unclear. Similarly the effect of commonly utilised calf MTU
stretching on MTPJ1 mechanics is yet to be reported.

22
CHAPTER THREE METHODOLOGY
3.0 Introduction
The purpose of this study was to investigate the resistance properties of the
MTPJ1 and the influence of ankle joint position and calf MTU extensibility in
asymptomatic normal subjects. This chapter provides detailed description of the
methodologies used to answer the proposed research questions. Reference is
made to pilot work which was used to develop the methodology, particularly the
reliability of the testing regime. A summary of the study design, subject
demographics and recruitment protocols are described. A thorough description
of the procedures used throughout the study is given together with an outline of
data collection and analyses.
3.1 Pilot Studies
Pilot work investigated the suitability of using a weight bearing set up to
measure passive MTPJ1 extensibility (Appendix 1). The influence of postural
sway was evident which resulted in the large variations of the data for MTPJ1
extension. Whilst the ICC3, 1 was acceptable, 0.81, the typical error in degrees
was 6.9 when testing five asymptomatic adult subjects. The initial aim of
developing this weight bearing methodology was to test the influence of foot
orthoses and different design parameters on MTPJ1 extension. Initial trials
revealed the ‘effect’ size was close to the measurement error and significant
‘noise’ in the measurement set up was evident. This work lead to the question
of examining ankle joint position and more particular the effects of tendo
Achilles load on MTPJ1 passive extension. To explore this further a non weight
bearing methodology was devised and tested.
3.2 Non-weight bearing Instrument methodology
The non weight bearing test procedure required subjects to lie supine with full
knee extension on a height adjustable motorised clinical plinth. The subject’s
test foot was then placed into position onto a custom built device (Fig 3.1). The
wooden rig consisted of several parts including a base plate 50cm by 40 cm, an
internal section consisting of two vertical arms, a cross plate connecting the two
arms and another connecting plate with a hinged extension measuring 5cm

23
across and 7cm long located in the middle of this plate. The hinged extension
had a small piece attached perpendicular to it so the force transducer could
maintain the force perpendicular to the hinge and therefore orthogonal to the
joint axis throughout testing. The distance from the hinge was 7cm which
represented the known lever arm so torque values (Nm) could be calculated.
The hinged plate cross section was able to be moved up and down along the
length of the upright vertical arms to accommodate various foot sizes and these
arms were able to be moved and locked by metal pins at ten degree intervals
either side of vertical to accommodate various ankle joint positions.
Attached internally to the hinge was a metal extension running laterally which
was connected to a custom built battery operated (9V) potentiometer. Prior to
testing each subject a calibration was performed with voltage recorded at 0 and
45 degrees as measured from a standard goniometer.
Figure 3.1: MTPJ1passive extension using a force transducer perpendicular to the axis and a potentiometer to simultaneously record force/angle data.

24
During testing the MTPJ1 axis was visually aligned with the hinged platform.
The test foot was then strapped into position with Velcro® fasteners across the
distal lower leg.
Subjects were instructed to relax whilst a hand held force transducer (McMesin®
AGF), moved the MTPJ1 through its range of extension motion and back to the
starting position. The transducer was held perpendicular to the hinged platform
with the guidance of the backing plate. Simultaneous force and angle data was
collected via the electrical potentiometer and force transducer sampling at
100Hz. Both instruments were connected to a portable laptop computer via a
data acquisition board (National Instruments® BNC 2110) and DAQ Card
(National Instruments® -6024E). Samples were then transferred to Labview®
software (v.7) with raw data passed through a fourth order Butterworth low pass
filter.
Each toe was moved through its extension range of motion fifteen times across
three ankle joint positions, namely; ankle joint neutral (vertical), ankle joint
plantar flexion (10 degrees) and ankle joint dorsiflexion (10 degrees). Full knee
extension was maintained throughout testing. A Latin Least Squares method
was adopted to ensure the order of testing ankle joint position was randomly
assigned for each participant, which was repeated for both feet.
A series of three experiments followed to refine the testing and determine the
suitability of this methodology to quantify MTPJ1 extension across ankle joint
positions and to assess the influence of stretching on joint motion.
Part One: Instrument development
3.3 Series I: Number of joint cycles
3.3.1 Description
The aim of the first series of testing was to determine the appropriate number of
joint excursions necessary to produce stable values for MTPJ1 extension range.
The viscoelastic nature of joints and surrounding structures means one can
expect a degree of ‘conditioning’ the joint must go through before values
stabilise. To date this has not been quantified for the MTPJ1. Further to this a
degree of familiarisation would be expected with subjects being tested and

25
hence this test series allowed testing protocol refinement. Unnecessary data
analyses and handling would be significantly reduced by exploring the
conditioning characteristics of MTPJ1 extension load un-load cycles.
3.3.2 Sample
Six consenting asymptomatic adults were recruited from the private practice of
the investigator for this initial series of testing. The sample included five females
and one male with an average age of 34 years (range 22-47 years). All subjects
were screened for pathology or significant medical history that would deem
them unsuitable for the study in accordance to inclusion and exclusion criteria
as outlined in section 3.7.1 and 3.7.2.
3.3.3 Data
Angle data were calibrated using a standard goniometer to the voltage across
0-45 degrees. Test data for force and angle was reduced using a custom
designed computer program within Labview® software (v.7). From there the
data were transferred to another custom designed spreadsheet (Microsoft
Excel®) where instantaneous force and angle data were represented at 0.5
degree intervals.
Raw data for this initial series is presented in Appendix 2. Further analysis was
performed using Statview® (SAS Institute Inc) statistical software. A repeated
ANOVA was performed and post-hoc comparisons (Scheffé analysis) for
clusters determined between joint cycles. Comparisons were made between the
means of joint clusters between cycles 2,3,4 and 7,8,9 and 12,13,14 that is, the
middle three cycles of each block of five joint extensions.
3.3.4 Derived Variables
Both feet of each subject were tested using the technique described in 3.2. The
MTPJ1 was moved through extension fifteen times across the three ankle joint
positions. The derived variables chosen for further analyses were joint angle at
10 and 30N of force for each ankle joint position and cycle.

26
3.3.5 Results
The ANOVA assessment for load un-load characteristics of the MTPJ1 across
fifteen cycles is presented in Appendix 3. Figure 3.2 and Table 3.1 illustrate the
significant increase in the means of cycles 2,3,4 compared with cycles 7,8,9 as
well as between cycles 2,3,4 and cycles 12,13,14. The results further
demonstrate that there was no significant difference between cycles 7,8,9 and
12,13,14. The results support the hypothesis that there is a degree of joint
conditioning and familiarisation within the testing process and that this variation
is mostly taken up within the first six joint cycles.
Figure 3.2: Mean and 95% Confidence Intervals for MTPJ1 extension through
15 cycles for loads 10N and 30N across three ankle joint positions measured in
degrees.
Table 3.1: Least Significance Difference (Scheffé) between the mean of the groups of cycles 2,3,4; 7,8,9 and 12,13,14.
Cycles (Mean) Mean Diff Crit. Diff p Value Ave[2,3,4] [7,8,9] -2.164 0.834 <.0001
Ave [2,3,4] [12,13,14] -2.525 0.834 <.0001
Ave [7,8,9] [12,13,14] -0.361 0.834 0.5641
p<0.05
-10
0
10
20
30
40
50
60
70
T1 T2 T3 T4 T5 T6 T7 T8 T9 T10 T11 T12 T13 T14 T15
PF, 30NPF, 10Nneutral, 30Nneutral, 10NDF, 30NDF, 10N

27
Examination of the ANOVA for clusters table (Appendix 3) suggests a
significant difference between cycle clusters and ankle position p=0.0031. A
further two way ANOVA was performed to investigate the real difference. This
again demonstrated no significant differences between cycles 7,8,9 and
12,13,14.
Further analysis of the cycles 7,8,9 were performed via a three way ANOVA
(ankle position, load and cycles). The results show there was no systematic
difference between cycles 7,8,9. p=0.9. See Figure 3.3.
The typical error was also determined for cycles 7,8,9 and was found to be 2.3
degrees, which represents the largest variation between these three cycles.
Figure 3.3: Mean difference and 95% confidence intervals for cycles 7,8,9. Derived variables 10 and 30N across the three ankle joint positions. The 95% Confidence Intervals reach 0 and therefore no systematic difference is evident.
3.3.6 Summary
This part of the project successfully determined the number of cycles required
during testing to confidently produce stable results. A minimum of ten cycles
were required with derived variables taken from the mean of cycles 7,8,9 for
further analysis.
-5 -4 -3 -2 -1 0 1 2 3 4
Diff T7-9
PF, 30NPF, 10Nneutral, 30Nneutral, 10NDF, 30NDF, 10N

28
3.4 Series II- Test re-test reliability (same day)
3.4.1 Description
The second series of preliminary testing was aimed at determining the same
day reliability of measuring MTPJ1 extension using the method previously
described. It was important to determine the repeatability of the measurement
technique, particularly aspects such as the visual alignment of the joint axis and
positioning of the foot. The following series outlines the design and investigative
methodology.
Subjects were tested as previously described in 3.2 and following this initial test
were then removed from the device and plinth. Subjects were then immediately
returned to the plinth, with both feet individually realigned for repeat testing.
Testing sequence for both feet followed a randomised Latin least square
method with the same testing sequence applied for re testing.
3.4.2 Sample
Six asymptomatic adults were recruited from the private practice of the
investigator for this series of testing. The sample included five females and one
male with an average age of 33 years, [range 20 - 47 years]. All subjects were
screened for pathology or significant medical history that would deem them
unsuitable for the study in accordance to inclusion and exclusion criteria as
outlined in section 3.7.1 and 3.7.2.
3.4.3 Data
Data was collected and reduced as described in 3.3.3. Raw data is presented in
Appendix 4. Further analyses were performed using Intraclass Correlation
Coefficients; model 3,1,(141) Standard Error Means (SEM) and 95% Confidence
Limits.
3.4.4 Derived variables
There were a total of six derived variables which included MTPJ1 angle at 10N
and 30N of force for each ankle joint position, namely ankle joint neutral, plantar
flexed and dorsi flexed, with the mean of cycles 7,8,9 used for further analyses.

30
3.5.2 Sample
Six asymptomatic adults were recruited from the private practice of the
investigator for this series of testing. The sample included five females and one
male with an average age of 41 years, [range 22 – 55 years]. All subjects were
screened for pathology or significant medical history that would deem them
unsuitable for the study in accordance to inclusion and exclusion criteria as
outlined in section 3.7.1 and 3.7.2.
3.5.3 Data
Data collection and reduction was performed as described in 3.3.3. Raw data is
presented in Appendix 5. Further analyses were performed using Intraclass
Correlation Coefficients; model 3,1, Standard Error Means (SEM) and 95%
Confidence Limits.
3.5.4 Derived variables
There were a total of six derived variables which included MTPJ1 angle at 10
and 30N of force for each ankle joint position, namely ankle joint neutral, plantar
flexed and dorsi flexed, with the mean of cycles 7,8,9 used for further analyses.
3.5.5 Results
Table 3.3 demonstrates the ICC 3, 1, SEM and 95 % Confidence Limits for the
test re-test reliability across one week. Reliability was good to high (ICC 3,1 0.76-
0.98) for all but one derived variable. Reliability for variable dorsiflexion at 10N
was poor (ICC 3,1 0.23). This is most likely due to the low actual values obtained
from this measure. The instrumentation used to detect change was arguably not
sensitive enough to detect change across time for variable AJDF10N, with
several subjects yielding no angular change at 10N force. Hence a small
between subject variance compared to a proportionately large ‘total variance’
resulted in a low ICC statistic.

29
3.4.5 Results
Table 3.2 demonstrates the ICC 3, 1, SEM and 95 % Confidence Limits for all six
derived variables for the same day test re-test reliability. Intra-class correlation
co-efficient values were high across all derived variables for the test re-test set
up. (>0.89). SEM’s were less than 2.7 degrees across all derived variables.
Table 3.2: Intraobserver ICC values,95% Confidence Limits, and SEM for MTPJ1 motion for each force and ankle position measured on the same day.
Variable ICC3,1 Lower Limit Upper Limit
SEM (degrees)
AJDF 10N 0.89 0.708 0.963 1.08 AJN 10N 0.95 0.864 0.984 2.60 AJPF 10N 0.98 0.953 0.995 1.66 AJDF 30N 0.97 0.917 0.99 1.51 AJN 30 N 0.98 0.926 0.991 2.58 AJPF 30N 0.99 0.981 0.998 1.18
AJDF: ankle joint dorsi flexed; AJN: ankle joint neutral; AJPF: ankle joint plantar flexed;
ICC: Intra-class correlation co-efficient model 3, 1; SEM: standard error mean
3.4.6 Summary
Same day test re-test reliability for measuring MTPJ1 extension was acceptably
high across all derived variables within the sample tested.
3.5 Series III- Test retest reliability (one week)
3.5.1 Description
The final series in the preliminary testing of the methodology was to determine
the reliability of measuring MTPJ1 extension over time. That is; could one
expect to yield similar joint displacement values over time thus rendering the
equipment and technique suitable to further assess interventions across time?
Subjects were tested on both feet as described in 3.2 with measurements
repeated after seven days. Testing sequence for both feet followed a
randomised Latin least square method with the same testing sequence re
applied after one week.

31
Table 3.3: Intraobserver ICC values,95% Confidence Limits, and SEM for MTPJ1 motion for each force and ankle position measured across time (one week).
Variable ICC3,1 Lower limit Upper limit SEM (degrees)
AJDF 10N 0.23 -0.300 0.657 0.97 AJN 10N 0.92 0.772 0.972 3.52 AJPF 10 N 0.93 0.814 0.977 5.08
AJDF 30N 0.76 0.421 0.913 3.64 AJN 30N 0.98 0.939 0.993 3.03 AJPF 30N 0.97 0.917 0.990 3.71
AJDF: ankle joint dorsi flexed; AJN: ankle joint neutral; AJPF: ankle joint plantar flexed;
ICC: Intraclass correlation co-efficient model 3, 1; SEM: standard error mean
3.5.6 Summary
Test re-test reliability across one week was acceptably high for five of the
derived variables. Variable, ankle joint dorsiflexion at 10N of force was
unreliable and hence these results should be viewed with caution. The actual
degree changes are small due to the low forces and higher stiffness of the
elastic series of the lower leg.
Part Two: Normal series
3.6 Study design and subjects
A prospective observational study design was used to determine the influence
of ankle joint position on MTPJ1 extension, as well as to assess the influence of
gender and laterality and foot posture in a normal asymptomatic population.
Demographic characteristics of the sample were collected including age,
gender, height, weight and body mass index (BMI), along with self determined
limb dominance indicated by the preferred kicking limb.
3.6.1 Recruitment
Convenience sampling was used to obtain subjects for this study. Subjects
were recruited from the author’s private podiatry clinics in the Perth metropolitan
area as well as students within the Podiatric Medicine Unit and Centre for
Musculoskeletal Studies, University of Western Australia. All subjects
underwent a screening process performed by the author to determine eligibility

32
for the study based on inclusion and exclusion criteria. Subjects were provided
with an information sheet (Appendix 6) and were required to complete a
consent form (Appendix 7), enabling participation in the study.
3.7 Data collection procedures
3.7.1 Inclusion criteria
Subjects were required to meet the following criteria:
• Have read and understood the information sheet
• Have read, understood and completed informed consent document
• Have reached skeletal maturity and be a minimum age of 18 years and less
than 60 years.
3.7.2 Exclusion criteria
Subjects were excluded from the study if they
• Have a history of lower limb surgery, trauma, gait abnormalities, neurological
disorders that directly affect the lower limb or any systemic disease such as
sero-negative or sero-positive pathology.
• Have a clinical diagnosis of Hallux Limitus/Rigidus or Functional Hallux
Limitus.
• Have a medical diagnosis of hyper mobility joint syndromes such as Ehlers
Danlos or Marfan’s syndrome
3.7.3 Ethical Considerations
The study was subjected and granted ethics approval by the Human Research
Ethics Committee of the University of Western Australia. All participating
subjects were required to read understand and sign a freedom of consent form
prior to entering the study (Appendix 6). This document along with the subject
information sheet (Appendix 7) outlined the purpose of the study, associated
know risks and addressed confidentiality issues. No invasive procedures were
performed on subjects.
Confidentiality of subjects was maintained by using alphanumerical coding,
known only to the author and primary supervisor. Individual data collection
forms were used throughout data collection with an appropriate alphanumerical

33
code applied. All data was saved, using Microsoft Excel® spreadsheets to the
author’s computer hard drive with password protection.
3.7.4 Data collection
All data was collected by the author, and systematically recorded according to
the procedures outlined below. Subjects were asked to volunteer for the study
following an introduction regarding the subject matter and procedures to be
undertaken. Subjects were issued with information and consent documentation.
Refusal without prejudice was highlighted and opportunity was given for further
information regarding procedures and purpose of study.
Individual participants were tested on one occasion. Following signing of the
consent form, subjects were screened to ensure they satisfied the inclusion
criteria. Demographic data was also collected at this time. All data handling was
performed by the author. This included completing the subject data collection
form (Appendix 8), reducing derived variables from computer programs and
saving collated data to Microsoft Excel® spreadsheets. Random cross checking
of raw data to spreadsheet entries was performed to identify any processing
errors. Outlier values of greater than two standard deviations of the respective
mean values were similarly checked.
3.7.5 Procedures
3.7.5.1 Foot Posture Index (FPI-6)
Each subject was assessed by the author to determine their foot posture of both
feet via the FPI-6.(5) Subjects were asked to stand, unshod, in their self
determined relaxed stance position with their head facing forward whilst
focussing on a random object during the assessment. A visual assessment of
foot posture was made by the investigator with data collected on the FPI-6 data
collection sheet (Appendix 9).
3.7.5.2 Ankle Joint Range of Motion
Ankle joint range of motion was quantified using the Weight Bearing Lunge Test
(WBLT).(10) A pilot study was performed to determine the intra-rater reliability,
comparing two methods of quantifying the WBLT. (Appendix 10) A same day
test re-test study design was used to compare two landmarks measuring angle
from the vertical during a WBLT. Ten asymptomatic subjects were tested using
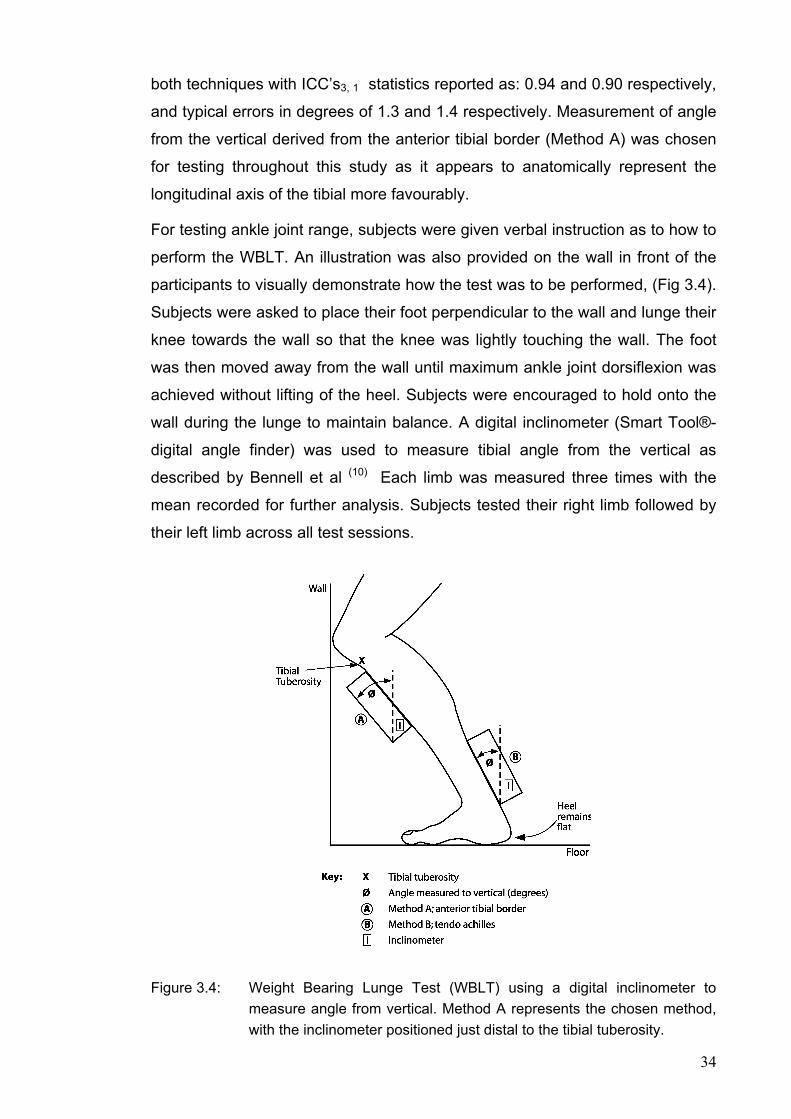
34
both techniques with ICC’s3, 1 statistics reported as: 0.94 and 0.90 respectively,
and typical errors in degrees of 1.3 and 1.4 respectively. Measurement of angle
from the vertical derived from the anterior tibial border (Method A) was chosen
for testing throughout this study as it appears to anatomically represent the
longitudinal axis of the tibial more favourably.
For testing ankle joint range, subjects were given verbal instruction as to how to
perform the WBLT. An illustration was also provided on the wall in front of the
participants to visually demonstrate how the test was to be performed, (Fig 3.4).
Subjects were asked to place their foot perpendicular to the wall and lunge their
knee towards the wall so that the knee was lightly touching the wall. The foot
was then moved away from the wall until maximum ankle joint dorsiflexion was
achieved without lifting of the heel. Subjects were encouraged to hold onto the
wall during the lunge to maintain balance. A digital inclinometer (Smart Tool®-
digital angle finder) was used to measure tibial angle from the vertical as
described by Bennell et al (10) Each limb was measured three times with the
mean recorded for further analysis. Subjects tested their right limb followed by
their left limb across all test sessions.
Figure 3.4: Weight Bearing Lunge Test (WBLT) using a digital inclinometer to measure angle from vertical. Method A represents the chosen method, with the inclinometer positioned just distal to the tibial tuberosity.

35
3.7.5.3 MTPJ1 ROM
First metatarsophalangeal joint extension was performed using the method
described previously in 3.2. Each foot of the participant was measured and a
randomised Latin Least square ordering sequence was used for ankle joint
position which was replicated for both feet. Prior to testing of each participant
calibration of the instrumentation was performed with potentiometer voltage
determined for angles 0 and 45 degrees as determined by a standard
goniometer.
3.7.5.4 Data processing
Data was processed using Labview® software (v.7) sampling at 100Hz with raw
data filtered using a fourth order Butterworth low pass.
Data was then transferred to a custom computer spreadsheet (Microsoft Excel®)
where values were taken for force versus angle series across all derived
variables. Derived variables for cycles 7, 8 and 9 were recorded. The mean of
cycles 7, 8, 9 was used for further analyses as determined by previous reliability
work outlined in section 3.3.
3.7.5.5 Analysis of Data
All data was recorded on computer spreadsheets (Microsoft Excel®) and then
transferred to a statistical software package (Statview®, SAS Institute Inc) for
further analyses. For the purpose of data analysis the mean of MTPJ1
extension cycles 7, 8 and 9 were used. In all tests of statistical significance an
alpha level of p<0.05 was adopted.
Data analysis was undertaken using number of feet rather than number of
subjects. This direction was chosen namely to avoid excluding any possibly
symmetrical anomalies as well as not introducing potential bias by averaging
the sum of left and right feet. It is however noted that pooling the left and right
feet may increase the risk of both Type I and Type II statistical errors by
essentially doubling the sample size. Statistical significance is more likely to be
reached due to increased sample size as the confidence limits become smaller. (121, 122)

36
Part Three: Stretching series
3.8 Study design and subjects
A prospective observational case control study design was used to determine
the influence of calf MTU stretching on ankle joint range of dorsiflexion and
MTPJ1 extension. Both short term effects and those over time were
investigated. Demographic characteristics of the sample were collected
including age, gender, height, weight and body mass index (BMI).
Fig 3.5 provides a flow chart of the study design where participants in this study
were randomly assigned a control leg with the contralateral leg being the test
leg. This was subjected to stretch conditions as described below. Measures of
ankle joint range and MTPJ1 extension were made prior to stretch and
immediately after with the test repeated following a one week home stretching
program.
Figure 3.5: Design and flow of participation through part III of the study investigating the effect of calf MTU stretching on MTPJ1 ROM. Subjects randomly assigned a control and test leg. Both feet and ankles tested for ROM [WBLT and MTPJ1] at baseline and repeated after experimental limb stretch. WBLT and MTPJ1 ROM for both limbs re-tested following a one week calf MTU stretching program on the experimental limb only.
Repeat measures of ankle (WBLT) and MTPJ1 ROM
Repeat Measures of ankle joint (WBLT) and MTPJ1 ROM
No stretch
Calf MTU stretch twice daily
No stretch
Subjects assessed for eligibility (n=11) 22 limbs.
Ineligible (1 limb)
Ankle joint (WBLT) and MTPJ1 ROM measured. Randomised (n=21 lower limbs)
Experimental Group (Stretch) Control Group (No stretch) (n=11) (n=10)
Week
0
1

37
3.8.1 Recruitment
Convenience sampling was used to obtain volunteer subjects for this study.
Subjects were invited to participate from a student cohort within the Centre for
Musculoskeletal Studies; University of Western Australia. All subjects
underwent a screening process performed by the author to determine eligibility
for the study based on inclusion and exclusion criteria. Subjects were provided
with an information sheet (Appendix 6) and were required to complete a
consent form (Appendix 7), enabling participation in the study.
3.9 Data collection procedures
Data collection procedures followed those described in section 3.4.4. Data was
recorded on a specifically designed collection form. (Appendix 8)
3.9.1 Inclusion criteria
The inclusion criteria for this study were common to those outlined in section
3.7.1.
3.9.2 Exclusion criteria
The exclusion criteria for this study were common to those outlined in section
3.7.2.
3.9.3 Ethical Considerations
The ethical considerations have been described in section 3.7.3. All
participating subjects were required to read understand and sign a consent form
prior to entering the study (Appendix 6) An information sheet (Appendix 7)
outlined the purpose of this study together with associated know risks and
addressed confidentiality issues.
3.9.4 Data collection
Data collection procedures followed that as described in section 3.7.5.4.
38
3.9.5 Procedures
3.9.5.1 Foot Posture Index
Subjects underwent assessment of foot posture via the Foot Posture Index-6 as
described in section 3.7.5.1.
3.9.5.2 Ankle Joint Range of Motion
Subjects were required to perform a WBLT on both legs as described in section
3.7.5.2.
3.9.5.3 MTPJ1
MTPJ1 extension was performed using the method described previously in 3.2.
Each foot of the participant was measured and a randomised Latin Least
square ordering sequence was used for ankle joint position, replicated for both
feet. Prior to testing each participant, calibration of the instrumentation was
performed with potentiometer voltage determined for angles 0 and 45 degrees
measured against a standard goniometer.
3.9.5.4 Calf muscle stretching
Subjects participating in the stretching part of the investigation were instructed
to perform a specific calf muscle stretch. Based on previous literature a
combined cyclic and static stretch design was derived whereby the subjects
wedged their randomly assigned foot against a wall or door frame keeping the
knee fully extended. The hips were then moved anteriorly and held until a firm;
non painful stretch was felt in the calf muscle, (Fig 3.6).
Subjects were instructed to hold this stretch for 30 seconds. This was followed
by 30 seconds of steady rhythmic lunges, which involved the same foot
maintaining the stretch position while subjects gently bended the knee towards
the wall to resistance and re straightening in a cyclic fashion with one flex /
extend cycle occurring approximately every second, i.e. 30 up and downs, (Fig
3.7).
Measurement of ankle joint range, via the weight bearing lunge test and passive
MTPJ1 extension, was performed pre stretch and immediately after the stretch

39
on both limbs with the contralateral limb acting as a control. Subjects were also
asked to perform this stretch twice daily for one week where MTPJ1 extension
and ankle joint range was re tested. A participation diary including instructions
regarding stretch protocol was issued for completion during the week to assess
compliance (Appendix 11).
Figure 3.6: Static calf MTU stretch. Subjects maintained full knee extension whilst moving the hips anteriorly until a non painful stretch was felt. Subjects were instructed to hold the stretch for 30 seconds.
Figure 3.7: Cyclic calf MTU stretch, where subjects lunged their knee forward and back to resistance. Subjects were instructed to move at approximately one cycle per second for 30 repetitions.

40
CHAPTER FOUR RESULTS
4.0 Introduction
This study investigated the influence of ankle joint position on MTPJ1 ROM in
an asymptomatic normal population. The association between ankle joint
position and MTPJ1 ROM was further assessed by investigating the effects of
calf muscle stretching on hallux extension properties, immediately and after a
one week home stretching program. Six dependent variables were assessed,
namely; AJN, AJPF and AJDF for both 10N and 30N of force. This section
provides a summary of the results obtained from statistical analyses.
Demographic data pertinent to both study groups are presented together with
descriptive data for each dependant variable. Results of analyses are presented
regarding differences in laterality, gender and foot posture across all dependent
variables. Group differences for the stretch control cohorts are also presented
following analyses.
4.1 Demographics
Demographic data of the sample population for parts two and three of the study
are presented in Table 4.1 and 4.2. Raw data sets are presented in Appendix
12 and 13. Descriptive statistics for each dependent variable for part two of the
study are presented in Table 4.3. Figure 4.1 and Figure 4.2 represents
differences in MTPJ1 ROM based on ankle joint position.
The investigation into the influence of ankle joint position on MTPJ1 ROM
consisted of 37 subjects (73 feet) who satisfied inclusion criteria. Throughout
the study one foot did not meet inclusion criteria. The stretching section of the
study consisted of 11 subjects (11 feet for the stretch group and 10 feet for the
control group).

41
Table 4.1: Demographic data including ankle joint range and foot posture for Part two of the study investigating ankle joint position and MTPJ1 ROM.
N No. of feet (L/R)
Gender M,F
Age (yrs) (SD)
[Range]
BMI (SD)
WBLT (degrees) L/R (SD)
FPI-6 L/R (SD)
37
73
(37/36)
16,21
28 (10)
[18-55]
22.5
(2.7)
46.7/ 45.8
(7.4)/(7.1)
3.05/3.69
(3.26)/(3.49)
N: number of subjects; No: number of feet; L: left, R: right; M: male, F: female; WBLT: weight
bearing lunge test; FPI-6: foot posture index.
Table 4.2: Demographic data foot posture for Part three of the study investigating calf MTU stretching and MTPJ1 ROM across ankle joint positions.
N No. of feet (S / C)
Gender M,F
Age (yrs) (SD)
[Range]
BMI (SD) FPI-6 L,R (SD)
11 21 (11 / 10)
7/4 29 (3.5) [26-36]
22.8 (2.7) 2.12 2.73 (2.88) (3.19)
N: number of subjects; No: number of feet; S: stretch group, C: control group; L: left, R: right
M: male, F: female; FPI-6: foot posture index.
4.2 Normality
The entire sample of 37 participants (73 feet) were assessed for normality
across dependent variables WBLT, ankle joint positions dorsi flexed, neutral
and plantar flexed for loads 10 and 30 Newton’s. Histograms were produced for
each dependent variable for assessment of normality [via skewness and
kurtosis]. All variables were deemed normally distributed with variable AJDF at
10 Newton’s of force demonstrating a negative skew.
4.3 Laterality
Table 4.3 demonstrates comparisons between left and right feet for all
dependent variables. The right foot demonstrated a significant increase in
MTPJ1 range for dependant variables AJDF10N (t= -2.789 p=0.008), AJN30N
(t= -2.711 p=0.01), AJDF30N (t=-3.066 p=0.004) and AJPF30N (t= -2.695
p=0.01) for the 37 subjects tested.
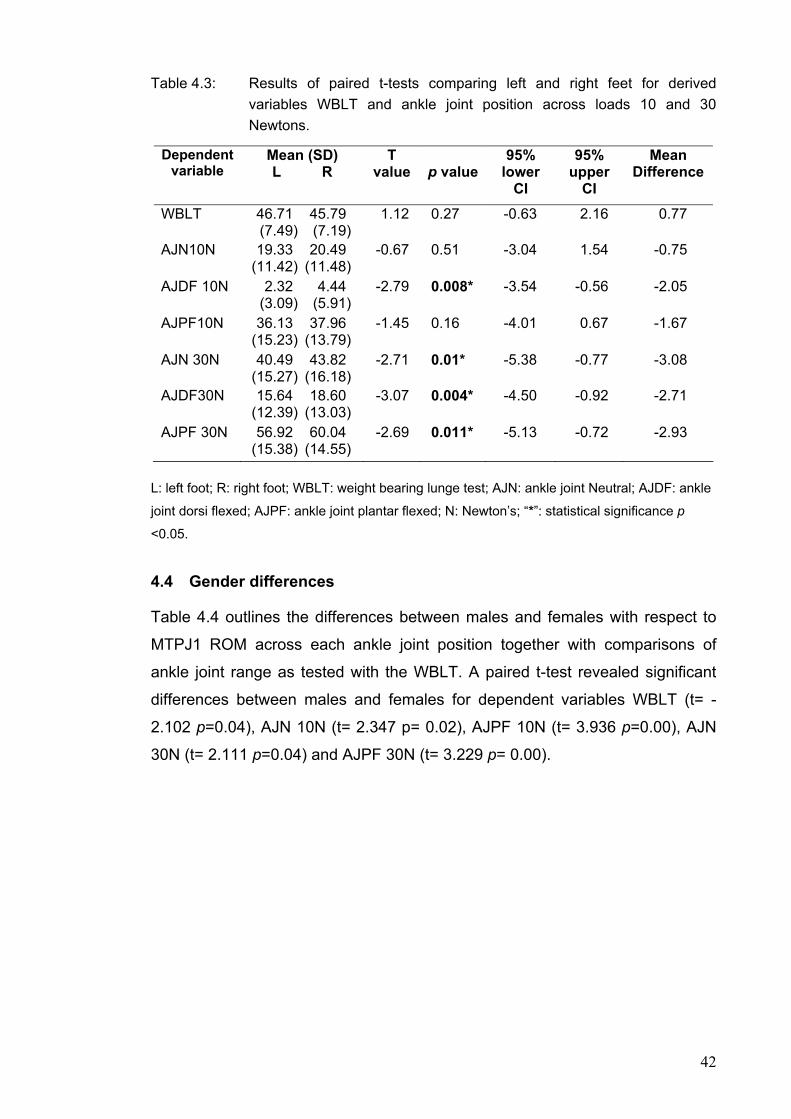
42
Table 4.3: Results of paired t-tests comparing left and right feet for derived variables WBLT and ankle joint position across loads 10 and 30 Newtons.
Dependent variable
Mean (SD) L R
T value
p value
95% lower
CI
95% upper
CI
Mean Difference
WBLT
46.71 45.79 (7.49) (7.19)
1.12 0.27 -0.63 2.16 0.77
AJN10N
19.33 20.49 (11.42) (11.48)
-0.67 0.51 -3.04 1.54 -0.75
AJDF 10N
2.32 4.44 (3.09) (5.91)
-2.79 0.008* -3.54 -0.56 -2.05
AJPF10N
36.13 37.96 (15.23) (13.79)
-1.45 0.16 -4.01 0.67 -1.67
AJN 30N
40.49 43.82 (15.27) (16.18)
-2.71 0.01* -5.38 -0.77 -3.08
AJDF30N
15.64 18.60 (12.39) (13.03)
-3.07 0.004* -4.50 -0.92 -2.71
AJPF 30N
56.92 60.04 (15.38) (14.55)
-2.69 0.011* -5.13 -0.72 -2.93
L: left foot; R: right foot; WBLT: weight bearing lunge test; AJN: ankle joint Neutral; AJDF: ankle
joint dorsi flexed; AJPF: ankle joint plantar flexed; N: Newton’s; “*”: statistical significance p
<0.05.
4.4 Gender differences
Table 4.4 outlines the differences between males and females with respect to
MTPJ1 ROM across each ankle joint position together with comparisons of
ankle joint range as tested with the WBLT. A paired t-test revealed significant
differences between males and females for dependent variables WBLT (t= -
2.102 p=0.04), AJN 10N (t= 2.347 p= 0.02), AJPF 10N (t= 3.936 p=0.00), AJN
30N (t= 2.111 p=0.04) and AJPF 30N (t= 3.229 p= 0.00).

43
Table 4.4: Mean, standard deviation (SD), T values, p values, 95% lower and upper confidence intervals (CI), and mean difference for dependent variables between male and female subjects from paired t tests. (21 female : 16 male)
Dependent variable
Mean (SD) M F
T value
p value
95% lower
CI
95% upper
CI
Mean Difference
WBLT
47.79 45.13 (5.03) (8.46)
-2.102 0.044* -6.71 -0.10 -3.40
AJN10N
15.8 22.9 (10.46) (11.2)
2.347 0.026* 0.94 13.61 7.28
AJDF 10N
2.71 3.86 (4.4) (5.04)
0.828 0.41 -1.56 3.68 1.06
AJPF10N
29.81 42.72 (13.15) (13.28)
3.936 0.001* 7.17 22.65 14.91
AJN 30N
36.53 46.26 (17.25) (13.12)
2.111 0.043* 0.29 17.38 8.84
AJDF30N
14.27 19.19 (11.38) (13.35)
0.901 0.37 -3.59 9.27 2.84
AJPF 30N
51.13 63.88 (16.91) (10.61)
3.229 0.003* 4.75 21.09 12.92
M: male; F: female; WBLT: weight bearing lunge test; AJN: ankle joint Neutral; AJDF: ankle joint
dorsi flexed; AJPF: ankle joint plantar flexed; N: Newton’s; “*”: statistical significance p <0.05.
4.5 Ankle joint position and MTPJ1 ROM
Table 4.5 outlines the mean, standard deviation and range for derived variables;
ankle joint range (WBLT), and MTPJ1 extension for force 10 and 30 Newton’s
across ankle joint positions, neutral, dorsi flexed and plantar flexed. Table 4.6
demonstrates comparisons between ankle joint position and MTPJ1 extension
for force 10 and 30 Newton’s. Paired t-tests reveal a significant difference in
MTPJ1 extension according to ankle joint position (p<0.0001). Figure 4.1
graphically represents the differences in MTPJ1 extension according to ankle
joint position. A significant reduction in MTPJ1 extension is evident as the ankle
joint position moves from plantar flexion through neutral to dorsiflexion for both
10 and 30 Newton’s of force. Figure 4.3 represents a force displacement curve
from a single subject as well as the stiffness curve with stiffness defined as the
ratio of change in force to change in displacement determined using a linear
best fit model. The force displacement curve demonstrates a right shift with
ankle joint positions neutral and plantar flexed highlighting the increased MTPJ1
ROM, whilst the stiffness curves demonstrates a more linear shape with ankle
joint dorsi flexed in keeping with greater stiffness and reduced ROM.

44
Table 4.5: The mean, standard deviation (SD), minimum, maximum and range of dependent variables for part two of the study investigating ankle joint position on MTPJ1 ROM. (measurements in degrees).
Dependent Variable Mean (SD) Min-Max [Range]
WBLT 46.26 (7.28) 22.90 – 62.30 [39.40]
AJN 10N 19.88 (11.38) 0.00 - 45.70 [45.70]
AJDF 10N 3.36 (4.78) 0.00 - 20.50 [20.50]
AJPF10N 37.03 (14.47) 4.00 - 72.20 [68.20]
AJN 30N 42.13 (15.71) 1.83 - 79.83 [78.00]
AJDF30N 17.10 (12.71) 0.00 - 53.33 [53.33]
AJPF 30N 58.46 (14.96) 17.33 - 79.67 [62.34]
Min: minimum; Max: maximum; WBLT: weight bearing lunge test; AJN, ankle joint neutral;
AJDF, ankle joint dorsi flexed; AJPF ankle joint plantar flexed; N, Newton’s (number of subjects
= 37, number of feet = 73, 37 left and 36 right)
Table 4.6: Paired t-test results between dependant variables; MTPJ1 ROM and ankle joint position and force (Newton’s) demonstrating a highly significant change in MTPJ1 extension between ankle joint positions.
Dependant
Variable T value p value 95% CI
(lower) 95% CI (upper)
Mean Difference
10 N
AJN & AJDF 15.09 <0.0001* 14.34 18.70 16.52AJN & AJPF -17.51 <0.0001* -19.10 -15.19 -17.14AJDF & AJPF -21.99 <0.0001* -36.72 -30.61 -33.6630 N AJN & AJDF 22.25 <0.0001* 22.78 27.27 25.03AJN & AJPF -19.39 <0.0001* -18.01 -14.65 -16.33AJDF & AJPF -28.18 <0.0001* -44.28 -38.43 -41.35
AJN: ankle joint neutral; AJDF: ankle joint dorsi flexed; AJPF: ankle joint plantar flexed; N:
Newton’s; CI: confidence intervals; “*”: statistical significance p <0.05.

45
-10
0
10
20
30
40
50
60
70
80
AJN10N AJDF10N AJPF10N
-10
0
10
20
30
40
50
60
70
80
90
AJN30N AJDF30N AJPF30N
Figure 4.1: Box plot of MTPJ1 extension for ankle joint positions neutral (AJN); dorsi flexed (AJDF) and plantar flexed (AJPF) at 10N force (A) and 30N force (B).
A
B

46
Angle (degrees)
AJPFAJNAJDF
Angle (degrees)
AJPFAJNAJDF
Figure 4.2: Representation of variables obtained from force-angle data of a single participant (subject 8). (A) The displacement (angle) at force 10 and 30 Newtons for each ankle joint position: AJDF (Ankle joint dorsi flexed); AJN (Ankle joint neutral); AJPF (Ankle joint plantar flexed) (B) The MTPJ1 passive stiffness defined as the ratio of change in force to change in displacement determined using a linear best fit model.
4.6 Foot posture
Analysis of the sample group (73 feet) was made based on foot posture
presentation. The FPI-6 instrument was used to determine foot type for each
subject. These were further catergorised into supinated (FPI-6 < 0), normal
(FPI-6 0- 5) and pronated (FPI-6 >6) feet. Table 4.7 outlines the mean and
standard deviation for MTPJ1 ROM across each foot type, ankle joint position
and MTPJ1 load. Table 4.8 describes the statistical comparison, via paired t-
tests of foot types and MTPJ1 ROM across all derived variables. Figure 4.3
represents graphically MTPJ1 extension for each foot type across loads 10 and
A
B
Forc
e (N
) 10
30
Forc
e (N
)

47
30 Newton’s of force. Significant differences were found between supinated and
neutral feet for derived variables AJPF 10N (t=-2.55, p=0.05); AJN 30N (t=-2.86,
p=0.04); AJDF30N (t=-1.23, p=0.03) and AJPF 30N (t= -3.53, p=0.02). A
significant difference was also found between neutral and pronated feet for
AJPF 10 N (t=2.70, p=0.01).
Table 4.7: Mean and standard deviation of ankle joint (WBLT) and MTPJ1 ROM across ankle joint positions and loads; according to foot type as determined by the FPI-6.
Foot Type (FPI-6)* Supinated Neutral Pronated
No of Feet (M,F) 6 (2,2) 50 (9,14) 17 (6,4)
WBLT 36.11 (11.13) 47.19 (6.37) 47.09 (5.81)
AJN 10N 14.06 (4.60) 20.98 (11.70) 18.72 (11.82)
AJDF 10N 0.11(0.20) 3.65 (4.82) 3.67 (5.22)
AJPF10N 33.42 (6.38) 39.79 (15.19) 30.18 (12.00)
AJN 30N 33.75 (3.51) 43.94 (15.76) 39.75 (17.40)
AJDF30N 8.61 (4.93) 18.65 (13.44) 15.55 (11.36)
AJPF 30N 54.05 (6.10) 60.82 (14.23) 53.08 (17.87)
M, Male; F, Female; WBLT, Weight bearing Lunge Test; AJN, ankle joint neutral; AJDF, ankle
joint dorsi flexed; AJPF ankle joint plantar flexed; N, Newton’s *Foot Posture Index;FPI-6;
Supinated: (-1 to -12), Normal: (0 to +5): Pronated (+6 to +12)

48
Table 4.8: Paired t-test analyses between foot types (FPI-6) for derived variables for ankle joint ROM (WBLT) and MTPJ1 ROM.
AJN, ankle joint neutral; AJDF, ankle joint dorsi flexed; AJPF ankle joint plantar flexed; N,
Newton’s: S, supinated: N, normal: P, pronated: “*”: statistical significance p <0.05.
Variable Foot type
Mean Difference T value p value 95% CI
(lower) 95% CI (upper)
WBLT S & N -7.95 -1.54 0.18 -21.17 5.27 S & P -7.65 -1.47 0.20 -20.99 5.69 N & P -2.89 -1.89 0.07 -6.12 0.35
10N AJN S & N -15.45 -2.43 0.06 -31.76 0.86
S & P 1.95 0.44 0.68 -9.36 13.25 N & P 4.08 0.80 0.44 -6.71 14.87
AJDF S & N -4.01 -1.86 0.12 -9.54 1.52 S & P -0.67 -1.20 0.28 -2.09 0.75 N & P -0.68 -0.37 0.72 -4.61 3.25
AJPF S & N -19.76 -2.55 0.05* -39.70 0.18 S & P 8.22 2.10 0.09 -1.86 18.31 N & P 15.62 2.70 0.01* 3.35 27.90
30N AJN S & N -16.12 -2.86 0.04* -30.63 -1.61
S & P 6.39 1.28 0.26 -6.42 19.20 N & P 4.29 0.63 0.54 -10.16 18.74
AJDF S & N -6.39 -1.23 0.03* -19.79 7.01 S & P 2.75 1.02 0.35 -4.15 9.65 N & P -2.07 -0.47 0.64 -11.42 7.27
AJPF S & N -15.37 -3.53 0.02* -26.55 -4.19 S & P 8.47 1.54 0.18 -5.69 22.64 N & P 10.30 1.55 0.14 -3.80 24.41
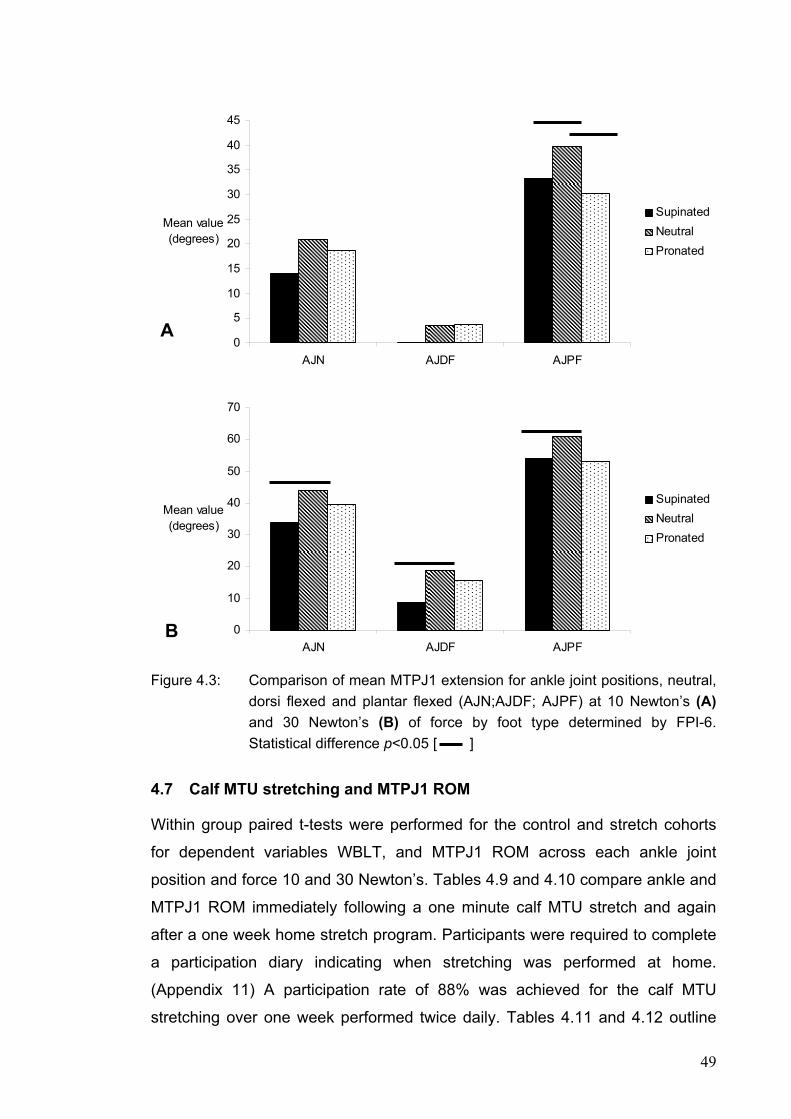
49
Figure 4.3: Comparison of mean MTPJ1 extension for ankle joint positions, neutral, dorsi flexed and plantar flexed (AJN;AJDF; AJPF) at 10 Newton’s (A) and 30 Newton’s (B) of force by foot type determined by FPI-6. Statistical difference p<0.05 [ ]
4.7 Calf MTU stretching and MTPJ1 ROM
Within group paired t-tests were performed for the control and stretch cohorts
for dependent variables WBLT, and MTPJ1 ROM across each ankle joint
position and force 10 and 30 Newton’s. Tables 4.9 and 4.10 compare ankle and
MTPJ1 ROM immediately following a one minute calf MTU stretch and again
after a one week home stretch program. Participants were required to complete
a participation diary indicating when stretching was performed at home.
(Appendix 11) A participation rate of 88% was achieved for the calf MTU
stretching over one week performed twice daily. Tables 4.11 and 4.12 outline
0
5
10
15
20
25
30
35
40
45
AJN AJDF AJPF
Mean value (degrees)
SupinatedNeutralPronated
A
0
10
20
30
40
50
60
70
AJN AJDF AJPF
Mean value (degrees)
SupinatedNeutralPronated
B

50
comparisons to baseline for the control group on the same day repeat test, and
again after one week.
Tables 4.13 and 4.14 demonstrate across group paired t-tests comparing
stretch and control cohorts for variables ankle joint neutral, dorsi flexed and
plantar flexed for forces 10 and 30 Newton’s respectively.
Table 4.9: The mean and standard deviation (SD) of dependent variables and paired t-tests for the stretch group in part three of the study investigating the effect of a one minute calf MTU stretch on MTPJ1 and ankle joint ROM measured on the same day.(all measures are in degrees)
Dependant
Variable Baseline
Mean (SD)
Retest (same day) Mean (SD)
T value p value 95% Upper and
Lower CI
Mean difference
WBLT 49.17 (5.51)
52.46 (4.67)
-3.446 0.006* (-5.42 : -1.16)
-3.29
AJN10N 13.89 (9.77)
16.70 (16.77)
-0.999 0.34 (-9.05 : 3.45)
-2.80
AJDF10N 2.89 (3.91)
4.79 (6.72)
-1.440 0.18 (-4.94: 1.06)
-1.94
AJPF10N 29.85 (13.80)
34.06 (15.81)
-2.477 0.03* (-8.00 : -0.42)
-4.21
AJN30N 40.21 (19.38)
45.45 (18.75)
-2.546 0.03* (-9.83 : -0.65)
-5.24
AJDF30N 19.88 (16.93)
23.32 (15.76)
-2.691 0.02* (-6.23 : -0.59)
-3.44
AJPF30N 54.38 (18.02)
55.42 (17.80)
-0.709 0.49 (-4.33 : 2.24)
-1.04
WBLT: weight bearing lunge test; AJN, ankle joint neutral; AJDF, ankle joint dorsi flexed; AJPF
ankle joint plantar flexed; N, Newton’s (number of subjects = 11, number of feet = 11, 5 left and
6 right); “*”: statistical significance p <0.05.
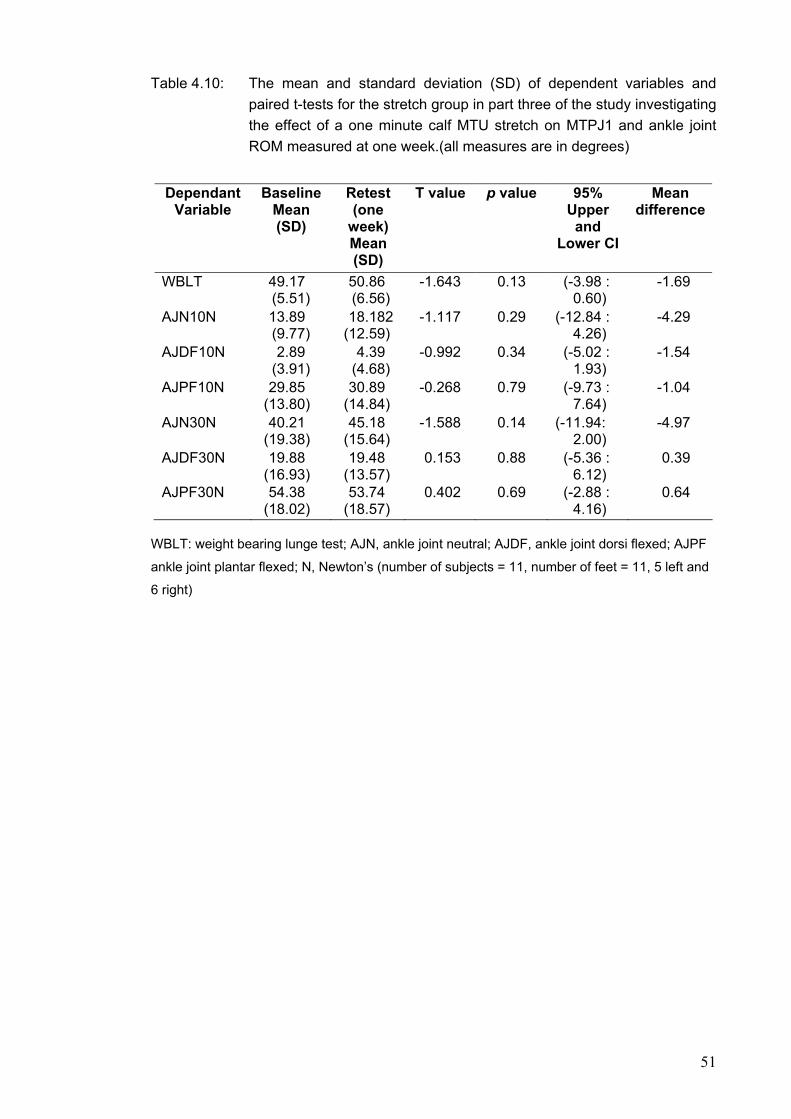
51
Table 4.10: The mean and standard deviation (SD) of dependent variables and paired t-tests for the stretch group in part three of the study investigating the effect of a one minute calf MTU stretch on MTPJ1 and ankle joint ROM measured at one week.(all measures are in degrees)
Dependant
Variable Baseline
Mean (SD)
Retest (one
week) Mean (SD)
T value p value 95% Upper
and Lower CI
Mean difference
WBLT 49.17 (5.51)
50.86 (6.56)
-1.643 0.13 (-3.98 : 0.60)
-1.69
AJN10N 13.89 (9.77)
18.182 (12.59)
-1.117 0.29 (-12.84 : 4.26)
-4.29
AJDF10N 2.89 (3.91)
4.39 (4.68)
-0.992 0.34 (-5.02 : 1.93)
-1.54
AJPF10N 29.85 (13.80)
30.89 (14.84)
-0.268 0.79 (-9.73 : 7.64)
-1.04
AJN30N 40.21 (19.38)
45.18 (15.64)
-1.588 0.14 (-11.94: 2.00)
-4.97
AJDF30N 19.88 (16.93)
19.48 (13.57)
0.153 0.88 (-5.36 : 6.12)
0.39
AJPF30N 54.38 (18.02)
53.74 (18.57)
0.402 0.69 (-2.88 : 4.16)
0.64
WBLT: weight bearing lunge test; AJN, ankle joint neutral; AJDF, ankle joint dorsi flexed; AJPF
ankle joint plantar flexed; N, Newton’s (number of subjects = 11, number of feet = 11, 5 left and
6 right)
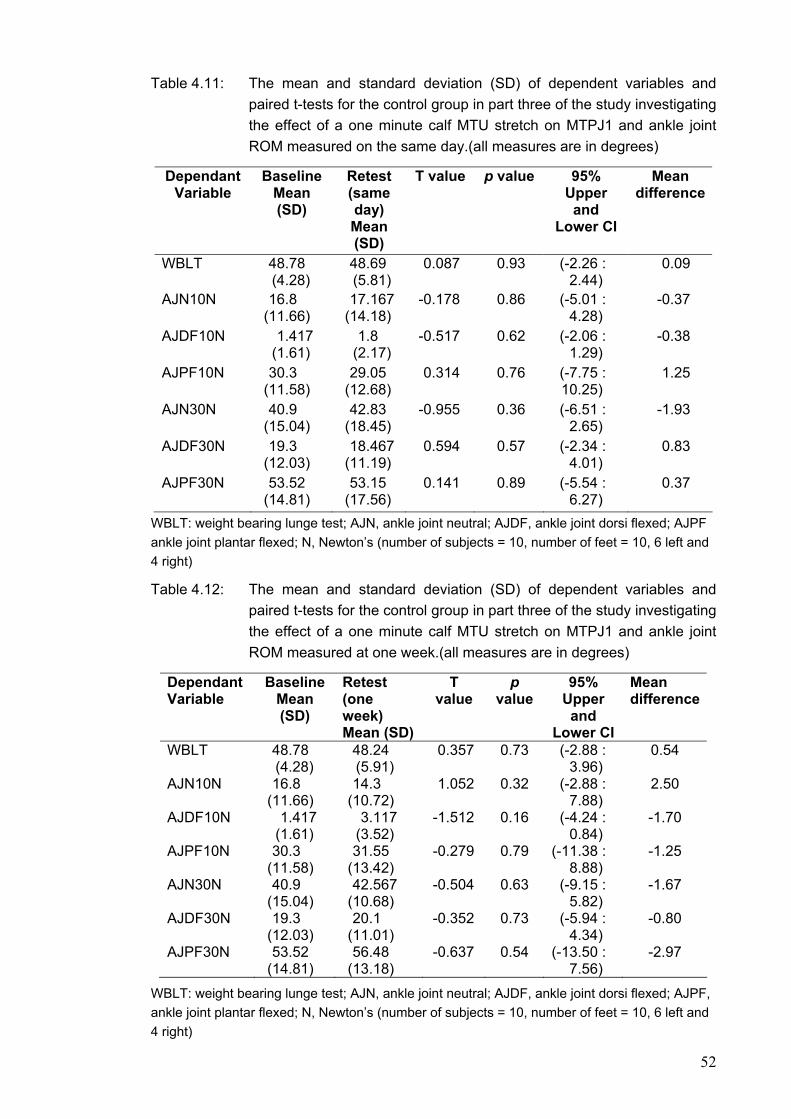
52
Table 4.11: The mean and standard deviation (SD) of dependent variables and paired t-tests for the control group in part three of the study investigating the effect of a one minute calf MTU stretch on MTPJ1 and ankle joint ROM measured on the same day.(all measures are in degrees)
Dependant Variable
Baseline Mean (SD)
Retest (same day) Mean (SD)
T value p value 95% Upper and
Lower CI
Mean difference
WBLT 48.78 (4.28)
48.69 (5.81)
0.087 0.93 (-2.26 : 2.44)
0.09
AJN10N 16.8 (11.66)
17.167 (14.18)
-0.178 0.86 (-5.01 : 4.28)
-0.37
AJDF10N 1.417 (1.61)
1.8 (2.17)
-0.517 0.62 (-2.06 : 1.29)
-0.38
AJPF10N 30.3 (11.58)
29.05 (12.68)
0.314 0.76 (-7.75 : 10.25)
1.25
AJN30N 40.9 (15.04)
42.83 (18.45)
-0.955 0.36 (-6.51 : 2.65)
-1.93
AJDF30N 19.3 (12.03)
18.467 (11.19)
0.594 0.57 (-2.34 : 4.01)
0.83
AJPF30N 53.52 (14.81)
53.15 (17.56)
0.141 0.89 (-5.54 : 6.27)
0.37
WBLT: weight bearing lunge test; AJN, ankle joint neutral; AJDF, ankle joint dorsi flexed; AJPF ankle joint plantar flexed; N, Newton’s (number of subjects = 10, number of feet = 10, 6 left and 4 right)
Table 4.12: The mean and standard deviation (SD) of dependent variables and paired t-tests for the control group in part three of the study investigating the effect of a one minute calf MTU stretch on MTPJ1 and ankle joint ROM measured at one week.(all measures are in degrees)
Dependant Variable
Baseline Mean (SD)
Retest (one week) Mean (SD)
T value
p value
95% Upper
and Lower CI
Mean difference
WBLT 48.78 (4.28)
48.24 (5.91)
0.357 0.73 (-2.88 : 3.96)
0.54
AJN10N 16.8 (11.66)
14.3 (10.72)
1.052 0.32 (-2.88 : 7.88)
2.50
AJDF10N 1.417 (1.61)
3.117 (3.52)
-1.512 0.16 (-4.24 : 0.84)
-1.70
AJPF10N 30.3 (11.58)
31.55 (13.42)
-0.279 0.79 (-11.38 : 8.88)
-1.25
AJN30N 40.9 (15.04)
42.567 (10.68)
-0.504 0.63 (-9.15 : 5.82)
-1.67
AJDF30N 19.3 (12.03)
20.1 (11.01)
-0.352 0.73 (-5.94 : 4.34)
-0.80
AJPF30N 53.52 (14.81)
56.48 (13.18)
-0.637 0.54 (-13.50 : 7.56)
-2.97
WBLT: weight bearing lunge test; AJN, ankle joint neutral; AJDF, ankle joint dorsi flexed; AJPF, ankle joint plantar flexed; N, Newton’s (number of subjects = 10, number of feet = 10, 6 left and 4 right)
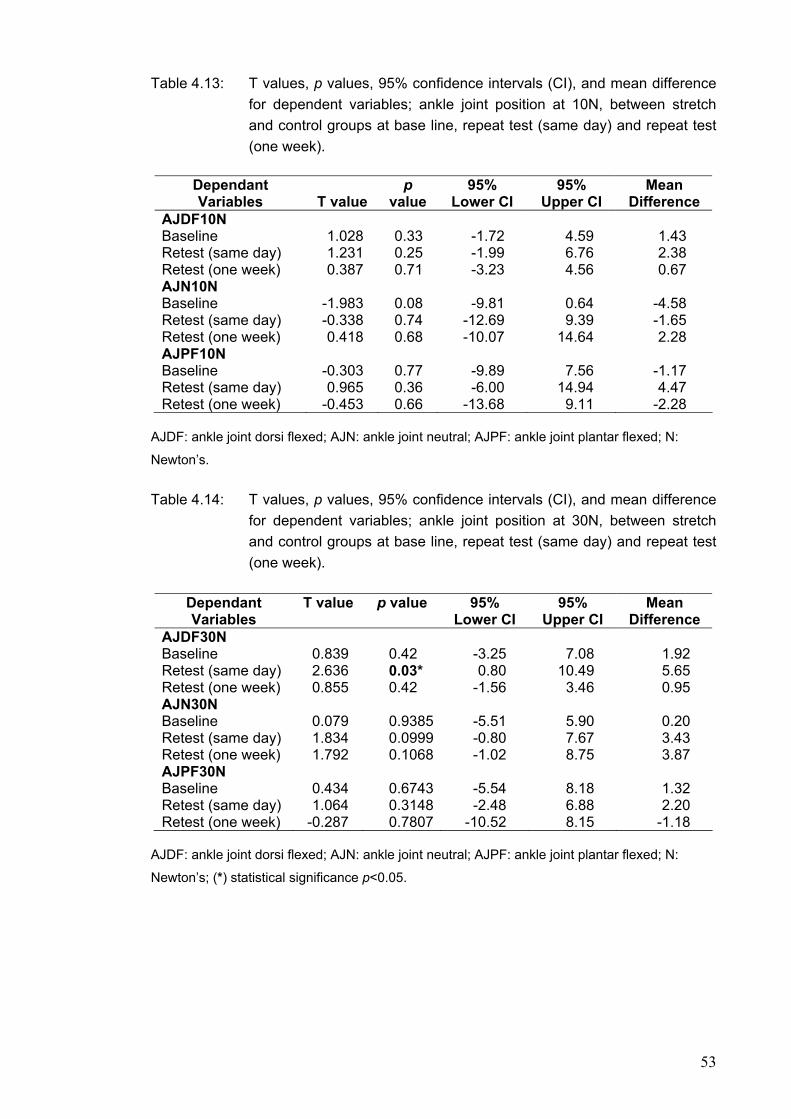
53
Table 4.13: T values, p values, 95% confidence intervals (CI), and mean difference for dependent variables; ankle joint position at 10N, between stretch and control groups at base line, repeat test (same day) and repeat test (one week).
Dependant Variables
T value
p value
95% Lower CI
95% Upper CI
Mean Difference
AJDF10N Baseline Retest (same day) Retest (one week)
1.028 1.231 0.387
0.33 0.25 0.71
-1.72 -1.99 -3.23
4.59 6.76 4.56
1.43 2.38 0.67
AJN10N Baseline Retest (same day) Retest (one week)
-1.983 -0.338 0.418
0.08 0.74 0.68
-9.81
-12.69 -10.07
0.64 9.39
14.64
-4.58 -1.65 2.28
AJPF10N Baseline Retest (same day) Retest (one week)
-0.303 0.965
-0.453
0.77 0.36
0.66
-9.89 -6.00
-13.68
7.56
14.94 9.11
-1.17 4.47
-2.28
AJDF: ankle joint dorsi flexed; AJN: ankle joint neutral; AJPF: ankle joint plantar flexed; N:
Newton’s.
Table 4.14: T values, p values, 95% confidence intervals (CI), and mean difference for dependent variables; ankle joint position at 30N, between stretch and control groups at base line, repeat test (same day) and repeat test (one week).
Dependant Variables
T value p value 95% Lower CI
95% Upper CI
Mean Difference
AJDF30N Baseline Retest (same day) Retest (one week)
0.839 2.636 0.855
0.42 0.03* 0.42
-3.25 0.80
-1.56
7.08
10.49 3.46
1.92 5.65 0.95
AJN30N Baseline Retest (same day) Retest (one week)
0.079 1.834 1.792
0.93850.09990.1068
-5.51 -0.80 -1.02
5.90 7.67 8.75
0.20 3.43 3.87
AJPF30N Baseline Retest (same day) Retest (one week)
0.434 1.064
-0.287
0.67430.31480.7807
-5.54 -2.48
-10.52
8.18 6.88 8.15
1.32 2.20
-1.18
AJDF: ankle joint dorsi flexed; AJN: ankle joint neutral; AJPF: ankle joint plantar flexed; N:
Newton’s; (*) statistical significance p<0.05.

54
CHAPTER FIVE DISCUSSION
5.0 Introduction
The present study was undertaken to determine the extensibility characteristics
of the MTPJ1 and its relationship to tendo Achilles load explored through
differing ankle joint positions. Further to this the immediate and longer term
effect of calf MTU stretching on MTPJ1 extension was also determined in a
sample of healthy asymptomatic subjects.
Review of the literature identified considerable variability in the methodology
used to determine MTPJ1 extension and, subsequently, normal range values
were similarly diverse. The research questions for this investigation derived
from findings of pilot work measuring MTPJ1 extension during quiet standing.
The initial results demonstrated a large influence on range of MTPJ1 motion by
associated postural muscle control used to maintain equilibrium from
perbutations throughout the load un-load cycles. The literature supports the
close interaction between tendo Achilles load and MTPJ1 extension through its
relationship to the plantar aponeurosis. The effect on MTPJ1 has yet to be
quantified. The influence of ankle joint position on measurement of MTPJ1
extension appears important for both clinical and research settings. Further to
this, the effect of commonly prescribed calf MTU stretching on MTPJ1 extension
remained unknown.
The chapter begins with a discussion of the study results including the reliability
testing for the methodology with reference made to individual research
questions. Statistical testing of dependent variables is further discussed in this
chapter with comparisons made to previous literature findings. Limitations and
recommendations for future studies are also presented.
5.1 Research questions
5.1.1 Reliability of methodology
i. The developed methodology for measuring MTPJ1 ROM and stiffness is
reliable compared to established clinical protocols.

55
ii. How many joint pre conditioning trials were required to provide stable
measures of MTPJ1 extension?
Reliability testing of the methodology for measuring MTPJ1 extension was
developed in three parts, as presented in sections 3.3, 3.4 and 3.5 of Chapter 3.
It is known that a joint, including surrounding soft tissues, displays viscoelastic
properties. Therefore some degree of creep and stress relaxation is
expected.(104) Results of section 3.3 confirmed that a degree of conditioning was
present when measuring MTPJ1 ROM. Analysis demonstrated that statistical
differences in joint range were evident during the initial load un-load cycles and
that beyond the sixth cycle no further statistical change was noted. This is
supported in the literature by Taylor et al(104) who reported a 16.6% decrease in
tension in rat tendons loaded and unloaded to 10% of resting length over ten
cycles. Taylor et al(104) also demonstrated a statistically significant difference in
the first four load unload cycles with no statistical difference noted beyond the
seventh peak tension cycle. Maganaris(103) also described tendon conditioning
noting that no further tendon elongation occurred after the first five load un-load
cycles in the gastrocnemius tendon in healthy men.
To yield more reliable results when measuring MTPJ1 extension, a degree of
conditioning appears necessary, a factor which is either not controlled for or
partially controlled for in many studies reporting MTPJ1 range.(34,35,41,42,46,142)
This study has shown improved stability of MTPJ1 measures following six load
un-load cycles. This can be attributed, in part, to neutralizing the mechanical
properties of the surrounding soft tissues as well as a degree of familiarity to the
testing procedure from the participants. Consequently previous data not citing
joint preconditioning should be viewed with caution and both research and
clinical protocols can be adapted from the results of this study.
Further reliability testing investigated the intra-rater reliability determined for the
same day testing as well as over time, i.e. one week. Results of section 3.4 and
3.5 confirm that the methodology used in this investigation for quantifying
MTPJ1 ROM was reliable. Specifically, the intra-rater reliability for the same day
test re-test was high (ICC 3,1 : 0.89-0.99) across all dependent variables. The
typical error ranged between 1.1 - 2.6 degrees, indicating test retest intra-rater
56
reliability would produce values to within 3 degrees on 95% of occasions when
measured on the same day.
Reliability of measurement of the MTPJ1 was further explored with intra-rater
test retest reliability determined over one week. All dependent variables
demonstrated good to high ICC’s (ICC 3,1 : 0.76 – 0.98) with the exception of
derived variable MTPJ1 extension range at 10 Newton’s of force in ankle joint
position dorsi flexion (ICC3,1 : 0.234). This poor reliability statistic was attributed
to the actual low values recorded at this level of force. Caution should further be
adopted when interpreting results for variable AJDF at 10N force as the
standard deviation was greater than the mean value. It would appear that in
AJDF, 10 Newton’s of force is insufficient to produce meaningful joint angle
changes. The typical error across all derived variables ranged from 0.97 – 5.08
degrees. This indicates test retest intra-rater reliability would produce values to
within 5.5 degrees on 95% of occasions when re measured following one week.
The methodology used in this study is unique; hence comparisons to previous
work are limited. However traditional methods of quantifying MTPJ1 ROM have
demonstrated high ICC’s. Hopson et al (35) examined four methods of measuring
static MTPJ1 extension and reported high intra-rater reliability with ICC’s
ranging between 0.91 and 0.98, with a standard error of the mean between 0.80
and 1.44 degrees across each measurement technique. Similarly Hogan and
Kidd(42) reported intra-rater reliability of measuring weight bearing MTPJ1
extension across two weeks as 0.87 and 0.98 for the left and right foot
respectively, with a standard error mean of 4.8 degrees.
Whilst these studies report good reliability of using a standard goniometer for
measuring MTPJ1 ROM, neither controlled for load applied to the hallux during
testing and the measurement tool was restricted to measures of at least one
degree increments.
5.1.2 Ankle joint position and MTPJ1 ROM
iii. Does ankle joint position significantly affect MTPJ1 passive extension and
stiffness in healthy asymptomatic subjects?
57
The present study investigated the above question by determining MTPJ1
extension across three ankle joint positions: dorsi flexed, neutral and plantar
flexed, and two loads: 10 and 30 Newtons of force. The results of this study
demonstrated a reduction of 84% and 60% in MTPJ1 extension between ankle
joint neutral and ankle joint dorsi flexed positions for loads 10 and 30 Newtons
respectively (p<0.0001). Similarly a reduction in range of 46% and 28% was
found between ankle joint plantar flexed and ankle joint neutral positions for
loads 10 and 30 Newtons respectively (p<0.0001).
The results are consistent with work by Flanigan et al (92) who demonstrated a
7.3% increase in tensile stretch of the plantar fascia with the ankle joint in fifteen
degrees dorsi flexion. Increased tension of the plantar fascia will produce a
plantar flexion moment across the MTPJ1, thus increasing the stiffness
characteristics of the joint.(143) The anatomical and functional interrelationship
between the tendo Achilles and plantar fascia has been described and the
results of this study are consistent with this phenomenon.(20-23,25-27,49,89,91,95)
Increased tendo Achilles load has been shown to transmit tensile load through
the plantar fascia with around one third of fascial stress transmitted to the first
ray.(90)
Ankle joint position therefore has important implications to both research and
clinical assessment of non weight bearing MTPJ1 ROM. Few studies describe
the position of the ankle joint when reporting joint range values, and hence
comparisons of normal range must be viewed with caution. Clinicians should
also be aware of the implications of MTPJ1 range across different ankle joint
positions when decision making or assessing outcomes from intervention.
5.1.3 Gender differences in ROM
iv. Were there gender differences with MTPJ1 ROM or stiffness in healthy
asymptomatic subjects?
The results of this study demonstrated increases in the means for MTPJ1
extension range for females across all derived variables. Statistical significance
was reached for ankle joint neutral at 10 Newton’s force (t=2.35, p= 0.02), ankle
joint plantar flexion at 10 Newton’s force (t=3.94, p=0.0005), ankle joint neutral

58
at 30 Newton’s force (t=2.11, p=0.04) and ankle joint plantar flexion at 30
Newton’s force (t= 3.23, p=0.003). Females demonstrated an increase in the
mean MTPJ1 extension across all variables from 20% for AJPF30N up to 31%
for AJN10N. The mean difference increase in MTPJ1 extension across all ankle
joint positions and loads was 7.97 degrees.
These results support previous reported findings of increased musculoskeletal
stiffness in males compared to females where these differences are attributable
to varied tendon mechanics and muscle architecture between the genders. (118-
120,144)
Whilst greater than the overall error level of the instrumentation, the clinical
relevance of this gender difference in a clinical setting remains unclear. Mobility
of joints through the medial column of the foot has been attributed to a greater
risk of hallux valgus development and studies similarly report a greater
incidence of hallux valgus in a female population.(145,146) Whilst
acknowledgement is made to other contributing factors, joint mobility
differences between the genders is supported within this thesis and may pose a
greater risk of pathology involving the MTPJ1.
The present study did, however, demonstrate a statistically significant increase
in ankle joint range of motion for males using the WBLT (t=-2.10, p= 0.04).
Males demonstrated a 6% increase in ankle joint range compared to females.
The WBLT relies on a self perceived maximum range and one may hypothesise
that males may demonstrate a higher perceived stretch tolerance. The mean
difference between males and females for ankle joint range was 3.4 degrees.
Given the available range afforded at the ankle joint the difference appear
clinically small.
5.1.4 Laterality
v. Were there symmetrical or limb dominance differences with MTPJ1 ROM
or stiffness in healthy asymptomatic subjects?
The results of this study demonstrate asymmetry across the entire sample for
non weight bearing MTPJ1 extension range. A significant difference was noted

59
between left and right feet for dependent variables ankle joint dorsi flexion at 10
Newton’s of force (t= -2.79, p=0.008), ankle joint neutral at 30 Newton’s force
(t=-2.71, p=0.01), ankle joint dorsi flexed at 30 Newton’s force (t=-3.07, p=
0.004), and ankle joint plantar flexed at 30 Newton’s force (t= -2.69, p= 0.01).
The results demonstrated an average increase of around 8% in MTPJ1
extension for the right side with the exception of variable AJDF10N which
showed much greater magnitude of difference. However this result can be
viewed cautiously as the angular change of the MTPJ1 was small. The average
mean difference for MTPJ1 extension across all variables was 2.19 degrees
which, given the associated instrumentation error, the clinical relevance of these
findings should be viewed cautiously.
The phenomenon of limb dominance has not been reported for MTPJ1 ROM.
Studies have described asymmetries in joint movement and limb segments
throughout gait, however the influence of limb dominance remains unclear.(124-
126,147) The sample population used in this present study, with the exception of
one subject, was right limb dominant. Whilst speculative, these results support
the hypothesis that limb dominance relates to asymmetrical joint range of
motion in the foot, notably MTPJ1. It must however be noted that the limb
dominance for MTPJ1 ROM was across all derived variables with statistical
significance reached for four of the six variables. One could speculate that there
may have been some influence in the methodological technique to produce
such a trend. Further investigation using a larger sample of equal left and right
sided dominant participants would provide greater insight into this phenomenon
within the joints of the foot.
5.1.5 Foot posture and MTPJ1 ROM
vi. Does foot posture influence MTPJ1 passive non weight bearing extension?
The current study revealed a slight trend towards a pronated foot type across
the sample of 73 feet, with FPI-6 values of 3.05 and 3.69 for the left and right
feet respectively. Whilst a neutral foot is commonly thought to be a ‘normal’ foot
type, several studies using the FPI instrument have described the ‘normal’ or
average foot to be mildly to moderately pronated, similar to the findings of this
study.(5,128,129,148) Assessing foot type for research purposes is common as it
60
has been hypothesised that foot morphology may predispose to certain
pathologies. Studies have however described increased risk of lower limb injury
with pronated,(130,131) as well as supinated foot types.(128,129) Another prospective
study found no association between foot type and lower limb injury.(133)
Differences in dynamic and static functions of the foot have been described
between foot types with the pronated foot often associated with joint mobility
and the cavus foot with rigidity.(128,149-152)
The present study demonstrated a significant increase in MTPJ1 ROM between
the supinated and neutral foot types across all ankle joint position under 30N of
force and for AJPF under 10N of force. However a reduced MTPJ1 ROM was
evident between the neutral foot type and the pronated foot type with statistical
significance reached for AJPF under 10N of force. No significant differences
were noted between the supinated and pronated foot types. Assuming that the
pronated foot type displays a larger degree of joint mobility then it may be
plausible that during non weight bearing testing of MTPJ1 ROM that recruitment
of muscle activity was present in this group to provide stability throughout the
load un-load cycles thus reducing toe extension. This again is speculative as
there were no controls for myogenic activity.
The study also demonstrated that supinated foot types had a reduced tendo
Achilles length as determined via the WBLT. Although not statistically significant
the reduced ankle joint dorsiflexion angle in the supinated group supports the
work by Burns and Crosbie (149), who demonstrated a strong positive correlation
between tendo Achilles length and foot type.
5.1.6 Calf MTU stretching and MTPJ1 ROM
vii. Does static and cyclic calf MTU stretches improve MTPJ1 range of motion
and stiffness in healthy asymptomatic subjects?
This study investigated the immediate and longer term effects of a one minute
hybrid, static and cyclic stretch of the calf MTU on ankle and MTPJ1 ROM. A
combined static and cyclic stretch regime was chosen as they each have been
shown to produce different modifications to the viscoelastic properties of the calf
MTU.(114)
61
The results demonstrated an increase in the mean ROM across all variables
immediately following calf MTU stretching, with statistical significant achieved
for ankle joint range via the WBLT (t= -3.45, p= 0.006), AJPF10N (t=-2.48, p=
0.03), AJN30N (t= -2.55, p= 0.03) and AJDF30N (t= -2.69, p= 0.02). The control
group demonstrated no statistical difference between baseline testing and
repeat testing, both immediately and after one week, with the stretch group
demonstrating no statistical differences in ROM following a one week stretch
program.
Increases in ankle joint ROM following stretching have been documented with
small statistically significant increases in range noted.(29) The lasting effects and
mechanisms involved in achieving greater joint ROM remain unclear. Folpp et al (153) describe an increase in the stretch tolerance of soft tissues following
stretching however others describe changes to the mechanical properties of the
musculoskeletal unit.(103,154-156) As the WBLT is a self regulated test, a change
in the stretch tolerance could explain the increased ankle joint range
demonstrated. However the testing of the MTPJ1 ROM was not self regulated
and would perhaps demonstrate true changes in the viscoelastic series of the
lower leg and foot.
The present study investigated both the immediate effect on ankle joint and
MTPJ1 ROM of a one minute calf MTU stretch and the effect after the stretch
was performed twice daily for one week. The acute effects of gastrocnemius
stretching on ankle joint ROM have been described, with Morse et al(157)
reporting a 17% (4.6 degree) increase in ankle ROM following a series of one
minute calf MTU stretches. The longer term effect of muscle stretching has also
been outlined with de Weijer et al(158) describing the effect of static stretching on
hamstring length over a twenty four hour period. Whilst increases in hamstring
length were maintained at twenty four hours, by 15 minutes post stretch the
hamstring length had already decreased. Duong et al(97) also describe the initial
rapid recovery of the calf MTU following acute stretch. They described a 23%
decrease in ankle joint torque following a five minute stretch with a 43%
recovery of torque within 2 minutes of stretch release. Whilst the present study
did not quantify the creep or stress relaxation of the MTPJ1 over time following
stretching, it would appear the study supports previous findings where an

62
immediate increase in ankle and MTPJ1 range was noted but returned to
baseline following one week. One could speculate that the effect on ankle joint
and MTPJ1 ROM of stretching, be it changes to stretch tolerance or the
viscoelastic properties of the soft tissues declines rapidly following stretching.
However greater changes may be demonstrated with increased stretch times.
Whilst this study reports increases in ankle joint and MTPJ1 ROM immediately
following stretching, these values appear clinically small. The present study
demonstrated a mean increase in ankle joint range of 3.3 degrees and
increases in MTPJ1 extension ranged between 1.0 and 5.2 degrees across all
dependent variables following calf MTU stretching. Radford et al(29) found a
similar small increase in ankle joint range following a systematic review of the
effects of calf MTU stretching. Consistent with this study they found a weighted
mean difference of 2.07 degrees increase for ankle joint dorsi flexion following
calf stretches of less than 15 minutes duration. The clinical relevance of such a
relatively small increase in joint range remains unclear; however concomitant
changes in ranges to associated neighbouring joints could be one possible
explanation for positive outcomes seen clinically.(111,112) The influence of these
small improvements to joint extensibility on gait efficiency is an area of further
interest. Whilst speculative, stretching in the elderly, who are more susceptible
to falls, may have a positive affect on postural stability similar to the benefit of
foot mobilization in this subgroup.(159)
Analyses of the data between the stretch and control groups reports no
statistical difference across all derived variables with the exception of AJDF30N
(t=2.64, p=0.03). This demonstrated a significant increase in MTPJ1 ROM
between the stretch and control groups measured on the same day following a
one minute stretch. The small sample size in both groups may account for this.
Given the within subject changes noted with calf MTU stretching a larger study
may be warranted to explore group differences further.
5.1.7 Limitations and recommendations for further study
Limitations were identified within the study and are discussed below, together
with recommendations for further investigation informed by this series of
studies.

63
Comparisons of non weight bearing MTPJ1 ROM between this study and those
reported within the literature is difficult due to the methodology used. Unique in
its design, the methodology used in this study demonstrates the advantage of
controlling for ankle joint position, torque applied to the joint and the viscoelastic
nature of the joint. A longitudinal study with a larger sample size would be
recommended to report normative data for non weight bearing MTPJ1
extension. A study cohort could be further divided into age decades which could
then be used to assess the effect of ageing on passive MTPJ1 ROM and
development of pathology.
Another recommendation for further studies is to include a larger sample of left
sided dominant subjects. Whilst this study found a significant trend towards
increased ROM on the dominant side, a lack of left sided dominant participants
renders any conclusion in terms of asymmetry purely speculative. Additional
measures of leg length and foot length differences would also be encouraged.
A limitation of this study is the lack of a clinically defined foot pathology group.
The present study describes a phenomenon between ankle joint position, tendo
Achilles load and MTPJ1 ROM in healthy asymptomatic adults. Therefore
conclusions to ‘pathology’ subgroups cannot be made. The presented
methodology demonstrates good reliability for quantifying MTPJ1 ROM so
future investigations comparing pathological groups and age matched controls
can be made. Of further interest are the effects of calf MTU stretching and
MTPJ1 ROM in such pathological groups. One might intuitively expect to see a
greater response to calf MTU stretches with those displaying limited joint
mobility, than the normal, asymptomatic participants used in this current study.
A suggested group for further investigation are individuals diagnosed with Type
2 diabetes, where correlations would be assessed between, glycosolated
haemoglobin levels, ankle and MTPJ1 joint extensibility and plantar pressures.
Pre and post evaluations on joint extensibility and plantar pressures could be
made following a similar stretching protocol described in this thesis. This could
be combined with an age matched control group not instructed to perform calf
MTU stretches. Elevated plantar pressures and disruptions to pressure time
integrals can have detrimental effects on diabetic feet by way of tissue

64
breakdown, particularly those with neuropathic changes and MTPJ1 ROM has
been described as a good predictor of elevated pressures.(53,74,79,160)
Improvements in gait efficiency led by improved joint extensibility seems an
important preventative strategy in this population and worthy of further
investigation.
A further limitation of this study is the pseudo passive movement reported. No
control for muscle activity was utilized and therefore a true passive extension of
the MTPJ1 was unknown. A recommendation for further investigation into true
passive MTPJ1 ROM would be to use electromyography to detect active
participant assistance during testing. Similarly the velocity or acceleration used
during testing MTPJ1 cycles, whilst steady, was neither controlled for nor
quantified. The rate of load displacement, which can affect the mechanical
properties of soft tissues, could be controlled for by using a motorized rig
programmed to move at a set velocity.
A recommendation for further investigations would be the assessment of the
effect of calf MTU stretching on MTPJ1 and ankle joint ROM during dynamic
gait. A motion analysis system could be used to collect kinematic data during
gait cycles. Correlation to plantar pressures would be of interest in specific
groups such as diabetics, athletes or the elderly who represent a greater risk for
falls. Force plates or in-shoe pressure systems could be used to provide before
and after changes to peak pressures and pressure-time integrals following calf
MTU stretches. The time course changes could be followed and appear worthy
of further investigation.
65
CHAPTER SIX CONCLUSIONS
6.0 Introduction
This chapter presents the conclusions of the study, grouped according to the
original research questions (i-vi).
6.1 Conclusions
From this study the following conclusions, limited to this cohort, may be drawn:
Reliability:
i. Measurement of non weight bearing MTPJ1 range of extension was
reliable for both the same day testing and across one week. [ICC3,1: >0.89;
SEM <2.6 degrees and ICC3,1: >0.76; SEM <5.1 degrees respectively].
ii. Reliable quantification of non weight bearing MTPJ1 extension requires at
least 6 load un-load cycles to reduce the variability in measures as a result
of joint conditioning. Baseline data was achieved by using the mean value
of load un-load cycles between 7-9.
Ankle joint position and MTPJ1 ROM:
iii. Ankle joint position significantly effects non weight bearing MTPJ1 ROM.
Range of MTPJ1 extension significantly reduced from ankle joint plantar
flexion, ankle joint neutral to ankle joint dorsi flexion under both load
conditions of 10 and 30 Newton’s of force.
Gender differences and MTPJ1 ROM:
iv. Female subjects demonstrated a greater range of non weight bearing
MTPJ1 ROM for derived variables AJN10N, AJPF10N, AJN30N and
AJPF30N. Males demonstrated a greater ankle joint range of motion.
Symmetry and limb dominance on MTPJ1 ROM:
v. Right sided dominance was associated with increased non weight bearing
MTPJ1 ROM.
66
Foot posture and MTPJ1 ROM:
vi. Neutral foot types had a greater MTPJ1 ROM compared to supinated foot
types for derived variables AJPF10N, AJN30N, AJDF30N and AJPF30N.
There were no statistical differences in ankle joint ROM based on foot
type.
Effects of calf MTU stretching on MTPJ1 ROM:
vii A one minute static and ballistic calf muscle stretch significantly improves
ankle joint range of motion immediately following stretch as well as MTPJ1
range for variables AJPF10N, AJN30N and AJDF 30N. A one week home
stretching protocol did not increase ankle or MTPJ1 range of motion.

67
REFERENCES
1. Dorland's pocket medical dictionary. 23rd Edition: Philadelphia: WB
Saunders-Co.; 1982.
2. McCarthy D. Cross sectional anatomy of the first ray. In: McGlamry E,
editor. Fundamentals of foot surgery. Baltimore: Williams and Wilkins;
1987.
3. Dananberg HJ. Functional hallux limitus and its relationship to gait
efficiency. Journal of the American Podiatric Medical Association. 1986;
76 (11):648-652.
4. Cornwall M, McPoil T, Lebec M, Vicenzino B, Wilson J. Reliability of the
Modified Foot Posture Index. Journal of the American Podiatric Medical
Association.2008; 98(1):7-13.
5. Redmond A, Crosbie J, Ouvrier R. Development and validation of a novel
rating system for scoring standing foot posture: The Foot Posture Index.
Clinical Biomechanics.2006; 21(1):89-98.
6. Camasta CA. Hallux limitus and hallux rigidus. Clinical examination,
radiographic findings, and natural history. Clinics in Podiatric Medical
Surgery.1996; 13 (3):423-48.
7. Latash M, Zatsiorsky V. Joint stiffness: Myth or reality? Human
movement science.1993 ;12 (6):653-692.
8. Evans G. Studies on the Anatomy and Function of Bone and Joints. New
York: Springer-Verlag; 1966.
9. Józsa L, Kannus P. Human Tendons: Anatomy, Physiology, and
Pathology: Human Kinetics; 1997.

68
10. Bennell K, Talbot R, Wajswelner H, Techovanich W, Kelly D. Intra-rater
and inter-rater reliability of a weight-bearing lunge measure of ankle
dorsiflexion. Australian Journal of Physiotherapy.1998 ; 44(3):175-180.
11. Hicks JH. The mechanics of the foot. II. The plantar aponeurosis and the
arch. Journal of Anatomy.1954; 88 (1):25-30.
12. Root M, Orien W, Weed J. Normal and abnormal function of the foot. Los
Angeles: Clinical Biomechanics; 1977.
13. Payne C, Chuter V, Miller K. Sensitivity and specificity of the functional
hallux limitus test to predict foot function. Journal of the American
Podiatric Medical Association.2002; 92 (5):269-271.
14. Chapman C. Functional hallux limitus. British Journal of Podiatry 1999; 2
(2):40-44.
15. Dananberg HJ. Gait style as an etiology to chronic postural pain. Part II.
Postural compensatory process. Journal of the American Podiatric
Medical Association.1993; 83 (11):615-624.
16. Dananberg HJ. Gait style as an etiology to chronic postural pain. Part I.
Functional hallux limitus. Journal of the American Podiatric Medical
Association.1993; 83 (8):433-441.
17. Birke J, Cornwall M, Jackson M. Relationship between hallux limitus and
ulceration of the great toe. The Journal of Orthopaedic and Sports
Physical Therapy.1988; 10 (5):172-176.
18. Shereff MJ, Bejjani FJ, Kummer FJ. Kinematics of the first
metatarsophalangeal joint. Journal of Bone and Joint Surgery.1986; 68-A
(3):392-398.

69
19. Roukis TS, Scherer PR, Anderson CF. Position of the first ray and
motion of the first metatarsophalangeal joint. Journal of the American
Podiatric Medical Association.1996; 86 (11):538-546.
20. Sarrafian SK. Functional characteristics of the foot and plantar
aponeurosis under tibiotalar loading. Foot Ankle.1987; 8 (1):4-18.
21. Carlson RE, Fleming LL, Hutton WC. The biomechanical relationship
between the tendoachilles, plantar fascia and metatarsophalangeal joint
dorsiflexion angle. Foot Ankle International.2000; 21(1):18-25.
22. Cheung JT-M, Zhang M, An K-N. Effect of Achilles tendon loading on
plantar fascia tension in the standing foot. Clinical Biomechanics.2006;
21(2):194-203.
23. Erdemir A, Hamel AJ, Fauth AR, Piazza SJ, Sharkey NA. Dynamic
loading of the plantar aponeurosis in walking. Journal of Bone and Joint
Surgery.2004; 86-A (3):546-552.
24. Johnson CH, Christensen JC. Biomechanics of the first ray part V: The
effect of equinus deformity: A 3-dimensional kinematic study on a
cadaver model. The Journal of Foot and Ankle Surgery.2005; 44 (2):114-
120.
25. Milz S, Rufai A, Buettner A, Putz R, Ralphs JR, Benjamin M. Three-
dimensional reconstructions of the Achilles tendon insertion in man.
Journal of Anatomy.2002; 200 (Pt 2):145-52.
26. Kogler GF, Veer FB, Verhulst SJ, Solomonidis SE, Paul JP. The effect of
heel elevation on strain within the plantar aponeurosis: in vitro study.
Foot Ankle International.2001; 22 (5):433-439.
27. Cheng H, Lin C, Wang H, Chou S. Finite element analysis of plantar
fascia under stretch-The relative contribution of windlass mechanism and
70
Achilles tendon force. Journal of Biomechanics. Accepted for publication.
2008.
28. Nawoczenski DA, Baumhauer JF, Umberger BR. Relationship between
clinical measurements and motion of the first metatarsophalangeal joint
during gait. Journal of Bone and Joint Surgery.1999; 81-A (3):370-376.
29. Radford JA, Burns J, Buchbinder R, Landorf KB, Cook C. Does
stretching increase ankle dorsiflexion range of motion? A systematic
review. British Journal of Sports Medicine.2006; 40(10):870-875.
30. Rao S, Saltzman C, Yack H. Ankle ROM and stiffness measured at rest
and during gait in individuals with and without diabetic sensory
neuropathy. Gait and Posture.2006; 24 (3):295-301.
31. D'Ambrogi E, Giacomozzi C, Macellari V, Uccioli L. Abnormal foot
function in diabetic patients: the altered onset of Windlass mechanism.
Diabetic Medicine.2005; 22 (12):1713-1719.
32. Fujiwara K, Toyama H, Kiyota T, Maeda K. Postural muscle activity
patterns during standing at rest and on an oscillating floor. Journal of
Electromyography and Kinesiology.2006; 16(5):448-457.
33. Hetherington V. Hallux valgus and forefoot surgery: Churchill
Livingstone, New York; 1994.
34. Buell T, Green DR, Risser J. Measurement of the first
metatarsophalangeal joint range of motion. Journal of the American
Podiatric Medicine Association.1988; 78 (9):439-448.
35. Hopson MM, McPoil TG, Cornwall MW. Motion of the first
metatarsophalangeal joint. Reliability and validity of four measurement
techniques. Journal of the American Podiatric Medical Association.1995;
85(4):198-204.

71
36. Halstead J, Turner DE, Redmond AC. The relationship between hallux
dorsiflexion and ankle joint complex frontal plane kinematics: A
preliminary study. Clinical Biomechanics.2005; 20 (5):526-531.
37. Halstead J, Redmond A. Weight-bearing passive dorsiflexion of the
hallux in standing is not related to hallux dorsiflexion during walking. The
Journal of Orthopaedic and Sports Physical Therapy.2006; 36 (8):550-
556.
38. Joseph J. Range of motion of the great toe in men. Journal of Bone and
Joint Surgery.1954; 36-B: 450-456.
39. Mann R, Hagy J. The function of the toes in walking, jogging and
running. Clinical Orthopaedics.1979 ; 142: 24-29.
40. Swanenburg J, Stappaerts KH, Tirez B, Uebelhart DA, G. Developoment
and reliability of a measurement device for flexion force of the first
metatarsophalangeal joint. Journal of Applied Biomechanics.2003; 19
(3): 271-278.
41. Allen MK. Dorsiflexion at the first metatarsophalangeal joint: a
comparison of measurement by tractograph and digital biometer. British
Journal of Podiatry.1998 (February):25-32.
42. Hogan D, Kidd R. The reliability and validity of goniometers when
measuring the first metatarsophalangeal joint in stance. Australasian
Journal of Podiatric Medicine.2001; 35 (1):19-22.
43. Wearing SC, Urry S, Perlman P, Smeathers J, Dubois P. Sagittal plane
motion of the human arch during gait: a videofluoroscopic analysis. Foot
and Ankle International.1998; 19 (11):738-742.

72
44. Wearing SC, Smeathers JE, Yates B, Sullivan PM, Urry SR, Dubois P.
Errors in measuring sagittal arch kinematics of the human foot with digital
fluoroscopy. Gait and Posture.2005; 21 (3):326-332.
45. Umberger BR, Nawoczenski DA, Baumhauer JF. Reliability and validity
of first metatarsophalangeal joint orientation measured with an
electromagnetic tracking device. Clinical Biomechanics.1999; 14 (1):74-
76.
46. Paton J. The relationship between navicular drop and first
metatarsophalangeal joint motion. Journal of the American Podiatric
Medical Association.2006; 96 (4):313-317.
47. Goldsmith JR, Lidtke RH, Shott S. The effects of range-of-motion therapy
on the plantar pressures of patients with diabetes mellitus. Journal of the
American Podiatric Medical Association.2002; 92 (9):483-490.
48. Perez H, Reber L, Christensen J. Effects on the metatarsophalangeal
joint after simulated first tarsometatarsal joint arthrodesis. Journal of Foot
and Ankle Surgery.2007; 46 (4):242-247.
49. Kogler G, Solomonidis S, Paul J. Biomechanics of longitudinal arch
support mechanisms in foot orthoses and their effect on plantar
aponeurosis strain. Clinical Biomechanics.1996; 11 (5):243-252.
50. Fuller EA. The windlass mechanism of the foot. A mechanical model to
explain pathology. Journal of the American of Podiatric Medical
Association.2000; 90 (1):35-46.
51. Aquino A, Payne C. Function of the plantar fascia. The Foot.1999; 9
(2):73-78.

73
52. D'Ambrogi E, Giurato L, D'Agostino MA, Giacomozzi C, Macellari V,
Caselli A. Contribution of plantar fascia to the increased forefoot
pressures in diabetic patients. Diabetes Care.2003; 26 (5):1525-1529.
53. Payne C, Turner D, Miller K. Determinants of plantar pressures in the
diabetic foot. Journal of Diabetes and its Complications.2002; 16 (4):277-
283.
54. Allen RH, Gross MT. Toe flexors strength and passive extension range of
motion of the first metatarsophalangeal joint in individuals with plantar
fasciitis. The Journal of Orthopaedic and Sports Physical Therapy.2003;
33 (8):468-478.
55. Baxter D. The foot and ankle in sport: Mosby, St. Louis; 1995.
56. Coughlin MJ, Shurnas PS. Hallux rigidus: demographics, etiology, and
radiographic assessment. Foot and Ankle International.2003; 24
(10):731-743.
57. Hamilton WG, O'Malley MJ, Thompson FM, Kovatis PE. Roger Mann
Award 1995. Capsular interposition arthroplasty for severe hallux rigidus.
Foot and Ankle International.1997; 18 (2):68-70.
58. Coughlin MJ, Shurnas PS. Hallux rigidus. Grading and long-term results
of operative treatment. Journal of Bone and Joint Surgery.2003; 85-A
(11):2072-2088.
59. Vanore JV, Christensen JC, Kravitz SR, Schuberth JM, Thomas JL, Weil
LS, et al. Diagnosis and treatment of first metatarsophalangeal joint
disorders. Section 2: Hallux rigidus. Journal of Foot and Ankle
Surgery.2003; 42 (3):124-36.
60. Hall C, Nester CJ. Sagittal plane compensations for artificially induced
limitation of the first metatarsophalangeal joint: a preliminary study.

74
Journal of the American Podiatric Medical Association.2004; 94 (3):269-
274.
61. Dananberg HJ. The Kinetic Wedge. Journal of the American Podiatric
Medical Association.1988; 78 (2):98-99.
62. Dananberg HJ, Guiliano M. Chronic low-back pain and its response to
custom-made foot orthoses. Journal of the American Podiatric Medical
Association.1999; 89 (3):109-117.
63. Bartold SJ. The plantar fascia as a source of pain--biomechanics,
presentation and treatment. Journal of Bodywork and Movement
Therapies.2004; 8 (3):214-226.
64. Akfirat M, Sen C, Gunes T. Ultrasonographic appearance of the plantar
fasciitis. Clinical Imaging.2003; 27 (5):353-357.
65. Singh D, Angel J, Bentley G, Trevino S. Fortnightly review: Plantar
fasciitis. British Medical Journal.1997; 315 (7101):172-175.
66. Taunton JE, Ryan MB, Clement DB, McKenzie DC, Lloyd-Smith DR.
Plantar fasciitis: a retrospective analysis of 267 cases. Physical Therapy
in Sport.2002; 3 (2):57-65.
67. McPoil TG, Martin RL, Cornwall MW, Wukich DK, Irrang JJ, Godges JJ.
Heel pain -plantar fasciitis: clinical pratice guidelines linked to the
international classification of functioning, disability, and health from the
orthopaedic section of the American physical therapy association. The
Journal of Orthopaedic and Sports Physical Therapy.2008; 38(4):A1-A-
18.
68. Lemont H, Ammirati K, Usen N. Plantar Fasciitis A Degenerative Process
(Fasciosis) Without Inflammation. Journal of the American Podiatric
Medical Association.2003; 93 (3):234-237.

75
69. Kumai T, Benjamin M. Heel spur formation and the subcalcaneal
enthesis of the plantar fascia. Journal of Rheumatology.2002; 29
(9):1957-1964.
70. Tsai WC, Chiu MF, Wang CL, Tang FT, Wong MK. Ultrasound evaluation
of plantar fasciitis. Scandinavian Journal of Rheumatology.2000; 29
(4):255-259.
71. Cardinal E, Chhem RK, Beauregard CG, Aubin B, Pelletier M. Plantar
fasciitis: sonographic evaluation. Radiology.1996; 201 (1):257-259.
72. Payne C. Biomechanics of the foot in diabetes mellitus: some theoretical
considerations. Journal of the American Podiatric Medical
Association.1998; 88 (6):285-289.
73. Glasoe WM, Allen MK, Ludewig PM, Saltzman CL. Dorsal mobility and
first ray stiffness in patients with diabetes mellitus. Foot and Ankle
International.2004; 25 (8):550-555.
74. Nube V, Molyneaux L, Yue D. Biomechanical Risk Factors Associated
with Neuropathic Ulceration of the Hallux in People with Diabetes
Mellitus. Journal of the American Podiatric Medical Association.2006; 96
(3):189-197.
75. Trevino S, Buford W, T N, Wright A. Use of a torque range of motion
device for objective differentiation of diabetic from normal feet in adults.
Foot and Ankle International.2004; 25 (8):561-567.
76. Salsich G, Mueller M, Sahrmann S. Passive Ankle Stiffness in Subjects
With Diabetes and Peripheral Neuropathy Versus an Age-Matched
Comparison Group. Physical Therapy.2000; 80 (4):352.
77. Chuter V, Payne C. Limited joint mobility and plantar fascia function in
Charcot's neuroarthropathy. Diabetic Medicine.2001; 18 (7):558-561.

76
78. Brownlee M, Vlassara H, Cerami A. Nonenzymatic glycosylation and the
pathogenesis of diabetic complications. Annals of Internal
Medicine.1984; 101 (4):527-537.
79. Giacomozzi C, D'Ambrogi E, Uccioli L, Macellari V. Does the thickening
of Achilles tendon and plantar fascia contribute to the alteration of
diabetic foot loading? Clinical Biomechanics.2005; 20 (5):532-539.
80. Craig M, Duffin A, Gallego P, Lam A, Cusumano J, Hing S, Donaghue K.
Plantar Fascia Thickness, a Measure of Tissue Glycation, Predicts the
Development of Complications in Adolescents with Type 1 Diabetes.
Diabetes Care.2008; 31 (6):1201-1206.
81. Mercer Bolton NR, Smith KE, Pilgram TK, Mueller MJ, Bae KT.
Computed tomography to visualize and quantify the plantar aponeurosis
and flexor hallucis longus tendon in the diabetic foot. Clinical
Biomechanics.2005; 20 (5):540-546.
82. Batista F, Nery C, Pinzur M, Monteiro A, de Souza E, Felippe F, et al.
Achilles tendinopathy in diabetes mellitus. Foot and Ankle
International.2008; 29 (5):498-501.
83. Tinley P, Taranto M. Clinical and Dynamic Range-of-Motion Techniques
in Subjects With and Without Diabetes Mellitus. Journal of the American
Podiatric Medical Association.2002; 92 (3):136-142.
84. Turner D, Helliwell P, Burton A, Woodburn J. The relationship between
passive range of motion and range of motion during gait and plantar
pressure measurements. Diabetic Medicine.2007; 24 (11): 1240-1246.
85. Birke JA, Franks BD, Foto JG. First ray joint limitation, pressure, and
ulceration of the first metatarsal head in diabetes mellitus. Foot and
Ankle International.1995; 16 (5):277-284.
77
86. Mueller MJ, Hastings M, Commean PK, Smith KE, Pilgram TK,
Robertson D, et al. Forefoot structural predictors of plantar pressures
during walking in people with diabetes and peripheral neuropathy.
Journal of Biomechanics.2003; 36 (7):1009-1017.
87. Garcia M, Lund K. The beneficial effect of motorised ankle dorsiflexion
on the healing of diabetic foot ulcers. Journal of Wound Care.2004; 13
(8):316-7.
88. Elsner A, Schiffer G, Jubel A, Koebke J, Andermahr J. The venous pump
of the first metatarsophalangeal joint: clinical implications. Foot and
Ankle International.2007; 28 (8):902-909.
89. Snow S, Bohne W, DiCarlo E, Chang V. Anatomy of the Achilles tendon
and plantar fascia in relation to the calcaneus in various age groups.
Foot and Ankle International.1995; 16 (7):418-421.
90. Cheung JT, Zhang M, An KN. Effect of Achilles tendon loading on plantar
fascia tension in the standing foot. Clinical Biomechanics.
2006; 21 (2):194-203.
91. Thordarson DB, Schmotzer H, Chon J, Peters J. Dynamic support of the
human longitudinal arch. A biomechanical evaluation. Clinical
Orthopaedics and Related Research.1995 (316) :165-172.
92. Flanigan RM, Nawoczenski DA, Chen L, Wu H, DiGiovanni BF. The
influence of foot position on stretching of the plantar fascia. Foot and
Ankle International.2007; 28 (7):815-822.
93. Harradine PD, Bevan LS. The effect of rearfoot eversion on maximal
hallux dorsiflexion. A preliminary study. Journal of the American Podiatric
Medical Association.2000; 90 (8):390-393.

78
94. Baan H, Drossaers-Bakker W, Dubbeldam R, Buurke J, Nene A, van de
Laar M. Flexor hallucis longus tendon rupture in RA-patients is
associated with MTP 1 damage and pes planus. BMC Musculoskeletal
Disorders.2007; 8: 110.
95. Grebing BR, Coughlin MJ. The effect of ankle position on the exam for
first ray mobility. Foot and Ankle International.2004; 25 (7):467-475.
96. Shrier I. Does stretching improve performance?: a systematic and critical
review of the literature. Clinical Journal of Sports Medicine.2004; 14
(5):267-273.
97. Duong B, Low M, Moseley AM, Lee RYW, Herbert RD. Time course of
stress relaxation and recovery in human ankles. Clinical
Biomechanics.2001; 16 (7):601-607.
98. Magnusson SP. Passive properties of human skeletal muscle during
stretch maneuvers: a review. Scandinavian Journal of Medicine and
Science in Sports.1998; 8 (2):65-77.
99. Roberts JM, Wilson K. Effect of stretching duration on active and passive
range of motion in the lower extremity. British Journal of Sports
Medicine.1999; 33 (4):259-63.
100. McNair PJ, Stanley SN. Effect of passive stretching and jogging on the
series elastic muscle stiffness and range of motion of the ankle joint.
British Journal of Sports Medicine.1996; 30 (4):313-317.
101. Gajdosik RL, Vander Linden DW, McNair PJ, Williams AK, Riggin TJ.
Effects of an eight-week stretching program on the passive-elastic
properties and function of the calf muscles of older women. Clinical
Biomechanics.2005; 20 (9):973-983.
79
102. Feland JB, Myrer JW, Schulthies SS, Fellingham GW, Measom GW. The
effect of duration of stretching of the hamstring muscle group for
increasing range of motion in people aged 65 years or older. Physical
Therapy.2001; 81 (5):1110-1117.
103. Maganaris CN. Tendon conditioning: artefact or property? Proceedings
Biological Sciences.2003; 270 Supplement 1:S39-42.
104. Taylor DC, Dalton JD, Jr., Seaber AV, Garrett WE, Jr. Viscoelastic
properties of muscle-tendon units. The biomechanical effects of
stretching. American Journal of Sports Medicine.1990; 18 (3):300-309.
105. Dananberg HJ. Manipulation of the ankle as a method of treatment for
ankle and foot pain. Journal of the American Podiatric Medical
Association.2004; 94 (4):395-399.
106. Pope R, Herbert R, Kirwan J. Effects of ankle dorsiflexion range and pre-
exercise calf muscle stretching on injury risk in army recruits. Australian
Journal of Physiotherapy.1998; 44 (3) :165-177.
107. Herbert RD, Gabriel M. Effects of stretching before and after exercising
on muscle soreness and risk of injury: systematic review. British Medical
Journal.2002; 325 (7362):468.
108. Park DY, Chou L. Stretching for prevention of Achilles tendon injuries: a
review of the literature. Foot and Ankle International.2006; 27 (12):1086-
1095.
109. Fowles JR, Sale DG, MacDougall JD. Reduced strength after passive
stretch of the human plantarflexors. Journal of Applied Physiology.2000;
89 (3):1179-1188.

80
110. Behm DG, Kibele A. Effects of differing intensities of static stretching on
jump performance. European Journal of Applied Physiology.2007;
101(5):587-594.
111. DiGiovanni BF, Nawoczenski DA, Lintal ME, Moore EA, Murray JC,
Wilding GE, et al. Tissue-specific plantar fascia-stretching exercise
enhances outcomes in patients with chronic heel pain. A prospective,
randomized study. Journal of Bone and Joint Surgery.2003; 85-
A(7):1270-1277.
112. Digiovanni BF, Nawoczenski DA, Malay DP, Graci PA, Williams TT,
Wilding GE, et al. Plantar fascia-specific stretching exercise improves
outcomes in patients with chronic plantar fasciitis. A prospective clinical
trial with two-year follow-up. Journal of Bone and Joint Surgery.2006; 88-
A (8):1775-1781.
113. McAtee R, Charland J. Facilitated Stretching. 3rd ed: Human Kinetics;
2007.
114. Mahieu NN, McNair P, De Muynck M, Stevens V, Blanckaert I, Smits N,
et al. Effect of static and ballistic stretching on the muscle-tendon tissue
properties. Medicine and Science in Sports Exercise.2007; 39 (3):494-
501.
115. Bressel E, McNair PJ. The effect of prolonged static and cyclic stretching
on ankle joint stiffness, torque relaxation, and gait in people with stroke.
Physical Therapy.2002; 82 (9):880-887.
116. McNair PJ, Dombroski EW, Hewson DJ, Stanley SN. Stretching at the
ankle joint: viscoelastic responses to holds and continuous passive
motion. Medicine and Science in Sports Exercise.2001; 33 (3):354-358.

81
117. Herbert R, Moseley A, Butler J, Gandevia S. Change in length of relaxed
muscle fascicles and tendons with knee and ankle movement in humans.
The Journal of Physiology.2002; 539 (2):637-645.
118. Blackburn J, Padua D, Weinhold P, Guskiewicz K. Comparison of triceps
surae structural stiffness and material modulus across sex. Clinical
Biomechanics.2006; 21 (2):159-167.
119. Blackburn JT, Riemann BL, Padua DA, Guskiewicz KM. Sex comparison
of extensibility, passive, and active stiffness of the knee flexors. Clinical
Biomechanics.2004; 19 (1):36-43.
120. Riemann BL, DeMont RG, Ryu K, Lephart SM. The Effects of Sex, Joint
Angle, and the Gastrocnemius Muscle on Passive Ankle Joint Complex
Stiffness. Journal of Athletic Trainer.2001; 36 (4):369-375.
121. Menz HB. Two feet, or one person? Problems associated with statistical
analysis of paired data in foot and ankle medicine. The Foot.2004; 14
(1):2-5.
122. Derr J. Valid paired data designs: make full use of the data without "
double-dipping". Journal of Orthopaedic and Sports Physical
Therapy.2006; 36 (2):42-4.
123. Allison G. Statistical and Clinical Interpretation of Research Results.
Journal of the American Podiatric Medical Association.2007; 97 (2):165-
170.
124. Sadeghi H, Allard P, Prince F, Labelle H. Symmetry and limb dominance
in able-bodied gait: a review. Gait and Posture.2000; 12 (1):34-45.
125. Maupas E, Paysant J, Martinet N, Andre J-M. Asymmetric leg activity in
healthy subjects during walking, detected by electrogoniometry. Clinical
Biomechanics.1999; 14 (6):403-411.

82
126. Sadeghi H. Local or global asymmetry in gait of people without
impairments. Gait and Posture.2003; 17 (3):197-204.
127. Razeghi M, Batt M. Foot type classification: a critical review of current
methods. Gait and Posture.2002; 15 (3):282-291.
128. Burns J, Keenan AM, Redmond A. Foot type and overuse injury in
triathletes. Journal of the American Podiatric Medical Association.2005;
95 (3):235-241.
129. Cain L, Nicholson L, Adams R, Burns J. Foot morphology and foot/ankle
injury in indoor football. Journal of Science and Medicine in Sport.2007;
10 (5):311-319.
130. Yates B, White S. The incidence and risk factors in the development of
medial tibial stress syndrome among naval recruits. American Journal of
Sports Medicine.2004; 32 (3):772-780.
131. Willems T, De Clercq D, Delbaere K, Vanderstraeten G, De Cock A,
Witvrouw E. A prospective study of gait related risk factors for exercise-
related lower leg pain. Gait and Posture.2006; 23 (1):91-98.
132. Esterman A, Pilotto L. Foot shape and its effect on functioning in Royal
Australian Air Force recruits. Part 2: Pilot, randomized, controlled trial of
orthotics in recruits with flat feet. Military Medicine.2005; 170 (7):629-
633.
133. Esterman A, Pilotto L. Foot shape and its effect on functioning in Royal
Australian Air Force recruits. Part 1: Prospective cohort study. Military
Medicine.2005; 170 (7):623-628.
134. Payne C, Oates M, Noakes H. Static stance response to different types
of foot orthoses. Journal of the American Podiatric Medical
Association.2003; 93 (6):492-498.

83
135. Mathieson I, Upton D, Prior TD. Examining the validity of selected
measures of foot type: a preliminary study. Journal of the American
Podiatric Medical Association.2004; 94 (3):275-281.
136. Urry SR, Wearing SC. Arch indexes from ink footprints and pressure
platforms are different. The Foot.2005; 15 (2):68-73.
137. Menz HB. Clinical hindfoot measurement: a critical review of the
literature. The Foot 1995; 5 (2):57-64.
138. Redmond A, Burns J, Crosbie J, Ouvrier R. An initial appraisal of the
validity of a criterion based, observational clinical rating system for foot
posture. Journal of Orthopaedic and Sports Physical Therapy.2001; 31:
160.
139. Keenan A, Redmond A, Horton M, Conaghan P, Tennant A. The foot
posture index: rasch analysis of a novel, foot-specific outcome measure.
Archives of Physical Medicine and Rehabilitation.2007; 88 (1):88-93.
140. Evans AM, Copper AW, Scharfbillig RW, Scutter SD, Williams MT.
Reliability of the foot posture index and traditional measures of foot
position. Journal of the American Podiatric Medical Association.2003; 93
(3):203-213.
141. McGraw K, Wong S. Forming Inferences About Some Intraclass
Correlation Coefficients. Psychological Methods.1996; 50 (1):30-46.
142. Wrobel J, Connolly J, Beach M. Associations between static and
functional measures of joint function in the foot and ankle. Journal of the
American Podiatric Medical Association.2004; 94 (6):535-541.
143. Harton FM, Weiskopf SA, Goecker RM. Sectioning the plantar fascia.
Effect on first metatarsophalangeal joint motion. Journal of the American
Podiatric Medical Association.2002; 92 (10):532-536.

84
144. Youdas J, Krause D, Hollman J, Harmsen W, Laskowski E. The influence
of gender and age on hamstring muscle length in healthy adults. The
Journal of Orthopaedic and Sports Physical Therapy.2005; 35 (4):246-
252.
145. Coughlin M, Jones C. Hallux valgus: demographics, etiology, and
radiographic assessment. Foot and Ankle International.2007; 28 (7):759-
777.
146. Harris M, Beeson P. Generalized hypermobility: is it a predisposing factor
towards the development of juvenile hallux abducto valgus? Part 2. The
Foot.1998; 8 (4): 203-209.
147. Maupas E, Paysant J, Datie AM, Martinet N, Andre JM. Functional
asymmetries of the lower limbs. A comparison between clinical
assessment of laterality, isokinetic evaluation and electrogoniometric
monitoring of knees during walking.Gait and Posture. 2002; 16 (3):304-
312.
148. Scharfbillig R, Evans A, Copper A, Williams M, Scutter S, Iasiello H, et al.
Criterion validation of four criteria of the foot posture index. Journal of the
American Podiatric Medical Association.2004; 94 (1):31-38.
149. Burns J, Crosbie J. Weight bearing ankle dorsiflexion range of motion in
idiopathic pes cavus compared to normal and pes planus feet.The Foot.
2005; 15 (2):91-94.
150. Song J, Hillstrom H, Secord D, Levitt J. Foot type biomechanics.
comparison of planus and rectus foot types. Journal of the American
Podiatric Medical Association.1996; 86 (1):16-23.
151. Franco A. Pes cavus and pes planus. Analyses and treatment. Physical
Therapy.1987; 67 (5):688-694.

85
152. Ledoux W, Shofer J, Ahroni J, Smith D, Sangeorzan B, Boyko E.
Biomechanical differences among pes cavus, neutrally aligned, and pes
planus feet in subjects with diabetes.Foot and Ankle International. 2003;
24 (11):845-850.
153. Folpp H, Deall S, Harvey LA, Gwinn T. Can apparent increases in
muscle extensibility with regular stretch be explained by changes in
tolerance to stretch?Australian Journal of Physiotherapy. 2006; 52
(1):45-50.
154. Kubo K, Kanehisa H, Kawakami Y, Fukunaga T. Influence of static
stretching on viscoelastic properties of human tendon structures in vivo.
Journal of Applied Physiology.2001; 90 (2):520-527.
155. Magnusson S, Narici M, Maganaris C, Kjaer M. Human tendon behaviour
and adaptation, in vivo. Journal of Physiology.2008; 586 (Pt 1):71-81.
156. Taylor DC, Brooks DE, Ryan JB. Viscoelastic characteristics of muscle:
passive stretching versus muscular contractions. Medicine and Science
in Sports and Exercise.1997; 29(12):1619-1624.
157. Morse C, Degens H, Seynnes O, Maganaris C, Jones D. The effect of
stretching on the passive stiffness of the human gastrocnemius muscle
tendon unit. Journal of Physiology.2008; 586 (1):97-106.
158. de Weijer V, Gorniak G, Shamus E. The effect of static stretch and
warm-up exercise on hamstring length over the course of 24 hours. The
Journal of Orthopaedic Sports and Physical Therapy.2003; 33(12):727-
733.
159. Vaillant J, Vuillerme N, Janvey A, Louis F, Braujou R, Juvin R, et al.
Effect of manipulation of the feet and ankles on postural control in elderly
adults. Brain Research Bulletin.2008; 75 (1):18-22.
86
160. Mueller M, Hastings M, Commean P, Smith K, Pilgram T, Robertson D.
Forefoot structural predictors of plantar pressures during walking in
people with diabetes and peripheral neuropathy. Journal of
Biomechanics.2003; 36 (7):1009-1017.
161. Landorf KB, Radford JA, Keenan AM, Redmond AC. Effectiveness of
Low-Dye Taping for the Short-term Management of Plantar Fasciitis.
Journal of the American Podiatric Medical Association.2005; 95 (6):525-
530.
162. Payne C, Munteanu S, Miller K. Position of the Subtalar Joint Axis and
Resistance of the Rearfoot to Supination. Journal of the American
Podiatric Medical Association.2003; 93 (2):131-135.
163. Loram ID, Maganaris CN, Lakie M. Paradoxical muscle movement in
human standing. Journal of Physiology.2004; 556 (Pt 3):683-689.
164. Loram ID, Maganaris CN, Lakie M. Human postural sway results from
frequent, ballistic bias impulses by soleus and gastrocnemius. Journal of
Physiology.2005; 564 (Pt 1):295-311.
165. Winter DA, Patla AE, Prince F, Ishac M, Gielo-Perczak K. Stiffness
control of balance in quiet standing. Journal of Neurophysiology.1998; 80
(3):1211-1221.
166. Winter DA, Patla AE, Rietdyk S, Ishac MG. Ankle muscle stiffness in the
control of balance during quiet standing. Journal of
Neurophysiology.2001; 85 (6):2630-2633.
167. Amis J, Jennings L, Graham D, Graham C. Painful heel syndrome:
radiographic and treatment assessment. Foot and Ankle.1998; (9):91-95.

87
168. Malliaras P, Cook J, Kent P. Reduced ankle dorsiflexion range may
increase the risk of patellar tendon injury among volleyball players.
Journal of Science and Medicine in Sport.2006; 9 (4):304-309.
169. Gabbe BJ, Bennell KL, Wajswelner H, Finch CF. Reliability of common
lower extremity musculoskeletal screening tests. Physical Therapy in
Sport.2004; 5 (2):90-97.
170. Gabbe BJ, Finch CF, Wajswelner H, Bennell KL. Predictors of lower
extremity injuries at the community level of Australian football. Clinical
Journal of Sports Medicine.2004; 14 (2):56-63.
171. Bennell K, Khan K, Matthews B, De Gruyter M, Cook E, Holzer K. Hip
and ankle range of motion and hip muscle strength in young female
ballet dancers and controls. British Journal of Sports Medicine.1999; 33
(5):340-346.
172. Collins N, Teys P, Vicenzino B. The initial effects of a Mulligan's
mobilization with movement technique on dorsiflexion and pain in
subacute ankle sprains. Manual Therapy.2004; 9 (2):77-82.
88
APPENDIX 1 Development of measurement tool: Weight bearing test set up
1.0 Description
The basis for the thesis originated from initial trials to develop a weight bearing
test to quantify passive MTPJ1 extension during quiet standing. Initial focus was
to determine the influence of foot orthoses on MTPJ1 ROM and stiffness, and
whether certain foot orthoses design parameters would influence MTPJ1
mechanics. To achieve this, a weight-bearing model was required and
produced. The result utilised a hand held force transducer (McMesin® AGF),
and battery operated (9V) potentiometer attached to a hinged wooden platform
which supported the subject’s body weight. A fifty centimetre adjustable backing
plate extended vertically and was positioned to rest on the subjects calves in an
attempt to reduce postural sway.
Visual alignment of the MTPJ1 axis was made with the hallux resting on the
anterior platform. The force transducer was maintained orthogonal to the
platform whilst the hallux was moved through its extension ROM and back to
neutral at a relatively constant velocity. Simultaneous angle and force data was
captured via a data acquisition board (National Instruments® BNC 2110) and
DAQ Card (National Instruments® -6024E) to a laptop computer. See Fig1. Data
was processed using Labview® software Version 7 sampling at 100Hz with raw
data filtered using a fourth order Butterworth low pass.

89
Figure 1: Weight-bearing set up to measure MTPJ1 ROM extension and the influence of foot orthoses and different design parameters.
1.1 Calibration
Calibration of the potentiometer was performed using a standard goniometer
with recordings of voltage output taken twice at ten degree increments, (0-90
degrees). Linear regression analyses of the data showed a line of best fit
relationship between angle and voltage R2=0.998, and R2=0.9972. See Fig 2.
y = -38.388x + 328.4
R2 = 0.9972
y = -39.143x + 327.03
R2 = 0.998
0102030405060708090
100
5 6 7 8 9
Figure 2: Linear regression model detailing relationship between angle and voltage output measured on two occasions. x axis (voltage); y axis (angle in degrees)
Angle
Force DAQ Board
Force Transducer Potentiometer

90
Further testing to determine the voltage change between angles was
determined. A relatively constant offset (0.204 V) was noted across angles 0-90
degrees. The change in the battery charge was consistent across these angles
with around 0.5% change equating to 0.3 degrees over around 70 degree
range. See Fig 3.
y = -0.0048x + 0.204
R2 = 0.6024
0
0.05
0.1
0.15
0.2
0.25
1 2 3 4 5 6 7 8 9 10
Figure 3: Changes in potentiometer voltage outputs across each angle. (1=0degrees and 10=90 degrees.)
The results demonstrated the voltage output had around 2% drift over 100
degrees; therefore an offset was required to be determined prior to each testing
session. To do these two recordings of battery output were determined at
known angles as measured by the standard goniometer. The chosen angles
were zero and 45 degrees which could be subtracted to determine the angle
data for subsequent trials. Calibration was performed prior to testing each
subject.
1.2 Reliability
Initially five asymptomatic female volunteers participated in the trial which
measured MTPJ1 extension in weight bearing as described above. A total of 35
joint cycles were performed in seven blocks of five joint extensions with the
variable; MTPJ1 angle at 30 N of force derived. Data reduction saw the mean of
the three middle cycles for each block determined with further analyses made
on the mean of blocks 2, 3 and 4. A same day test re-test design was utilised
as summarised in Table 1. Reliability analysis was performed using an
Intraclass Correlation Coefficient statistic ICC model (3,1) .(141)

91
Table 1: Weight bearing MTPJ1 extension at 30N force/degrees measured in five asymptomatic adults. Same day test re-test with the mean of blocks 2,3,4 recorded and standard deviation (SD) and range across subjects.
Subject
Test1
Test2
Mean Difference
Left Foot 1 25.28 33.17 7.89
2 37.89 35.67 -2.22 3 56.83 50.50 -6.33 4 46.28 64.83 18.55 5 59.06 55.50 -3.56
Right Foot 1 32.78 28.00 -4.78 2 28.33 14.00 -14.33 3 58.00 64.67 6.67 4 53.67 55.67 2 5 67.11 56.00 -11.11
Mean, (SD), [Range]
46.52 (14.6) [25.28 - 67.11]
45.80 (17.1) [14 - 64.83]
The results demonstrated a large degree of variation with in some subjects
across trials and blocks, as evident in the mean test re-test values. Across all
subjects the mean difference between trials one and two performed on the
same day was 7.74 degrees (SD 9.8).
Reliability analysis between trial one and two demonstrated an ICC 3, 1 of 0.811,
with 95% Confidence Limit (0.370-0.954) and Typical error in degrees of 6.91.
1.3 Intervention
Subsequent pilot testing involved subject’s weight bearing on standard, non-
moulded, high density Ethyl Vinyl Acetate foot orthoses (ICB Medical
Orthotics®, ICB Medical Distributors P/L, Kirrawee). Two orthotic designs were
tested, one with no modification and the second with a first metatarsal cut out.
The latter is suggested to improve MTPJ1 extension by allowing first metatarsal
plantar flexion. Subjects were tested using the methodology described above
with the derived variable MTPJ1 angle at 30N force recorded with the mean of
blocks 2,3 and 4 used for further analyses. Table 2 summarises these results.

92
Table 2: Weight bearing MTPJ1 extension; degrees at 30N force, quiet standing versus a standard orthotic versus an orthotic with a first metatarsal cut out. Mean of blocks 2,3,4 represented and standard deviation (SD) across subjects.
Subject Baseline Standard Orthotic
Orthotic Cut Out
Left Foot 1 25.28 26.67 29.67 2 37.89 43 28.17 3 56.83 46.5 53.33 4 46.28 44.67 54.67 5 59.06 54.33 45 Right Foot 1 32.78 34 24.67 2 28.33 11.33 16.83 3 58 53.67 57.33 4 53.67 40.83 62.83 5 67.11 55.83 62.5
Mean, (SD), [Range]
46.52 (14.59)
[25.28 - 67.11]
41.08 (13.91)
[11.33 - 55.83]
43.5 (17.13)
[16.83 - 62.83]
Table 2 demonstrates inconsistencies between standing, standing on a
standard orthoses and standing on an orthoses hypothesised to increase
MTPJ1 ROM. Whilst the between subject variability is to be expected there was
no obvious direction with the intervention. Some subjects demonstrated a
decrease in MTPJ1 ROM with the orthotic conditions whilst others
demonstrated improvements. The mean difference between the standard
orthotic condition and modified orthotic condition compared to quiet standing
was 5.4 degrees (SD 7.2) and 3.0 degrees (SD 8.2) respectively.
What was demonstrated was the “effect size”, if any, was comparable with the
measurement error derived from the previous same day test re-test data and
not in keeping with the working hypotheses that orthoses improve MTPJ1
mechanics.
1.4 Foot Type
Individual response to the orthotic conditions could in part be contributed to
specific foot types i.e. pronation-supination continuum. Two subjects were
chosen to voluntarily participate in testing based on their individual foot posture
as determined by the Foot Posture Index (FPI-6). Comparisons were made
between a pronated foot type (Foot Posture Index: [9]) and a supinated foot

93
type (Foot Posture Index: [-3]). Subjects were tested whilst weight bearing as
previously described in quiet standing as well as standing on a standard
prefabricated orthotic device (ICB Medical Orthotics®, ICB Medical Distributors
P/L, Kirrawee).
Further to this the effect of Low Dye taping of the foot was tested to see if
changes to MTPJ1 mechanics could be detected. The Low Dye taping
technique is a commonly used therapy to assess the effects of supporting the
medial longitudinal arch of the foot. It has been shown to be effective in the
short term management of plantar fasciitis.(161)
The variables derived were MTPJ1 extension range in degrees at 30N of force.
The mean of blocks 2,3 and 4 were used for further analysis. Table 3 provides a
summary.
Table 3: Effects of foot posture on MTPJ1 weight bearing extension. Range of motion in degrees at 30N force with the mean of block 2,3,4 recorded; Subject 1 : Supinated foot FPI-6 [-3], and Subject 2 pronated foot FPI-6 [9].
Subject Baseline Standard Orthotic
Taping
Left Foot 1 33.88 19.83 32.05 2 50.38 55.66 43.5 Right Foot 1 22.16 13.55 29.56
2 52.05 62.33 58.33 The comparison of foot type and the effects of orthoses and taping revealed an
interesting phenomenon. It showed the supinated foot type actually had a
significant reduction in hallux ROM with the orthotic condition, whereas the
pronated foot type demonstrated a slight increase in MTPJ1 ROM. Foot posture
has been shown to correlate weakly to the location of the subtalar joint axis
(r2~0.30) and resistance to supinate the foot.(162) Therefore it can be
hypothesised that the supinated foot type tested may have had a more lateral
orientation of the subtalar joint axis although this was not assessed. In essence
the foot orthotic in this foot type was creating an increased supination moment
across the subtalar joint resulting in increased lateral instability. To compensate
this and maintain forefoot ground contact, greater muscle recruitment may have
been responsible for limiting hallux extension particularly the long plantar

94
flexors, peroneus longus, flexor hallucis longus, flexor digitorum longus. This
was not tested or controlled for.
Muscle recruitment of the lower leg muscles has been described in the literature
during quiet standing.(163-166) As the centre of gravity passes anterior to the
ankle joint axis recruitment of the plantar flexors, particularly the gastrocsoleus
muscle complex is required to maintain equilibrium. Conversely as the centre of
gravity passes posteriorly to the ankle joint the anterior leg muscles, namely
tibialis anterior is recruited to maintain equilibrium. The relationship between
gastrocsoleus muscle stiffness and MTPJ1 ROM has been described.(20,21,90)
From the above pilot work it was hypothesised that moving the hallux through
its ROM with a hand held force transducer in relaxed stance produced small
posterior – anterior acceleration to the centre of mass. It is plausible that these
perturbations produce compensatory postural muscle activation, influencing
hallux ROM and partially accounting for the error between trials.
1.5 Postural sway
To explore this hypothesis further a single subject design investigated the effect
of postural sway on forces required to dorsi flex the hallux and stiffness
(instantaneous angle divided by force) at 20 degrees extension. The subject
was measured in four postural positions, namely standard (quiet stance), self
selected maximum backward, maximum forward and maximum lateral. Whilst
the subject maintained these postural positions the hallux was moved to 20
degrees extension and the derived variables Force (N) and stiffness were
recorded. Table 4 provides a summary.
Table 4: Posture position and effect on MTPJ1. Force (N) and stiffness with the hallux at 20 degrees extension if four postural positions during quiet standing (baseline), maximum forward, maximum backwards and maximum lateral.
Posture Baseline Backward Forward Lateral
Force (N) Left Foot 18.71 18.38 34.47 15.97 Right Foot 25.01 23.1 36.1 23.22 Stiffness* Left Foot 0.25 0.31 0.59 0.11 Right Foot 0.39 0.36 0.71 0.37
*stiffness: defined as the as the ratio of change in force to change in displacement determined using a linear best fit model.

95
These data reveal large increases in force required to dorsi flex the hallux with a
forward postural position together with increased joint stiffness, most likely due
to increased tension in the gastrocsoleus muscle complex, tendo Achilles and
plantar aponeurosis. Muscle recruitment appeared evident to maintain the body
from falling forward with marked effects on MTPJ1 stiffness.
1.6 Development of research question
The above pilot work led to the further investigation of the inter relationship of
the posterior leg muscle group and particularly the correlation between the
Tendo Achilles, plantar aponeurosis and MTPJ1 mechanics.
As the weight bearing model was deemed unreliable and not sensitive enough
to detect meaningful change, a non weight-bearing device was derived. The
custom designed non weight bearing set up allowed testing of MTPJ1 extension
across ankle joint positions to represent varying loads through the Achilles
tendo and plantar aponeurosis. Reliability testing of this device is presented in
full within the main body of the thesis as to the effects of calf muscle tendon
stretching on MTPJ1 extension.
Further insight into the perturbation effects of measuring hallux ROM in weight-
bearing is an area for further investigation and could be achieved by collecting
centre of pressure (COP) data via a force platform concomitantly with hallux
ROM and electromyography activity.

96
APP
END
IX 2
R
aw d
ata
MTP
J1 C
ycle
s
Sx
Sex
Age
W
BLT
L
Mea
n W
BLT
R
Mea
n B
MI
Sequ
ence
1
M
47
47.7
45
.7
46.6
46
.67
43.7
43
.7
44.7
44
.03
24.2
AB
C
2 F
47
33.4
35
.2
35.4
34
.67
36.9
36
.7
36.7
36
.77
24.9
BA
C
3 F
29
45.4
47
45
.1
45.8
3 40
.3
37.8
38
.2
38.7
7 19
.8
CBA
4
F 26
54
.3
51
52.6
52
.63
48.9
47
.7
47.7
48
.10
24.2
AC
B
5
F 22
44
.8
44.1
47
.1
45.3
3 43
.8
44.4
43
.9
44.0
3 18
.8
BCA
6 F
34
22.6
22
.7
23.4
22
.90
23.1
23
.1
23
23.0
7 24
.7
CAB
A
JN: R
OM
at 1
0N
Sx
C
ycle
1
2 3
4 5
6 7
8 9
10
11
12
13
14
15
1L
18
.5
23.5
24
24
24
23
23
23
.5
23
21.5
23
25
22
.5
24
24.5
1R
20
28.5
34
37
38
.5
32.5
37
.5
37
34.5
34
33
33
.5
35
38.5
32
.5
2L
22
17
.5
26
26.5
28
.5
24
28
28.5
28
29
29
.5
37
29.5
32
.5
32.5
2R
23
19
18
23.5
25
26
.5
24.5
23
.5
21.5
23
.5
32
31
25.5
24
.5
22.5
3L
29
35
38
35.5
35
.5
37.5
44
39
37
35
36
.5
37.5
42
37
.5
38
3R
36
39
40
.5
39
39
45.5
44
.5
48.5
44
44
.5
38
43.5
39
38
39
4L
7.5
11.5
14
11
11
10
14
.5
10
10.5
11
11
12
.5
10.5
12
11
4R
8.5
21.5
17
.5
15.5
15
.5
17
17.5
17
.5
17
18
18
17
16
20.5
22
5L
7 15
.5
14.5
12
18
17
.5
16.5
23
.5
18.5
20
18
.5
20.5
21
15
.5
16.5
5R
8 9
10
6.5
6.5
12
12
10
12
10.5
10
.5
8.5
9.5
12.5
9
6L
8
15
18
19
18.5
17
20
.5
19
23.5
21
.5
24.5
24
.5
24
21.5
24
6R
15.5
19
15
.5
18
24
23
24.5
22
.5
25.5
25
23
28
25
30
.5
24
AJN
: RO
M a
t 30N
Sx
Cyc
le
1 2
3 4
5 6
7 8
9 10
11
12
13
14
15
1L
34.5
39
.5
39
39.5
39
.5
41
39
40
40
42
41
44
42
42
42
1R
41
49
51
.5
53.5
53
52
.5
53.5
53
.5
54
52
51.5
52
.5
54.5
53
.5
52.5
2L
53.5
56
56
.5
56.5
57
56
60
59
58
57
60
60
60
60
58
2R
59.5
60
.5
61.5
61
.5
58.5
58
60
.5
56
57
60
60
58.5
57
.5
60.5
59
3L
56.5
62
61
61
.5
60.5
63
64
64
63
63
62
64
63
.5
64.5
64
.5

97
3R
66
.5
68.5
69
69
69
.5
70
70.5
70
69
70
70
70
.5
69
70
68.5
4L
28
34
37.5
39
.5
41.5
40
47
39
32
.5
35.5
35
.5
39.5
33
35
34
.5
4R
40
.5
52.5
53
.5
55.5
52
52
.5
53
50.5
57
.5
55
53.5
54
56
55
.5
58
5L
26
31
.5
33
31
36.5
35
36
.5
38.5
36
.5
36
38
38
36.5
36
.5
37
5R
22
24
.5
21
22.5
21
.5
26
27.5
24
.5
26
26
24
24
25
26
24
6L
27
.5
30.5
32
36
34
.5
35
35.5
39
39
.5
41.5
42
.5
42.5
43
44
44
6R
33.5
34
.5
34
34.5
38
.5
38
42
40.5
42
.5
42.5
45
44
.5
45.5
48
.5
45
AJD
F: R
OM
at 1
0N
Sx
C
ycle
1
2 3
4 5
6 7
8 9
10
11
12
13
14
15
1L
0
0 0
0 0
1 1
1 0
0 1
1 0
0 0
1R
0
1.5
1.5
2 2
1.5
3 2
3 3.
5 3
4.5
4 6
6.5
2L
2.
5 4
4 4
4.5
4.5
5 4
4.5
4.5
3 4
4 4.
5 4.
5 2R
4 8.
5 5
3 3
3.5
3 3
3.5
3.5
6.5
2 3
3.5
3 3L
6 10
8
7.5
7.5
8 7.
5 9
12.5
6.
5 8.
5 8.
5 10
.5
10
11.5
3R
10
11
9.5
10
9.5
9 9
10
17
17
17
13
11.5
9.
5 11
4L
1 0
0 0
0 0
0 0
0 0
0 0
0 0
0 4R
0 0
0 0
1 0
0 0
0 0
0 0
1 0
0 5L
2 1
0 0
0 0
0 0
0 0
0 0
0 0
0 5R
1.5
1.5
1 0
1 1
1 1
1 0
0 0
0 1
1 6L
1 0
0.5
0.5
0 0.
5 0
0 0
1 1.
5 1.
5 0
0 1.
5 6R
1.5
1 0
0 1
0 0
0 2
0 0
0 0
0 0
AJD
F: R
OM
at 3
0N
Sx
C
ycle
1
2 3
4 5
6 7
8 9
10
11
12
13
14
15
1L
3
5 5
5 6
5.5
7 6
6 8
8.5
8.5
8.5
8.5
8 1R
6.5
10.5
10
.5
11.5
11
.5
12
12.5
12
.5
12.5
13
12
.5
13
13.5
14
14
.5
2L
16
.5
25.5
27
.5
27.5
30
.5
30
26.5
31
.5
32
31.5
30
.5
32.5
32
.5
30.5
30
2R
17.5
20
.5
19.5
19
19
.5
22.5
20
20
.5
21.5
23
20
20
.5
19
19.5
22
.5
3L
23
.5
30.5
29
28
.5
28.5
30
28
.5
30
31.5
28
.5
32
29.5
32
.5
31
30
3R
27
.5
28.5
26
.5
29
29
29
28
28
34.5
33
.5
33
32
33
31
31
4L
10
7.
5 6
6 5.
5 5.
5 6.
5 6
7 8
6.5
5.5
7.5
4.5
7 4R
6.5
5.5
6 7.
5 8.
5 10
8
8 7
9 10
7.
5 8.
5 7.
5 8.
5 5L
8 8
7 7.
5 6
5.5
4.5
4.5
5 5
4.5
5 4.
5 4.
5 5
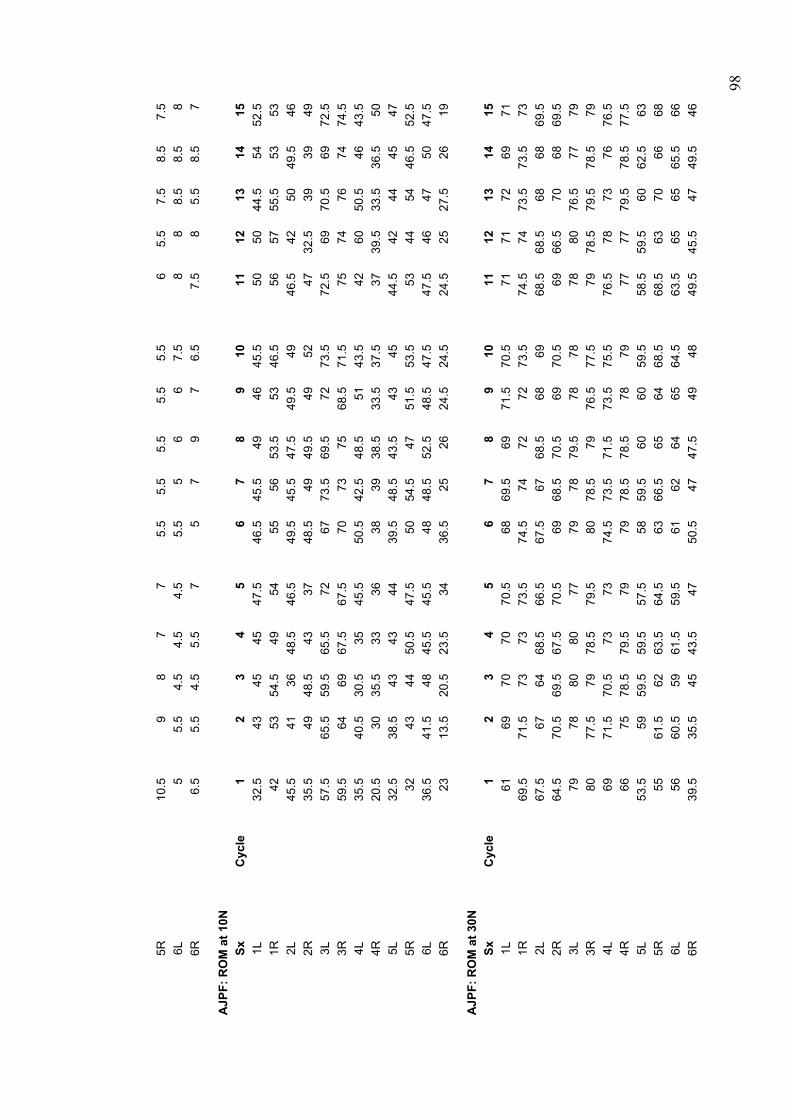
98
5R
10
.5
9 8
7 7
5.5
5.5
5.5
5.5
5.5
6 5.
5 7.
5 8.
5 7.
5 6L
5 5.
5 4.
5 4.
5 4.
5 5.
5 5
6 6
7.5
8 8
8.5
8.5
8 6R
6.5
5.5
4.5
5.5
7 5
7 9
7 6.
5 7.
5 8
5.5
8.5
7
A
JPF:
RO
M a
t 10N
Sx
Cyc
le
1 2
3 4
5 6
7 8
9 10
11
12
13
14
15
1L
32.5
43
45
45
47
.5
46.5
45
.5
49
46
45.5
50
50
44
.5
54
52.5
1R
42
53
54.5
49
54
55
56
53
.5
53
46.5
56
57
55
.5
53
53
2L
45
.5
41
36
48.5
46
.5
49.5
45
.5
47.5
49
.5
49
46.5
42
50
49
.5
46
2R
35
.5
49
48.5
43
37
48
.5
49
49.5
49
52
47
32
.5
39
39
49
3L
57
.5
65.5
59
.5
65.5
72
67
73
.5
69.5
72
73
.5
72.5
69
70
.5
69
72.5
3R
59.5
64
69
67
.5
67.5
70
73
75
68
.5
71.5
75
74
76
74
74
.5
4L
35
.5
40.5
30
.5
35
45.5
50
.5
42.5
48
.5
51
43.5
42
60
50
.5
46
43.5
4R
20.5
30
35
.5
33
36
38
39
38.5
33
.5
37.5
37
39
.5
33.5
36
.5
50
5L
32
.5
38.5
43
43
44
39
.5
48.5
43
.5
43
45
44.5
42
44
45
47
5R
32
43
44
50.5
47
.5
50
54.5
47
51
.5
53.5
53
44
54
46
.5
52.5
6L
36.5
41
.5
48
45.5
45
.5
48
48.5
52
.5
48.5
47
.5
47.5
46
47
50
47
.5
6R
23
13
.5
20.5
23
.5
34
36.5
25
26
24
.5
24.5
24
.5
25
27.5
26
19
A
JPF:
RO
M a
t 30N
Sx
Cyc
le
1 2
3 4
5 6
7 8
9 10
11
12
13
14
15
1L
61
69
70
70
70.5
68
69
.5
69
71.5
70
.5
71
71
72
69
71
1R
69
.5
71.5
73
73
73
.5
74.5
74
72
72
73
.5
74.5
74
73
.5
73.5
73
2L
67.5
67
64
68
.5
66.5
67
.5
67
68.5
68
69
68
.5
68.5
68
68
69
.5
2R
64
.5
70.5
69
.5
67.5
70
.5
69
68.5
70
.5
69
70.5
69
66
.5
70
68
69.5
3L
79
78
80
80
77
79
78
79.5
78
78
78
80
76
.5
77
79
3R
80
77
.5
79
78.5
79
.5
80
78.5
79
76
.5
77.5
79
78
.5
79.5
78
.5
79
4L
69
71
.5
70.5
73
73
74
.5
73.5
71
.5
73.5
75
.5
76.5
78
73
76
76
.5
4R
66
75
78
.5
79.5
79
79
78
.5
78.5
78
79
77
77
79
.5
78.5
77
.5
5L
53
.5
59
59.5
59
.5
57.5
58
59
.5
60
60
59.5
58
.5
59.5
60
62
.5
63
5R
55
61
.5
62
63.5
64
.5
63
66.5
65
64
68
.5
68.5
63
70
66
68
6L
56
60.5
59
61
.5
59.5
61
62
64
65
64
.5
63.5
65
65
65
.5
66
6R
39
.5
35.5
45
43
.5
47
50.5
47
47
.5
49
48
49.5
45
.5
47
49.5
46

99
-2.164 .834 <.0001 S-2.525 .834 <.0001 S-.361 .834 .5641
Mean Diff. Crit. Diff. P-ValueAve 23&4, ave T789Ave 23&4, Ave T12-14ave T789, Ave T12-14
Scheffe for ClustersEffect: Category for ClustersSignificance Level: 5 %
APPENDIX 3 Summary of Analysis of Variance Analyses: MTPJ1 cycles.
In the assessment below the ANOVA reports a significant increase between the
means of cycles (T2,3,4) and (T7,8,9). Also of note is that there was not a
significant difference between the mean of cycles T7,8,9 and T12,13,14. Also
demonstrated is a significant interaction between Ankle joint position and cycles
(clusters) (p=0.0031) indicating the effect of the clusters is different depending
on ankle joint position. A further two way ANOVA is presented below to declare
where the difference lies.
1 18416.807 18416.807 55.921 <.0001 55.921 1.0002 89326.030 44663.015 135.616 <.0001 271.231 1.0002 1507.255 753.628 2.288 .1094 4.577 .437
66 21736.115 329.3352 268.627 134.313 32.902 <.0001 65.804 1.0002 16.598 8.299 2.033 .1350 4.066 .4004 68.568 17.142 4.199 .0031 16.797 .9254 36.112 9.028 2.212 .0711 8.846 .632
132 538.855 4.082
DF Sum of Squares Mean Square F-Value P-Value Lambda Pow erLoadVarAnkleLoad * VarAnkleSubject(Group)Category for ClustersCategory for Clusters * LoadCategory for Clusters * VarAnkleCategory for Clusters * Load * VarAnkleCategory for Clusters * Subject(Group)
ANOVA Table for Clusters
12 2.639 3.594 1.03812 2.861 4.028 1.16312 2.861 3.966 1.14512 21.986 9.723 2.80712 25.125 10.734 3.09912 25.708 9.996 2.88612 44.597 12.806 3.69712 49.736 12.839 3.70612 48.931 13.441 3.88012 13.167 9.844 2.84212 13.944 10.635 3.07012 14.806 10.875 3.13912 45.917 14.673 4.23612 48.306 13.094 3.78012 49.264 13.176 3.80412 67.347 10.621 3.06612 68.667 8.857 2.55712 69.236 9.006 2.600
Count Mean Std. Dev. Std. Err.10N, DF, Ave 23&410N, DF, ave T78910N, DF, Ave T12-1410N, neutral, Ave 23&410N, neutral, ave T78910N, neutral, Ave T12-1410N, PF, Ave 23&410N, PF, ave T78910N, PF, Ave T12-1430N, DF, Ave 23&430N, DF, ave T78930N, DF, Ave T12-1430N, neutral, Ave 23&430N, neutral, ave T78930N, neutral, Ave T12-1430N, PF, Ave 23&430N, PF, ave T78930N, PF, Ave T12-14
Means Table for ClustersEffect: Category for Clusters * Load * VarAnkle

100
Two way ANOVA split by ankle joint position:
The assessment below compares the influence of ankle joint position, namely
ankle joint dorsiflexion and ankle joint plantar flexion on the derived variables
from cycles 2,3,4; 7,8,9 and 12,13,14. The two way ANOVA demonstrates a
significant difference between cycles 2,3,4 and 12,13,14 for ankle joint
dorsiflexion, whilst ankle joint plantar flexion demonstrates a significant
difference between cycles 2,3,4 and 7,8,9 as well as between cycles 2,3,4 and
12,13,14. Importantly for both ankle joint positions there was no significant
difference between cycles 7,8,9 and 12,13,14, supporting the theory that joint
conditioning is mostly achieved after 6 cycles.
1 2251.951 2251.951 12.219 .0020 12.219 .93222 4054.506 184.2962 10.410 5.205 4.578 .0156 9.156 .7512 6.114 3.057 2.689 .0791 5.377 .495
44 50.031 1.137
DF Sum of Squares Mean Square F-Value P-Value Lambda Pow erLoadSubject(Group)Category for ClustersCategory for Clusters * LoadCategory for Clusters * Subject(Group)
ANOVA Table for ClustersSplit By: VarAnkleCell: DF
-.500 .780 .2777-.931 .780 .0157 S-.431 .780 .3840
Mean Diff. Crit. Diff . P-ValueAve 23&4, ave T789Ave 23&4, Ave T12-14ave T789, Ave T12-14
Scheffe for ClustersEffect: Category for ClustersSignificance Level: 5 %Split By: VarAnkleCell: DF
1 7684.556 7684.556 20.291 .0002 20.291 .99522 8331.796 378.7182 160.964 80.482 13.197 <.0001 26.394 .9982 44.908 22.454 3.682 .0332 7.364 .644
44 268.332 6.098
DF Sum of Squares Mean Square F-Value P-Value Lambda Pow erLoadSubject(Group)Category for ClustersCategory for Clusters * LoadCategory for Clusters * Subject(Group)
ANOVA Table for ClustersSplit By: VarAnkleCell: PF
-3.229 1.806 .0002 S-3.111 1.806 .0004 S
.118 1.806 .9864
Mean Diff. Crit. Diff. P-ValueAve 23&4, ave T789Ave 23&4, Ave T12-14ave T789, Ave T12-14
Scheffe for ClustersEffect: Category for ClustersSignificance Level: 5 %Split By: VarAnkleCell: PF

101
Three factor repeated measures ANOVA:
The following ANOVA is an assessment of the effect of cycles 7,8,9 against
ankle joint position and loads, namely 10 and 30 N. Of note is that the trials
have no systematic effect on the values, main effect p= 0.95.
1 16977.894 16977.894 51.505 <.0001 51.505 1.0002 93305.322 46652.661 141.527 <.0001 283.054 1.0002 1355.905 677.953 2.057 .1360 4.113 .396
66 21756.097 329.6382 .447 .223 .055 .9461 .111 .0582 1.572 .786 .195 .8231 .390 .0794 37.241 9.310 2.310 .0612 9.238 .6554 5.796 1.449 .359 .8371 1.438 .129
132 532.111 4.031
DF Sum of Squares Mean Square F-Value P-Value Lambda Pow erLoadVarAnkleLoad * VarAnkleSubject(Group)Category for T789Category for T789 * LoadCategory for T789 * VarAnkleCategory for T789 * Load * VarAnkleCategory for T789 * Subject(Group)
ANOVA Table for T789
12 2.458 3.158 .91212 2.500 3.529 1.01912 3.625 5.511 1.59112 25.583 11.016 3.18012 25.208 11.518 3.32512 24.583 10.029 2.89512 50.042 13.436 3.87912 50.000 12.767 3.68612 49.167 12.867 3.71412 13.250 9.666 2.79012 13.958 10.524 3.03812 14.625 11.804 3.40712 49.083 13.247 3.82412 47.875 13.094 3.78012 47.958 13.471 3.88912 68.542 9.235 2.66612 68.750 9.054 2.61412 68.708 8.398 2.424
Count Mean Std. Dev. Std. Err.10N, DF, T710N, DF, T810N, DF, T910N, neutral, T710N, neutral, T810N, neutral, T910N, PF, T710N, PF, T810N, PF, T930N, DF, T730N, DF, T830N, DF, T930N, neutral, T730N, neutral, T830N, neutral, T930N, PF, T730N, PF, T830N, PF, T9
Means Table for T789Effect: Category for T789 * Load * VarAnkle
-17.731 4.933 <.0001 SMean Diff . Crit. Diff . P-Value
10N, 30N
Scheffe for T789Effect: LoadSignificance Level: 5 %
-28.313 7.578 <.0001 S-50.799 7.578 <.0001 S-22.486 7.578 <.0001 S
Mean Diff. Crit. Diff. P-ValueDF, neutralDF, PFneutral, PF
Scheffe for T789Effect: VarAnkleSignificance Level: 5 %
.111 .828 .9464
.049 .828 .9895-.063 .828 .9827
Mean Diff . Crit. Diff. P-ValueT7, T8T7, T9T8, T9
Scheffe for T789Effect: Category for T789Significance Level: 5 %
Analysis of cycles 7,8,9:
The following assessment demonstrates the mean and 95% confidence limits
for cycles 7,8,9 for derived variables ankle joint neutral, dorsiflexion and plantar
flexion across loads 10 and 30 Newtons. The fact that the 95% confidence limits
includes zero demonstrates there is no systematic difference between trials
7,8,9.

102
-5 -4 -3 -2 -1 0 1 2 3 4
Diff T7-9
PF, 30NPF, 10Nneutral, 30Nneutral, 10NDF, 30NDF, 10N
Cell Point ChartSplit By: VarAnkle, LoadError Bars: 95% Confidence Interval
Typical error is determined as the standard deviation of the difference scores
divided by the square root of the sample (i.e. 3) minus one. The typical error of
the difference between cycles 7,8,9 equals 3.297 / 1.4142 = 2.3 degrees, which
is relatively small given the fact that the variables are derived from the average
of cycles 7,8,9. 2.3 degrees represents the largest difference between cycles
7,8,9.
-.049 3.297 .389 72 -14.500 8.500 01.167 2.666 .770 12 -1.000 8.000 01.375 2.423 .699 12 -1.000 6.500 0
-1.000 2.788 .805 12 -7.000 3.000 0-1.125 4.811 1.389 12 -14.500 4.500 0-.875 4.052 1.170 12 -5.500 8.500 0.167 1.723 .497 12 -2.500 3.000 0
Mean Std. Dev. Std. Error Count Minimum Maximum # MissingDiff T7-9, TotalDiff T7-9, DF, 10NDiff T7-9, DF, 30NDiff T7-9, neutral, 10NDiff T7-9, neutral, 30NDiff T7-9, PF, 10NDiff T7-9, PF, 30N
Descriptive StatisticsSplit By: VarAnkle, Load
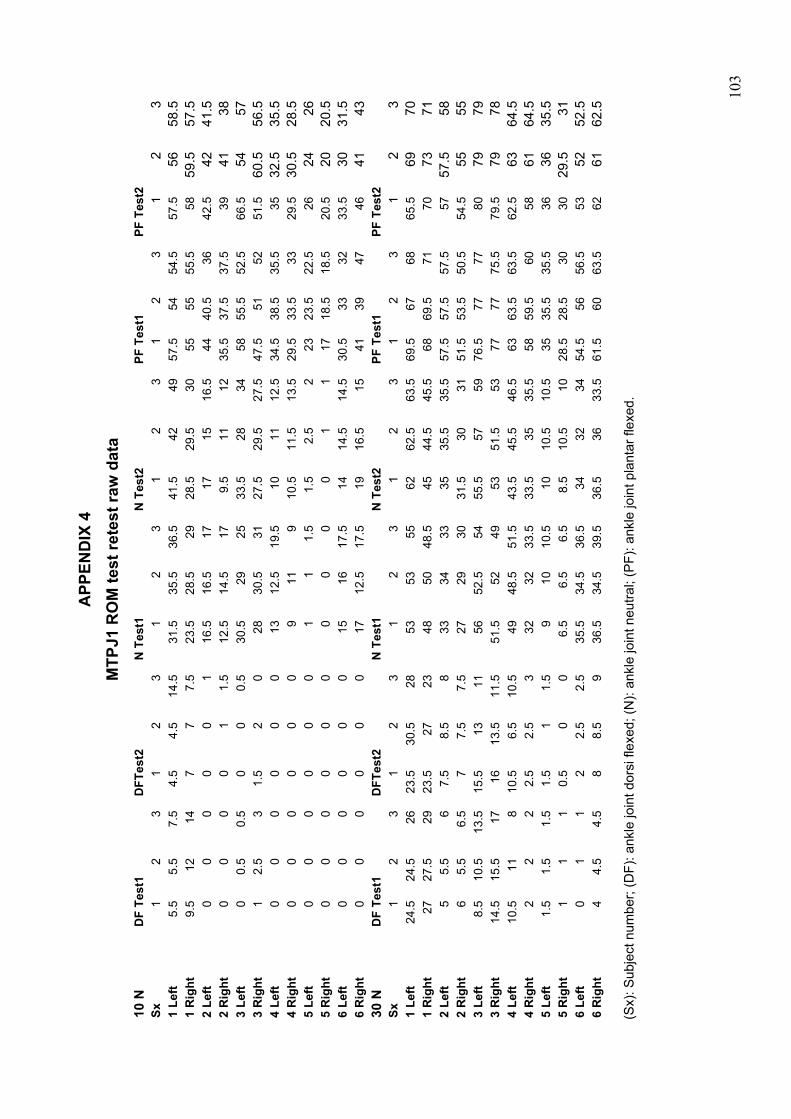
10
3
APP
END
IX 4
M
TPJ1
RO
M te
st re
test
raw
dat
a 10
N
DF
Test
1 D
FTes
t2
N T
est1
N
Tes
t2
PF T
est1
PF
Tes
t2
Sx
1 2
3 1
2 3
1 2
3 1
2 3
1 2
3 1
23
1 Le
ft 5.
5 5.
5 7.
5 4.
5 4.
5 14
.5
31.5
35
.5
36.5
41
.5
42
49
57.5
54
54
.5
57.5
56
58.5
1
Rig
ht
9.5
12
14
7 7
7.5
23.5
28
.5
29
28.5
29
.5
30
55
55
55.5
58
59
.557
.5
2 Le
ft 0
0 0
0 0
1 16
.5
16.5
17
17
15
16
.5
44
40.5
36
42
.5
4241
.5
2 R
ight
0
0 0
0 1
1.5
12.5
14
.5
17
9.5
11
12
35.5
37
.5
37.5
39
41
38
3 Le
ft 0
0.5
0.5
0 0
0.5
30.5
29
25
33
.5
28
34
58
55.5
52
.5
66.5
54
57
3 R
ight
1
2.5
3 1.
5 2
0 28
30
.5
31
27.5
29
.5
27.5
47
.5
51
52
51.5
60
.556
.5
4 Le
ft 0
0 0
0 0
0 13
12
.5
19.5
10
11
12
.5
34.5
38
.5
35.5
35
32
.535
.5
4 R
ight
0
0 0
0 0
0 9
11
9 10
.5
11.5
13
.5
29.5
33
.5
33
29.5
30
.528
.5
5 Le
ft 0
0 0
0 0
0 1
1 1.
5 1.
5 2.
5 2
23
23.5
22
.5
26
2426
5
Rig
ht
0 0
0 0
0 0
0 0
0 0
1 1
17
18.5
18
.5
20.5
20
20.5
6
Left
0 0
0 0
0 0
15
16
17.5
14
14
.5
14.5
30
.5
33
32
33.5
30
31.5
6
Rig
ht
0 0
0 0
0 0
17
12.5
17
.5
19
16.5
15
41
39
47
46
41
43
30 N
D
F Te
st1
DFT
est2
N
Tes
t1
N T
est2
PF
Tes
t1
PF T
est2
Sx
1
2 3
1 2
3 1
2 3
1 2
3 1
2 3
1 2
3 1
Left
24.5
24
.5
26
23.5
30
.5
28
53
53
55
62
62.5
63
.5
69.5
67
68
65
.5
6970
1
Rig
ht
27
27.5
29
23
.5
27
23
48
50
48.5
45
44
.5
45.5
68
69
.5
71
70
7371
2
Left
5 5.
5 6
7.5
8.5
8 33
34
33
35
35
.5
35.5
57
.5
57.5
57
.5
57
57.5
58
2 R
ight
6
5.5
6.5
7 7.
5 7.
5 27
29
30
31
.5
30
31
51.5
53
.5
50.5
54
.5
5555
3
Left
8.5
10.5
13
.5
15.5
13
11
56
52
.5
54
55.5
57
59
76
.5
77
77
80
7979
3
Rig
ht
14.5
15
.5
17
16
13.5
11
.5
51.5
52
49
53
51
.5
53
77
77
75.5
79
.5
7978
4
Left
10.5
11
8
10.5
6.
5 10
.5
49
48.5
51
.5
43.5
45
.5
46.5
63
63
.5
63.5
62
.5
6364
.5
4 R
ight
2
2 2
2.5
2.5
3 32
32
33
.5
33.5
35
35
.5
58
59.5
60
58
61
64.5
5
Left
1.5
1.5
1.5
1.5
1 1.
5 9
10
10.5
10
10
.5
10.5
35
35
.5
35.5
36
36
35.5
5
Rig
ht
1 1
1 0.
5 0
0 6.
5 6.
5 6.
5 8.
5 10
.5
10
28.5
28
.5
30
30
29.5
31
6 Le
ft 0
1 1
2 2.
5 2.
5 35
.5
34.5
36
.5
34
32
34
54.5
56
56
.5
53
5252
.5
6 R
ight
4
4.5
4.5
8 8.
5 9
36.5
34
.5
39.5
36
.5
36
33.5
61
.5
60
63.5
62
61
62.5
(Sx)
: Sub
ject
num
ber;
(DF)
: ank
le jo
int d
orsi
flex
ed; (
N):
ankl
e jo
int n
eutra
l; (P
F): a
nkle
join
t pla
ntar
flex
ed.

10
4
APP
END
IX 5
M
TPJ1
RO
M: t
est r
etes
t ove
r one
wee
k ra
w d
ata
10N
Sx
DF
Test
1
D
F Te
st2
N T
est1
N
Tes
t2
PF T
est1
PF
Tes
t2
1 Le
ft 0
0 0
0 0
0 2.
5 2.
5 2.
5 0
1.5
2 15
14
13
11
11
.5
12
1 R
ight
0
0 0
0 0
0 9.
5 7.
5 8.
5 5.
5 7.
5 7.
5 24
29
28
22
.5
21
22.5
2
Left
0 0
0 0
0 0
16.5
14
.5
16
9.5
11
9.5
43
38
43.5
35
32
43
.5
2 R
ight
0
0 0
0 0
0 16
.5
19.5
20
14
16
14
44
42
40
.5
38.5
35
35
.5
3 Le
ft 0
0 0
0 0
0 0
0 0
0 0
0 6
4 4.
5 5.
5 2.
5 6.
5 3
Rig
ht
0 0
0 0
0 0
0 0
0 0
0 0
11.5
13
.5
11
11.5
13
.5
14.5
4
Left
0 0
1.5
2 0
1.5
32
34
37
23.5
22
.5
27
63
71
69
56
56.5
55
.5
4 R
ight
0
0 0
0 0
0 36
39
38
.5
32.5
29
28
63
.5
64
60
57.5
59
.5
53.5
5
Left
0 0
0 0
0 0
16.5
23
.5
18.5
14
14
.5
14.5
48
.5
43.5
43
33
.5
30
31.5
5
Rig
ht
1 1
1 0
0 0
12
10
12
19
16.5
15
54
.5
47
51.5
46
41
43
6
Left
5 4
4.5
0 0
0.5
16.5
23
.5
18.5
33
.5
28
34
45.5
47
.5
49.5
66
.5
54
57
6 R
ight
3
3 3.
5 1.
5 2
0 12
10
12
27
.5
29.5
27
.5
49
49.5
49
51
.5
60.5
56
.5
30N
Sx
DF
Test
1
D
F Te
st2
N T
est1
N
Tes
t2
PF T
est1
PF
Tes
t2
1 Le
ft 1
0 0
0 1
1 14
14
.5
13
11
8.5
8 30
29
.5
29.5
32
33
31
.5
1 R
ight
2
2 2
1 1.
5 1.
5 23
21
23
.5
23
24
24
45.5
49
.5
49
46
47.5
50
2
Left
3 2.
5 2.
5 1
1.5
2 30
.5
30.5
31
.5
30.5
34
.5
28.5
56
.5
52.5
56
57
60
59
2
Rig
ht
7.5
9 7
4.5
4 4
40
41.5
40
.5
35
34.5
33
62
.5
61.5
62
59
60
59
.5
3 Le
ft 0
0 0
0 0
0 1.
5 2
2 2
1.5
2 21
23
23
.5
22
22.5
22
3
Rig
ht
0 0
0 0
0 0
7 7
7.5
3 3
2.5
17.5
17
17
13
.5
14
14.5
4
Left
11.5
10
.5
10.5
11
10
11
53
.5
58
58
51.5
51
55
76
.5
76.5
78
.5
77.5
79
.5
78.5
4
Rig
ht
9.5
9 7.
5 7
7 9.
5 63
63
.5
65.5
61
.5
59.5
60
80
79
.5
79.5
77
80
80
5
Left
4.5
4.5
5 2
2.5
2.5
36.5
38
.5
36.5
34
32
34
59
.5
60
60
53
52
52.5
5
Rig
ht
5.5
5.5
5.5
8 8.
5 9
27.5
24
.5
26
36.5
36
33
.5
66.5
65
64
62
61
62
.5
6 Le
ft 26
.5
31.5
32
15
.5
13
11
60
59
58
55.5
57
59
67
68
.5
68
80
79
79
6 R
ight
20
20
.5
21.5
16
13
.5
11.5
60
.5
56
57
53
51.5
53
68
.5
70.5
69
79
.5
79
78
(Sx)
: Sub
ject
num
ber;
(DF)
: ank
le jo
int d
orsi
flex
ed; (
N):
ankl
e jo
int n
eutra
l; (P
F): a
nkle
join
t pla
ntar
flex
ed.
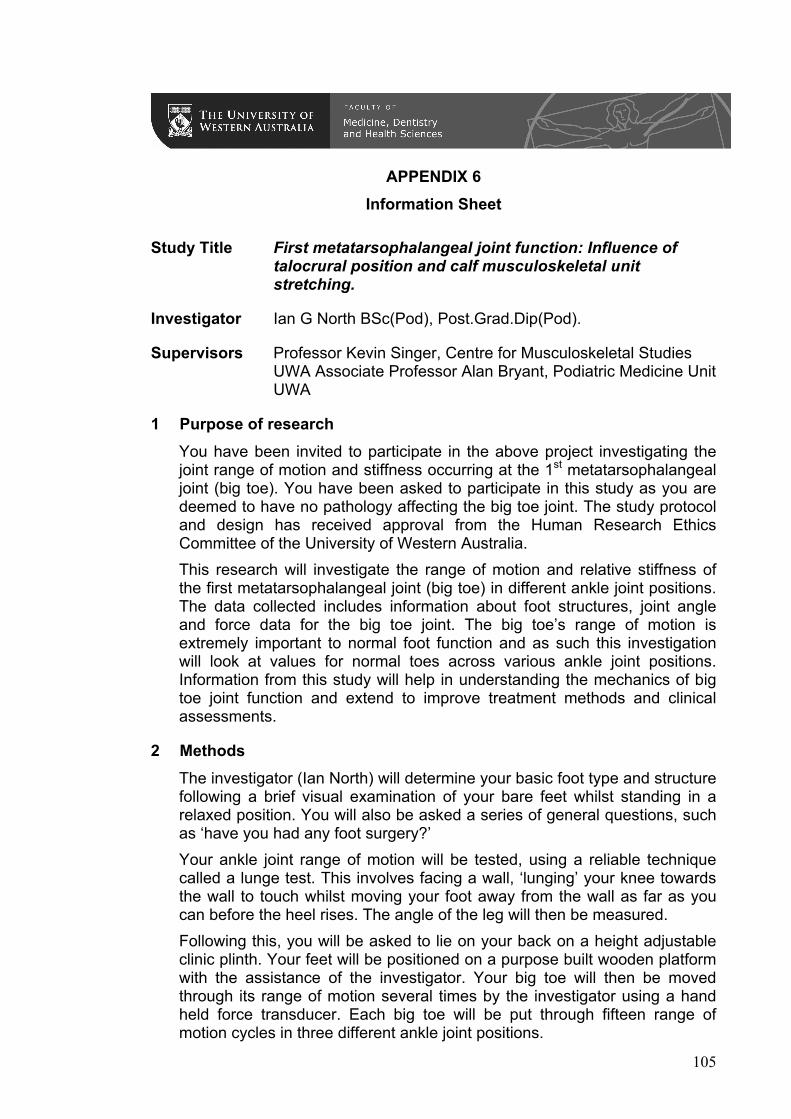
105
APPENDIX 6 Information Sheet
Study Title First metatarsophalangeal joint function: Influence of talocrural position and calf musculoskeletal unit stretching.
Investigator Ian G North BSc(Pod), Post.Grad.Dip(Pod).
Supervisors Professor Kevin Singer, Centre for Musculoskeletal Studies UWA Associate Professor Alan Bryant, Podiatric Medicine Unit UWA
1 Purpose of research You have been invited to participate in the above project investigating the joint range of motion and stiffness occurring at the 1st metatarsophalangeal joint (big toe). You have been asked to participate in this study as you are deemed to have no pathology affecting the big toe joint. The study protocol and design has received approval from the Human Research Ethics Committee of the University of Western Australia. This research will investigate the range of motion and relative stiffness of the first metatarsophalangeal joint (big toe) in different ankle joint positions. The data collected includes information about foot structures, joint angle and force data for the big toe joint. The big toe’s range of motion is extremely important to normal foot function and as such this investigation will look at values for normal toes across various ankle joint positions. Information from this study will help in understanding the mechanics of big toe joint function and extend to improve treatment methods and clinical assessments.
2 Methods The investigator (Ian North) will determine your basic foot type and structure following a brief visual examination of your bare feet whilst standing in a relaxed position. You will also be asked a series of general questions, such as ‘have you had any foot surgery?’ Your ankle joint range of motion will be tested, using a reliable technique called a lunge test. This involves facing a wall, ‘lunging’ your knee towards the wall to touch whilst moving your foot away from the wall as far as you can before the heel rises. The angle of the leg will then be measured. Following this, you will be asked to lie on your back on a height adjustable clinic plinth. Your feet will be positioned on a purpose built wooden platform with the assistance of the investigator. Your big toe will then be moved through its range of motion several times by the investigator using a hand held force transducer. Each big toe will be put through fifteen range of motion cycles in three different ankle joint positions.

106
The big toe joint will be moved to its normal end range of motion; no discomfort should be felt by you throughout the investigation. There are no known risks associated with this testing methodology. All data should be gathered within ten minutes, thus posing minimal inconvenience to you. Stretching Group: If selected to participate in the stretching section of the study, you will be assigned to perform one static lower limb stretch throughout the duration of one week. The stretch involves the calf muscles (behind the lower leg) and Achilles tendon. This particular stretch is routinely advocated in clinical practice for a range of pathologies however the effect on range of motion and MTPJ1 stiffness is yet to be determined. The investigator will demonstrate the stretch and will give you written instructions to have at home as a reminder. The stretching programme consists of a one minute stretch performed twice per day, on a randomly assigned leg only. You will be required to complete a diary (provided) to record your daily stretching activity. The investigator will measure your ankle and big toe range of motion, as described above, on day 1 as well as after one week of stretching, day 7.
3 Benefits Whilst there may be limited direct personal benefits from being involved in the study, data collected will provide greater insight into the mechanics of the big toe joint and will be used to determine better treatment options to improve big toe joint function. Thus your participation has the potential to benefit the wider community.
4 Confidentiality Information obtained from the study will be recorded and the data derived from this information will be used for teaching purposes and to produce publications in scientific or medical journals. All personal information gathered will be subject to the University’s confidentiality and privacy rules and regulations.
5 Request for further information You may ask for more information about the study now or at a later date as the study progresses.
6 Refusal or withdrawal of participation You may withdraw from the study at any time without prejudicing your continuing podiatric care. Your participation in this study does not prejudice any right you may have to compensation under statute or common law.
The Human Research Ethics Committee at the University of Western Australia requires that all participants are informed that, if they have any complaint regarding the manner, in which a research project is conducted, it may be given to the researcher or, alternatively to the Secretary, Human Research Ethics Committee, Registrar’s Office, University of Western Australia, 35 Stirling Highway, Crawley, WA 6009 (telephone number 6488-3703). All study participants will be provided with a copy of the Information Sheet and Consent Form for their personal records.

107
APPENDIX 7 Consent Form for Participants
Title of Project First Metatarsophalangeal Joint Function: Influence of talocrural position and calf musculoskeletal unit stretching.
Investigator Ian G North BSc(Pod), Post.Grad.Dip(Pod). Supervisors Professor Kevin Singer, Centre for Musculoskeletal Studies
UWA Associate Professor Alan Bryant, Podiatric Medicine Unit
UWA
1 Purpose of research
I have been informed that this research will investigate the range of motion and relative stiffness of the first metatarsophalangeal joint (big toe). The big toe joint is extremely important for normal walking and information gathered through this research will prove valuable in terms of understanding and management of disorders effecting first metatarsophalangeal joint function. The data collected includes information about foot structures, joint angle and force data. You have been invited to participate in this study because your big toe joints are deemed normal. Such an investigation will give clinicians greater insight into foot function and effective treatment strategies.
2 Procedure
I understand that my feet will be physically examined by an experienced podiatrist and I will be asked a series of questions by the investigator. I understand that I will be required to lie on my back on a height adjustable clinic plinth with my feet placed on a wooden platform. The investigator will then move my big toe forwards and backwards several times on each foot and in three different ankle positions whilst I remain relaxed to test the big toe joint range of motion.
3 Benefits
I understand that there are no direct benefits from being involved in the study.
4 Confidentiality
I understand that the information obtained from the study will be recorded and data derived from this information will be used for teaching purposes and to produce publications in scientific or medical journals. All personal information gathered will be subject to the University’s confidentiality and privacy rules and regulations.
5 Request for further information

108
I understand that I may ask for more information about the study now or at a later date as the study progresses.
6 Refusal or withdrawal of participation
I understand that I may withdraw from the study at any time without prejudice to my health service continuing care. I _________________________________ have read the information provided and any questions I have asked have been answered to my satisfaction. I agree to participate in this study, realising that I may withdraw at any time without reason and without prejudice to my future podiatric treatment. I understand that all information provided is treated as strictly confidential and will not be released by the investigator unless required to by law. I have been advised as to what data is being collected, what the purpose is and what will be done with data upon completion of the research. I agree that research data gathered for the study may be published provided my name or other identifying information is not used. Participant (signature):_______________________ Date: _____________

109
APPENDIX 8 MTPJ1 ROM Data Recording Sheet
Subject ID #: ________________________________________________ Date: __________________________
Age: _________________________ Weight (kg): ________________ Height (cm): ____________________
Sex: Male Female Dominance: Left Right
WBLT (L) WBLT (R) Cal
Left Right
Neutral
Plantar
Dorsi
Subject ID #: ________________________________________________ Date: __________________________
Age: _________________________ Weight (kg): ________________ Height (cm): ____________________
Sex: Male Female Dominance: Left Right
WBLT (L) WBLT (R) Cal
Left Right
Neutral
Plantar
Dorsi
Subject ID #: ________________________________________________ Date: __________________________
Age: _________________________ Weight (kg): ________________ Height (cm): ____________________
Sex: Male Female Dominance: Left Right
WBLT (L) WBLT (R) Cal
Left Right
Neutral
Plantar
Dorsi

11
0
APP
END
IX 9
Fo
ot P
ostu
re In
dex
(FPI
-6) –
Col
lect
ion
Form

111
APPENDIX 10 Ankle joint ROM pilot study: WBLT
Ankle Joint ROM (Lunge Test)
1.0 Description
Restricted ankle joint dorsiflexion has been implicated as a contributing factor in
several foot and lower limb pathologies, including plantar fasciitis. (63,167,168)
Clinical investigation of ankle joint range of motion is routinely performed and
like all quantitative tests reliability is paramount. The Weight Bearing Lunge
Test (WBLT) has been described and has been shown to be reliable.(10) The
technique to perform the lunge test appears standard across studies. However
there are measurement variations with some authors choosing to measure the
vertical angle from the anterior tibial crest (10,169,170) as opposed to the vertical
angle from the Achilles tendon.(149,171) Also described is the method of
measuring the distance from the wall to the toes whilst in the lunge position. (106,
170-172) There appears to be a preference in the literature to use the method
measuring the toe distance from the wall however, this doesn’t allow for
subjects height or indeed length of tibia. Therefore quantifying tibial angle may
give a more valid description of ankle range of motion. To date there is a lack of
normative data and accordingly values that may be deemed pathological.
2.0 Research Question
A pilot study was undertaken to investigate and compare the intra-rater
reliability of quantifying the weight-bearing lunge test using a digital
inclinometer. Two measurement techniques were compared to determine the
most reliable method for future aspects to this thesis.
3.0 Method
Ten asymptomatic adult subjects (6 female, 4 male) volunteered to participate
in measuring their ankle joint range of motion via the WBLT. All subjects had an
absence of lower limb pathology and significant orthopaedic, systemic or
neurological anomalies were excluded. Demographic data was collected
including age, gender and body mass index (BMI).

112
Subjects performed a WBLT, as described by Bennell et al (10) which involves
the subject placing their foot perpendicular to the wall and lunging their knee
towards the wall. The foot is then moved away from the wall until maximum
ankle joint dorsiflexion is achieved without lifting of the heel. Subjects are
encouraged to hold onto the wall during the lunge to maintain balance.
The subject’s left leg was tested. Each subject received instructions from the
investigator as to how to perform the task and this was supervised during
testing. Measurement of tibial angle was recorded using a digital inclinometer
with an accuracy of 0.1o (Smart Tool®-digital angle finder, M-D Building
Products, Oklahoma City). Calibration of the inclinometer was performed prior
to each test occasion according to manufacturer instructions.
Two standardised methods were tested for reliability comparison. Method A
measured the tibial angle in degrees (0.1o) taken from the anterior tibial border
just inferior to the tibial tuberosity. Method B was taken along the length of the
tendo-Achilles inferior to the musculotendinous junction. Recorded angles were
taken from the vertical. See Figure 1.
Three measures were recorded at each session for each method with the mean
taken for comparisons. The procedure was repeated after approximately one
hour with test re-test analysis made.

113
Figure 1: Weight-bearing Lunge Test (WBLT). Technique A; Anterior Tibial border; Method B; Achilles Tendon. Measurement taken is angle from vertical in degrees.
4.0 Results
Subject demographic data was recorded and is summarised in Table 1. WBLT
angle data for the left leg was recorded using the two methods described above
with the mean and standard deviation values in degrees shown in Table 2.
Reliability analysis was performed using Intraclass correlation co-efficients
(model 3,1) (141) and typical error and 95% confidence intervals are reported in
Table 3.
Table 1: Subject demographic data for WBLT mean and standard deviation (SD).
n: number of subjects; M: male; F: female; cm’s: centimetres; Kg’s: kilograms; BMI: body mass
index.
Subjects (n)
Gender (M,F)
Age (years) (SD)
Height (cm's) (SD)
Weight (kg's) (SD) BMI (SD)
10 4,6 38 (12.19) 173.1 (9.63)
69.55 (14.97)
23.07 (3.77)

114
Table 2: Subject data for weight bearing lunge test representing the mean and standard deviation (SD) in degrees from vertical of trial 1 and 2 for both measurement techniques
Method
A Method
B
Subject (n)
Test1 Test2 Test1 Test2
1 35.66 35.26 22.9 23.06 2 45.8 43.17 36.1 32.3 3 48.27 47.7 36.4 35.74 4 42.1 42.1 28.44 29.94 5 45.34 44.04 30.47 30.74 6 41.47 43.3 29.6 31.9 7 47.2 49.4 34.47 37.84 8 45.17 42.77 29 28.17 9 56.87 53.6 38.5 37.84
10 49.1 46.9 29.04 30.97 Mean (S.D)
45.7 (5.6)
44.8 (4.9)
31.5 (4.8)
31.9 (4.5)
Table 3: Intra-rater reliability (ICC 3,1), 95% confidence intervals (CI), typical error and confidence variance (CV) for weight bearing lunge test comparing two measurement techniques.
Method A Method B ICC (3,1) 0.938 0.903 95% CI (0.752-0.985) (0.634-0.977) Typical Error (degrees) 1.31 1.44 Typical Error CV(%) 2.8 4.4
5.0 Discussion
Results indicate excellent same day intra-rater reliability of the WBLT to quantify
ankle joint dorsiflexion for both measurement methods A and B with ICC’s (3,1),
0.938 and 0.903 respectively. Both methods of measurement are relatively easy
and efficient. The WBLT is functional in nature as it requires weight bearing
loading through the foot and ankle during testing.
Whilst both methods are reliable there were significant differences in actual
values between method types, due mainly to the anatomy of the lower limb.
Further investigation into the validity of both measurement techniques could be
performed via fluoroscopy. However one could intuitively surmise that Method
A, given its proximity to the tibial shaft, would produce more valid results.

115
For this reason, plus the marginally higher ICC and lower correlation variance,
Method A was chosen for quantifying ankle joint dorsiflexion for future aspects
of this project.

116
APPENDIX 11 Stretch instructions and participation diary
Stretch Protocol: You are asked to perform a calf muscle tendon stretch on your randomly assigned leg _____________. The technique is to place (wedge) the foot against a wall or door frame keeping the knee fully extended. Then the hips are moved anteriorly and held until a firm, non painful stretch is felt in the calf muscle. See fig 1a and 1b. Feel free to do this whilst wearing shoes if its more comfortable. Then you are instructed to hold this stretch for 30 seconds followed by 30 seconds of steady rhythmic lunges. These involves the foot being maintained in the stretch position with you gently bending the knee to resistance and re straightening in a cyclic fashion with one flex / extend cycle approximately every second. i.e. 30 up and downs. You are asked to perform this stretch twice (2x) daily for one week where MTPJ1 extension and ankle joint range will be re tested. Please indicate with a tick on the participation diary below as you perform a stretch.
Subject ID:______________________
MON TUES WED THURS FRI SAT SUN
AM
PM
* Please mark in box to indicate when stretch is performed.

11
7
APP
END
IX 1
2 M
TPJ1
RO
M R
aw D
ata:
(par
t tw
o)
10N
Subj
ect I
D
Gen
der
Age
B
MI
WB
LT
FPI
A
JN10
N
A
JDF1
0N
A
JPF1
0N
1L K
F
34
24.7
22
.90
-216
.50
16.5
017
.00
16.6
70.
00
0.00
0.00
0.00
44.0
040
.50
36.0
040
.17
1R
23
.10
-112
.50
14.5
017
.00
14.6
70.
00
0.00
0.00
0.00
35.5
037
.50
37.5
036
.83
2L A
F
22
18.8
45
.30
515
.00
16.0
017
.50
16.1
70.
00
0.00
0.00
0.00
30.5
033
.00
32.0
031
.83
2R
44
.00
517
.00
12.5
017
.50
15.6
70.
00
0.00
0.00
0.00
41.0
039
.00
47.0
042
.33
3L S
F
29
19.8
45
.80
444
.00
39.0
037
.00
40.0
07.
50
9.00
12.5
09.
7073
.50
69.5
072
.00
71.7
0 3R
38.7
0 5
44.5
048
.50
44.0
045
.70
9.00
10
.00
17.0
012
.00
73.0
075
.00
68.5
072
.20
4L M
M
47
24
.2
46.6
0 3
23.0
023
.50
23.0
023
.20
1.00
1.
000.
000.
3045
.50
49.0
046
.00
46.8
0 4R
44.0
0 2
37.5
037
.00
34.5
036
.30
3.00
2.
003.
002.
7056
.00
53.5
053
.00
54.2
0 5L
D
F 47
24
.9
34.7
0 0
28.0
028
.50
28.0
028
.20
5.00
4.
004.
504.
5045
.50
47.5
049
.50
47.5
0 5R
36.7
0 1
24.5
023
.50
21.5
023
.20
3.00
3.
003.
503.
2049
.00
49.5
049
.00
49.2
0 6L
St
F 29
24
.2
52.6
3 2
14.5
010
.00
10.5
011
.70
0.00
0.
000.
000.
0042
.50
48.5
051
.00
47.3
0 6R
50.2
0 3
17.5
017
.50
17.0
017
.30
0.00
0.
000.
000.
0039
.00
38.5
033
.50
37.0
0 7L
Sh
F 43
19
.2
47.2
0 10
2.50
2.50
2.50
2.50
0.00
0.
000.
000.
0015
.00
14.0
013
.00
14.0
0 7R
43.1
0 10
9.50
7.50
8.50
8.50
0.00
0.
000.
000.
0024
.00
29.0
028
.00
27.0
0 8L
J
M
27
22.6
45
.80
00.
000.
000.
000.
000.
00
0.00
0.00
0.00
6.00
4.00
4.50
4.83
8R
40.4
0 0
0.00
0.00
0.00
0.00
0.00
0.
000.
000.
0011
.50
13.5
011
.00
12.0
0 9L
L
F 55
32
.0
39.8
0 2
16.5
014
.50
16.0
015
.67
0.00
0.
000.
000.
0043
.00
38.0
043
.50
41.5
0 9R
37.2
0 2
16.5
019
.50
20.0
018
.67
0.00
0.
000.
000.
0044
.00
42.0
040
.50
42.1
7 10
L A
F
20
21.9
54
.30
331
.50
35.5
036
.50
34.5
05.
50
5.50
7.50
6.17
57.5
054
.00
54.5
055
.33
10R
51.7
0 3
23.5
028
.50
29.0
027
.00
9.50
12
.00
14.0
011
.83
55.0
055
.00
55.5
055
.17
11L
Su
F 54
23
.0
43.7
0 1
32.0
034
.00
37.0
034
.33
0.00
0.
001.
500.
5063
.00
71.0
069
.00
67.6
7

11
8
11R
41.9
0 1
36.0
039
.00
38.5
037
.83
0.00
0.
000.
000.
0063
.50
64.0
060
.00
62.5
0 E
R00
1 L
F 20
21
.1
43.8
0 6
26.5
028
.50
28.0
027
.66
0.00
0.
001.
000.
3332
.50
38.5
036
.00
35.6
6 E
R00
1 R
39.4
0 7
15.0
013
.00
12.0
013
.33
2.00
3.
504.
503.
3330
.50
29.0
031
.50
30.3
3 K
G00
2L
F 20
21
.5
50.2
0 1
37.5
046
.00
34.0
039
.16
7.50
11
.00
7.00
8.50
58.5
057
.50
59.5
058
.50
KG
002R
44.2
0 1
39.0
038
.50
39.5
039
.00
16.5
0 13
.50
14.0
014
.66
62.0
077
.00
64.5
067
.83
SA
003L
M
19
27
.8
43.9
0 6
8.50
8.50
10.5
09.
160.
00
0.00
0.00
0.00
24.0
023
.00
21.5
022
.83
SA
003R
45.2
0 8
10.5
012
.00
12.0
011
.50
1.00
1.
001.
001.
0020
.50
21.0
022
.50
21.3
3 JH
004L
M
19
20
.5
50.9
0 5
17.5
018
.00
16.0
017
.16
0.50
0.
000.
000.
1628
.00
29.5
029
.50
29.0
0 JH
004R
54.3
0 5
16.5
013
.50
12.0
014
.00
2.00
3.
500.
001.
8331
.50
34.0
033
.50
33.0
0 LM
005L
F
18
21.5
61
.60
042
.00
43.0
035
.00
40.0
011
.00
9.00
9.50
9.83
51.5
057
.50
47.5
052
.16
LM00
5R
62
.30
131
.50
26.0
026
.00
27.8
312
.00
13.5
012
.00
12.5
036
.50
36.5
038
.00
37.0
0 JK
006L
M
25
22
.2
49.0
0 1
20.0
019
.50
17.5
019
.00
6.00
8.
5010
.00
8.16
32.0
036
.00
37.5
035
.16
JK00
6R
49
.60
118
.50
18.0
018
.50
18.3
38.
00
0.00
0.00
2.66
27.5
021
.00
32.5
027
.00
JH00
7L
M
18
19.0
48
.80
921
.00
21.5
018
.50
20.3
34.
50
5.50
6.50
5.50
43.5
051
.50
42.0
045
.66
JH00
7R
53
.10
931
.00
31.0
025
.50
29.1
63.
00
7.00
5.50
5.16
42.0
047
.00
44.5
044
.50
BM
008L
M
26
21
.0
47.7
0 3
15.0
015
.50
15.0
015
.16
2.00
2.
002.
002.
0020
.50
21.5
025
.00
22.3
3 B
M00
8R
45
.80
319
.50
19.5
020
.50
19.8
30.
00
0.00
0.00
0.00
29.0
029
.00
29.0
029
.00
IW00
9L
F 19
20
.0
53.0
0 0
5.00
4.50
4.50
4.66
1.50
1.
000.
000.
8324
.00
21.0
021
.00
22.0
0 IW
009R
46.9
0 1
9.50
8.00
8.00
8.50
1.50
0.
000.
000.
5038
.00
38.5
038
.00
38.1
6 D
T001
0L
M
18
23.0
56
.70
1128
.50
24.0
027
.00
26.5
00.
00
0.00
2.00
0.66
38.5
047
.50
36.0
040
.66
DT0
010R
55.4
0 11
29.5
031
.00
29.5
030
.00
0.00
3.
003.
502.
1639
.50
41.5
044
.00
41.6
6 S
C00
11L
F 19
22
.0
40.4
0 0
12.0
014
.00
13.5
013
.16
0.00
0.
000.
000.
0030
.50
35.0
032
.50
32.6
6 S
C00
11R
45.3
0 -4
13.5
011
.00
14.0
012
.83
0.00
0.
501.
000.
5041
.00
36.5
038
.00
38.5
0 M
A00
12L
F 21
21
.0
40.2
0 6
25.5
028
.00
22.0
025
.16
2.50
5.
003.
503.
6636
.50
33.5
031
.00
33.6
6 M
A00
12R
44.3
0 5
24.0
023
.50
27.0
024
.83
8.00
9.
006.
007.
6642
.00
40.5
040
.00
40.8
3 K
D00
13L
F 20
21
.0
51.4
0 5
28.5
034
.00
30.5
031
.00
7.00
6.
505.
506.
3343
.50
39.5
044
.50
42.5
0 K
D00
13R
50.4
0 6
46.5
041
.50
36.5
041
.50
21.0
0 18
.50
18.5
019
.33
41.5
041
.50
36.0
039
.66
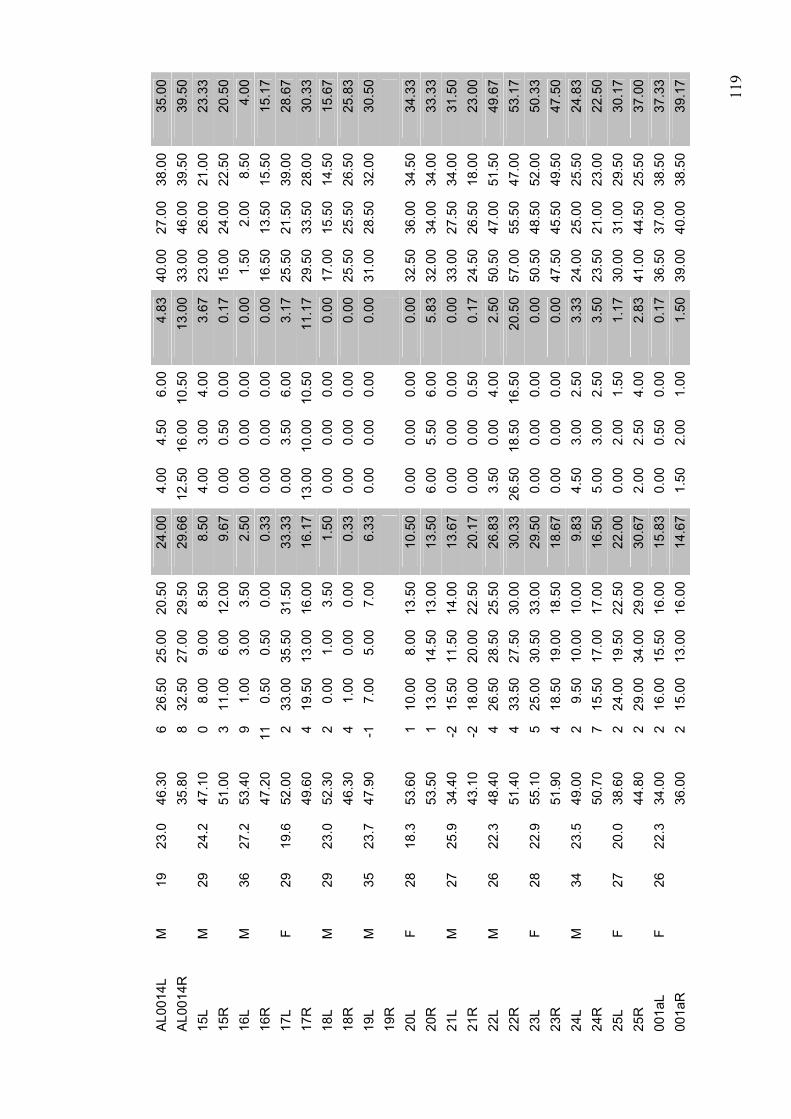
11
9
AL0
014L
M
19
23
.0
46.3
0 6
26.5
025
.00
20.5
024
.00
4.00
4.
506.
004.
8340
.00
27.0
038
.00
35.0
0 A
L001
4R
35
.80
832
.50
27.0
029
.50
29.6
612
.50
16.0
010
.50
13.0
033
.00
46.0
039
.50
39.5
0 15
L M
29
24
.2
47.1
0 0
8.00
9.00
8.50
8.50
4.00
3.
004.
003.
6723
.00
26.0
021
.00
23.3
3 15
R
51
.00
311
.00
6.00
12.0
09.
670.
00
0.50
0.00
0.17
15.0
024
.00
22.5
020
.50
16L
M
36
27.2
53
.40
91.
003.
003.
502.
500.
00
0.00
0.00
0.00
1.50
2.00
8.50
4.00
16
R
47
.20
110.
500.
500.
000.
330.
00
0.00
0.00
0.00
16.5
013
.50
15.5
015
.17
17L
F 29
19
.6
52.0
0 2
33.0
035
.50
31.5
033
.33
0.00
3.
506.
003.
1725
.50
21.5
039
.00
28.6
7 17
R
49
.60
419
.50
13.0
016
.00
16.1
713
.00
10.0
010
.50
11.1
729
.50
33.5
028
.00
30.3
3 18
L M
29
23
.0
52.3
0 2
0.00
1.00
3.50
1.50
0.00
0.
000.
000.
0017
.00
15.5
014
.50
15.6
7 18
R
46
.30
41.
000.
000.
000.
330.
00
0.00
0.00
0.00
25.5
025
.50
26.5
025
.83
19L
M
35
23.7
47
.90
-17.
005.
007.
006.
330.
00
0.00
0.00
0.00
31.0
028
.50
32.0
030
.50
19R
20
L F
28
18.3
53
.60
110
.00
8.00
13.5
010
.50
0.00
0.
000.
000.
0032
.50
36.0
034
.50
34.3
3 20
R
53
.50
113
.00
14.5
013
.00
13.5
06.
00
5.50
6.00
5.83
32.0
034
.00
34.0
033
.33
21L
M
27
25.9
34
.40
-215
.50
11.5
014
.00
13.6
70.
00
0.00
0.00
0.00
33.0
027
.50
34.0
031
.50
21R
43.1
0 -2
18.0
020
.00
22.5
020
.17
0.00
0.
000.
500.
1724
.50
26.5
018
.00
23.0
0 22
L M
26
22
.3
48.4
0 4
26.5
028
.50
25.5
026
.83
3.50
0.
004.
002.
5050
.50
47.0
051
.50
49.6
7 22
R
51
.40
433
.50
27.5
030
.00
30.3
326
.50
18.5
016
.50
20.5
057
.00
55.5
047
.00
53.1
7 23
L F
28
22.9
55
.10
525
.00
30.5
033
.00
29.5
00.
00
0.00
0.00
0.00
50.5
048
.50
52.0
050
.33
23R
51.9
0 4
18.5
019
.00
18.5
018
.67
0.00
0.
000.
000.
0047
.50
45.5
049
.50
47.5
0 24
L M
34
23
.5
49.0
0 2
9.50
10.0
010
.00
9.83
4.50
3.
002.
503.
3324
.00
25.0
025
.50
24.8
3 24
R
50
.70
715
.50
17.0
017
.00
16.5
05.
00
3.00
2.50
3.50
23.5
021
.00
23.0
022
.50
25L
F 27
20
.0
38.6
0 2
24.0
019
.50
22.5
022
.00
0.00
2.
001.
501.
1730
.00
31.0
029
.50
30.1
7 25
R
44
.80
229
.00
34.0
029
.00
30.6
72.
00
2.50
4.00
2.83
41.0
044
.50
25.5
037
.00
001a
L F
26
22.3
34
.00
216
.00
15.5
016
.00
15.8
30.
00
0.50
0.00
0.17
36.5
037
.00
38.5
037
.33
001a
R
36
.00
215
.00
13.0
016
.00
14.6
71.
50
2.00
1.00
1.50
39.0
040
.00
38.5
039
.17

12
0
30N
Subj
ect I
D
Gen
der
Age
B
MI
WB
LT
FPI
A
JN30
N
A
JDF3
0N
A
JPF3
0N
1L K
F
34
24.7
22
.90
-233
.00
34.0
033
.00
33.3
35.
00
5.50
6.00
5.50
57.5
057
.50
57.5
057
.50
1R
23
.10
-127
.00
29.0
030
.00
28.6
76.
00
5.50
6.50
6.00
51.5
053
.50
50.5
051
.83
2L A
F
22
18.8
45
.30
535
.50
34.5
036
.50
35.5
00.
00
1.00
1.00
0.67
54.5
056
.00
56.5
055
.67
2R
44
.00
536
.50
34.5
039
.50
36.8
34.
00
4.50
4.50
4.33
61.5
060
.00
63.5
061
.67
3L S
t F
29
19.8
45
.80
464
.00
64.0
063
.00
63.7
028
.50
30.0
031
.50
30.0
078
.00
79.5
078
.00
78.5
0 3R
38.7
05
70.5
070
.00
69.0
069
.80
28.0
0 28
.00
34.5
036
.20
78.5
079
.00
76.5
078
.00
4L M
M
47
24
.2
46.6
03
39.0
040
.00
40.0
039
.70
7.00
6.
006.
006.
3069
.50
69.0
071
.50
70.0
0 4R
44.0
02
53.5
053
.50
54.0
053
.70
12.5
0 12
.50
12.5
012
.50
74.0
072
.00
72.0
072
.70
5L D
F
47
24.9
34
.70
060
.00
59.0
058
.00
59.0
026
.50
31.5
032
.00
30.0
067
.00
68.5
068
.00
68.5
0 5R
36.7
01
60.5
056
.00
57.0
057
.80
20.0
0 20
.50
21.5
020
.70
68.5
070
.50
69.0
069
.30
6L S
t F
29
24.2
52
.63
247
.00
39.0
032
.50
39.5
06.
50
6.00
7.00
6.50
73.5
071
.50
73.5
072
.80
6R
50
.20
353
.00
50.5
057
.50
53.7
08.
00
8.00
7.00
7.70
78.5
078
.50
78.0
078
.30
7L S
h F
43
19.2
47
.20
1014
.00
14.5
013
.00
13.8
31.
00
0.00
0.00
0.33
30.0
029
.50
29.5
029
.67
7R
43
.10
1023
.00
21.0
023
.50
22.5
02.
00
2.00
2.00
2.00
45.5
049
.50
49.0
048
.00
8L J
M
27
22
.6
45.8
00
1.50
2.00
2.00
1.83
0.00
0.
000.
000.
0021
.00
23.0
023
.50
22.5
0 8R
40.4
00
7.00
7.00
7.50
7.17
0.00
0.
000.
000.
0017
.50
17.0
017
.00
17.7
0 9L
L
F 55
32
.0
39.8
02
30.5
030
.50
31.5
030
.83
3.00
2.
502.
502.
6756
.50
52.5
056
.00
55.0
0 9R
37.2
02
40.0
041
.50
40.5
040
.67
7.50
9.
007.
007.
8362
.50
61.5
062
.00
62.0
0 10
L A
F
20
21.9
54
.30
353
.00
53.0
055
.00
53.6
724
.50
24.5
026
.00
25.0
069
.50
67.0
068
.00
68.1
7 10
R
51
.70
348
.00
50.0
048
.50
48.8
327
.00
27.5
029
.00
27.8
368
.00
69.5
071
.00
69.5
0 11
L S
u F
54
23.0
43
.70
153
.50
58.0
058
.00
56.5
011
.50
10.5
010
.50
10.8
376
.50
76.5
078
.50
77.1
7 11
R
41
.90
163
.00
63.5
065
.50
64.0
09.
50
9.00
7.50
8.67
80.0
079
.50
79.5
079
.67
ER
001
L F
20
21.1
43
.80
619
.50
21.0
021
.50
46.8
38.
00
8.00
7.50
7.83
57.5
058
.00
57.5
057
.66
ER
001
R
39
.40
740
.00
39.0
039
.50
39.5
016
.00
16.5
015
.00
15.8
361
.50
62.5
065
.50
63.1
6 K
G00
2L
F 20
21
.5
50.2
01
48.5
043
.50
43.5
045
.16
21.5
0 25
.00
22.5
023
.00
71.0
068
.50
68.5
069
.33
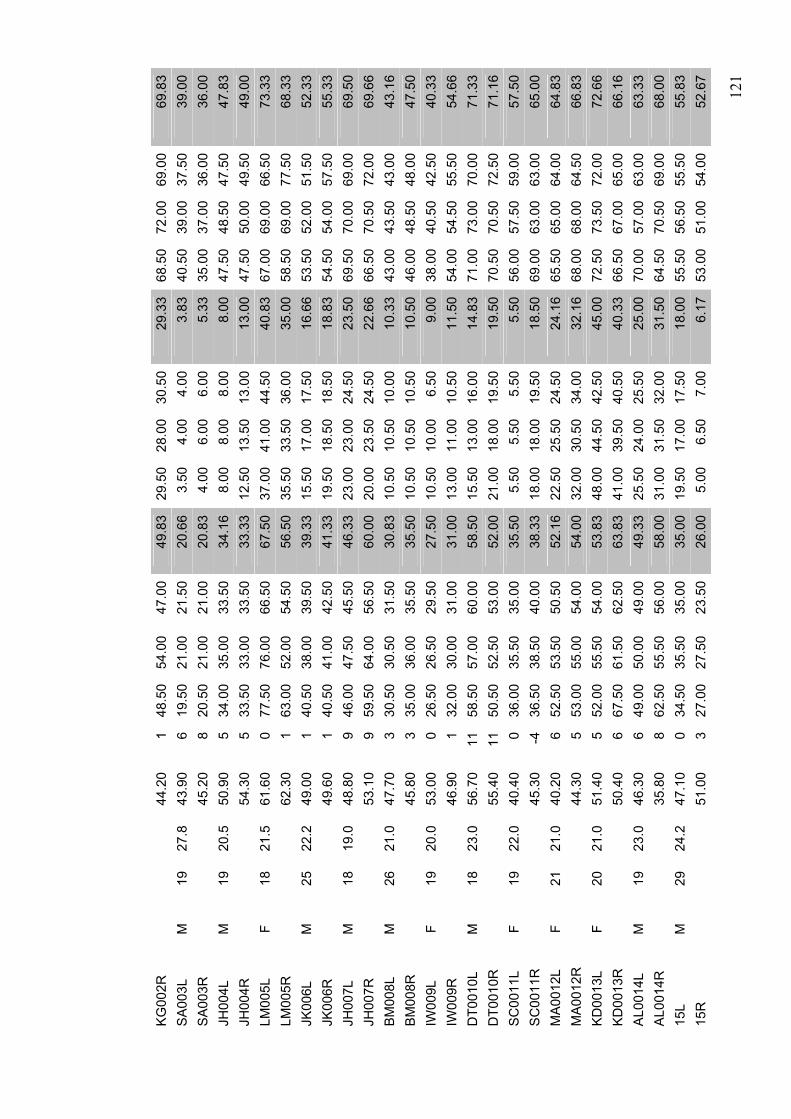
12
1
KG
002R
44.2
01
48.5
054
.00
47.0
049
.83
29.5
0 28
.00
30.5
029
.33
68.5
072
.00
69.0
069
.83
SA
003L
M
19
27
.8
43.9
06
19.5
021
.00
21.5
020
.66
3.50
4.
004.
003.
8340
.50
39.0
037
.50
39.0
0 S
A00
3R
45
.20
820
.50
21.0
021
.00
20.8
34.
00
6.00
6.00
5.33
35.0
037
.00
36.0
036
.00
JH00
4L
M
19
20.5
50
.90
534
.00
35.0
033
.50
34.1
68.
00
8.00
8.00
8.00
47.5
048
.50
47.5
047
.83
JH00
4R
54
.30
533
.50
33.0
033
.50
33.3
312
.50
13.5
013
.00
13.0
047
.50
50.0
049
.50
49.0
0 LM
005L
F
18
21.5
61
.60
077
.50
76.0
066
.50
67.5
037
.00
41.0
044
.50
40.8
367
.00
69.0
066
.50
73.3
3 LM
005R
62.3
01
63.0
052
.00
54.5
056
.50
35.5
0 33
.50
36.0
035
.00
58.5
069
.00
77.5
068
.33
JK00
6L
M
25
22.2
49
.00
140
.50
38.0
039
.50
39.3
315
.50
17.0
017
.50
16.6
653
.50
52.0
051
.50
52.3
3 JK
006R
49.6
01
40.5
041
.00
42.5
041
.33
19.5
0 18
.50
18.5
018
.83
54.5
054
.00
57.5
055
.33
JH00
7L
M
18
19.0
48
.80
946
.00
47.5
045
.50
46.3
323
.00
23.0
024
.50
23.5
069
.50
70.0
069
.00
69.5
0 JH
007R
53.1
09
59.5
064
.00
56.5
060
.00
20.0
0 23
.50
24.5
022
.66
66.5
070
.50
72.0
069
.66
BM
008L
M
26
21
.0
47.7
03
30.5
030
.50
31.5
030
.83
10.5
0 10
.50
10.0
010
.33
43.0
043
.50
43.0
043
.16
BM
008R
45.8
03
35.0
036
.00
35.5
035
.50
10.5
0 10
.50
10.5
010
.50
46.0
048
.50
48.0
047
.50
IW00
9L
F 19
20
.0
53.0
00
26.5
026
.50
29.5
027
.50
10.5
0 10
.00
6.50
9.00
38.0
040
.50
42.5
040
.33
IW00
9R
46
.90
132
.00
30.0
031
.00
31.0
013
.00
11.0
010
.50
11.5
054
.00
54.5
055
.50
54.6
6 D
T001
0L
M
18
23.0
56
.70
1158
.50
57.0
060
.00
58.5
015
.50
13.0
016
.00
14.8
371
.00
73.0
070
.00
71.3
3 D
T001
0R
55
.40
1150
.50
52.5
053
.00
52.0
021
.00
18.0
019
.50
19.5
070
.50
70.5
072
.50
71.1
6 S
C00
11L
F 19
22
.0
40.4
00
36.0
035
.50
35.0
035
.50
5.50
5.
505.
505.
5056
.00
57.5
059
.00
57.5
0 S
C00
11R
45.3
0-4
36.5
038
.50
40.0
038
.33
18.0
0 18
.00
19.5
018
.50
69.0
063
.00
63.0
065
.00
MA
0012
L F
21
21.0
40
.20
652
.50
53.5
050
.50
52.1
622
.50
25.5
024
.50
24.1
665
.50
65.0
064
.00
64.8
3 M
A00
12R
44.3
05
53.0
055
.00
54.0
054
.00
32.0
0 30
.50
34.0
032
.16
68.0
068
.00
64.5
066
.83
KD
0013
L F
20
21.0
51
.40
552
.00
55.5
054
.00
53.8
348
.00
44.5
042
.50
45.0
072
.50
73.5
072
.00
72.6
6 K
D00
13R
50.4
06
67.5
061
.50
62.5
063
.83
41.0
0 39
.50
40.5
040
.33
66.5
067
.00
65.0
066
.16
AL0
014L
M
19
23
.0
46.3
06
49.0
050
.00
49.0
049
.33
25.5
0 24
.00
25.5
025
.00
70.0
057
.00
63.0
063
.33
AL0
014R
35.8
08
62.5
055
.50
56.0
058
.00
31.0
0 31
.50
32.0
031
.50
64.5
070
.50
69.0
068
.00
15L
M
29
24.2
47
.10
034
.50
35.5
035
.00
35.0
019
.50
17.0
017
.50
18.0
055
.50
56.5
055
.50
55.8
3 15
R
51
.00
327
.00
27.5
023
.50
26.0
05.
00
6.50
7.00
6.17
53.0
051
.00
54.0
052
.67

12
2
16L
M
36
27.2
53
.40
915
.00
15.5
015
.00
15.1
75.
00
5.00
4.50
4.83
18.0
016
.50
17.5
017
.33
16R
47.2
011
20.5
020
.50
20.5
020
.50
6.00
7.
008.
007.
0028
.50
28.5
028
.50
28.5
0 17
L F
29
19.6
52
.00
254
.00
56.5
056
.50
55.6
740
.50
40.5
042
.50
41.1
761
.50
59.5
058
.50
59.8
3 17
R
49
.60
460
.50
58.5
058
.50
59.1
746
.00
46.0
046
.00
46.0
072
.50
71.5
074
.50
72.8
3 18
L M
29
23
.0
52.3
02
23.0
022
.50
22.5
022
.67
7.50
8.
508.
508.
1740
.00
38.5
041
.00
39.8
3 18
R
46
.30
420
.50
20.5
020
.00
20.3
311
.00
10.5
010
.50
10.6
743
.00
44.0
043
.50
43.5
0 19
L M
35
23
.7
47.9
0-1
32.5
029
.50
32.0
031
.33
8.00
5.
506.
006.
5050
.00
49.5
050
.00
49.8
3 19
R
20L
F 28
18
.3
53.6
01
32.5
036
.00
34.0
034
.17
10.5
0 11
.00
11.0
010
.83
52.5
053
.00
55.5
053
.67
20R
53.5
01
36.0
038
.00
37.5
037
.17
17.5
0 17
.00
17.5
017
.33
57.5
058
.50
57.0
057
.67
21L
M
27
25.9
34
.40
-234
.50
34.5
033
.50
34.1
77.
00
7.00
7.00
7.00
51.0
046
.50
53.0
050
.17
21R
43.1
0-2
36.5
036
.50
37.0
036
.67
8.00
8.
008.
508.
1749
.50
50.5
050
.00
50.0
0 22
L M
26
22
.3
48.4
04
62.5
063
.50
65.0
063
.67
39.0
0 38
.50
37.5
038
.33
78.5
079
.00
78.0
078
.50
22R
51.4
04
80.0
080
.00
79.5
079
.83
53.0
0 54
.50
52.5
053
.33
75.0
070
.50
75.5
073
.67
23L
F 28
22
.9
55.1
05
54.5
056
.50
58.0
056
.33
19.5
0 17
.50
18.5
018
.50
71.5
072
.00
73.5
072
.33
23R
51.9
04
50.0
049
.00
48.5
049
.17
21.0
0 19
.50
23.0
021
.17
68.0
069
.00
70.0
069
.00
24L
M
34
23.5
49
.00
229
.50
28.0
028
.50
28.6
716
.50
16.5
015
.50
16.1
739
.00
39.5
039
.50
39.3
3 24
R
50
.70
736
.00
36.0
035
.50
35.8
315
.50
17.0
015
.00
15.8
339
.00
38.5
039
.50
39.0
0 25
L F
27
20.0
38
.60
252
.50
48.5
051
.50
50.8
324
.50
23.0
026
.00
24.5
053
.50
54.0
054
.50
54.0
0 25
R
44
.80
259
.00
57.5
060
.50
59.0
029
.50
33.0
033
.50
32.0
073
.50
74.5
079
.50
75.8
3 00
1aL
F 26
22
.3
34.0
02
34.5
035
.00
36.5
035
.33
9.00
9.
0010
.50
9.50
58.0
058
.50
56.5
057
.67
001a
R
36
.00
235
.50
36.5
036
.50
36.1
716
.00
15.5
011
.50
14.3
356
.50
60.5
061
.50
59.5
0

12
3
APP
END
IX 1
3 R
aw d
ata:
Str
etch
and
con
trol
coh
orts
; bas
elin
e, re
-test
(sam
e da
y) a
nd re
test
(one
wee
k)
Bas
elin
e
10
N
Dor
si fl
exed
N
eutra
l
Pla
ntar
Fle
xed
Sx
15L
4 3
43.
678
98.
5 8.
5023
2621
23.3
315
R
0 0.
50
0.17
116
12
9.67
1524
22.5
20.5
016
L 0
00
0.00
13
3.5
2.50
1.5
28.
54.
0016
R
0 0
00.
000.
50.
50
0.33
16.5
13.5
15.5
15.1
717
L 0
3.5
63.
1733
35.5
31.5
33
.33
25.5
21.5
3928
.67
17R
13
10
10.5
11.1
719
.513
16
16.1
729
.533
.528
30.3
318
L 0
00
0.00
01
3.5
1.50
1715
.514
.515
.67
18R
0
00
0.00
10
0 0.
3325
.525
.526
.525
.83
19L
0 0
00.
007
57
6.33
3128
.532
30.5
019
R
20L
0 0
00.
0010
813
.5
10.5
032
.536
34.5
34.3
320
R
6 5.
56
5.83
1314
.513
13
.50
3234
3433
.33
21L
0 0
00.
0015
.511
.514
13
.67
3327
.534
31.5
021
R
0 0
0.5
0.17
1820
22.5
20
.17
24.5
26.5
1823
.00
22L
3.5
04
2.50
26.5
28.5
25.5
26
.83
50.5
4751
.549
.67
22R
13
.5
3.5
78.
0033
.527
.530
30
.33
5755
.547
53.1
723
L 0
00
0.00
2530
.533
29
.50
50.5
48.5
5250
.33
23R
0
00
0.00
18.5
1918
.5
18.6
747
.545
.549
.547
.50
24L
4.5
32.
53.
339.
510
10
9.83
2425
25.5
24.8
324
R
5 3
2.5
3.50
15.5
1717
16
.50
23.5
2123
22.5
025
L 0
21.
51.
1724
19.5
22.5
22
.00
3031
29.5
30.1
725
R
2 2.
54
2.83
2934
29
30.6
741
44.5
25.5
37.0
0
30N
D
orsi
flex
ed
Neu
tral
P
lant
ar F
lexe
d
Sx
15
L 19
.5
1717
.518
.00
34.5
35.5
35
35.0
055
.556
.555
.555
.83

12
4
15R
5
6.5
76.
1727
27.5
23.5
26
.00
5351
5452
.67
16L
5 5
4.5
4.83
1515
.515
15
.17
1816
.517
.517
.33
16R
6
78
7.00
20.5
20.5
20.5
20
.50
28.5
28.5
28.5
28.5
017
L 40
.5
40.5
42.5
41.1
754
56.5
56.5
55
.67
61.5
59.5
58.5
59.8
317
R
46
4646
46.0
060
.558
.558
.5
59.1
772
.571
.574
.572
.83
18L
7.5
8.5
8.5
8.17
2322
.522
.5
22.6
740
38.5
4139
.83
18R
11
10
.510
.510
.67
20.5
20.5
20
20.3
343
4443
.543
.50
19L
8 5.
56
6.50
32.5
29.5
32
31.3
350
49.5
5049
.83
19R
20
L 10
.5
1111
10.8
332
.536
34
34.1
752
.553
55.5
53.6
720
R
17.5
17
17.5
17.3
336
3837
.5
37.1
757
.558
.557
57.6
721
L 7
77
7.00
34.5
34.5
33.5
34
.17
5146
.553
50.1
721
R
8 8
8.5
8.17
36.5
36.5
37
36.6
749
.550
.550
50.0
022
L 39
38
.537
.538
.33
62.5
63.5
65
63.6
778
.579
7878
.50
22R
53
54
.552
.553
.33
8080
79.5
79
.83
7570
.575
.573
.67
23L
19.5
17
.518
.518
.50
54.5
56.5
58
56.3
371
.572
73.5
72.3
323
R
21
19.5
2321
.17
5049
48.5
49
.17
6869
7069
.00
24L
16.5
16
.515
.516
.17
29.5
2828
.5
28.6
739
39.5
39.5
39.3
324
R
15.5
17
1515
.83
3636
35.5
35
.83
3938
.539
.539
.00
25L
24.5
23
2624
.50
52.5
48.5
51.5
50
.83
53.5
5454
.554
.00
25R
29
.5
3333
.532
.00
5957
.560
.5
59.0
073
.574
.579
.575
.83
Re-
test
(sam
e da
y)
10N
D
orsi
flex
ed
Neu
tral
P
lant
ar F
lexe
d
Sx
15
L 0
00
0.00
05
0 1.
6719
25.5
2021
.50
15R
2
2.5
2.5
2.33
48
1.5
4.50
3028
.529
29.1
716
L 0
00
0.00
00.
50
0.17
77.
55
6.50
16R
1
00
0.33
4.5
01
1.83
1013
.511
.511
.67
17L
2.5
8.5
8.5
6.50
40.5
3938
.5
39.3
355
5353
.553
.83
17R
11
10
.56.
59.
3333
3627
.5
32.1
735
4133
.536
.50
18L
0 0
00.
000
00
0.00
23.5
2123
.522
.67

12
5
18R
0
00
0.00
38
3 4.
6727
.524
.529
27.0
019
L 0
00
0.00
75.
59
7.17
3830
.534
.534
.33
19R
20
L 1.
5 0
00.
509.
59
11.5
10
.00
1622
2220
.00
20R
10
7.
58
8.50
1814
.515
15
.83
36.5
3639
.537
.33
21L
0 0
00.
0014
.513
.514
14
.00
2524
.519
.523
.00
21R
1.
5 1
11.
179
1313
11
.67
2020
20.5
20.1
722
L 1
00
0.33
3938
41
39.3
313
.530
.540
.528
.17
22R
26
.5
18.5
16.5
20.5
052
.558
.555
.5
55.5
069
.566
.568
68.0
023
L 3
32.
52.
8323
24.5
23.5
23
.67
43.5
4345
.544
.00
23R
0
00.
50.
1727
16.5
16.5
20
.00
4849
.550
.549
.33
24L
1.5
01.
51.
0012
5.5
0 5.
8329
2828
28.3
324
R
4.5
01.
52.
0013
.515
14.5
14
.33
2627
2626
.33
25L
6 2.
54.
54.
3326
2524
.5
25.1
740
3934
.537
.83
25R
11
11
10.5
10.8
327
30.5
28
28.5
037
.540
4139
.50
30
N
Dor
si fl
exed
N
eutra
l
Pla
ntar
Fle
xed
Sx
15L
7 8
9.5
8.17
3534
.533
34
.17
50.5
51.5
4950
.33
15R
12
11
.511
.511
.67
4542
.543
.5
43.6
759
.559
5758
.50
16L
8 8
6.5
7.50
1414
.517
15
.17
1917
16.5
17.5
016
R
12.5
10
.511
.511
.50
2222
.522
.5
22.3
327
.530
26.5
28.0
017
L 40
40
4441
.33
7067
.567
68
.17
76.5
77.5
7676
.67
17R
49
.5
49.5
50.5
49.8
375
74.5
73.5
74
.33
73.5
7976
.576
.33
18L
13
12.5
12.5
12.6
731
3331
31
.67
4544
.545
44.8
318
R
10.5
10
1110
.50
2728
.526
27
.17
4344
43.5
43.5
019
L 14
16
1615
.33
3736
.538
.5
37.3
357
.555
.555
.556
.17
19R
20
L 10
10
.510
10.1
727
28.5
30
28.5
044
.544
44.5
44.3
320
R
20
2021
20.3
340
3941
40
.00
53.5
5657
.555
.67
21L
8 8.
58.
58.
3335
.536
36
35.8
341
40.5
39.5
40.3
321
R
10.5
10
1010
.17
3233
33
32.6
739
.539
.537
38.6
722
L 32
.5
3231
31.8
374
.574
.575
.5
74.8
377
74.5
76.5
76.0
0
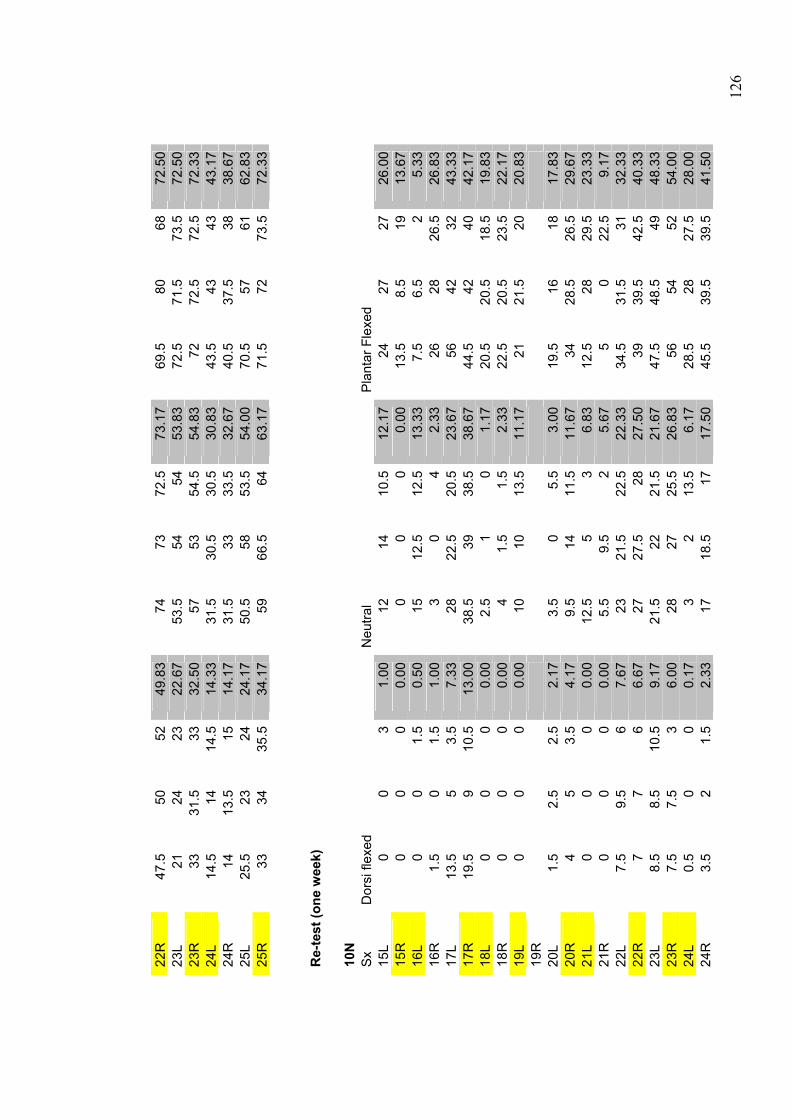
12
6
22R
47
.5
5052
49.8
374
7372
.5
73.1
769
.580
6872
.50
23L
21
2423
22.6
753
.554
54
53.8
372
.571
.573
.572
.50
23R
33
31
.533
32.5
057
5354
.5
54.8
372
72.5
72.5
72.3
324
L 14
.5
1414
.514
.33
31.5
30.5
30.5
30
.83
43.5
4343
43.1
724
R
14
13.5
1514
.17
31.5
3333
.5
32.6
740
.537
.538
38.6
725
L 25
.5
2324
24.1
750
.558
53.5
54
.00
70.5
5761
62.8
325
R
33
3435
.534
.17
5966
.564
63
.17
71.5
7273
.572
.33
Re-
test
(one
wee
k)
10
N
Sx
Dor
si fl
exed
N
eutra
l
Pla
ntar
Fle
xed
15L
0 0
31.
0012
1410
.5
12.1
724
2727
26.0
015
R
0 0
00.
000
00
0.00
13.5
8.5
1913
.67
16L
0 0
1.5
0.50
1512
.512
.5
13.3
37.
56.
52
5.33
16R
1.
5 0
1.5
1.00
30
4 2.
3326
2826
.526
.83
17L
13.5
5
3.5
7.33
2822
.520
.5
23.6
756
4232
43.3
317
R
19.5
9
10.5
13.0
038
.539
38.5
38
.67
44.5
4240
42.1
718
L 0
00
0.00
2.5
10
1.17
20.5
20.5
18.5
19.8
318
R
0 0
00.
004
1.5
1.5
2.33
22.5
20.5
23.5
22.1
719
L 0
00
0.00
1010
13.5
11
.17
2121
.520
20.8
319
R
20L
1.5
2.5
2.5
2.17
3.5
05.
5 3.
0019
.516
1817
.83
20R
4
53.
54.
179.
514
11.5
11
.67
3428
.526
.529
.67
21L
0 0
00.
0012
.55
3 6.
8312
.528
29.5
23.3
321
R
0 0
00.
005.
59.
52
5.67
50
22.5
9.17
22L
7.5
9.5
67.
6723
21.5
22.5
22
.33
34.5
31.5
3132
.33
22R
7
76
6.67
2727
.528
27
.50
3939
.542
.540
.33
23L
8.5
8.5
10.5
9.17
21.5
2221
.5
21.6
747
.548
.549
48.3
323
R
7.5
7.5
36.
0028
2725
.5
26.8
356
5452
54.0
024
L 0.
5 0
00.
173
213
.5
6.17
28.5
2827
.528
.00
24R
3.
5 2
1.5
2.33
1718
.517
17
.50
45.5
39.5
39.5
41.5
0

12
7
25L
0 0
1.5
0.50
27.5
32.5
37
32.3
347
41.5
55.5
48.0
025
R
16
8.5
710
.50
34.5
3335
34
.17
48.5
45.5
47.5
47.1
7
30N
S
x D
orsi
flex
ed
Neu
tral
P
lant
ar F
lexe
d
15
L 12
.5
1212
.512
.33
3737
.534
.5
36.3
351
5352
.552
.17
15R
5.
5 5.
55
5.33
26.5
26.5
29.5
27
.50
5154
.554
53.1
716
L 18
17
1817
.67
3130
30
30.3
322
.516
.511
.516
.83
16R
17
.5
18.5
18.5
18.1
736
.537
.534
.5
36.1
746
4749
47.3
317
L 39
36
3536
.67
57.5
5253
.5
54.3
377
6659
.567
.50
17R
44
.5
43.5
4343
.67
65.5
6562
64
.17
7672
7373
.67
18L
9 10
.59
9.50
3635
35
35.3
342
43.5
43.5
43.0
018
R
9.5
8.5
99.
0034
.534
33.5
34
.00
44.5
4343
.543
.67
19L
3.5
44
3.83
32.5
3332
.5
32.6
738
3838
.538
.17
19R
20
L 11
.5
1312
.512
.33
31.5
3031
30
.83
36.5
3435
35.1
720
R
15
1613
.514
.83
3735
34.5
35
.50
5651
.547
51.5
021
L 5.
5 6
65.
8338
37.5
40
38.5
052
.548
52.5
51.0
021
R
4 4
5.5
4.50
34.5
3637
35
.83
52.5
5251
51.8
322
L 29
29
.526
.528
.33
4746
48
47.0
060
5959
59.3
322
R
31
3231
31.3
359
.558
.561
59
.67
6867
.569
.568
.33
23L
26
26.5
26.5
26.3
347
48.5
48
47.8
371
.573
73.5
72.6
723
R
27
27.5
2727
.17
54.5
55.5
55.5
55
.17
7675
.576
.576
.00
24L
18
18.5
18.5
18.3
344
43.5
44
43.8
343
4443
43.3
324
R
18.5
18
.518
.518
.50
3737
.539
.5
38.0
058
.558
57.5
58.0
025
L 33
.5
3536
34.8
365
.562
68.5
65
.33
7778
.576
77.1
725
R
38
3735
.536
.83
7374
76
74.3
375
79.5
7476
.17