Embed Size (px)
Citation preview

ENG460 Thesis Brendan Fidock 30387869 15/5/2010
School of Engineering and Energy
ENG460 Engineering Thesis
The A1 Wind Farm:
An investigation into the voltage control, network support capability and
stability of the A1 distribution network.
A report submitted to the School of Engineering and Energy, Murdoch University in
partial fulfilment of the requirements for the degree of Bachelor of Engineering
Submitted: May 2010
Author: Brendan Fidock
Student No 30387869
Academic Supervisor: Dr Martina Calais
Industrial Supervisors: Tom Pearcy and Njabulo Mlilo
Unit Coordinator: Professor Parisa Bahri

ENG460 Thesis Brendan Fidock 30387869 15/5/2010 i
Abstract
The wind energy generation investigated by this thesis is the A1 Wind Farm. This
thesis aims to investigate the voltage control capabilities of the wind farm and how
the wind farm is able to provide network voltage support through the generation and
absorption of reactive power. The thesis also aims to investigate how the voltage
control capabilities and reactive power support affect the voltage stability of the
network. These aims will be referred to as voltage control, network support capability
and stability of the network.
The A1 Wind Farm consists of twelve 1800kW wind turbine generators,
manufactured by ENERCON. These wind turbines are variable speed, pitch
controlled, using synchronous generators with a full scale power converter which is
coupled to the SWIS. Specifically, the role of the A1 Wind Farms power converter
and its control has been investigated. The power converter has proven to be vital to
the voltage control, network support capability and stability of the A1 Distribution
Network. The thesis analyses the A1 Wind Farm (AWF) by using PowerFactory
Version 14. This is used to construct a model that represents the A1 distribution
network and A1 Wind Farm. These simulations are conducted using steady state and
transient conditions.
The findings of the steady state investigation was that operating the AWF at a limited
active power output of 15MW and a power factor of 0.95 leading would result in the
least impact on the voltage of the Western Power customers. By using limited active
power and power factor control (PQ) it resulted in the least amount of tap changers
with a changing load and AWF generation. In turn this resulted in reduced-
ENG460 Thesis Brendan Fidock 30387869 15/5/2010 ii
maintenance of the tap changer and a decrease in voltage fluctuations at the 22kV
busbar of the A1 zone substation.
The power factor of 0.95 leading (absorbing reactive power) also compensated for the
voltage rise in the capacitive transmission and distribution network during low load
conditions. When using a fixed PQ control for the “constructed” AWF model, it acts
like a negative load model. Thus, all the synchronous generator reactive power
capabilities had no influence on the voltage at steady state. This is because the
reactive power flow of the generator is decoupled by the power converter.
From the transient investigation, it was concluded that the AWF must have under
voltage ride through (UVRT) capabilities. UVRT is important to the voltage control,
network support capability and stability of the A1 network, because this specific
capability allows the AWF to remain online and to generate reactive power output
even if its voltage is under the required limits. If the AWF was required to disconnect
after a fault then the voltage levels and stability would be worse than if it remained
connected. Also, using the same PQ control used for the steady state investigation for
transient analysis caused problematic results. This is because PQ control makes the
power converter absorb reactive power after the fault has been cleared when in fact
the power converter control should support the voltage by generating reactive power.

ENG460 Thesis Brendan Fidock 30387869 15/5/2010 iii
Therefore, by reverting to voltage control from constant PQ control, the AWF has
also reverted from absorbing reactive power to generating reactive power. In doing
this the AWF has provided reactive power support following the fault. Thus, the AWF
should utilise V control instead of PQ control under transient conditions and this
voltage control and UVRT should be triggered by the under voltage of 0.8 per unit.
In conclusion, under transient conditions, the under voltage ride through capabilities
of the A1 Wind Farm were essential to the voltage control, network support capability
and stability of the A1 distribution network.

ENG460 Thesis Brendan Fidock 30387869 15/5/2010 iv
Confidentiality notice The wind farm within this thesis has been referred to as the A1 Wind Farm due to
confidentiality agreements between the wind farms owners and Western Power. To
protect all parties from litigation issues, the intention of the author is not to refer to
any particular wind farm but to a general hypothetical model. This will be referred to
from now on as the A1 Wind Farm.

ENG460 Thesis Brendan Fidock 30387869 15/5/2010 v
Acknowledgments The author would like to thank my Western Power Supervisors Njabulo Mlilo and
Tom Pearcy and my Murdoch University supervisor Martina Calais.
Njabulo Mlilo, for facilitating the initial stages of the thesis, organising my mentoring
with Tom Pearcy and providing the resources required to complete the project.
Tom Pearcy, for his guidance and expertise is this area. I acknowledge that his
mentoring and tutoring has been vital to my understanding and to the success of this
thesis.
Martina Calais, for your efforts to get the thesis started and for her continued support
and drive. Her motivation and guidance has lead to an in depth understanding of the
topic and development of research skills that will remain throughout my engineering
career.

ENG460 Thesis Brendan Fidock 30387869 15/5/2010 vi
Table of Contents Abstract ...................................................................................................................................... i
Confidentiality notice ............................................................................................................... iv
Acknowledgments ..................................................................................................................... v
Table of Contents ..................................................................................................................... vi
List of Figures ........................................................................................................................ viii
List of Tables ............................................................................................................................ ix
List of Acronyms ....................................................................................................................... x
1 Introduction ....................................................................................................................... 1
1.1 Thesis structure and aims ......................................................................................... 3
1.2 Thesis scope outline ................................................................................................. 5
2 Background ....................................................................................................................... 6
2.1 South West Interconnected System .......................................................................... 7
2.2 SWIS structure ......................................................................................................... 8
2.3 SWIS voltage limits ................................................................................................. 9
2.4 SWIS stability .......................................................................................................... 9
2.5 Disturbances ........................................................................................................... 10
2.6 Steady state stability............................................................................................... 11
2.7 Transient stability ................................................................................................... 11
2.8 Voltage stability ..................................................................................................... 12
2.9 Wind generations impact on stability ..................................................................... 14
3 The A1 distribution structure and AWF .......................................................................... 16
3.1 A1 distribution structure ........................................................................................ 16
3.2 Substation loads ..................................................................................................... 18
3.3 A1 Wind Farm feeders ........................................................................................... 20
3.4 A1 Wind Farm ....................................................................................................... 21
3.5 ENERCON wind turbines ...................................................................................... 22
3.6 Power converter coupled generator construction ................................................... 22
3.7 The power converter .............................................................................................. 24
3.7.1 Power converter operation performance ............................................................ 24
3.7.2 Control of the power converter .......................................................................... 26
3.7.3 ENERCON fault ride through capabilities ........................................................ 28
3.7.4 ENERCON under voltage ride through (UVRT) .............................................. 29
3.7.5 A1 Wind Farm under voltage ride through (UVRT) ......................................... 30
ENG460 Thesis Brendan Fidock 30387869 15/5/2010 vii
4 Network modelling approach .......................................................................................... 31
4.1 Data collection ....................................................................................................... 31
4.2 PowerFactory construction .................................................................................... 33
4.3 Models .................................................................................................................... 34
4.3.1 External grid model ........................................................................................... 34
4.3.2 Terminal model .................................................................................................. 35
4.3.3 Transformer model ............................................................................................ 35
4.3.4 General load model ............................................................................................ 37
4.3.5 Induction machine model .................................................................................. 37
4.3.6 Line model ......................................................................................................... 38
4.3.7 Synchronous generator model ........................................................................... 39
4.3.8 Rectifier model .................................................................................................. 41
4.3.9 Inverter model .................................................................................................... 41
5 Testing the PowerFactory simulation .............................................................................. 44
5.1 Steady state investigations ..................................................................................... 44
5.1.1 Determine maximum active power output from the A1 Wind Farm. ................ 45
5.1.2 Preferred A1 Wind Farm power factor .............................................................. 47
5.1.3 Scenario 1 Analysis (A1 Wind Farm output = 1MW, Peak load = 40MW) ...... 52
5.1.4 Scenario 2 Analysis (A1 Wind Farm output = 15MW, low load = 10MW) ..... 52
5.1.5 Optimum power factor at steady state ............................................................... 54
5.1.6 A1 Wind Farm model steady state behaviour .................................................... 56
5.1.7 Conclusions of steady state investigation .......................................................... 58
5.2 Transient investigations ......................................................................................... 59
5.3 Scenario 3, analysis using PQ control (22kV busbar fault) ................................... 61
5.3.1 Voltage per unit analysis ................................................................................... 62
5.3.2 Reactive power analysis .................................................................................... 63
5.4 Scenario 3, analysis using voltage control (22kV busbar fault) ............................. 67
5.4.1 Voltage per unit and reactive power analysis (voltage control) ........................ 68
5.4.2 Conclusions from the transient investigation (voltage control) ......................... 70
6.0 Scope for future work ...................................................................................................... 72
6.1 Expansion of the A1 Wind Farm (AWF) ............................................................... 72
6.2 Optimising the active power output ....................................................................... 72
6.3 Further investigation of voltage instability ............................................................ 73
7 Conclusion ....................................................................................................................... 74
8 References ....................................................................................................................... 76
Appendices .............................................................................................................................. 78

ENG460 Thesis Brendan Fidock 30387869 15/5/2010 viii
List of Figures
Figure 1: South West Interconnected System [1] ...................................................................... 7 Figure 2: Diagram of SWIS structure [1] .................................................................................. 8 Figure 3: A1 zone substation layout [1] .................................................................................. 17 Figure 4: A1 peak load forecast 1996 to 2027 [1] ................................................................... 18 Figure 5: Direct-drive power converter generator [9] ............................................................. 23 Figure 6: General capability chart of ENERON wind turbines with FACTS Capabilities: .... 25 Figure 7: Structure of ENERCON farm Control Unit for wind farm voltage control [11] ..... 27 Figure 8: External Grid model [13] ......................................................................................... 34 Figure 9: Delta – Delta transformer model [13] ...................................................................... 36 Figure 10: Delta – Wye neutral transformer model [13] ......................................................... 36 Figure 11: Balanced three phase PQ load model [13] ............................................................. 37 Figure 12: Three phase induction machine model [13] ........................................................... 37 Figure 13: HV Cable models ................................................................................................... 38 Figure 14: Synchronous generator model [13] ........................................................................ 39 Figure 15: Rectifier model [13] ............................................................................................... 41 Figure 16: Pulse width modulator inverter model [13] ........................................................... 41 Figure 17: A1 distribution network and the A1 Wind Farm model created within
PowerFactory. .......................................................................................................................... 43 Figure 18: Inverter theory in relation to power factor [adapted from 16] ............................... 48 Figure 19: A1 Wind Farm connection busbar, 22kV busbar fault simulation ......................... 62 Figure 20: A1 Wind Farm connection busbar, 22kV busbar fault simulation. ........................ 66 Figure 21: A1 Wind Farm connection busbar, 22kV busbar fault simulation (voltage control)
................................................................................................................................................. 68

ENG460 Thesis Brendan Fidock 30387869 15/5/2010 ix
List of Tables
Table 1: Steady state optimum power factor test .................................................................... 51
ENG460 Thesis Brendan Fidock 30387869 15/5/2010 x
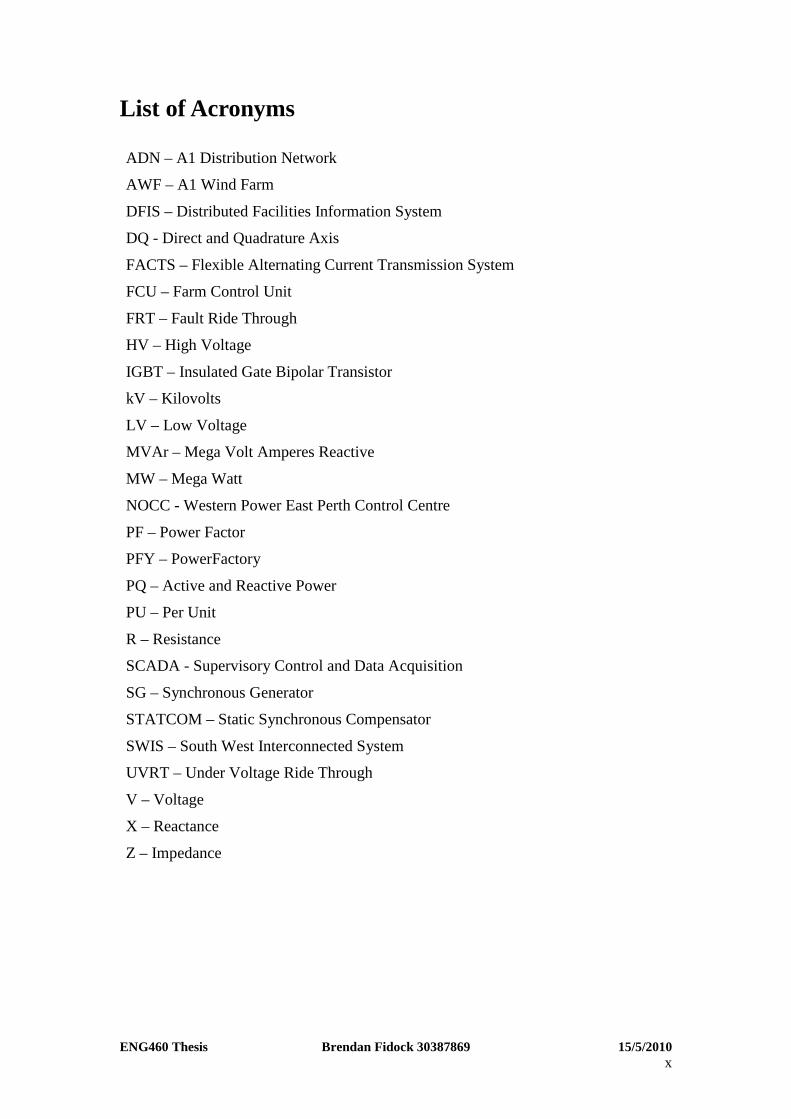
List of Acronyms
ADN – A1 Distribution Network
AWF – A1 Wind Farm
DFIS – Distributed Facilities Information System
DQ - Direct and Quadrature Axis
FACTS – Flexible Alternating Current Transmission System
FCU – Farm Control Unit
FRT – Fault Ride Through
HV – High Voltage
IGBT – Insulated Gate Bipolar Transistor
kV – Kilovolts
LV – Low Voltage
MVAr – Mega Volt Amperes Reactive
MW – Mega Watt
NOCC - Western Power East Perth Control Centre
PF – Power Factor
PFY – PowerFactory
PQ – Active and Reactive Power
PU – Per Unit
R – Resistance
SCADA - Supervisory Control and Data Acquisition
SG – Synchronous Generator
STATCOM – Static Synchronous Compensator
SWIS – South West Interconnected System
UVRT – Under Voltage Ride Through
V – Voltage
X – Reactance
Z – Impedance
ENG460 Thesis Brendan Fidock 30387869 15/5/2010 1
1 Introduction Although wind energy generation has the largest proportion of renewable energy
generation in Western Australia, little research has been conducted into its voltage
control and the impact of this control on the South West Interconnected System
(SWIS). Therefore, the purpose of this research is to investigate the voltage control
capabilities of a wind farm and how the wind farm is able to provide network voltage
support through the generation and absorption of reactive power.
The wind energy generator that is investigated by this thesis is the A1 Wind Farm.
This is because this thesis aims to investigate the voltage control and network support
capability of power converter coupled wind generation within the SWIS. Thus, the A1
Wind Farm was chosen because it uses power converter coupled technology and plays
a vital role in voltage control, network support and stability of the A1 Distribution
Network within the SWIS.
Furthermore, the role of the A1 Wind Farms power converter and its control has been
investigated. The power converter has proven to be vital to the voltage support,
control and stability of the A1 Wind Farm (AWF).
In order to understand the power converters control, the background of the A1 Wind
Farms turbine technology was investigated and understood. Once completed the thesis
analyses the A1 Wind Farm by using PowerFactory Version 14 to construct a model
that represents the A1 distribution network and the A1 Wind Farm.

ENG460 Thesis Brendan Fidock 30387869 15/5/2010 2
This model is used to simulate different generation outputs and loads, while changing
the power factor and the control of the A1 Wind Farm.
These simulations are conducted using steady state and transient investigations.
The steady state investigation uses two worst case scenarios. These scenarios are used
to investigate the A1 Wind Farms impact on voltage fluctuations, at the 22kV busbar
of the A1 zone substation.
The transient investigation uses one worst case scenario and transient condition. The
transient condition is created by a short circuit fault at the 22kV busbar. This is to test
the control, voltage support and voltage stability of the A1 Wind Farm under transient
conditions and to validate or reject the findings of the steady state investigation.

ENG460 Thesis Brendan Fidock 30387869 15/5/2010 3
1.1 Thesis structure and aims
The structure of the thesis is sectionalised in order to cover the aims of the thesis.
Each section and its sub section will cover a different aim. The outline of the section
structure and the aims are as follows:
Section Aim
Section 2 Review the structure of the SWIS.
Review the SWIS voltage limits.
Define steady state, transient and voltage stability.
Investigate and discuss the impact of wind generation on
stability.
Choose a distribution network for a case study (the A1
distribution network)
Section 3 Describe the A1 distribution network structure and zone
substation loads.
Investigate and discuss the A1 Wind Farm.
Describe the ENERCON wind turbines and their use of
synchronous generation with power converter coupled
technology.
Investigate and discuss ENERCON and the A1 Wind Farm
fault ride through capabilities.

ENG460 Thesis Brendan Fidock 30387869 15/5/2010 4
Section 4 Model and simulate the A1 distribution network and A1 Wind
Farm.
Describe how this model was constructed using Power Factory.
Section 5 Test the model using steady state and transient network
conditions.
Investigate and discuss the A1 Wind Farms control, behaviour
and voltage stability that results from both steady state and
transient conditions.
Section 6 Discuss the scope of future work that could be based upon this
thesis.

ENG460 Thesis Brendan Fidock 30387869 15/5/2010 5
1.2 Thesis scope outline
The scope of this thesis is limited to the A1 distribution network and how it is affected
by the A1 Wind Farm and its control. The impact on the SWIS has been limited to a
distribution network level. This is because there are many different factors that impact
on the voltage of the SWIS and it is not the purpose of this thesis to analyse all of
these factors.
However, the power system analysis of the A1 distribution network and the theories
discussed in relation to power, voltage control and stability can still be applied to the
SWIS. Although, the theories developed may have to be applied differently due to
higher system voltages, generator technologies, network size and diversity.
For the steady state investigation, the scope of this thesis has been limited to two
worst case scenarios. This is a conventional approach to power system analysis. This
approach is replicated by Western Power. By analysing the worst case scenarios this
thesis has determined the limits of the A1 Wind Farm.
The transient investigation has been limited to one worst case scenario. This scenario
uses a three phase short circuit fault at the 22kV busbar of the A1 zone substation. In
doing this, the behaviour of the AWF’s voltage control and reactive support
capabilities are specifically tested.

ENG460 Thesis Brendan Fidock 30387869 15/5/2010 6
2 Background Within the South West Interconnected System or SWIS, the connection of wind farms
is a regular occurrence. The wind farm that is investigated within this thesis is the A1
Wind Farm. This wind farm affects the voltage stability of the A1 Network. This
thesis conducts steady state and transient investigations to determine its voltage
control, network support capability and stability of the network. Before this
investigation can be performed, one must understand the structure of the SWIS and
the A1 Distribution Network.
ENG460 Thesis Brendan Fidock 30387869 15/5/2010 7
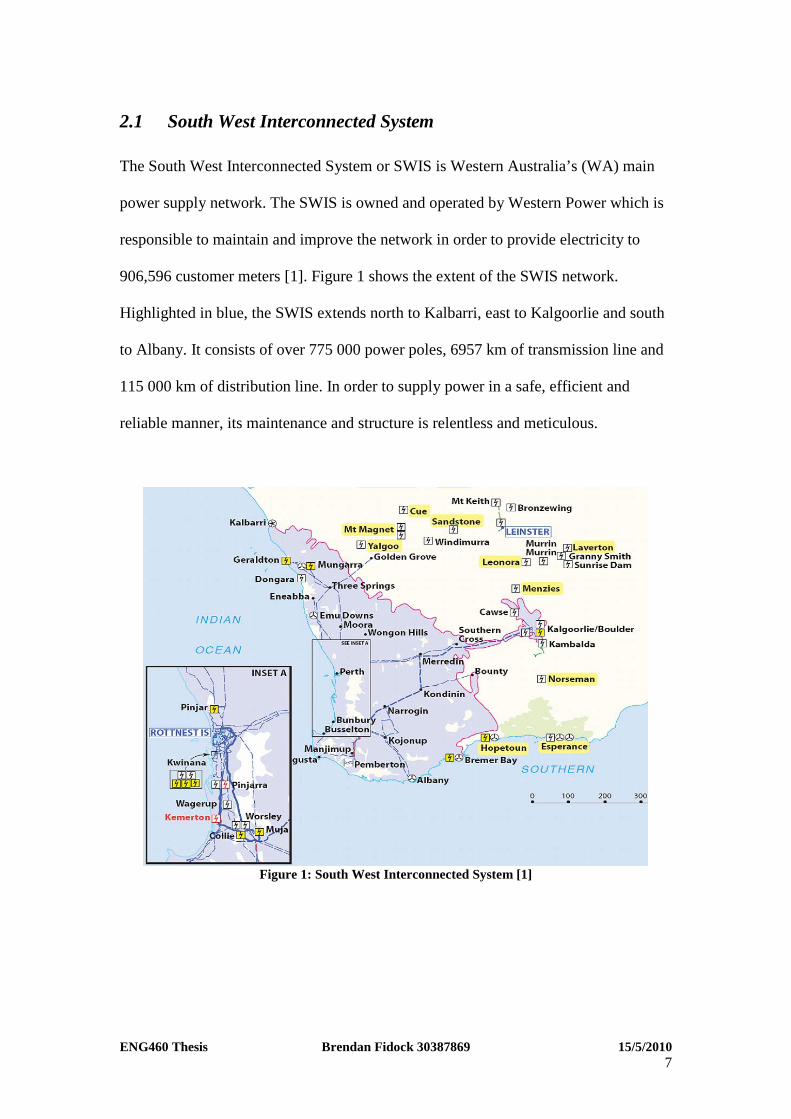
2.1 South West Interconnected System
The South West Interconnected System or SWIS is Western Australia’s (WA) main
power supply network. The SWIS is owned and operated by Western Power which is
responsible to maintain and improve the network in order to provide electricity to
906,596 customer meters [1]. Figure 1 shows the extent of the SWIS network.
Highlighted in blue, the SWIS extends north to Kalbarri, east to Kalgoorlie and south
to Albany. It consists of over 775 000 power poles, 6957 km of transmission line and
115 000 km of distribution line. In order to supply power in a safe, efficient and
reliable manner, its maintenance and structure is relentless and meticulous.
Figure 1: South West Interconnected System [1]
ENG460 Thesis Brendan Fidock 30387869 15/5/2010 8
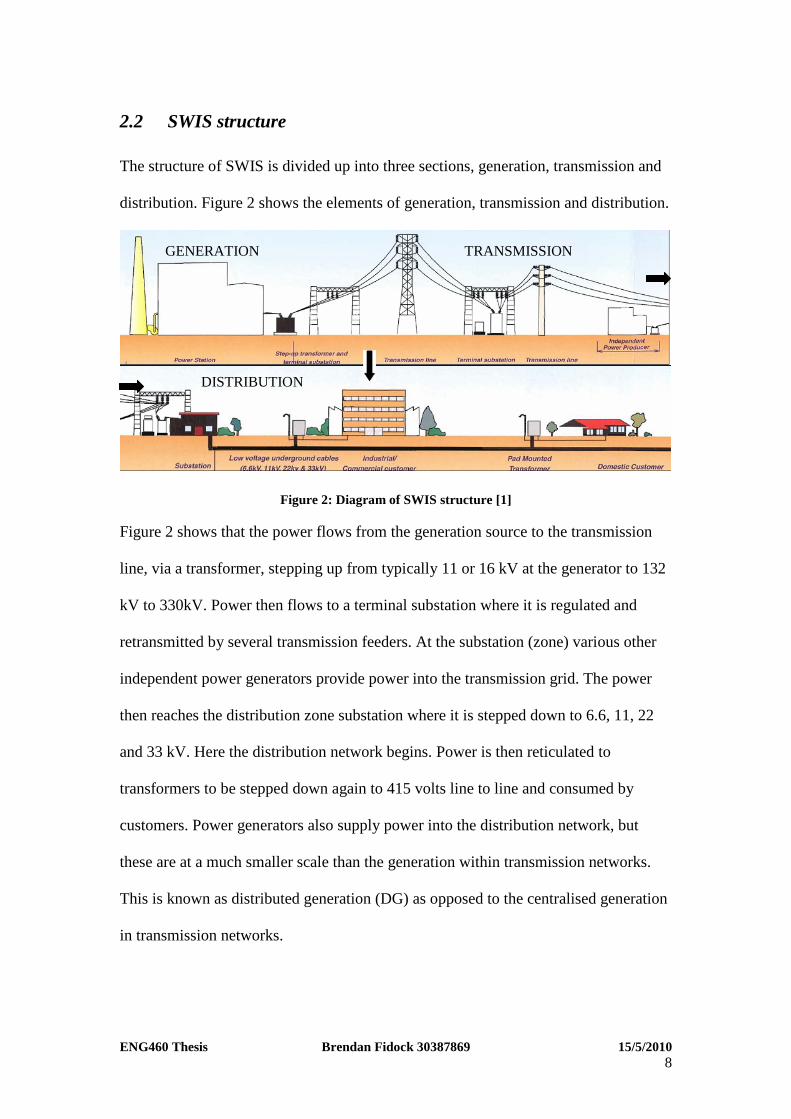
2.2 SWIS structure
The structure of SWIS is divided up into three sections, generation, transmission and
distribution. Figure 2 shows the elements of generation, transmission and distribution.
Figure 2: Diagram of SWIS structure [1]
Figure 2 shows that the power flows from the generation source to the transmission
line, via a transformer, stepping up from typically 11 or 16 kV at the generator to 132
kV to 330kV. Power then flows to a terminal substation where it is regulated and
retransmitted by several transmission feeders. At the substation (zone) various other
independent power generators provide power into the transmission grid. The power
then reaches the distribution zone substation where it is stepped down to 6.6, 11, 22
and 33 kV. Here the distribution network begins. Power is then reticulated to
transformers to be stepped down again to 415 volts line to line and consumed by
customers. Power generators also supply power into the distribution network, but
these are at a much smaller scale than the generation within transmission networks.
This is known as distributed generation (DG) as opposed to the centralised generation
in transmission networks.
GENERATION TRANSMISSION
DISTRIBUTION

ENG460 Thesis Brendan Fidock 30387869 15/5/2010 9
2.3 SWIS voltage limits
The voltage limits of the SWIS are specified by the Western Power Technical Rules
[2]. Within distribution networks the high voltage limits are 0.9 to 1.1 pu, or plus or
minus 10% [2].
If a generator remains outside these voltage limits for longer than a stipulated time
then voltage instability can occur. However, for each wind generator the connection
requirements are specifically negotiated with Western Power. This is because not all
wind generators, such as the induction type, can provide full voltage support and may
have to be disconnected during emergency conditions. These connection agreements
between the wind farm owner and Western Power are confidential and are not
available due to possible litigation issues. However, the approach of this thesis is to
utilise the above voltage limits to determine voltage stability of the A1 Wind Farm.
In order to understand voltage stability, the stability of the SWIS is outlined. In doing
this, the disturbances that affect the stability of the SWIS and their relation to
transient and voltage stability are discussed.
2.4 SWIS stability
For Western Power to provide a reliable service, the SWIS must remain intact and be
capable of withstanding a wide variety of disturbances. Therefore, the SWIS has been
designed and operated to allow for contingencies to minimize the impact of
disturbances.

ENG460 Thesis Brendan Fidock 30387869 15/5/2010 10
This is so that a disturbance does not cause the network to become unstable, as the
loss of stability may result in uncontrolled, widespread power interruptions. Thus, it is
vital that disturbances and the theory of stability are understood.
2.5 Disturbances
In relation to power systems, a large disturbance is one for which the nonlinear
equations describing disturbances dynamics cannot be linearised for analysis.
Examples of these are transmission system faults, sudden load changes and the loss of
generating units or transmission line outages [3].
A small disturbance occurs when a power system operating in a steady state condition
undergoes a change in which case it can be analysed by the linearised versions of its
dynamic algebraic equations. This could be a change in voltage regulator tap or the
outage of a distribution line.
The reader should note the small disturbance definition, as a small disturbance will be
used in the transient investigation of this thesis.
There are two types of stability investigations that evaluate the impact of power flows
and disturbances on the distribution network. These are steady state investigations and
transient investigations.
ENG460 Thesis Brendan Fidock 30387869 15/5/2010 11
2.6 Steady state stability
A power system is in a steady-state operating condition, if all the measured or
calculated quantities of the system are constant for analysis. When operating in a
steady-state condition, if a sudden change in parameters of the system occurs, then the
system has undergone a disturbance. Disturbances can be large or small depending on
their origin [4].
The power system is “steady-state” stable, if it returns to a satisfactory steady state
condition following a small disturbance. For the purpose of analysis the satisfactory
voltage is stipulated by the SWIS voltage limits under emergency conditions. As
outlined is section 2.3, these are 0.9 to 1.1 per unit.
2.7 Transient stability
Transient stability investigations are commonly undertaken by Western Power’s
planning departments. These ensure the proper dynamic performance of the system
and that the generator adheres to the Western Powers connection criteria.
Following a large or small disturbance, if a significantly different but satisfactory
steady state operating condition is attained, then the system is “transiently” stable [4].

ENG460 Thesis Brendan Fidock 30387869 15/5/2010 12
2.8 Voltage stability
The term ‘voltage stability’ is described as “the ability of a power system to maintain
steady acceptable voltages at all buses in the system under normal operating
conditions and after being subjected to a small disturbance” [4].
A system enters a state of voltage instability when a disturbance, increase in load
demand, or change in system condition causes a progressive and uncontrollable
collapse in voltage.
The main factor that causes voltage instability is the inability of the power system to
meet the demand for reactive power.
Voltage instability is essentially a local phenomenon; however, its consequences may
have a widespread impact. ‘Voltage collapse’ is more complex than voltage instability
and is usually the result of a sequence of events accompanying voltage instability.
Voltage collapse leads to a low voltage profile in a significant part of the power
system [4].
Within this thesis, the analysis of voltage stability has been limited to the A1
distribution network. However, as stated before, in complex power systems such as
the entire SWIS, many factors contribute to the process of voltage collapse because of
voltage instability. These are the strength of the transmission and distribution system,
power transfer levels, load characteristics, generator reactive power capability limits
and characteristics of compensating devices [4].

ENG460 Thesis Brendan Fidock 30387869 15/5/2010 13
After discussing stability, it is vital to outline how wind generation impacts on it. The
relevant issues that attribute to wind generations impact are different to those of fossil
fuel generation. This is because the wind resource is not always constant and the best
wind resources are usually in remote locations where the strength of the distribution
network is weak. Also, different wind generation technology is used and not all of
these technologies can provide voltage control and network support.

ENG460 Thesis Brendan Fidock 30387869 15/5/2010 14
2.9 Wind generations impact on stability
Wind energy generation main impacts on stability can be attributed to the following:
• Wind site locations
• Connection at lower voltage levels
• Wind Fluctuation
• Limited predictability
Historically, wind resources and hence wind energy generation are usually located at
different locations than conventional power stations. The best wind generation site
can also be the worst to transport electricity from as these sites are often remote and at
a weak point of the SWIS. At weak points in the SWIS the fault level is low. This
results from the high impedance at that point in the network. Therefore, if the wind
farm participates in voltage support, then the ability to distribute the generated active
or reactive power is limited by this high impedance.
Power converter coupled wind generators, like the A1 Wind Farm, are usually
connected to lower voltage levels than conventional power stations. At lower voltages
wind generation cannot participate in the control of stability at a transmission level,
however, these can contribute to the control of voltage stability at a distribution level.
This means that if there is a fault on the transmission network, then the A1 Wind
Farm will not be able to impact on the stability of the transmission network.

ENG460 Thesis Brendan Fidock 30387869 15/5/2010 15
The fluctuating nature of wind power could be perceived as a problem for voltage
system stability. However, for large wind turbines, the wind generation output
variations of minutes are slow in comparison to the voltage stability time frame of
seconds [5]. Although, if the active power output of the A1 Wind Farm dropped
below 20%, just before or during a fault, then this would limit its ability to supply
reactive power and voltage support. This is because, at less than 20% of its output, the
reactive power supplied is proportional to the active power output. This is discussed
in more detail in section 3.7.1.
Systems with a high amount of wind power penetration usually require a higher
spinning reserve than power systems utilising only fossil fuel generation. This is
because of the limited predictability of wind speed and thus, the limited predictability
of the output. Therefore, the higher the wind power penetration into the SWIS or the
A1 distribution network, then the higher the influence that the wind fluctuations will
have on the stability of other generators within the SWIS and A1 network [5].
Now that the thesis background has been discussed, the investigation into the A1
Wind Farms and surrounding network can be outlined. Section 3 will outline the A1
distribution network structure, the A1 Wind Farm and utilisation of ENERCON’Ss
variable speed, synchronous generator, power converter coupled concept.
It is important to outline the A1 distribution network structure and the A1 Wind Farm,
to understand what is needed to be modelled for the steady state and transient
investigations.
ENG460 Thesis Brendan Fidock 30387869 15/5/2010 16
3 The A1 distribution structure and AWF
The network chosen for the case study is the A1 distribution network.
The A1 network was chosen because it met the following characteristics:
• Utilised power converter coupled wind generation technology (ENERCON
wind turbines)
• Wind energy generation was on a distribution network voltage level (22kV)
• The A1 distribution network was in a remote location
• Specific steady state and transient voltage stability studies had been performed
by Western Power, therefore, this thesis could be compared and validated.
3.1 A1 distribution structure
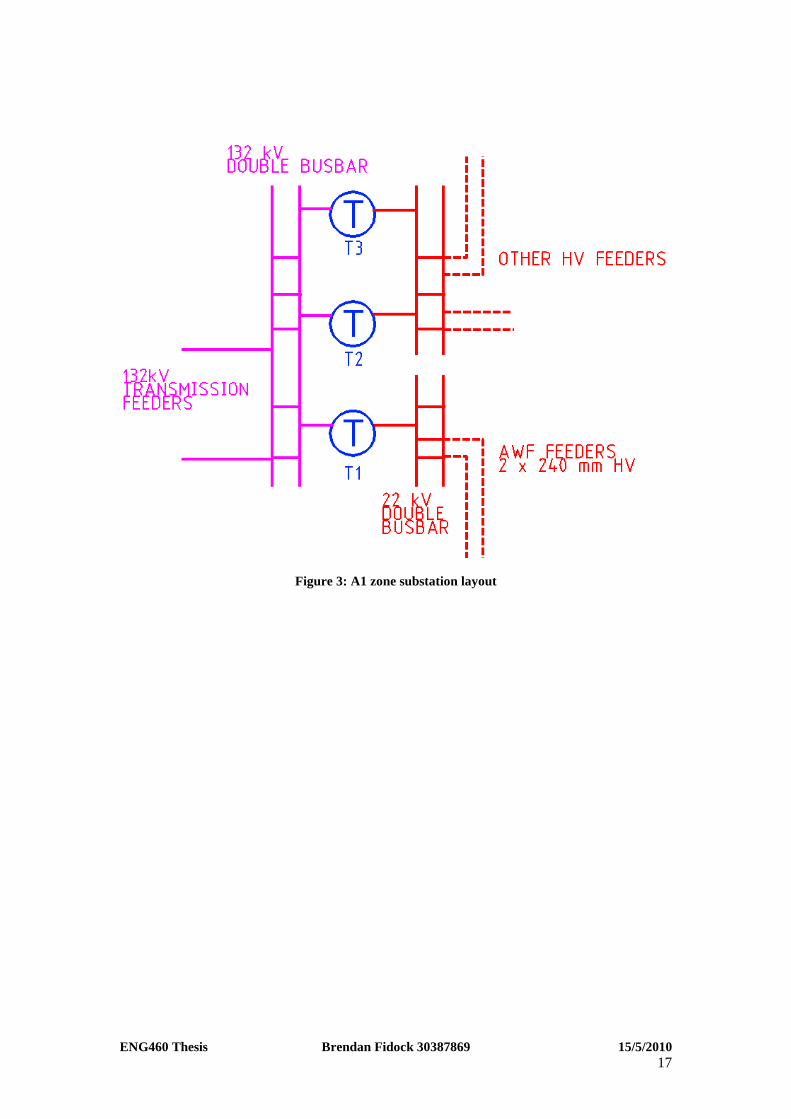
The A1 distribution network (ADN) comprises of the 132/22 kV A1 zone substation.
It supplies power to the local town and the surrounding district. It is supplied by two
132kV lines from the M1 power station and there are three large 132/22kV
transformers that transform the voltage from transmission levels to distribution levels.
There are two 20MVA transformers (T1 and T3) and one 24 MVA transformer (T2).
The normal mode of operation for the transformers is for 2 transformers to run in
parallel, with the other on stand-by. However, due to high loads during summer and
winter, it is necessary to switch 3 transformers into service during peak periods. As
shown in Figure 3, the A1 Wind Farm high voltage feeders connect to the 22kV
busbar of the transformer 1 (T1).
ENG460 Thesis Brendan Fidock 30387869 15/5/2010 17
Figure 3: A1 zone substation layout
ENG460 Thesis Brendan Fidock 30387869 15/5/2010 18
3.2 Substation loads
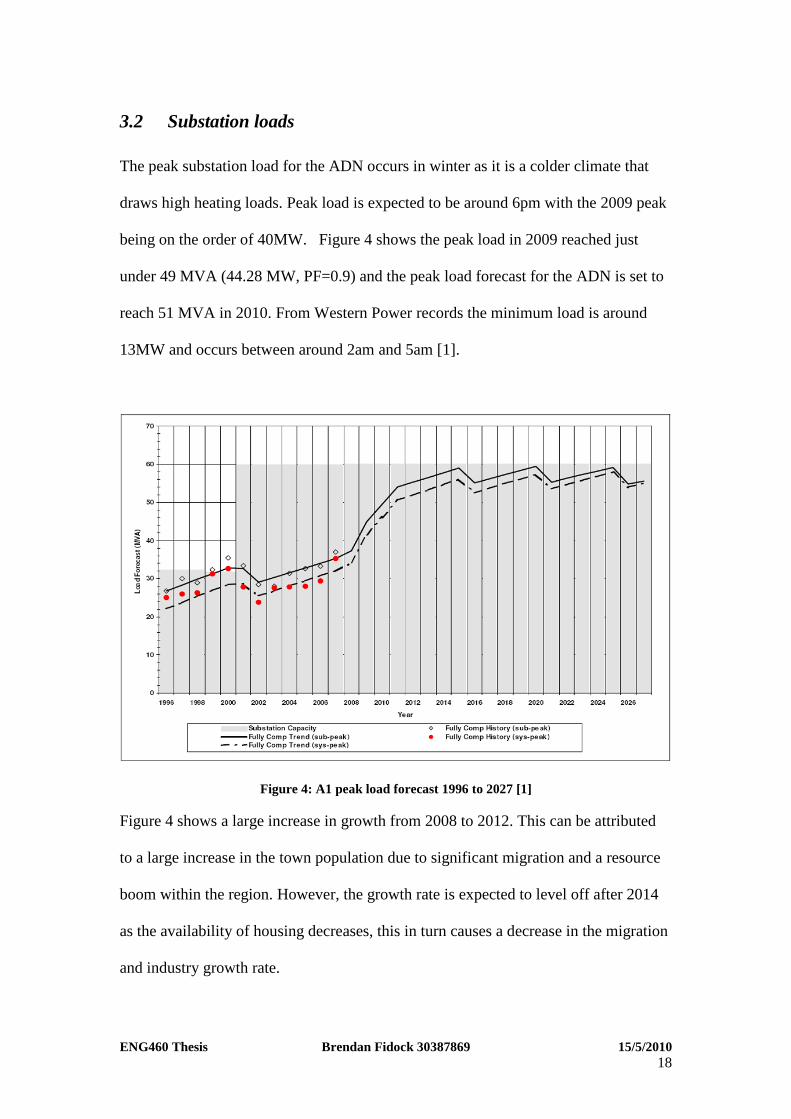
The peak substation load for the ADN occurs in winter as it is a colder climate that
draws high heating loads. Peak load is expected to be around 6pm with the 2009 peak
being on the order of 40MW. Figure 4 shows the peak load in 2009 reached just
under 49 MVA (44.28 MW, PF=0.9) and the peak load forecast for the ADN is set to
reach 51 MVA in 2010. From Western Power records the minimum load is around
13MW and occurs between around 2am and 5am [1].
Figure 4: A1 peak load forecast 1996 to 2027 [1]
Figure 4 shows a large increase in growth from 2008 to 2012. This can be attributed
to a large increase in the town population due to significant migration and a resource
boom within the region. However, the growth rate is expected to level off after 2014
as the availability of housing decreases, this in turn causes a decrease in the migration
and industry growth rate.

ENG460 Thesis Brendan Fidock 30387869 15/5/2010 19
The peak and trough substation loads are important for creating the worst case
scenarios for the steady state and transient investigations. Using the information
above, an average peak load of 40MW and trough load of 10MW was decided upon to
test the worst case scenarios.
As previously stated, the A1 Wind Farm is connected to the 22kV busbar of the A1
zone substation via A1 Wind Farm feeders. These feeders are important as this thesis
investigates power flows on the A1 Wind Farm feeders specifically.

ENG460 Thesis Brendan Fidock 30387869 15/5/2010 20
3.3 A1 Wind Farm feeders
For the A1 Wind Farm (AWF) to distribute power to the ADN efficiently, it requires
dedicated High Voltage (HV) feeders from the AWF all the way back to the 22 kV
busbar. From the A1 zone substation circuit breakers, there are two 12km HV feeders
that run directly to the AWF. The cables that are used for the feeders are 240mm²,
22kV, termitex, underground copper cables (termitex protects against termites).
Due to the charging capacitance associated with underground cables, these feeders act
as a capacitive load over low load periods. Therefore, during low periods the AWF
would have to absorb reactive power to reduce the voltage rise caused by this
capacitive load. This will be discussed further in section 5.

ENG460 Thesis Brendan Fidock 30387869 15/5/2010 21
3.4 A1 Wind Farm
The A1 Wind Farm consists of twelve ENERCON wind turbines rated at 1800kW
each. ENERCON wind turbines are constructed using variable speed, pitch controlled,
power converter coupled, direct drive synchronous wound rotor generator technology.
It generates power according to the wind speed at any particular time, but during
commissioning it was limited to a maximum output level of 15 MW. This was
specified by Western Powers Networks Development from system investigations [6].
Also during commissioning, the wind farms power factor was fixed at a value
specified by Western Powers Networks Planning Development. Therefore, the
reactive power generated and absorbed by the A1 Wind Farm is proportional to active
power and power factor.
The maximum active power and power factor set-points have been determined such
that the wind farm is able to provide the maximum possible generation benefit to the
wind farm owner, while ensuring that the transmission network operates within the
Transmission Planning criteria.

ENG460 Thesis Brendan Fidock 30387869 15/5/2010 22
3.5 ENERCON wind turbines ENERCON wind turbines are constructed using three rotor blades, upwind, direct
drive synchronous wound rotor generator decoupled from the grid via a power
converter. The power converter is essentially a rectifier, a dc to dc converter and a
pulse width modulating inverter [7]. It uses three insulated gate bipolar transistor
(IGBT), pulse width modulating inverters per turbine.
The ENERCON power converter allows the AWF to operate at an optimum value
independent of the operating conditions. This would not be possible if the
synchronous generator is directly coupled to a grid system at 50Hz, as the grid
requires constant synchronous speed. By using the power converter to rectify and then
invert the generator output, the ENERCON concept allows the generator turbine
speed to vary. This optimizes the efficiency of power generation and gives it the
ability to provide full reactive power control [9].
3.6 Power converter coupled generator construction
The synchronous generator (SG) utilised by the ENERCON turbine is a multiple
salient pole, electrically excited, direct drive, using wound rotor generator technology.
The synchronous generators excitation power flows to the stator via the control of a
power converter. Thus, unlike conventional synchronous generators, the stator is not
directly coupled to the grid but to the power converter. Therefore, the reactive power
exchange with the grid is not determined be the properties of the generator but by the
control of the power converter.

ENG460 Thesis Brendan Fidock 30387869 15/5/2010 23
By decoupling the SG from the grid, it allows the power converter to operate at a
power factor that best suits the operating conditions of the A1 distribution network.
This means that the power factor of the generator and converter can be controlled
independently [9]. The operation and control of the power converter will be discussed
further in section 3.7..
Figure 5 shows the configuration of the direct drive power converter coupled
generator.
Figure 5: Direct-drive power converter generator [9]
Figure 5 shows that the three blade rotor and generator shafts are mounted to the same
shaft without the use of a gearbox. The omission of a gearbox requires that a
synchronous generator has a large number of poles. These multiple poles allow the
generator to operate at low speeds.
The multiple poles of a generator make the nacelle (hub) of the turbine larger than
other turbine types. Therefore, its aerodynamic egg shape is important to minimize the
turbulence around the base of the blade, thus, increasing performance.

ENG460 Thesis Brendan Fidock 30387869 15/5/2010 24
The generator is connected to a 415/22 kV 2 MVA step transformer, via three
700kVA IGBT inverter modules (power converter).
3.7 The power converter
The power converter allows the AWF to participate in maintaining the quality of
supply and power system stability. It provides the AWF with robust fault ride through
capabilities, voltage control and management of active and reactive power [10].
3.7.1 Power converter operation performance
The provision and control of reactive power for voltage control purposes is one of the
main objectives of the AWF. This is known as Flexible Alternating Current
Transmission Systems or FACTS.

ENG460 Thesis Brendan Fidock 30387869 15/5/2010 25
Figure 6 shows the FACTS capabilities of ENERCON wind turbines.
Figure 6: General capability chart of ENERON wind turbines with FACTS capabilities:
a) default capability b) extended capability with the STATCOM option c) expanded capability
with the Q+ option [11]
From Figure 6, it can be seen that the default option of the ENERCON wind turbine
can provide a constant reactive power for the operation between 20% and 100% rated
active power. However, ENERCON states that within 0% and 20% of rated active
power output, the reactive power capability is proportional to the available active
power [9].
The provision of reactive power from the ENERCON wind turbine can also be
extended by installing a STATCOM; this is known as the STATCOM option. The
installation of a STATCOM allows the provision of reactive power completely
independent from the provision of active power and the availability of wind.
This option may be required in some remote areas where the standard ENERCON
machine cannot address the reactive power capabilities required to connect that point
of the network.

ENG460 Thesis Brendan Fidock 30387869 15/5/2010 26
An expansion of the reactive power capability with the same dynamic performance is
available with the Q+ option. This option is similar to the STATCOM option,
however, its provision of reactive power has a wider range and is able to provide more
reactive power to support the voltage following a fault or other dynamic event [9][12].
Therefore, unlike other wind energy conversion systems, the ENERCON wind
turbines can provide reactive power and voltage support to the A1 distribution
network. This is a desirable characteristic for Western Power.
3.7.2 Control of the power converter
The power converter is vital for voltage control and maintaining system stability. In
order for the power converter to fulfil these functions, the appropriate control is
required.
For the steady state investigations, the control of the power converter revolves around
a fixed set point for power factor or reactive power. These set points result from
Western Power planning studies and are set during the commissioning of the AWF.
Although that these set points are determined during the commissioning study, once
the wind farm is in operational, these set points can be altered online via the wind
farm control room or dispatch centre. This is all carried out via the supervisory
control and data acquisition (SCADA) and additional communication interfaces.
Power factor and reactive power set point control allows the reactive power capability
from the AWF to maintain voltage control [11]. Based on the difference between
actual voltage and voltage set point, the Farm Control Unit (FCU) provides set points
for reactive power, thus, the power factor is altered to achieve this reactive power
setpoint.
ENG460 Thesis Brendan Fidock 30387869 15/5/2010 27
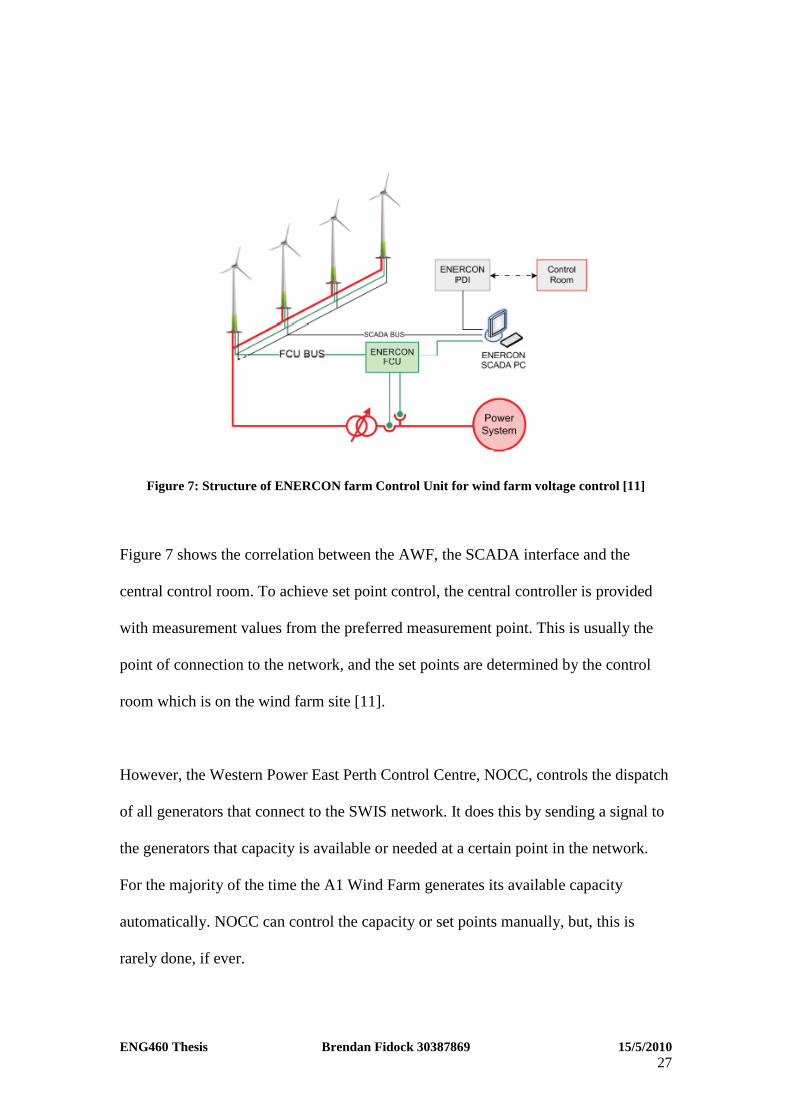
Figure 7: Structure of ENERCON farm Control Unit for wind farm voltage control [11]
Figure 7 shows the correlation between the AWF, the SCADA interface and the
central control room. To achieve set point control, the central controller is provided
with measurement values from the preferred measurement point. This is usually the
point of connection to the network, and the set points are determined by the control
room which is on the wind farm site [11].
However, the Western Power East Perth Control Centre, NOCC, controls the dispatch
of all generators that connect to the SWIS network. It does this by sending a signal to
the generators that capacity is available or needed at a certain point in the network.
For the majority of the time the A1 Wind Farm generates its available capacity
automatically. NOCC can control the capacity or set points manually, but, this is
rarely done, if ever.
ENG460 Thesis Brendan Fidock 30387869 15/5/2010 28
Therefore, unlike some other generators, the control circuit breakers and set point
adjustment is fully automated by the farm control unit. Thus, when capacity and wind
is available, the AWF is always connected and generating.
3.7.3 ENERCON fault ride through capabilities
Fault-ride-through (FRT) is a capability to withstand temporary voltage dips caused
by short circuits or faults. Depending on the distribution system, the requirements for
the SWIS may vary depending on the identified needs and characteristics of the power
system, for example, the installed generating capacity, load characteristics, earthing,
protections, voltage and angle stability and fault levels [11].
Active and reactive power during faults or post fault is a specific requirement desired
within Western Power distribution networks. This requirement is especially vital for
distribution networks utilising wind generation. This is because usually good wind
resources are available in remote, less populated areas with a weak power system
infrastructure. Within these weaker distribution networks there is lesser ability to deal
with various types of disturbances and to support the power system security and
stability.
Therefore, as stipulated by section 3.3.3.3 (C) of the Western Power technical rules
[2], fault ride through capabilities are required for all wind generators.
ENG460 Thesis Brendan Fidock 30387869 15/5/2010 29
3.7.4 ENERCON under voltage ride through (UVRT)
ENERCON address the fault ride through requirements with its FACTS capabilities.
Using the power converter and software, the Under Voltage Ride Through (UVRT)
allows the AWF to ride through faults for up to five seconds at zero volts at its
terminals, even at full rated active power.
It does this by using the inverter within the power converter to stay connected during
depressed voltages. The insulated gate bipolar transistors within the inverter have high
current ratings and are protected by current limiting protection. During UVRT, the
inverter either continues to supply a limited output current with a depressed terminal
voltage or ceases switching the insulated gate bipolar transistors while staying on-line
(circuit breaker remains closed).
The use of a power converter system on variable speed inverter coupled turbines
provides the option of maintaining load on the rotor generator during the depressed
terminal voltages by switching in a dump load onto the DC bus.
During UVRT, a special UPS safely supplies all necessary auxiliaries to operate the
AWF during the voltage depression, (e.g. controls, drives, fans).
The UVRT control mode is triggered by voltage levels of between 95% and 80%
rated voltage. Section 3.3.3.3 (C) of the Western Power technical rules [2] stipulates
that under voltage fault ride through capabilities are required for all generators.

ENG460 Thesis Brendan Fidock 30387869 15/5/2010 30
3.7.5 A1 Wind Farm under voltage ride through (UVRT)
Under fault conditions, the A1 Wind Farm (AWF) continues to generate provided that
the system voltage is maintained above the under voltage set point of the inverters.
The under voltage set point is 80%. At this point the AWF reverts from constant PQ
control to voltage control (controls AC voltage set point).
Therefore, after a fault has occurred the AWF will adjust the power factor to generate
the most reactive power to quickly achieve the AC voltage set point.
Once the fault has been cleared, if the new steady state system voltage is below the
voltage set point, then the inverters would switch themselves off line. The inverters
can only reconnect 3 minutes after the system voltage has been restored to nominal
levels.
UVRT is vital for the ADN as the loss of the wind farm during a fault condition may
lead to an additional drop in system voltage during and following the clearing of the
fault.
ENG460 Thesis Brendan Fidock 30387869 15/5/2010 31
4 Network modelling approach Section 4 discusses the approach to the modelling of the A1 distribution network and
the A1 Wind Farm that was described in Section 3.
To model the ADN and AWF, data collection from the Western Power sources was
necessary. The data collected is discussed as well as the construction of the
PowerFactory (PFY) model. The network component models (cables, transformers)
created within PFY to represent the WP distribution network, are also discussed
briefly.
The PowerFactory model created by this thesis can be found in appendix B.
4.1 Data collection
Data collection for the PowerFacrtory model was collected from a number of sources.
These are as follows:
• Manufacturers datasheets
• PowerFactory Training Manual
• Western Powers SWIS computer interface, DFIS
Manufacturer’s datasheets were used for modelling the cables within the PFY model.
To create an accurate representation of the cables within the ADN, the rated current,
positive and zero sequence resistance and reactance was extracted and used. Please
refer to appendix A for exact specifications.

ENG460 Thesis Brendan Fidock 30387869 15/5/2010 32
The power factory training manual specified typical transformer and synchronous
generator parameters. The manual outlined positive sequence impedance and copper
losses for the transformer, and stator resistance and synchronous reactances for the
synchronous generator. Please refer to appendix A for exact specifications.
DFIS is Western Powers SWIS, geographic information system. It provided conductor
and cable lengths, sizes and connection points of equipment. This tool is very
powerful for storing and retrieving the network data and its specifications.
A Western Power presentation [1] was utilised to determine actual loads and
generation of the A1 Network over 2009. This data was entered into the PFY model to
create the worst case scenarios for steady state analysis.
ENG460 Thesis Brendan Fidock 30387869 15/5/2010 33
4.2 PowerFactory construction
Using the data collected, the PowerFactory simulation was constructed to represent
A1 Distribution Network, including a specific “constructed” model for the A1 Wind
Farm.
To construct the above, the following models were used from the PowerFactory
(PFY) library:
• External Grid – To model the 132kV interconnecting grid
• Terminals – To model the busbars
• Transformers – Used to model zone substation, distribution transformers and
point of interconnection between the AWF and ADN
• General Loads – To model static PQ loads
• Lines – To model the cables based on a data sheet
• Induction Machine – To model dynamic loads
• Synchronous generator – Mechanical to electrical energy converter, coupled to
the SWIS via a power converter
• Power Converter – Modelled by a rectifier and inverter
The DC booster (modelled by a DC/DC converter) was not included in the PFY
model as it did not alter any of the results and proved to be a source of error within
PFY when using voltage control.
ENG460 Thesis Brendan Fidock 30387869 15/5/2010 34
4.3 Models
Section 4.3 discusses the network component models created within PFY to represent
the A1 distribution network.
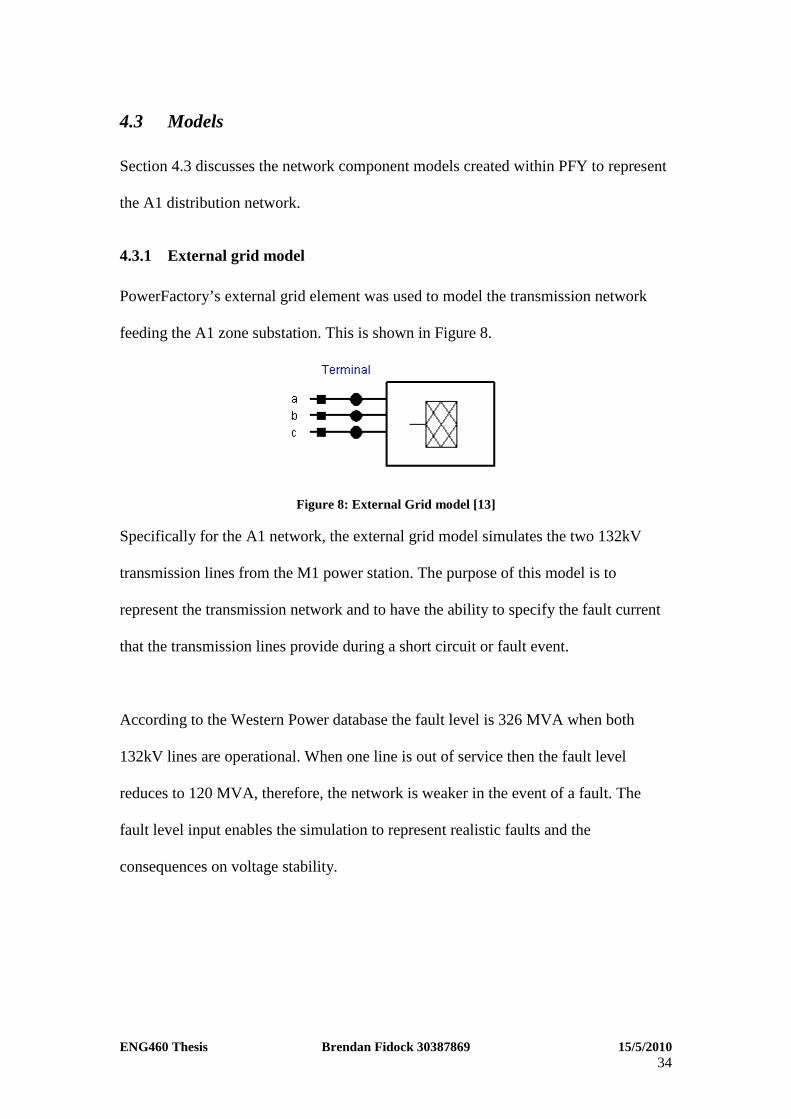
4.3.1 External grid model
PowerFactory’s external grid element was used to model the transmission network
feeding the A1 zone substation. This is shown in Figure 8.
Figure 8: External Grid model [13]
Specifically for the A1 network, the external grid model simulates the two 132kV
transmission lines from the M1 power station. The purpose of this model is to
represent the transmission network and to have the ability to specify the fault current
that the transmission lines provide during a short circuit or fault event.
According to the Western Power database the fault level is 326 MVA when both
132kV lines are operational. When one line is out of service then the fault level
reduces to 120 MVA, therefore, the network is weaker in the event of a fault. The
fault level input enables the simulation to represent realistic faults and the
consequences on voltage stability.

ENG460 Thesis Brendan Fidock 30387869 15/5/2010 35
4.3.2 Terminal model
Terminals represent the busbars within the SWIS network. These act as a point of
interconnection between all models. The terminal’s main function is its ability to
isolate parts of the network easily. Thus, parts of the simulation can be switched in
and out for variation of power flow studies. Another purpose of the terminal is to act
as a virtual instrument so voltage and reactive power can be compared during
transient simulations.
4.3.3 Transformer model
There are two types of transformer models within the PFY simulation of the A1
distribution network. These are the Delta – Delta model, used for the zone substation
transformers and the Delta – Wye neutral model, used for the connection of the AWF
to the A1 distribution network.
Transformer models contain absolute impedances, leakage reactance’s, winding
resistances and magnetization reactance. Each transformer model is defined by
various inputs. These are as follows:
• Technology – Three phase
• Rated Power – 20 to 24 MVA
• Nominal Frequency – 50 Hz
• Rated Voltage – HV and LV side
• Configuration – Delta – Delta or Delta-Wye neutral
• Positive and Negative sequence impedance – Refer to Appendix A
• Zero Sequence Impedance – Refer to Appendix A
• Magnetizing Impedance – Refer to Appendix A
ENG460 Thesis Brendan Fidock 30387869 15/5/2010 36
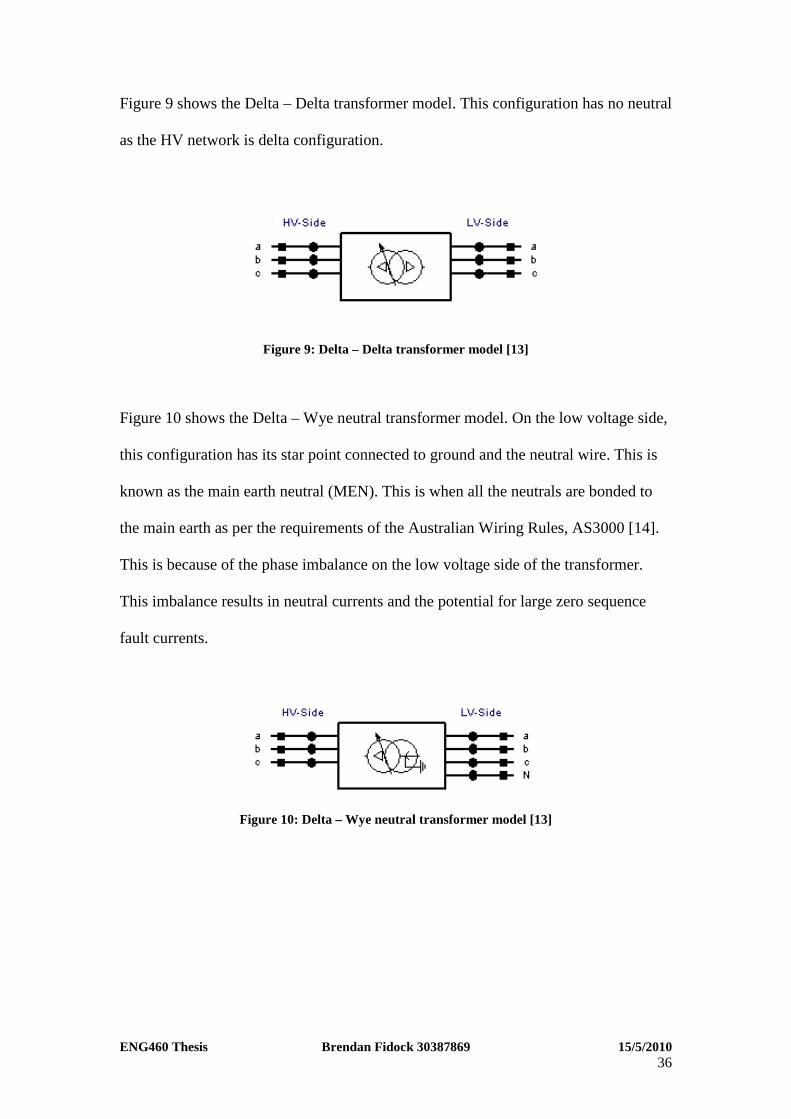
Figure 9 shows the Delta – Delta transformer model. This configuration has no neutral
as the HV network is delta configuration.
Figure 9: Delta – Delta transformer model [13]
Figure 10 shows the Delta – Wye neutral transformer model. On the low voltage side,
this configuration has its star point connected to ground and the neutral wire. This is
known as the main earth neutral (MEN). This is when all the neutrals are bonded to
the main earth as per the requirements of the Australian Wiring Rules, AS3000 [14].
This is because of the phase imbalance on the low voltage side of the transformer.
This imbalance results in neutral currents and the potential for large zero sequence
fault currents.
Figure 10: Delta – Wye neutral transformer model [13]

ENG460 Thesis Brendan Fidock 30387869 15/5/2010 37
4.3.4 General load model
Figure 11 shows the balanced three phase PQ load model implemented in the PFY
simulation. This model represents the HV PQ load seen at the 22kV busbar.
Figure 11: Balanced three phase PQ load model [13]
The inputs that are specified within this type of load are as follows:
• Real power (P)
• Reactive power (Q)
4.3.5 Induction machine model
Figure 12 shows the balanced three phase induction machine model implemented in
the PFY simulation. This model represents the motor load seen at the 22kV busbar.
This model is important for testing the transient analysis of the A1 distribution
network, as its load is dynamic unlike the static general load model.
Figure 12: Three phase induction machine model [13]
ENG460 Thesis Brendan Fidock 30387869 15/5/2010 38
The following parameters were specified for each induction machine:
• Rated Voltage – 22kV
• Input mode –Electrical Parameters
• Power Rating – Rated mechanical power of 4000kW
• Nominal Frequency – 50Hz
• No of Pole pairs – 1 pole pairs
• Connection – Delta
The default parameters within PFY were utilised for the rotor and the stator within
load flow and the short circuit analysis.
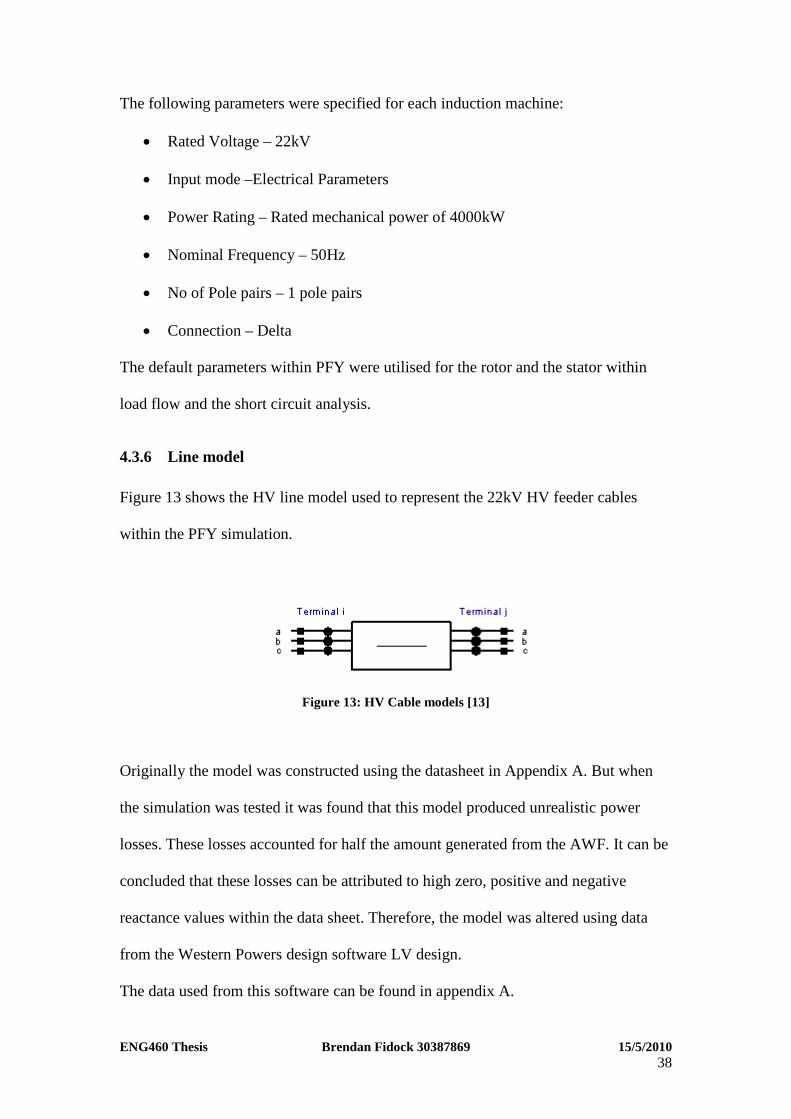
4.3.6 Line model
Figure 13 shows the HV line model used to represent the 22kV HV feeder cables
within the PFY simulation.
Figure 13: HV Cable models [13]
Originally the model was constructed using the datasheet in Appendix A. But when
the simulation was tested it was found that this model produced unrealistic power
losses. These losses accounted for half the amount generated from the AWF. It can be
concluded that these losses can be attributed to high zero, positive and negative
reactance values within the data sheet. Therefore, the model was altered using data
from the Western Powers design software LV design.
The data used from this software can be found in appendix A.

ENG460 Thesis Brendan Fidock 30387869 15/5/2010 39
Within the line model, the following parameters are specified:
• Rated current – 479 A
• Positive, Negative and Zero sequence resistance - 0.161 ohms/km
• Positive, Negative and Zero sequence reactance - 0.067 ohms/km
• Length of the line in kilometres – 12 kms
This thesis does not investigate unsymmetrical faults, thus, the zero sequence
impedance is irrelevant.
4.3.7 Synchronous generator model
Figure 14 represents the synchronous generator model used the represent the multiple
salient pole generator utilised by the ENERCON wind turbines.
Figure 14: Synchronous generator model [13]
For the AWF, all twelve 1800 kW wind turbines have been grouped in this lumped
generator model. The synchronous generator represents the part of the ENERCON
wind turbine which converts the mechanical energy of the 3 rotor blades into
electrical energy.
The synchronous generator is specified by the following parameters:
• Nominal apparent power – 22.73 MVA
• Nominal Voltage – 415 V

ENG460 Thesis Brendan Fidock 30387869 15/5/2010 40
• Power Factor – 0.95 leading
For load flow, the following parameters have to be specified:
• Mode of Local Voltage Controller – Power Factor
• Active power – 15 MW
• Reactive power – -4.93 MVAr
• Synchronous reactance’s – Xd = 2.61 pu, Xq = 1.57 pu
• Inertia – The acceleration time constant of 4 seconds
To represent the ENERCON model accurately, the synchronous generator is coupled
to a power converter. The power converter is constructed of two models within PFY,
these are as follows:
• Rectifier
• Pulse width modulator inverter
ENG460 Thesis Brendan Fidock 30387869 15/5/2010 41
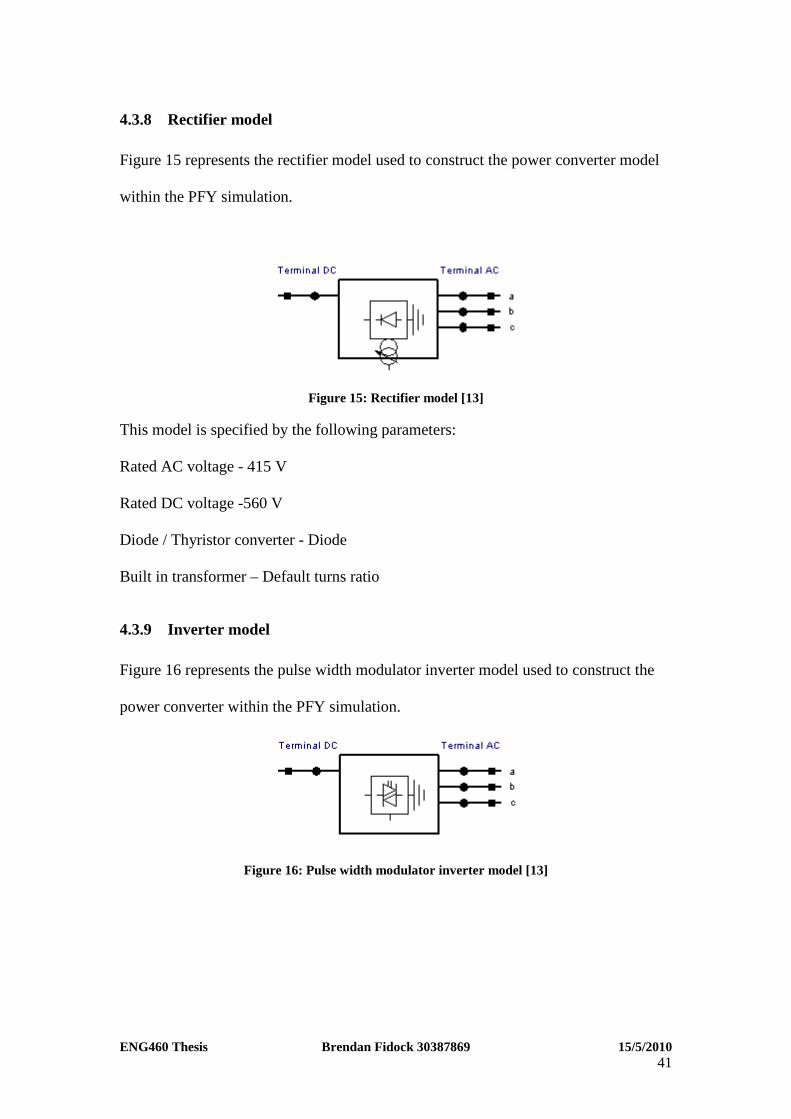
4.3.8 Rectifier model
Figure 15 represents the rectifier model used to construct the power converter model
within the PFY simulation.
Figure 15: Rectifier model [13]
This model is specified by the following parameters:
Rated AC voltage - 415 V
Rated DC voltage -560 V
Diode / Thyristor converter - Diode
Built in transformer – Default turns ratio
4.3.9 Inverter model
Figure 16 represents the pulse width modulator inverter model used to construct the
power converter within the PFY simulation.
Figure 16: Pulse width modulator inverter model [13]

ENG460 Thesis Brendan Fidock 30387869 15/5/2010 42
This model is specified by the following parameters:
Rated AC voltage - 415 V
Rated DC voltage -560 V
Rated power – 37.8 MVA
Modulation – Sinusoidal PWM
Control Mode
Steady State – P-Q (constant PQ control)
Transient – Vac-phi (AC voltage set point control)
The combination of the synchronous generator, the rectifier and the pulse width
modulator inverter within the PFY simulation represents the A1 Wind Farm model.
This model will be referred to furthermore as the “constructed” AWF model [9].
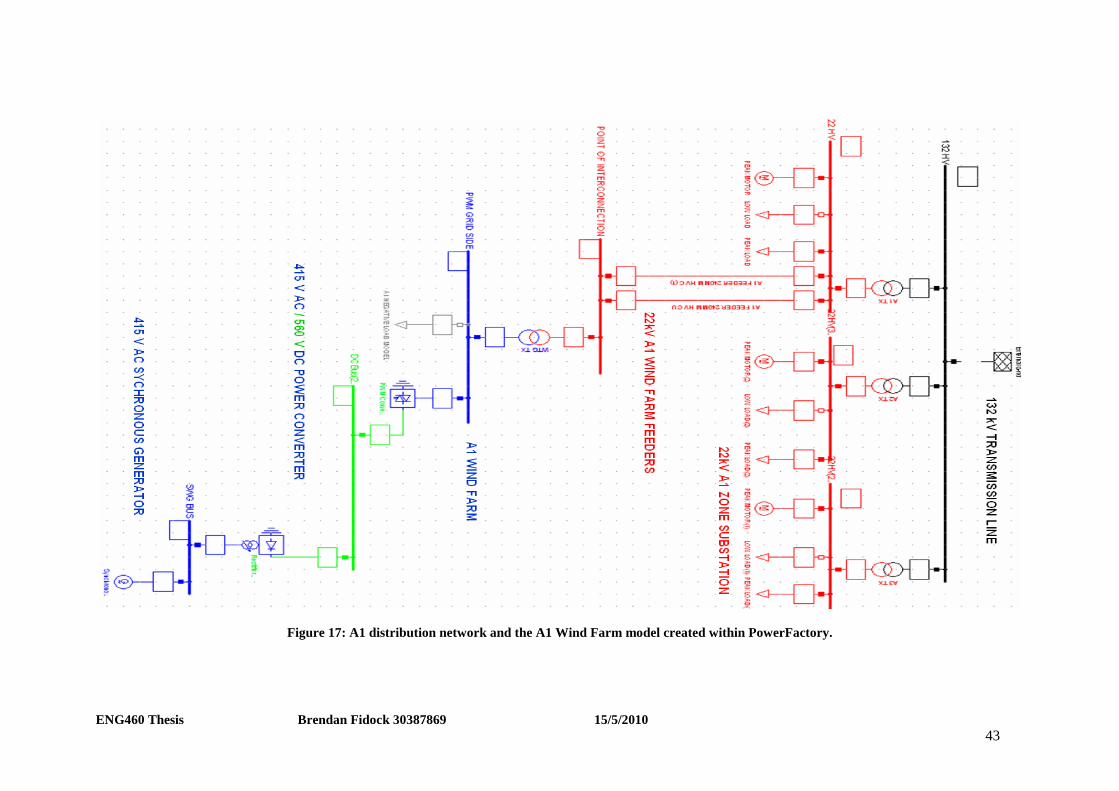
Figure 17 on next page shows the entire A1 distribution network and the A1 Wind
Farm model created within PowerFactory.
ENG460 Thesis Brendan Fidock 30387869 15/5/2010 43
Figure 17: A1 distribution network and the A1 Wind Farm model created within PowerFactory.

ENG460 Thesis Brendan Fidock 30387869 15/5/2010 44
5 Testing the PowerFactory simulation Once the PowerFactory simulation model was constructed, the steady state and
transient investigations were undertaken. These studies investigated the voltage that
resulted from the power output and control of the A1 Wind Farm.
5.1 Steady state investigations
During the initial commissioning of the A1 Wind Farm, the power factor and
maximum active power set points were determined by the Western Power planning
department. The objective of these set points were to ensure that the operation of the
wind farm would have minimal impact on the 22kV busbar voltage at A1 zone
substation. By limiting the A1 Wind Farms (AWF) output, any adverse voltage
fluctuations, due to the change in output, would have minimal effect on Western
Power customers connected to the same 22kV busbar.
This meant that any reactive power support from the AWF would be a function of the
active power and power factor.
The steady state investigation within this thesis has utilised the same method as the
Western Powers planning department. The purpose is to determine a maximum active
power set point for the wind farm and an optimum power factor to minimize the
AWF’s impact on voltage fluctuations at the 22kV busbar. The set points for the
active power was determined by the Western Power study [6] to be 15MW, while the
power factor set points were altered between 0.95 leading to 0.95 lagging, as these are
the limits of the technical rules [2].

ENG460 Thesis Brendan Fidock 30387869 15/5/2010 45
5.1.1 Determine maximum active power output from the A1 Wind Farm.
One of the objectives of limiting the active power and hence the reactive power of the
AWF would be to limit the number of tap changes at the A1 zone substation when the
wind farm is operating. This would ensure that additional maintenance of substation
tap changer was avoided (due to additional voltage regulation). The aim of the active
power limits is that the number of tap changes at the zone substation will be similar to
that which would have occurred if the wind farm was not connected.
Also under the steady state investigation, the optimal tap position for the A1 zone
substation has been investigated. This ensured that the reactive power support of the
AWF will not be at its limit and would act as a secondary voltage control measure to
the tap settings. This way, if a fault does occur, then the tap position will not be too
far away from its optimal position and the AWF will be able to provide more reactive
power support to recover the system voltage.
The optimal tap position for the A1 zone substation would be the position that
resulted in the least amount of tapping and voltage fluctuations. Ideally the optimal
tap position would be the neutral position, thus, giving the substation its full range of
voltage control by tapping. At the A1 zone substation, each tap position up or down
results in a 1.25% change in the busbar voltage. Thus, if the voltage was 1.0 per unit
and the tap position changed from the neutral position (zero) to tap 1, then this would
result in a voltage of 1.0125 per unit or 1.0125 times 22 kV.
ENG460 Thesis Brendan Fidock 30387869 15/5/2010 46
However, having the tap position at neutral would mean that voltage regulation would
solely rely on the reactive power support of the AWF and the 132kV feeders. This is
another reason why it was important to determine the active power limit of the AWF
during commissioning. Determining this would allow Western Power planners to
determine the A1 Wind Farms consequent reactive power support and the tap position
for steady state conditions.
The Western Power planning study concluded that large active power output
fluctuations of the AWF would increase the tap changer activity at the A1 zone
substation. That is additional tap changer activity would add to the risk of the tap
changer being further from the optimal tap position during a fault.
Therefore, by limiting the AWF output to 15MW, the tap changer position would
closely follow that which would be expected without the wind farm in operation.
Thus, this would reduce the tap changing activity and voltage fluctuations. However,
by limiting output even further, this produced better results, but the improvement was
considered to be too marginal to justify the extra limitations [6].
Concluding, all future steady state and transient investigations have been conducted
with the limiting wind farm maximum active power output set to 15 MW.

ENG460 Thesis Brendan Fidock 30387869 15/5/2010 47
5.1.2 Preferred A1 Wind Farm power factor
As the active power limit of 15MW had been determined, a preferred power factor
would have to be investigated to determine the reactive power generated or absorbed
by the AWF.
This is because the power factor of the loads and generators connected to the SWIS
directly relates to its voltage fluctuations and voltage control.
The term power factor (PF) is a function of the cosine of the phase angle difference
between voltage and current. Thus:
Power Factor = cosine (θv – θi) [8]
θv = Voltage phase angle in degrees.
θi = Current phase angle in degrees
For power system analysis, the convention is that generators with a lagging power
factor generate reactive power, and that these generators supply inductive loads [8].
Whereas generators with a leading power factor absorb reactive power, and that these
generators supply capacitive loads.
Figure 18 summarises the convention and how it relates to power converter (inverter)
coupled generation.

ENG460 Thesis Brendan Fidock 30387869 15/5/2010 48
Figure 18: Inverter theory in relation to power factor [adapted from 16]
Figure 18 shows that when supplying active and reactive power, the inverter coupled
generators current (IA) lags the terminal voltage (VΦ), therefore the PF is lagging and
the generator is producing reactive power. However, when supplying active and
absorbing reactive power then the inverter coupled generators current (IA) leads the
terminal voltage, therefore, the PF is leading.
This same convention can be applied to loads, however, the passive sign convention
must be applied. Therefore, loads with a lagging power factor absorb reactive power,
these are known as inductive loads, for example induction motors. While loads with a
leading power factor generate reactive power, these are known as capacitive loads.
Although capacitive loads are rare, capacitive load conditions often occur during low
load periods, for example midnight. This results from the lack of active and reactive
power being drawn on the distribution and transmission network and the line charging
current of very long lines or cables.

ENG460 Thesis Brendan Fidock 30387869 15/5/2010 49
Generators that generate reactive power increase the voltage magnitude within the
SWIS, while generators that absorb reactive power, decrease the voltage magnitude
within the SWIS. As loads are the opposite of generators, loads also behave opposite
of the above. For example, capacitive loads such as the line charging example result
in a voltage rise over the distribution line.
An increase and decrease in the voltage results from the impedance of the SWIS. The
SWIS is an inductive network, therefore, its impedance is jωL. As loads or generators
generating reactive power have an impedance of –j(1/ωC) , then by multiplication,
this will result in a positive number and a voltage rise (j x –j = 1). Whereas, if the load
or generator absorbs reactive power have an impedance of jωL , then by
multiplication this will result in a negative number and a voltage drop (j x j = -1).
Therefore it can be concluded that, the power factor of the loads and generators
connected to the SWIS directly relates to its voltage fluctuations and voltage control.

ENG460 Thesis Brendan Fidock 30387869 15/5/2010 50
To determine the preferred power factor for the operation of the wind farm, the power
factor was altered to investigate its effect on busbar voltages. This was done by
devising two worst case scenarios for the substation load and A1 Wind Farm
generation. The two worst case scenarios are as follows:
Scenario 1 - Minimum A1 Wind Farm output of 1 MW and a peak substation load of 40 MW.
Scenario 2 - Maximum A1 Wind Farm output of 15 MW and a low substation load of 10 MW
To replicate the Western Power steady state study, the load was split into general
static load and motor load. The static load was assumed to be 70% of the total load
and its power factor 0.99 lagging. And the motor load was assumed to be 30% of the
total load and a power factor of 0.8 lagging. Thus, both were inductive loads that
would absorb reactive power.
The impact on the busbar voltage was tested in both scenarios by varying the AWF
generators power factor from 0.95 leading to 0.95 lagging. This was done by changing
the output of the inverter within the power converter as this directly controls the A1
Wind Farms output.
Before the AWF was connected, the steady state per unit voltage at the 22kV busbar
was 0.986 per unit.
Therefore the power factor that produces the voltage closest to 0.986 per unit will be
the optimal power factor.

ENG460 Thesis Brendan Fidock 30387869 15/5/2010 51
The steady state test results are summarised in table 1.
Table 1: Steady state optimum power factor test
SCENARIO
WIND
PF
LEADING OR
LAGGING
VOLTAGE AT 22kV
BUSBAR (kV)
VOLTAGE AT 22kV
BUSBAR (pu)
1 0.95 LEADING 21.738 0.988
1 1 NA 21.757 0.989
1 0.95 LAGGING 21.775 0.990
2 0.95 LEADING 21.697 0.987
2 1 NA 22.04 1.000
2 0.95 LAGGING 22.251 1.012
ENG460 Thesis Brendan Fidock 30387869 15/5/2010 52
5.1.3 Scenario 1 Analysis (A1 Wind Farm output = 1MW, Peak load = 40MW)
In scenario 1, the AWF output was limited to 1 MW and the total zone substation was
set to a peak load of 40MW. The power factor (PF) of the power converter was
altered from 0.95 leading the 0.95 lagging. This resulted in the reactive power output
of the power converter changing from absorbing to generating 0.33 MVAr.
Table 1 outlines that a PF of 0.95 lagging had the most affect, in comparison to 0.986
per unit, on the 22kV bus voltage resulting in a bus voltage of 0.99 per unit at peak
load. Table 1 also proves that a PF of 0.95 leading had the least impact on the bus
voltage with a voltage of 0.988 per unit. As the loads are the same for this test, both
voltage fluctuations can be attributed to the absorption and generation of the reactive
power by the AWF controlled by the power converter and the changing power factor.
Neither of these would result in a tap change at the A1 zone substation as all voltage
fluctuations are well within the 1.25% voltage step size per tap.
5.1.4 Scenario 2 Analysis (A1 Wind Farm output = 15MW, low load = 10MW)
In scenario 2, the AWF output was increased to 15 MW and the total A1 zone
substation set to a low load of 10MW. The power factor (PF) of the power converter
was altered from 0.95 leading to 0.95 lagging. This resulted in the reactive power
output of the power converter changing from absorbing to generating 4.93 MVAr.

ENG460 Thesis Brendan Fidock 30387869 15/5/2010 53
Again the results in Table 1 prove that PF of 0.95 lagging had the most affect on the
22kV busbar voltage, resulting in a bus voltage of 1.012 per unit at low load. This is
known as voltage rise, and may impact customers by providing higher voltages that
are outside the limits of typical appliances. Voltage rise can be just as much of a
problem as under voltage, as it can cause premature appliance failure and customer
complaints.
From Table 1 it can be concluded that the power factor of 0.95 lagging would result it
additional tapping down. Therefore, it would also require tapping up once the AWF
output dropped off.
In scenario 2, the PF of 0.95 leading also had the least affect on voltage as it resulted
in a voltage of 0.987 per unit (closest to 0.986 per unit). This would require no
additional tapping at the zone substation and would result in the least amount of
steady state voltage fluctuations.
At a low load and high output, the PF of 1.0, absorbing or generating 0 MVAr by the
AWF resulted in a voltage rise on the busbar voltage, as this increased to 1.0 per unit.
At this power factor the A1 zone substation would require additional tapping down at
high wind farm generation and tapping up again at low generation. This is not
desirable as it increases voltage fluctuations and tap changer maintenance.

ENG460 Thesis Brendan Fidock 30387869 15/5/2010 54
5.1.5 Optimum power factor at steady state
In conclusion of the steady state investigation, it is apparent that a power factor of
0.95 leading is optimum for both cases as this maintained the voltage closest to the
original 22kV busbar voltage (0.986 per unit).
In reality the AWF peak output occurs at night and as explained before, this also
coincides with low loads on the A1 distribution network (ADN). These low load
conditions already result in voltage rise on the AND. This voltage rise can be
attributed to the voltage rise over distribution and 132kV lines.
Therefore, using a PF of 0.95 leading (absorbing reactive power) would reduce the
voltage rise caused by the capacitance of the 132kV feeders while also resulting in the
least impact on voltage fluctuations and tap changing.
In general, the overall A1 distribution network has a high resistance to reactance ratio
(R/X), therefore, it is apparent that from 22 kV busbar at the A1 zone substation to the
customers load the voltage would drop, due to conductor resistance. This voltage drop
is a function of the I²R losses due to the active power drawn. Although, as the active
power draw is low during these load and generation conditions, the impact of voltage
drop would be negligible to Western Power customers at this time.
Therefore, analysing the steady state results it can be concluded that for both
scenarios, a fixed power factor for the AWF should be set to 0.95 leading. This would
result in the least impact on the customers in both scenarios due to the voltage rise in
the distribution and transmission network. This voltage rise would be balanced by the
AWF absorbing reactive power, thus, reducing the voltage.

ENG460 Thesis Brendan Fidock 30387869 15/5/2010 55
To validate the above conclusion the Western Power steady state study [6] concluded
that when using fixed power factor mode, a leading power factor resulted in a lower
impact on the A1 substation voltages than a lagging power factor. The results also
showed that while using a power factor of 0.95 leading, the wind farm had the least
affect on A1 zone substation 22kV busbar voltages.
It can also be concluded that AWF is a major influence on voltage control within the
A1 distribution network. This is because that any small voltage change can result in
additional tapping and voltage fluctuations at the 22kV busbar.
Therefore, it is recommended that all voltage rises caused by the wind farm and
capacitive line is mitigated by a leading power factor.

ENG460 Thesis Brendan Fidock 30387869 15/5/2010 56
5.1.6 A1 Wind Farm model steady state behaviour
For the steady state analysis, the “constructed” AWF model within PowerFactory
behaves like a generator with a fixed active power output and power factor. These
parameters are stipulated in PowerFactory using the inverter within the power
converter model. Therefore, as long as the stipulated active and reactive power
parameters are within the synchronous generators power limits, the power converter
controls the output of the “constructed” AWF model. It can then be concluded that the
synchronous generator reactive power capabilities apart from its limits, have no
influence on the steady state investigation.
Therefore, the synchronous generator reactive power capabilities will not have any
impact on the network. This is because the generator is decoupled by the power
converter, and at steady state, the reactive capability of the power converter is the
only parameter that has an impact.
It can then be concluded that the “constructed” AWF model behaves essentially as a
negative load at steady state. A negative load model is when a load is used to simulate
a generator. In PowerFactory, the positive direction of the load is from the grid
towards the load. Thus, if the load is negative then it is essentially generating active
and reactive power.

ENG460 Thesis Brendan Fidock 30387869 15/5/2010 57
For both models the active power output and power factor are determined, and a
resulting reactive power is generated or absorbed using the following formulas:
Active Power (P) (given) = 15MW
Power Factor (given) = 0.95 leading
Apparent Power (S) (calculated) = 15MW / 0.95 = 15.78 MVA
Angle between voltage and current (θ) (calculated) = cosine^-1 x 0.95 =18.19º
P = 15.78 x cosine (18.19º)
= 15 MW
The resulting reactive power from the above:
Q = 15.78 x sine (18.19º)
= 4.93 MVAr (A1 Wind Farm absorbing reactive power)
To follow power system analysis convention, active power must be negative for the
load to be generating. However, for loads, a leading power factor results in a
capacitive load (lagging generator) and generating reactive power, while a lagging
power factor results in an inductive load and absorbing power factor. Therefore, a
negative load requires a lagging power factor to replicate a leading generator.

ENG460 Thesis Brendan Fidock 30387869 15/5/2010 58
5.1.7 Conclusions of steady state investigation
Concluding the steady state investigation, it was determined that operating the AWF
at a limited active power output of 15MW and a power factor of 0.95 leading would
result in the least voltage impact on Western Power customers. This limited active
power and power factor control (PQ) would also result in the least amount of tap
changers with a changing load and AWF generation, thus, reducing maintenance and
more importantly the voltage fluctuations. This power factor set point will also absorb
reactive power to compensate for the voltage rise in the capacitive distribution and
transmission line during low load conditions.
It can also be concluded that AWF has a major influence on voltage control within the
A1 distribution network. As a small voltage rise from the wind farm can lead to
significant implications for the control voltage via tap changing.
While using a fixed PQ control for the “constructed” AWF model, it acts like a
negative load model. Thus, all the synchronous generator reactive power capabilities
have no influence on the voltage at steady state. This conclusion will have to be tested
by the transient investigation to see whether it holds true for both steady state and
transient conditions.
All transient investigations have been conducted with the AWF operating with a fixed
active power of 15MW and fixed power factor of 0.95 leading (absorbing reactive
power). This shall be known furthermore as PQ control.

ENG460 Thesis Brendan Fidock 30387869 15/5/2010 59
5.2 Transient investigations
The steady state investigation determined the limits for PQ control; these were a
limited active power output of 15 MW and the fixed power factor of 0.95 leading for
the AWF. This PQ control is utilised by the transient investigation to test the voltage
stability of the A1 Wind Farm under fault conditions.
Although a Western Power transient study was undertaken, the study utilised other
simulation software. Therefore, the results of this transient investigation could not be
validated due to large differences between the software and the outputs.
The transient investigation uses one worst case scenario to test voltage stability.
However, unlike the steady state investigation, for the transient investigation the A1
Wind Farms power output and the zone substation load remains unchanged. The load
is set to a peak of 40MW and A1 Wind Farms output set to peak of 15MW. Thus, the
wind speed and load are assumed to be constant.
For voltage stability, peak load and peak wind farm generation is the worst case
scenario. This is because at peak load the busbar demands the most reactive power
and at peak generation the AWF is also absorbing the most reactive power. Therefore,
a fault will cause the loads to absorb the most reactive power, while the AWF should
have to generate a large amount of reactive power to support the voltage and maintain
voltage stability.

ENG460 Thesis Brendan Fidock 30387869 15/5/2010 60
To test voltage support and voltage stability, the worst case scenario will simulate a
fault at 22kV busbar, this scenario is as followed:
Scenario 3 – peak load and generation conditions, 3 phase short circuit fault at 22kV
busbar.
In the PowerFactory simulation, the short circuit fault is set to actuate at 0.5 seconds.
The fault on the 22kV busbar will be cleared at 1.66seconds (1.16 after the fault has
occurred) and total simulation time will run for 10 seconds, as this is a reasonable
time for the voltage to achieve a new steady state.
The circuit breaker clearance times have been determined by section 2 of Western
Power technical rules [2]. This stipulates for a voltage range of 66kV to 132kV, the
circuit breaker (CB) must clear within 0.2 seconds and for a voltage range of 33kV
and below the CB can take up to 1.16 seconds.
A fault on the 22kV busbar will be the best scenario to test the voltage control,
network support capability and stability of the network. As this fault, will be depress
the voltage for a longer period of time, due to the longer CB clearance time.

ENG460 Thesis Brendan Fidock 30387869 15/5/2010 61
The Western Power technical rules [2] does not stipulate a critical time for voltage
stability. However, the voltage must reach an acceptable steady state voltage level
following the disturbance. This acceptable voltage level can be stipulated as 0.9 to 1.1
per unit of the nominal voltage within the nominated simulation time (10 seconds).
Thus, if the voltage at the generator connection point or the 22kV busbar does not
achieve 0.9 to 1.1 per unit (emergency conditions) within 10 seconds (assuming new
steady state is achieved), then voltage instability has occurred and the generator will
be disconnected.
5.3 Scenario 3, analysis using PQ control (22kV busbar fault)
For scenario 3, a fault has been simulated at the 22kV busbar under the above load
and generation conditions. This simulation shows how the network behaves once the
AWF has been isolated.
The simulation runs for a total of 10 seconds, the short circuit fault is actuated at 0.5
seconds into the simulation and cleared at 1.66 seconds. The fault current supplied by
the A1 zone substation is 326 MVA, a value obtained from the Western Power
database.
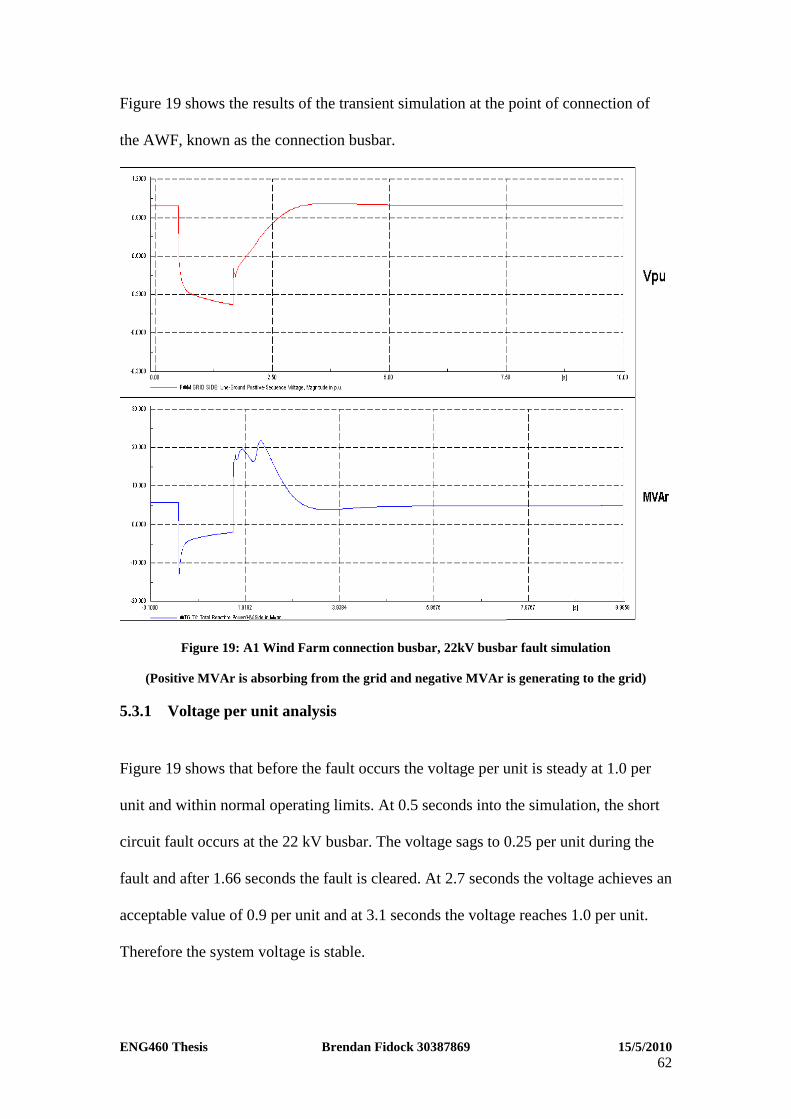
ENG460 Thesis Brendan Fidock 30387869 15/5/2010 62
Figure 19 shows the results of the transient simulation at the point of connection of
the AWF, known as the connection busbar.
Figure 19: A1 Wind Farm connection busbar, 22kV busbar fault simulation
(Positive MVAr is absorbing from the grid and negative MVAr is generating to the grid)
5.3.1 Voltage per unit analysis
Figure 19 shows that before the fault occurs the voltage per unit is steady at 1.0 per
unit and within normal operating limits. At 0.5 seconds into the simulation, the short
circuit fault occurs at the 22 kV busbar. The voltage sags to 0.25 per unit during the
fault and after 1.66 seconds the fault is cleared. At 2.7 seconds the voltage achieves an
acceptable value of 0.9 per unit and at 3.1 seconds the voltage reaches 1.0 per unit.
Therefore the system voltage is stable.

ENG460 Thesis Brendan Fidock 30387869 15/5/2010 63
5.3.2 Reactive power analysis
Under constant PQ control Figure 19 shows that before the fault occurs 5.71 MVAr is
absorbed by the AWF from the grid through the 20 MVA transformer. At 0.5 seconds
into the simulation the short circuit fault occurs at the 22 kV busbar. After the fault
occurs, the reactive power generated by the AWF increases up to 13MVAr. However,
once the fault is cleared the AWF now reverts to PQ control and starts to absorb up to
21MVAr.
This shows that following the clearing of a fault, the AWF absorbs a large amount
reactive power from the grid, although the voltage has not yet stabilised to acceptable
limits. This is very undesirable for Western Power, as this would depress voltages
even further and a large amount of reactive power would have to be fed from the A1
zone substation to the AWF (large voltage difference between sending and receiving).
However, while still absorbing the reactive power, the voltage at the connection point
increases to 1.0 per unit. This should not occur following a fault situation. The AWF
should revert to generating reactive power to help support the voltage to recover to
1.0 per unit.

ENG460 Thesis Brendan Fidock 30387869 15/5/2010 64
This problem can be attributed to the constant PQ control. This is because PQ control
makes the power converter absorb reactive power after the fault has been cleared
when really the power converter control should be trying to control the voltage. The
AWF should support the voltage by reversing the reactive power control from
absorbing to generating, thus, the power converter should change from a leading to a
lagging power factor.
At this point it would be ideal to test the transient behaviour of the negative load
model. As it appears that the constant PQ control model is not ideal for transient
analysis.
5.3.3 A1 Wind Farm model behaviour during transient analysis
The steady state investigation concluded that using a fixed PQ control for the
“constructed” AWF model makes it behave like a negative load model. Therefore,
unlike other wind turbine models (induction), all the synchronous generator reactive
power capabilities (apart from its power limits) of the “constructed” model had no
influence on the voltage at steady state.
It was also concluded that this negative load theory should also be tested under
transient analysis.

ENG460 Thesis Brendan Fidock 30387869 15/5/2010 65
For transient analysis, usually the voltage stability of the wind generator depends on
the components of the rotating machinery [17]. These are as followed:
• Turbine aerodynamics
• Turbine mechanical controls, pitch and active stall
• Shaft dynamics
• Generator electric characteristics.
The AWF utilises the ENERCON design, thus, the generator is decoupled from the
grid by the power converter. Therefore, the power converter controls the current
output of the network side. Even during a fault, the current output from the power
converter is not significantly higher than its rated output, this is because it is a current
limited device and any additional generator over speeding can be minimized by the
IGBT’s blocking the current during fault conditions, and this current being dumped to
a resistive load [17].
Two conclusions can be made from the above.
One is that the AWF does not significantly contribute to the fault current as its output
is limited by the power converter.
Two, any change in the synchronous generator speeds will not be seen on the network
side during transient analysis. This is because the output of the power converter can
be controlled, regardless of the variations in the speed of the synchronous generator
unit.
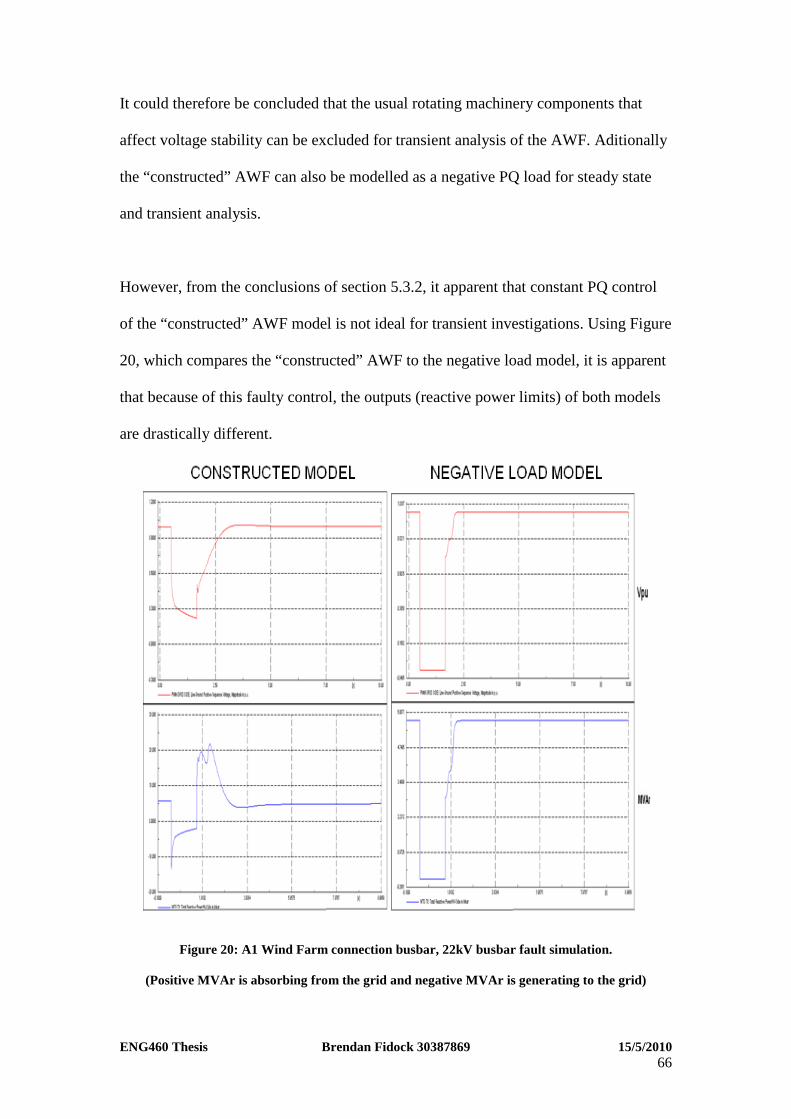
ENG460 Thesis Brendan Fidock 30387869 15/5/2010 66
It could therefore be concluded that the usual rotating machinery components that
affect voltage stability can be excluded for transient analysis of the AWF. Aditionally
the “constructed” AWF can also be modelled as a negative PQ load for steady state
and transient analysis.
However, from the conclusions of section 5.3.2, it apparent that constant PQ control
of the “constructed” AWF model is not ideal for transient investigations. Using Figure
20, which compares the “constructed” AWF to the negative load model, it is apparent
that because of this faulty control, the outputs (reactive power limits) of both models
are drastically different.
Figure 20: A1 Wind Farm connection busbar, 22kV busbar fault simulation.
(Positive MVAr is absorbing from the grid and negative MVAr is generating to the grid)

ENG460 Thesis Brendan Fidock 30387869 15/5/2010 67
Therefore, the only thing that can be concluded is that while utilising constant PQ
control, that these two models cannot be compared extensively to concur that the
“constructed” AWF model behaves like a negative load under transient analysis.
From all the above, it can be concluded that the rest of the transient analysis will have
to be completed using voltage control (voltage control) and the “constructed” AWF
model.
5.4 Scenario 3, analysis using voltage control (22kV busbar fault)
To use voltage control, the pulse width modulator within the power converter was
changed from a constant PQ control of 15MW and -4.93MVAr (0.95 leading) to
constant voltage control, using an AC voltage set point of 1.0 per unit. This means
that once the fault has been cleared the power converter will change its control to
generate reactive power. This will ensure that voltage achieves a steady state of 1.0
per unit as quickly as possible.
Once again, the fault has been simulated at the 22kV busbar under the peak load and
generation conditions. The simulation runs for a total of 10 seconds, the short circuit
fault is actuated at 0.5 seconds into the simulation and cleared at 1.66 seconds. Figure
21 shows the results of the transient simulation at the connection point of the AWF.
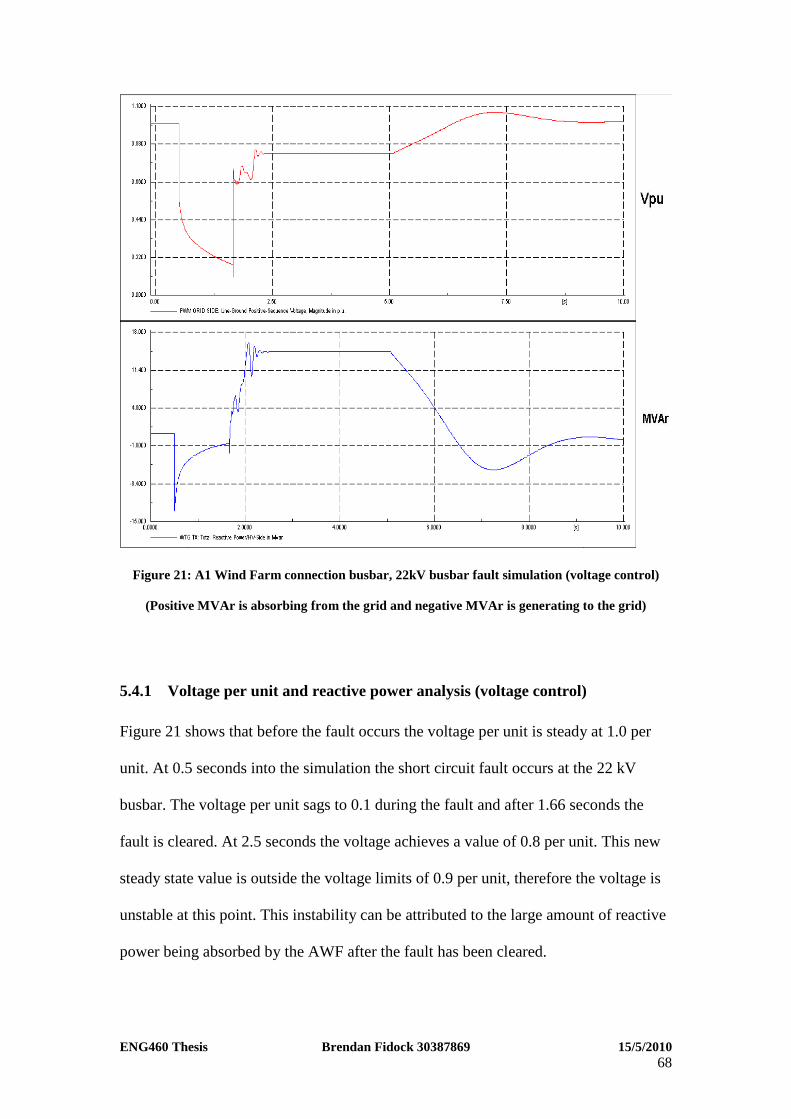
ENG460 Thesis Brendan Fidock 30387869 15/5/2010 68
Figure 21: A1 Wind Farm connection busbar, 22kV busbar fault simulation (voltage control)
(Positive MVAr is absorbing from the grid and negative MVAr is generating to the grid)
5.4.1 Voltage per unit and reactive power analysis (voltage control)
Figure 21 shows that before the fault occurs the voltage per unit is steady at 1.0 per
unit. At 0.5 seconds into the simulation the short circuit fault occurs at the 22 kV
busbar. The voltage per unit sags to 0.1 during the fault and after 1.66 seconds the
fault is cleared. At 2.5 seconds the voltage achieves a value of 0.8 per unit. This new
steady state value is outside the voltage limits of 0.9 per unit, therefore the voltage is
unstable at this point. This instability can be attributed to the large amount of reactive
power being absorbed by the AWF after the fault has been cleared.
ENG460 Thesis Brendan Fidock 30387869 15/5/2010 69
At 5 seconds into the simulation the controller has determined that the AC voltage set
point of 1.0 per unit will not be achieved unless the power converter changes the
AWF from absorbing to generating reactive power. It reality, this would occur faster
than this, this is because the control algorithm within PowerFactory is slower than the
actual ENERCON controllers. This can be seen in Figure 21, at this point the
controller reverts the wind farm from absorbing to generating reactive power (positive
is absorbing from the grid and negative is generating to the grid) and the result is that
the voltage now increases to its AC voltage set point of 1.0 per unit. Once the AC
voltage over shoots the set point the reactive power generated by the AWF reduces to
the pre fault value and the voltage becomes steady at 1.0 per unit.
Unlike PQ control, Figure 21 shows that using voltage control for transient analysis
produces realistic results. As the wind farm reverts to generating reactive power once
the voltage set point has not been reached. This change can be attributed to the under
voltage ride through capabilities of the A1 Wind Farm. If these capabilities had not
existed then the AWF would have been disconnected once the voltage became
unstable. Therefore, if the AWF had been disconnected rather than generating reactive
power, the voltage would not have recovered as quick and may have resulted in
additional load shedding or reactive power support from the 132kV feeders.
From the steady state analysis, it was concluded that a constant PQ control of 15MW
and -4.93 MVAr results in the least impact on the 22kV busbar of the A1 zone
substation. However, using the same PQ control for transient analysis caused
problematic results. Therefore, the AWF had to utilise voltage control under transient
conditions.

ENG460 Thesis Brendan Fidock 30387869 15/5/2010 70
Voltage control should be triggered by the under voltage of 0.8 per unit, (shown in
Figure 21) as discussed in section 3.7.5, the AWF under voltage ride through.
5.4.2 Conclusions from the transient investigation (voltage control)
From the transient analysis, it can be concluded, that it is important for the AWF to
have under voltage ride through capabilities. This is important to the voltage control
and stability of the A1 network, because this specific capability allows the AWF to
remain online and to generate reactive power output even if its voltage is under the
required limits.
The studies conducted under PQ control indicate that immediately after clearing the
fault the wind farm is absorbing reactive power. In turn, this would lead to a
depression of the network voltage. Therefore, under PQ control, if the wind farm
disconnected after the fault, then the voltage recovery would be quicker.
However, clause 3.3.3.3 (f) of the technical rules [2] does not allow generators to
absorb reactive power during voltage recovery. Therefore, there is an issue with the
PQ control for voltage recovery under transient conditions.
This issue is overcome by the utilisation of voltage control for the AWF. Under
voltage control, the model responds by generating power after fault clearance and the
network voltage is supported and voltage instability averted. Therefore, under voltage
control, if the wind farm disconnected after the fault, then the voltage recovery would
be slower.

ENG460 Thesis Brendan Fidock 30387869 15/5/2010 71
It can be concluded that by reverting to voltage control from constant PQ control, the
AWF has also reverted from absorbing reactive power to generating reactive power.
In doing this the AWF has provided reactive power support following the fault
condition.
Within the transient investigation, at first, transient voltage instability occurred, as the
voltage did achieve an acceptable steady state voltage following the transient event.
However, long term steady state voltage instability was avoided due to the under
voltage ride through capabilities of the AWF. This is because that once the under
voltage ride through capabilities (through voltage control) were actuated by the under
voltage set point, the voltage per unit achieved a new acceptable steady state voltage
within the simulation timeframe.
Therefore, it is now obvious why fault ride through capabilities are required by [2] for
Western Power networks utilising wind energy generation. That the under voltage ride
through capabilities of the AWF can contribute to the voltage control, network
support capability and stability of the A1 distribution network.
ENG460 Thesis Brendan Fidock 30387869 15/5/2010 72
6 Scope for future work
There are a number of additional investigations that could be performed using this
thesis as a research basis.
6.1 Expansion of the A1 Wind Farm (AWF)
Currently the owner of the A1 Wind Farm is planning to increase the number of wind
turbines to 18. However, as the original wind turbine is no longer manufactured by
ENERCON, a turbine of a greater capacity will be installed. This new wind farm may
require additional static reactive power compensation (STATCOM) and more
complex control between the wind farm and the STATCOM. Within this investigation
the optimum size of the wind turbines and STATCOM could be determined and
transiently tested.
6.2 Optimising the active power output
Future research could investigate the affect of changing the active power limit above
15 MW. This would produce different steady state and transient results. This way the
maximum output could be optimised and the research could investigate the AWF
under current generating conditions, rather than its initial commissioning conditions
and limitations.

ENG460 Thesis Brendan Fidock 30387869 15/5/2010 73
6.3 Further investigation of voltage instability
Voltage instability could be further investigated by reducing the fault level of the
external source and increasing the motor load within the PowerFactory simulation.
This would occur if one of the transmission feeders was isolated for maintenance or a
132kV fault. The size of the motor load and fault level could be determined to
investigate at what load and fault level that voltage instability would occur. When it
does occur, the motor speed and torque could be viewed and analysed to determine if
the motors stall and what additional affect this would have on the voltage stability.

ENG460 Thesis Brendan Fidock 30387869 15/5/2010 74
7 Conclusion
The purpose of this thesis was to investigate the voltage control, network support
capability and stability of the A1 distribution network and AWF under steady state
and transient conditions. This thesis was completed using research, simulation
modelling and steady state and transient analysis of the A1 Wind Farm (AWF).
The research outlined that when using the ENERCON concept, coupling the grid side
of the synchronous generator to the power converter allows the wind turbine to have
full control of its reactive power and power factor. The power converter allows the
AWF to participate in maintaining the voltage control and support through reactive
power generation and voltage stability using the Under Voltage Ride Through
capabilities.
The power converter can be controlled using fixed and limited PQ control for steady
state analysis. However, it should be noted, that the same PQ control proved
problematic for the transient analysis. After a fault occurred, the A1 Wind Farm did
not generate reactive power as it should to support the voltage.
Therefore, it was concluded that PQ control was not appropriate for transient network
conditions and the power converter should revert to voltage control to generate
reactive power. In reality this is carried out, as the technical rules [2] stipulate that a
generator is not permitted to absorb reactive power during voltage recovery.
ENG460 Thesis Brendan Fidock 30387869 15/5/2010 75
For the steady state investigation, it was concluded that operating the AWF at a
limited active power output of 15MW and a power factor of 0.95 leading (absorbing
reactive power) resulted in the least impact on the voltage of the Western Power
customers. When using fixed PQ control for the “constructed” AWF, the model acts
like a negative load model. Thus, all the synchronous generator reactive power
capabilities had no influence on the voltage at steady state.
For the transient investigation, it was concluded that it is required for the A1 Wind
Farm to have under voltage ride through (UVRT) capabilities. UVRT capabilities are
important to the voltage control, support and stability of the A1 network, because this
specific capability allows the AWF to remain online and to generate reactive power
even if its voltage is under the required limits and voltage instability has already
occurred.
The implications of these conclusions are that, the wind energy generation must be
limited during commissioning to limit the impact on voltage fluctuations. The power
converter used for the ENERCON wind turbines, is required for voltage control,
network support capability and stability of the A1 distribution network.
ENG460 Thesis Brendan Fidock 30387869 15/5/2010 76
8 References
[1] Dean Frost, Power point, “Network Planning & Development”, Western
Power, 2010.
[2] Zoran Bozic et al, “Technical rules”, Perth, Western Power, 2007.
[3] J Grainger and W Stevenson Jr, Power System Analysis, Singapore, McGraw-
Hill international editions, 1994.
[4] Prabha Kundur, Power System Stability and Control, USA, McGraw-Hill
international editions, 1994.
[5] Thomas Ackermann, Wind power in power systems, John Wiley and Sons,
2005.
[6] Cath Chalmers, “A1 Wind Farm, Discussion of expected interaction with
transmission network during TIER 1 operation”, Western Power Capital
efficiency Branch, Perth, WA Western Power, 2009
[7] Ned Mohan, Tore M. Undeland, William P. Robbins, Power electronics :
converters, applications, and design, 3rd Edition, Hoboken, John Wiley and
Sons, 2003
[8] Stephen J Chapman, Electric Machinery Fundamentals, 3rd Edition, USA,
Mcgraw Hill companies, 1999.
ENG460 Thesis Brendan Fidock 30387869 15/5/2010 77
[9] DIgSILENT Power System Engineering and Software, “Direct Drive
Synchronous Machine Models for Stability Assessment of Wind Farms”,
DIgSILENT Power System Engineering and Software, NO DATE, [Online].
Available:http://www.digsilent.de/Consulting/Publications/DirectDrive_Mode
ling.pdf [Accessed: 25/11/2009].
[10] N. Hingorani, L. Gyugi, “Understanding Facts: Concepts and technology of
flexible AC transmission systems”, New York, Wiley, 2000.
[11] A. Beekmann, J Marques, E Quitmann , S Watchte., “Wind energy converters
with FACTS capabilities for optimized intergration of wind power into
transmission and distribution systems”, Germany, CIGRE publication, 2009.
[12] No Author, “Grid Connection Regulations for High and Extra High Voltage”,
Bayreuth, E.ON Netz GmbH, 2006.
[13] PowerFactory users manual, Digsilent PowerFactory V14, Gomaringen,
Germany 2008.
[14] AS/NZS 3000:2007, Australian Wiring Rules (Incorporating Amendment No.
1), Sydney: Standards Australia, 2007.
[15] A.E Fitzgerald, , Charles Kingsley Jr, Stephen D Umans, Electric Machinery,
6th Edition, New York, Mcgraw Hill Companies, 2003.
[16] Stephen J Chapman, Electric Machinery Fundamentals, 4th edition, Boston
Mcgraw Hill companies, 2005.
[17] N. Hatziargyriou et al, “CIGRE technical brochure on modelling new forms of
generation and storage”, Germany, CIGRE publication, 2000.
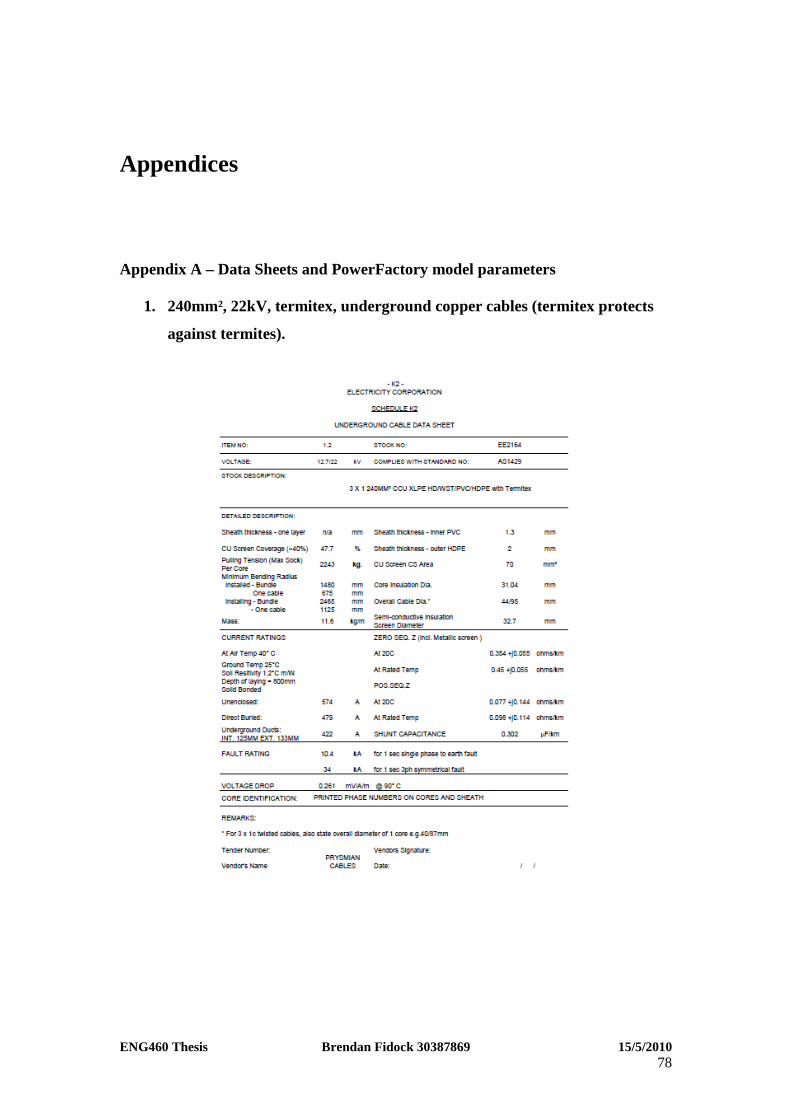
ENG460 Thesis Brendan Fidock 30387869 15/5/2010 78
Appendices
Appendix A – Data Sheets and PowerFactory model parameters
1. 240mm², 22kV, termitex, underground copper cables (termitex protects
against termites).
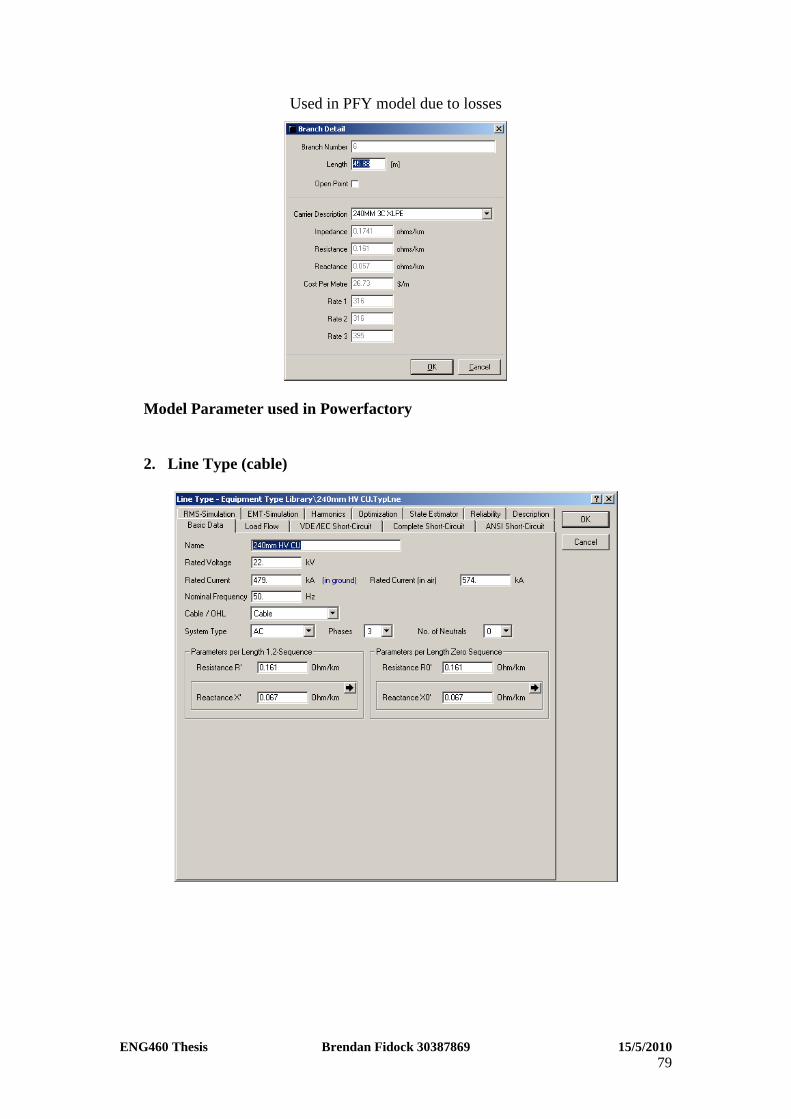
ENG460 Thesis Brendan Fidock 30387869 15/5/2010 79
Used in PFY model due to losses
Model Parameter used in Powerfactory 2. Line Type (cable)
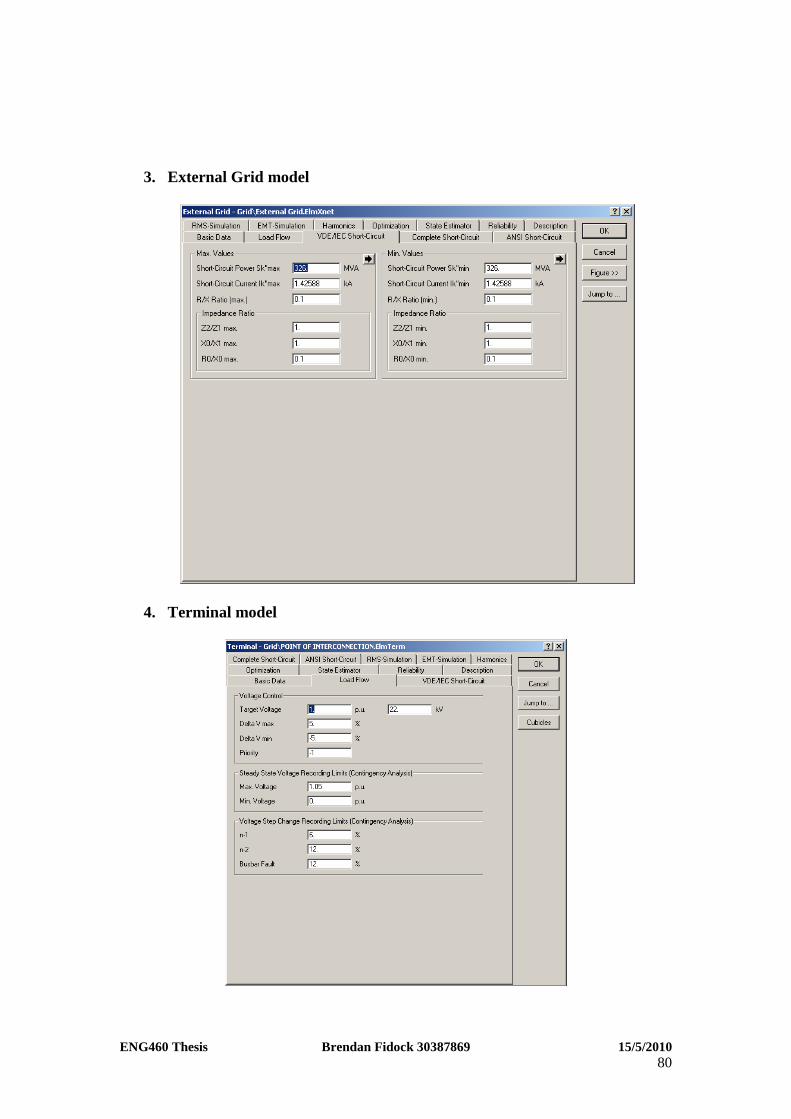
ENG460 Thesis Brendan Fidock 30387869 15/5/2010 80
3. External Grid model
4. Terminal model
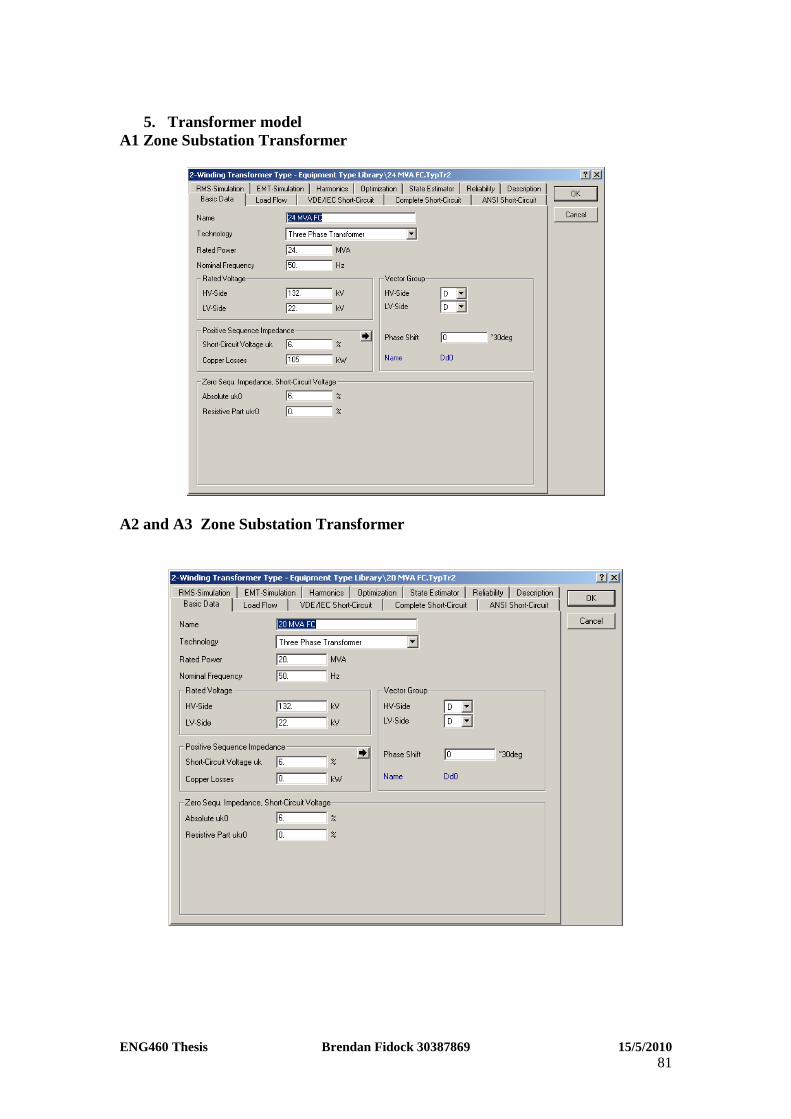
ENG460 Thesis Brendan Fidock 30387869 15/5/2010 81
5. Transformer model
A1 Zone Substation Transformer
A2 and A3 Zone Substation Transformer
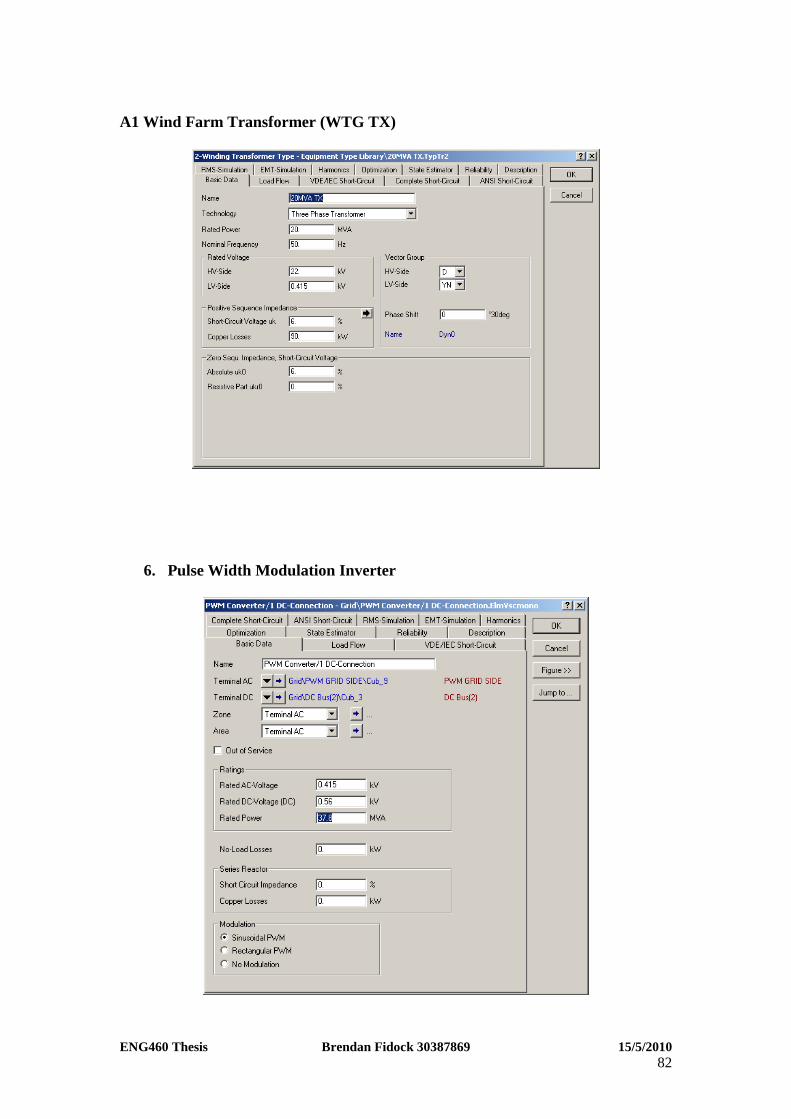
ENG460 Thesis Brendan Fidock 30387869 15/5/2010 82
A1 Wind Farm Transformer (WTG TX)
6. Pulse Width Modulation Inverter
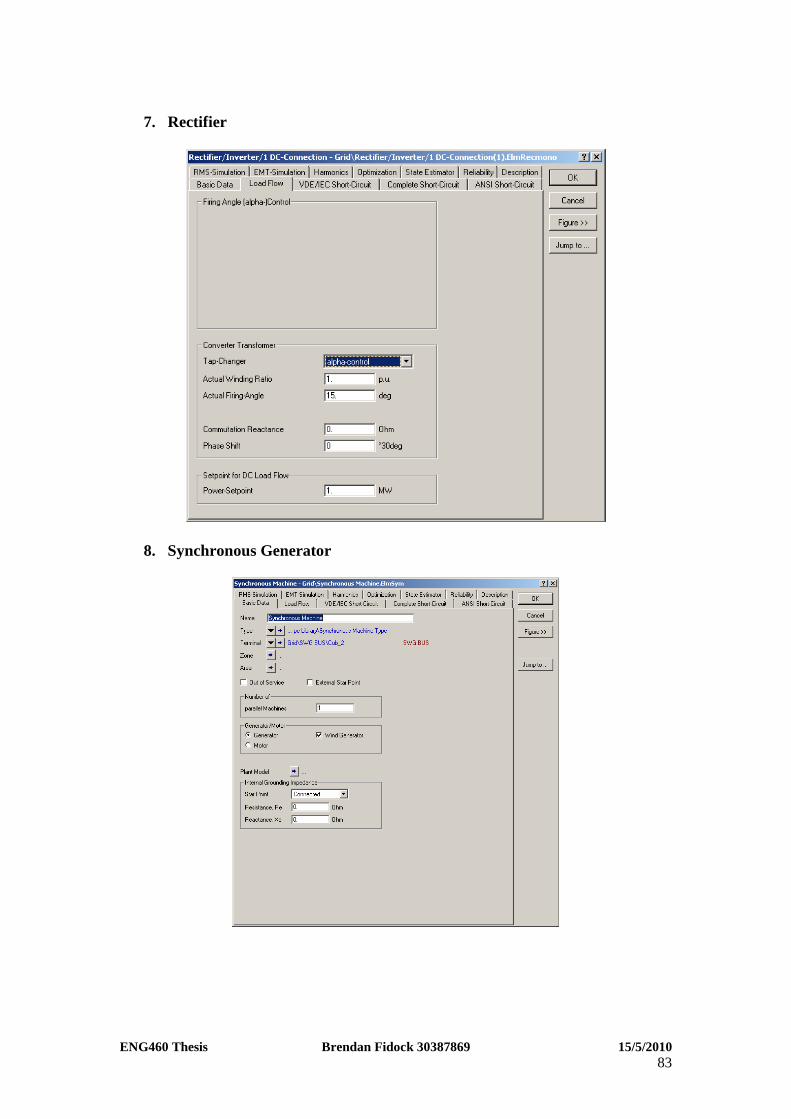
ENG460 Thesis Brendan Fidock 30387869 15/5/2010 83
7. Rectifier
8. Synchronous Generator
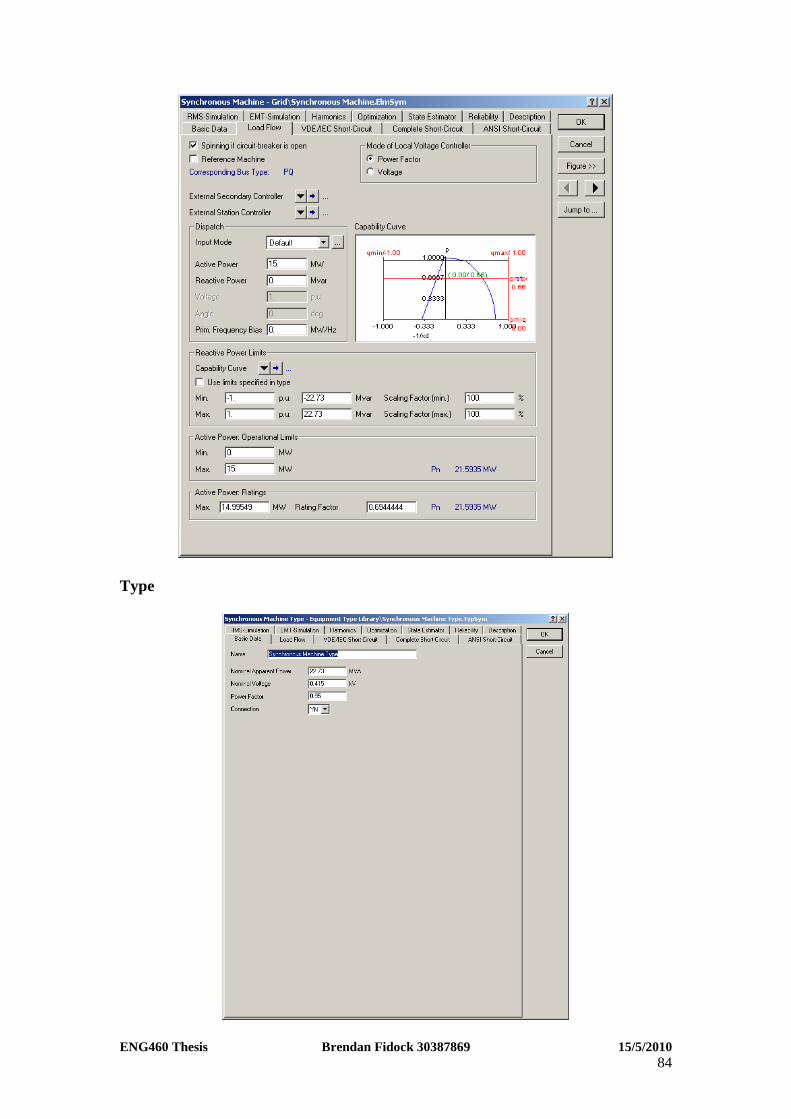
ENG460 Thesis Brendan Fidock 30387869 15/5/2010 84
Type
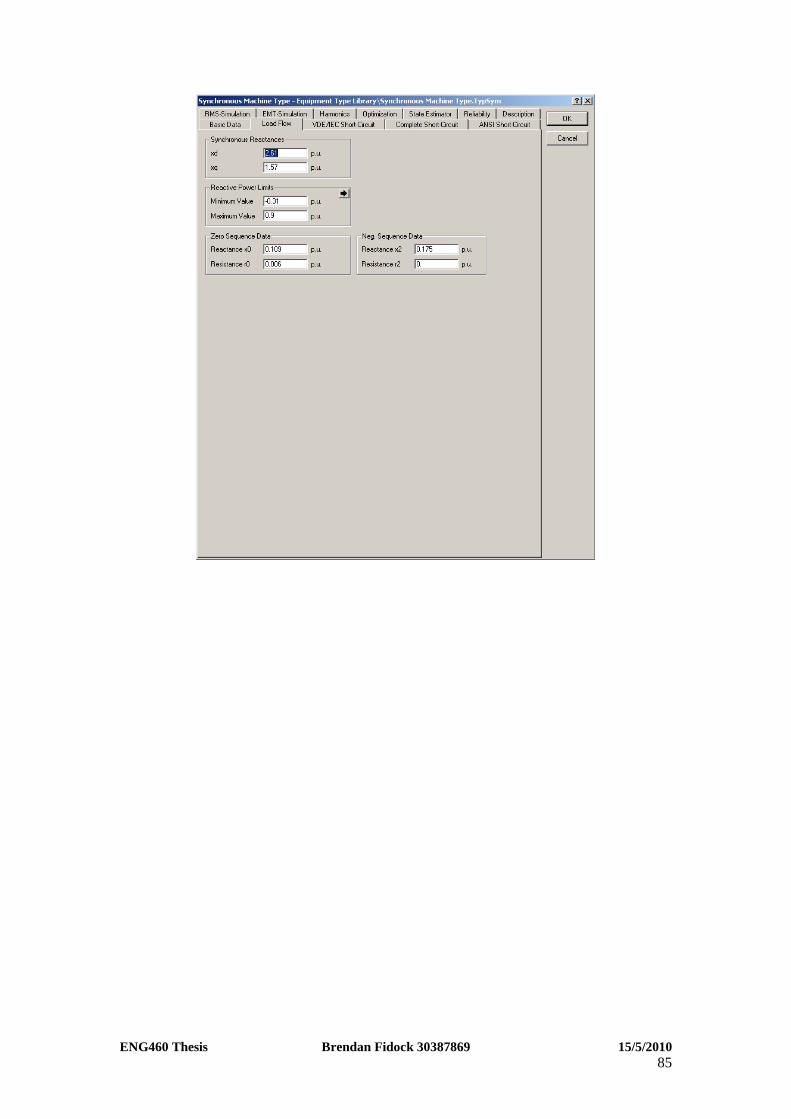
ENG460 Thesis Brendan Fidock 30387869 15/5/2010 85

ENG460 Thesis Brendan Fidock 30387869 15/5/2010 86
Appendix B – PowerFactory A1 Wind Farm Model
Appendix B is located in the folder named “Appendices” in the root directory of the
enclosed compact disc. It consists of a PowerFactory export file (.PFD) that can be
imported into PowerFactory Version 14 only.
Import this file into PowerFactory using
File- Import - Data (.PFD) – Select A1 Wind Farm – Execute
Then click file – activate project – A1 Wind Farm
For help with steady state and transient investigations, email Brendan Fidock on
Email: [email protected]

ENG460 Thesis Brendan Fidock 30387869 15/5/2010 87
This page has been left blank intentionally.


![ENG460 Engineering Thesis (Quality Assessment in ... · Corrosion Detection in ACSR Cables [55] A report submitted to School of Engineering and Information Technology, Murdoch University](https://img.pdfslide.us/doc/110x75/5fc394b7f85420758f3983a0/eng460-engineering-thesis-quality-assessment-in-corrosion-detection-in-acsr.jpg)