Embed Size (px)
Citation preview

1
An Economic Impact Analysis of the Nursery and Landscaping Industry
in Washington State
By
David Holland and Sanjoy Bhattacharjee
Working Paper SeriesWP 2006-1
School of Economic Sciences
AN ECONOMIC IMPACT ANALYSIS OF THE NURSERY AND
LANDSCAPING INDUSTRY IN WASHINGTON STATE David Holland Sanjoy Bhattacharjee∗ ABSTRACT
This study shows the economic impact of the Washington State Nursery, Plant Materials
and Landscaping industries on the Washington State economy. The analysis in this paper is
based on 2002 Census of Agriculture and Census of Industry data, up-dated to 2005 and
integrated into an IMPLAN based input-output (IO) model. The economic impact measured in
this study relates only to Green Industry production and distribution sourced in the State of
Washington. That is, the source of the product or service is firms located in Washington.
Measured in 2002 dollars, the economic (direct and indirect) impact of the Green Industry in
Washington is estimated to be $2.48 billion in sales and over 43,000 jobs. This report is
organized as follows: In section 1, we give a brief overview of the study. In section 2, we
present a brief literature review of other state studies made on Green Industry and their estimated
economic impact. In section 3, we summarize the overall structure of Green Industry. In section
4 we discuss the research methodology. In section 5 we review the economic impact of Green
Industry on the Washington economy as measured in our study, and section 6 concludes.
Keywords: Green Industry, Regional economic impact, Input-output analysis
JEL: R1 Length: 43 pages
∗ David Holland is a Professor and Sanjoy Bhattacharjee is a recent Ph.D. graduate from the School of Economic Sciences, Washington State University, Pullman, WA. This research was sponsored by Grant Number 3025-3384 from the Washington State Nursery and Landscape Association.
1
TABLE OF CONTENTS
ABSTRACT.................................................................................................................................... 1
TABLE OF CONTENTS................................................................................................................ 2
TABLE OF TABLES ..................................................................................................................... 3
TABLE OF FIGURES.................................................................................................................... 3
INTRODUCTION .......................................................................................................................... 4
OTHER ECONOMIC IMPACT STUDIES OF THE GREEN INDUSTRY................................. 5
THE STRUCTURE OF GREEN INDUSTRY............................................................................... 6
Input Supply Firms ..................................................................................................................... 9
Production Firms......................................................................................................................... 9
Wholesale Distribution Firms................................................................................................... 11
Retailers .................................................................................................................................... 12
End Users.................................................................................................................................. 12
RESEARCH METHODOLOGY AND INFORMATION SOURCES........................................ 13
ECONOMIC IMPACT ANALYSIS ............................................................................................ 17
Impact Analysis: ....................................................................................................................... 20
SUMMARY.................................................................................................................................. 27
REFERENCES: ............................................................................................................................ 28
APPENDIX 1: PRODUCTION FUNCTIONS FOR LANDSCAPING AND NURSERY
INDUSTRIES ............................................................................................................................... 31
APPENDIX 2: AGGREGATION SCHEME FOR IMPLAN INDUSTRIES.............................. 39
APPENDIX 3: INPUT-OUTPUT MODELS AND ECONOMIC IMPACT ANALYSIS .......... 40
Input-Output Modeling ............................................................................................................. 40
2
TABLE OF TABLES
Table 1: Gross Sales by Product Mix ............................................................................................. 5 Table2: Overview of Selected Previous Studies Evaluating the Economic Impact of the Green Industry in Specific States .............................................................................................................. 7 Table 3: (Sales in Washington for the Green Industry, 2002) ...................................................... 14 Table 4: (Projected Gross Sales, Year 2005) ................................................................................ 15 Table 5: Relative Size of Washington Industries......................................................................... 16 Table 6: Event Margins for Green Industry Products................................................................... 19 Table 7: Final Direct Effects for the Year 2005 ........................................................................... 19 Table 8: Output (Sales) Impact of the Green Industry, WA State, 2005 ..................................... 22 Table 9: Employment Impact of Green Industry, WA State, for 2005........................................ 23 Table10: Value-Added Impact of Green Industry for 2005.......................................................... 24 Table 11: Decomposition of Value-added Impact ........................................................................ 24 Table12: Indirect Business-Tax Impact of Green Industry for 2005............................................ 25 Table13: Tax Impact of Green Industry........................................................................................ 26 Table A1.1: Value-Added for Landscape Industry....................................................................... 31 Table A1.2: Input demand by Landscape Industry per Dollar of Sales........................................ 32 Table A1.3: Intermediate/ Industry Demand for Landscape Services.......................................... 34 Table A1.4: Institutional/ Final Demand for Landscape Industry ................................................ 35 Table A1.5: Value-Added for the Greenhouse and Nursery Industry .......................................... 35 Table A1.6: Input Demand for the Greenhouse and Nursery Industry per Dollar of Output ....... 36 Table A1.7: Final Demand for Greenhouse and Nursery ............................................................. 38 Table A2.1: Sectoring Scheme for IMPLAN Industries............................................................... 39 Table A3.1: Input Coefficient Matrix (Regional Purchase Coefficients or RPC), Matrix “C” .... 41 Table A3.2: Adjusted Coefficient Matrix (Regional Purchase Coefficients or RPC), Matrix “A”....................................................................................................................................................... 42 Table A3.3: Simple (I-A) Inverse ................................................................................................. 43 Table A3.4: Economic Impact on X ............................................................................................. 43
TABLE OF FIGURES
Figure 1: Structure of the Green Industry ....................................................................................... 8 Figure 2: Economic Impact of the Green Industry ....................................................................... 17
3
1: INTRODUCTION
The main purpose of this study is to estimate the economic impact of the Washington
State Nursery, Plant Materials and Landscaping industry on the Washington State economy. The
analysis in this paper is based on 2002 Census of Agriculture and Census of Industry data up-
dated to 2005 and integrated into an IMPLAN based input-output (IO) model by personnel at
Washington State University (IMPLAN, 2004). The Washington “Green Industry” for this study
is defined as consisting of the following industry groups/sectors (NAICS): Nursery and
Greenhouse (1114), Landscaping Services (56173), Landscape Architecture (54132), plus
Wholesale Marketing Intermediaries (42293) such as brokers and horticultural distribution
centers and finally retailers like Lawn and Garden Centers (4442), Building Material Supply
Stores (4441) Food and Beverage Stores (445) and Mass Merchandisers (452), such as Wal-
Mart, all of whom retail the Nursery and Greenhouse product produced in Washington.
The economic impact measured in this study relates only to Green Industry production
and distribution sourced in the State of Washington. That is, the source of the product or service
is firms located in Washington. This means that the economic impact of imported Green
Industry product is not measured in this study even though such imports do generate jobs and
income in Washington-based wholesale, retail and transportation industries. From that
perspective the economic impact figures (jobs and income) in this report are conservative.
This report is organized as follows: In section 1, we give a brief overview of the study.
In section 2, we present a brief literature review of other studies made on Green Industry and
their estimated economic impact. In section 3, we summarize the overall structure of Green
Industry. In section 4 we review the economic impact of Green Industry on the Washington
economy as measured in our study, and section 5 concludes.
4
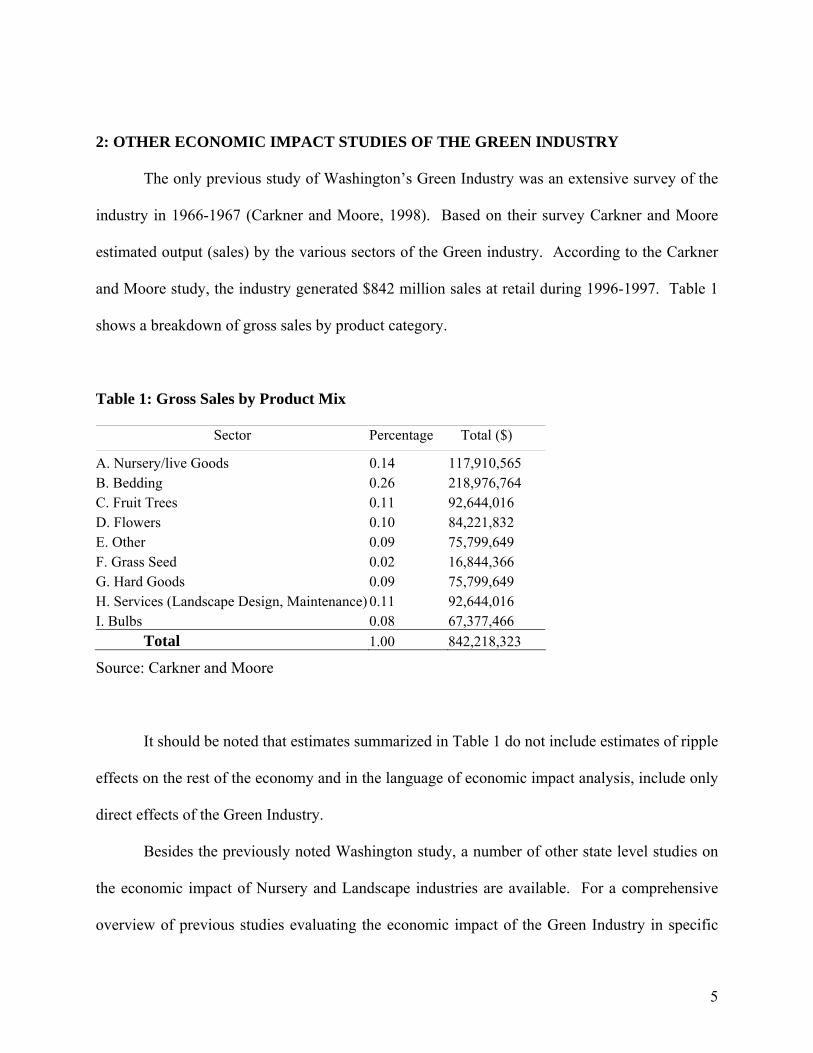
2: OTHER ECONOMIC IMPACT STUDIES OF THE GREEN INDUSTRY
The only previous study of Washington’s Green Industry was an extensive survey of the
industry in 1966-1967 (Carkner and Moore, 1998). Based on their survey Carkner and Moore
estimated output (sales) by the various sectors of the Green industry. According to the Carkner
and Moore study, the industry generated $842 million sales at retail during 1996-1997. Table 1
shows a breakdown of gross sales by product category.
Table 1: Gross Sales by Product Mix
Sector Percentage Total ($)
A. Nursery/live Goods 0.14 117,910,565 B. Bedding 0.26 218,976,764 C. Fruit Trees 0.11 92,644,016 D. Flowers 0.10 84,221,832 E. Other 0.09 75,799,649 F. Grass Seed 0.02 16,844,366 G. Hard Goods 0.09 75,799,649 H. Services (Landscape Design, Maintenance) 0.11 92,644,016 I. Bulbs 0.08 67,377,466 Total 1.00 842,218,323
Source: Carkner and Moore
It should be noted that estimates summarized in Table 1 do not include estimates of ripple
effects on the rest of the economy and in the language of economic impact analysis, include only
direct effects of the Green Industry.
Besides the previously noted Washington study, a number of other state level studies on
the economic impact of Nursery and Landscape industries are available. For a comprehensive
overview of previous studies evaluating the economic impact of the Green Industry in specific
5
states, see “Economic Impacts of the Green Industry in the United States,” Charles Hall et al.,
2005.
Among state level Green Industries, the big three are California, Texas and Florida.
According to Hall et al. California ranked first with estimated total state economic impact of
$10.33 billion. Texas was second with $9.76 billion of economic impact and Florida was third
with an estimated impact of $9.16 billion (Table 2.) After Florida, a number of states such
Illinois, Ohio, Tennessee, Minnesota, and Wisconsin are roughly in the same size range - $2-4
billion total state economic impact.
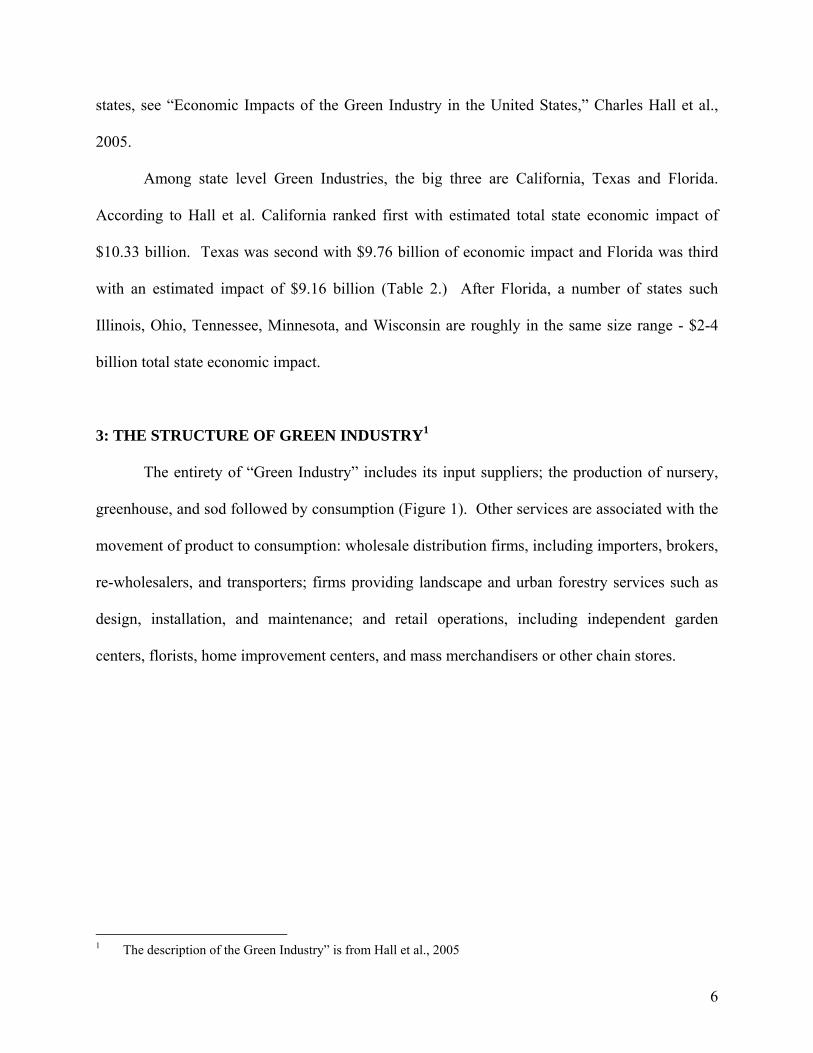
3: THE STRUCTURE OF GREEN INDUSTRY1
The entirety of “Green Industry” includes its input suppliers; the production of nursery,
greenhouse, and sod followed by consumption (Figure 1). Other services are associated with the
movement of product to consumption: wholesale distribution firms, including importers, brokers,
re-wholesalers, and transporters; firms providing landscape and urban forestry services such as
design, installation, and maintenance; and retail operations, including independent garden
centers, florists, home improvement centers, and mass merchandisers or other chain stores.
1 The description of the Green Industry” is from Hall et al., 2005
6
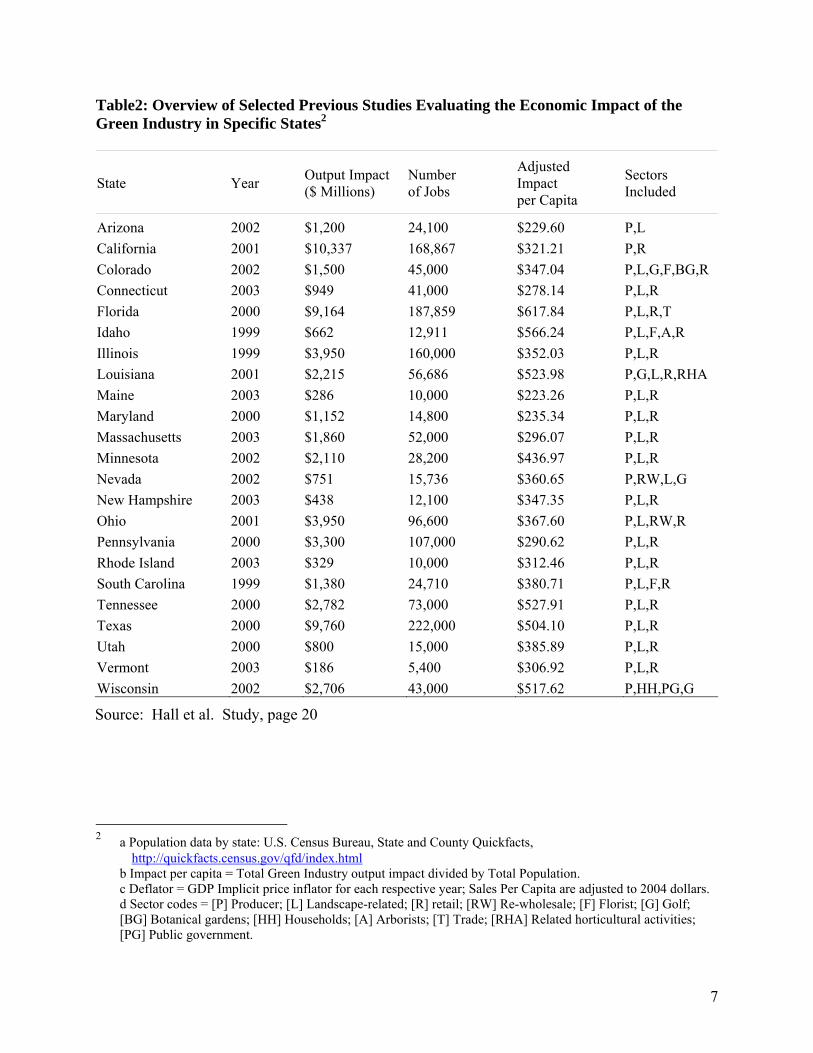
Table2: Overview of Selected Previous Studies Evaluating the Economic Impact of the Green Industry in Specific States2
State Year Output Impact ($ Millions)
Number of Jobs
Adjusted Impact per Capita
Sectors Included
Arizona 2002 $1,200 24,100 $229.60 P,L California 2001 $10,337 168,867 $321.21 P,R Colorado 2002 $1,500 45,000 $347.04 P,L,G,F,BG,R Connecticut 2003 $949 41,000 $278.14 P,L,R Florida 2000 $9,164 187,859 $617.84 P,L,R,T Idaho 1999 $662 12,911 $566.24 P,L,F,A,R Illinois 1999 $3,950 160,000 $352.03 P,L,R Louisiana 2001 $2,215 56,686 $523.98 P,G,L,R,RHA Maine 2003 $286 10,000 $223.26 P,L,R Maryland 2000 $1,152 14,800 $235.34 P,L,R Massachusetts 2003 $1,860 52,000 $296.07 P,L,R Minnesota 2002 $2,110 28,200 $436.97 P,L,R Nevada 2002 $751 15,736 $360.65 P,RW,L,G New Hampshire 2003 $438 12,100 $347.35 P,L,R Ohio 2001 $3,950 96,600 $367.60 P,L,RW,R Pennsylvania 2000 $3,300 107,000 $290.62 P,L,R Rhode Island 2003 $329 10,000 $312.46 P,L,R South Carolina 1999 $1,380 24,710 $380.71 P,L,F,R Tennessee 2000 $2,782 73,000 $527.91 P,L,R Texas 2000 $9,760 222,000 $504.10 P,L,R Utah 2000 $800 15,000 $385.89 P,L,R Vermont 2003 $186 5,400 $306.92 P,L,R Wisconsin 2002 $2,706 43,000 $517.62 P,HH,PG,G
Source: Hall et al. Study, page 20
2 a Population data by state: U.S. Census Bureau, State and County Quickfacts,
http://quickfacts.census.gov/qfd/index.html b Impact per capita = Total Green Industry output impact divided by Total Population. c Deflator = GDP Implicit price inflator for each respective year; Sales Per Capita are adjusted to 2004 dollars. d Sector codes = [P] Producer; [L] Landscape-related; [R] retail; [RW] Re-wholesale; [F] Florist; [G] Golf;
[BG] Botanical gardens; [HH] Households; [A] Arborists; [T] Trade; [RHA] Related horticultural activities; [PG] Public government.
7
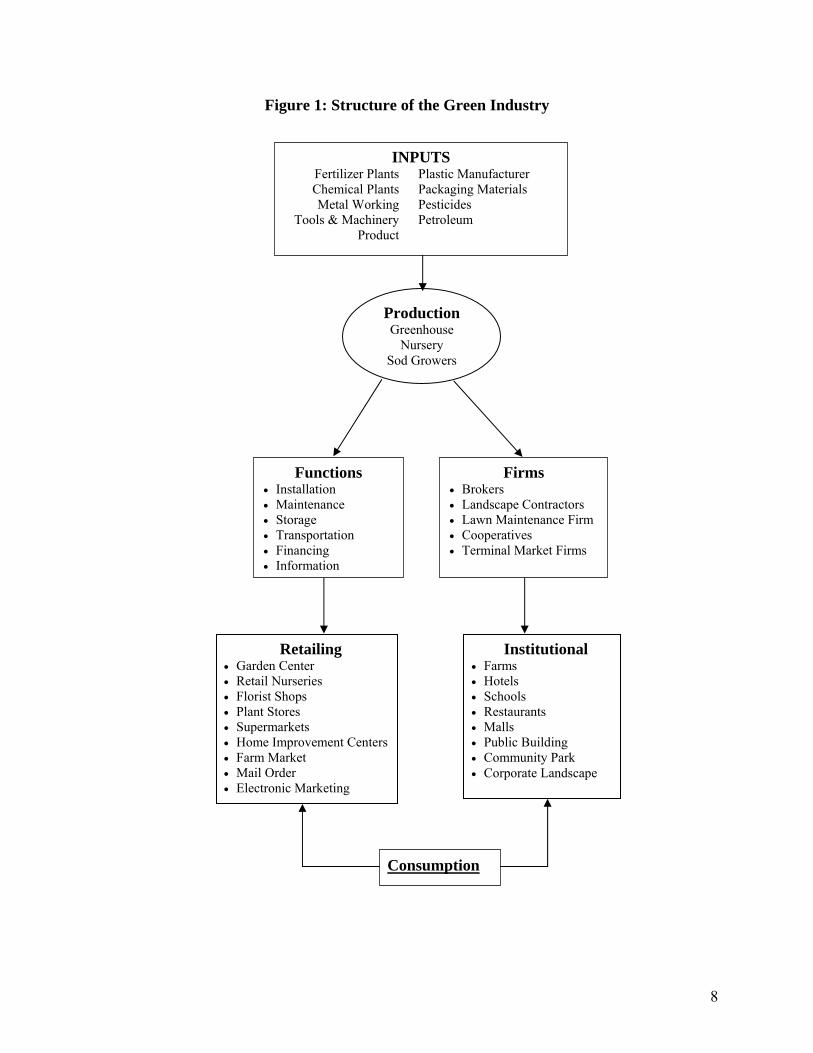
Figure 1: Structure of the Green Industry
INPUTS Fertilizer Plants
Chemical Plants Metal Working
Tools & Machinery Product
Plastic Manufacturer Packaging Materials Pesticides Petroleum
Functions • Installation • Maintenance • Storage • Transportation • Financing • Information
ProductionGreenhouse
Nursery Sod Growers
Firms • Brokers • Landscape Contractors • Lawn Maintenance Firm • Cooperatives • Terminal Market Firms
Retailing • Garden Center • Retail Nurseries • Florist Shops • Plant Stores • Supermarkets • Home Improvement Centers • Farm Market • Mail Order • Electronic Marketing
Institutional • Farms • Hotels • Schools • Restaurants • Malls • Public Building • Community Park • Corporate Landscape
Consumption
8
Input Supply Firms
These firms, often referred to as allied trade firms, are businesses that provide various
inputs for Ornamental plant production, landscape services, and retail sales. These inputs
commonly include agrichemicals, fertilizers, containers, packaging, farm machinery, tools and
equipment, propagative materials, and consulting services. These products often originate from
extractive and manufacturing industries such as mining, petroleum, and forestry.
Production Firms
Participants engaged in producing Green Industry products include growers of nursery,
sod, and floriculture crops. Floriculture crops include bedding plants, potted flowering plants,
foliage plants, cut cultivated greens, and cut flowers. Bedding and garden plants consist of
young flowering plants (annuals and perennials) and vegetable plants.
Flowering plants are largely sold in pots for indoor use. The market outlets for
floriculture crops are florists, garden centers, mass merchandisers, supermarkets, chain stores,
discount stores, home improvement centers, hardware stores, landscape contractors, and re-
wholesalers. Other retail outlets are farmers markets, flea markets, and street vendors.
Nursery crops are woody perennial plants that are usually grown in containers or in-
ground. The Census of Agriculture defines nursery crops as ornamental trees and shrubs, fruit
and nut trees (for noncommercial use), vines, and ground covers. They are primarily used for
landscaping, not for producing edible products on a commercial scale. Trees and shrubs are
classified as deciduous or evergreen. Deciduous includes shade, flowering, ornamental, fruit,
and nut trees and shrubs. Evergreens include broadleaf and coniferous trees, and Christmas
trees. Christmas tree farms are counted as part of nursery crops.
9

Sales of most nursery crops, except Christmas trees, are more local or regional than
floriculture crops, which are less costly to ship to farther markets. While homeowners are the
typical consumers of trees, shrubs, and woody ornamental plants, markets also include
developers, public utilities, golf courses, resorts, commercial parks, malls, as well as government
agencies in charge of public parks, street and highway vegetation, and forests. Like many floral
crops, demand for nursery crops (except Christmas trees) tends to coincide with normal planting
seasons in the spring and fall.
Wholesale sales of nursery products are usually handled by salespersons who have
established relations with large buyers. Marketing programs include numerous trade shows,
advertising in trade publications, catalogs, and direct mail. Close planning with large buyers
(referred to as partnering) is required to secure long-term markets and to ensure that the right
product mix is produced; however, demand for different products can still vary substantially
from year to year. Sales and many variable expenses (costs-of-goods-sold) are highly seasonal,
with up to 50 percent of sales in the second quarter of a typical year. Cash flow is uneven
throughout the year so cash management is important. Technical knowledge of plants and pests
is important for nursery management, although many of the everyday tasks (cultural practices)
are routine and do not require specialized labor. However, automation has proven to be difficult,
aside from the widespread use of irrigation and fertilization systems. Greenhouse operations can
be very sophisticated, with automatic irrigation and fertilization (sometimes referred to as
fertigation), and air and lighting systems driven by a variety of sensors. Innovations demanded
by big-box retailers (such as custom labeling, bar codes, scanners, and electronic data
interchange between suppliers and buyers) are now used by many producers.
10
In recent years, there has been considerable consolidation among large growers, largely
in response to consolidation occurring at the retail level. The rise of large, nationwide plant
retailers like Home Depot, Lowe’s, Wal-Mart, etc. has created a marketing opportunity for large
growers who can supply the large volumes these customers require. Companies like Hines and
Color Spot have grown rapidly through acquisition during the past decade, largely to service
these big customers. Geared to serve big customers by handling large volumes, large growers
actively discourage small-volume buyers. While large nurseries are supplying mainly big-box
retailers and large landscape installation companies, smaller growers are the main suppliers of
independent garden centers, retail nurseries, and smaller landscape firms. Proximity and high
product quality are more important to these buyers than low price because the end consumer is
most interested in quality and the breadth of retail selection. Keeping plants alive and healthy is
a challenge for many consumers, and small retail operations often have more technically
knowledgeable staff than mass retailers to assist customers with plant care advice.
To even out the seasonal nature of demand throughout the year, many nurseries produce
plants like Easter lilies and poinsettias that have demand at times other than late spring or fall.
Large producers may also sell related products like soil, sod, and Christmas trees. Some growers
may produce a range of soil mixtures made from peat moss, sand, bark, sawdust, lime, perlite,
vermiculite, and other materials (including mulched product waste) to sell to other growers on a
contract basis.
Wholesale Distribution Firms
Wholesale distributors are an integral part of the Green Industry supply chain.
Intermediaries such as brokers and importers facilitate the transactions of domestic and
11
international (importing/exporting) growers and retailers. Re-wholesalers (often referred to as
horticultural distribution centers or HDCs) are also market facilitators that offer regionally
specific mixes of landscape supplies for immediate pickup or delivery to landscape professionals
and have emerged throughout the United States in a variety of forms. There are self-contained
HDCs and HDCs that serve as independent profit centers within vertically-integrated grower,
landscape contracting, and retail garden center operations.
Retailers
Retail firms are another point of contact with end consumers of horticultural products,
such as independent garden centers, florists, home centers, mass merchants, and other chain
stores. Garden centers are establishments primarily engaged in selling trees, shrubs, other plants,
seeds, bulbs, mulches, soil conditioners, fertilizers, pesticides, garden tools, and other garden
supplies to the general public. These establishments primarily sell products purchased from
others, but may sell some plants which they grow themselves. Garden center consumer studies
indicate customer loyalty and repeat business result from a convenient store location, plant
quality, customer service, and plant selection.
End Users
Final consumers of Green Industry products and services are referred to as end users.
While the vast majority of nursery and turf grass products used by end users are purchased from
Green Industry businesses, this is not the case for services. The end users themselves perform a
significant amount of lawn and landscape services. However, these services are only for internal
consumption; that is, end users do not maintain or care for any landscape plants or green space
12
other than their own. The list of end users includes airports, cemeteries, churches, commercial
general business areas, golf courses and driving ranges, homeowners, municipalities, private
recreation areas, public roadways, schools and universities, utilities and construction3.
“Commercial areas” are comprised of restaurants, banks, credit unions, commercial building
operators, shopping centers, real estate managers, apartment buildings, other dwelling operators,
mobile home sites, hotels and motels, medical centers, nursing care centers, intermediate care
facilities, general and specialty hospitals, residential care facilities, retirement communities,
community centers, and adult and child day-care centers.
4: RESEARCH METHODOLOGY AND INFORMATION SOURCES
The economic impact analysis in this paper begins with the most recent figures from the
Agriculture and Economic Census for the State of Washington data for 2002 and IMPLAN 2002
data for Washington. Information from the Census was considered the most reliable data
available, because the Census has well-established statistical methodologies and adjustment for
non-responding business as well as published confidence parameters. According to Census 2002
data, the Washington Green Industry was estimated to generate $1.17 billion worth of sales,
which is the value of sales at factory gate during 2001-2002. Table 3 shows a breakdown of
gross sales by industry.
3 In Table A1.3, new residential construction and highway construction are shown as important buyers of Landscape Services.
13
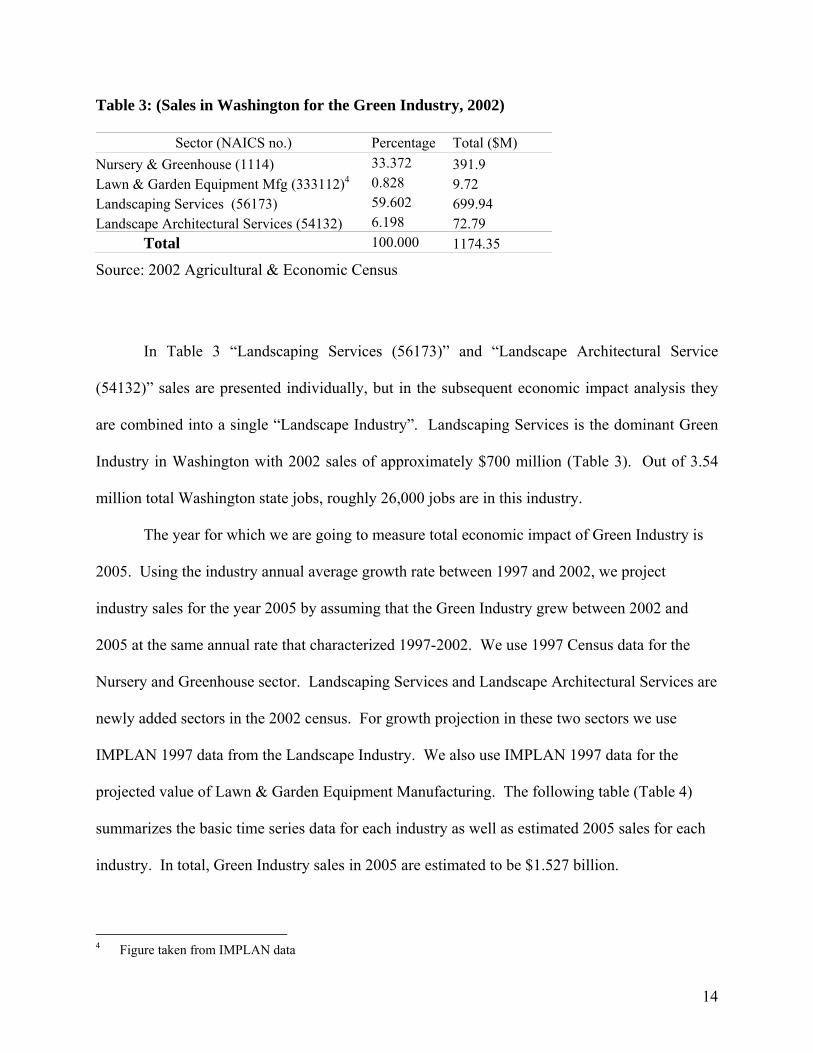
Table 3: (Sales in Washington for the Green Industry, 2002)
Sector (NAICS no.) Percentage Total ($M) Nursery & Greenhouse (1114) 33.372 391.9 Lawn & Garden Equipment Mfg (333112)4 0.828 9.72 Landscaping Services (56173) 59.602 699.94 Landscape Architectural Services (54132) 6.198 72.79 Total 100.000 1174.35
Source: 2002 Agricultural & Economic Census
In Table 3 “Landscaping Services (56173)” and “Landscape Architectural Service
(54132)” sales are presented individually, but in the subsequent economic impact analysis they
are combined into a single “Landscape Industry”. Landscaping Services is the dominant Green
Industry in Washington with 2002 sales of approximately $700 million (Table 3). Out of 3.54
million total Washington state jobs, roughly 26,000 jobs are in this industry.
The year for which we are going to measure total economic impact of Green Industry is
2005. Using the industry annual average growth rate between 1997 and 2002, we project
industry sales for the year 2005 by assuming that the Green Industry grew between 2002 and
2005 at the same annual rate that characterized 1997-2002. We use 1997 Census data for the
Nursery and Greenhouse sector. Landscaping Services and Landscape Architectural Services are
newly added sectors in the 2002 census. For growth projection in these two sectors we use
IMPLAN 1997 data from the Landscape Industry. We also use IMPLAN 1997 data for the
projected value of Lawn & Garden Equipment Manufacturing. The following table (Table 4)
summarizes the basic time series data for each industry as well as estimated 2005 sales for each
industry. In total, Green Industry sales in 2005 are estimated to be $1.527 billion.
4 Figure taken from IMPLAN data
14
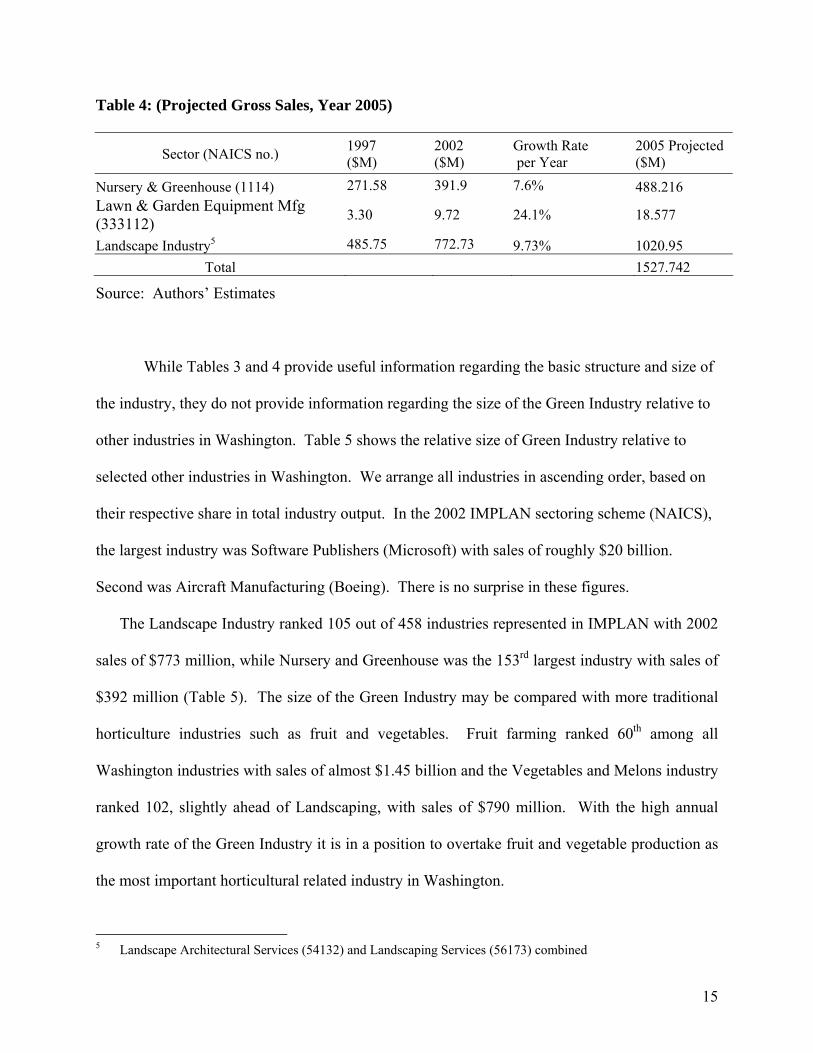
Table 4: (Projected Gross Sales, Year 2005)
Sector (NAICS no.) 1997 ($M)
2002 ($M)
Growth Rate per Year
2005 Projected ($M)
Nursery & Greenhouse (1114) 271.58 391.9 7.6% 488.216 Lawn & Garden Equipment Mfg (333112) 3.30 9.72 24.1% 18.577
Landscape Industry5 485.75 772.73 9.73% 1020.95 Total 1527.742
Source: Authors’ Estimates
While Tables 3 and 4 provide useful information regarding the basic structure and size of
the industry, they do not provide information regarding the size of the Green Industry relative to
other industries in Washington. Table 5 shows the relative size of Green Industry relative to
selected other industries in Washington. We arrange all industries in ascending order, based on
their respective share in total industry output. In the 2002 IMPLAN sectoring scheme (NAICS),
the largest industry was Software Publishers (Microsoft) with sales of roughly $20 billion.
Second was Aircraft Manufacturing (Boeing). There is no surprise in these figures.
The Landscape Industry ranked 105 out of 458 industries represented in IMPLAN with 2002
sales of $773 million, while Nursery and Greenhouse was the 153rd largest industry with sales of
$392 million (Table 5). The size of the Green Industry may be compared with more traditional
horticulture industries such as fruit and vegetables. Fruit farming ranked 60th among all
Washington industries with sales of almost $1.45 billion and the Vegetables and Melons industry
ranked 102, slightly ahead of Landscaping, with sales of $790 million. With the high annual
growth rate of the Green Industry it is in a position to overtake fruit and vegetable production as
the most important horticultural related industry in Washington.
5 Landscape Architectural Services (54132) and Landscaping Services (56173) combined
15
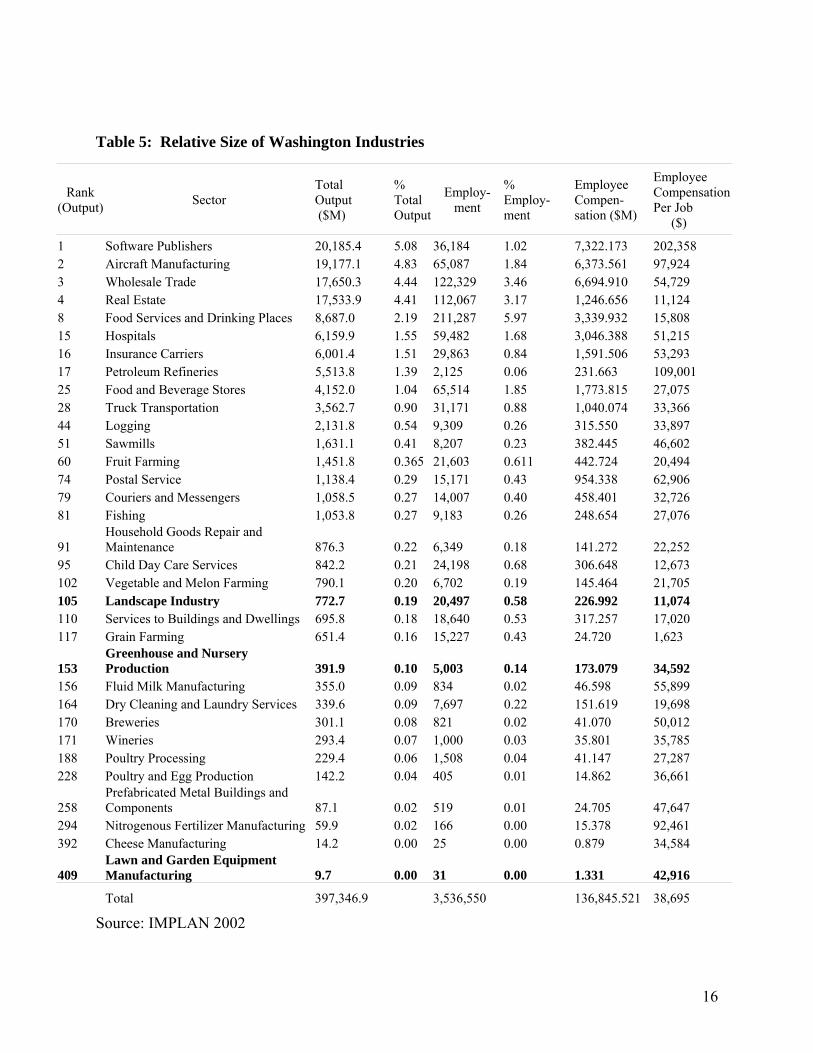
Table 5: Relative Size of Washington Industries
R(O
Employee
1 2 3 4 8 1516172528445160747981
919510101111
15151617171822
252939
40
ank utput) Sector
Total Output ($M)
% Total Output
Employ-ment
% Employ-ment
Employee Compen-sation ($M)
Compensation Per Job ($)
Software Publishers 20,185.4 5.08 36,184 1.02 7,322.173 202,358 Aircraft Manufacturing 19,177.1 4.83 65,087 1.84 6,373.561 97,924 Wholesale Trade 17,650.3 4.44 122,329 3.46 6,694.910 54,729 Real Estate 17,533.9 4.41 112,067 3.17 1,246.656 11,124 Food Services and Drinking Places 8,687.0 2.19 211,287 5.97 3,339.932 15,808
Hospitals 6,159.9 1.55 59,482 1.68 3,046.388 51,215 Insurance Carriers 6,001.4 1.51 29,863 0.84 1,591.506 53,293 Petroleum Refineries 5,513.8 1.39 2,125 0.06 231.663 109,001 Food and Beverage Stores 4,152.0 1.04 65,514 1.85 1,773.815 27,075 Truck Transportation 3,562.7 0.90 31,171 0.88 1,040.074 33,366 Logging 2,131.8 0.54 9,309 0.26 315.550 33,897 Sawmills 1,631.1 0.41 8,207 0.23 382.445 46,602 Fruit Farming 1,451.8 0.365 21,603 0.611 442.724 20,494 Postal Service 1,138.4 0.29 15,171 0.43 954.338 62,906 Couriers and Messengers 1,058.5 0.27 14,007 0.40 458.401 32,726 Fishing 1,053.8 0.27 9,183 0.26 248.654 27,076
Household Goods Repair and Maintenance 876.3 0.22 6,349 0.18 141.272 22,252
Child Day Care Services 842.2 0.21 24,198 0.68 306.648 12,673 2 Vegetable and Melon Farming 790.1 0.20 6,702 0.19 145.464 21,705 5 Landscape Industry 772.7 0.19 20,497 0.58 226.992 11,074 0 Services to Buildings and Dwellings 695.8 0.18 18,640 0.53 317.257 17,020 7 Grain Farming 651.4 0.16 15,227 0.43 24.720 1,623
3 Greenhouse and Nursery Production 391.9 0.10 5,003 0.14 173.079 34,592
6 Fluid Milk Manufacturing 355.0 0.09 834 0.02 46.598 55,899 4 Dry Cleaning and Laundry Services 339.6 0.09 7,697 0.22 151.619 19,698 0 Breweries 301.1 0.08 821 0.02 41.070 50,012 1 Wineries 293.4 0.07 1,000 0.03 35.801 35,785 8 Poultry Processing 229.4 0.06 1,508 0.04 41.147 27,287 8 Poultry and Egg Production 142.2 0.04 405 0.01 14.862 36,661
8 Prefabricated Metal Buildings and Components 87.1 0.02 519 0.01 24.705 47,647
4 Nitrogenous Fertilizer Manufacturing 59.9 0.02 166 0.00 15.378 92,461 2 Cheese Manufacturing 14.2 0.00 25 0.00 0.879 34,584
9 Lawn and Garden Equipment Manufacturing 9.7 0.00 31 0.00 1.331 42,916
Total 397,346.9 3,536,550 136,845.521 38,695
Source: IMPLAN 2002
16
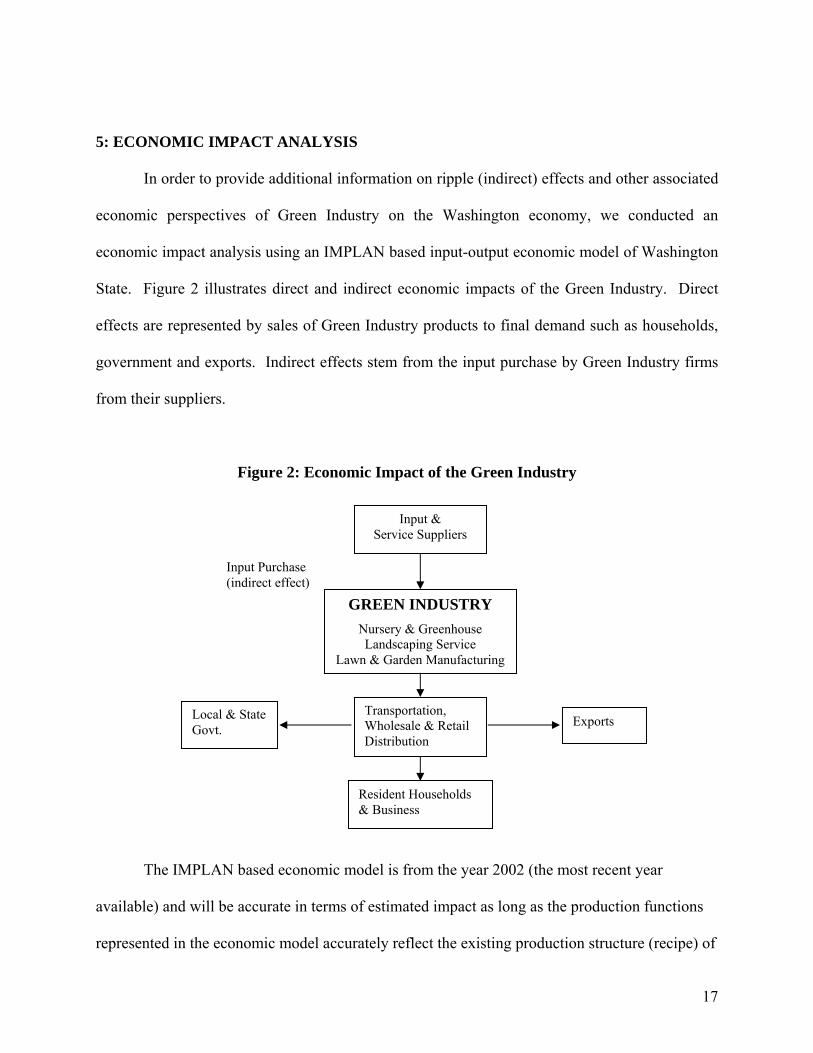
5: ECONOMIC IMPACT ANALYSIS
In order to provide additional information on ripple (indirect) effects and other associated
economic perspectives of Green Industry on the Washington economy, we conducted an
economic impact analysis using an IMPLAN based input-output economic model of Washington
State. Figure 2 illustrates direct and indirect economic impacts of the Green Industry. Direct
effects are represented by sales of Green Industry products to final demand such as households,
government and exports. Indirect effects stem from the input purchase by Green Industry firms
from their suppliers.
Figure 2: Economic Impact of the Green Industry
Input &
Service Suppliers
GREEN INDUSTRY Nursery & Greenhouse Landscaping Service
Lawn & Garden Manufacturing
Input Purchase (indirect effect)
Local & State Govt.
Resident Households & Business
Exports Transportation, Wholesale & Retail Distribution
The IMPLAN based economic model is from the year 2002 (the most recent year
available) and will be accurate in terms of estimated impact as long as the production functions
represented in the economic model accurately reflect the existing production structure (recipe) of
17
Washington’s industries. Usually industry structure changes slowly so that an economic model
that captures the structure in 2002 should be reasonably representative for the next 5 to 6 years.
For more information on input-output models and economic impact analysis see Appendix 3.
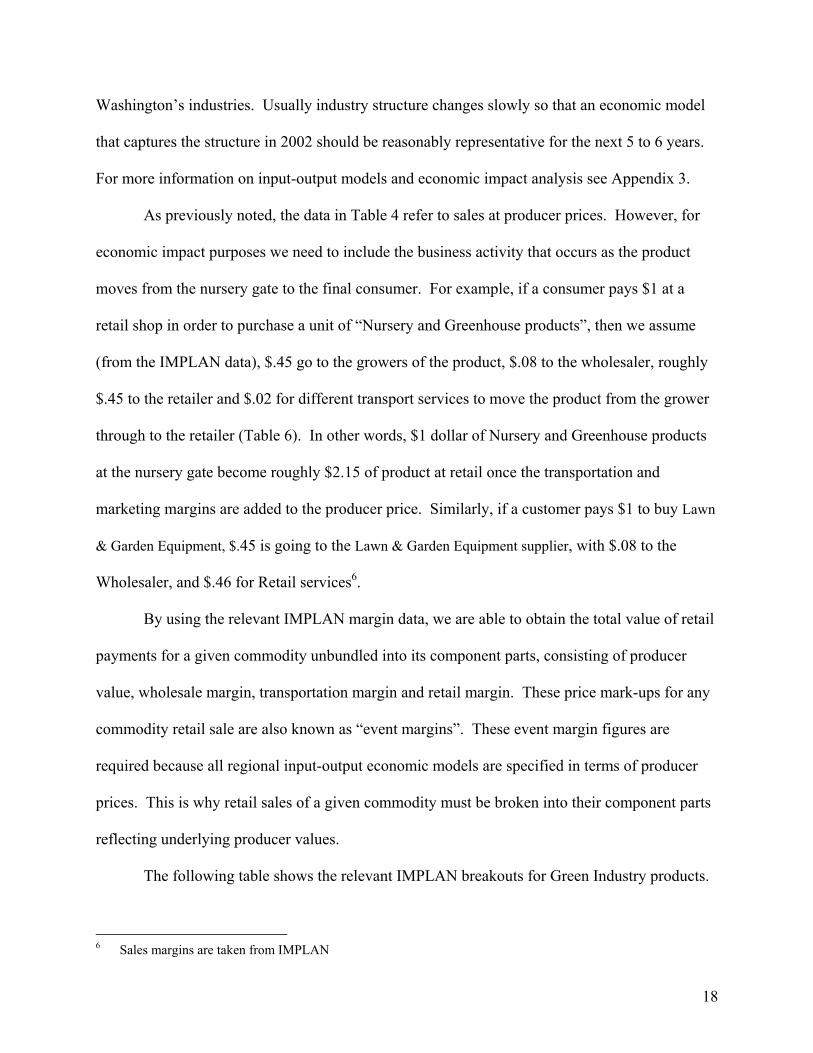
As previously noted, the data in Table 4 refer to sales at producer prices. However, for
economic impact purposes we need to include the business activity that occurs as the product
moves from the nursery gate to the final consumer. For example, if a consumer pays $1 at a
retail shop in order to purchase a unit of “Nursery and Greenhouse products”, then we assume
(from the IMPLAN data), $.45 go to the growers of the product, $.08 to the wholesaler, roughly
$.45 to the retailer and $.02 for different transport services to move the product from the grower
through to the retailer (Table 6). In other words, $1 dollar of Nursery and Greenhouse products
at the nursery gate become roughly $2.15 of product at retail once the transportation and
marketing margins are added to the producer price. Similarly, if a customer pays $1 to buy Lawn
& Garden Equipment, $.45 is going to the Lawn & Garden Equipment supplier, with $.08 to the
Wholesaler, and $.46 for Retail services6.
By using the relevant IMPLAN margin data, we are able to obtain the total value of retail
payments for a given commodity unbundled into its component parts, consisting of producer
value, wholesale margin, transportation margin and retail margin. These price mark-ups for any
commodity retail sale are also known as “event margins”. These event margin figures are
required because all regional input-output economic models are specified in terms of producer
prices. This is why retail sales of a given commodity must be broken into their component parts
reflecting underlying producer values.
The following table shows the relevant IMPLAN breakouts for Green Industry products.
6 Sales margins are taken from IMPLAN
18
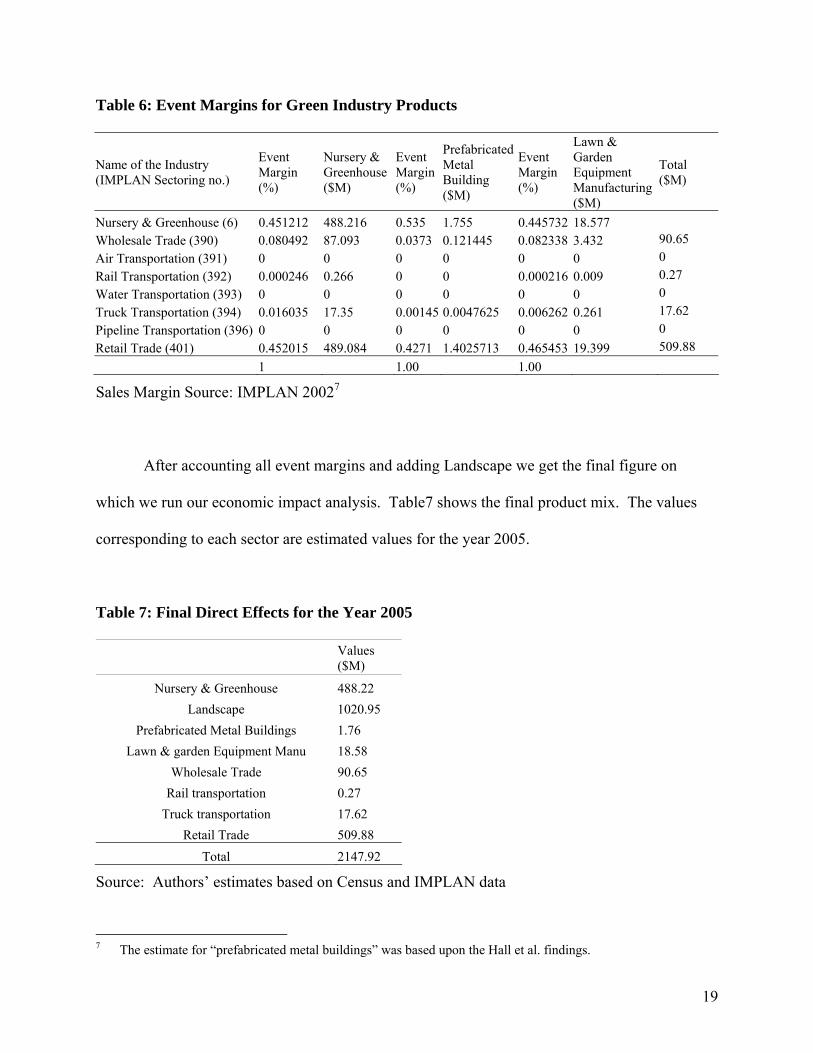
Table 6: Event Margins for Green Industry Products
Name of the Industry (IMPLAN Sectoring no.)
Event Margin (%)
Nursery & Greenhouse ($M)
Event Margin (%)
Prefabricated Metal Building ($M)
Event Margin (%)
Lawn & Garden Equipment Manufacturing ($M)
Total ($M)
Nursery & Greenhouse (6) 0.451212 488.216 0.535 1.755 0.445732 18.577 Wholesale Trade (390) 0.080492 87.093 0.0373 0.121445 0.082338 3.432 90.65 Air Transportation (391) 0 0 0 0 0 0 0 Rail Transportation (392) 0.000246 0.266 0 0 0.000216 0.009 0.27 Water Transportation (393) 0 0 0 0 0 0 0 Truck Transportation (394) 0.016035 17.35 0.00145 0.0047625 0.006262 0.261 17.62 Pipeline Transportation (396) 0 0 0 0 0 0 0 Retail Trade (401) 0.452015 489.084 0.4271 1.4025713 0.465453 19.399 509.88
1 1.00 1.00
Sales Margin Source: IMPLAN 20027
After accounting all event margins and adding Landscape we get the final figure on
which we run our economic impact analysis. Table7 shows the final product mix. The values
corresponding to each sector are estimated values for the year 2005.
Table 7: Final Direct Effects for the Year 2005
Values ($M)
Nursery & Greenhouse 488.22 Landscape 1020.95
Prefabricated Metal Buildings 1.76 Lawn & garden Equipment Manu 18.58
Wholesale Trade 90.65 Rail transportation 0.27
Truck transportation 17.62 Retail Trade 509.88
Total 2147.92
Source: Authors’ estimates based on Census and IMPLAN data
7 The estimate for “prefabricated metal buildings” was based upon the Hall et al. findings.
19
Almost $2.15 billion worth of direct sales are associated with the Washington Green
Industry. This includes almost $510 million worth of retail markup, $18.5 million worth of
transportation and $90 million worth of wholesale markup. This is the Marketing and
Transportation business associated with bringing Washington produced Green Industry product
to end consumers.
We assumed that all Nursery and Greenhouse product is eventually sold at retail. This
probably overestimates the retail margins for this industry in Washington. We have used a Type-
I input-output (IO) model to enumerate the total economic impact of Green Industry. The Type-I
multiplier measures the direct and indirect effects of the Green Industry. It captures the inter-
industry effects only; i.e., industries buying from local industries and does not include payroll-
household consumption impact (induced effect). As a result, the indirect effects of the Green
Industry are conservatively estimated in this study. Since household consumption of Green
Industry production is treated as exogenous it was not possible to estimate induced economic
impacts.
Impact Analysis:
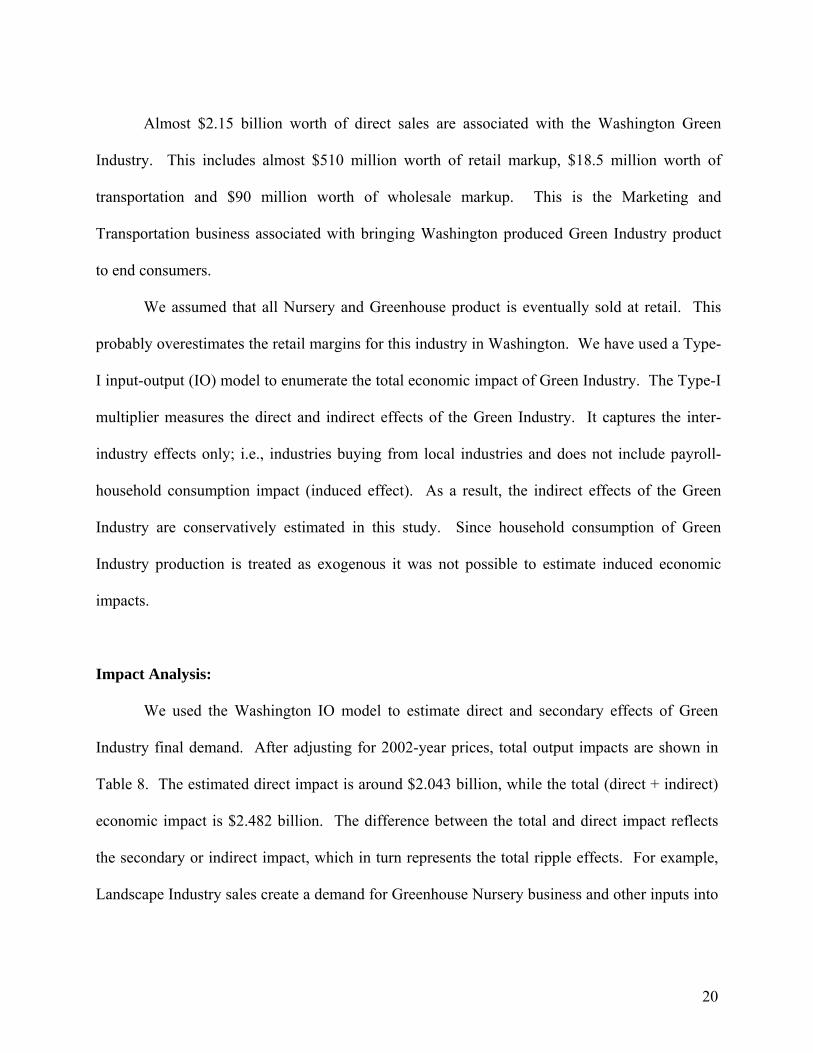
We used the Washington IO model to estimate direct and secondary effects of Green
Industry final demand. After adjusting for 2002-year prices, total output impacts are shown in
Table 8. The estimated direct impact is around $2.043 billion, while the total (direct + indirect)
economic impact is $2.482 billion. The difference between the total and direct impact reflects
the secondary or indirect impact, which in turn represents the total ripple effects. For example,
Landscape Industry sales create a demand for Greenhouse Nursery business and other inputs into
20

Landscaping (Table A1.2, appendix). This is reflected in the indirect impacts of the Green
Industry in Table 8.
Table 9 shows total employment driven by final demand of the Green Industry in the
state of Washington. An estimated 39,000 jobs in Washington are directly associated with the
Green Industry. The ripple effect generates an additional 4,000 jobs for a total of 43,000 jobs in
Washington. The Value-added impact is summarized in Table 10. Green Industry adds almost
$1.7 billion to the Washington economy, out of which $1.4 billion is direct impact. Value-added
impact comprises employee compensation, proprietor’s income, other property type income and
indirect business tax. Employee compensation and indirect business tax share the highest and
lowest proportion of value-added income among all four categories respectively (Table11).
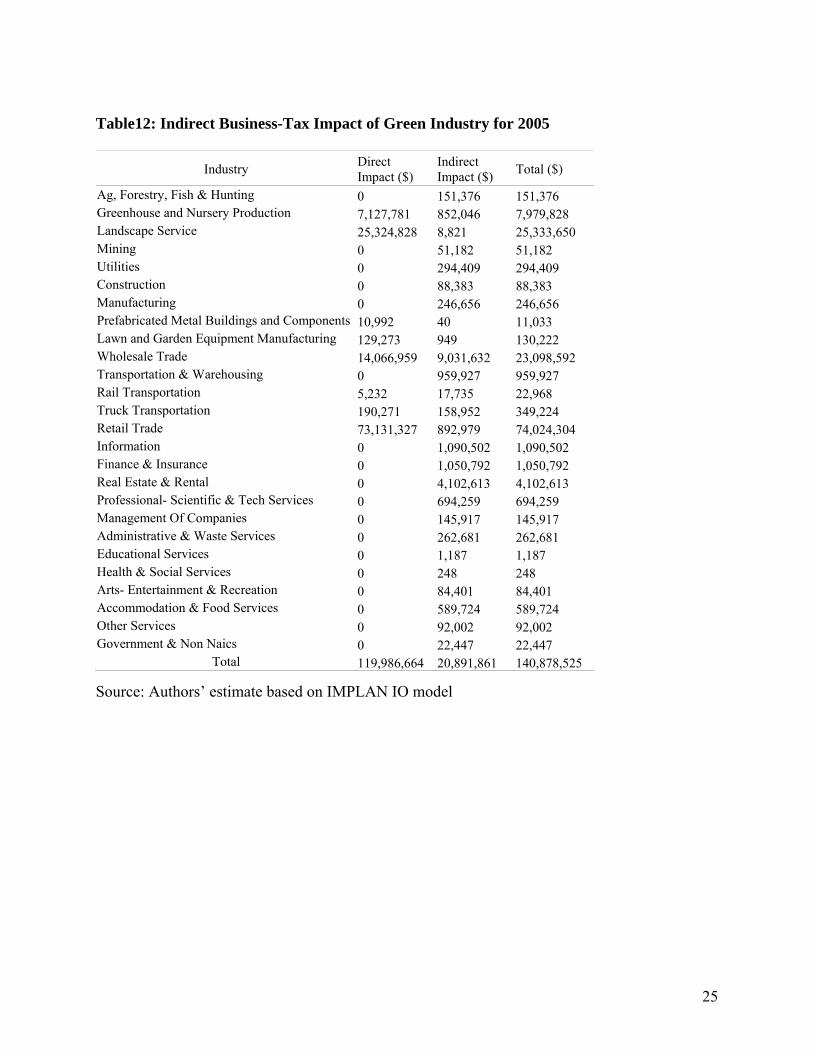
Retail trade generates the highest indirect business tax (almost $73 million) among all sectors in
Green Industry (Table 12).
The impact on taxes from changes in Green Industry economic activities is reported in
more detail in Table13. Based on the IMPLAN tax information (simple ratio estimates) and
output (sales), Table 13 shows the taxes generated directly and indirectly by the Green Industry.
The economic impact of Green Industry increases Federal tax revenues by $215 million. State
and local tax revenues are estimated at $152 million. The sales tax, which is also part of total
indirect business taxes, is the largest of all state-tax impact. The estimated value of the state
sales tax is almost $78 million per year. Other important state and local taxes are the property
tax and the B&O tax (Table 13).
21
Table 8: Output (Sales) Impact of the Green Industry, WA State, 2005
Industry Direct Impact ($)
Indirect Impact ($)
Total ($)
Ag, Forestry, Fishing 0 11,280,250 11,280,250 Greenhouse and Nursery Production 470,865,152 56,286,656 527,151,808 Landscape Service 984,666,048 342,976 985,009,024 Mining 0 653,202 653,202 Utilities 0 2,675,235 2,675,235 Construction 0 13,398,938 13,398,938 Manufacturing 0 42,027,080 42,027,080 Prefabricated Metal Buildings and Components 1,653,372 6,082 1,659,455 Lawn and Garden Equipment Manufacturing 17,203,506 126,258 17,329,764 Wholesale Trade 84,552,184 54,286,376 138,838,560 Transportation & Warehousing 0 26,940,640 26,940,640 Rail Transportation 248,568 842,543 1,091,111 Truck Transportation 16,860,518 14,085,228 30,945,746 Retail Trade 467,451,754 6,164,707 473,616,461 Information 0 21,247,466 21,247,466 Finance & Insurance 0 34,436,648 34,436,648 Real Estate & Rental 0 46,903,320 46,903,320 Professional- Scientific & Tech Services 0 43,941,752 43,941,752 Management Of Companies 0 13,033,777 13,033,777 Administrative & Waste Services 0 14,104,911 14,104,911 Educational Services 0 170,541 170,541 Health & Social Services 0 28,419 28,419 Arts- Entertainment & Recreation 0 1,414,353 1,414,353 Accommodation & Food Services 0 6,575,358 6,575,358 Other Services 0 7,022,106 7,022,106 Government & Non Naics 0 20,884,846 20,884,846 Total 2,043,501,103 438,879,667 2,482,380,770
Source: Authors’ estimate based on IMPLAN IO model (2002 prices)
22
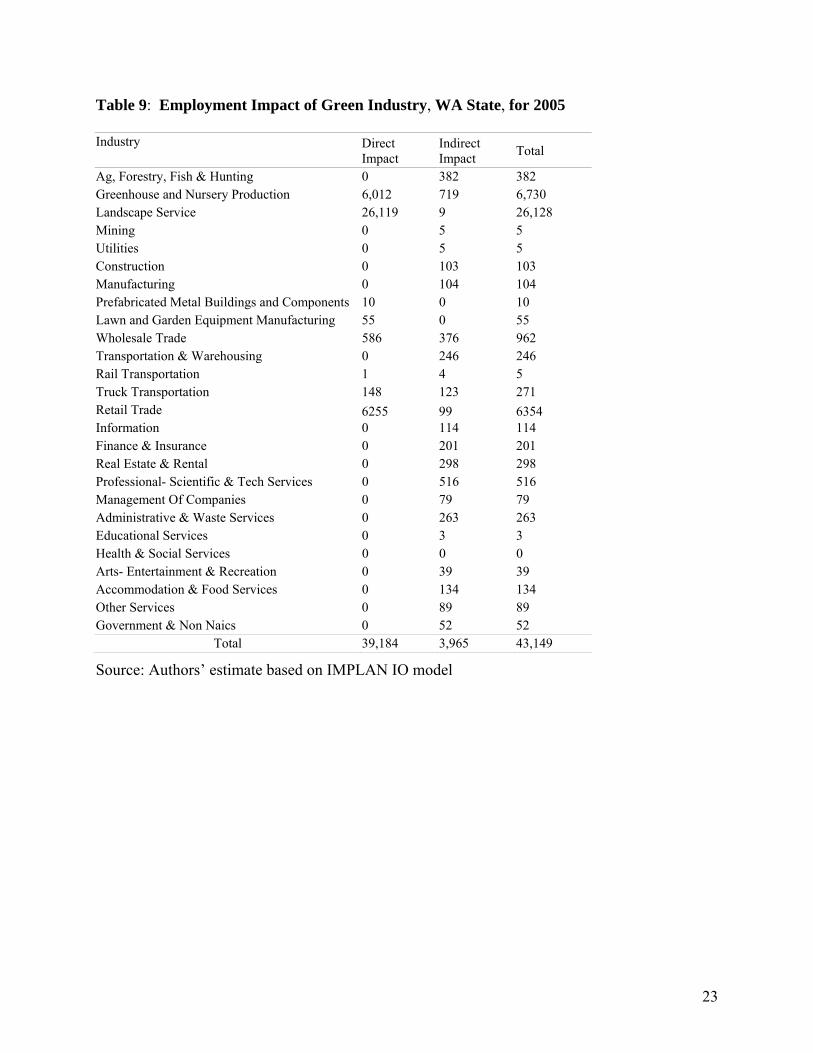
Table 9: Employment Impact of Green Industry, WA State, for 2005 Industry Direct
Impact Indirect Impact Total
Ag, Forestry, Fish & Hunting 0 382 382 Greenhouse and Nursery Production 6,012 719 6,730 Landscape Service 26,119 9 26,128 Mining 0 5 5 Utilities 0 5 5 Construction 0 103 103 Manufacturing 0 104 104 Prefabricated Metal Buildings and Components 10 0 10 Lawn and Garden Equipment Manufacturing 55 0 55 Wholesale Trade 586 376 962 Transportation & Warehousing 0 246 246 Rail Transportation 1 4 5 Truck Transportation 148 123 271 Retail Trade 6255 99 6354 Information 0 114 114 Finance & Insurance 0 201 201 Real Estate & Rental 0 298 298 Professional- Scientific & Tech Services 0 516 516 Management Of Companies 0 79 79 Administrative & Waste Services 0 263 263 Educational Services 0 3 3 Health & Social Services 0 0 0 Arts- Entertainment & Recreation 0 39 39 Accommodation & Food Services 0 134 134 Other Services 0 89 89 Government & Non Naics 0 52 52
Total 39,184 3,965 43,149
Source: Authors’ estimate based on IMPLAN IO model
23
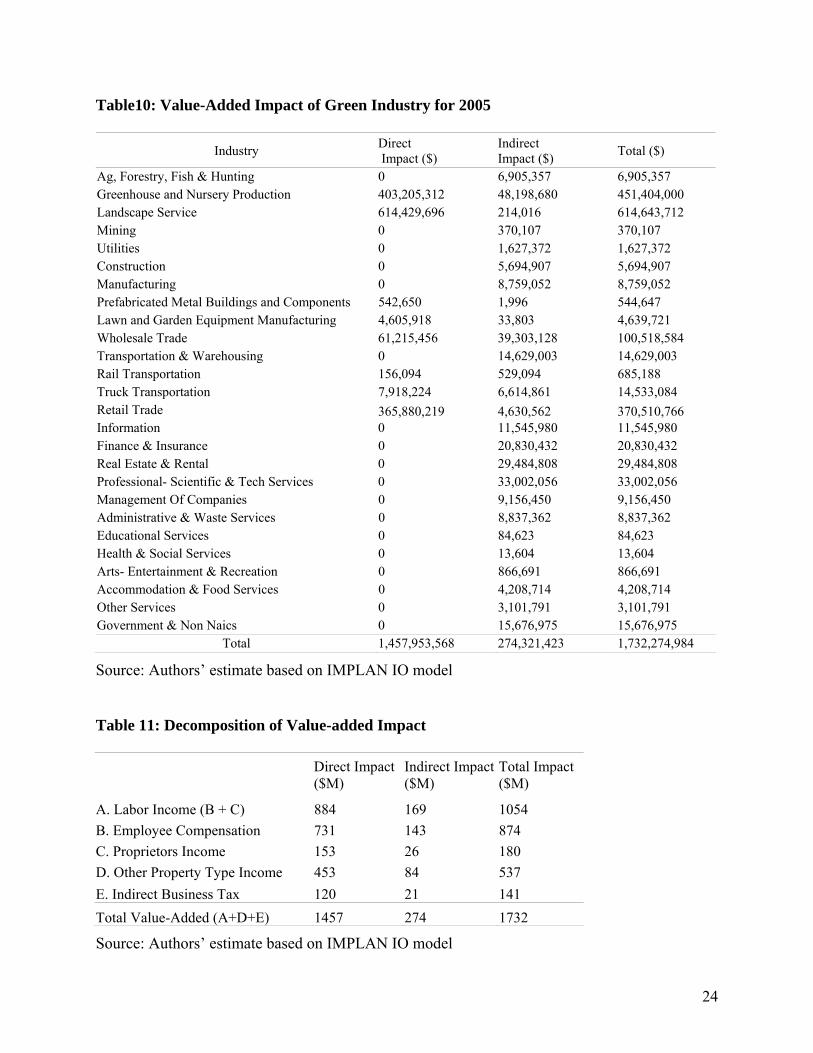
Table10: Value-Added Impact of Green Industry for 2005
Source: Authors’ estimate based on IMPLAN IO model
Industry Direct Impact ($)
Indirect Impact ($) Total ($)
Ag, Forestry, Fish & Hunting 0 6,905,357 6,905,357 Greenhouse and Nursery Production 403,205,312 48,198,680 451,404,000 Landscape Service 614,429,696 214,016 614,643,712 Mining 0 370,107 370,107 Utilities 0 1,627,372 1,627,372 Construction 0 5,694,907 5,694,907 Manufacturing 0 8,759,052 8,759,052 Prefabricated Metal Buildings and Components 542,650 1,996 544,647 Lawn and Garden Equipment Manufacturing 4,605,918 33,803 4,639,721 Wholesale Trade 61,215,456 39,303,128 100,518,584 Transportation & Warehousing 0 14,629,003 14,629,003 Rail Transportation 156,094 529,094 685,188 Truck Transportation 7,918,224 6,614,861 14,533,084 Retail Trade 365,880,219 4,630,562 370,510,766 Information 0 11,545,980 11,545,980 Finance & Insurance 0 20,830,432 20,830,432 Real Estate & Rental 0 29,484,808 29,484,808 Professional- Scientific & Tech Services 0 33,002,056 33,002,056 Management Of Companies 0 9,156,450 9,156,450 Administrative & Waste Services 0 8,837,362 8,837,362 Educational Services 0 84,623 84,623 Health & Social Services 0 13,604 13,604 Arts- Entertainment & Recreation 0 866,691 866,691 Accommodation & Food Services 0 4,208,714 4,208,714 Other Services 0 3,101,791 3,101,791 Government & Non Naics 0 15,676,975 15,676,975
Total 1,457,953,568 274,321,423 1,732,274,984
Table 11: Decomposition of Value-added Impact
Direct Impact ($M)
Indirect Impact ($M)
Total Impact ($M)
A. Labor Income (B + C) 884 169 1054 B. Employee Compensation 731 143 874 C. Proprietors Income 153 26 180 D. Other Property Type Income 453 84 537 E. Indirect Business Tax 120 21 141 Total Value-Added (A+D+E) 1457 274 1732
Source: Authors’ estimate based on IMPLAN IO model
24
25
Table12: Indirect Business-Tax Impact of Green Industry for 2005
Industry Direct Impact ($)
Indirect Impact ($) Total ($)
Ag, Forestry, Fish & Hunting 0 151,376 151,376 Greenhouse and Nursery Production 7,127,781 852,046 7,979,828 Landscape Service 25,324,828 8,821 25,333,650 Mining 0 51,182 51,182 Utilities 0 294,409 294,409 Construction 0 88,383 88,383 Manufacturing 0 246,656 246,656 Prefabricated Metal Buildings and Components 10,992 40 11,033 Lawn and Garden Equipment Manufacturing 129,273 949 130,222 Wholesale Trade 14,066,959 9,031,632 23,098,592 Transportation & Warehousing 0 959,927 959,927 Rail Transportation 5,232 17,735 22,968 Truck Transportation 190,271 158,952 349,224 Retail Trade 73,131,327 892,979 74,024,304 Information 0 1,090,502 1,090,502 Finance & Insurance 0 1,050,792 1,050,792 Real Estate & Rental 0 4,102,613 4,102,613 Professional- Scientific & Tech Services 0 694,259 694,259 Management Of Companies 0 145,917 145,917 Administrative & Waste Services 0 262,681 262,681 Educational Services 0 1,187 1,187 Health & Social Services 0 248 248 Arts- Entertainment & Recreation 0 84,401 84,401 Accommodation & Food Services 0 589,724 589,724 Other Services 0 92,002 92,002 Government & Non Naics 0 22,447 22,447
Total 119,986,664 20,891,861 140,878,525
Source: Authors’ estimate based on IMPLAN IO model
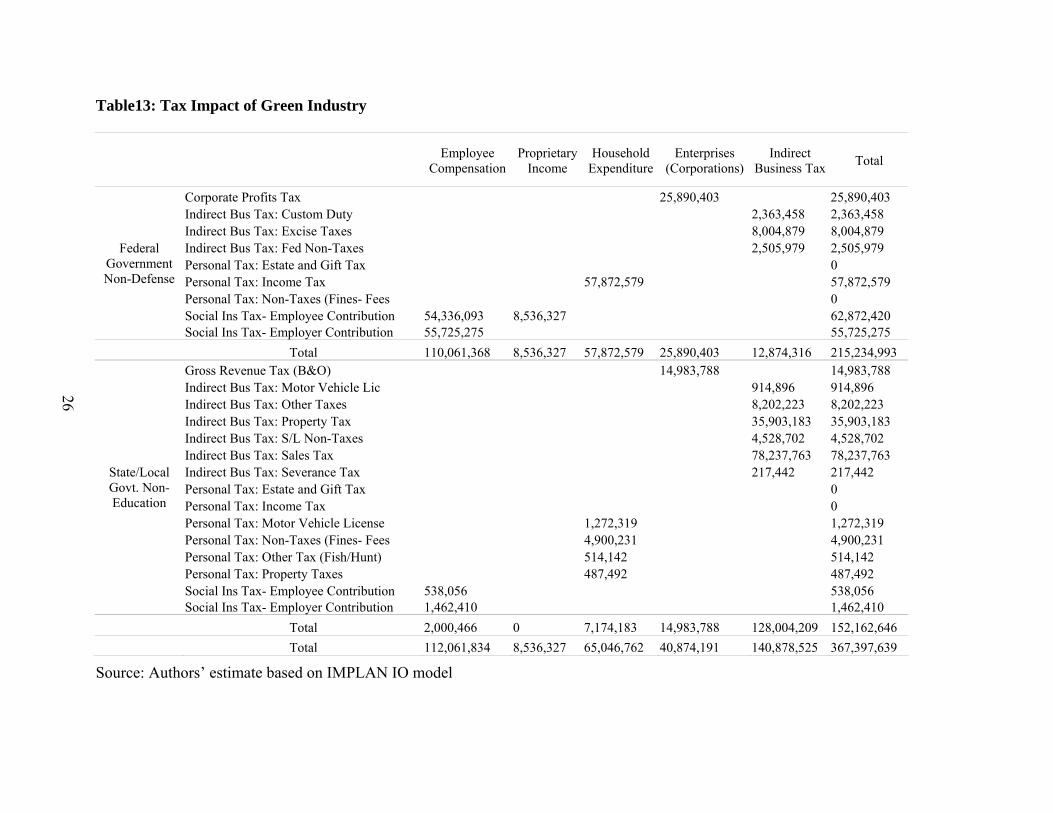
Table13: Tax Impact of Green Industry
Employee Compensation
Proprietary Income
Household Expenditure
Enterprises (Corporations)
Indirect Business Tax Total
Corporate Profits Tax 25,890,403 25,890,403 Indirect Bus Tax: Custom Duty 2,363,458 2,363,458 Indirect Bus Tax: Excise Taxes 8,004,879 8,004,879 Indirect Bus Tax: Fed Non-Taxes 2,505,979 2,505,979 Personal Tax: Estate and Gift Tax 0 Personal Tax: Income Tax 57,872,579 57,872,579 Personal Tax: Non-Taxes (Fines- Fees 0 Social Ins Tax- Employee Contribution 54,336,093 8,536,327 62,872,420
Federal Government Non-Defense
Social Ins Tax- Employer Contribution 55,725,275 55,725,275 Total 110,061,368 8,536,327 57,872,579 25,890,403 12,874,316 215,234,993
Gross Revenue Tax (B&O) 14,983,788 14,983,788 Indirect Bus Tax: Motor Vehicle Lic 914,896 914,896 Indirect Bus Tax: Other Taxes 8,202,223 8,202,223 Indirect Bus Tax: Property Tax 35,903,183 35,903,183 Indirect Bus Tax: S/L Non-Taxes 4,528,702 4,528,702 Indirect Bus Tax: Sales Tax 78,237,763 78,237,763 Indirect Bus Tax: Severance Tax 217,442 217,442 Personal Tax: Estate and Gift Tax 0 Personal Tax: Income Tax 0 Personal Tax: Motor Vehicle License 1,272,319 1,272,319 Personal Tax: Non-Taxes (Fines- Fees 4,900,231 4,900,231 Personal Tax: Other Tax (Fish/Hunt) 514,142 514,142 Personal Tax: Property Taxes 487,492 487,492 Social Ins Tax- Employee Contribution 538,056 538,056
State/Local Govt. Non-Education
Social Ins Tax- Employer Contribution 1,462,410 1,462,410 Total 2,000,466 0 7,174,183 14,983,788 128,004,209 152,162,646
Total 112,061,834 8,536,327 65,046,762 40,874,191 140,878,525 367,397,639
Source: Authors’ estimate based on IMPLAN IO model
26
6: SUMMARY
In order to understand the relative size and secondary effect of any industry in a given
state economy, economic impact analysis is a standard approach. Economic impacts may be
measured in sales, jobs or value added. From our IO analysis we have seen that in the year 2005
the Green Industry generated $ 2.48 billion of total output (sales), and $ 1.73 billion of value-
added income to the Washington State economy. Directly and indirectly, the industry creates
almost 43,000 jobs. Total state and local tax revenues generated by the Green Industry in
Washington are $158 million. The above figures of sales, value-added, tax and job creation in
combination with high rates of industry growth suggest the increasing economic importance of
the Green Industry in the Washington economy.
27

REFERENCES: Carkner, Richard and R. Moore. “An analysis of the Economic Dimension of the Washington Nursery and Plant Materials Industry.” Department of Agricultural and Resource Economics, Washington State University. 1998. Hall, Charles et al. “Economic Impacts of the Green Industry in the United States.” Final Report to the National Urban and Community Forestry Advisory Committee. College of Agriculture, University of Tennessee. 2005. IMPLAN Professional User’s Guide, Analysis Guide, Data Guide. 3rd edition. IMPLAN Group Inc., Stillwater, MN, 2004. U.S. Census Bureau. 2002 County Business Patterns, EPCD, County & State Database on NAICS Basis. United States Department of Commerce, Washington, D.C. Available at http://www.census.gov/epcd/cbp/view/cbpview.html. U.S. Census Bureau. Annual Benchmark Report for Retail Trade and Food Services: January 1992 through February 2004. Current Business Reports BR/03-A. U.S. Department of Commerce, Washington, D.C., March 2004. Available at http://www.census.gov/prod/ec02/ec0254i03.pdf. U.S. Census Bureau. Annual Benchmark Report for Wholesale Trade: January 1992 through December 2003. Current Business Reports BW/03-A. U.S. Department of Commerce, Washington, D.C., March 2004. Available at http://www.census.gov/prod/2004pubs/br03-a.pdf. U.S. Census Bureau. Architectural, Engineering and Related Services, 2002, Economic Census. Professional, Scientific and Technical Services, Industry Series, EC02-541-03. U. S. Department of Commerce, Washington, D.C., October 2004. Available at http://www.census.gov/prod/ec02/ec0254i03.pdf. U.S. Census Bureau. Building Material and Supplies Dealers, 2002 Economic Census, Retail Trade Industry Series, EC02-441-18. U. S. Department of Commerce, Washington, D.C., November 2004. Available at http://www.census.gov/prod/ec02/ec0244i18.pdf. U.S. Census Bureau. Farm, Floral and Nursery Supplies, 2002 Economic Census, Wholesale Trade Industry Series, EC02-421-15. U. S. Department of Commerce, Washington, D.C., November 2004. Available at http://www.census.gov/prod/ec02/ec0242i15.pdf. U.S. Census Bureau. Florists, 2002 Economic Census, Retail Trade Industry Series, EC02-441-16. U. S. Department of Commerce, Washington, D.C., August 2004. Available at http://www.census.gov/prod/ec02/ec0244i16.pdf. U.S. Census Bureau. Food and Beverage Stores, 2002 Economic Census, Retail Trade Industry Series, EC02- 441-07. U. S. Department of Commerce, Washington, D.C., September 2004. Available at http://www.census.gov/prod/ec02/ec0244i07.pdf.
28
U.S. Census Bureau. General Merchandise Stores, 2002 Economic Census, Retail Trade Industry Series, EC02-441-11. U. S. Department of Commerce, Washington, D.C., October 2004. Available at http://www.census.gov/prod/ec02/ec0244i11.pdf. U.S. Census Bureau. Lawn and Garden Equipment & Supplies Stores, 2002 Economic Census, Retail Trade Industry Series, EC02-441-08. U. S. Department of Commerce, Washington, D.C., September 2004. Available at http://www.census.gov/prod/ec02/ec0244i08.pdf. U.S. Census Bureau. Lawn and Garden Tractor and Home Lawn and Garden Equipment Manufacturing, 2002 Economic Census, Manufacturing Industry Series, EC02-311-333112 (RV). U. S. Department of Commerce, Washington, D.C., December 2004. U.S. Census Bureau. Machinery, Equipment and Supplies, 2002 Economic Census, Wholesale Trade Industry Series, EC02-421-09. U. S. Department of Commerce, Washington, D.C., September 2004. Available at http://www.census.gov/prod/ec02/ec0242i09.pdf. U.S. Census Bureau. Prefabricated Metal Building and Component Manufacturing, 2002 Economic Census, Manufacturing Industry Series, EC02-311-332311 (RV). U. S. Department of Commerce, Washington, D.C., January 2005. U.S. Census Bureau. Services to Buildings and Dwellings, 2002 Economic Census, Administrative and Support and Waste Management and Remedial Services Industry Series, EC02-561-07. U. S. Department of Commerce, Washington, D.C., June 2004. Available at http://www.census.gov/prod/ec02/ec0256i07.pdf. U.S. Census Bureau. Washington: 2002, 2002 Economic Census, Administrative and Support and Waste Management and Remediation Services, Geographic Area Series, EC02-56A-WA. U. S. Department of Commerce, Washington, D.C., March 2005. Available at http://www.census.gov/prod/ec02/ec0256awa.pdf. U.S. Census Bureau. Washington: 2002, 2002 Economic Census, Professional, Scientific, and Technical Services, Geographic Area Series, EC02-54A-WA. U. S. Department of Commerce, Washington, D.C., March 2005. Available at http://www.census.gov/prod/ec02/ec0254awa.pdf. U.S.D.A., National Agricultural Statistics Service. 2002 Census of Agriculture. United States Summary and State Data, Vol. 1, Geographic Area Series, Part 51, AC-02-A-51. United States Department of Agriculture, Washington, D.C., June 2004. U.S.D.A., National Agricultural Statistics Service. Floriculture Crops 2003 Summary, April 2004. Available at http://www.nass.usda.gov. U.S.D.A., National Agricultural Statistics Service. Nursery Crops 2003 Summary, July 2004. Available at http://www.nass.usda.gov.
29

U.S. Department of Commerce. “Gross Domestic Product Implicit Price Deflators” (quarterly). Bureau of Economic Analysis, Washington, D.C. Dec. 22, 2004. Available at http://research.stlouisfed.org/fred/data/gdp/gdpdef. U.S. Landscape Tree Planting Survey, American Nursery & Landscape Association and the USDA Forest Service, conducted by the National Gardening Association. Available at http://www.anla.org/pdffiles/survey.pdf, retrieved January 2004.
30
APPENDIX 1: PRODUCTION FUNCTIONS FOR LANDSCAPING AND NURSERY INDUSTRIES
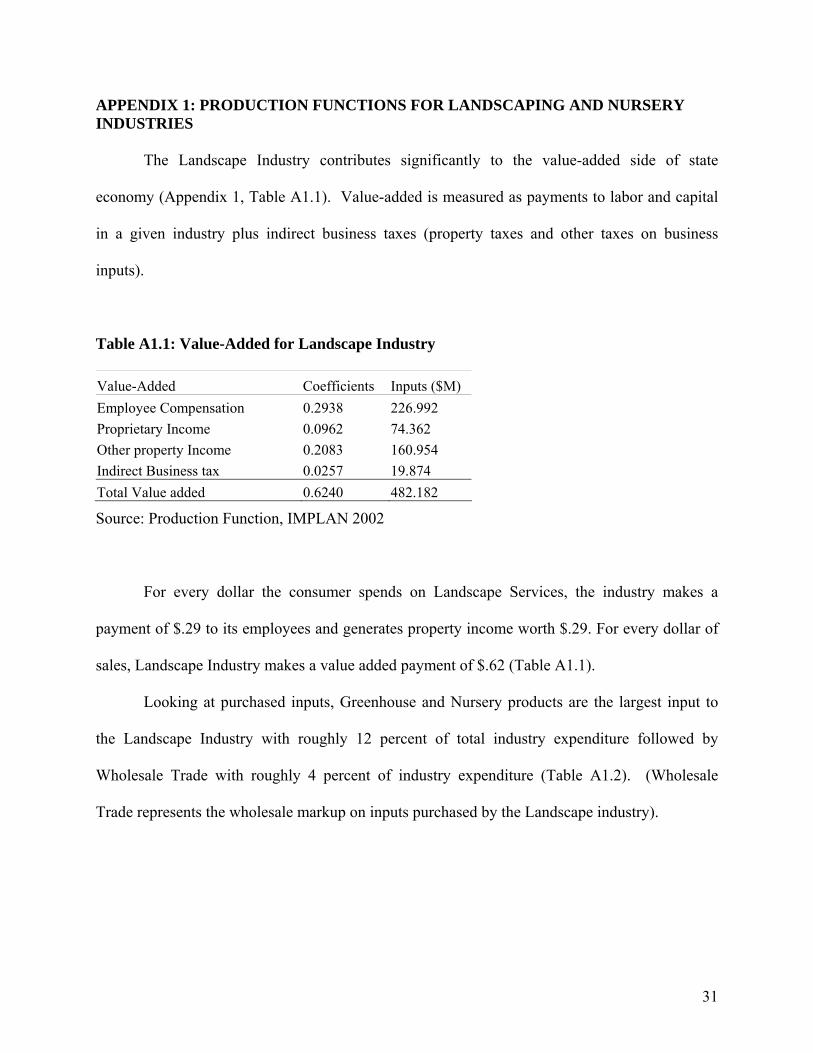
The Landscape Industry contributes significantly to the value-added side of state
economy (Appendix 1, Table A1.1). Value-added is measured as payments to labor and capital
in a given industry plus indirect business taxes (property taxes and other taxes on business
inputs).
Table A1.1: Value-Added for Landscape Industry Value-Added Coefficients Inputs ($M) Employee Compensation 0.2938 226.992 Proprietary Income 0.0962 74.362 Other property Income 0.2083 160.954 Indirect Business tax 0.0257 19.874 Total Value added 0.6240 482.182
Source: Production Function, IMPLAN 2002
For every dollar the consumer spends on Landscape Services, the industry makes a
payment of $.29 to its employees and generates property income worth $.29. For every dollar of
sales, Landscape Industry makes a value added payment of $.62 (Table A1.1).
Looking at purchased inputs, Greenhouse and Nursery products are the largest input to
the Landscape Industry with roughly 12 percent of total industry expenditure followed by
Wholesale Trade with roughly 4 percent of industry expenditure (Table A1.2). (Wholesale
Trade represents the wholesale markup on inputs purchased by the Landscape industry).
31
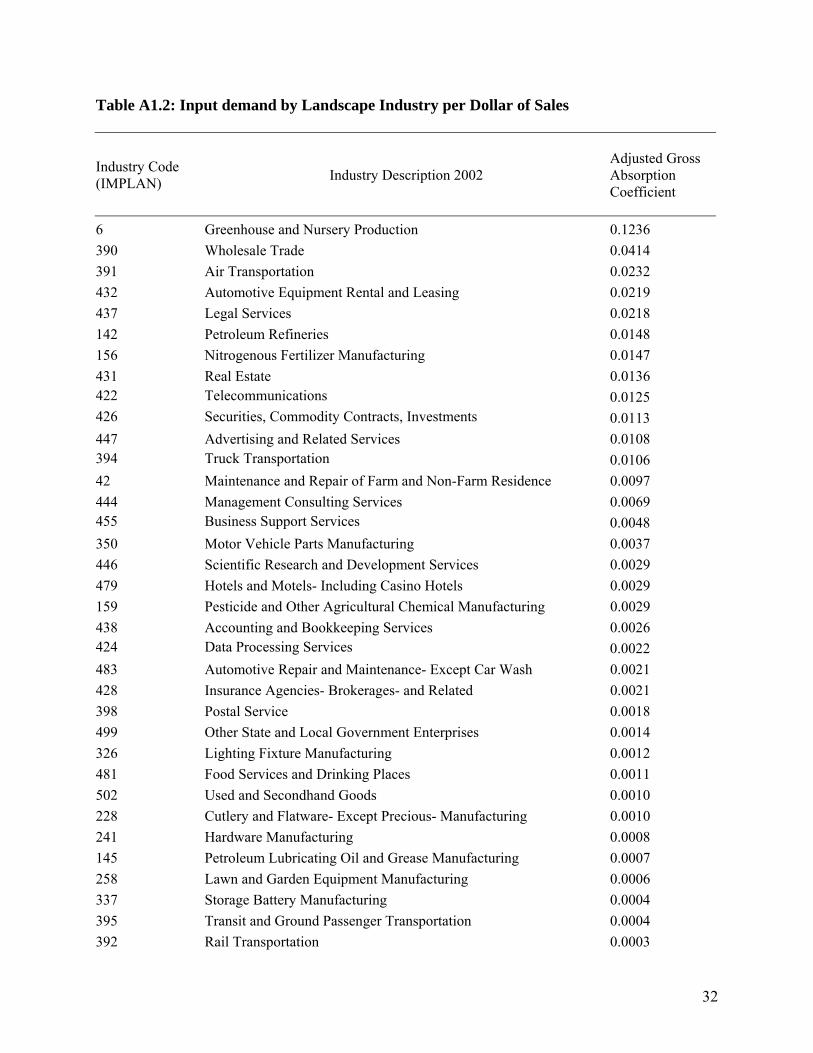
Table A1.2: Input demand by Landscape Industry per Dollar of Sales
Industry Code (IMPLAN) Industry Description 2002
Adjusted Gross Absorption Coefficient
6 Greenhouse and Nursery Production 0.1236 390 Wholesale Trade 0.0414 391 Air Transportation 0.0232 432 Automotive Equipment Rental and Leasing 0.0219 437 Legal Services 0.0218 142 Petroleum Refineries 0.0148 156 Nitrogenous Fertilizer Manufacturing 0.0147 431 Real Estate 0.0136 422 Telecommunications 0.0125 426 Securities, Commodity Contracts, Investments 0.0113 447 Advertising and Related Services 0.0108 394 Truck Transportation 0.0106 42 Maintenance and Repair of Farm and Non-Farm Residence 0.0097 444 Management Consulting Services 0.0069 455 Business Support Services 0.0048 350 Motor Vehicle Parts Manufacturing 0.0037 446 Scientific Research and Development Services 0.0029 479 Hotels and Motels- Including Casino Hotels 0.0029 159 Pesticide and Other Agricultural Chemical Manufacturing 0.0029 438 Accounting and Bookkeeping Services 0.0026 424 Data Processing Services 0.0022 483 Automotive Repair and Maintenance- Except Car Wash 0.0021 428 Insurance Agencies- Brokerages- and Related 0.0021 398 Postal Service 0.0018 499 Other State and Local Government Enterprises 0.0014 326 Lighting Fixture Manufacturing 0.0012 481 Food Services and Drinking Places 0.0011 502 Used and Secondhand Goods 0.0010 228 Cutlery and Flatware- Except Precious- Manufacturing 0.0010 241 Hardware Manufacturing 0.0008 145 Petroleum Lubricating Oil and Grease Manufacturing 0.0007 258 Lawn and Garden Equipment Manufacturing 0.0006 337 Storage Battery Manufacturing 0.0004 395 Transit and Ground Passenger Transportation 0.0004 392 Rail Transportation 0.0003
32
414 Periodical Publishers 0.0003 393 Water Transportation 0.0003 418 Motion Picture and Video Industries 0.0003 385 Gasket- Packing- and Sealing Device Manufacturing 0.0002 126 Paperboard Container Manufacturing 0.0002 277 Heating Equipment- Except Warm Air Furnaces 0.0001 134 Sanitary Paper Product Manufacturing 0.0001 411 Miscellaneous Store Retailers 0.0001 272 Photographic and Photocopying Equipment Manufacturing 0.0001 101 Textile Bag and Canvas Mills 0.0001 136 Manifold Business Forms Printing 0.0001 125 Paper and Paperboard Mills 0.0001 325 Electric Lamp Bulb and Part Manufacturing 0.0000 404 Building Material and Garden Supply Stores 0.0000 402 Furniture and Home Furnishings Stores 0.0000 405 Food and Beverage Stores 0.0000 408 Clothing and Clothing Accessories Stores 0.0000
Source: IMPLAN 20028
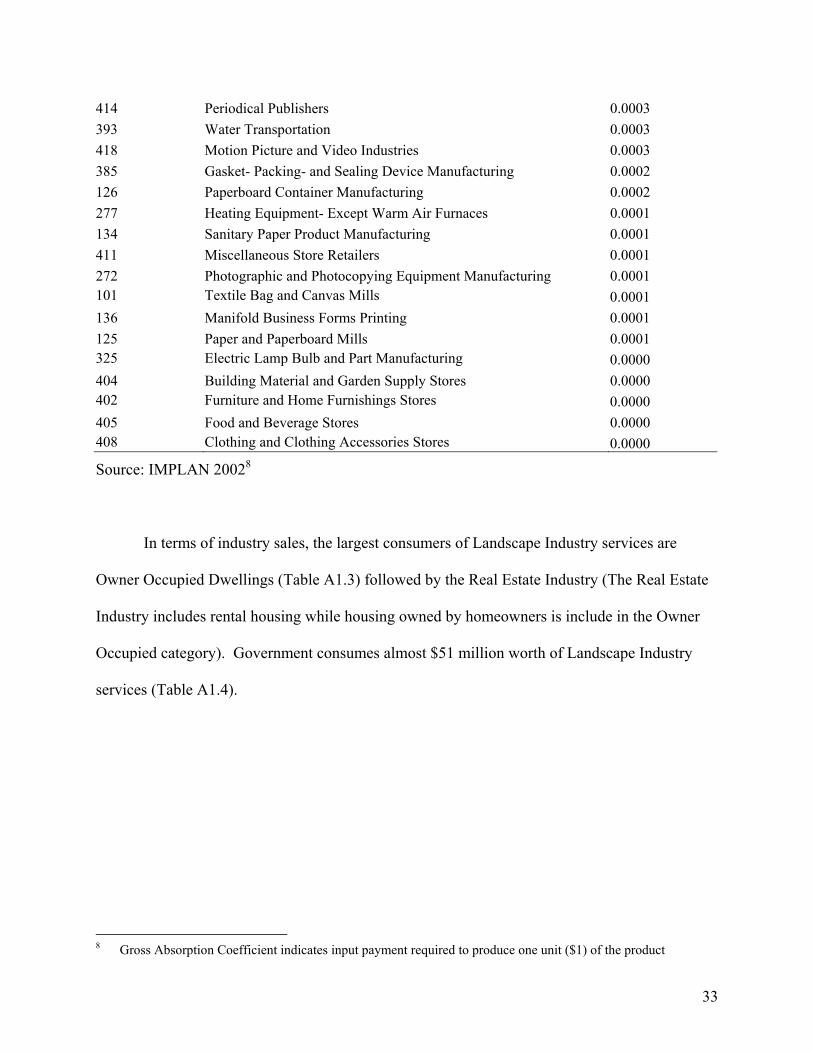
In terms of industry sales, the largest consumers of Landscape Industry services are
Owner Occupied Dwellings (Table A1.3) followed by the Real Estate Industry (The Real Estate
Industry includes rental housing while housing owned by homeowners is include in the Owner
Occupied category). Government consumes almost $51 million worth of Landscape Industry
services (Table A1.4).
8 Gross Absorption Coefficient indicates input payment required to produce one unit ($1) of the product
33
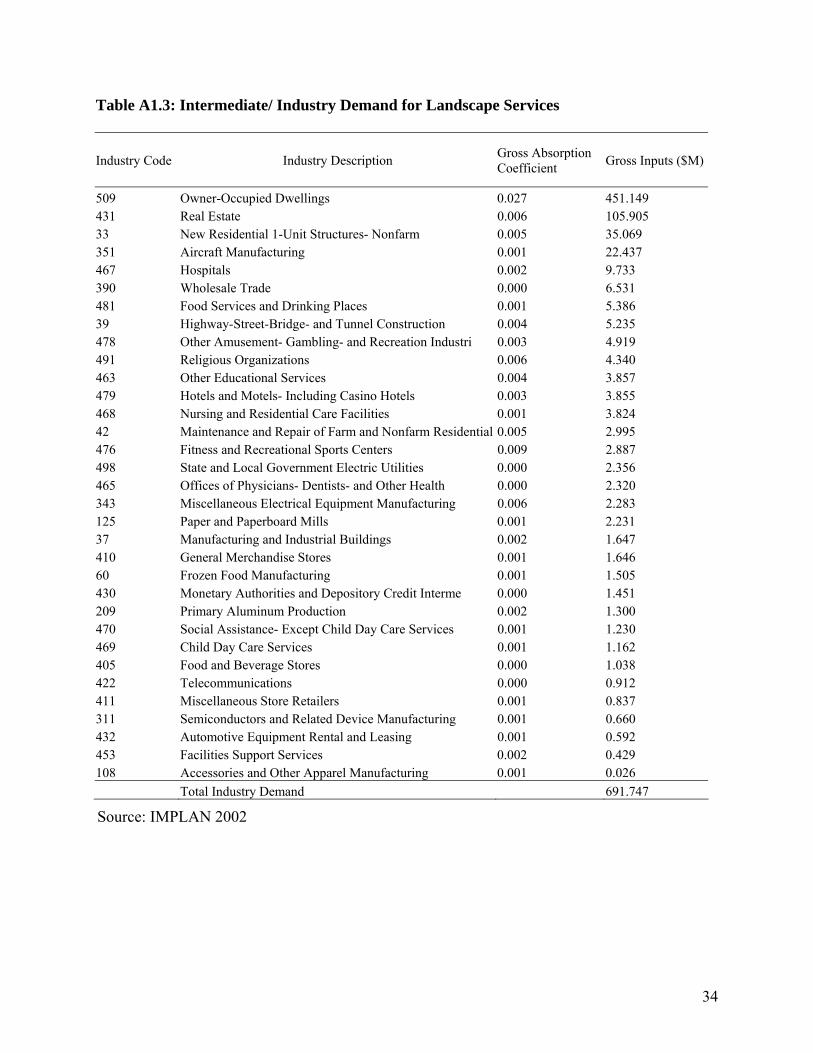
Table A1.3: Intermediate/ Industry Demand for Landscape Services
Industry Code Industry Description Gross Absorption Coefficient Gross Inputs ($M)
509 Owner-Occupied Dwellings 0.027 451.149 431 Real Estate 0.006 105.905 33 New Residential 1-Unit Structures- Nonfarm 0.005 35.069 351 Aircraft Manufacturing 0.001 22.437 467 Hospitals 0.002 9.733 390 Wholesale Trade 0.000 6.531 481 Food Services and Drinking Places 0.001 5.386 39 Highway-Street-Bridge- and Tunnel Construction 0.004 5.235 478 Other Amusement- Gambling- and Recreation Industri 0.003 4.919 491 Religious Organizations 0.006 4.340 463 Other Educational Services 0.004 3.857 479 Hotels and Motels- Including Casino Hotels 0.003 3.855 468 Nursing and Residential Care Facilities 0.001 3.824 42 Maintenance and Repair of Farm and Nonfarm Residential 0.005 2.995 476 Fitness and Recreational Sports Centers 0.009 2.887 498 State and Local Government Electric Utilities 0.000 2.356 465 Offices of Physicians- Dentists- and Other Health 0.000 2.320 343 Miscellaneous Electrical Equipment Manufacturing 0.006 2.283 125 Paper and Paperboard Mills 0.001 2.231 37 Manufacturing and Industrial Buildings 0.002 1.647 410 General Merchandise Stores 0.001 1.646 60 Frozen Food Manufacturing 0.001 1.505 430 Monetary Authorities and Depository Credit Interme 0.000 1.451 209 Primary Aluminum Production 0.002 1.300 470 Social Assistance- Except Child Day Care Services 0.001 1.230 469 Child Day Care Services 0.001 1.162 405 Food and Beverage Stores 0.000 1.038 422 Telecommunications 0.000 0.912 411 Miscellaneous Store Retailers 0.001 0.837 311 Semiconductors and Related Device Manufacturing 0.001 0.660 432 Automotive Equipment Rental and Leasing 0.001 0.592 453 Facilities Support Services 0.002 0.429 108 Accessories and Other Apparel Manufacturing 0.001 0.026 Total Industry Demand 691.747
Source: IMPLAN 2002
34
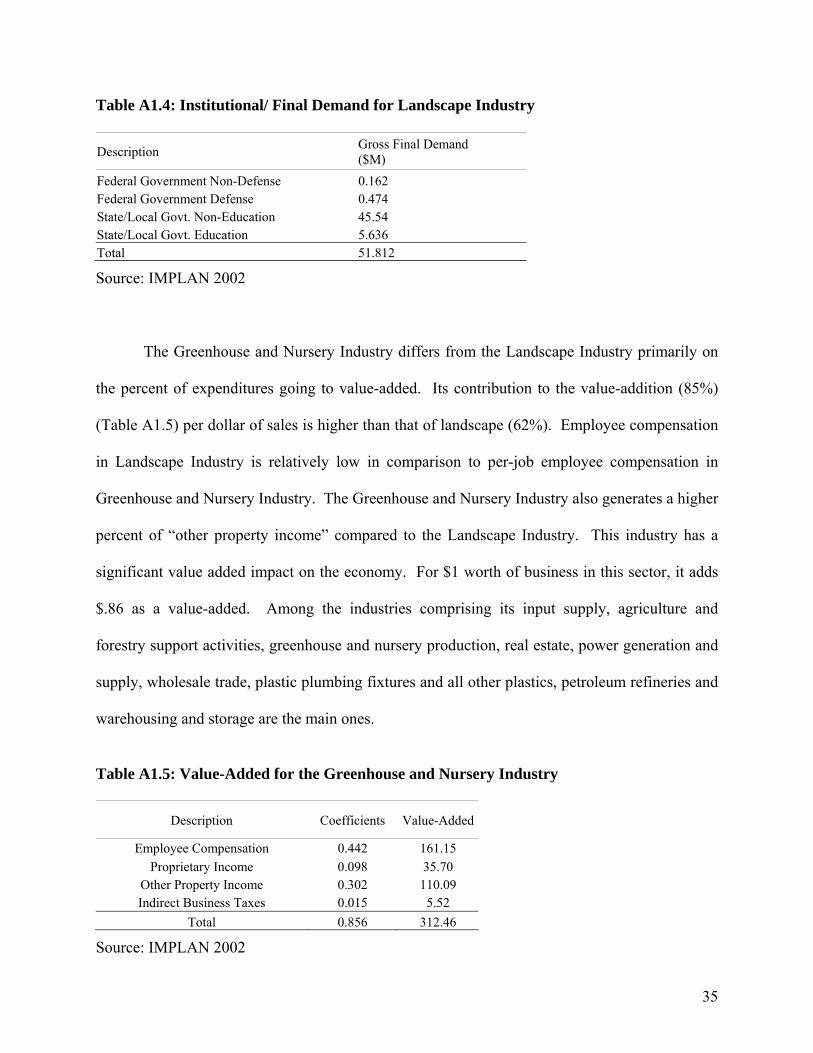
Table A1.4: Institutional/ Final Demand for Landscape Industry
Description Gross Final Demand ($M)
Federal Government Non-Defense 0.162 Federal Government Defense 0.474 State/Local Govt. Non-Education 45.54 State/Local Govt. Education 5.636 Total 51.812
Source: IMPLAN 2002
The Greenhouse and Nursery Industry differs from the Landscape Industry primarily on
the percent of expenditures going to value-added. Its contribution to the value-addition (85%)
(Table A1.5) per dollar of sales is higher than that of landscape (62%). Employee compensation
in Landscape Industry is relatively low in comparison to per-job employee compensation in
Greenhouse and Nursery Industry. The Greenhouse and Nursery Industry also generates a higher
percent of “other property income” compared to the Landscape Industry. This industry has a
significant value added impact on the economy. For $1 worth of business in this sector, it adds
$.86 as a value-added. Among the industries comprising its input supply, agriculture and
forestry support activities, greenhouse and nursery production, real estate, power generation and
supply, wholesale trade, plastic plumbing fixtures and all other plastics, petroleum refineries and
warehousing and storage are the main ones.
Table A1.5: Value-Added for the Greenhouse and Nursery Industry
Description Coefficients Value-Added
Employee Compensation 0.442 161.15 Proprietary Income 0.098 35.70
Other Property Income 0.302 110.09 Indirect Business Taxes 0.015 5.52
Total 0.856 312.46
Source: IMPLAN 2002
35
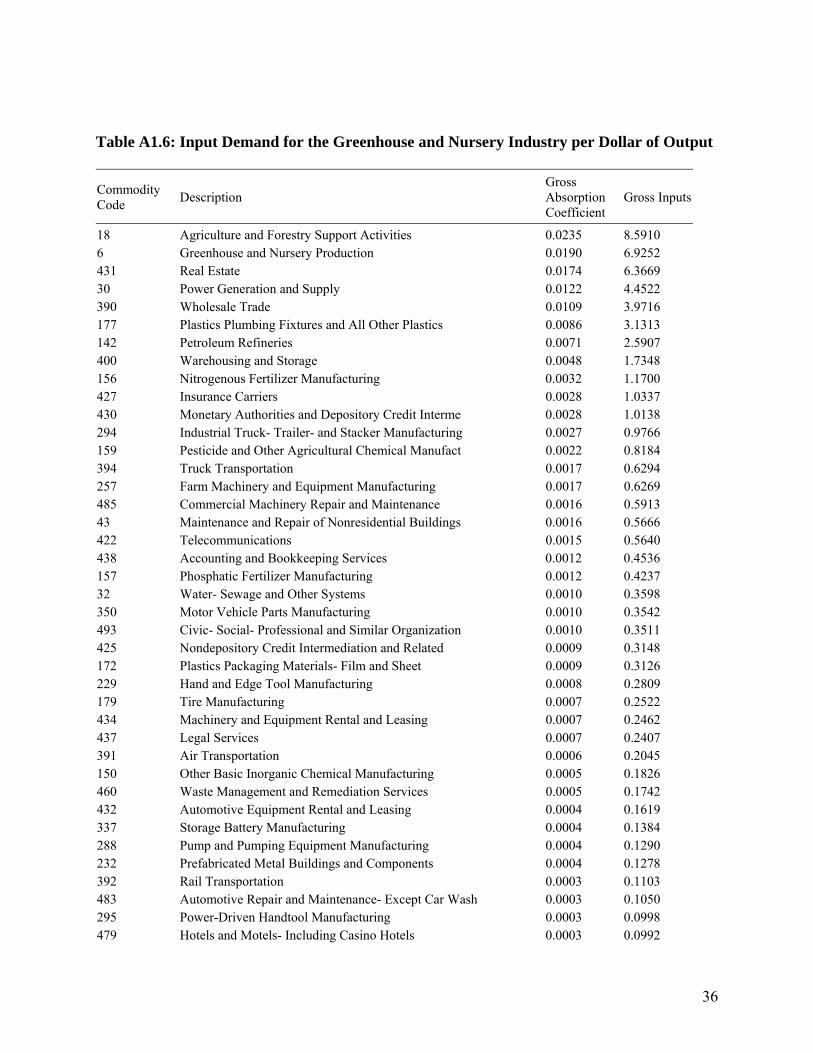
Table A1.6: Input Demand for the Greenhouse and Nursery Industry per Dollar of Output
Commodity Code Description
Gross Absorption Coefficient
Gross Inputs
18 Agriculture and Forestry Support Activities 0.0235 8.5910 6 Greenhouse and Nursery Production 0.0190 6.9252 431 Real Estate 0.0174 6.3669 30 Power Generation and Supply 0.0122 4.4522 390 Wholesale Trade 0.0109 3.9716 177 Plastics Plumbing Fixtures and All Other Plastics 0.0086 3.1313 142 Petroleum Refineries 0.0071 2.5907 400 Warehousing and Storage 0.0048 1.7348 156 Nitrogenous Fertilizer Manufacturing 0.0032 1.1700 427 Insurance Carriers 0.0028 1.0337 430 Monetary Authorities and Depository Credit Interme 0.0028 1.0138 294 Industrial Truck- Trailer- and Stacker Manufacturing 0.0027 0.9766 159 Pesticide and Other Agricultural Chemical Manufact 0.0022 0.8184 394 Truck Transportation 0.0017 0.6294 257 Farm Machinery and Equipment Manufacturing 0.0017 0.6269 485 Commercial Machinery Repair and Maintenance 0.0016 0.5913 43 Maintenance and Repair of Nonresidential Buildings 0.0016 0.5666 422 Telecommunications 0.0015 0.5640 438 Accounting and Bookkeeping Services 0.0012 0.4536 157 Phosphatic Fertilizer Manufacturing 0.0012 0.4237 32 Water- Sewage and Other Systems 0.0010 0.3598 350 Motor Vehicle Parts Manufacturing 0.0010 0.3542 493 Civic- Social- Professional and Similar Organization 0.0010 0.3511 425 Nondepository Credit Intermediation and Related 0.0009 0.3148 172 Plastics Packaging Materials- Film and Sheet 0.0009 0.3126 229 Hand and Edge Tool Manufacturing 0.0008 0.2809 179 Tire Manufacturing 0.0007 0.2522 434 Machinery and Equipment Rental and Leasing 0.0007 0.2462 437 Legal Services 0.0007 0.2407 391 Air Transportation 0.0006 0.2045 150 Other Basic Inorganic Chemical Manufacturing 0.0005 0.1826 460 Waste Management and Remediation Services 0.0005 0.1742 432 Automotive Equipment Rental and Leasing 0.0004 0.1619 337 Storage Battery Manufacturing 0.0004 0.1384 288 Pump and Pumping Equipment Manufacturing 0.0004 0.1290 232 Prefabricated Metal Buildings and Components 0.0004 0.1278 392 Rail Transportation 0.0003 0.1103 483 Automotive Repair and Maintenance- Except Car Wash 0.0003 0.1050 295 Power-Driven Handtool Manufacturing 0.0003 0.0998 479 Hotels and Motels- Including Casino Hotels 0.0003 0.0992
36
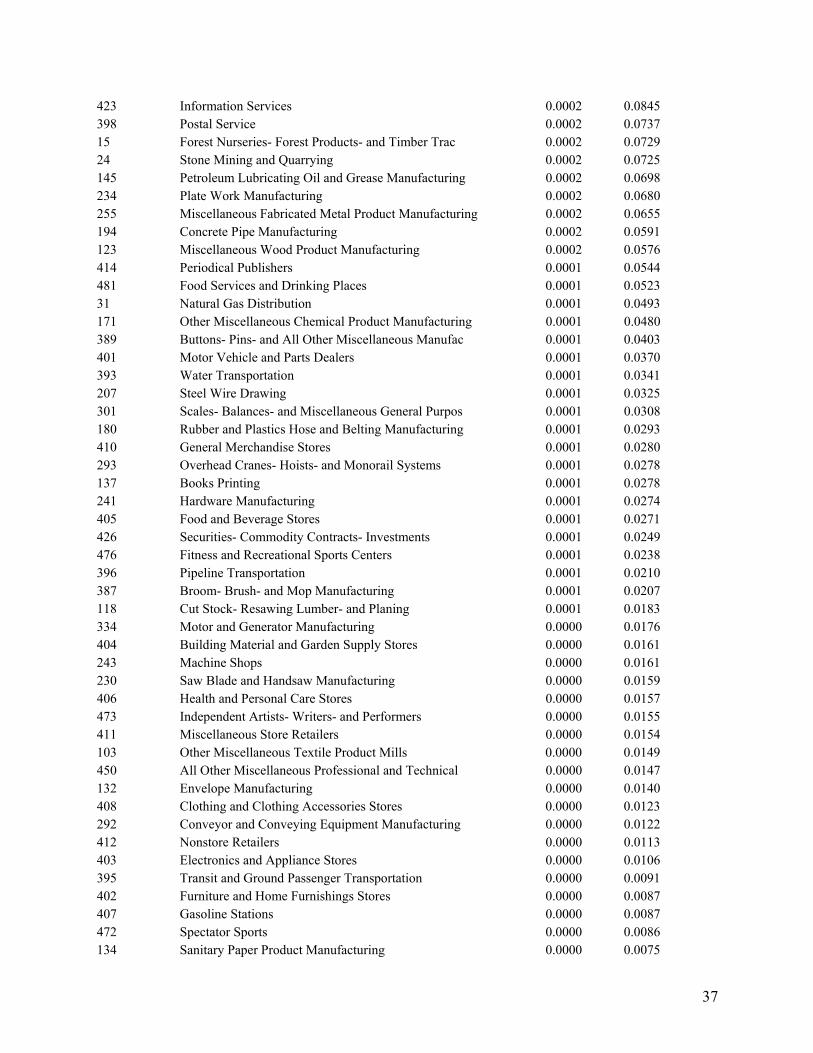
423 Information Services 0.0002 0.0845 398 Postal Service 0.0002 0.0737 15 Forest Nurseries- Forest Products- and Timber Trac 0.0002 0.0729 24 Stone Mining and Quarrying 0.0002 0.0725 145 Petroleum Lubricating Oil and Grease Manufacturing 0.0002 0.0698 234 Plate Work Manufacturing 0.0002 0.0680 255 Miscellaneous Fabricated Metal Product Manufacturing 0.0002 0.0655 194 Concrete Pipe Manufacturing 0.0002 0.0591 123 Miscellaneous Wood Product Manufacturing 0.0002 0.0576 414 Periodical Publishers 0.0001 0.0544 481 Food Services and Drinking Places 0.0001 0.0523 31 Natural Gas Distribution 0.0001 0.0493 171 Other Miscellaneous Chemical Product Manufacturing 0.0001 0.0480 389 Buttons- Pins- and All Other Miscellaneous Manufac 0.0001 0.0403 401 Motor Vehicle and Parts Dealers 0.0001 0.0370 393 Water Transportation 0.0001 0.0341 207 Steel Wire Drawing 0.0001 0.0325 301 Scales- Balances- and Miscellaneous General Purpos 0.0001 0.0308 180 Rubber and Plastics Hose and Belting Manufacturing 0.0001 0.0293 410 General Merchandise Stores 0.0001 0.0280 293 Overhead Cranes- Hoists- and Monorail Systems 0.0001 0.0278 137 Books Printing 0.0001 0.0278 241 Hardware Manufacturing 0.0001 0.0274 405 Food and Beverage Stores 0.0001 0.0271 426 Securities- Commodity Contracts- Investments 0.0001 0.0249 476 Fitness and Recreational Sports Centers 0.0001 0.0238 396 Pipeline Transportation 0.0001 0.0210 387 Broom- Brush- and Mop Manufacturing 0.0001 0.0207 118 Cut Stock- Resawing Lumber- and Planing 0.0001 0.0183 334 Motor and Generator Manufacturing 0.0000 0.0176 404 Building Material and Garden Supply Stores 0.0000 0.0161 243 Machine Shops 0.0000 0.0161 230 Saw Blade and Handsaw Manufacturing 0.0000 0.0159 406 Health and Personal Care Stores 0.0000 0.0157 473 Independent Artists- Writers- and Performers 0.0000 0.0155 411 Miscellaneous Store Retailers 0.0000 0.0154 103 Other Miscellaneous Textile Product Mills 0.0000 0.0149 450 All Other Miscellaneous Professional and Technical 0.0000 0.0147 132 Envelope Manufacturing 0.0000 0.0140 408 Clothing and Clothing Accessories Stores 0.0000 0.0123 292 Conveyor and Conveying Equipment Manufacturing 0.0000 0.0122 412 Nonstore Retailers 0.0000 0.0113 403 Electronics and Appliance Stores 0.0000 0.0106 395 Transit and Ground Passenger Transportation 0.0000 0.0091 402 Furniture and Home Furnishings Stores 0.0000 0.0087 407 Gasoline Stations 0.0000 0.0087 472 Spectator Sports 0.0000 0.0086 134 Sanitary Paper Product Manufacturing 0.0000 0.0075
37
325 Electric Lamp Bulb and Part Manufacturing 0.0000 0.0058 474 Promoters of Performing Arts and Sports and Agents 0.0000 0.0045 409 Sporting Goods- Hobby- Book and Music Stores 0.0000 0.0044 471 Performing Arts Companies 0.0000 0.0036 478 Other Amusement- Gambling- and Recreation Industri 0.0000 0.0035 383 Office Supplies- Except Paper- Manufacturing 0.0000 0.0024 136 Manifold Business Forms Printing 0.0000 0.0022 161 Paint and Coating Manufacturing 0.0000 0.0022 237 Ornamental and Architectural Metal Work Manufactur 0.0000 0.0015 381 Sporting and Athletic Goods Manufacturing 0.0000 0.0012 138 Blankbook and Looseleaf Binder Manufacturing 0.0000 0.0003 0.1437
Source: IMPLAN 2002
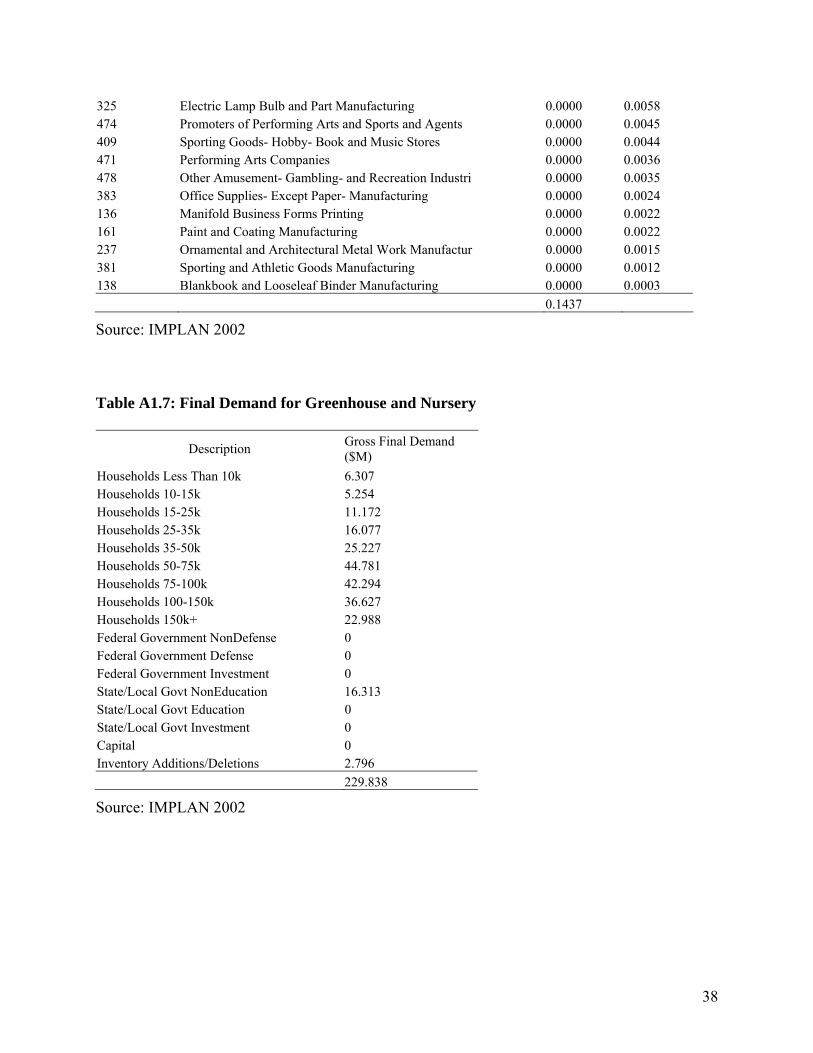
Table A1.7: Final Demand for Greenhouse and Nursery
Description Gross Final Demand ($M)
Households Less Than 10k 6.307 Households 10-15k 5.254 Households 15-25k 11.172 Households 25-35k 16.077 Households 35-50k 25.227 Households 50-75k 44.781 Households 75-100k 42.294 Households 100-150k 36.627 Households 150k+ 22.988 Federal Government NonDefense 0 Federal Government Defense 0 Federal Government Investment 0 State/Local Govt NonEducation 16.313 State/Local Govt Education 0 State/Local Govt Investment 0 Capital 0 Inventory Additions/Deletions 2.796
229.838
Source: IMPLAN 2002
38
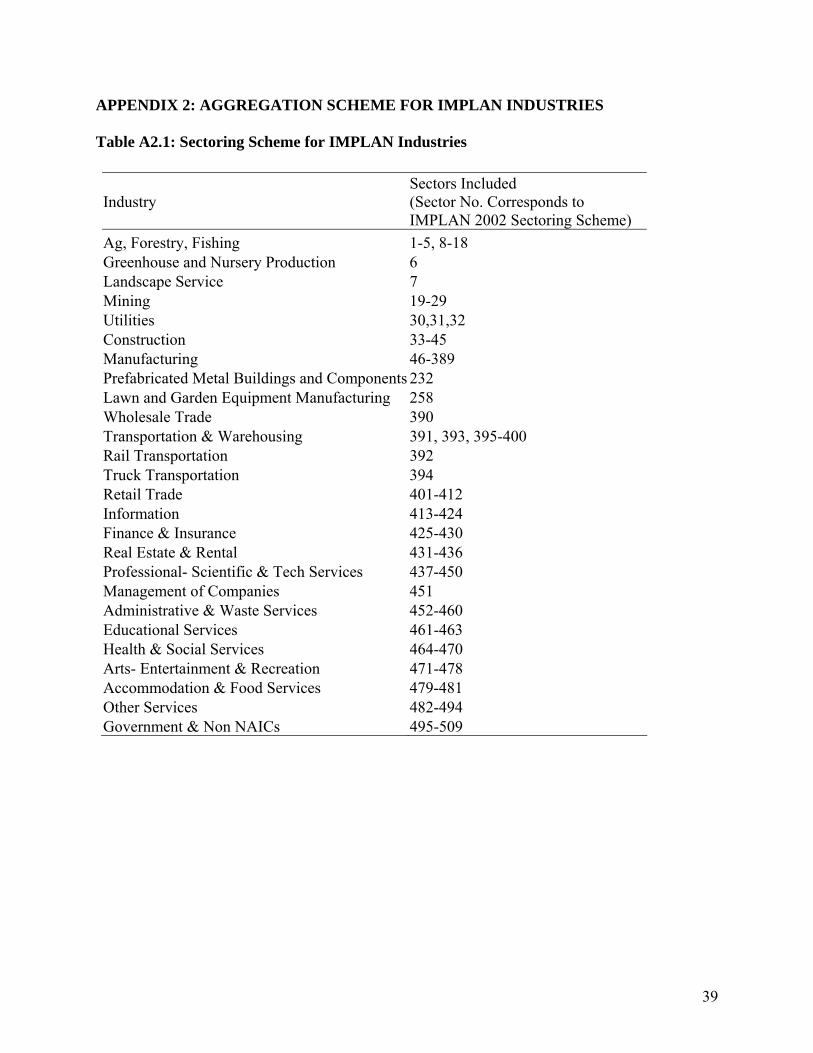
APPENDIX 2: AGGREGATION SCHEME FOR IMPLAN INDUSTRIES Table A2.1: Sectoring Scheme for IMPLAN Industries
Industry Sectors Included (Sector No. Corresponds to IMPLAN 2002 Sectoring Scheme)
Ag, Forestry, Fishing 1-5, 8-18 Greenhouse and Nursery Production 6 Landscape Service 7 Mining 19-29 Utilities 30,31,32 Construction 33-45 Manufacturing 46-389 Prefabricated Metal Buildings and Components 232 Lawn and Garden Equipment Manufacturing 258 Wholesale Trade 390 Transportation & Warehousing 391, 393, 395-400 Rail Transportation 392 Truck Transportation 394 Retail Trade 401-412 Information 413-424 Finance & Insurance 425-430 Real Estate & Rental 431-436 Professional- Scientific & Tech Services 437-450 Management of Companies 451 Administrative & Waste Services 452-460 Educational Services 461-463 Health & Social Services 464-470 Arts- Entertainment & Recreation 471-478 Accommodation & Food Services 479-481 Other Services 482-494 Government & Non NAICs 495-509
39
APPENDIX 3: INPUT-OUTPUT MODELS AND ECONOMIC IMPACT ANALYSIS Input-Output Modeling
Input-Output (I/O) economic analysis was developed by Wassily Leontief. According to
I/O analysis, sales in an industry can be analyzed in terms of demand for the product and all the
inputs necessary for its production. The model has a set of equations representing supply and
demand for the whole economy. Supply is assumed to meet demand. Industry supply responds
with a new level of output that meets the changes in demand, and a new general equilibrium in
the economy is reached. In this study, the economic impact of the Green Industry in Washington
State is found using I/O analysis.
An I/O model is a system of simultaneous linear equations (for example, see equation 1
in this Appendix) that traces the supply of and demand for products at a point in time (year) for
an economy. The two basic types of I/O models are Type I models, where consumption by
households is considered exogenous, and Type SAM models, where household consumption is
considered endogenous. Capital investment, inventory additions and deletions, government
spending, and domestic and foreign exports are the usual exogenous variables in a Type SAM
model.
Input-Output models work on two necessary assumptions. First is the assumption of
fixed price. I/O models assume prices to be fixed. Product price does not respond to a change in
demand. This is because each industry uses a combination of fixed inputs for the production of
its commodity and the return to scale for each industry is constant.
Construction of an I/O model begins with the formation of a matrix of technical
coefficients, called the C matrix. The C matrix is a matrix of all the production functions within
an economy. The production functions are arranged so each is a column in the C matrix. Each
40
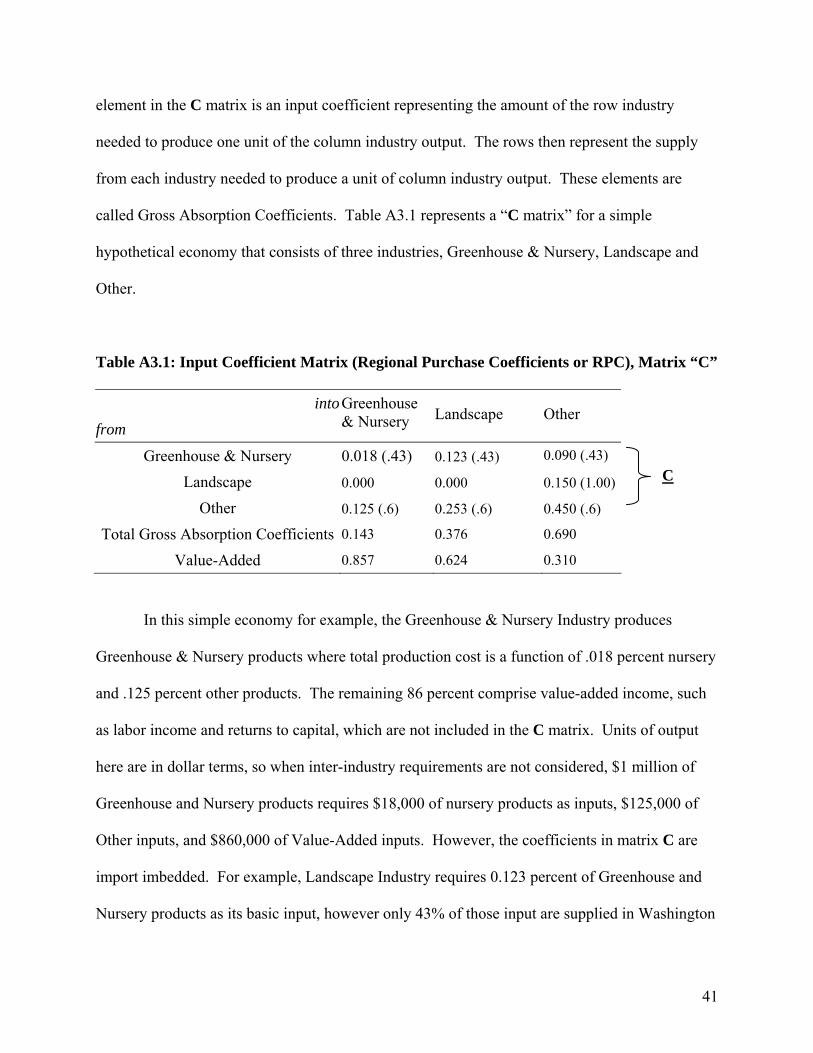
element in the C matrix is an input coefficient representing the amount of the row industry
needed to produce one unit of the column industry output. The rows then represent the supply
from each industry needed to produce a unit of column industry output. These elements are
called Gross Absorption Coefficients. Table A3.1 represents a “C matrix” for a simple
hypothetical economy that consists of three industries, Greenhouse & Nursery, Landscape and
Other.
Table A3.1: Input Coefficient Matrix (Regional Purchase Coefficients or RPC), Matrix “C”
intofrom
Greenhouse & Nursery Landscape Other
Greenhouse & Nursery 0.018 (.43) 0.123 (.43) 0.090 (.43)
Landscape 0.000 0.000 0.150 (1.00)
Other 0.125 (.6) 0.253 (.6) 0.450 (.6)
Total Gross Absorption Coefficients 0.143 0.376 0.690
Value-Added 0.857 0.624 0.310
C
In this simple economy for example, the Greenhouse & Nursery Industry produces
Greenhouse & Nursery products where total production cost is a function of .018 percent nursery
and .125 percent other products. The remaining 86 percent comprise value-added income, such
as labor income and returns to capital, which are not included in the C matrix. Units of output
here are in dollar terms, so when inter-industry requirements are not considered, $1 million of
Greenhouse and Nursery products requires $18,000 of nursery products as inputs, $125,000 of
Other inputs, and $860,000 of Value-Added inputs. However, the coefficients in matrix C are
import imbedded. For example, Landscape Industry requires 0.123 percent of Greenhouse and
Nursery products as its basic input, however only 43% of those input are supplied in Washington
41
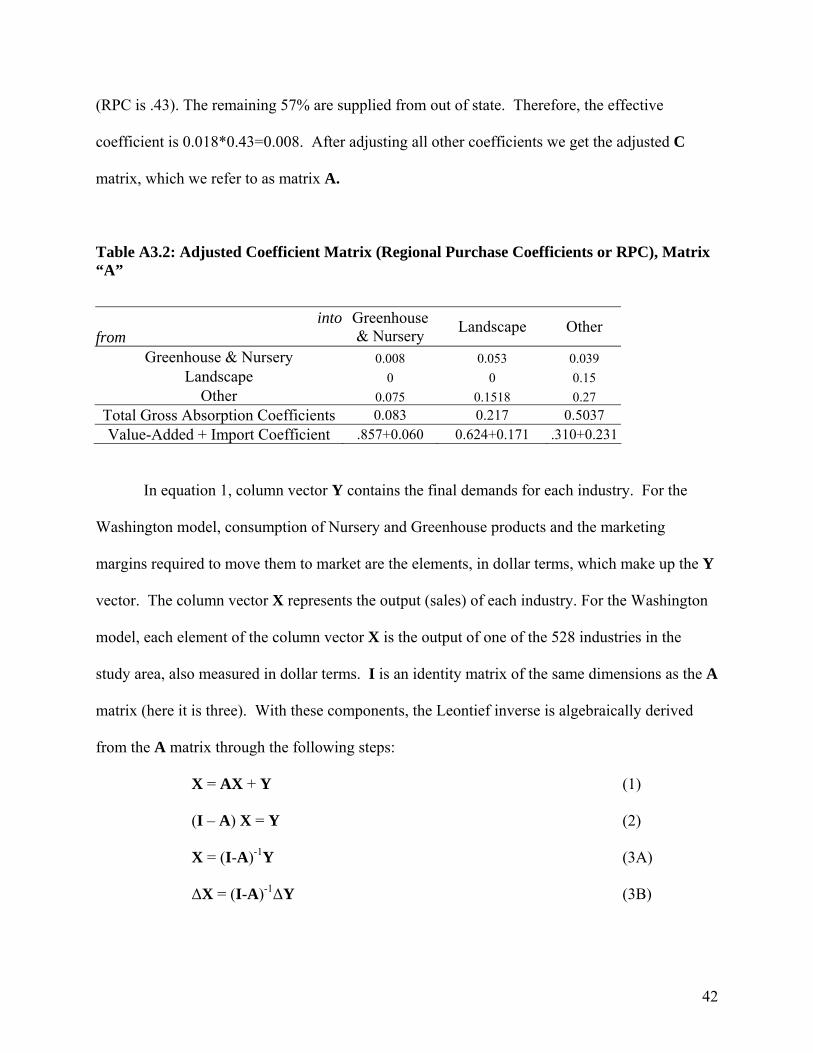
(RPC is .43). The remaining 57% are supplied from out of state. Therefore, the effective
coefficient is 0.018*0.43=0.008. After adjusting all other coefficients we get the adjusted C
matrix, which we refer to as matrix A.
Table A3.2: Adjusted Coefficient Matrix (Regional Purchase Coefficients or RPC), Matrix “A”
intofrom
Greenhouse & Nursery Landscape Other
Greenhouse & Nursery 0.008 0.053 0.039 Landscape 0 0 0.15
Other 0.075 0.1518 0.27 Total Gross Absorption Coefficients 0.083 0.217 0.5037 Value-Added + Import Coefficient .857+0.060 0.624+0.171 .310+0.231
In equation 1, column vector Y contains the final demands for each industry. For the
Washington model, consumption of Nursery and Greenhouse products and the marketing
margins required to move them to market are the elements, in dollar terms, which make up the Y
vector. The column vector X represents the output (sales) of each industry. For the Washington
model, each element of the column vector X is the output of one of the 528 industries in the
study area, also measured in dollar terms. I is an identity matrix of the same dimensions as the A
matrix (here it is three). With these components, the Leontief inverse is algebraically derived
from the A matrix through the following steps:
X = AX + Y (1)
(I – A) X = Y (2)
X = (I-A)-1Y (3A)
∆X = (I-A)-1∆Y (3B)
42
The (I-A)-1 Leontief inverse can then be used to calculate changes in supply throughout the
economy due to changes in final demand (equation 3B, where ∆ represents change). Table A3.2
is the (I-A)-1 matrix for the hypothetical economy whose “A” matrix is represented in table A3.1.
Multiplying the Leontief inverse by the column vector of final demands Y, results in the solution
output for each industry shown in the column vector X.
Table A3.3: Simple (I-A) Inverse
Greenhouse &
Nursery Landscape Other
Greenhouse & Nursery 1.013 0.064 0.067 Landscape 0.016 1.033 0.213
Other 0.107 0.221 1.421
Table A3.4 is the matrix representation of the impact from a hypothetical $1 million
increase in Greenhouse and Nursery final demand. The change in total output is represented on
the left side of the equation, i.e., the X column vector. Results from the hypothetical model show
a $1 million increase in final demand for Greenhouse and Nursery products requires an increase
of $1.013 million in the Greenhouse and Nursery sector, a $0.016 million increase in the
Landscape sector, and a $0.107 million increase in the other sector.
Table A3.4: Economic Impact on X 1.013 1.013 0.064 0.067 * 10.016 0.016 1.033 0.213 00.107 0.107 0.221 1.421 0
=
The increases in the X vector results from the two impacts described above: Direct and
Indirect effects. Direct effects are the unitary changes to industry output in which the final
demand change occurs. Direct effects in tableA3.4 are $1 million for the Greenhouse and
43

Nursery sector. Indirect effects are $0.013 million for Nursery and Landscaping, $0.016 million
for Landscape, and $0.107 million for Other.
44


![»Form Follows [Anything]«](https://img.pdfslide.us/doc/110x75/626e7406454d816c926c1885/form-follows-anything.jpg)