Embed Size (px)
Citation preview

Page | 1
UNIVERSITY OF HARGEISA
SCHOOL OF ECONIOMICS AND POLITICAL SCIENSE
Title
IMPACT OF WORKING CAPITAL MANAGEMENT ON BUSINESS
OPERATIONAL PERFORMANCE
By ID
MAHAD ISMACIL AKULE 127054
AHMED HUSEIN MAHAMED 126997
Advisor: SEED ABDILAHI SEED
A Research Proposal/Thesis Submitted to the School of Economics and
Political Sciences, Fulfillment of the Requirements for the Award of
Bachelor Degree in Economics
August, 2016
Page | 2
Chapter one: introduction
1.1 Background…………………………………………………………………………………………………………………6
1.2. Problem Statement of study…………………………………………………………………………………………8
1.3. Objectives of the Study…………………………………………………………………………………………………..9
1.3.1. General objectives of the study………………………………………………………………………………………9
1.3.2. Specific objectives of the study………………………………………………………………………………………9
1.4. Significance of the Study………………………………………………………………………………………………10
1.5. Scope of the study……………………………………………………………………………………………………….10
1.6. Description of the study……………………………………………………………………………………………….11
1.7. Limitation of the Study…………………………………………………………………………………………………12
Chapter Two: The Review of literature
2.1. Theoretical literature Review………………………………………………………………………………………13
2.1.1. Overview of Financial Management…………………………………………………………………………….13
2.1.2. Objective of working Capital Management…………………………………………………………………14
2.1.4. Significance of Working Capital Components Management…………………………………………15
2.1.4.1. Accounting Receivable Management………………………………………………………………………….16
2.1.4.2. Inventory Management………………………………………………………………………………………………17
2.1.4.3. Cash Management……………………………………………………………………………………………………….18
2.1.4.4. Account payable Management…………………………………………………………………………………….19
2.1.5. working capital policy…………………………………………………………………………………………………19
2.1.5.1. Defensive Working Capital Policy……………………………………………………………………………….20
2.1.5.2. Aggressive Working Capital Policy………………………………………………………………………………21
2.1.5.3. Conservative Working Capital Policy…………………………………………………………………………..21
2.2. Review of empirical literature…………………………………………………………………………………….21
Chapter three: Research Methodology
3.1. Introduction……………………………………………………………………………………………………………..23
3.2. Operational Definition………………………………………………………………………………………………24
3.2.1. Independent Variable (IDV)…………………………………………………………………………………24
3.2.1.1. Cash Conversion Cycle (CCC)……………………………………………………………………………………..24
3.2.1.2. Inventory Conversion Period (ICP)……………………………………………………………………………..24
3.2.1.3. Average Collection Period (ACP)……………………………………………………………………………….25
3.2.1.4. Average Payment Period (APP)………………………………………………………………………………….25

Page | 3
3.2.2. Dependent Variable (DV)………………………………………………………………………………..25
3.3. Research design……………………………………………………………………………………………………..26
3.4. Research Approaches………………………………………………………………………………………………26
3.5. Sample Design………………………………………………………………………………………………………..26
3.5.1. Population……………………………………………………………………………………………………………….27
3.5.2. Sample Frame………………………………………………………………………………………………………….27
3.5.3. Sample Size……………………………………………………………………………………………………………..28
3.5.4. Sampling Techniques………………………………………………………………………………………………29
3.6. Source of Data………………………………………………………………………………………………………..29
3.6.1. Primary Data……………………………………………………………………………………………………………29
3.6.2. Secondary Data……………………………………………………………………………………………………….29
3.7. Data Collection Techniques………………………………………………………………………………………30
3.8. Data Analysis and presentation…………………………………………………………………………………30
3.9. Ethical Consideration…………………………………………………………………………………………………30
Chapter Four: RESULTS AND DISCUSSION AND INTERPRETATION
4.1. Introduction………………………………………………………………………………………………………………..31
4.2. Descriptive Statistics……………………………………………………………………………………………………31
4.2.1. Demographic statistics of Respondents……………………………………………………………………..31
4.2.1. Manager’s Knowledge in Working Capital Management………………………………………………34
4.2.1. Cash Convention Cycle…………………………………………………………………………………………………34
4.2.1.2. Inventory Management……………………………………………………………………………………………….36
4.2.1.3. Account Receivable management……………………………………………………………………………….37
4.2.1.4. Account Payable management…………………………………………………………………………………….38
4.2.2. Analysis for measurement indicators………………………………………………………………………………….39
4.2.3. Correlations…………………………………………………………………………………………………………………42
4.2.3.1. Relationship between CCC and Profitability…………………………………………………………………42
4.2.3.2. Account receivable and Firm’s Profitability………………………………………………………………….43
4.2.3.3. Account Payable and Inventory against Profit Margin Ratio………………………………………44
4.2.3.4. Relationship between CCC and Liquidity…………………………………………………………………….44
Chapter Five: Conclusion and Recommendations
5.1. Introduction………………………………………………………………………………………………………………45
5.2. Conclusion………………………………………………………………………………………………………………….45

Page | 4
5.2.1. Correlation of Cash convention Cycle with Profitability and Liquidity…………………………46
5.2.2. Components in Cash Convention Cycle against Liquidity and Profitability……………….…46.
5.2.3. Manager’s Knowledge and competence level in Working Capital Management…………47
5.3. Recommendations……………………………………………………………………………………………………47
5.3.1. Working Capital Balancing Acct……………………………………………………………………………….48
5.3.2. Inventory Balancing Act……………………………………………………………………………………………48
5.3.3. Account Receivable Balancing Act………………………………………………………………………………49
5.3.4. Account Payable Balancing Act………………………………………………………………………………….49
6.0. Reference…………………………………………………………………………………………………………………………….50.
List of figures:
Figure 1 Conceptual framework for Working Capital Management Components of the Study ................. 14
Figure 2 Typology of working capital policy ............................................................................................. 19
Figure 3 Age categories of respondents ................................................................................................ 32
Figure 4 of respondent’s level Educational ........................................................................................... 33
Figure 5 Impact of CCC on Liquidity and Profitability against manager’s perceptions ....................... 33
Figure 6 impact of inventory management on liquidity and profitability against manager’s insights .. 35
Figure 7 impact of Account receivable on liquidity and profitability against manager’s perceptions . 36
Figure 8 impact of Account payable management on liquidity and profitability against manager’s
perceptions ............................................................................................................................................ 37
Figure 9 correlation between CCC and Profitability............................................................................. 40
Figure 10 correlation of average collection period with profit margin ratio ......................................... 42
Figure 11 correlation of CCC and liquidity (measured current ratio) ................................................... 43
Figure 12 elements of working capital .................................................................................................. 46
Figure 13 main objective of working capital management ................................................................... 46
Figure 14 inventory balancing act ........................................................................................................ 47
Figure 15 Account Receivable balancing act ........................................................................................ 47
Figure 16 Account Payable balancing act ............................................................................................. 48

Page | 5
List of Tables Table 1 Sample frame………………………………………………………………………………………………………………………..27
Table 2 Respondent's Gender ............................................................................................................... 31
Table 3Marital Status of respondents................................................................................................... 31
Table 4 the position of respondents in their firms (What is your current position in your firm?) ....... 32
Table 5 Summary of all Variables of paper ........................................................................................... 38
Table 6 Descriptive Statistics for all Samples ........................................................................................ 39
List of Appendixes: Appendix 1 Questionnaires ............................................................................ Error! Bookmark not defined.

Page | 6
Chapter one: Introduction
1.1. Background
Generally, financial management is essential part of the economic and non economic activities
at the global perspective, which leads to decide the efficient procurement and utilization of finance
with profitable manner. Earlier, the subject of financial management was part of accountancy with
traditional approaches. No a days it has been enlarged with innovative and multi dimensional
functions in the field of the business (Subramanian, 2009). The term financial management has
been given many definitions by many authors. The most popular and acceptable definition of
financial management as given by S.C Kuchal is that “the financial management deals with
procurement of funds and their effective utilization in the business”. Basically, the objectives of
financial management may be broadly divided into two parts which are (1) Profit maximization:
The profit maximization is considered as parameter of measuring business operational efficiency
and helps to reduce business risk, (Subramanian, 2009) (2) Wealth Maximization: the wealth
maximization is one of the modern approaches, which involves the latest innovation and
improvement in the field of the business concern (Subramanian, 2009).
So, Business concern then needs Finance to meet their requirements in the economic world. Any
kind of business activities depends on finance regardless size (small or large) of business to fulfill
operational activities in a highly profitable manner (Subramanian, 2009). In the modern world, all
the activities are concerned with the economic movements very particular to earning profit and
avoid risk of insolvency through combination of various strategies, hence the entire normal
business course of actions directly relate with making profit. According to economics concept of
factors of production; rent given to landlord, wage given to labour, return given to capital and
profit given to shareholders, a business concern needs finance to meet all the requirements.
Therefore, the finance is often called as lifeblood of organization. The finance can be classified
into two board categories which are private finance and public finance each of them can be further
sub-divided. The private finance includes individuals, firms, business or corporation financial
resources to meet the requirement, whereas public finance concerns the revenue and disbursement
of Government such as central Government, State Government, and semi-Government financial
matters (Subramanian, 2009).
Page | 7
However, it is also profoundly indispensable to understand the basic definitions of current assets
and current liability in order to clearly insight the meaning of working capital, and its relevant
management in the normal business course of actions.
(Fitzgerald 2006) defined current assets as, “cash and other assets which are expected to be
converted into cash in the ordinary course of business within one year or within such longer period
as constitutes the normal operating cycle of a business.” The claims or obligations which are
normally expected to mature for payment within an accounting cycle are known as current
liabilities. Then, Working capital is the capital available for conducting the day-to-day operations
of an organization, normally the excess of current assets over current liabilities, whereas working
capital management is the management of all aspects of both current assets and current liabilities
to minimize the risk of insolvency while maximizing the return on assets. So, it’s clear without
doubt that inefficient financial management including working capital management may damage
business enterprise’s profitability (Gebrehiwot & Wolday, 2006). On the contrary, the efficient
management of working capital is a fundamental part of the overall corporate strategy to create
shareholders value (Nazir and Afza, 2008).
In addition to, “The working capital plays the same role in the business as the role of heart in
human body. Working capital funds are generated and these funds are circulated in the business.
As and when this circulation stops, the business becomes lifeless. It is because of this reason that
the working capital is known as the circulating capital as it circulates in the business just like blood
in the human body.” (Agarwal, 2000:171-172). Nevertheless, excessive levels of current assets
may have a negative effect on the firm’s profitability, whereas a low level of current assets may
lead to lower level of liquidity and stock outs leading to difficulties in maintaining smooth
operations (Van Horne and Wachowicz, 2004). Accordingly, working capital management is an
attempt to manage and control the current assets and the current liabilities in order to maximize
profitability and proper level of liquidity in business.
Though a number of research works have discovered the impact of working capital management
on the performance of organizations, there is no investigation has been carried out regarding to
impact of working capital management on the business operations in the context of Somaliland.
This limited evidence and information gaps related to the research topic in Somaliland perspective
invite for research to be undertaken so as to identify the impact of existing real practice, and

Page | 8
techniques of working capital management currently applied, underline problems, evaluate its
magnitude to some extent and propose relevant recommendations. In view of that, the focus of this
paper will be to assess working capital management in-depth and how proper management on
working capital components fundamentally effect on business operational performance through
the liquidity and profitability balance act.
1.2. Problem Statement of study
Working Capital Management and its Impact on Firms’ Performance has been studied significantly
by different researchers (Padachi, K. (2006); F. Finau, (2011); Anand and Gupta (2002); Mohamad
and Noriza (2010); Deloof (2003); Luo et al. (2009); Vishmani at el., (2007) Koperunthevi (2010);
Fathi and Tavakkoli (2009); V. Ganesan, (2007)). Most of these and other researchers identified
significant association between working capital management and firms’ operational performance.
It has however been discovered that some methods that managers use in practice to make working
capital decisions do not rely on the principles of finance, rather they use vague rules of thumb or
poorly constructed models (Emery, Finnerty and Stowe 2004). This practice of poorly constructed
models makes managers not capable to successfully manage the various mixes of available
working capital components. Thus, the organization may either be overcapitalized or
undercapitalized. Egbide (2009) found that large number of business failures in the past has been
blamed on the inability of the financial manager to plan and control the working capital of their
respective firms.
However, while searching on internet, browsing the books and journals no study directly related
to research topic which has been conducted in Hargeisa as well as in Somaliland. Thus, lack of
proper research which has been locally conducted in relation to this question, and with light of
underlined problems by above referenced intercontinental studies, this problem seems uncovered
potential bottleneck in Somaliland business environment in which may give chance local
company’s managers to have limited wakefulness in working capital management decisions, and
encourage them to apply traditional approaches of working capital management, rather they should

Page | 9
apply financial management principles. As a result, this may hinder the entire local business
operational performance.
Therefore, the aim of this study is to assess significance and impact of proper working capital
management decisions on business operational performance. The paper will emphasize the
liquidity and profitability balance act in order to ensure how to maintain overall working capital
investment levels in a rational and reasonable position focusing on the key components of current
assets and current liabilities namely: cash, accounts receivable, inventory and accounts payable.
1.3. Objectives of the Study
1.3.1. General objectives of the study
The general objective of this paper will be to examine balance of current assets and current
liabilities where currents assets are sufficiently liquid to minimize the risk of insolvency and return
on capital employed is the highest as possible with least possible working capital investment level.
1.3.2. Specific objectives of the study
1. To examine the impact of cash management on firm’s operational performance.
2. To evaluate the effect of inventory management on firm’s operational performance
3. To analyze the effect of receivable management on firm’s operational performance
4. To address the importance of trade payable management on firm’s operational performance
1.4. Significance of the Study
The findings of this paper will provide implications for managers of companies located and operate
in Somaliland whose are attempting to make decisions regarding to working capital management

Page | 10
reform models. It will also assist managers to understand and develop financial policies, practices
and techniques for managing working capital components in a most productive way. The findings
will reveal the significance of working capital management for companies in Hargeisa Somaliland
in terms of performance and the practice of liquidity and profitability balance act to some extent.
Moreover, the study will help me as a researcher not only for academic requirement, but also to
have solid experience, expert insight and grounded intuition from this question or issue under the
investigation. Also it will provide basic guidelines and relevance benchmark for potential
researchers as well as other fundamental stakeholders of this environment such as accountants,
financial managers, and financial policy makers.
1.5. Scope of the study
The paper will be delimited to investigate impact of working capital management on business
operational performance emphasizing the management of core working capital components ( cash,
account receivable, inventory, and account payable) with relative measurement indicators
including CCC (cash conversion cycle), which are used for WCM measurement. The study will
also use liquidity and profitability ratios particularly current ratio (CR), quick ratio (QR), profit
margin ratio (PMR), and return on asset ratio (ROAR) for performance measurement. Moreover,
the coverage of the paper will not cover all categories of privately owned businesses, rather it will
confine on carefully selected representative sample of wholesale businesses specifically
merchandising companies exist and run in Hargeisa. The wholesale businesses are those buy goods
in bulk and then resell them, generally for a higher price than they were purchased to retailers or
other wholesalers not directly to the end users/ consumers.
Considering the geographical scope, the research will take place in Hargeisa, the city of Somaliland
situated in a mountainous area, 1,334 meters (4,377 feet) above sea level in an enclosed valley of
the northwestern Galgodon highlands (Ogo Mountains). According to Demography, Hargeisa has
a population of around 750,000 residents as of 2015. The urban area occupies 65 square kilometers
(25 sq mi), with a population density of 11,600 inhabitants per square kilometer (30,000/sq mi).
In addition to, Hargeisa is the financial hub to many entrepreneurial industries ranging from
Page | 11
gemstone cutters, to construction, food processing, retail, and import and export firms. Regarding
to climate, Hargeisa has a semi-arid climate (Köppen: BSh). The city generally features warm
winters and hot summers. However, despite its location in the tropics, due to the high altitude
Hargeisa seldom experiences either very hot or very cold weather. This is a trait rarely seen in
regions with semi-arid climates. The city receives the bulk of its precipitation between the months
of April and September, averaging just less than 400 mm of rainfall annually. Average monthly
temperatures in Hargeisa range from 18 C in the months of December and January to 24 C in the
month of June.
1.6. Description of the study
Large merchandising companies along with retailers which exist and operate in Somaliland are
large in number than other manufacturing and service industries. So they have tremendous
influence on effectiveness and smooth going of country’s economic conditions as long as they are
one of the major private sector sources of job opportunities, take incredible part the aggregate price
level in the economy and revitalize or refresh entire economic cycle. They also increase demand
of foreign currency particularly U.S dollar for buying goods from foreign markets due to lack of
international recognition of Somaliland local currency which only works and circulates within the
Somaliland territory. The large merchandising companies which are under consideration of this
study are those buy goods in bulk and then resell them, generally for a higher price than they were
purchased to retailers or other wholesalers not directly to the end users/ consumers. These large
merchandising companies are comparatively systemized in terms managerial skills including
financial management, accounting and reporting, documentation and record keeping then lower
tiers of business.
1.7. Limitation of the Study
The major drawbacks of this paper can be lack of commitment, inappropriate information
disclosure, and treatment which may hinder to clearly understand existing situation and actual
Page | 12
happenings in the right of reality. The research paper might also face lack of relevance, reliable,
and complete data. In addition to, there may be lack of sophisticated accounting system practice
and correct record keeping in sampled companies which will be under investigation. However, this
drawback will limit the findings of the study.
Chapter Two: The Review of literature
This chapter calls attention to on present literatures involving to the working capital management
components, and its effect on business operational performance. The literature review section
comprises two sections. The first section concerns the theoretical review of working capital
management while the second section examines the empirical evidence pertinent to working
capital management
Page | 13
2.1. Theoretical literature Review
2.1.1. Overview of Financial Management
The traditional definition of Finance is the study of funds management and the directing of these
funds in order to achieve its particular objectives. The unique objective of a good financial
management is to maximize returns that associate with minimizing of financial risks
simultaneously. In Financial management it is critical to understand the business objectives and
financial functions before recognizing the major component that is the short-term financial
management or the Working Capital Management relative to the day-to-day operations (Brigham
and Ehrhardt, 2010; Chandra, 2008; Keown, Martin, Petty, and Scott, 2002; D. Sharma, 2009).
Financial management is also concerned with the creation of economic wealth, maximizing the
share price for shareholders’ equity, planning and controlling of the business’s financial resources,
increasing its profitability and maximizing the rate of returns on Equity.
2.1.2. Objective of working Capital Management
According to Gitman (2009) the objective of Working Capital Management (WCM) is to minimize
the Cash Conversion Cycle (CCC) the amount of capital tied up in the firm’s current assets. It
focuses on controlling account receivables and their collection process, and managing the
investment in inventory. Working capital management is vital for all business survival,
sustainability and its direct impact on performance (Mengesha, 2014). Moreover, the primary
cause of an enterprise’s failure is the poor control management of Working Capital internally
amongst its components. Thus, the finance manager of an enterprise must be alert to the level of
working capital (Finau, 2011).

Page | 14
However, the primary emphasis of this paper is to examine the four critical components of working
capital management namely Cash, Accounting receivable, Inventory and Accounts payable. Even
though the operation cycle of these components relative to operational performance should be
considered, it will not be given a great consideration as the below illustrated conceptual
Framework (Figure 2.1.2-1) demonstrates the critical portion of the financial management
components for this study.
Figure 1 Conceptual framework for Working Capital Management Components of the Study
Financial Management
Working Capital
Management
Cash management
Impact on Performance
Accounts Receivable
Management
Impact on Performance
Inventory Management
Impact on Performance
Accounts Payable
Management
Impact on Performance
Ensure Liquidity and Profitability Balance Liquidity
Profit Margin and Return on
Assets Ration
Profitability

Page | 15
2.1.3.
2.1.4. Significance of Working Capital Components Managemen
Working capital is so important for business day-to-day operations. A decision made on one of the
Working Capital components has an impact on the other components. In order to maximize the
performance of a business, the Working Capital Management should be integrated into the short
term financial decision making process (Crum, Klingman, and Tavis, 1983). Working Capital or
Net Working Capital is “the difference between current assets less current liabilities” (Arnold,
2008). In financial annual reports, working capital is defined in an algebraic expression as follows:
The investment in NWC is so vital and helps the capital budgeting analysis of a given firm.
Working Capital (WC) can be invested in short-term sources of finance, such as cash, inventories,
account receivables, and notes receivables. WC is minimised in terms of payments made to
account payables (creditors), account notes payable and other accrued liabilities. In order to
balance out the optimal levels of costs and benefits, then the liquidity components of working
capital must be managed with appropriate techniques through raising or lowering the stocks, cash,
account receivables and account payables (Arnold, 2008; Gitman, 2009).
2.1.4.1. Accounting Receivable Management
Account receivables are assets representing amounts owed to the firm as a result of the sale of
goods or services in the ordinary course of business. Kelly and McGowen (2010) suggest that
credit customers who pay late or don’t pay at all only aggravate the problem. Thus, it is important
for the financial manager or account receivables manager to establish a good policy that controls
the advantages of offering credit with the associated costs.
Current Ratio and Quick
Ratio
Net Working Capital (NWC) = Current Assets (CA) – Current Liabilities (CL).
Page | 16
The firm should establish its receivables policies after carefully considering both the benefits and
costs of different policies. (Hampton 2004). Three factors should be analyzed:
Profits. The firm should investigate different possibilities and forecasts the effect of each
on its future profits. The cost of funds tied up in receivables, collection costs, bad debt
losses, and money lost discounts for early payment should be compared with additional
sales or losses of sales as a result of each proposed policy
Growth in sales. Sometimes firms are willing to accept short term setbacks with respect
to profits if a new policy enables the firm to increase its sales significantly. A firm may
adopt a certain policy to gain a foothold in previously closed market. Because growth is so
important aside from profits, it should be viewed as a separate factor in determining
receivables policies.
Possible problems. In spite of increase sales and profits, some policies may be
accompanied by obvious and annoying problems.
2.1.4.2. Inventory Management
The composition of an inventory differs depending on what kind of production or business
companies are involved in. The five different assets an inventory can consist of are; raw materials,
work in progress materials, finished goods, extra material and consumption materials. Most
companies have an inventory that they more or less depend on in their operation (Lantz, 2008, p.
306).
Raw Materials Raw materials are concerned with the goods that have been delivered by the
supplier to purchaser’s warehouse but have not yet been taken into the production area for
conversion process (Cinnamon et al., 2010).Work In Progress (WIP) Work in progress concerns
are when the product has left the raw material storage area, until it is declared for sale and delivery
to customers (Birt et al., 2011; Cinnamon et al., 2010). Finished Goods refer to the stock sitting
in the warehouse waiting for sale and delivery to customers.
The management of inventory is one of the more challenging tasks for working capital managers
who, if they could decide, would like to minimize the inventory as much as possible in order to
shorten the cash conversion cycle and reduce costs. The risk of minimizing an inventory down to
Page | 17
a level close to zero is that it increases the possibility of running out of materials needed in the
production or running short of finished goods during a high demand. Such situation would be
costly for any company due to the revenues they would lose (Maness and Zietlow, 2005, p. 99).
Each manager has their own interests they first and foremost would like to satisfy which
complicate the task to reach a joint decision. Each company should find the balance that they will
benefit most from (Pass & Pike, 2007).
The just-in-time approach is a strategy for effective inventory management and help keeping
inventory levels on a lower level. The strategy aims to make the orders of material, produce and
deliver just in time when it is required and not before (Brealey, Myers and Allen, p. 820).
2.1.4.3. Cash Management
In a financial sense, the term cash refers to all money items and sources that are immediately
available to help pay firms bills (Hampton, 2004). Managing cash is becoming ever more
sophisticated in the global and electronic age of the 1990s as financial managers try to squeeze the
last dollar of profit out of their cash management strategies (Block and Hirt, 1992).
The management with account payables and receivables that has been described above and below
goes under the term of cash management. Following paragraphs summarizes what cash
management engage in order to shorten the cash conversion cycle (Lantz, 2008, p. 119);
Extend the credit time for account payables
Shorten the credit time for account receivables
Incorporate more efficient methods for the management of account payables and
receivables
Improve the procurement of capital surplus and deficits (Lantz, 2008, p. 119)
Despite the ambition to minimize the cash conversion time and therefore the costs in the
conversion cycle, the companies cannot escape all costs since they have their own obligations to

Page | 18
consider. Taking into the account these responsibilities companies must keep some cash for
expected as well as unexpected expenditures that occur in their everyday business. Lantz have
mentioned about these three motives why companies should hold cash (Lantz, 2008, p. 119);
The transaction motive: the company must be able to manage their own obligations like
payments to suppliers. They should not be dependable on customers paying in time since
they can be late and pay after due date which will involve extra costs.
The speculative motive: the market is unpredictable and opportunities could turn up at any
time and when they do, companies should see to that they have money available if they
would like to invest.
The precautionary motive: as well as the market is unpredictable so are the activities in the
business. Unexpected events like; machines breaking down, a suddenly increase or
decrease of the demand and more, can occur and could have a very negative influence for
the whole company if not taken care of (Lantz, 2008, p. 120).
2.1.4.4. Account payable Management
The general guidelines for optimizing the managing of account payables involve the timing of
payments. Companies should try prolonging the time of payment as long as possible as they can
use the advantage of their suppliers financing their investments until payment has been made.
Another argument for prolonging the time for payment is that the producing companies, for
example, need some time to convert their purchased raw material into products they can get sold
and get cash in return (Maness and Zietlow, 2005, . 235-238).
Some suppliers offer their customers discount rates as an attempt to get them to pay their
receivables before maturity date which may sound tempting but this is not always the most
profitable option. To avoid being misled by theses discounts offers, companies should carefully
consider every discount offer they get to see that it is beneficial in terms of their conditions Maness
and Zietlow, 2005, p. 235-238). If there is no discount offer given companies should use the whole
credit period and pay their payables on due date. Paying after due date should always be avoided
unless the company has fallen in financial difficulties and there is no other choice. The reason for
Page | 19
this is that delayed payments can result in unnecessary costs as late fees (Dolfe and Koritz, 2000,
p. 49).
2.1.5. Working Capital Policy
Working capital policy can be best described as a strategy which provides the guideline to manage
the current assets and current liabilities in such a way that it reduces the risk of default (Afza and
Nazir, 2007). Working capital policy is mainly focusing on the liquidity of current assets to meet
current liabilities. Liquidity is very important because, if the level of liquidity is too high then a
company has lot of idle resources and it has to bear the cost of these idle resources. However, if
liquidity is too low then it will face lack of resources to meet its current financial liabilities (Arnold,
2008). Current assets are key component of working capital and the WCP also depends on the
level of current assets against the level of current liabilities (Afza and Nazir, 2007). On this base
the literature of finance classifies working capital policy into three categories as defensive or
hedging, aggressive and conservative working capital policy (Arnold, 2008 pp.535-36) and
discussed as follows:
Figure 2 Typology of working capital policy
2.1.5.1. Defensive Working Capital Policy
Defensive policy: Company follows defensive policy by using long term debt and equity to finance
its fixed assets and major portion of current assets. Under this approach, the business concern can
adopt a financial plan which matches the expected life of assets with the expected life of the
sources of funds raised to finance assets (Paramasivan and Subramanian, 2009). Inventory
expected to be sold in 30 days could be financed with a 30- day bank loan; a machine expected to
last for 5 years could be financed with a 5-year loan; a 20-year building could be financed with a
Working Capital Policy
Defensive Policy Aggresesive Policy Concervative Policy

Page | 20
20 year mortgage bond; and so forth (Weston and Brigham, 1977, P. 716). Inventory expected to
be sold in 30 days could be financed with a 30- day bank loan; a machine expected to last for 5
years could be financed with a 5-year loan; a 20-year building could be financed with a 20 year
mortgage bond; and so forth (Weston and Brigham, 1977, P. 716).
Defensive policy reduces the risk by reducing the current liabilities but it also affects profitability
because long term debt offers high interest rate which will increase the cost of financing (Arnold,
2008 p.530)
2.1.5.2. Aggressive Working Capital Policy
Aggressive policy: Paramasivan and Subramanian (2009) pinpointed that in aggressive policy the
entire estimated requirement of current assets should be financed from short-term sources and even
a part of fixed assets financing be financed from short- term sources. This approach makes the
finance mix more risky, less costly and more profitable. This policy increases the risk of default
because a company might face a lack of resources to meet the short term liabilities but it also gives
a high return as the high return is associated with high risk (Arnold, 2008, p.536).
2.1.5.3. Conservative Working Capital Policy
Conservative policy: It is also a mixture of defensive WCP and aggressive WCP. So Conservative
Working Capital Policy refers to minimize risk by maintaining a higher level of Working Capital.
This type of Working Capital Policy is suitable to meet the seasonal fluctuation of the
manufacturing operation (T.Subramanian, 2009).
2.2. Review of empirical literature
Several researchers have conducted researches in relation to working capital management from
dissimilar standpoint and in different atmospheres. Below are some of them which might be
incredibly fascinating and valuable for the research:

Page | 21
Moyer et al. (2003) found that Working Capital consists of a large portion of a firm’s total
investment in assets, 40% in manufacturing and 50-60% in retailing and wholesale industries
respectively. The firms could reduce its financing cost and increase the funds available for
expansion if they minimize the funds tied up in current assets. They found that cash helps to keep
the firm liquid. It enables the firm to pay its obligations and also protects the firm from becoming
bankrupt.
Alipour (2011) researched about working capital management and corporate profitability while
taking sample of 1063 companies from Tehran stock exchange. To test the hypothesis, multiple
regressions and Pearson’s correlation was used. He analyzed that sale and profit of a company is
greatly influenced by the working capital management. Due to inefficient working capital
management, a company may be incapable to pay its debts on time. The results show a significant
relationship between working capital management and profitability of a company. There is a
negative relationship between cash conversion cycle, average collection period, inventory turnover
in days and profitability.
The study on Kenyan firms suggest that more profitable firms takes the shortest time to collect
cash from their customers and high inventory levels reduce costs of possible interruptions in the
production process and loss of business due to scarcity of products. The study also reveals that the
longer a firm takes to pay its creditors, the more profitable it is M. Mathuva, (2010).
Usama (2012) extended the work of Rehman and Nasar regarding working capital management
while taking the sample of 18 companies from other food sector listed on Karachi Stock Exchange
for the period of 2006-2010. The researcher used different variables to measure working capital
management such as average collection period, inventory turnover in days, cash conversion cycle,
average payment period, debt ratio, firm size, current ratio, and financial asset to total asset. Using
common effect model and pooled least square regression, the results indicated that working capital
management has significant positive association with firm’s profitability and liquidity. He also
concluded that firm size and minimum inventory turnover in days has positive influence on firm’s
profitability.
In Malaysia, Mohamad and Noriza (2010) did their study by taking secondary data from
Bloomberg’s 72 listed companies for 5 years from 2003-2007 to derive the relationship empirically
Page | 22
between Working capital management and profitability. Study was done to check effects of
working capital components (such as CCC, CATA (Current Asset over Total Assets Ratio) ratio,
debt to asset ratio, CR and current liabilities over total asset ratio) on firm’s performance and
profitability measured by Tobin’s Q ratio, return on invested capital and ROA (Return on Assets).
Correlation and Multiple Regression results showed a significant negative relation between
working capital components and company’s performance.
Bhunia, Khan and Mukhuti (2011) provided the evidence with respect to the relationship between
liquidity and profitability of a firm. They took steel companies of private sector in India to assess
the management of liquidity as a factor of performance. They studied important liquidity indicators
and analyzed that optimal working capital management can be achieved by controlling the trade-
off between profitability and liquidity of a firm. Firm value is positively affected by optimal
working capital management so the investment in working capital must be satisfactory. They
concluded that liquidity and profitability are significantly positively associated.
Regarding to profitability, the empirical result suggests there is a significant positive relation
between the cash conversion cycle and profitability which is opposed to results found in the prior
studies (Deloof, 2003; Hyun-Han & Soenen, 1998; Lazaridis & Tryfonidis, 2006; Jose, et al.,1996;
Eljelly, 2004). But it is consistent with the study of Jeng-Ren, et al. (2006). Considering the
component of the cash conversion cycle, the regression result point out a significant positive
relation between number of days inventory and profitability which is opposed to the previous
studies (Deloof, 2003; Raheman & Nasr, 2007; Samiloglu & Demirgunes, 2008; Lazaridis &
Tryfonidis, 2006). The positive result with the cash conversion cycle points out that an increase in
profitability is associated with a rise in the cash conversion cycle. It shows that the profitable
companies tend to have the longer cash conversion cycle which indicates to inefficient working
capital management. The result contrasts with our expectation. This might be affected by either
inventory period, accounts receivable period or accounts payable period.
Chapter three: Research Methodology
3.1. Introduction
Page | 23
The preceding chapter opened a way to identify the literary work of people in relation to working
capital management and its impact on firm’s operational performance. On the contrary, this chapter
takes a step forward to demonstrate the research methodology by explaining the operational
definition, type of research to be employed along with the research approach and determining
sample design of the paper. It also addresses the data sources and ways of getting relevant data, its
collection instrument, and the mode of data analysis and synthesize. Hence, this chapter also deals
with ethical issues that the researcher must give a great attention in course of conducting the
research.
3.2. Operational Definition
The ultimate goal of working capital management is to get balances of current assets and current
liabilities right. So this section profoundly identifies an independent variable (IV) and dependent
variable (DV) of the paper as mentioned below:
3.2.1. Independent Variable (IDV)
The independent variable (IV) refers to the status of the presumed 'cause,' changes in which lead
to changes in the status of the dependent variable (Rosenthal & Rosnow, 1991, p. 71). However,
the independent variables of the paper will be working capital management through WCM
measurement indicators namely: Average Collection Period (ACP), Inventory Conversion Period
(ICP), Average Payment Period (APP), and Cash Conversion Cycle (CCC as detailed below in
brief with formula to calculate them:
3.2.1.1. Cash Conversion Cycle (CCC):
Business enterprises purchase inventories from suppliers on credit basis and then sell inventory on
credit as well to the customers. The CCC simply means the length of time (in days) that company
uses to sell inventory, collect receivables and pays its accounts payable. CCC is the difference
between sum of inventory period and receivable period (operating cycle) and payment period
(Cash conversion cycle = Average number of days accounts receivable+ Average number of days
inventory –Average number of days accounts payable).

Page | 24
3.2.1.2. Inventory Conversion Period (ICP):
The ICP also called days inventory outstanding and it gives a measure of days it takes for
company’s inventory to turn over, i.e., to be converted to sales, either as cash or accounts
receivable. Inventory period is calculated by dividing average inventory by cost of sales per day.
Formula:
Average number of days inventory = Average inventory /Cost of goods sold x 365
3.2.1.3. Average Collection Period (ACP)
This variable is defined as the number of the days which is needed to collect the receivables. In
other words, it is the average period for which receivables are outstanding. The information about
the net annual sales of the firm and the average beginning and ending receivables are used
(Mohammadi, 2007):
Formula:
Average number of days accounts receivable = Average accounts receivable/Annual credit Sales
x 365
3.2.1.4. Average Payment Period (APP)
This is the number of days a company takes to pay off the accounts payable. In other words, it
gives measure of how long it takes the company to pay its obligations to suppliers as they come
due. The average beginning and ending accounts payable are used to measure the average payment
period (Deloof, 2003)
Formula:
Average number of days accounts payable = Average accounts payable/Credit purchase x 365
3.2.2. Dependent Variable (DV)
Page | 25
Dependent Variables or outcome variables will be the variables used to measure the performance
of the firm. Although profitability ratios measure a firm’s overall efficiency and effectiveness in
generating profit, the liquidity will be considered as a factor of performance. However, the
dependent variable (DV)) will be operational performance in particular liquidity and profitability
of selected business firms through the measurement of liquidity and profitability ratios namely:
current ratio and quick ratio for liquidity measurement, as well as profit margin and return on
assets ratios for profitability measurement. In order to understand clearly the DVs, let us have
closer look at liquidity and profitability. Liquidity in the context of working capital management
means having enough cash or ready access to cash to meet all payment obligations when these fall
due, whereas profitability is calculated by establishing relationships between profit figures on the
one hand, and sales or assets on the other hand.
3.3. Research design
Research designs are plans or proposals and procedures for research that span the decisions from
broad assumptions to detailed methods of data collection and analysis (Creswell, 2009).
Regarding to this paper, the descriptive research design will be utilized in order to gather data
relevant to research topic, analysis the data and organize the information so as to reach proper
conclusion; and provide collective picture about the impact of working capital management
techniques on business operational performance. Furthermore, Seyom and Ayalew (1987) agreed
that descriptive survey method of research is more appropriate to gather several kinds of data on a
broad size to achieve the objective of the study. Based on that, the descriptive research design
will be used to describe the nature of the existing circumstances of the research problem.
3.4. Research Approaches

Page | 26
The type of investigation brings to light to determine the research approach in which to follow.
Therefore, the approach of the study will be quantitative particularly inferential quantitative
approach with the probabilistic systematic sampling technique.
3.5. Sample Design
Population sampling is the process of taking a subset of subjects that is representative of the entire
population. The sample must have sufficient size to warrant statistical analysis.
3.5.1. Population
The population is theoretically specified aggregation of research elements; while target population
is the complete group of particular population elements relevant to the research project.
Considering this study, the research population of the paper will be the privately owned businesses,
whereas target population shall be 41 merchandising wholesale companies which exist and operate
in Hargeisa.
3.5.2. Sample Frame
The list which holds the target population under the investigation in which sample size can drawn
is called Sample frame as shown below:
Table 1 Sample Frame
ID Name of the Company Location Type Of License
Sample Size (n), Population (N), K and Random
Start #
Selected Sample Units
46 Mohamed Ibrahim Guled( Daus Company) Hargeisa Wholesale N = 41
79 International Center Compnay Haregisa Whole Sale n = 12
85 Hussein Ahmed Jama(Tayosan Fuel Station)
Hargeisa Whole sale K= 3
100 Star Fuel Station Hargeisa Wholesale RSN(1,41) = 5
135 Ahmed Sulub Warsame Hargeisa Wholesale 1
149 Abdi Ibrahim Ismail( Solar Plane Company)
Hargeisa Whalesale
164 Hawa Sheikh Muse Gabilay Whole sale

Page | 27
200 Abdi Karim Nuur Hassan Hargeisa Whole Sale 2
221 Mohamed Hassan Kaahin(Kaahin F.Station)
Hargeisa Whole sale
231 Awl Ahmed Hussien(Africa Fuel Station) Hargeisa Wholesale
232 Maxamed Xirsi Yousuf(Hamze interprise) Hargeisa Wholesale A 3
239 Mohamed Awnur Mohamed Hargeisa Wholesale
240 Mohamoud Mohamed Kahin(Nasteex0 F.ST)
Hargeisa Wholesale
243 Ubah Mohamed Duale (Degaan Trading &Hotel)
Hargeisa Wholesale 4
253 Mohamed Hussein Ahmed Hargeisa Wholesale
268 Kaiseh Omer Hassan Hargeisa Wholesale
293 Mohamed Ahmed Mohamed (Som.F.st) Hargeisa Wholesale 6
296 Zayid Ali Mohamed Jama(Zayid Style) Hargeisa Wholesale C
306 Kosar Shabel Ali (Xaraf Gas Station) Hargeisa Wholesale
322 Ahmed Saed Farah ( Jabali General Trading Co.)
Hargeisa Wholesale 7
325 Idiris Mohamed Abdallah ( Brothers) Hargeisa Wholesale
328 Faisal Mohamed Ali Samale (Germany Pharmeceuical
Hargeisa Wholesale
340 Abdirashid Dahir Habane Hargeisa Wholesale 8
353 Abdil Karim Aw Adan Hargeisa Wholesale
358 Muhumed Sulub (Tayo Maal Workshop Co.)
Hargeisa Wholesale
370 Faizal H Yousuf Aden ( Liban Petrolium&F.Station)
Hargeisa Wholesale 9
373 Ahmed Nur Mohamed (Barwaqo Fuel Station)
Hargeisa Wholesale
388 Abdikarim Mohamed Adan (Gacanle Fuel Station)
Hargeisa Wholesale
389 Adan Ilmi Abdallah(Mabruk Vegitables) Hargeisa Wholesale 10
390 Ahmed Omer Ali (Googaa Cigale ) Hargeisa Wholesale
391 Mohamed Matan Jama(Commercial Honey Trading)
Hargeisa Wholesale
560 Sacaada General Trading Company Hargeisa Wholesale 11
580 Mohamed Muse Shiraqle (Shiraqleh Fuel Station)
Hargeisa Wholesale
679 Abdirahman Nour Egal( Home of Educational Material and Accessories )
Hargeisa Wholesale
728 Ahmed Sulub Warsame (Sulub Fuel Station)
Hargeisa Wholesale 12
751 Soma Yaman Hargeisa Wholesale
762 Qani Abdi Alin ( Dheeman Tailor and Supermarket)
Hargeisa Wholesale
771 Surad Electric Connection Hargeisa Wholesale
Page | 28
794 Mohamed Hussein Ahmed (National Fuel Station)
Hargeisa Wholesale
818 Star Group of Companies Hargeisa Wholesale
3.5.3. Sample Size
The sample size simply means number of research elements in which the researcher should
communicate in the course of gathering the primary data; the sample size should also possess the
characteristics of efficiency, representativeness, relevance, reliability and flexibility in order to
provide comprehensive snapshot which actually can reflect the real characteristics of entire
population under the question. So it must be selected in a scientific way. However, the rule of
thumb says if the population under given study is less than 1000 take 30% as a sample. In this
context, the target population will be 41 companies which is less than 1000. Therefore, the sample
size of this study has been determined using rule of thumb and it becomes 41*.3= 12 wholesale
businesses exist and operate in Hargeisa city.
3.5.4. Sampling Techniques
After determining sample size from the target population, it is rational to identify sample units
using sampling techniques. Consequently, the sampling technique of the study will be probability
sampling particularly systematic random sampling so as to choose actual, final sampling units to
be contacted in the course of conducting the research especially the primary data collection phase.
3.6. Source of Data
3.6.1. Primary Data
The primary data will be generated from the selected final units or respondents of the sample size
under the examination, which are sampled 12 wholesale companies.
3.6.2. Secondary Data
According to level ten designs (2006) describes secondary research as information gathered
through literature, publication and other reasonable sources. Hence, the secondary data is often
Page | 29
comparatively quite simple and easier to collect than in primary research. In this study; secondary
research draws attention to the collection of information relevant to the topic through literature
review of publication, Books, Journal articles, academic researches and other sensible sources.
3.7. Data Collection Techniques
In this context; the data collection methods are techniques and tools used for gathering primary
data from given issue under study. However, the questionnaire will be data collection method used
as a primary data collection mechanism.
3.8. Data Analysis and presentation
Globally, it is a consensus or widely accepted opinion that the data are not valuable themselves
and fruitful for making transparent and evidence based decisions across each particular situations
under the issue unless the data converted into information in the course of technical analysis.
Therefore, the quantitative data will be synthesized and analyzed by using descriptive type
analysis with the help and utilization of statistical package for social science (SPSS) and excel
spreadsheet. Furthermore, the analytical will be presented in a tabular and chart form along with
interpretation.
3.9. Ethical Consideration
Ethical issue is profoundly critical in doing research and special consideration should be given.
Based on this, many authors had addressed it and proposed several ethical issues to be
concentrated on. For instant, Creswel (2003) states that the researcher has an obligation to respect
Page | 30
the rights, needs, values and desires of the informants. However, the researcher must avoid
disclosure of confidential information, involvement without consent, any form of
misrepresentation and deceiving research participants e.g. concealing the purpose of the research.
The researcher also should respect religion, culture, norms, values and individual behavior and
attitude as well.
Chapter Four: RESULTS AND DISCUSSION AND INTERPRETATION
4.1. Introduction
In this chapter, presents empirical results from quantitative data analysis using
combination of SPSS and excel spread sheet. The chapter covers analysis of
variables of paper and investigates associations between and among them using
selected key working capital ratios including cash convention cycle, accounts
receivable days, inventory days, account payable days to measure independent
variables. Likewise, current ratio and profit margin ratio for measurement
dependent variables, the liquidity and profitability. Total the valid response of
respondents is 16 which corresponding to 84.2% while 3
4.2. Descriptive Statistics
Descriptive analysis shows the mean, and standard deviation of the different
variables of interest in the study. It also presents the minimum and maximum
values of the variables which help in getting a picture about the maximum and
minimum values a variable has achieved. Moreover, the descriptive analysis can
be categorized into three sections; the first section involves general knowledge
and competence of managers in working capital management relative to the
business liquidity and profitability, the section deals with indicators used to
measure variables of the research and the last section emphasizes correlation
between independent and dependent variables.
Page | 31
4.2.1. Demographic statistics of Respondents
The tables below show some basic information of respondents including gender,
marital status, level of education, but this information is not part of research
objectives just as provision of demographic information of sampled population
and as a supporting evidence.
Table 2 Respondent's Gender
Frequency Percent Valid Percent Cumulative Percent
Valid
Male 14 73.7 87.5 87.5
Female 2 10.5 12.5 100.0
Total 16 84.2 100.0
Missing System 3 15.8
Total 19 100.0
Table 3 Marital Status of respondents
Frequency Percent Valid Percent Cumulative Percent
Valid
Single 7 36.8 43.8 43.8
Married 9 47.4 56.3 100.0
Total 16 84.2 100.0
Missing System 3 15.8
Total 19 100.0

Page | 32
Figure 3 Age categories of respondents
Table 4 the position of respondents in their firms (What is your current position in your firm?)
Frequency Percent Valid Percent C.Percent
Valid
Accountant 8 42.1 50.0 50.0
Financial Manager 1 5.3 6.3 56.3
Sales Manager 2 10.5 12.5 68.8
Owner and Manager 5 26.3 31.3 100.0
Total 16 84.2 100.0
Missing System 3 15.8
Total 19 100.0
Page | 33
Figure 4 of respondent’s level Educational
4.2.1. Manager’s Knowledge in Working Capital Management.
As mentioned in first two chapters, working capital is the capital available for conducting the day-
to-day operations of an organization, normally the excess of current assets over current liabilities,
whereas working capital management is the management of all aspects of both current assets and
current liabilities to minimize the risk of insolvency while maximizing the return on assets. So, the
working capital plays the same role in the business as the role of heart in human body. As long as
working capital is as liquidity keeps the business running, managers must aware significance of
working capital management and great emphasis on it in order to undertake profitable operation
and avoid risk of insolence during normal course of business. However, this involves addressing
the extent of manager’s knowledge and wakefulness on working capital management through cash
convention cycle associated with firm’s profitability and liquidity as below illustrated tables and
graphs show.
4.2.1.1. Cash Convention Cycle
Figure 5 Impact of CCC on Liquidity and Profitability against manager’s perceptions
Frequency Percent Valid Percent C. Percent
Valid
Neither one 1 5.3 6.3 6.3
Liquidity only 5 26.3 31.3 37.5
Profitability only 7 36.8 43.8 81.3
Both Profitability and
Liquidity 3 15.8 18.8 100.0
Cash Convention Cycle Management is important for increasing the: a) company's profitability only,
b) company's liquidity only, c) Both (company's Profitability and Liquidity) d) Neither one)
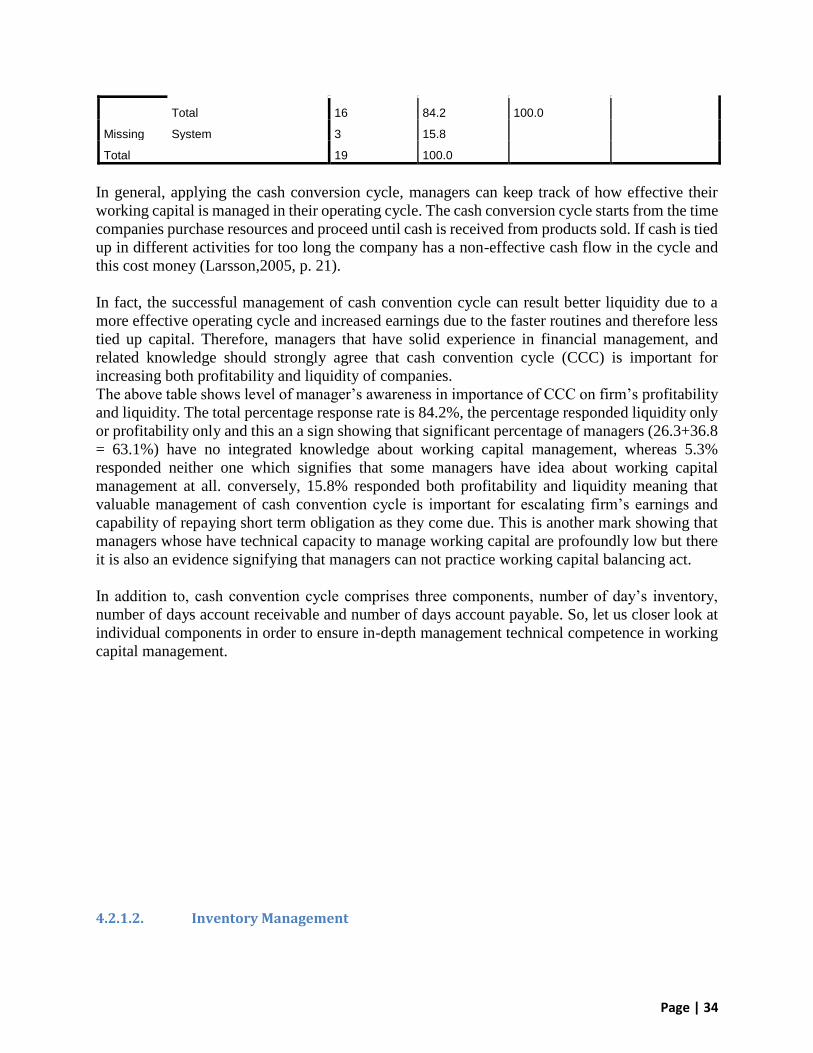
Page | 34
Total 16 84.2 100.0
Missing System 3 15.8
Total 19 100.0
In general, applying the cash conversion cycle, managers can keep track of how effective their
working capital is managed in their operating cycle. The cash conversion cycle starts from the time
companies purchase resources and proceed until cash is received from products sold. If cash is tied
up in different activities for too long the company has a non-effective cash flow in the cycle and
this cost money (Larsson,2005, p. 21).
In fact, the successful management of cash convention cycle can result better liquidity due to a
more effective operating cycle and increased earnings due to the faster routines and therefore less
tied up capital. Therefore, managers that have solid experience in financial management, and
related knowledge should strongly agree that cash convention cycle (CCC) is important for
increasing both profitability and liquidity of companies.
The above table shows level of manager’s awareness in importance of CCC on firm’s profitability
and liquidity. The total percentage response rate is 84.2%, the percentage responded liquidity only
or profitability only and this an a sign showing that significant percentage of managers (26.3+36.8
= 63.1%) have no integrated knowledge about working capital management, whereas 5.3%
responded neither one which signifies that some managers have idea about working capital
management at all. conversely, 15.8% responded both profitability and liquidity meaning that
valuable management of cash convention cycle is important for escalating firm’s earnings and
capability of repaying short term obligation as they come due. This is another mark showing that
managers whose have technical capacity to manage working capital are profoundly low but there
it is also an evidence signifying that managers can not practice working capital balancing act.
In addition to, cash convention cycle comprises three components, number of day’s inventory,
number of days account receivable and number of days account payable. So, let us closer look at
individual components in order to ensure in-depth management technical competence in working
capital management.
4.2.1.2. Inventory Management

Page | 35
Figure 6 impact of inventory management on liquidity and profitability against manager’s insights
The management of inventory is one of the more challenging tasks compared to
all other components in the cycle. So managers pay attention to minimize the
inventory as much as possible in order to shorten the cash conversion cycle and
reduce costs. Regarding above graph, 31.6% answered neither one and they have
no idea concerning with importance of inventory management on company’s
liquidity and profitability, while 36.9% have no integrated knowledge and only
15.8% (those responded both) have technical capacity to deal with this issue.
Nevertheless, inventory involves major working capital investment and therefore
levels need to be very tightly controlled, but this evidence indicates managers not
capable to employ inventory balancing act which is significant to reduce
inventory to the lowest possible level and to ensure sufficient inventory at the
same time.

Page | 36
4.2.1.3. Account Receivable management
Figure 7 impact of Account receivable on liquidity and profitability against manager’s perceptions
Companies depend more or less on their account receivables to finance some if not all of their
payables and they should therefore attempt to reduce their credit time to customers as much as
possible. The credit time runs from the invoice date until the due date of the invoice. The reason
for shortening the credit period is due to the fact that longer credit time to customers includes the
unfavorable effect that it keeps companies from benefiting the capital inflow that they are
expecting from sales. Observing the above graph, the percentage of valid response is 84.2% where
63.1% (26.3% liquidity only +36.8% profitability only =63.1%) have no integrated financial
management knowledge. moreover, this is also signal showing that managers not able to apply
account receivable balancing act which is useful to undertake two opposite tasks (collecting
receivables very quickly as possible and expanding the credit period to customers) at same time.
Besides, only 21.1% (those responded both) have technical capacity. This is low rate indicating
that the most companies are exposing themselves to a higher risk of ending up in an unstable
financial situation and less profitable operations. Further, no one has responded ‘neither one’ that
is way not visible in the graph. More optimistically, if it is boiled down, this can be interpreted
growing accounting receivable management knowledge compared to other components in the
cycle.

Page | 37
4.2.1.4. Account Payable management
Figure 8 impact of Account payable management on liquidity and profitability against manager’s perceptions
Regarding to previous study, the general guidelines for optimizing the managing of account
payables involve the timing of payments. Companies should try prolonging the time of payment
as long as possible as they can use the advantage of their suppliers financing their investments
until payment has been made. Another argument for prolonging the time for payment is that the
producing companies, for example, need some time to convert their purchased raw material into
products they can get sold and get cash in return (Maness and Zietlow, 2005, . 235-238). Based on
that, Account payable management has a great influence to both liquidity and profitability.
Considering the graph above, 42.1% (neither one) of respondents answered that account payable
management has no consequence to entire working capital management; so this can restrict
companies to utilize their supplier’s cheap finance through prolonging the time of payment as
possible until the maturity date on the basis of account payable balancing act, rather they might
pay it very quickly prior to due date which may lead another unfavorable financial situation like
prolonging cash convention cycle, risk of insolvency and bad reputation cash crises manner. in
contrast, 25.5% (15.8% liquidity only +10.5% profitability only = 25.5%) have no integrated
financial management knowledge. on the other hand, only 15.8% (those responded both) have

Page | 38
technical competence and this indicates that the most companies are exposing themselves to a
higher risk of ending up in an unstable financial situation and less profitable operations.
4.2.2. Analysis for measurement indicators
This section involves to measure cash convention cycle and its components so as to be able to
evaluate impact of working capital management on business operational performance. The table
shows variables those have been directly calculated from raw data gathered from sampled
wholesale companies during data collection using the following formulas detailed in chapter three:
Category1: Independent Variables
Cash conversion cycle = Average number of days accounts receivable+ Average number of days
inventory –Average number of days accounts payable
Average number of days inventory = Average inventory /Cost of goods sold x 365
Average number of days accounts receivable = Average accounts receivable/Annual credit Sales
x 365
Average number of days accounts payable = Average accounts payable/Credit purchase x 365
Category2: dependent Variables
Current Ratio = Current Assets/ Current Liabilities and Profit Margin Ratio = Net Profit/ Sales
Table 5 Summary of all Variables of paper
Independent Variables Dependent Variables
Company Names
ACP ICP APP CCC C R P MR ROA
Company001 87 109.6 181 15.6 4.95 0.4405 N/A
Company002 97 69.55 141 25.55 1.63 0.40 N/A
Company003 67 69.3 87 49.3 1.09 0.39 N/A
Company004 121 97 165 53 4.02 0.41 N/A
Company005 150 85 179 56 0.92 0.39 N/A
Company006 75 77.3 94 58.3 1.98 0.35 N/A
Company007 82 84.3 103 63.3 1.05 0.29 N/A
Company008 102 204.3 256 50.3 1.33 0.31 N/A
Company009 216 93 152 157 0.994 0.28 N/A
Company010 105 107.3 53 159.3 0.15 0.25 N/A

Page | 39
Company011 143 105 72 176 0.13 0.23 N/A
Company012 171 107 50 228 0.21 0.20 N/A
Company013 98 150 60 188 0.26 0.31 N/A
Company014 127 75 39 163 0.22 0.38 N/A
Company015 154 142.3 65 231.3 0.19 -0.09 N/A
Company016 93 191 234.61 49.39 1.02 0.41 N/A
Company017 Rejected Rejected Rejected Rejected Rejected Rejected Rejected
Company018 Rejected Rejected Rejected Rejected Rejected Rejected Rejected
Company019 Rejected Rejected Rejected Rejected Rejected Rejected Rejected
Table 1 shows the descriptive statistic of independent and dependent variables for the entire sample
of 19 wholesale companies in which exist and operate in Hargeisa. The first four variables are
measured in the unit of days.
The cash conversion cycle as we use as our independent variable has a mean of 107.71 days. This
explains that it takes in average 107.71 days to convert capital tied up in working capital into cash.
Hence, the mean of all three variables of in the CCC are compatible as the lay between 110.43
days and 120.73. The minimum amount of days it takes for the capital in the cash conversion cycle
to convert into cash is 16 days and the maximum amount of days is 231.
The components of the cash conversion cycle are the following three variables; the number of days
inventory, the number of days accounts receivable and the number of days of accounts payable.
The table shows that minimum number of days account receivable and minimum number of days
inventory are 67 days and 69 days respectively. Even though the minimum number of days it takes
to convert inventories into sales and collects relative account receivable from customers is very
close to each other, the minimum number of days account payable is 39 days and this indicates
that some companies have limited time to repay short term obligations to their suppliers.
Table 6 Descriptive Statistics for all Samples
Cash Convention
Cycle
Average
Collection Period
Inventory
Convention
Period
Average
Payment Period
Current Ratio Profit Margin
Ratio = Net
N Valid 16 16 16 16 16 16
Missing 3 3 3 3 3 3
Mean 107.71 118.00 110.43 120.73 1.25900 .30941
Std. Deviation 75.023 40.038 41.203 67.945 1.391614 .128537
Minimum 16 67 69 39 .130 -.090
Maximum 231 216 204 256 4.950 .441

Page | 40
Studying the maximum number of days, these are not as compatible for the three variables as the
minimum number of days. The number of day’s accounts payable has the highest maximum with
256 days followed by the number of days account receivable that has a maximum of 116 days. The
number of day’s inventory has the lowest maximum with 104 days. Observing the mean in the
table, the number of day’s accounts receivable has a mean of 118 days and the number of days
accounts payable has a mean on 120.73 days. That fact that these variables have values close to
each other is remarkable as their maximum number of days differs greatly between them as one of
them has the second lowest maximum and the other one the highest. The mean for the number of
day’s inventory is 110.43 days.
The profitability, given by net profit/ sales is measured in the unit of percent and for our sample
the maximum profitability is 44.1%, a minimum of -9 % and a mean of 30.9%. This shows that
the sampled companies conduct printable operations on average, but some of them are running
with los instead of generating profit.
Regarding to current ratio, order to manage current liabilities with enough current assets the level
of the ratio should stay above 1 which both the mean and the maximum are for this sample. The
mean stays on a level above one which is 1.259, while the maximum comes up around 4.950 which
signifies that the current assets are approximately five times greater than the current liabilities.
However, the current ratio has a minimum of 0.130 in which designates that some companies not
capable to pay current liabilities as they come due which can result risk of insolvent.
4.2.3. Correlations
4.2.3.1. Relationship between CCC and Profitability
Figure 9 correlation between CCC and Profitability

Page | 41
This graph shows the correlation between cash convention cycle (CCC) and profitability. In this paper,
The CCC has been taken as independent variable, whereas profitability measured by Profit margin ratio
has been considered as dependent variable. From the graph, the company001 and company002 have
lowest cash conventions cycles which are 15.6 days and 25.55 days correspondingly with the highest
profitability of 44% and 40% in that order. On the contrary, company012 and company015 have CCC of
228 days 231 days respectively with lowest profitability of 20% and -9% respectively.
Thus, as the cash convention cycle rises, the profitability of companies continues to decrease and
opposite is true. The exception of company014 and company013 showed slightly opposite pattern and
this can be caused by the effect of other variables assumed as consistent. Therefore, the cash convention
cycle and profitability have negative relationship which supporting the work of Lazaridis and Tryfonidis
(2006) investigate the relationship between working capital management and company’s profitability
measured by gross operating profit on 131companies listed in the Athens Stock Exchange for the period
from 2001 to 2004. Regression result shows the negative relationship between cash conversion cycle and
profitability.
4.2.3.2. Account receivable and Firm’s Profitability
Regarding the components of cash convention cycle as a substitute in the equation, the number of day’s
accounts payables, number of days accounts receivable and number of day’s inventories for cash conversion
cycle. Observing the below illustrated graph, although there is considerable variation in trends of the two
variables, the most companies that have lower average collection period are the most profitable. Based this
trends and with the light of association of CCC with firm’s profitability, the number of days account
receivable has significant negative relationship with the gross operation profit. This significant negative
relationship between gross operating profit and number of day’s accounts receivables is demonstrated that
companies can increase their profitability by decreasing credit term giving to their customers.

Page | 42
Figure 10 correlation of average collection period with profit margin ratio
4.2.3.3. Account Payable and Inventory against Profit Margin Ratio
There is positive relationship between gross operating profit and number of days accounts payable as a
company delays its payment which affects the higher level of working capital and use to increase its
profitability which less-profit companies can make use of this to delay their payment. In addition to, the
number of days account payable also affects the length of cash convention cycle which significant negative
association with company’s profitability. At last, the researchers found the negative relationship between
number of days inventories and gross operating profit.
4.2.3.4. Relationship between CCC and Liquidity
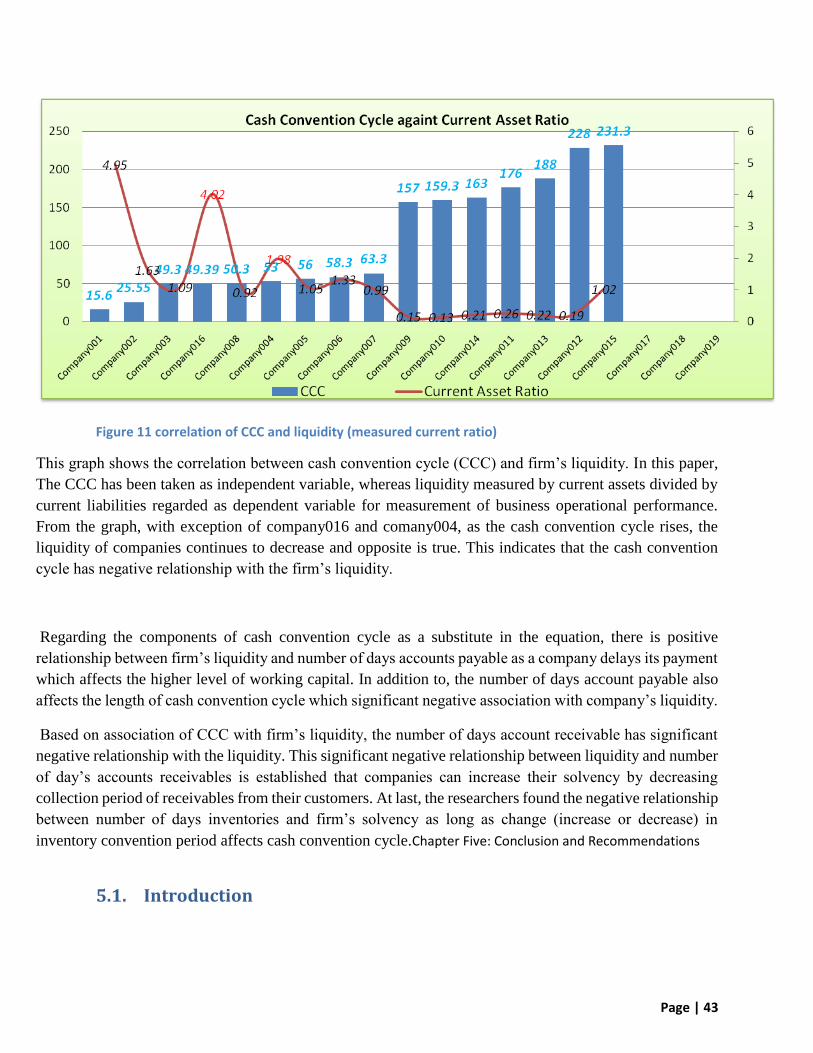
Page | 43
Figure 11 correlation of CCC and liquidity (measured current ratio)
This graph shows the correlation between cash convention cycle (CCC) and firm’s liquidity. In this paper,
The CCC has been taken as independent variable, whereas liquidity measured by current assets divided by
current liabilities regarded as dependent variable for measurement of business operational performance.
From the graph, with exception of company016 and comany004, as the cash convention cycle rises, the
liquidity of companies continues to decrease and opposite is true. This indicates that the cash convention
cycle has negative relationship with the firm’s liquidity.
Regarding the components of cash convention cycle as a substitute in the equation, there is positive
relationship between firm’s liquidity and number of days accounts payable as a company delays its payment
which affects the higher level of working capital. In addition to, the number of days account payable also
affects the length of cash convention cycle which significant negative association with company’s liquidity.
Based on association of CCC with firm’s liquidity, the number of days account receivable has significant
negative relationship with the liquidity. This significant negative relationship between liquidity and number
of day’s accounts receivables is established that companies can increase their solvency by decreasing
collection period of receivables from their customers. At last, the researchers found the negative relationship
between number of days inventories and firm’s solvency as long as change (increase or decrease) in
inventory convention period affects cash convention cycle.Chapter Five: Conclusion and Recommendations
5.1. Introduction
Page | 44
This chapter presents conclusion drawn from the analysis of empirical results in conformity with
research objectives mentioned in chapter one and come up recommendations
5.2. Conclusion
In the management of the company, it is important to take both profitability and liquidity into
consideration because even profitable companies might sometimes face cash flow problem.
Company’s liquidity ties up in working capital which comprises current assets and current
liabilities. Working capital plays a vital role in the company’s operations and requires the efficient
management. The management of working capital concerns the management of cash, inventories,
accounts receivable and accounts payable. It is necessary for a company to monitor its working
capital properly and maintain its balance at the appropriate level. Shortage of working capital may
lead to lack of liquidity as well as loss of production and sales; on the contrary, excess balance of
working capital could be seen as loss of investment opportunities, so integrated management is
needed through maintaining trade-off between liquidity and profitability.
The purpose of this study is all about to investigate the impact of working capital management on
business operational performance. if it is recall the variables of the paper, the cash convention
cycle plus its three components (Average collection period, Inventory convention period and
Average payment period in days) have been taken as an independent variables to measure working
capital management and associate with the outcome variables; the profitability and liquidity ratios
have been taken as outcome variables and as a measure of firm’s performance. What is more, the
quantitative method has been used as our research approach to examine the relationship between
these variables.
5.2.1. Correlation of Cash convention Cycle with Profitability and Liquidity
The empirical findings showed as the cash convention cycle (CCC) rises; the profitability of
companies continues to decrease and reverse is true, which means the companies with low CCC
are the most profitable and opposite is correct. The conclusion of this fact is that the cash
convention cycle has negative correlation with the firm’s profitability.
Regarding to correlation between cash convention cycle (CCC) and firm’s liquidity (measured
current Ratio. Empirical findings indicated that the cash convention cycle has negative relationship
with the firm’s liquidity meaning that the companies with low CCC are capable to meet their
payment obligations as these fall due. In contrast, Firms with high CCC are at risk of insolvency.
5.2.2. Components in Cash Convention Cycle against Liquidity and Profitability

Page | 45
As mentioned earlier, the CCC contains three sub components, the number of days account
receivable, number of days inventory and number of days account payable. Let us have closer look
at their individual correlation with Company’s profitability and liquidity:
The number of days account receivable has significant negative relationship with firm’s liquidity.
Similarly, the number of days account receivable has negative correlation with the gross operation
profit. This negative relationship between gross operating profit and number of day’s accounts
receivables is demonstrated that companies can increase their profitability by decreasing credit
term giving to their customers.
There is positive relationship between gross operating profit and number of days accounts payable
as a company delays its payment which affects the higher level of working capital and use to
increase its profitability which less-profit companies can make use of this to delay their payment.
In addition to, the number of days account payable also affects the length of cash convention cycle
which significant negative association with company’s profitability. Likewise, the number of days
account payable has positive correlation with liquidity. At last, the researchers found the negative
relationship between number of days inventories and gross operating profit. Likewise, the number
of days inventory has negative association with company’s liquidity but is not strong.
5.2.3. Manager’s Knowledge and competence level in Working Capital
Management
In fact, the successful and integrated management of working capital management can result better
liquidity due to the more effective operating cycle and increase earnings due to the faster routines
and less tied up capital as well. As the table3 in chapter four shows, the respondents were all
managers, sector managers and accountants. However, the analysis of empirical results showed
that the companies’ managers have extremely very low competence in working capital
management. Companies’ managers can be classified into three classes based knowledge and
technical capacity. The first class has no working capital management idea at all; the second class
has no integrated financial management knowledge and last class which is comparatively the
lowest proportion has knowledge and technical capacity to some extent. In addition to, the first
two groups can’t apply proper working capital management in conformity with financial
management principles. However, there is doubt that even last the group not better able to practice
working balancing act which is profoundly significant to minimize risk of insolvency and
maximize return.
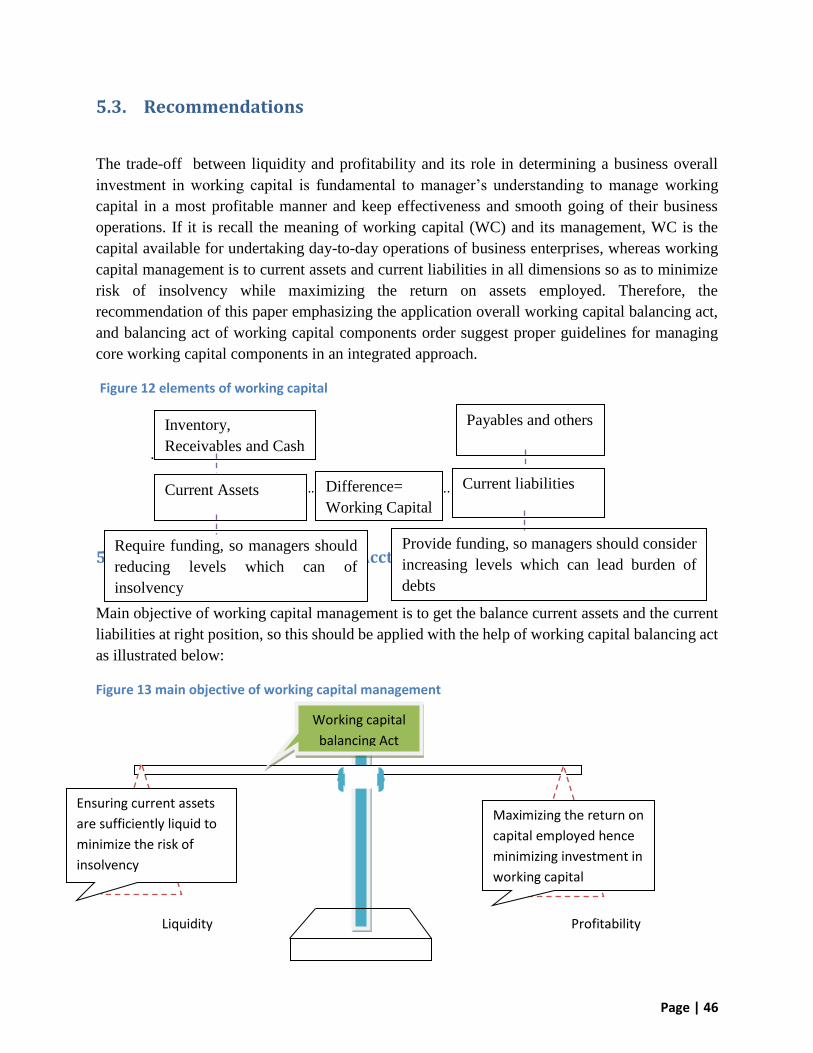
Page | 46
5.3. Recommendations
The trade-off between liquidity and profitability and its role in determining a business overall
investment in working capital is fundamental to manager’s understanding to manage working
capital in a most profitable manner and keep effectiveness and smooth going of their business
operations. If it is recall the meaning of working capital (WC) and its management, WC is the
capital available for undertaking day-to-day operations of business enterprises, whereas working
capital management is to current assets and current liabilities in all dimensions so as to minimize
risk of insolvency while maximizing the return on assets employed. Therefore, the
recommendation of this paper emphasizing the application overall working capital balancing act,
and balancing act of working capital components order suggest proper guidelines for managing
core working capital components in an integrated approach.
Figure 12 elements of working capital
.
…………… … …………………………..
5.3.1. Working Capital Balancing Acct
Main objective of working capital management is to get the balance current assets and the current
liabilities at right position, so this should be applied with the help of working capital balancing act
as illustrated below:
Figure 13 main objective of working capital management
Liquidity Profitability
Inventory,
Receivables and Cash
Require funding, so managers should
reducing levels which can of
insolvency
Current Assets Difference=
Working Capital
Payables and others
Provide funding, so managers should consider
increasing levels which can lead burden of
debts
Current liabilities
Working capital
balancing Act
Ensuring current assets
are sufficiently liquid to
minimize the risk of
insolvency
Maximizing the return on
capital employed hence
minimizing investment in
working capital
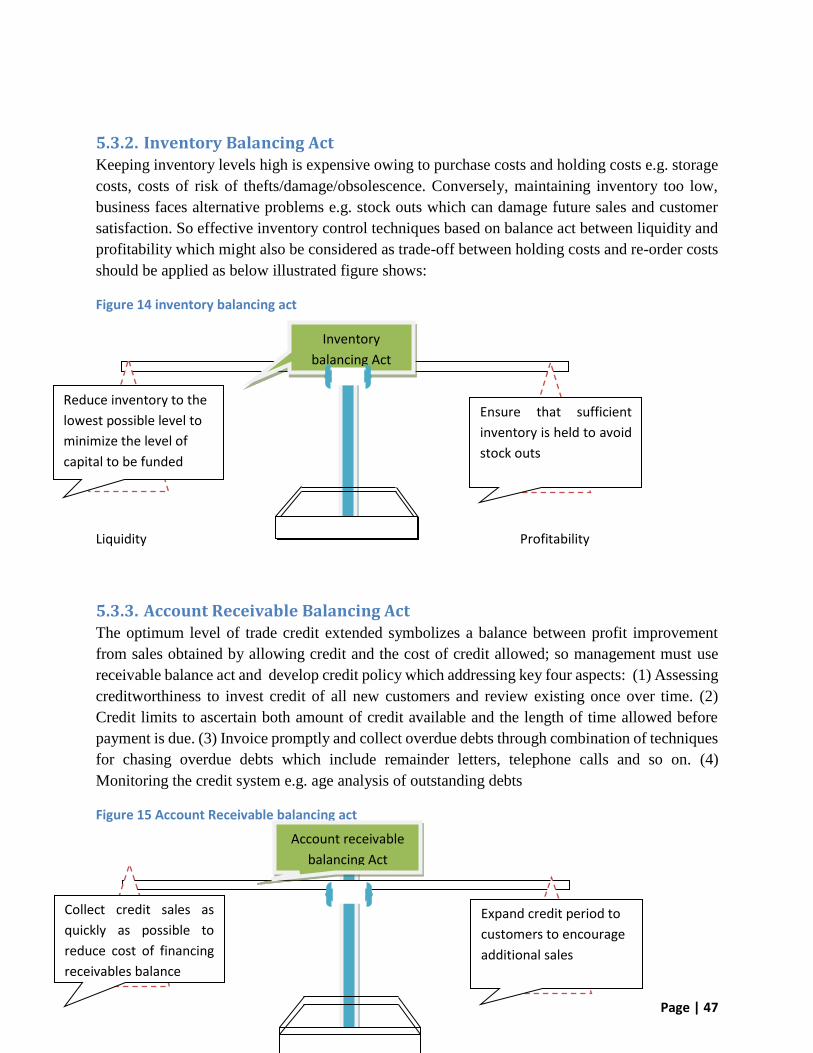
Page | 47
5.3.2. Inventory Balancing Act Keeping inventory levels high is expensive owing to purchase costs and holding costs e.g. storage
costs, costs of risk of thefts/damage/obsolescence. Conversely, maintaining inventory too low,
business faces alternative problems e.g. stock outs which can damage future sales and customer
satisfaction. So effective inventory control techniques based on balance act between liquidity and
profitability which might also be considered as trade-off between holding costs and re-order costs
should be applied as below illustrated figure shows:
Figure 14 inventory balancing act
Liquidity Profitability
Liquidity Profitability
5.3.3. Account Receivable Balancing Act The optimum level of trade credit extended symbolizes a balance between profit improvement
from sales obtained by allowing credit and the cost of credit allowed; so management must use
receivable balance act and develop credit policy which addressing key four aspects: (1) Assessing
creditworthiness to invest credit of all new customers and review existing once over time. (2)
Credit limits to ascertain both amount of credit available and the length of time allowed before
payment is due. (3) Invoice promptly and collect overdue debts through combination of techniques
for chasing overdue debts which include remainder letters, telephone calls and so on. (4)
Monitoring the credit system e.g. age analysis of outstanding debts
Figure 15 Account Receivable balancing act
Inventory
balancing Act
Reduce inventory to the
lowest possible level to
minimize the level of
capital to be funded
Ensure that sufficient
inventory is held to avoid
stock outs
Account receivable
balancing Act
Collect credit sales as
quickly as possible to
reduce cost of financing
receivables balance
Expand credit period to
customers to encourage
additional sales

Page | 48
Liquidity Profitability
5.3.4. Account Payable Balancing Act
The trade payable is the simplest and most importance source of short-term finance for many companies.
So companies should practice balancing act between liquidity and profitability as shown below:
Figure 16 Account Payable balancing act
Liquidity Profitability
6.0. Reference
REFFERENCE
Account payable
balancing Act
Delay payments to
suppliers to utilize a
‘free’ source of finance
Delay too long may cause
difficulties for the
company in the long-
term
Management should
Delay payments to
suppliers to obtain a
‘’free’’ source of finance
Delaying too long may
cause burden for the
business in the long run
and it should be avoided
Page | 49
Baveld, M. B. (2012). ‘Impact of Working Capital Management. Netherlands: University of
Twente.
Finau, F. K. (2011). Impact of working capital management Dynamics on performance of Tongan
Interprises in New Zealand. New Zealand: Unitec Institute of Technology .
Mengesha, W. (2014). Impact of working capital management on firms performance. Addis
Ababa, Ethiopia: Jimma University College of Business and Economics.
Mwangi, L. W. (2014 ). Effects of Working Capital Management on Performanc. European
Journal of Business and Management , 195-200.
R.M.S. Bandara. (2015). Impact of Working Capital Management Policy on. Global Journal of
Contemporary Research in Accounting, Auditing and Business Ethics (GJCRA) , (2311-3162).
Subramanian, C. P. (2009). New Age Financial Management. New age international limited
publishers.
T.Subramanian, C. a. (2009). Financial Management. New Delhi: New age international limited
Publishers.
Appendix 1 Questionnaires
Section A
1. What is your position in the firm? -----------------------------------------------------------------------
2. How many years of experience do you have in your current position? -------------------------
3. Which industry does your company operates in?
a) Retail
b) Wholesale
c) Manufacturing
d) Finance
e) Other __________ (please specify)
Section B

Page | 50
Please indicate the extent of your agreement or disagreement with the following statements by
ticking one of the boxes from (1) to (5) where 1 = strongly disagree 2 = Disagree 3 = neither
agree or disagree 4 = agree 5 = strongly agree
4. Management of inventory is important for increasing the following:
a) Company’s profitability only
1 2 3 4 5
b) Company’s Liquidity only
1 2 3 4 5
c) both liquidity & profitability
1 2 3 4 5
d) Neither profitability nor liquidity
1 2 3 4 5
5. Management of accounts receivable is significant for increasing the following:
a) Company’s profitability only
1 2 3 4 5
b) Company’s Liquidity only
1 2 3 4 5
c) both liquidity & profitability
1 2 3 4 5
d) Neither profitability nor liquidity
1 2 3 4 5
6. Management of accounts payable is significant for increasing the followings:
Page | 51
a) Company’s profitability only
1 2 3 4 5
b) Company’s Liquidity only
1 2 3 4 5
c) both liquidity & profitability
1 2 3 4 5
d) Neither profitability nor liquidity
1 2 3 4 5
7. Management of cash conversion cycle is important for increasing the followings
a) Company’s profitability only
1 2 3 4 5
b) Company’s Liquidity only
1 2 3 4 5
c) both liquidity & profitability
1 2 3 4 5
d) Neither profitability nor liquidity
1 2 3 4 5
Section C
8. Does your company purchase inventory from your suppliers on account/credit?
Yes
No
9. What is the annual credit purchase of your company (please select the applicable range
from given options or specify your own figure)?
a) $ 10,0000 and less
b) $ 11,000-20,000
c) $ 21,000-30,000
d) $ 31,000-40,000
e) $ 50,000 and above

Page | 52
f) Other (please specify) $ ----------------------
10. On average, what is the beginning account payable and ending account payable balance
in accounting period?
Beginning account Payable balance Ending account payable balance
$----------------------------------------------
$--------------------------------------------------
11. Please tell us the beginning and ending balance of the following accounts?
Account names Beginning balance Ending balance
inventory
$-----------------------------------------
$----------------------------------------
Account receivable
$------------------------------------------
$------------------------------------------
Cost of goods sold $-------------------------------------
$ ------------------------------------------
Current assets Not needed
$ ----------------------------------------
Current liability Not needed $-----------------------------------------
12. Please tell us the annual credit sales of your company (please select the applicable range
from given options or specify your own figure)?
g) $ 20,0000 and less
h) $ 21,000-40,000
i) $ 41,000-60,000
j) $ 61,000-80,000
k) $ 90,000 and above
l) Other (please specify) $ ----------------------
13. On average, please tell the annual cash sales of your company? please
m) $ 30,0000 and less
n) $ 31,000-60,000
o) $ 61,000-90,000
p) $ 91,000-120,000
q) $ 100,000 and above
r) Other (please specify) $ ----------------------
THANK YOU FOR YOUR SUPPORT

Page | 53

Page | 54