Embed Size (px)
Citation preview

School of Civil Engineering
Sydney NSW 2006
AUSTRALIA
http://www.civil.usyd.edu.au/
Centre for Advanced Structural Engineering
Structural Modelling of Support Scaffold
Systems
Research Report No R896
Tayakorn Chandrangsu BSc MSc
Kim JR Rasmussen MScEng PhD
June 2009
ISSN 1833-2781

School of Civil Engineering
Centre for Advanced Structural Engineering
http://www.civil.usyd.edu.au/
Structural Modelling of Support Scaffold Systems
Research Report No R896
Tayakorn Chandrangsu, BSc, MSc
Kim JR Rasmussen, MScEng, PhD
June 2009
Abstract:
In this report, accurate three-dimensional advanced analysis models are developed to capture
the behaviour of support scaffold systems, as observed in full-scale subassembly tests
consisting of three-by-three bay scaffold systems with combinations of various lift heights,
number of lifts and jack extensions. The paper proposes methods for modelling spigot joints,
semi-rigid upright-to-beam connections and base plate eccentricities. Material nonlinearity is
taken into account in the models based on the Ramberg-Osgood expression fitted to available
experimental data. Actual initial geometric imperfections including member out-of-
straightness and storey out-of-plumb are also incorporated in the models. The ultimate loads
from the nonlinear analyses were calibrated against failure loads and load-deflection
responses obtained from full-scale subassembly tests. The numerical results show very good
agreement with tests, indicating that it is possible to accurately predict the behaviour and
strength of highly complex support scaffold systems using material and geometric nonlinear
analysis. The report is a milestone in the ongoing development of a design methodology for
support scaffold systems based on advanced analysis currently undertaken at the University
of Sydney.
Keywords: Advanced analysis, Formwork subassemblies, Support scaffold systems, Steel scaffolds,
Falsework, Subassembly tests, Structural models, Calibrations

Structural Modelling of Support Scaffold Systems June 2009
School of Civil Engineering Research Report No R896
2
Copyright Notice
School of Civil Engineering, Research Report R896
Structural Modelling of Support Scaffold Systems
© 2009 Tayakorn Chandrangsu and Kim JR Rasmussen
[email protected] and [email protected]
ISSN 1833-2781
This publication may be redistributed freely in its entirety and in its original
form without the consent of the copyright owner.
Use of material contained in this publication in any other published works must
be appropriately referenced, and, if necessary, permission sought from the
author.
Published by:
School of Civil Engineering
The University of Sydney
Sydney NSW 2006
AUSTRALIA
June 2009
This report and other Research Reports published by the School of Civil
Engineering are available on the Internet:
http://www.civil.usyd.edu.au

Structural Modelling of Support Scaffold Systems June 2009
School of Civil Engineering Research Report No R896
3
Table of Contents
1. Introduction.......................................................................................................5
1.1 Scaffold Systems.........................................................................................5
1.2 Advanced Analysis .....................................................................................6
1.3 Previous Scaffold Models ...........................................................................7
2. Full-Scale Subassembly Tests.........................................................................10
2.1 Test Setup and Procedures ........................................................................10
2.2 Test Configurations...................................................................................12
2.3 Test Results ...............................................................................................15
3. Finite Element Models ....................................................................................17
3.1 Spigot Joints..............................................................................................17
3.2 Semi-Rigid Standard-to-Ledger Connections...........................................18
3.3 Brace Connections ....................................................................................19
3.4 Base Plate Eccentricity .............................................................................20
3.5 Load Eccentricity ......................................................................................20
3.6 Geometric Imperfections ..........................................................................20
3.7 Geometric and Material Nonlinearities.....................................................21
3.8 Calibrations ...............................................................................................25
4. Discussion .......................................................................................................35
5. Conclusions.....................................................................................................36
Acknowledgement ..............................................................................................36
References ...........................................................................................................36

Structural Modelling of Support Scaffold Systems June 2009
School of Civil Engineering Research Report No R896
4

Structural Modelling of Support Scaffold Systems June 2009
School of Civil Engineering Research Report No R896
5
1. Introduction
1.1 Scaffold Systems
Scaffolds are temporary structures commonly used in construction to support various types of
loads. The vertical loads on scaffold can be from labourers, construction equipment,
formworks, and construction materials. Commonly, scaffolds must also be designed to
withstand lateral loads, including wind loads, impact loads, and earthquake loads. Depending
on their use, scaffolds may be categorised as access scaffolds or support scaffolds. Access
scaffolds are used to support light to moderate loads from labourers, small construction
material and equipment for safe working space. They are usually attached to buildings with
ties and only one bay wide. Support scaffolds, also sometimes called falsework, are subjected
to heavy loads, for example, concrete weight in the formwork. Support scaffolds are the main
focus in this research. An example of a support scaffold system is shown in Figure 1. Support
scaffolds normally consist of standards (vertical members), ledgers (horizontal members),
and braces. The scaffold standards are connected to each other to create a lift via couplers,
also known as spigot joints (Figure 2). In order to connect ledgers to standards, wedge-type
or Cuplok joints (Figure 3) are usually preferred for the connection because no bolting or
welding is required; though, in some systems manually adjusted pin-jointed couplers are still
being used. The connections for diagonal brace members are usually made of hooks for easy
assembling. The base of scaffolds consists of threaded adjustable jacks, which can be
extended up to typically 600 mm by a wing nut to accommodate irregularity of the ground.
The top of scaffolds consists of threaded adjustable jacks with U-heads which support timber
bearers and ensure the levelling of the formwork.
Figure 1: Typical support scaffold

Structural Modelling of Support Scaffold Systems June 2009
School of Civil Engineering Research Report No R896
6
Figure 2: Schematic of spigot joint
Top cup
Bottom cup
Standard
Ledger
Ledger blade
3
1
2
Locking pin
Figure 3: Schematic of Cuplok joint
1.2 Advanced Analysis
With the ready availability of powerful computers and sophisticated structural analysis
software packages, geometric and material nonlinear structural analysis has become feasible
and practical. Nonlinear analysis allows researchers and practitioners to more accurately
predict the failure load and deformation of scaffold systems. Advanced analysis involves the
modelling of changes of the geometry of structures as a result of loading and inelastic
material behaviour. In the research by Gylltoft and Mroz [1], a three-dimensional geometric
and material nonlinear finite element model was verified against the results of a full scale test
scaffold. The model was further applied to determine the ultimate load of a typical access
scaffold considering various configurations and load combinations.
However, in many cases research on scaffold systems has focused on elastic nonlinear
geometric modelling associated with second-order effects. For example, elastic geometric
nonlinear analyses were reported by Peng et al. [2], Prabhakaran et al. [3], Yu et al. [4], Chu
et al. [5], and Weesner and Jones [6]. Geometric nonlinear analysis is also a common practice
in design offices, whereas the use of inelastic analysis is still rare. Nevertheless, with accurate
finite element model, advanced analysis method can usually fulfil the design requirement
with no tedious separate member capacity checks.
Top Standard
Bottom Standard
Spigot Insert

Structural Modelling of Support Scaffold Systems June 2009
School of Civil Engineering Research Report No R896
7
AS4100 [7] allows the application of advanced analysis for the design of steel frames in
which the members are of compact cross-section with full lateral restraint, thus preventing
local buckling and flexural-torsional buckling. Advanced analysis models should include
related material properties, residual stresses, instability effects, initial geometric
imperfections, actual connection behaviour, construction methods, and interaction with the
foundations [8]. In the research described herein, three-dimensional advanced structural
analysis models are proposed in order to develop a new design methodology for support
scaffold systems.
1.3 Previous Scaffold Models
By means of available commercial finite element softwares such as ANSYS [9], LUSAS
[10], and NIDA [11], many new studies on scaffold behaviour were carried out through three-
dimensional models such as those presented by Prabhakaran et al. [3], Milojkovic et al. [12],
and Godley and Beale [13]. Three-dimensional structural analysis is beneficial in describing
complex failure modes such as those observed when the combined effects of in-plane and
out-of-plane bending are present. Some past models proposed by Huang et al. [14], and Peng
et al. [15] were created in two dimensions for simplicity and computational efficiency.
Two types of geometrical imperfections are typically required to be considered in an
advanced analysis for steel framed systems to capture the second-order effects: the initial
member out-of-straightness of the standard and the initial story out-of-plumb of the frame.
There are many ways of taking geometric imperfection effects into account. Three methods
of modelling imperfections were trialled in [16], including the scaling of eigenbuckling
modes (EBM), the application of notional horizontal forces (NHF), and the direct modelling
of initial geometric imperfections (IGI). EBM was performed by carrying out an
eigenbuckling analysis on the structural model, and then scaling and superimposing the
lowest eigenmode onto the perfect geometry to create an initial imperfect structural frame for
the second-order structural analysis. In the NHF approach, additional lateral point loads were
applied at the top of each column in one direction of the frame and initial member out-of-
straightness could be represented by lateral distributed forces along each member. The IGI
method consisted of applying an initial sway of the frame and an out-of-straightness to each
column in the frame.
For scaffold systems, these same approaches can be applied to model the effects of initial
imperfections in the analysis. For example, Yu et al. [4] and Chu et al. [5] integrated EBM
with the magnitude of the column out-of-straightness of 0.001 of the height of the scaffold
units into the model. Moreover, Yu and Chung [17] investigated a method called critical load
approach where initial imperfections were integrated directly into a Perry-Robertson
interaction formula to determine the failure loads of the scaffolds in the analysis. In other
research on scaffold systems by Peng et al. [2], the NHF approach was incorporated in the
model by applying a horizontal notional force of 0.1% to 0.5% of the vertical loads at mid-
height of the scaffold lift. Godley and Beale [18] adopted an IGI approach by imposing a
sinusoidal bow to the members and angular out-of-plumb to the frame. In each of these
approaches, careful calibration against test results or numerical reference values is required.
Scaffold joints are complex in nature due to need for rapid assembly and reassembly in
construction. The Cuplok connections behave as semi-rigid joints, and show looseness with
small rotational stiffness at the beginning of loading. Once the joints lock into place under
applied load, the joints become stiffer [13]. Wedge-type joints are generally more flexible
and closer to pinned connections. They also often display substantial looseness at small
rotations [18]. Figure 4 shows typical moment-rotation curves for cuplock [13] and wedge-
type [18] joints. As to spigot joints, the spigot can create out-of-straightness of the standards,

Structural Modelling of Support Scaffold Systems June 2009
School of Civil Engineering Research Report No R896
8
and the possibility of the joint to open up due to the gap between the standard and the spigot
can produce complexity in modelling [19]. Moreover, the modelling of boundary conditions
of scaffold systems is crucial because the top and bottom restraints can significantly influence
the stability and strength of the system [20].
In recent research by Peng et al. [2], analysis models of wedge-type jointed, 3-storey, 3-bay,
and 5-row scaffold system were presented. Experimental tests on scaffold joints showed that
the joint stiffness varied between 4.903 kNm/rad (50 ton cm/rad) and 8.826 kNm/rad (90 ton
cm/rad) with the average of 6.865 kNm/rad (70 ton cm/rad) being adopted for all joints into
their model.
Godley and Beale [18] found that scaffold connections are frequently made of wedge-type
joints, for which the joint stiffness exhibits different response under clockwise and counter-
clockwise rotations, and occasionally exhibits looseness in connections with low stiffness.
Consequently, Prabhakaran et al. [3] modified the stiffness matrix for the end points of the
beam to include connection flexibility, using a piecewise linear curve to model the moment-
rotation response.
0.0
0.5
1.0
1.5
2.0
2.5
3.0
3.5
0.00 0.05 0.10 0.15 0.20
Rotation (radian)
Mo
men
t (k
Nm
)
Cuplok joint
Wedge-type joint
Figure 4: Typical moment-rotation curves for Cuplok and wedge-type joints
Yu [20] studied the effects of boundary conditions of scaffold systems, and categorised them
into four cases, i.e. Pinned-Fixed, Pinned-Pinned, Free-Fixed, and Free-Pinned, with the first
term being the translational restraint at the top of the scaffold, and the second term being the
rotational restraint at the base of the scaffold. In all analyses, the rotation at the top was
assumed to be free. These conditions were incorporated into the models of one bay of one-
storey modular steel scaffolds (MSS1), and two-storey modular steel scaffolds (MSS2). Yu
found that for MSS1 the failure loads for Free-Fixed and Pinned-Pinned conditions are
reasonably close to test results; however, for MSS2 the model results are considerably higher
than the test results. Subsequently, Yu suggested that since the top of the scaffolds normally
has lateral restraints then joints at the top can be modelled as translational springs, and for the
bottom rotational spring can be applied. A stiffness of 100 kN/m for the top translational
spring and stiffness of 100 kNm/rad for the bottom rotational spring gave comparable results
to the tests.

Structural Modelling of Support Scaffold Systems June 2009
School of Civil Engineering Research Report No R896
9
Chu et al. [5] studied single storey double bay scaffolds. In the presence of restraints on the
loading beam and the jack bases, the top and base were modelled with various boundary
conditions, and the scaffold connections were assumed to be rigid. The researchers found that
both Pinned-Pinned and Pinned-Fixed conditions gave higher load carrying capacities than
the experimental results; on the other hand, the Free-Fixed condition gave satisfactory result
compared to the tests. Research on the stability of single storey scaffold systems by Vaux et
al. [21] found that when Cuplok connections are represented by pin joints, and the
connections of the top and bottom jacks to the standards are assumed as rigid with the top-
bottom boundary conditions taken as Pinned-Pinned, good agreement can be achieved
between numerical and experimental failure loads.
Weesner and Jones [6] studied the load carrying capacity of three-storey scaffolds assuming
rigid joints between the stories, and pin joints for the top and the bottom boundary conditions.
The results of their elastic buckling analysis were higher than the test values with the
percentage differences ranging from 6% to 17%. In the analysis of large access scaffold
systems by Godley and Beale [18], cantilever arm tests were carried out on scaffold wedge-
type joints. The nonlinear moment-rotation curve from the tests showed joint looseness and
different values of rotational stiffness under positive (counter-clockwise) rotation and
negative (clockwise) rotation. The authors suggested the use of a multi-linear or nonlinear
moment-rotation curve for scaffold joint modelling.
In the work by Enright et al. [19], the modelling of spigot joints was studied for the stability
analysis of scaffold systems. The spigot insert (Figure 2) was considered to have bending
resistance, but not to transmit axial load; therefore, the model adopted two vertical members
connected by pin joints representing the standards, and on the side, the entirely rigid spigot
member was connected at the top, centre, and bottom to the standard via short and axially
stiff members capable of transferring only lateral forces, as shown in Figure 5. Due to the
axial load in the standards, the spigot would be in bending, and the amount of bending would
depend on the amount of axial load and the degree of out of straightness. From research of
Harung et al. [22], it was found that if the spigot joints are modelled as fully continuous
joints, the analysis would overestimate the load carrying capacity of the system.
Figure 5: Spigot joint model
Milojkovic et al. [23] studied eccentricity in the modelling of scaffold connections. Given
that the neutral axes of the connections were offset by 50 mm, the authors modelled the
eccentric joint with a finite spring of length equal to the eccentricity of 50 mm. The spring
Axial load
Standards Spigot
Pin joint

Structural Modelling of Support Scaffold Systems June 2009
School of Civil Engineering Research Report No R896
10
had specific rotational stiffness, and was assumed to be axially stiff. The authors concluded
that for large frames, unless torsion failure occurs, then the effects of joint eccentricity are
insignificant. In the scaffold study by Gylltoft and Mroz [1] the braces were represented as
truss members with pinned joints connected to the standards, and the connections between
other members were modelled as short finite elements with nonlinear stiffness in all
directions. To model the shores of the scaffold system, Peng et al. [15] applied rigid links
with pinned supports at both ends, given that actual shores were connected loosely by nails at
the top and bottom.
2. Full-Scale Subassembly Tests
2.1 Test Setup and Procedures
A total of 18 support scaffold subassembly tests were conducted at the University of Sydney
in 2006 [24] to study the behaviour and ultimate load-carrying capacities of such systems. In
all tests, the formwork subassembly, also known as Cuplok scaffold system, was constructed
as a grid frame of three-by-three bays with a constant nominal bay width of 1829 mm in both
directions. The first fourteen tests were systems of three lifts with equal nominal lift height of
1.5 m. The systems featured different bracing arrangements (full, none, perimeter, core, and
North-South direction only) and different jack extension heights (300 mm or 600 mm) at both
top and bottom. In the last four subassembly tests, systems with 1 m and 2 m lift heights with
full bracing were tested with the variation in the number of lifts from 2 to 4 and jack
extension heights of 300 mm or 600 mm.
All testing components were taken from stocks of used material. As a result, the testing
materials showed some geometric imperfections representing those encountered in practice,
particularly in regard to the out-of-straightness of the standards. Besides, the Cuplok joints
showed signs of wear from frequent use and were therefore representative of joints used in
practice in terms of joint stiffness and strength [24].
The standards, attached with Cuplok joints, were made from cold-formed circular steel tube
grade 450 MPa with nominal outside diameter of 48.3 mm and thickness of 4 mm. The grade
350 MPa ledgers with end blades were of nominal outside diameter of 48.3 mm and thickness
of 3.2 mm. The telescopic braces with hook ends were made of 48.3 mm x 4.0 mm outer tube
and 38.2 mm x 3.2 mm inner tube with nominal yield stress of 400 MPa. The adjustable jacks
were made of 36 mm diameter threaded steel rod of grade 430 MPa. The base plates were
180 mm x 180 mm x 10 mm in dimension with nominal yield stress of 250 MPa [24].
A test frame was constructed specially for the subassembly tests consisting of four loading
beams at both the top and bottom running in the North-South direction. A total of sixteen
hydraulic jacks attached to the top loading beams (four hydraulic jacks per loading beam)
were used to load the (150 mm x 77 mm) timber bearers running in the East-West direction
that applied loading to the top of each standard via (210 mm clear width) U-heads. Four sets
of cross-bracing were installed to prevent sway of the top loading beams. Ball bearings were
inserted between the jacks and timber bearers in the first test. However, this condition
produced excessive lateral displacements and rotations of the adjustable jacks and was
deemed non-representative of construction practice, where the bearers support a series of
closely spaced secondary bearers running orthogonally to the main bearers. These secondary
bearers elastically restrain displacements and rotations of the primary bearers. Consequently,
the results of Test No. 1 were discarded and in subsequent tests, secondary bearers spaced
approximately at 600 mm were attached at the top of primary bearers. Figure 6 illustrates a
typical test frame showing primary and secondary bearers and bracings. The results of Test

Structural Modelling of Support Scaffold Systems June 2009
School of Civil Engineering Research Report No R896
11
No. 7 were also discarded since the hydraulic jacks accidentally moved out of positions
during the test.
Figure 6: Typical test frame from top view

Structural Modelling of Support Scaffold Systems June 2009
School of Civil Engineering Research Report No R896
12
In all tests except Test No. 6, the loads were applied at an eccentricity of 25 mm in the North-
South direction to the top adjustable jacks (Figure 7(a)) along the second row in the East-
West direction while for the rest of the standards the loads were applied concentrically. In
addition, the base plates in the row of eccentrically loaded standards were placed on 3 mm
diameter circular steel rods at a nominal eccentricity of 15 mm, as shown in Figure 7(b), as
per AS3610 [25].
The load eccentricities applied at the top and bottom of the system were arranged such that
the standards were bent in single curvature. The loads were applied equally by hydraulic
jacks on each standard through primary bearers, except in Test No. 14 where the loads
applied to the corner, perimeter, and centre jacks were in the ratio of 1:2:4 respectively. The
applied loads were recorded at each increment of loading until failure occurred, and
theodolites were employed to measure initial geometric imperfections of all the standards
before the test began and the displacements of six selected standards during loading [24].
Hydraulic jack
Primary bearer
U-head
Unit: mm
S N
Base plate
(a)
(b)
3 mm steel rod
Figure 7: Enlarged view of (a) top eccentricity and (b) bottom eccentricity
2.2 Test Configurations
A summary of the test configurations which includes test number, test date, lift height,
number of lifts, top and bottom jack extension length, position of spigot, bracing
arrangement, type of loading, and loading eccentricity is presented in Table 1.

Structural Modelling of Support Scaffold Systems June 2009
School of Civil Engineering Research Report No R896
13
Table 1: Summary of test configurations
Test Date Lift
height
No.
of
lifts
Jack
extension
Spigot
(lifts) Bracing Loading
Load
eccentricity in
2nd
row
standards
1 17/1/06 1.5 m 3 600 mm 2
nd &
3rd
full uniform
25 mm top &
15 mm bottom
2 31/1/06 1.5 m 3 600 mm 2
nd &
3rd
full uniform
25 mm top &
15 mm bottom
3 8/2/06 1.5 m 3 600 mm 2
nd &
3rd
full uniform
25 mm top &
15 mm bottom
4 13/2/06 1.5 m 3 600 mm 2
nd &
3rd
none uniform
25 mm top &
15 mm bottom
5 16/2/06 1.5 m 3 600 mm 2
nd &
3rd
perimeter uniform
25 mm top &
15 mm bottom
6 22/2/06 1.5 m 3 600 mm 2
nd &
3rd
perimeter uniform 15 mm bottom
7 3/3/06 1.5 m 3 300 mm 2
nd &
3rd
full uniform
25 mm top &
15 mm bottom
8 10/3/06 1.5 m 3 300 mm 2
nd &
3rd
full uniform
25 mm top &
15 mm bottom
9 17/3/06 1.5 m 3 300 mm 2
nd &
3rd
none uniform
25 mm top &
15 mm bottom
10 24/3/06 1.5 m 3 300 mm 2
nd &
3rd
core uniform
25 mm top &
15 mm bottom
11 30/3/06 1.5 m 3 300 mm 2
nd &
3rd
full uniform
25 mm top &
15 mm bottom
12 7/4/06 1.5 m 3 300 mm 2nd
full uniform 25 mm top &
15 mm bottom
13 13/4/06 1.5 m 3 300 mm 2
nd &
3rd
N-S only uniform
25 mm top &
15 mm bottom
14 3/5/06 1.5 m 3 300 mm 2
nd &
3rd
core 1:2:4
25 mm top &
15 mm bottom
15 15/5/06 2 m 2 300 mm 2nd
full uniform 25 mm top &
15 mm bottom
16 19/5/06 1 m 3 600 mm 3rd
full uniform 25 mm top &
15 mm bottom
17 7/6/06 1 m 4 300 mm 3rd
full uniform 25 mm top &
15 mm bottom
18 30/6/06 1 m 4 300 mm 3rd
full uniform 25 mm top &
15 mm bottom
A schematic of a typical test configuration is shown in Figure 8. The figure shows a typical 3-
lift support scaffold system with a lift height of 1.5 m in a full bracing arrangement being
loaded by hydraulic jacks attached to the test frame. The figure also shows a temporary
support deck for access to the test frame. The bracing arrangement is according to the
labelling in the figure showing core and perimeter braces. Full bracing arrangement includes
both core and perimeter braces. N-S bracing arrangement consists of braces running in the

Structural Modelling of Support Scaffold Systems June 2009
School of Civil Engineering Research Report No R896
14
North-South direction. As an example, Figure 9 shows the actual Test No. 8 setup consisting
of a 3-lift, 1.5 m lift height and 300 mm jack extension subassembly test with full bracing
arrangement including top and bottom eccentricities in 2nd
row.
Figure 8: Schematic of typical test configuration in plan and elevation view

Structural Modelling of Support Scaffold Systems June 2009
School of Civil Engineering Research Report No R896
15
Figure 9: Test No. 8 setup
2.3 Test Results
A summary of the test results consisting of test number, ultimate load from hydraulic jacks at
3 different locations (corner, perimeter, and centre), and observed failure mode is shown in
Table 2. As noted earlier, the results of Tests No. 1 and 7 are unrepresentative, and thus not
shown in the summary.

Structural Modelling of Support Scaffold Systems June 2009
School of Civil Engineering Research Report No R896
16
Table 2: Summary of test results
Test
Ultimate
load at
corner
jacks
(kN)
Ultimate
load at
perimeter
jacks
(kN)
Ultimate
load at
centre
jacks
(kN)
Observed failure mode
2 87 86 89 N-S sway mode, final failure of top and
bottom jacks
3 91 90 91 N-S sway mode, failure of top and bottom
jacks, and spigot
4 50 50 50 N-S sway mode, final failure of top and
bottom jacks
5 60 60 60 N-S sway of centre bay, final failure of top
jacks
6 60 60 60 N-S sway of centre bay, final failure of top
jacks and spigot
8 130 130 130 Some N-S sway, failure of standards and
spigot at top lift
9 65 65 65 N-S sway mode, final failure of top jacks and
top standards
10 70 70 70 N-S sway mode, failure of corner standards
and spigots
11 120 120 120 Some N-S sway, final failure of top spigots
and standards
12 119 120 120 Some N-S sway, failure of top spigots and
corner standards
13 70 70 70 Some E-W sway, final failure of perimeter
spigots in 2nd
lift
14 40 80 160 Some N-S sway, failure of top spigots and
centre standards
15 105 105 105 Failure of corner spigot and top standard
16 100 100 100 N-S sway mode, failure of jacks
17 140 140 140 Bearer broke off before final failure of top
jacks
18 150 150 150 Some N-S sway, final failure of corner
standard at top lift
The test results suggest that the failure modes are controlled by the jack extension length
since when 600 mm top and bottom extensions are used the failure mode is North-South
sway with final failure at the jacks. On the contrary, when 300 mm extensions are used,
failure occurs mainly in the standards and spigots with only small sway displacements.
Noticeably, the ultimate load decreases as the jack extension increases. The test results show
that the bracing arrangement significantly influences the ultimate load of the system. Also,
the higher lift height reduces the ultimate load. Moreover, the standards tend to fail at the top
lift and around the perimeter region, especially at the corner where there is no bracing and
only two ledgers are connected. Final failure occurred in spigots and jacks in most cases, as

Structural Modelling of Support Scaffold Systems June 2009
School of Civil Engineering Research Report No R896
17
shown in Figure 10. Complete data on initial geometric imperfections and displacements as
well as supplementary tests on components of Cuplok scaffold systems, including tensile
coupon, stub column and bending tests are available in [24].
(a) (b)
Figure 10: Failure in (a) spigot and (b) jack
3. Finite Element Models
In this research, three-dimensional finite element models have been developed for analysing
support scaffold systems. The analyses include geometric and material nonlinearities and are
performed using the commercial finite element software package Strand7 [26]. The models
present efficient and accurate methods for representing spigot joints, standard-to-ledger
connections, base plate eccentricities, and load eccentricities. Also, initial geometric
imperfections and material nonlinearity of all components of the system are incorporated in
the models. In modelling the structural elements of the scaffold system, nonlinear beam
elements, including contact, link, and connection elements, are used as described in sections
3.1 to 3.7. The models are compared with the subassembly tests [24] and calibrated against
the ultimate loads and displacement responses in section 3.8.
3.1 Spigot Joints
In the studied systems, the spigot joint consists of an insert made from a circular hollow steel
tube with 38.2 mm outside diameter, 3.2 mm in thickness, and 300 mm in total length. The
insert feeds into the abutting top and bottom standards to create a required lift height, as
shown in Figure 2. The top standard can slide over the insert, which is fastened to the bottom
standard by a fixed pin. The spigot modelling suggested by Enright et al. [19] is adopted, as
shown in Figure 11.

Structural Modelling of Support Scaffold Systems June 2009
School of Civil Engineering Research Report No R896
18
Figure 11: Schematic of spigot joint model
The top and bottom standards are modelled as nonlinear beam element connected to the
spigot via pinned connections. The spigot beam element is connected to the standards by
three pinned stiff links capable of only transferring lateral forces from the standards to the
spigot. As a result, the vertical force travels through the standards and only horizontal forces
transfer to the spigot via the pinned links. When the standard bends under vertical load, the
spigot is forced to bend because of the lateral forces acting oppositely at the top/bottom and
centre of the spigot. The degree of bending of the spigot depends on the amount of initial
geometric imperfection of the standard and vertical force. In three-dimensional analyses, the
spigot model is arranged in the direction perpendicular to the primary bearers which is in the
same direction as that of the load eccentricity. This arrangement is reasonable since it was
observed from the subassembly tests [24] that the spigot joint tends to fail in the same
direction as the load eccentricity. For simplicity, the spigot model is applied at mid height of
the lift, even though the spigot is often located at little below or above mid height in actuality.
3.2 Semi-Rigid Standard-to-Ledger Connections
The connections between standard and ledger in this research consist of a semi-rigid Cuplok-
type joint that can join up to four ledgers to the standard. The relation between the moment
and rotation of the Cuplok connections is modelled by a tri-linear curve, as illustrated in
Figure 12. The parameters that describe the tri-linear curve (k1, k2, k3, β1, β2, β3) were
obtained from laboratory tests. Three different joint configurations were tested in bending
about vertical and horizontal axes, i.e. the 4-way, 3-way and 2-way configurations, reflecting
the number of ledgers connected at the joint. It was observed that the more ledgers connected,
the less movement in the joint itself, and hence the greater stiffness. The average joint
stiffness values for k1, k2, and k3 for different joint configurations and bending axes (Figure
13) are presented in Table 3. The average joint rotation values for β1, β2 and β3 are presented
for different joint configurations and bending axes in Table 4. The connection element in
Strand7 [26] is used to model the relation between moment and rotation. It requires that a
multi-linear moment-rotation table is specified for bending about vertical and horizontal axes.
The connection element is used to supply stiffness for any of the six degrees of freedom
(axial, shear in 2 directions, and bending about 3 axes); in this case, only bending about
vertical and horizontal axes is incorporated in the multi-linear table; the rest are assumed to
be rigid.
Load
Top Standard
Spigot
Pinned link
Pinned link
Pinned link
Bottom Standard
150 mm
150 mm
0

Structural Modelling of Support Scaffold Systems June 2009
School of Civil Engineering Research Report No R896
19
Table 3: Average Cuplok joint stiffness (kNm/rad)
Bending about horizontal axis Bending about vertical axis
Joint configuration k1 k2 k3 k1 k2 k3
4-way 80 102 5.3 15 7.5 0.8
3-way 75 87 5.1 14 7 1
2-way 70 77 4.6 7.5 5 1.5
Table 4: Average rotation for Cuplok joints (rad)
Bending about horizontal axis Bending about vertical axis
Joint configuration β 1 β 2 β 3 β 1 β 2 β 3
4-way 0.014 0.036 0.16 0.02 0.04 0.1
3-way 0.012 0.036 0.16 0.02 0.04 0.1
2-way 0.007 0.036 0.16 0.02 0.04 0.1
Figure 12: Tri-linear moment-rotation for the Cuplok joints
Figure 13: Bending axes of the Cuplok joints
3.3 Brace Connections
The braces are made of telescopic members with hooks at the ends. They are modelled using
two rigidly connected elements with different cross-sections. Connection elements with only
Rotation
Moment
β1 β2 β3
k1
k2
k3

Structural Modelling of Support Scaffold Systems June 2009
School of Civil Engineering Research Report No R896
20
axial stiffness form the connection between the brace member elements and the ledgers. The
axial spring stiffness is taken as 1.8 kN/mm as obtained from test calibrations on braced
scaffold systems. The braces are offset 60 mm from the nodal points between the standards
and ledgers because in actual construction the braces are connected to ledgers at about this
distance away from the joints.
3.4 Base Plate Eccentricity
The placement of the base plate of scaffold systems on an uneven or sloped ground can create
eccentricity. The amount of base eccentricity depends largely on ground surface irregularities
as shown in Figure 14(a). AS3610 [25] specifies an expected base eccentricity of no more
than 40 mm or bp/4, whichever is less, where bp is the stiff portion of bearing of an end plate,
as shown in Figure 14(a). For example, bp/4 is 17 mm for the scaffold system in the study
which is less than 40 mm; therefore, the expected base eccentricity of the system is no more
than 17 mm. The base eccentricity model proposed is illustrated in Figure 14(b), in which the
base eccentricity is labelled as “e”. The standard and the base plate are modelled using
nonlinear beam elements with their corresponding cross-sectional and material properties. A
contact element is used to model a gap between the base plate and the ground. The contact
element is set to provide stiffness only in compression, and only when the nodes to which it is
connected come into contact, that is when the gap closes. The stiffness is specified as
“infinity,” implying that when the load transfers from the standard to the base plate causing
the far end of the base plate to rotate and touch the ground, the point of contact becomes
infinitely stiff representing solid ground or other hard surface.
Figure 14: (a) base plate on uneven ground and (b) base eccentricity model
3.5 Load Eccentricity
A load eccentricity can occur between the timber bearer and the U-Head since the bearer is
not always positioned such that its centre line coincides with the centre line of the jack, even
though in good construction practice the U-head is twisted against the bearer so as to reduce
the amount of eccentricity. In order to model the eccentricity, a rigid link with length equal to
the load eccentricity is connected to the top of the jack in the direction perpendicular to the
bearer, and the vertical point load is applied at the far end of the link. The rigid link behaves
as a short, stiff cantilever that introduces vertical force and additional moment into the jack.
3.6 Geometric Imperfections
Scaffold systems are generally slender and sensitive to stability effects; therefore, initial
geometric imperfections producing member P-δ and frame P-∆ effects (Figure 15) must be
considered in the analysis model. A common approach to incorporate geometric
Load
Standard
Base plate
Uneven ground Contact element
Base plate
Standard
(a) (b)
bp
1 1
e

Structural Modelling of Support Scaffold Systems June 2009
School of Civil Engineering Research Report No R896
21
imperfections is to scale one or more critical elastic buckling modes and apply the scaled
displacements to the perfect geometry. Nevertheless, several issues remain unanswered in
this method. For instance, how many buckling modes should be included and what scaling
factors should be applied? One alternative is to use the maximum allowable imperfection
values from available structural codes. For example, the Australian steel design standard [7]
specifies a maximum out-of-straightness of L/1000, where L is the member length.
Nonetheless, this method often produces conservative predictions of the strength of systems.
Another approach is to apply notional horizontal forces, but some doubt remains as to the
magnitude of force to use.
Alternatively, for the purpose of calibrating the analysis model, in this research the
magnitudes of the member out-of-straightness and the frame out-of-plumb are implemented
directly at the nodes of the finite element models from acquired initial imperfection
measurements taken as part of the subassembly tests [24]. The member out-of-straightness (δ)
is applied at mid height of the standard in each scaffold lift and the frame out-of-plumb (∆) is
applied at each ledger-standard connection point and at the U-head at the top of the scaffold.
From the measurements, the average out-of-straightness of the standards is Lh/820 mm for the
lifts with spigot joint and Lh/1700 mm for the lifts without spigot joint, where Lh is the lift
height, and the average out-of-plumb of the frames is H/470 mm, where H is the total height.
Full details of the initial geometric imperfections of the subassembly tests are available in
[24]. For other studies on the scaffold systems, real data on initial geometric imperfections is
procured from construction sites around the Sydney area.
Figure 15: P-δ and P-∆ effects
3.7 Geometric and Material Nonlinearities
In geometric nonlinear analysis, an accurate determination of the displacements is attained
which is particularly important in slender structures such as scaffold systems. In the present
beam element based analysis, the deformed geometry is used to establish the equilibrium
equation and the element’s local reference system is updated at each load increment to
capture the load deflection characteristics.
In material nonlinear analysis, the nonlinear relationship between stress and strain is applied.
The stress-strain relations for the scaffold components used in the models are based on the
Ramberg-Osgood expression [27, 28] fitted to experimental data obtained from
supplementary tests on components of the subassembly tests [24]. Figures 16 to 21 show the
Ramberg-Osgood stress-strain curves used in the material modelling of the experimental
standard, ledger, jack, base plate, brace, and spigot respectively. Since there is no stress-strain
data for the ledger, brace and spigot, the stress-strain relations for these components are
obtained by scaling the Ramberg-Osgood stress-strain relation used for the standards to their
Structural Modelling of Support Scaffold Systems June 2009
School of Civil Engineering Research Report No R896
22
nominal yield stress. However, the ledger, brace and spigot insert are expected to be loaded
only in elastic range, and therefore, the material nonlinearity effects of these components are
negligible. The Ramberg-Osgood parameters (E0, σ0.2, n) for each scaffold component are
summarised in Table 5. In the table, E0 is the initial Young’s modulus, σ0.2 is the 0.2% proof
stress as the equivalent yield stress, and n is a parameter which determines the sharpness of
the knee of the stress-strain curve.
Table 5: Ramberg-Osgood parameters for scaffold components
Component E0 (GPa) σ0.2 (MPa) n
Standard 200 530 38.2
Ledger 200 380 38.2
Jack 200 495 16.0
Base plate 200 260 25.0
Brace 200 430 38.2
Spigot 200 430 38.2
The Ramberg-Osgood stress-strain relations are applied to the beam elements of each
scaffold component. As the beam cross-section and length are subdivided, sampling points on
the cross-section and integration points along the length of the beam are utilised to
numerically integrate the stiffness characteristics of the beam. As a result of this section and
length-wise integration, the propagation of yielding through the cross-section and along the
beam element can be included. The axial and bending stiffness are coupled as the neutral axis
on the yielded beam shifts [26]. This method is referred to as plastic-zone analysis [8].
Figure 16: Stress-strain curve for standard
0.00E+00
1.00E+08
2.00E+08
3.00E+08
4.00E+08
5.00E+08
6.00E+08
0.0000 0.0050 0.0100 0.0150 0.0200 0.0250
Strain
Str
ess
(Pa)
Ramberg-Osgood Test result

Structural Modelling of Support Scaffold Systems June 2009
School of Civil Engineering Research Report No R896
23
Figure 17: Stress-strain curve for ledger
Figure 18: Stress-strain curve for jack
0.00E+00
1.00E+08
2.00E+08
3.00E+08
4.00E+08
5.00E+08
0.0000 0.0050 0.0100 0.0150 0.0200 0.0250
Strain
Str
ess
(Pa)
Ramberg-Osgood
0.00E+00
1.00E+08
2.00E+08
3.00E+08
4.00E+08
5.00E+08
6.00E+08
7.00E+08
0.0000 0.0050 0.0100 0.0150 0.0200 0.0250
Strain
Str
ess
(Pa)
Ramberg-Osgood Test result

Structural Modelling of Support Scaffold Systems June 2009
School of Civil Engineering Research Report No R896
24
Figure 19: Stress-strain curve for base plate
Figure 20: Stress-strain curve for brace
0.00E+00
1.00E+08
2.00E+08
3.00E+08
4.00E+08
0.0000 0.0050 0.0100 0.0150 0.0200 0.0250
Strain
Str
ess
(Pa)
Ramberg-Osgood Test result
0.00E+00
1.00E+08
2.00E+08
3.00E+08
4.00E+08
5.00E+08
0.0000 0.0050 0.0100 0.0150 0.0200 0.0250
Strain
Str
ess
(Pa)
Ramberg-Osgood

Structural Modelling of Support Scaffold Systems June 2009
School of Civil Engineering Research Report No R896
25
Figure 21: Stress-strain curve for spigot
3.8 Calibrations
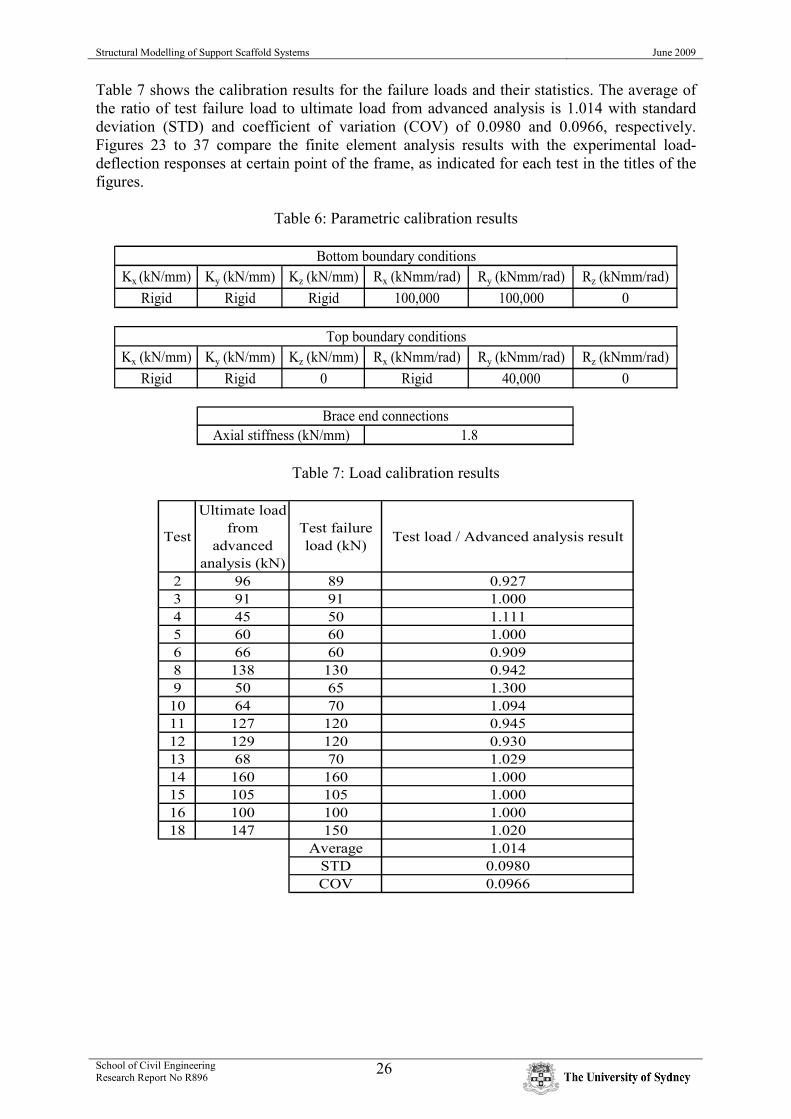
The commercial software package Strand7 [26] was used to create a finite element model for
each of the full-scale subassembly tests using the actual frame dimensions and measured
values of imperfections. The mean of the measured dimensions of components were used for
cross-sectional properties in the finite element models. As an example, Figure 22 shows the
finite element model for Test No. 3 of the subassembly tests [24]. The ultimate loads and
displacements obtained from the nonlinear analyses accounting for both material and
geometric nonlinearities were calibrated against failure loads and load-deflection responses
obtained from the full-scale subassembly tests [24].
The calibrations were achieved by changing the stiffness of the elastic restraints applied at the
U-head and base plate, as well as the axial spring stiffness of the brace connections; the latter
was changed after the calibrations were performed on unbraced systems for the top and
bottom rotational stiffness. Table 6 shows the results of the stiffness parameters obtained
from the calibrations. In the table, K represents translational stiffness with subscript showing
its direction corresponding to Figure 22, and R represents rotational stiffness with subscript
showing the axis of bending according to Figure 22. It should be noted that the top rotational
stiffness about the x-axis is assumed to be rigid, corresponding to the negligible strong axis
bending of the bearer. However, the y-axis bending stiffness is taken as 40 kNm/rad since
bending about this axis occurs during failure as observed in the tests [24]. The bottom
rotational stiffness about the x and y axes is calibrated as 100 kNm/rad. The bottom rotational
stiffness is applied to all uprights except the uprights with bottom eccentricity for which base
plate modelling is applied. The translational stiffness at the base is taken as rigid in all
directions. At the top, the translational stiffness is assumed to be rigid in the x and y
directions, but 0 in the z direction. The brace end connections have an axial stiffness of 1.8
kN/mm capable of transferring only axial forces to the ledgers.
0.00E+00
1.00E+08
2.00E+08
3.00E+08
4.00E+08
5.00E+08
0.0000 0.0050 0.0100 0.0150 0.0200 0.0250
Strain
Str
ess
(Pa)
Ramberg-Osgood
Structural Modelling of Support Scaffold Systems June 2009
School of Civil Engineering Research Report No R896
26
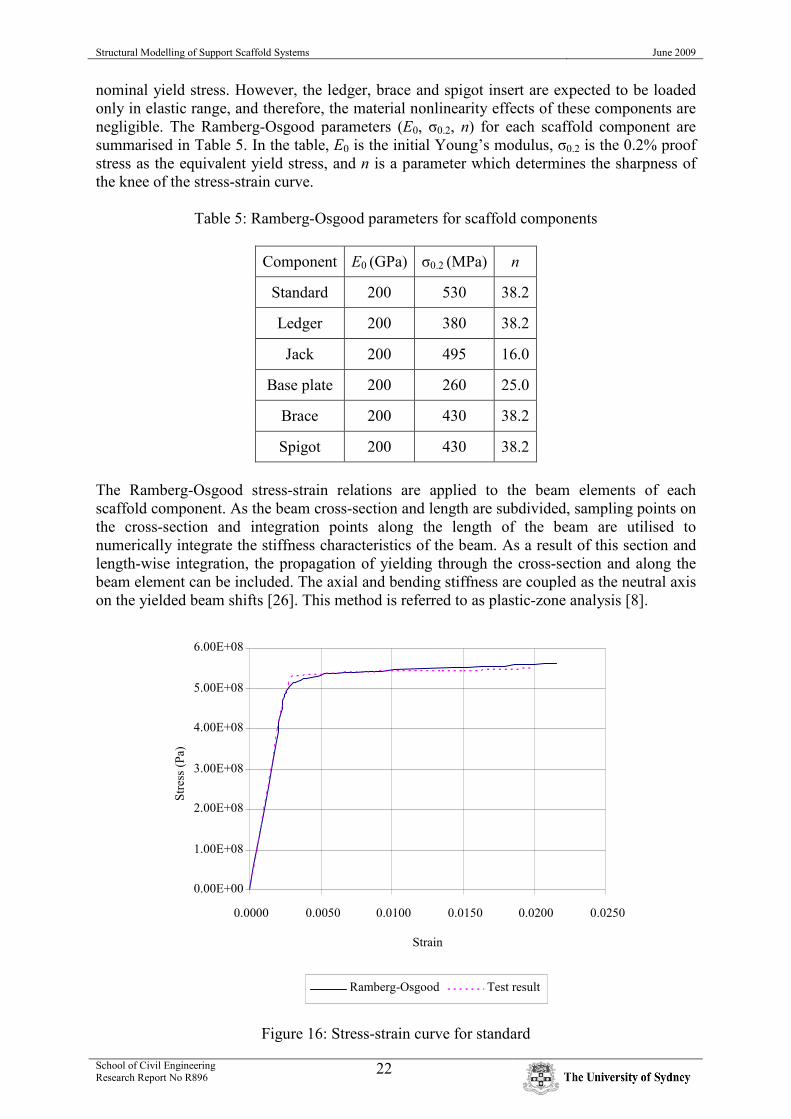
Table 7 shows the calibration results for the failure loads and their statistics. The average of
the ratio of test failure load to ultimate load from advanced analysis is 1.014 with standard
deviation (STD) and coefficient of variation (COV) of 0.0980 and 0.0966, respectively.
Figures 23 to 37 compare the finite element analysis results with the experimental load-
deflection responses at certain point of the frame, as indicated for each test in the titles of the
figures.
Table 6: Parametric calibration results
Kx (kN/mm) Ky (kN/mm) Kz (kN/mm) Rx (kNmm/rad) Ry (kNmm/rad) Rz (kNmm/rad)
Rigid Rigid Rigid 100,000 100,000 0
Kx (kN/mm) Ky (kN/mm) Kz (kN/mm) Rx (kNmm/rad) Ry (kNmm/rad) Rz (kNmm/rad)
Rigid Rigid 0 Rigid 40,000 0
Top boundary conditions
Brace end connections
Axial stiffness (kN/mm) 1.8
Bottom boundary conditions
Table 7: Load calibration results
Test
Ultimate load
from
advanced
analysis (kN)
Test failure
load (kN)Test load / Advanced analysis result
2 96 89 0.927
3 91 91 1.000
4 45 50 1.111
5 60 60 1.000
6 66 60 0.909
8 138 130 0.942
9 50 65 1.300
10 64 70 1.094
11 127 120 0.945
12 129 120 0.930
13 68 70 1.029
14 160 160 1.000
15 105 105 1.000
16 100 100 1.000
18 147 150 1.020
Average 1.014
STD 0.0980
COV 0.0966
Structural Modelling of Support Scaffold Systems June 2009
School of Civil Engineering Research Report No R896
27
Figure 22: Finite element model of Test No. 3 showing axes
0
20
40
60
80
100
120
0 5 10 15 20 25 30 35 40
Deflection (mm)
Lo
ad (
kN
)
Test result FE result
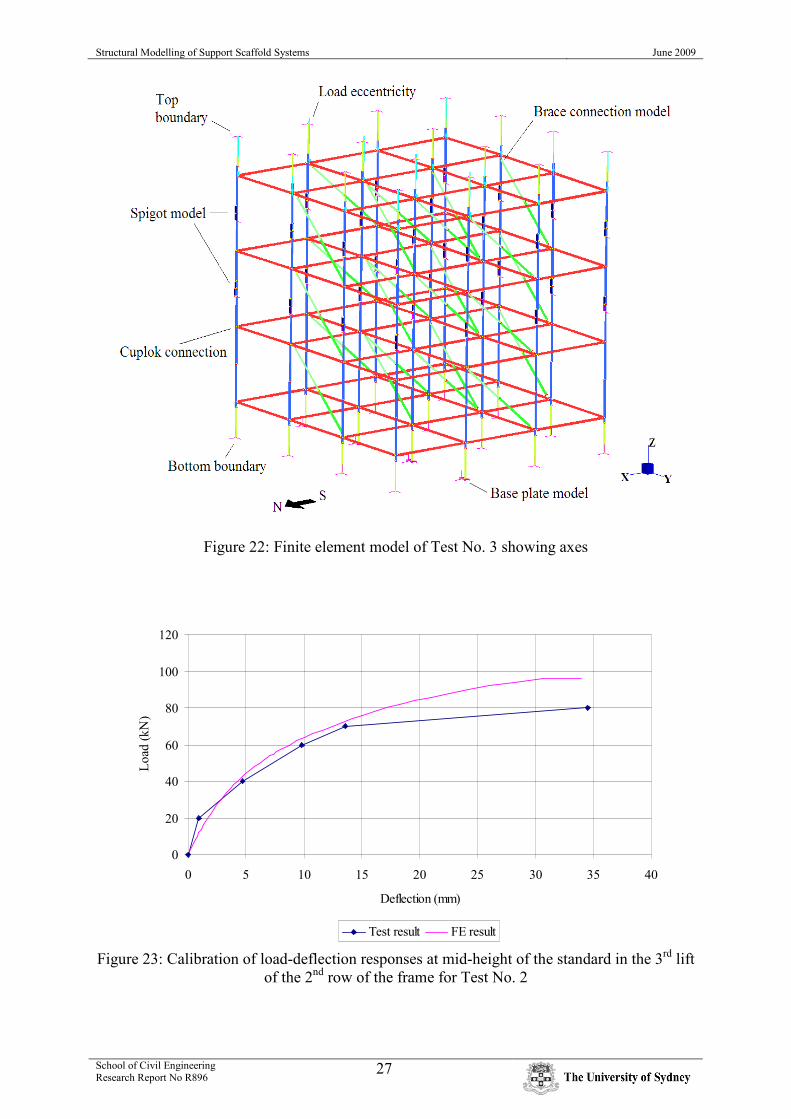
Figure 23: Calibration of load-deflection responses at mid-height of the standard in the 3rd
lift
of the 2nd
row of the frame for Test No. 2

Structural Modelling of Support Scaffold Systems June 2009
School of Civil Engineering Research Report No R896
28
0
10
20
30
40
50
60
70
80
90
100
0 5 10 15 20 25 30 35 40
Deflection (mm)
Lo
ad (
kN
)
Test result FE result
Figure 24: Calibration of load-deflection responses at mid-height of the standard in the 3rd
lift
of the 2nd
row of the frame for Test No. 3
0
5
10
15
20
25
30
35
40
45
50
0 5 10 15 20 25 30
Deflection (mm)
Lo
ad (
kN
)
Test result FE result
Figure 25: Calibration of load-deflection responses at mid-height of the standard in the 3rd
lift
of the 2nd
row of the frame for Test No. 4

Structural Modelling of Support Scaffold Systems June 2009
School of Civil Engineering Research Report No R896
29
0
10
20
30
40
50
60
70
0 5 10 15 20 25 30 35
Deflection (mm)
Lo
ad (
kN
)
Test result FE result
Figure 26: Calibration of load-deflection responses at mid-height of the standard in the 3rd
lift
of the 2nd
row of the frame for Test No. 5
0
10
20
30
40
50
60
70
0 2 4 6 8 10 12
Deflection (mm)
Lo
ad (
kN
)
Test result FE result
Figure 27: Calibration of load-deflection responses at mid-height of the standard in the 3rd
lift
of the 2nd
row of the frame for Test No. 6

Structural Modelling of Support Scaffold Systems June 2009
School of Civil Engineering Research Report No R896
30
0
20
40
60
80
100
120
140
160
0 5 10 15 20 25 30
Deflection (mm)
Lo
ad (
kN
)
Test result FE result
Figure 28: Calibration of load-deflection responses at mid-height of the standard in the 3rd
lift
of the 2nd
row of the frame for Test No. 8
0
10
20
30
40
50
60
0 1 2 3 4 5 6 7 8 9
Deflection (mm)
Lo
ad (
kN
)
Test result FE result
Figure 29: Calibration of load-deflection responses at mid-height of the standard in the 3rd
lift
of the 2nd
row of the frame for Test No. 9

Structural Modelling of Support Scaffold Systems June 2009
School of Civil Engineering Research Report No R896
31
0
10
20
30
40
50
60
70
0 0.5 1 1.5 2 2.5 3
Deflection (mm)
Lo
ad (
kN
)
Test result FE result
Figure 30: Calibration of load-deflection responses at mid-height of the standard of the 3rd
lift
of the 2nd
row of the frame for Test No. 10
0
20
40
60
80
100
120
140
0 2 4 6 8 10 12 14 16
Deflection (mm)
Lo
ad (
kN
)
Test result FE result
Figure 31: Calibration of load-deflection responses at mid-height of the standard in the 3rd
lift
of the 2nd
row of the frame for Test No. 11

Structural Modelling of Support Scaffold Systems June 2009
School of Civil Engineering Research Report No R896
32
0
20
40
60
80
100
120
140
0 2 4 6 8 10 12 14 16 18
Deflection (mm)
Lo
ad (
kN
)
Test result FE result
Figure 32: Calibration of load-deflection responses at mid-height of the standard in the 3rd
lift
of the 2nd
row of the frame for Test No. 12
0
10
20
30
40
50
60
70
80
0 0.5 1 1.5 2 2.5 3 3.5 4 4.5 5
Deflection (mm)
Lo
ad (
kN
)
Test result FE result
Figure 33: Calibration of load-deflection responses at the 2nd
lift of the 1st row of the frame
for Test No. 13

Structural Modelling of Support Scaffold Systems June 2009
School of Civil Engineering Research Report No R896
33
0
20
40
60
80
100
120
140
160
180
0 2 4 6 8 10 12 14 16 18
Deflection (mm)
Lo
ad (
kN
)
Test result FE result
Figure 34: Calibration of load-deflection responses at mid-height of the standard in the 3rd
lift
of the 2nd
row of the frame for Test No. 14
0
20
40
60
80
100
120
0 2 4 6 8 10 12 14 16
Deflection (mm)
Lo
ad (
kN
)
Test result FE result
Figure 35: Calibration of load-deflection responses at mid-height of the standard in the 2nd
lift
of the 2nd
row of the frame for Test No. 15

Structural Modelling of Support Scaffold Systems June 2009
School of Civil Engineering Research Report No R896
34
0
20
40
60
80
100
120
0 5 10 15 20 25 30
Deflection (mm)
Lo
ad (
kN
)
Test result FE result
Figure 36: Calibration of load-deflection responses at mid-height of the standard in the 3rd
lift
of the 2nd
row of the frame for Test No. 16
0
20
40
60
80
100
120
140
160
0 5 10 15 20 25 30 35
Deflection (mm)
Lo
ad (
kN
)
Test result FE result
Figure 37: Calibration of load-deflection responses at mid-height of the standard in the 3rd
lift
of the 2nd
row of the frame for Test No. 18
Structural Modelling of Support Scaffold Systems June 2009
School of Civil Engineering Research Report No R896
35
4. Discussion
The calibrations show that advanced analysis using geometric and material nonlinear finite
element models gives very good predictions of the ultimate loads of the systems. Most of the
predictions are within 10% of the actual failure loads. In fact, the average of the ratios
between failure test load and predicted ultimate load is very close to 1 (1.014) with a
relatively small COV of 0.0966.
In addition, advanced analysis gives good results in predicting deformation responses of
support scaffold systems. The finite element analysis results of the load-deflection responses
fit the test results [24] reasonably closely with most of the values within 20% of one another.
It can be noticed that in some tests there are no deflection values available for the failure
load. Also, Test No. 4 only provides three measured deflections during loading, and has been
ignored in the comparison.
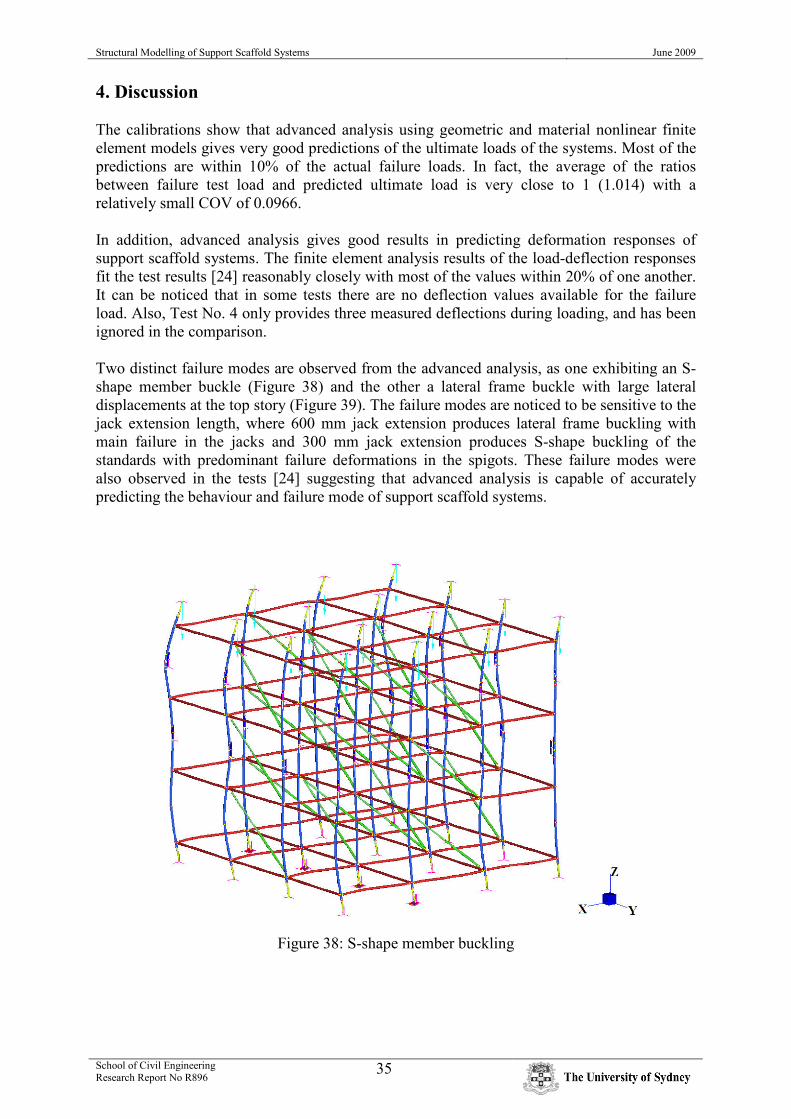
Two distinct failure modes are observed from the advanced analysis, as one exhibiting an S-
shape member buckle (Figure 38) and the other a lateral frame buckle with large lateral
displacements at the top story (Figure 39). The failure modes are noticed to be sensitive to the
jack extension length, where 600 mm jack extension produces lateral frame buckling with
main failure in the jacks and 300 mm jack extension produces S-shape buckling of the
standards with predominant failure deformations in the spigots. These failure modes were
also observed in the tests [24] suggesting that advanced analysis is capable of accurately
predicting the behaviour and failure mode of support scaffold systems.
Figure 38: S-shape member buckling

Structural Modelling of Support Scaffold Systems June 2009
School of Civil Engineering Research Report No R896
36
Figure 39: Lateral frame buckling
5. Conclusions
In this paper, nonlinear finite element analysis models for support scaffold systems have been
developed. Models for various components of the systems including spigot joints, semi-rigid
upright-to-beam connections and base plate eccentricities are proposed. Calibrations of these
models to the full-scale subassembly tests [24] consisting of three-by-three bay formwork
systems with the combinations of different numbers of lifts, jack extension, and lift height are
achieved by adjusting the top and bottom boundary conditions as well as the brace connection
stiffness. The ultimate loads obtained from advanced analysis are in close agreement with the
failure loads of the tests; moreover, comparisons of load-deflection responses also show close
agreement, demonstrating that advanced analysis is able to accurately predict the behaviour
and strength of highly complex support scaffold systems. The development of a design
methodology for support scaffold systems based on advanced analysis is in progress at the
University of Sydney.
Acknowledgement
The authors would like to thank Boral Formwork & Scaffolding Pty Ltd for providing
subassembly test data and support of this research project.
References
[1] Gylltoft K, Mroz K. Load carrying capacity of scaffolds. Structural Engineering
International 1995;1:37-42.
[2] Peng JL, Chan SL, Wu CL. Effects of geometrical shape and incremental loads on
scaffold systems. Journal of Constructional Steel Research 2007;63(4):448-459.
[3] Prabhakaran U, Godley MHR, Beale RG. Three-dimensional second order analysis of
scaffolds with semi-rigid connections. Welding in the World 2006;50(SPEC ISS):187-194.
[4] Yu WK, Chung KF, Chan SL. Structural instability of multi-storey door-type modular
steel scaffolds. Engineering Structures 2004;26(7):867-881.

Structural Modelling of Support Scaffold Systems June 2009
School of Civil Engineering Research Report No R896
37
[5] Chu AYT, Chan SL, Chung KF. Stability of modular steel scaffolding systems -
theory and verification. Proceedings of International Conference Advances in Building
Technology Hong Kong, 2002, pp. 621-628.
[6] Weesner LB, Jones HL. Experimental and analytical capacity of frame scaffolding.
Engineering Structures 2001;23(6):592-599.
[7] Standard Australia. AS 4100: Steel structures. 1998.
[8] Clarke MJ, Bridge RQ, Hancock GJ, Trahair NS. Advanced analysis of steel building
frames. Journal of Constructional Steel Research 1992;23(1-3):1-29.
[9] ANSYS Release 5.5. ANSYS basic analysis procedures guide. Swanson Analysis
Systems, 1998.
[10] LUSAS. User manual version 12.2. FEA Ltd, UK, 1998.
[11] NAF-NIDA. Software for nonlinear integrated design and analysis version 3. User's
manual. Department of Civil and Structural Engineering, Hong Kong Polytechnic University,
2001.
[12] Milojkovic B, Beale RG, Godley MHR. Determination of the factors of safety of
standard scaffold structures. Proceedings of International Conference Advances in Steel
Structures, Vol. 1 UK, 2002, pp. 303-310.
[13] Godley MHR, Beale RG. Sway stiffness of scaffold structures. Structural Engineer
1997;75(1):4-12.
[14] Huang YL, Chen HJ, Rosowsky DV, Kao YG. Load-carrying capacities and failure
modes of scaffold-shoring systems, Part I: Modeling and experiments. Structural Engineering
and Mechanics 2000;10(1):53-66.
[15] Peng JL, Pan ADE, Chen WF, Yen T, Chan SL. Structural modeling and analysis of
modular falsework systems. Journal of Structural Engineering 1997;123(9):1245-1251.
[16] Chan SL, Huang HY, Fang LX. Advanced analysis of imperfect portal frames with
semirigid base connections. Journal of Engineering Mechanics 2005;131(6):633-640.
[17] Yu WK, Chung KF. Prediction on load carrying capacities of multi-storey door-type
modular steel scaffolds. Steel & Composite Structures 2004;4(6):471-487.
[18] Godley MHR, Beale RG. Analysis of large proprietary access scaffold structures.
Proceedings of the Institution of Civil Engineers: Structures and Buildings, Vol. 146 UK,
2001, pp. 31-39.
[19] Enright J, Harriss R, Hancock GJ. Structural stability of braced scaffolding and
formwork with spigot joints. Proceedings of the Fifteenth International Specialty Conference
on Cold-Formed Steel Structures, Vol. 1 St. Louis, Missouri, USA, 2000, pp. 357-376.
[20] Yu WK. An investigation into structural behaviour of modular steel scaffolds. Steel &
Composite Structures 2004;4(3):211-226.
[21] Vaux S, Wong C, Hancock G. Sway stability of steel scaffolding and formwork
systems. Proceedings of the Third International Conference on Advances in Steel Structures,
Vol. 1 Hong Kong, 2002, pp. 311-319.
[22] Harung HS, Lightfoot E, Duggan DM. The strength of scaffold towers under vertical
loading. Structural Engineer 1975;53(1):23-30.
[23] Milojkovic B., Beale R.G., M.H.R. G. Modelling scaffold connections. Proceedings
of the 4th ACME UK Annual Conference 1996:85-88.
[24] CASE. Tests of formwork subassemblies and components. Investigation Report No.
S1499. Centre for Advanced Structural Engineering, School of Civil Engineering, University
of Sydney, 2006.
[25] Standard Australia. AS 3610: Formwork for concrete. 1995.
[26] Strand7. Strand7 release 2.4 manual. Strand7 Pty Ltd, 2009.
[27] Ramberg W, Osgood WR. Determination of stress–strain curves by three parameters.
Technical Note No. 503. National Advisory Committee on Aeronautics (NACA). 1941.
[28] Rasmussen KJR. Full-range stress-strain curves for stainless steel alloys. Journal of
Constructional Steel Research 2003;59(1):47-61.