Embed Size (px)
Citation preview
School of Chemical Technology Degree Programme of Chemical Technology
Maria Puustinen
SUSTAINABILITY ASPECTS OF CRUDE SULFATE SOAP ACIDUL ATION TO
CRUDE TALL OIL WITHIN THE EU BIOFUEL POLICY FRAMEWO RK
Master’s thesis for the degree of Master of Science in Technology submitted
for inspection in Espoo, June 18, 2015.
Supervisor Professor Ville Alopaeus
Instructors M.Sc. (Tech.) Maiju Helin
D.Sc. (Tech.) Sarwar Golam

Aalto University, P.O. BOX 11000, 00076 AALTOwww.aalto.fi
Abstract of master's thesis
Author Maria Puustinen
Title of thesis Sustainability aspects of crude sulfate soap acidulation to crude tall oil
within the EU biofuel policy framework
Department Department of Biotechnology and Chemical Technology
Professorship Plant design Code of professorship KEM-107
Thesis supervisor Ville Alopaeus
Thesis advisor(s) / Thesis examiner(s) Maiju Helin, Sarwar Golam
Date 18.06.2015 Number of pagesmber of pages 83 Language English
Abstract
The EU biofuel policy is based on two directives, the Renewable Energy Directive and the Fuel Quality
Directive. These directives set sustainability criteria for biofuels and present the general rules for calculating
the greenhouse gas emissions of a fuel. However, the directives have been interpreted differently in different
member states, especially concerning waste and residue feedstocks. In Finland, the greenhouse gas
emissions of acidulation are currently not reported in the lifecycle emissions of a biofuel based on crude tall
oil (CTO), as CTO is considered a residue of pulp production. However, the residue status of CTO has been
questioned, due to its alleged intentional manufacturing in the acidulation process. This thesis aims, first, to
create and implement a method for calculating the greenhouse gas emissions of typical acidulation processes
in line with EU policy, and second, to determine if acidulation emissions can be separated from the pulp
production emissions in a kraft pulp mill. Based on the results, the work provides recommendations for the
classification of CTO under EU biofuel legislation.
Crude tall oil is generated when acid is added to a separated soap phase formed in pulp cooking. This soap
has to be removed from the process and by means of acidulation, sulfur and sodium cooking chemicals in
the soap can be recycled back to the pulping process. Acidulation is interlinked with the pulp mill chemical
recovery cycle and constitutes a major intake of sulfur to the cycle. As the material streams from acidulation
have effects also outside the acidulation process, emissions of acidulation were in this work calculated by
considering the chemical balance of the whole pulp mill. Models for a typical pulp mill and three common
acidulation processes were created based on literature and UPM-internal data. The emissions of the three
most common acidulation processes were calculated and the sensitivity of these emissions was studied
against the most important variables of both acidulation and chemical balance of the pulp mill.
It was first observed that depending on the sulfur balance of the pulp mill and acidulation inputs, an
interlinked acidulation process could either increase or decrease the total emissions of the mill. Second, it
was seen that the emissions of an acidulation process are more sensitive to changes in the pulp mill sulfur
balance than they are to changes in the acidulation process. Thus, due to large variations in the sulfur
balances between different pulp mills, or even at the same mill at different times, the emissions of
acidulation cannot be reliably determined and separated from the emissions of pulp production. Moreover,
the sulfur balance, which affects the acidulation emissions the most, is optimized for pulp production, not
for CTO production. This supports the conclusion that acidulation emissions should be allocated to pulp,
rather than to CTO.
Acidulation is an essential part of the pulp mill and an optimized way to dispose the soap. As the soap is
clearly a residual stream and emissions of acidulation cannot be separated from the emissions of pulp
production, no emissions can be allocated to CTO. Therefore, it is recommended that CTO is regarded as a
residue in the EU biofuel legislation.
Keywords Sustainability, crude tall oil, acidulation, emission calculation, biofuels

Aalto University, P.O. BOX 11000, 00076 AALTOwww.aalto.fi
Diplomityön tiivistelmä
Tekijä Maria Puustinen
Työn nimi Kestävyysnäkökulmia suovan palstoitukseen mäntyöljyksi EU:n
biopolttoainepolitiikan viitekehyksessä
Laitos Biotekniikan ja kemian tekniikan laitos
Professuuri Tehdassuunnittelu Professuurikoodi KEM-107
Työn valvoja Ville Alopaeus
Työn ohjaaja(t)/Työn tarkastaja(t) Maiju Helin, Sarwar Golam
Päivämäärä 18.06.2015 Sivumäärä 83 Kieli Englanti
Tiivistelmä
EU:n biopolttoainepolitiikka perustuu kahteen direktiiviin, uusituvan energian direktiiviin ja polttoaineiden
laatudirektiiviin. Nämä direktiivit asettavat biopolttoaineille kestävyyskriteerit ja esittelevät pääperiaatteet
biopolttoaineiden elinkaaren kasvihuonekaasupäästölaskennalle. Näitä direktiivejä on kuitenkin tulkittu eri
jäsenmaissa eri tavoin, erityisesti koskien jäte- ja tähderaaka-aineiden määrittelyjä. Palstoituksen
kasvihuonekaasupäästöjä ei tällä hetkellä Suomessa huomioida mäntyöljystä valmistetun biopolttoaineen
elinkaaren päästölaskennassa, sillä raakamäntyöljy luokitellaan selluntuotannon tähteeksi. Mäntyöljyn
tähdestatus on kuitenkin kyseenalaistettu viitaten sen tarkoitukselliseen tuottamiseen palstoitusprosessissa.
Tämän diplomityön tavoitteina on luoda metodi palstoituksen päästöjen laskemiseksi, soveltaa sitä tyypillisille
palstoitusprosesseille ja määrittää, voidaanko palstoituksen päästöt erottaa sellun tuotannon päästöistä.
Tämän perusteella diplomityössä annetaan suosituksia mäntyöljyn luokittelemiseen EU:n
biopolttoainelainsäädännössä.
Raakamäntyöljy syntyy, kun sellunkeitossa muodostuneeseen suopaan lisätään palstoituksessa happoa. Suopa
on poistettava selluprosessista ja palstoituksen avulla suovan sisältämät sellunkeittokemikaalit, rikki ja
natrium, voidaan palauttaa selluprosessiin. Palstoitus on integroitu sellutehtaan kemikaalikiertoon ja tuo
siihen merkittäviä määriä rikkiä. Koska palstoituksen materiaalivirrat eivät rajaudu palstoitusprosessin sisälle,
tässä työssä palstoituksen päästöt on laskettu huomioiden koko sellutehtaan kemikaalitase. Laskentaa varten
työssä määritetään mallit tyypilliselle sellutehtaalle, sekä siihen integroiduille kolmelle yleiselle
palstoitusprosessityypille. Työssä lasketaan näiden kolmen palstoitusprosessin päästöt ja tutkitaan
herkkyysanalyysillä sekä sellutehtaan kemikaalitaseen että palstoituksen merkittävimpien muuttujien
vaikutusta näihin päästöihin.
Tulosten perusteella sellutehtaan kemikaalikiertoon integroitu palstoitusprosessi voi tehtaan rikkitaseesta ja
palstoituksen syötteistä riippuen joko lisätä tai vähentää sellutehtaan kokonaispäästöjä. Toiseksi, työssä
havaitaan palstoitusprosessin päästöjen olevan herkempiä sellutehtaan rikkitaseen muutoksille, kuin
muutoksille itse palstoitusprosessissa. Koska rikkitaseet eri sellutehtailla, tai jopa samalla tehtaalla eri aikoina
ovat hyvin erilaisia, ei palstoituksen päästöjä voida luotettavasti määrittää ja erottaa selluntuotannon
päästöistä. Lisäksi, sellutehtaan rikkitasetta optimoidaan sellun tuotannon ehdoilla, ei raakamäntyöljyn
tuotannon ehdoilla. Näistä syistä palstoituksen päästöt tulisi kohdentaa raakamäntyöljyn sijaan sellulle.
Palstoitus on tärkeä osa sellutehtaan kemikaalikiertoa ja optimoitu tapa hävittää prosessista erotettava suopa.
Koska suopa on selkeästi tähdevirta, eikä palstoituksen kasvihuonekaasupäästöjä voida erottaa sellun
tuotannon päästöistä, ei raakamäntyöljylle voida kohdentaa päästöjä. Täten suositus on, että raakamäntyöljy
tulisi EU:n biopolttoainelainsäädännössä tulkita sellun tuotannon tähteeksi.
Avainsanat Kestävyys, mäntyöljy, palstoitus, päästölaskenta, biopolttoaineet

Preface
This work was conducted at UPM Biofuels during spring 2015 while the first commercial
batches of crude tall oil based renewable diesel were produced. I am happy that in addition
to writing my thesis, I was able to participate in the start-up phase of the first UPM
Biorefinery.
I would like to thank Maiju Helin, my manager and instructor at UPM Biofuels for all the
advice and guidance, and especially for showing confidence in me from the very beginning. I
would also like to thank Sarwar Golam, my instructor from Aalto University, for valuable
comments and encouragement during this project. Likewise, I thank Professor Jukka
Koskinen, who supervised my thesis work in practice. Furthermore, I owe to Sami Saarela,
Aleksi Nurmi, Ismo Tapalinen, Marko Sundqvist, Markku Kauppinen, Esa Hassinen, Andreas
Rönnqvist and Matti Tikka from UPM, for sharing their knowledge and arranging the time to
discuss about my thesis subject with me.
In addition, I want to thank all my colleagues at UPM for taking me a part of the team. You
made my workdays enjoyable and I could not have imagined a better environment to learn
new things. Finally, I would like to thank J-P for peer support.
Thank You!
June 18, 2015, Espoo
Maria Puustinen

Contents
Preface ..................................................................................................................................... 4
1 Introduction ..................................................................................................................... 1
1.1 Aim of the work .................................................................................................... 3
1.2 Structure of the work ........................................................................................... 3
LITERATURE PART .................................................................................................................... 5
2 EU biofuel policy framework ............................................................................................ 6
2.1 Renewable Energy Directive and Fuel Quality Directive ...................................... 7
2.2 National legislation in Finland .............................................................................. 9
2.3 Interpretations of wastes and residues in EU member states ............................. 9
2.4 Certification schemes .........................................................................................14
2.5 Calculation of the lifecycle greenhouse gas emissions of biofuels ....................15
2.6 Future amendments of the EU directives ..........................................................21
3 Crude tall oil recovery in a kraft pulp mill ...................................................................... 23
3.1 Separation of crude sulfate soap........................................................................25
3.2 Acidulation with sulfuric acid .............................................................................26
3.3 Acidulation with spent acid from chlorine dioxide production ..........................28
3.4 Pre-acidulation with carbon dioxide ..................................................................30
4 Sulfur and sodium balances in the kraft pulping process .............................................. 32
4.1 Uncontrolled intakes and discharges of sulfur and sodium ...............................35
4.1.1 Wood, water, chemicals and fuels ........................................................35
4.1.2 Magnesium sulfate from oxygen delignification ...................................36
4.1.3 Air emissions ..........................................................................................36
4.1.4 Washing of pulp .....................................................................................36
4.1.5 Crude tall oil and turpentine .................................................................37
4.2 Controlled intakes and discharges of sulfur and sodium ...................................37

4.2.1 Mother liquid from acidulation plant ....................................................37
4.2.2 Spent acid from ClO2 manufacturing .....................................................38
4.2.3 Scrubber salts ........................................................................................39
4.2.4 Make-up chemicals ................................................................................40
4.2.5 Fly ash from the electrostatic precipitators ..........................................40
4.3 The impact of acidulation in a typically balanced pulp mill ...............................41
APPLIED PART ......................................................................................................................... 43
5 Defining the acidulation process emissions in a kraft pulp mill ..................................... 44
5.1 System boundary and calculation method .........................................................44
5.2 Basis for calculation ............................................................................................50
5.2.1 Reference pulp mill chemical recovery cycle ........................................50
5.2.2 Acidulation plant ...................................................................................52
5.2.3 Emission factors .....................................................................................54
5.3 Calculation of greenhouse gas emissions of acidulation processes ...................55
5.3.1 Pulp mill balances ..................................................................................55
5.3.2 Emission calculations .............................................................................62
5.4 Sensitivity analysis ..............................................................................................66
6 Discussion and recommendations ................................................................................. 73
7 Conclusions .................................................................................................................... 76
References ............................................................................................................................. 78

1
1 Introduction
In order to mitigate global warming, the European Union has set targets to decrease
greenhouse gas emissions and to increase the use of renewable energy in its member
states. By the year 2020, 10% of transport fuels used in EU shall be renewable. The
biofuels counted towards the target have to fulfill a certain sustainability criteria, one of
which being a minimum greenhouse gas emissions saving in comparison to fossil fuel. [1]
The general principles for calculating the lifecycle greenhouse gas emissions of a fuel, are
presented in EU directives, but are in many ways open to interpretation.
Depending on the feedstock, different emission calculation rules are applied. One
particularly debatable matter relates to defining waste and residue feedstocks. Current
EU directives do not define wastes or residues, but state, that for the calculation of
lifecycle greenhouse gas emissions of biofuels produced from wastes or residues, no up-
stream emissions before the generation of the residue have to be taken into account [1].
This means, that the process where the waste or residue is generated is left outside the
system boundary of calculation and the emissions of a waste or residue are set to zero. A
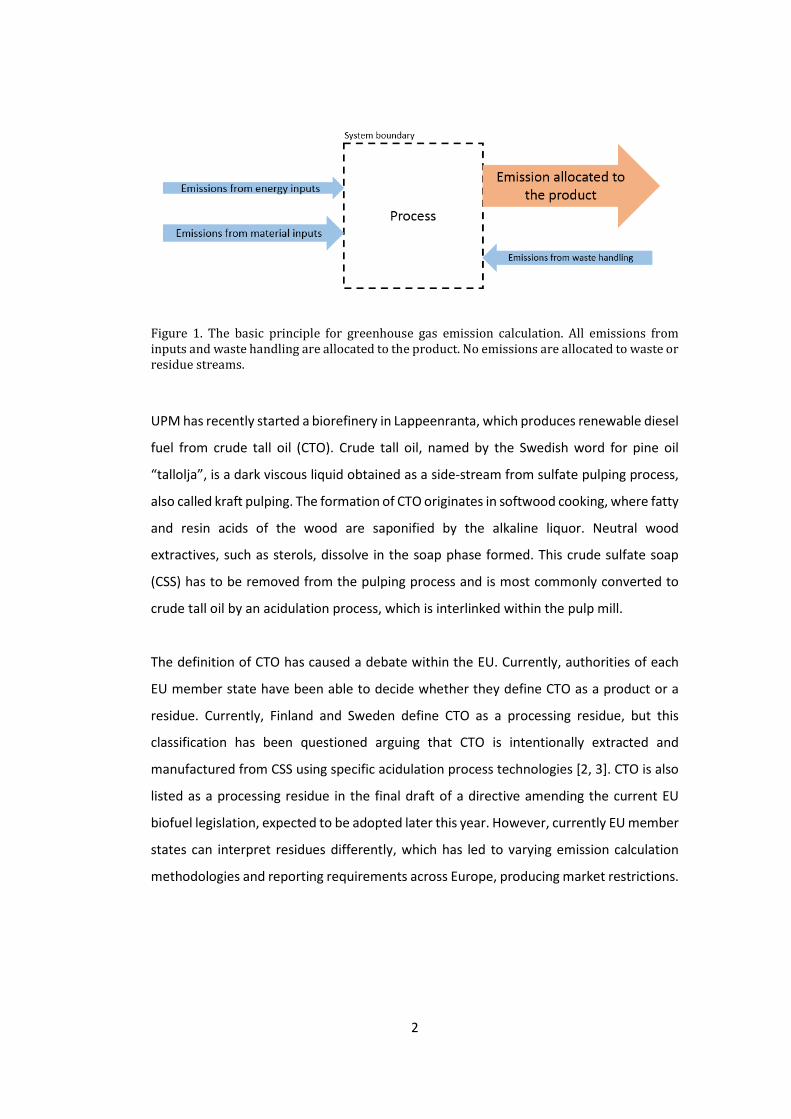
simplified principle of the lifecycle emission calculation is presented in Figure 1. The
process emissions are defined by the emissions from production of the energy and
material inputs used inside the system boundary, direct emissions generated and
emissions created in handling of the waste streams. These emissions are calculated based
on the quantities of inputs used and wastes created, which are converted to emissions
using input and waste specific emissions factors. As the emissions of waste and residue
streams are considered zero, all emissions are then allocated to the product or products
of the process.
2
Figure 1. The basic principle for greenhouse gas emission calculation. All emissions from inputs and waste handling are allocated to the product. No emissions are allocated to waste or residue streams.
UPM has recently started a biorefinery in Lappeenranta, which produces renewable diesel
fuel from crude tall oil (CTO). Crude tall oil, named by the Swedish word for pine oil
“tallolja”, is a dark viscous liquid obtained as a side-stream from sulfate pulping process,
also called kraft pulping. The formation of CTO originates in softwood cooking, where fatty
and resin acids of the wood are saponified by the alkaline liquor. Neutral wood
extractives, such as sterols, dissolve in the soap phase formed. This crude sulfate soap
(CSS) has to be removed from the pulping process and is most commonly converted to
crude tall oil by an acidulation process, which is interlinked within the pulp mill.
The definition of CTO has caused a debate within the EU. Currently, authorities of each
EU member state have been able to decide whether they define CTO as a product or a
residue. Currently, Finland and Sweden define CTO as a processing residue, but this
classification has been questioned arguing that CTO is intentionally extracted and
manufactured from CSS using specific acidulation process technologies [2, 3]. CTO is also
listed as a processing residue in the final draft of a directive amending the current EU
biofuel legislation, expected to be adopted later this year. However, currently EU member
states can interpret residues differently, which has led to varying emission calculation
methodologies and reporting requirements across Europe, producing market restrictions.

3
1.1 Aim of the work
The residue status of CTO has been questioned due to the alleged intentional
manufacturing of CTO in the acidulation process. Therefore, it is important to understand
the effect of acidulation process to the total greenhouse gas emissions of a CTO based
biofuel, although in Finland these emissions do not currently need to be reported. In this
work, the emissions of typical acidulation processes are studied with regards to EU
legislation. As the acidulation process is normally integrated with the kraft pulping
process, this work focuses on the separation of acidulation-induced emissions from the
pulp production caused emissions in the pulp mill.
The purpose of the work is to:
1) Create and implement a method for calculating the greenhouse gas emissions of
CSS acidulation to CTO in selected typical kraft pulp mill integrated processes. The
method shall be in line with EU biofuel policies.
2) Determine if acidulation emissions can be separated from the pulp production
emissions in a kraft mill and
3) Provide recommendations on how CTO should be classified in EU biofuel
legislation.
1.2 Structure of the work
The literature part consists of three chapters. Chapter 2 presents the policy framework
and resulting authority requirements for the biofuel lifecycle emission calculations in EU.
Chapter 3 provides an overview of the main types of acidulation processes. The effects of
acidulation processes on the material and energy balances of the pulp mill are studied in
chapter 4. The purpose of the evaluation is to determine, if possible indirect emissions
created elsewhere in the pulp mill due to acidulation should be considered in the
calculations.

4
In the applied part, definitions for the system boundaries for emissions calculation are
presented, according to the information collected. Corresponding methods for emission
calculation are applied for the most common acidulation process types integrated with a
kraft mill, and the generalizability of the results is estimated in a sensitivity analysis.
Finally, the residue status of CTO is discussed in the light of the findings and conclusions
are drawn.

5
LITERATURE PART

6
2 EU biofuel policy framework
The European Union has recognized increasing the use of biofuels and bioliquids as one
of the main ways to mitigate climate change. Biofuels are defined as liquid or gaseous
fuels produced from biomass and used for transport. Bioliquids, on the other hand, are
liquid fuels used for energy purposes other than transport. As production of biofuels is
still economically uncompetitive with fossil fuels, the biofuel market is dependent on legal
obligations and financial support, such as tax reliefs or investment aid. In EU, the main
policies enhancing the use of biofuels are set in the Renewable Energy Directive (RED) [1]
and the Fuel Quality Directive (FQD) [4], which are presented in section 2.1. In these
directives, obligations to increase the use of biofuels are set for each member state, as
well as sustainability criteria for the biofuels to be counted towards these targets.
However, as the legal acts of EU are set as directives, they are non-specific in the means
of fulfilling these requirements and each member state has been obligated to adopt the
contents of the directives into their own national regulations. This has made different
interpretations of the directive possible and led to variations in the laws of different
member states. In Finland, the directives were adopted to national laws by the Act on
Biofuels and Bioliquids in 2013 [5] and in the amendment of the Distribution Obligation
Act in 2010 [6], presented in section 2.2.
Section 2.3 discusses the different interpretations of wastes and residues in EU member
states. The sustainability criteria applied for a fuel are dependent on the classification of
the feedstock. The compliance with the criteria is monitored through EU approved
certification schemes, which are presented briefly in section 2.4. The minimum
greenhouse gas emission saving criteria is equal for all biofuels, but it is calculated
differently for wastes and residues. Section 2.5 outlines the rules for the calculation of
greenhouse gas emissions. Finally, section 2.6 overviews the expected future changes in
the EU biofuel policies.

7
2.1 Renewable Energy Directive and Fuel Quality Directive
The most important policies regarding biofuels are set in the EU Renewable Energy
Directive (RED) 2009/28/EC [1] and the Fuel Quality Directive (FQD) 2009/30/EC [4]. Many
of the main provisions considering biofuels are present in both directives. EU-wide targets
for the shares of renewable energy are set in RED article 3. By the year 2020, the share of
renewable energy used in EU needs to be at least 20% of the total energy consumption
and 10% of the energy used in transport. RED Annex I presents individual renewable
energy targets for each member state, with the target for Finland being 38 % of the total
consumption of energy by 2020 [1]. FQD, on the other hand, sets environmental
specifications for the fuels used in EU [4].
Both RED and FQD describe the sustainability criteria that biofuels need to fulfill in order
to be counted towards renewable energy targets. In RED, the criteria are presented in
article 17. If the criteria are not met, the fuel is regarded as fossil when calculating the
fulfillment of the targets and obligations. Furthermore, fuels that fail to meet the criteria
will not be eligible for financial support set for promoting the use of biofuels and
bioliquids. The main contents of the sustainability criteria are the following: [1, 4]
I. Setting of minimum greenhouse gas emission savings:
The greenhouse gas emission saving from the use of biofuels and bioliquids has
to be at least 35% until the end of the year 2016 and from 2017 at least 50%. For
new installations (production started on 2017 or after), the greenhouse gas
emission saving has to be at least 60% from the year 2018.
II. Excluding biomass feedstocks obtained from land with high biodiversity:
Raw material obtained from primary forest, from areas designated for nature
protection purposes or from highly biodiverse grassland cannot be used for
production of biofuels or bioliquids.

8
III. Excluding biomass feedstocks obtained from land with high carbon stock:
Raw material obtained from high carbon stock land, such as wetlands or forests,
cannot be used for production of biofuels or bioliquids unless the land use status
is not changed after January 2008.
IV. Excluding biomass feedstocks obtained from dried peatland:
Raw material obtained from land that was peatland in January 2008 cannot be
used for the production of biofuels or bioliquids unless evidence is provided that
the cultivation and harvesting of that raw material does not involve drainage of
previously undrained soil.
RED states that if a biofuel or bioliquid fulfills these criteria, member states should require
no other sustainability criteria to be met for taking the bioliquid or biofuel into account in
their renewable energy share calculations. Biofuels and bioliquids only need to
accomplish the minimum greenhouse gas saving if produced from waste and residues,
other than agricultural, aquaculture, fisheries and forestry residues. For these biofuels
sustainability criteria II-IV are not considered. [1] However, neither RED nor FQD does
specify the means to define wastes and residues. Specifications for calculating the
greenhouse gas saving of a biofuel or bioliquid are provided in both directives and
presented in more detail in section 2.5. [1, 4]
In addition to renewable energy targets and sustainability criteria for biofuels and
bioliquids, RED tries to mitigate climate change by presenting a concept for promoting the
use of advanced biofuels. The so-called double counting rule presented in article 21
means that biofuels made from wastes, residues, non-food cellulosic material, and ligno-
cellulosic material are counted towards the targets twice their energy content. [1] Thus,
a fuel supplier can fulfill a 20% biofuel distribution obligation by mixing only 10% of
advanced biofuels with a fossil fuel. Therefore, in theory, the value of an advanced biofuel
is enhanced by the price difference between fossil and traditional biofuel when compared
to other biofuels. Although RED presents double counting as mandatory, it has not been
adopted for use in all EU member states. Moreover, different interpretations of the term
residue result to varying double counting rules in different countries.
9
2.2 National legislation in Finland
Finnish biofuel policy is based on Act on Biofuels and Bioliquids 393/2013 [5] and the
Distribution Obligation Act 446/2007 [6] which implement the policies of RED and FQD
with additional national targets and methods for assuring the sustainability of biofuels in
Finland. Act on Biofuels and Bioliquids adopts the sustainability criteria of RED and FQD
to Finnish legislation and describes how the compliance of the criteria shall be proved. In
Finnish legislation, a fifth sustainability criterion is added to the four criteria presented in
RED. The fifth criterion extends the conditions of EU agricultural subsidies, regarding good
practices and environmental performance, to apply also to cultivation of biofuel
feedstocks.
The Distribution Obligation Act sets a national target for gradually increasing the share of
renewable energy used in transport to 20% by the year 2020. This is done by obligating
the fuel distributors to supply biofuels to consumption in increasing shares. The obligated
shares are 8% of the total supplied energy content for the year 2015, 10% for 2016, 12%
for 2017, 15% for 2018, 18% 2019 and 20% for 2020 and after. The biofuels supplied must
fulfill the sustainability criteria adopted in Act on Biofuels and Bioliquids. Double counting
is used for advanced biofuels made from waste, residue, non-food cellulosic and ligno-
cellulosic raw materials as set in RED. [6]
2.3 Interpretations of wastes and residues in EU member states
According to RED, the use of wastes and residues as a biofuel feedstock is promoted in
three ways. First, the greenhouse gas calculation is eased for wastes and residues, as no
emissions are allocated to them before the waste or residue is generated. Second, the
traceability requirements for wastes and residues, other than agricultural, aquaculture,
fisheries and forestry residues are reduced, as the sustainability criteria II-IV regarding the
origin of the feedstock are not considered. Third, biofuels produced from wastes and
residues should be double countable. [1] Yet, this is not the case in all member states.
10
EU directives do not currently provide definitions of wastes and residues, but in RED
Annex V examples of agricultural crop residues are listed and crude glycerine is given as
an example of a processing residue [1]. The first official EU document defining waste and
residue in the biofuel context is Communication from the Commission (2010/C 160/02)
which clarifies the possible practical implementation of the EU directives regarding
biofuels. EU Communications have no binding character but member states can
implement them in practice. [7]
The communication defines waste as any substance or object which the holder discards or
intends or is required to discard. Raw materials that have been intentionally modified to
count as waste (e.g. by adding waste material to a material that was not waste) should
not be considered as qualifying. In the communication, residues are listed to include
agricultural, aquaculture, fisheries and forestry residues, and processing residues.
Processing residue is defined as a substance that is not the end product(s) that a
production process directly seeks to produce. It is not a primary aim of the production
process and the process has not been deliberately modified to produce it. Crude glycerine,
already mentioned in RED, tall oil pitch, and manure are listed as examples of residues.
[7]
The decision on whether a certain feedstock is classified as waste or residue is in practice
made by the national authorities in each member state. In Finland, definitions of waste
and residue are included to both Act on Biofuels and Bioliquids and Distribution Obligation
Act and are in line with the definitions provided in the communication. [5, 6] The Finnish
legislation does not directly list any examples of substances regarded as wastes or
residues. However, article 38 of Act on Biofuels and Bioliquids mandates Energy Authority
to monitor the compliance of the legislation and, by petition, to provide advance
information on whether a specified substance will be considered waste, residue, non-food
cellulosic or ligno-cellulosic raw material and therefore be eligible for double counting.
The advance information is valid until further notice, and can be canceled by resolution
of judicial authority on the change of interpretation of provision or other particular

11
reason. [5] Currently, Energy Authority has considered crude tall oil, used as biofuel
feedstock by UPM, as a residue [8].
Wastes and residues are interpreted differently in different countries leading to situation,
where certain residue and waste based biofuels only have a market in countries that have
the same residue or waste classification for the raw material. Although a biofuel supplier
would provide an international certificate of compliance with the sustainability criteria for
a biofuel, it will not have market in countries, where the local legislation does not approve
it to be calculated towards the renewable energy mandate of this country. Classification
to waste or residue does neither always mean that the material is double countable. Some
countries, including Spain and Sweden have never adopted the double counting principle
presented as obligatory in RED and Germany has abolished double counting in the
beginning of the year 2015 [9].
Member states have also presented additional criteria for biofuels counted towards their
renewable energy targets, despite that this is straightforwardly prohibited in RED. For
example, in Belgium and Spain, only selected producers can supply biofuels towards their
biofuel mandate, and Germany has banned all fuels from animal fat feedstocks for even
single counting towards their mandate. [10] Yet, the European Commission has verified
the full transposition of the EU directives to the national laws of these member states
[11].
Examples of different interpretations of waste and residue materials, as well as double
counting, are compiled to Table 1. The table includes the current interpretations in
selected member states as well as the wastes and residues listed in EU documents. While
RED [1] is currently the only effective legislation listing examples of wastes and residue,
many member states have decided to follow the listing provided in Communication from
the Commission (CC) [7]. For comparison, the table also includes the final draft version of
ILUC directive [12], although it has not yet been officially adopted. The ILUC directive is
discussed in more detail in section 2.6.

12
Table 1. Wastes, residues and double counting in EU legislation and some member states according to public information. ILUC directive is included according to European Parliament second reading proposal. LÄHTEET[1, 7, 8, 10, 12–17]
Double counting in use
Double counting NOT in use
Listed as waste or residue
Feedstock Wa
ste
or
resi
du
e
acc
ord
ing
to
RE
D
Wa
ste
or
resi
du
e
acc
ord
ing
to
CC
Wa
ste
or
resi
du
e
acc
ord
ing
to
ILU
C
Fin
lan
d
Fra
nce
Ge
rma
ny
Ita
ly
Th
e N
eth
erl
an
ds
Sp
ain
Sw
ed
en
Un
ite
d K
ing
do
m
Animal fat /tallow category 1
Animal fat /tallow category 2
Animal fat /tallow category 3
Bagasse
BarkBiomass fraction of industrial waste not fit for use in
the food or feed chain
Branches, tree tops (forest residue)
Brown grease /grease trap fat
Brown liquor, black liquor
Cashew nut shell liquid (CSNL)
Corn /maize cobs
Crude glycerine
Crude tall oil (CTO)*
Empty Palm Fruit Bunches (EFB)
Fiber sludge
Food waste
Grape marc
Husks
Leaves and needles from forest industry
Lignin
Manure
Methanol from pulp processing
Nut shells
Organic municipal solid waste (MSW)

13
Double counting in use
Double counting NOT in use
Listed as waste or residue
Feedstock Wa
ste
or
resi
du
e
acc
ord
ing
to
RE
D
Wa
ste
or
resi
du
e
acc
ord
ing
to
CC
Wa
ste
or
resi
du
e
acc
ord
ing
to
ILU
C
Fin
lan
d
Fra
nce
Ge
rma
ny
Ita
ly
Th
e N
eth
erl
an
ds
Sp
ain
Sw
ed
en
Un
ite
d K
ing
do
m
Palm oil fatty acid distillate (PFAD)
Palm oil mill effluent (POME)Palm oil separated from silicate precipitate or waste
water sludge
Palm oil stearine
Palm sludge oil from POME
Pre-commercial thinnings from forest industry
Rapeseed residueRefinery fatty acids, residual acid oils, distillation
residues
**
Renewable component of end-of-life-tyres
Sawdust and cutter chips***
Sewage sludge
Slaughterhouse waste
Soapstock acid oil****
Spent bleaching earth
Starch slurry (low grade)
Straw
Sugar beet residues
Tall oil pitch
dc?
Technical corn oil (TCO)*****
Turpentine from pulp processing or tall oil
processing
Used cooking oil (UCO) entirely of vegetable originUsed cooking oil (UCO) entirely or partly of animal
origin
Waste pressings from production of vegetable oils
Wine lees
References[1] [7] [12] [8] [10,13] [14] [10] [15] [10] [16] [17]
** if original fatty acids are residues
*** with exceptions
**** when contaminated with sulfur
***** of genetically modified corn
* classified as advanced feedstock, but
not eligible for double counting
14
Positions towards CTO are varying. Currently, the decision-making authorities have
classified CTO as a residue only in Finland and Sweden. Sweden has not adopted the
double counting principle, making CTO double countable only in Finland. Italy has
classified CTO as an advanced biofuel, but not included it on the double counting list.
United Kingdom and The Netherlands have explicitly banned CTO from double counting.
In the Netherlands, this is due to interpretation that the double counting rules of RED are
not applicable for feedstocks that already have existing non-bioenergy uses. However, tall
oil pitch (TOP), listed as a residue in the Commission Communication, is double countable
in the Netherlands although, in addition to CTO, also TOP has existing uses in the chemical
industry [18].
In summary, the national regulations in EU member states vary from slightly different
interpretations on the definitions of waste and residue to direct violations of the EU
directives, as RED and FQD have not been adopted as such. In addition, the changes of
the policies have been unpredictable, which together with the inconsistency of the
interpretations make the business environment challenging for a biofuel supplier.
2.4 Certification schemes
According to RED article 18, both national or international voluntary schemes and
agreements can be used to measure greenhouse gas emissions savings and prove the
compliance with the sustainability criteria [1]. Communication from the Commission
2010/C 160/01 further clarifies this statement. According to the communication, the
compliance with sustainability criteria can be proved through an international voluntary
scheme, national scheme of an EU member state, or through bilateral and multilateral
agreements between EU and third countries. [19]
RED article 18 presents guidelines for a mass balance system, which has to be used by
economic operators to show compliance with the sustainability criteria. The main
requirement for the system is that incoming material to a mixture should have the same
quantity and sustainability characteristics than outgoing material from the mixture. The
mass balance system has to be designed so, that all sustainability characteristics of a
15
mixture of raw material or biofuel can be assigned to the corresponding fractions of the
mixture at all times. [1] The sustainability characteristics in this context mean the
compliance of sustainability criteria set in RED. As the first requirement is accomplishing
the minimum greenhouse gas saving, the lifecycle emissions of the biofuel have to be
monitored within the mass balance system. Member states are obligated to designate
biofuel suppliers to monitor and report biofuel lifecycle greenhouse gas emissions by the
Fuel Quality Directive. [4]
EU Commission currently approves 19 different voluntary certification schemes [[20].
Different schemes might have slight differences in the detailed calculation methods or
definitions of emissions factors, but all are based on the calculation rules presented in
Renewable Energy Directive. The calculation rules of RED, and more detailed instructions
for process emissions calculation according to Finnish national scheme and International
Sustainability and Carbon Certification (ISCC) are presented in the next chapter.
2.5 Calculation of the lifecycle greenhouse gas emissions of biofuels
The lifecycle greenhouse gas emissions are calculated following the basic principles of
lifecycle analysis (LCA) by taking into account emissions generated by all energy and
material inputs needed and wastes created along the supply chain of the biofuel within
the system boundaries set in RED. The analysis is extremely important, as despite of a
renewable raw material, an energy intensive production chain may also result to a biofuel
having higher greenhouse gas emissions than fossil fuel. The lifecycle greenhouse gas
emissions of a biofuel are always compared to those of a fossil comparator, and according
to the sustainability criteria set in RED, a minimum emission saving must be achieved.
In article 19, Renewable Energy Directive provides three options for the calculation of
lifecycle greenhouse gas emissions of a biofuel. First is to use default emission values for
production chains listed in the directive. Second option is to use real values calculated
according to instructions provided. Third option is to use default values in combination
with real calculated values. [1]
16
RED Annex V Part C clarifies the rules for calculating the greenhouse gas emissions of a
biofuel. The gaseous emissions taken into account for the greenhouse gas emission
calculation are carbon dioxide (CO2), nitrous oxide (N2O) and methane (CH4). The CO2
emissions include only fossil carbon, as the CO2 released in the incineration of biomass is
considered to have absorbed to the biomass when it is grown. Therefore, the incineration
of biomass results to zero CO2 increase when the total lifecycle greenhouse gas emissions
are considered.
The emissions are calculated as grams of CO2 equivalents per megajoule of fuel
(gCO2eq/MJ), for which the global warming potential of all greenhouse gases is
transformed to that of CO2. The factors for calculating the CO2 equivalence are the
following:
CO2: 1 gCO2eq/g
N2O: 296 gCO2eq/g
CH4: 23 gCO2eq/g
For renewable diesel produced from tall oil, no default values exist. Hence, real calculated
values have to be used. The general equation for lifecycle greenhouse gas emission
calculation is the following:
-. [/01234/.6] = 389 + 3; + 3< + 3=> + 3? – 3@9A – 399@ – 399B – 388 , (1)
where
E is the total emissions from the use of the fuel in gCO2eq/MJ of biofuel,
eec is the emissions from the extraction or cultivation of raw materials in gCO2eq/MJ
of biofuel,
el is the annualized emissions from carbon stock changes caused by land-use change
in gCO2eq/MJ of biofuel,
ep is the emissions from processing in gCO2eq/MJ of biofuel,
etd is the emissions from transport and distribution in gCO2eq/MJ of biofuel,
eu is the emissions from the fuel in use in gCO2eq/MJ of biofuel,
esca is the emission saving from soil carbon accumulation via improved agricultural
management in gCO2eq/MJ of biofuel,

17
eccs is the emission saving from carbon capture and geological storage in gCO2eq/MJ
of biofuel,
eccr is the emission saving from carbon capture and replacement in gCO2eq/MJ of
biofuel, and
eee is the emission saving from excess electricity from cogeneration in gCO2eq/MJ of
biofuel.
For biofuels and bioliquids produced from process residues, no extraction, cultivation, or
annualized emissions from land use change are reported, as emissions are considered
zero in the point where the residue is generated. Furthermore, no emission saving from
soil carbon accumulation via improved agricultural management can be accounted for
process residues. [1]
In the case of renewable diesel produced from tall oil, no carbon capture and storage or
replacement is performed and no emissions can be accounted for emission saving from
excess electricity from cogeneration. The emissions from the fuel in use are regarded as
zero for biofuels and bioliquids, as the carbon released in the burning of the fuel is
considered to have absorbed to the biomass when raw material is grown. The N2O and
CH4 emissions of the fuel in use are also excluded from the inspection as they are
presumed to be equivalent to the fossil fuel emissions from use. Therefore, for tall oil
renewable diesel the equation for calculation of the lifecycle greenhouse gas emissions is
reduced to the sum of processing emissions and emissions from transport and
distribution:
-. [/01234/.6] = 3< + 3=>. (2)
Emissions from processing, ep, include emissions created by handling of wastes and
leakages and emissions from the production of chemicals or products used in processing.
[1] For common substances, these can be taken into account by using emission factors
from references approved by sustainability scheme certifiers. Consumption of electricity
is taken into account by using average emission intensity of the production and
distribution of electricity in a defined region, if electricity is not produced in the fuel
production plant [1].

18
If several products are generated in the same process, the emissions created until that
point are allocated between the products in proportion to their energy content (lower
heating value, LHV). In addition to the process emissions, all previous emissions generated
by the raw material are also allocated between products. Wastes and residues are
regarded to have zero emissions at the point they are generated, so emissions are only
divided between products and by-products. [1]
Allocation takes place directly in the point where the by-products are generated. Yet, the
Renewable Energy Directive specifies, that in case fuels produced in refineries, unit of
analysis for the analysis shall be the refinery. [1] RED does not specify the concept of a
refinery, but for example in ISCC instructions, this is understood as interlinked processes.
According to ISCC and Finnish Energy authority, no allocation should be done before a
point where no energy or material feedback streams are connected to any up-stream
parts of the process. [21, 22] This means setting the system boundary to cover the whole
refinery, as pictured in Figure 2, and allocating emissions only for product streams exiting
the system boundary, not for intermediate products.
Figure 2. System boundary and allocation for a process containing interlinked process parts. Process part A and Process part B compose an interlinked process. [22]
Practical definitions of policy considering the setting of system boundaries for the
calculation of processing emissions are scarce. In RED, two directions are given, one being
19
the exclusion of analyzing interlinked processes separately and another is excluding
emissions from the manufacture of machinery and equipment from calculation [1].
Therefore, it is due to interpretation, if other indirect effects should be considered or not.
Certification scheme providers might apply varying rules, for example, the Finnish Energy
Authority states that indirect effects caused by the biofuel production should not be
included in the calculations [22], but does not specify which emissions are considered
indirect. The problems with defining the system boundary are especially significant when
calculating processing emissions for acidulation of CSS to CTO.
Emissions from transport and distribution, etd, consist of emissions from the transport and
storage of raw and semi-finished materials and from the storage and distribution of
finished materials. [1] For the calculation of transport emissions, routes and transport
modes need to be known.
When the total lifecycle greenhouse gas emissions of a fuel are known, the greenhouse
gas emission saving is calculated as:
I [%] = KLM – KLKLM
∗ 100 %, (3)
where
S is total emission saving percentage from the use of the biofuel,
EM is total emissions from the biofuel in gCO2eq/MJ of the biofuel, and
EMF is total emissions from the fossil fuel comparator in gCO2eq/MJ of the fossil fuel.
The fossil fuel comparator for renewable diesel is the average emission from fossil diesel
fuel, 83.8 gCO2eq/MJ. A newer value can be used, if such is available. [1]
When raw material logistic or processing emissions are calculated, it is often more
practical to calculate emissions per kg or ton of raw material, rather than per MJ of raw
material, so that the emissions can be allocated to products based on mass yields. ISCC
and Finnish Energy Authority instruct that the process emissions should be calculated
based on the following equations. The basis for the calculation is the previous year and
20
annual average figures can be used. The processing emissions created per kilogram of
product are:
EMP = QRSTSUVWXUXVY UZ[\]^_VXZ[`abcdeYW fgQRhSiV _WZj]UVXZ[`abcde
YW fgQRX[_]V\`abcdeYW fgQRki\VS kiVSW`abcde
YW flmnop^iX[ _WZj]UV`ab
YWf , (4) where
emission (EM) caused by the consumption of electricity is
EMnonrstmrmsl ruvwxyPsmuv = electricity `z{|lt f ∗ EFtn}muv~o nonrstmrmsl ym� `z}��e
z{| f, (5)
emission caused by the production of heat for internal use is
EM|n~s Ptupxrsmuv = fuel consumption `z}ltf ∗ EF�xno `z}��e
z} f, (6)
emission caused by each input, e.g. chemical, used in processing is
EMmvPxsw = inputs `z}ltf ∗ EF~ppmsmuv~o mvPxsw `z}��e
z} f, (7)
and emission caused by the treatment of waste waters from the process is
EM�~wsn �~snt = waste water ` oltf ∗ EF�~wsn �~snt `z}��e
o f. (8)
The emissions factors, EF, for each input and waste stream can be obtained from certain
lifecycle inventory databases [23, 24] or other source accepted by the auditor of the
sustainability scheme. The factors are estimates of the typical emissions generated in the
lifecycle, such as in manufacturing and distribution of the input, or handling of waste, per
unit of quantity of the input used or waste created. For energy inputs, the emissions
21
factors are regional and hence dependent on the forms of energy production in the
region.
2.6 Future amendments of the EU directives
The basic rules of emissions calculations are not expected to be changed in the near
future. However, amendments to the directives are pending. In April 28, 2015, the
European Parliament approved a second reading position of the so-called ILUC directive
[12], which amends EU biofuel policies set in RED and FQD. In this directive, the definitions
of wastes and residues are finally provided, and CTO is included in the list of processing
residues. The directive will still undergo legal-linguistic finalization, before it will be
accepted by the European Council and adopted to EU legislation. However, this procedure
is purely formal and no modifications to the contents will be made. After the adoption of
the ILUC-directive, the member states will have 24 months to implement the directive in
their national legislation, presumably, harmonizing the residue status of CTO in EU in the
year 2017.
The abbreviation ILUC in the name of the directive refers to indirect land use change. The
directive was first meant to tackle the problem of cultivated biofuel feedstocks causing
high indirect emission effects by expansion of croplands. However, the current ILUC
directive still does not require the ILUC emissions to be calculated towards to total
greenhouse gas emissions of a biofuel and thereby does not exclude non-emissions-saving
traditional biofuels to be counted towards the renewable energy targets. [12]
From the point of view of CTO utilization, the most important content of the ILUC directive
is that CTO is added in the Annex IX part A list of double countable feedstocks. The list
includes among others biomass fraction of wastes and residues from forestry and forest-
based industries, i.e. bark, branches, pre-commercial thinnings, leaves, needles, tree tops,
saw dust, cutter shavings, black liquor, brown liquor, fibre sludge, lignin and tall oil. In
addition, definitions of waste and residue are added to the new directive, in line with the
definitions provided in the EU communication, presented in section 2.3. After the
implementation of ILUC, biofuels made of CTO will also be counted towards a target set

22
for advanced biofuels. Each member state is obligated to set their own target, for which
a reference target of 0.5% of all energy used in transport is proposed. However, the target
can also be lower. [12]
The finalization of the ILUC directive has not ended the debate considering the residue
status of CTO. As concluded before, previous EU directives have not been implemented
in all member states as such, and the future will tell how individual member states decide
to interpret and implement the ILUC directive. However, the interpretations on wastes
and residues should be at least partly harmonized in the following years.
23
3 Crude tall oil recovery in a kraft pulp mill
As the acidulation process, where CTO is generated, is often used as an argument against
the residue interpretation, the emission effects of the acidulation process are studied in
this work. In this chapter, acidulation is described as a part of the kraft pulp mill chemical
recovery cycle, and three most common acidulation process types, concerning inputs and
outputs, are presented. As machinery is excluded from the processing emission
calculations by RED [1], the analysis of the processes is based purely on material and
energy balances, and the technology is not of interest.
Crude tall oil is produced by acidulation of crude sulfate soap, which is a side-stream
generated in the kraft pulping process. Kraft pulping, also known as sulfate pulping, is the
most commonly used pulp production method in the world. Acidulation process is
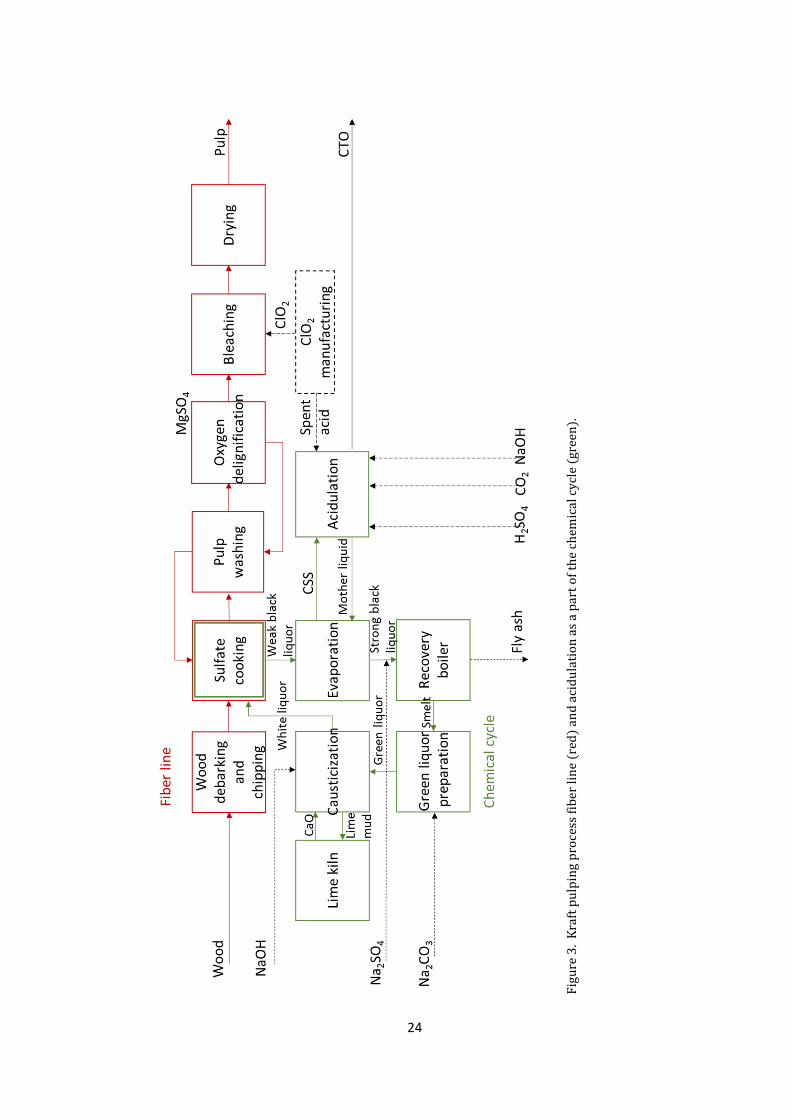
typically integrated with the kraft pulp mill, as seen in Figure 3. Hence, the setting of the
system boundary for process emission calculation is not straightforward. Acidulation is
interlinked with the pulp mill chemical recovery cycle (pictured in green in Figure 3) and
possibly also with bleaching chemical manufacturing. Inside the chemical cycle, the
needed additions of sulfur and sodium containing chemicals are dependent on the sulfur
and sodium balances of the mill, which are affected by acidulation. The acidulation
process increases both sulfur and water amount of the chemical recovery cycle. Hence,
acidulation may cause a need for sulfur removal elsewhere in the pulp mill and increase
the energy need of the evaporation plant. The effects of acidulation on the chemical
balances are studied in more detail in chapter 4.
24
Figure
3. Kr
aft pu
lping
proce
ss fib
er lin
e (red
) and
acidu
lation
as a p
art of
the c
hemi
cal cy
cle (g
reen).

25
The generation of CTO originates in the sulfate cooking of pulp. The sulfate process uses
white liquor, a mixture of sodium hydroxide (NaOH) and sodium sulfide (Na2S), as a
reagent in the pulp cooking, in order to separate the cellulose fibers of wood. As a side
reaction, the alkaline cooking chemicals saponify the fatty and resin acids of the wood
and form crude sulfate soap, where the neutral substances from the wood, such as
sterols, are dissolved.
Separation of cellulose fibers from the cooking mixture leaves a black liquor phase that
contains the hemicelluloses, lignin, and other extractives of the wood, as well as used
cooking chemicals and crude sulfate soap. The reacted cooking chemicals are recycled and
re-used through the chemical recovery cycle of the pulp mill (see Figure 3), and black
liquor is burned for energy in the recovery boiler. As a lighter phase, the foaming crude
sulfate soap rises on top of the black liquor and is separated by skimming from the top of
black liquor tanks. Finally, CSS is acidulated to crude tall oil, typically using sulfuric acid,
sometimes also carbon dioxide or spent acid form bleaching chemical plant. [25] The yield
of crude tall oil varies between 10-75 kg per air dried ton (ADt) of pulp, depending on the
trees used, where they have grown and how the logs have been stored [26]. A typical CTO
yield in Northern coniferous forest belt is 30-50 kg/ADt [27]. The next section, 3.1,
overviews the separation of crude sulfate soap and sections 3.2, 3.3 and 3.4 present the
three most typical acidulation processes, acidulation with sulfuric acid, acidulation using
spent acid and pre-acidulation with carbon dioxide.
3.1 Separation of crude sulfate soap
Separation of CSS from the black liquor is an established industrial practice at the pulp
mills for various reasons. First, the soap needs to be separated from the black liquor in
order to prevent fouling of the evaporators. Secondly, it is removed, as feeding soap to
the recovery boiler would cause control problems. [26] Thirdly, combustion of soap in the
recovery boiler would bind valuable recovery boiler capacity, which is unfavorable, as the
recovery boiler is the most expensive process part of the mill, and hence normally the
bottle neck of the pulp production [25].
26
Consequently, CSS, which has risen to the top black liquor, is skimmed away from the top
of liquor tanks before the liquor is fed to evaporation plant. The skimmed soap still
contains some black liquor, which is separated in decanter tanks, where the black liquor
falls to the bottom. [25] This second decanting phase is important in order to minimize
acid consumption in acidulation, as black liquor residue in CSS increases the acid need
[28].
After decantation tank, the separated CSS is pumped to acidulation plant. The acidulation
can be done in batches or in a continuous process and the separation technology of tall
oil can vary between decanting and centrifugal or hydrodynamic separation (HDS)
processes. [25] However, considering the processing emissions calculation, only the
inputs and outputs are of interest. Acidulation acid can be purchased sulfuric acid, but
also spent acid from a bleaching chemical plant, chlorine dioxide (ClO2) production, can
be used. The acid need, and therefore sulfur addition, can be reduced by pre-acidulation
by carbon dioxide. It would also be possible the use the salt cake, sodium bisulfite, from
SO2 scrubbers of the mill for pre-acidulation [29], but it is not known to be used in any
commercial pulp mill and is therefore not studied here.
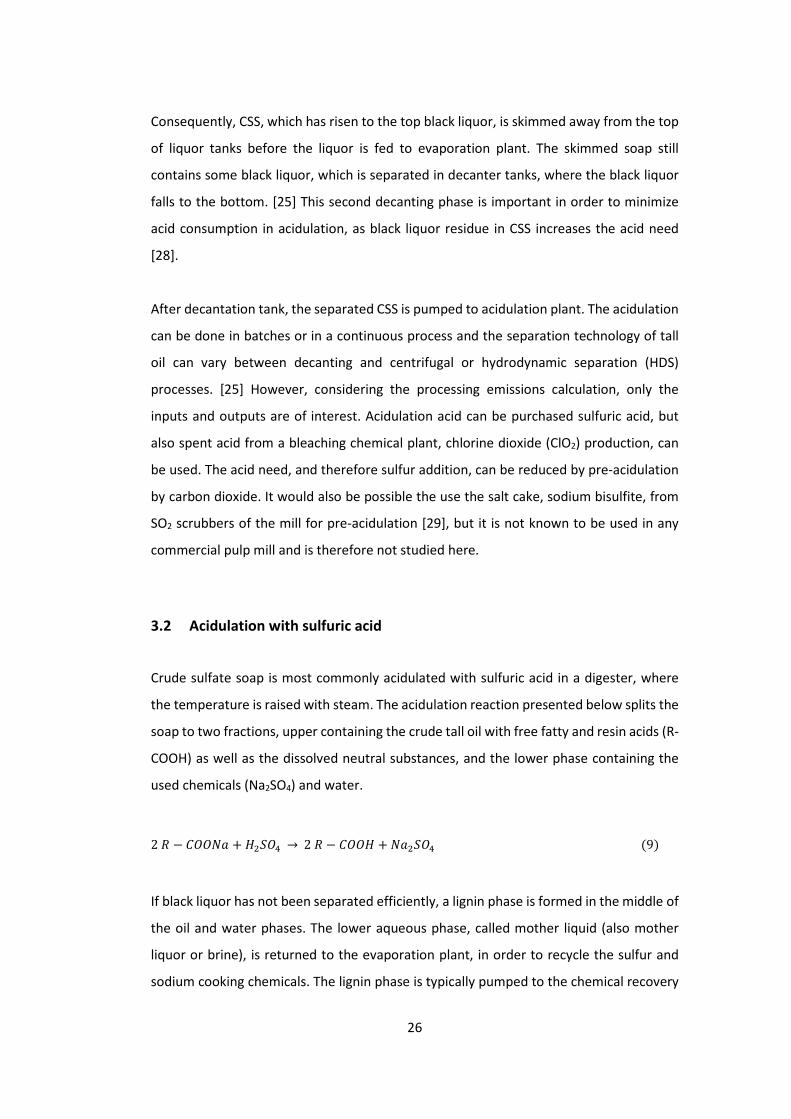
3.2 Acidulation with sulfuric acid
Crude sulfate soap is most commonly acidulated with sulfuric acid in a digester, where
the temperature is raised with steam. The acidulation reaction presented below splits the
soap to two fractions, upper containing the crude tall oil with free fatty and resin acids (R-
COOH) as well as the dissolved neutral substances, and the lower phase containing the
used chemicals (Na2SO4) and water.
2 � − 011�� + �2I1� → 2 � − 011� + ��2I1� (9)
If black liquor has not been separated efficiently, a lignin phase is formed in the middle of
the oil and water phases. The lower aqueous phase, called mother liquid (also mother
liquor or brine), is returned to the evaporation plant, in order to recycle the sulfur and
sodium cooking chemicals. The lignin phase is typically pumped to the chemical recovery

27
together with mother liquid, and burned for energy in the recovery boiler. [30] These
recycled streams interlink the acidulation plant with the pulp mill chemical cycle,
comparable to the concept of a refinery, presented in RED and pictured in Figure 2.
The H2SO4 acidulation process does not directly produce any greenhouse gases. The air
emissions from acidulation consist of sulfur gases, mainly hydrogen sulfide (H2S), which is
formed in low pH from the sulfide from the black liquor residues in CSS. The sulfuric gases
from the acidulation plant are led to scrubber, where they are washed with white liquor
or NaOH, forming Na2SO4 and NaHSO3 scrubber salts.
The theoretical need for H2SO4 in acidulation is 170 kg/ton of CTO produced, when only
the soap splitting reaction is considered. Black liquor residue in soap increases the acid
need [28], raising the typical value for H2SO4 consumption in an acidulation plant from
185 kg/ton of CTO to 240 kg /ton of CTO [27, 31]. An excess of acid is preferred in order
to secure that no unreacted soap is left in the reactor. The yield of CTO is generally
reported as yield per pulp produced, not per soap generated. This yield is therefore
dependent on the amount of fatty and resin acids and extractives of the wood as well as
the yield of soap recovery by skimming. The optimization of CTO yield from soap is mostly
made by ensuring the purity of soap and minimizing the remains of black liquor in the
soap phase [32].
A block diagram of the acidulation process is presented in Figure 4. First, CSS separated
from black liquor is pumped to a digester with H2SO4. Steam is used to raise the
temperature to approximately 100 °C and CTO, lignin and mother liquid phases are
separated. CTO is pumped to drying tank from the top of the digester, while lignin and
mother liquid are neutralized using NaOH or white liquor from the chemical cycle, and
returned to the chemical recovery cycle of the mill by feeding the mixture to the
evaporation plant. The drying of CTO is done using partial vacuum. [30]
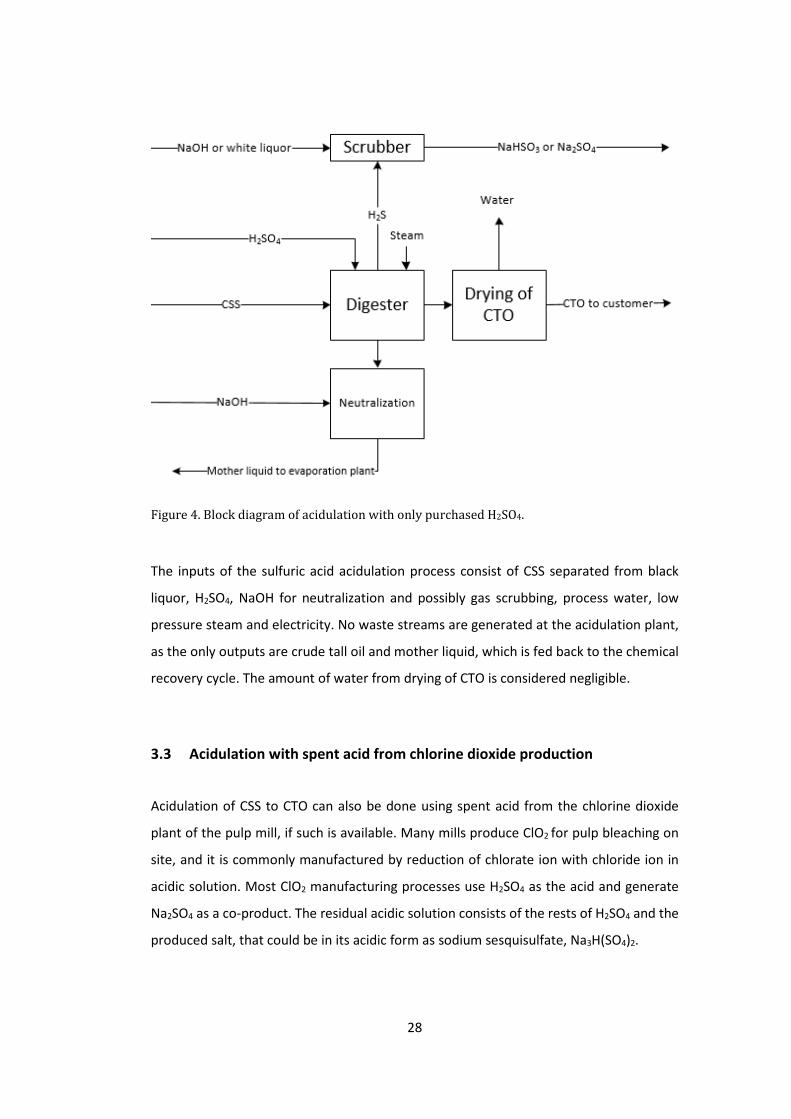
28
Figure 4. Block diagram of acidulation with only purchased H2SO4.
The inputs of the sulfuric acid acidulation process consist of CSS separated from black
liquor, H2SO4, NaOH for neutralization and possibly gas scrubbing, process water, low
pressure steam and electricity. No waste streams are generated at the acidulation plant,
as the only outputs are crude tall oil and mother liquid, which is fed back to the chemical
recovery cycle. The amount of water from drying of CTO is considered negligible.
3.3 Acidulation with spent acid from chlorine dioxide production
Acidulation of CSS to CTO can also be done using spent acid from the chlorine dioxide
plant of the pulp mill, if such is available. Many mills produce ClO2 for pulp bleaching on
site, and it is commonly manufactured by reduction of chlorate ion with chloride ion in
acidic solution. Most ClO2 manufacturing processes use H2SO4 as the acid and generate
Na2SO4 as a co-product. The residual acidic solution consists of the rests of H2SO4 and the
produced salt, that could be in its acidic form as sodium sesquisulfate, Na3H(SO4)2.

29
The spent acid solution can be used to substitute pure H2SO4 in acidulation, although also
other options for the utilization of the spent acid exist [26]. Using spent acid instead of
H2SO4 does not cause changes in the basic process, as seen in Figure 5. The need for spent
acid is adjusted according to the pH of the soap [30], but all in all the total acid
consumption is increased in comparison to using pure H2SO4 [28]. Spent acid consumption
is dependent on the composition of the spent acid stream, and could either substitute all
H2SO4 or be used with purchased acid. If sodium sesquisulfate is used, the consumption
could be as high as 1000 kg/ ton CTO [33].
Figure 5. Block diagram of acidulation using spent acid from ClO2 manufacturing plant.
Using spent acid in acidulation could be beneficial for the pulp mill, as the need for
purchased H2SO4 is reduced. However, spent acid is not available in pulp mills producing
unbleached pulp, or mills where ClO2 is not manufactured on site. The usability of spent
acid is also dependent on the ClO2 generation process. The most used ClO2 processes in
Finland, Mathieson, Erco R8, AHP and SVP processes, produce spent acid without chlorine
compounds, which can therefore be used for acidulation without causing corrosion
problems. [18, 26, 30, 34]
30
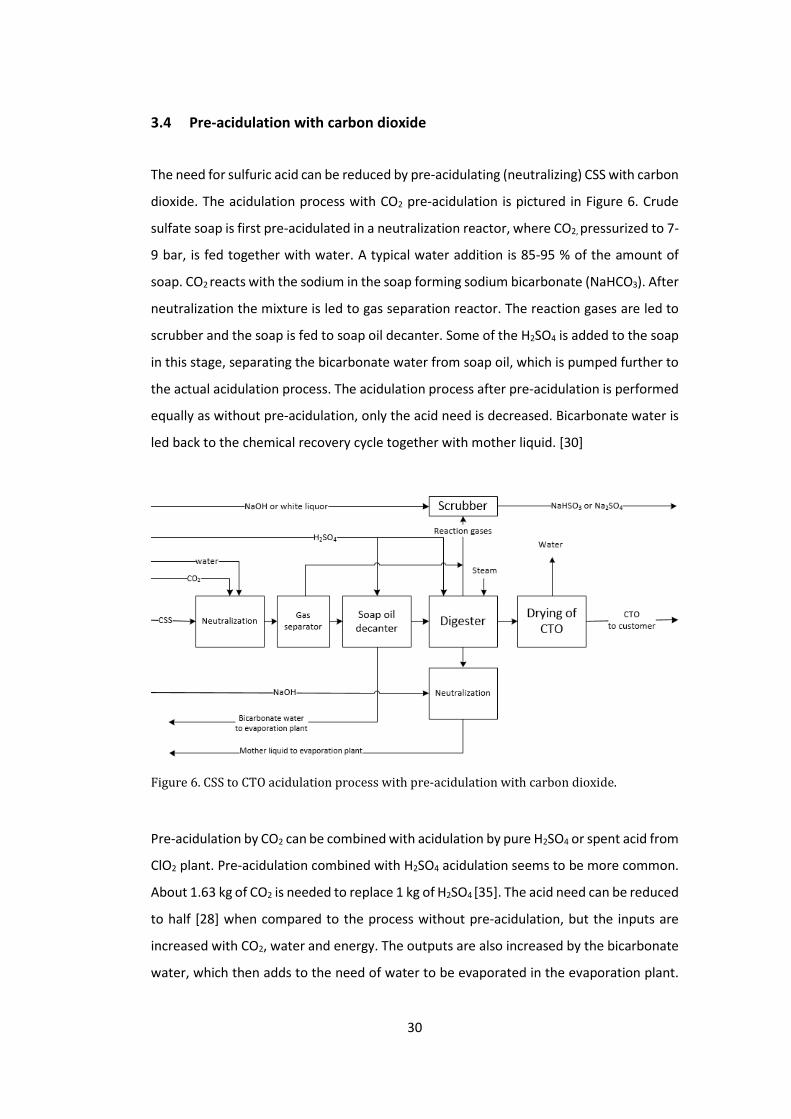
3.4 Pre-acidulation with carbon dioxide
The need for sulfuric acid can be reduced by pre-acidulating (neutralizing) CSS with carbon
dioxide. The acidulation process with CO2 pre-acidulation is pictured in Figure 6. Crude
sulfate soap is first pre-acidulated in a neutralization reactor, where CO2, pressurized to 7-
9 bar, is fed together with water. A typical water addition is 85-95 % of the amount of
soap. CO2 reacts with the sodium in the soap forming sodium bicarbonate (NaHCO3). After
neutralization the mixture is led to gas separation reactor. The reaction gases are led to
scrubber and the soap is fed to soap oil decanter. Some of the H2SO4 is added to the soap
in this stage, separating the bicarbonate water from soap oil, which is pumped further to
the actual acidulation process. The acidulation process after pre-acidulation is performed
equally as without pre-acidulation, only the acid need is decreased. Bicarbonate water is
led back to the chemical recovery cycle together with mother liquid. [30]
Figure 6. CSS to CTO acidulation process with pre-acidulation with carbon dioxide.
Pre-acidulation by CO2 can be combined with acidulation by pure H2SO4 or spent acid from
ClO2 plant. Pre-acidulation combined with H2SO4 acidulation seems to be more common.
About 1.63 kg of CO2 is needed to replace 1 kg of H2SO4 [35]. The acid need can be reduced
to half [28] when compared to the process without pre-acidulation, but the inputs are
increased with CO2, water and energy. The outputs are also increased by the bicarbonate
water, which then adds to the need of water to be evaporated in the evaporation plant.
31
Therefore, the pre-acidulation of CSS increases the energy need at the evaporation plant
in comparison to direct acidulation with H2SO4. As the sodium in bicarbonate water
originates from the sulfate cooking and carbonates are formed in the chemical recovery
anyway, the bicarbonate water addition to chemical cycle is estimated not to affect the
chemical balances. The sodium bicarbonate is converted to NaOH in causticization, which
returns the sodium to a usable form.
Pre-acidulation is favorable for pulp mills with high sulfidity, as it decreases the sulfur
addition to the chemical cycle. It also eases the control of the acidulation plant, as the pH
control is easier with CO2 than H2SO4. However, if sulfur additions are in any case needed
to balance the chemical cycle, replacing H2SO4 with CO2 is unprofitable.

32
4 Sulfur and sodium balances in the kraft pulping process
The acidulation process is interlinked with the chemical recovery cycle of the pulp mill,
making the pulp mill a refinery, when using specification given by sustainability scheme
providers [21, 22]. As stated in RED [1], the process emissions of a fuel produced in a
refinery, shall be analyzed considering the whole refinery. Hence, presuming that the
same basic rules apply for raw material processing, emissions of acidulation cannot be
studied simply on the acidulation plant level. The chemicals used in acidulation affect the
sodium and sulfur balance of the mill, and might cause a need to remove or add these
elements elsewhere. In this chapter, acidulation and other process parts affecting the
sodium and sulfur balance are studied. The aim is to determine if some input or waste
streams, created elsewhere in the pulp mill due to acidulation, should be included in the
processing emission calculation of crude tall oil.
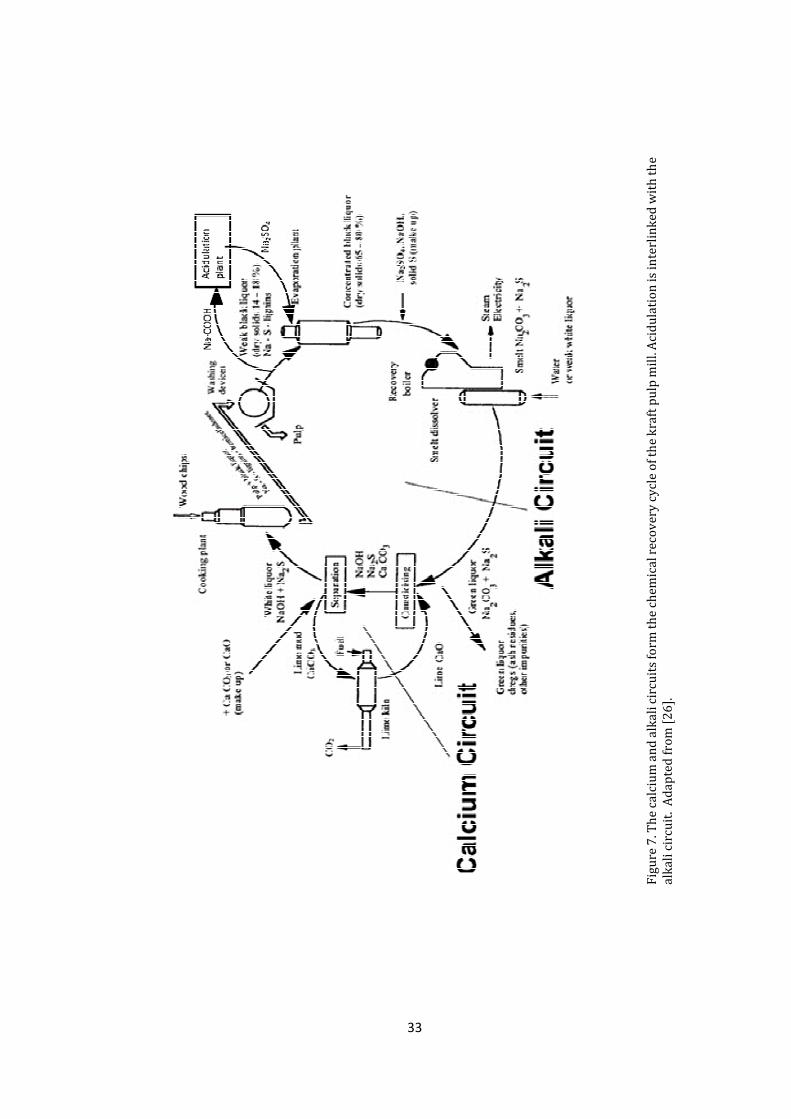
The chemical recovery cycle of the pulp mill, pictured in green in Figure 3, is used for
recycling the valuable cooking chemicals of the pulp mill from black liquor back to the
cooking of pulp. Actually, the chemical recovery cycle consists of two circuits, the calcium
circuit and the alkali circuit, presented in more detail in Figure 7. To maintain a proper
operation of the recovery cycle, chemical balances have to be controlled. The sulfur and
sodium balance is the most important chemical balance in the kraft mill, and the sodium
and sulfur cooking chemicals are recycled through the alkali recovery circle, to which
acidulation plant is interlinked.
33
Figure
7. Th
e calc
ium an
d alka
li circ
uits fo
rm th
e che
mical
recov
ery cy
cle of
the k
raft p
ulp m
ill. Ac
idulat
ion is
interl
inked
with
the
alkali
circu
it. Ad
apted
from
[26].

34
As seen in Figure 7, the alkali circuit is used to recover NaOH and N2S cooking chemicals
after they have reacted with lignin and acids of the wood. First, the reacted sulfur and
sodium are washed from the pulp to black liquor. Crude sulfate soap is separated from
the liquor, and led to acidulation plant, where sodium reacted with the fatty and resin
acids of the wood is converted to Na2SO4 by addition of H2SO4. If CO2 pre-acidulation is
used, some of the sodium is returned to the cycle in the form of NaHCO3. The mother
liquid, containing the acidulation chemicals, is returned to the alkali recovery cycle and
fed to evaporation plant together with the black liquor. After evaporation, concentrated
black liquor is burned in the recovery boiler, where sulfur and sodium are recovered in
the form of Na2S and Na2CO3. These salts are dissolved to weak white liquor or water, and
reacted with lime (CaO) from the lime kiln to recover the chemicals needed for pulp
cooking, Na2S and NaOH. This process part is called causticizing, where also calcium
carbonate, CaCO3, is formed. Finally, the carbonate is separated to be converted back to
CaO in the lime kiln, and NaOH and N2S are fed back to the cooking plant.
For proper operation of the mill, the amounts of sulfur and sodium in the cycle need to
be kept constant. Hence, the intakes and discharges of sodium and sulfur to and from the
balance need to be equal. [25] An important indicator describing the sulfur and sodium
balance in the pulp mill is sulfidity. Sulfidity indicates the share of sodium as Na2S in
comparison to the total active cooking chemicals Na2S and NaOH. Sulfidity at modern pulp
mills is normally 30-45% [25], in softwood pulping preferably 40-43%. Too low sulfidity
reduces the efficiency of cooking. [27] On the other hand, if sulfidity rises too high, the
sulfurous gas emissions increase, as the sulfidity searches equilibrium. This is why too high
sulfidity causes problems in the gas collection system. High sulfur content might also
cause corrosion in the process equipment. [25] This is why the sulfur and sodium intakes
to and discharges from the chemical cycle need to be controlled.
There are always small amounts of sulfur and sodium, as well as non-process elements,
such as potassium and chlorine, entering the mill with process inputs. As these cannot be
let to build up in the chemical recovery circle, the recovery circle in a pulp mill can never
be totally closed, as intakes need to be purged. Intakes of sulfur and sodium come from
wood, water and chemicals used in the pulping process. Discharges can happen either via
uncontrolled chemical losses to air, water and product streams, or in a controlled manner

35
by directing certain sulfur and sodium rich streams out of the chemical cycle. [31] In the
next sections, first uncontrolled intakes and discharges are presented in section 4.1. Then
the controllable intakes and discharges are introduced in section 4.2. Section 4.3
summarizes the typical ranges for sulfur and sodium intakes and discharges in a kraft pulp
mill and discusses the control strategy of the balance.
4.1 Uncontrolled intakes and discharges of sulfur and sodium
Sulfur and sodium intakes from wood, process water or chemicals used, and discharges
by air emissions or to product streams, are not controlled in the means of optimizing the
chemical balance of the mill. Naturally, the efficiency of pulp washing is controlled for
process reasons, and air emissions for environmental reasons, but as these variables are
not changed in order to optimize the chemical balance of the mill, they are presented as
uncontrolled and presumed to be constant in stabile operation of the mill.
4.1.1 Wood, water, chemicals and fuels
The wood and water used for pulping contain some sulfur, which is therefore continuously
added to the chemical cycle. Non-sulfurous chemicals used in the pulp mill may contain
some sulfur as impurity as well. In the EU Best available technology reference document
(BREF) for the production of pulp, paper and board [26], the amount of these sulfur inputs
through wood, water and chemicals is estimated to be 0.3-0.5 kg of sulfur /ADt of pulp,
which is well in line with UPM pulp mill reports [27]. In a separate study, sulfur addition
to the cycle with wood chips in a Finnish pulp mill has been determined to be 0.05-0.08
kg S/ADt [36], so most of the sulfur addition can be concluded to result to water and
chemical impurities.
In addition, fossil fuels used in the lime kiln or recovery boiler may add sulfur to the
balance. However, fossil fuels are seldom used in the chemical recovery cycle of the pulp
mill in normal operation, so their effect on the chemical balance can be estimated to be
negligible outside start-ups or shut-downs.
36
Sodium impurities in process inputs are significantly smaller than sulfur impurities.
Hardwood contains negligible amounts of sodium, while the amount in softwood chips
has been measured to be relatively higher, 0.03 kg Na/ADt [36]. Sodium intake through
wood, water and chemicals is often estimated to be negligible [27], but values up to 0.07
kg Na/ADt are reported [31].
4.1.2 Magnesium sulfate from oxygen delignification
Magnesium sulfate (MgSO4) is often added to the fiber line oxygen delignification stage,
as presented in Figure 3, in order to prevent heavy metal catalyzed degradation of
cellulose fibers. After delignification stage, MgSO4 is dissolved in the washing water, which
is then recycled back to the chemical recovery cycle, increasing the sulfur content of the
cycle. [25] The estimated addition of sulfur according to the BREF document is 0.0-0.8 kg
S/ADt [26].
4.1.3 Air emissions
Strong and weak odorous gases, mainly H2S and SO2, are collected from the recovery
boiler, lime kiln and vents of the pulp mill. According to best available technology (BAT),
odorous gases are either burned or scrubbed, and only residual gases are released to
atmosphere. Most of the sulfur from gas collection system is thereby absorbed to the
scrubber salts and removed as such, or returned to the chemical cycle. BAT-associated
emission levels for total sulfur in residual gases is 0.085-0.29 kg S/ADt when the emission
levels of lime kiln and recovery boiler are combined [37]. The flue gases do not contain
sodium.
4.1.4 Washing of pulp
Both sulfur and sodium are lost from the chemical cycle to the fiber line (see Figure 3 in
page 24), as washing of the pulp leaves a residual amount of the black liquor adsorbed to
the cellulose fibers. Best available technology for kraft pulping includes highly efficient
brown stock washing, which means that the chemical losses to pulp should be minimal
[37]. However, no definitions of efficient washing and related chemical losses are found.
Chemical losses of washing are proposed to be of 3.49 kg Na/ADt and 0.73 kg S/ADt [31].
An older study presents higher losses, 4.5 kg Na/ADt and 1.53 kg S/ADt [38]. Recent

37
measurements in a Finnish pulp mill reported measured losses of 2.60 kg Na/ADt and 0.62
kg S/ADt for softwood, when the mill was facing problems with pulp washing. As these
values were reported to be exceptionally high, it can be presumed that washing losses in
modern mills are lower. [36] Therefore, minimum washing losses of sodium and sulfur to
pulp are estimated to be 1.30 kg Na/ADt and 0.31 kg S/ADt, which are also in line with
UPM internal reports [27].
4.1.5 Crude tall oil and turpentine
Crude tall oil and turpentine, which is obtained from the vapors of the sulfate cooking
plant, are seldom mentioned in literature as possible outflows of sulfur and sodium.
However, sulfur losses with CTO have been estimated to be 0.1-1 kg S/ton of pulp [28].
UPM internal data provides data in line with these estimations, 0.15 kg S/ADt for sulfur,
and a small amount of sodium, 0.01 kg Na/ADt [27]. Significant amounts of sulfur can also
be lost from the chemical cycle through turpentine. In a modern Finnish mill, 0.1 kg S/ADt
was lost in turpentine stream. Turpentine did not contain any sodium. [36]
4.2 Controlled intakes and discharges of sulfur and sodium
In addition to uncontrolled intakes and discharges in a kraft pulp mill, there are several
sulfur and sodium rich streams where decisions on intakes or discharges can be made.
Sulfur and sodium additions of mother liquid from acidulation plant and spent acid from
ClO2 manufacturing could in theory be either sewered, used elsewhere, or lead to the
chemical cycle. In addition, directing salts of SO2 scrubbers and fly ash of the recovery
boiler electrostatic precipitators away from the cycle are controlled possibilities to
discharge sulfur and sodium from the balance. Finally, make-up chemicals can be added
to the cycle, if sodium or sulfur content is too low.
4.2.1 Mother liquid from acidulation plant
Mother liquid from the acidulation plant is practically always led back to the chemical
cycle of the pulp mill in order to recycle the cooking chemicals fed to the acidulation plant
in crude sulfate soap. If recycling of mother liquid was not done, losses through soap
would be 1.8-2.7 kg Na/ADt and 0.14-0.28 kg S/ADt [36, 38]. The sodium losses through

38
soap would be high without recovery, so the only economic solution is to return mother
liquid to the chemical cycle. Disposal of mother liquid might also cause problems in
wastewater treatment, as the remains of resin and fatty acids of CTO are toxic to aquatic
organisms [18, 39].
In acidulation, both sulfur and sodium amounts in chemical cycle are increased as H2SO4
or spent acid is used for acidulation and NaOH for neutralization of mother liquid.
According to one study, sulfur addition to cycle is 0.06-0.08 kg S/kg CTO if purchased
sulfuric acid is used. Hence, the sulfur addition is proportional to the yield of CTO.
Assuming 40 kg CTO/ADt yield the sulfur addition would be 2.4-3.2 kg S/ADt, similar to
the range reported in BREF document, 2-3 kg S/ADt [26]. If spent acid from ClO2
manufacturing is used in acidulation, the total sulfur addition is significantly increased in
comparison to acidulation by pure H2SO4. If pre-acidulation with CO2 is used, the sulfur
addition to cycle can be reduced to half, corresponding to 1.2-1.6 kg S/kg CTO produced.
[28]
Sulfur and sodium contents of the mother liquid can be calculated based on inputs to
acidulation plant, and known losses to CTO and air. In the applied part of this work, typical
sodium and sulfur contents of the mother liquid are determined separately for each of
the three process types presented.
4.2.2 Spent acid from ClO2 manufacturing
As described in section 3.3, chlorine dioxide is used in pulp bleaching, and is often
produced in the plant area by a process producing sulfuric acid and SO4 salts as co-
products. There are several possibilities to utilize this residue stream. The spent acid
stream can be used in acidulation of CTO, fed straight to the chemical cycle by feeding it
to the evaporator plant with the mother liquid [36], utilized elsewhere, for example as pH
adjustment in the fiber line [26, 28], or sewered [18]. The applicability of these choices is
dependent on the by-products of ClO2 process and the balance of the pulp mill.
Many processes for ClO2 production produce some chlorine or chloride compounds as by-
products. [26] Chlorine is not wanted to the chemical cycle as it could build up and induce
corrosion. The most common ClO2 processes in Finland, Mathieson, HP-A and R8

39
processes [34], provide chlorine free effluents. Spent acid effluent from these processes
is usable for acidulation and adds both sulfur and sodium to the chemical cycle. Effluent
from Mathieson process adds more sulfur to the chemical cycle than other process when
equal amounts of ClO2 are produced. [26, 30] The HP-A process produces both spent
sulfuric acid and Na2SO4, and the R8 process produces an acidic sodium sesquisulfate salt
cake [26, 40].The sodium sesquisulfate from R8 processes could be separated into H2SO4
and Na2SO4 [40], but is often used as such [36].
Although the spent acid is usable for acidulation, it is often preferably used for pH control
of pulp bleaching [27] and not taken to the chemical cycle at all. For example, according
to the environmental impact assessment of newest pulp mill planned to be built in
Finland, the best solutions for optimizing the mill sulfur balance, is not to direct the spent
acid to the chemical cycle at all and just try to minimize its quantity [41].
4.2.3 Scrubber salts
According to the BAT documents, odorous gases, mainly SO2, from different parts of the
pulp mill should either be burned or scrubbed in wet scrubbers [37]. As these odorous
gases have high content of sulfur without any sodium, it is often favorable for sulfidity
control not to let the sulfur return to the chemical balance. A common option to do this
is by scrubbing the gases with NaOH and thereby producing sodium bisulfite, NaHSO3,
which can be utilized further outside the chemical cycle in the acidification of bleached
pulp [36]. NaHSO3 is a common oxidizing chemical, so if no use for it is found inside the
pulp mill, it may be sold out for utilization in other processes. It could in theory be used
also for pre-acidulation of sulfate soap [29], but no commercial references of this are
found [25]. SO2 can also be scrubbed using white liquor, when Na2SO4 is produced.
If scrubber salts are washed with white liquor and returned to the chemical cycle, no
losses through scrubber salts exist. However, when NaHSO3 for other uses has been
produced the sulfur losses from the cycle have been 0.6 kg S/ADt. No sodium losses are
generated if external NaOH is used for scrubbing, but 0.7 kg Na/ADt losses through
scrubber salts are reported when white liquor is used. [36]
40
4.2.4 Make-up chemicals
If sulfur or sodium levels in chemical cycle are too low, the balance can be corrected by
adding make-up chemicals to the cycle. The quantities of needed sodium and sulfur make-
up are dependent on all other intakes and discharges of sodium and sulfur, and the make-
up chemicals are the most flexible way for balancing chemical deficit in the recovery cycle.
Traditionally the most common make-up chemical has been Na2SO4, but in modern high
sulfidity mills, additional sulfur is often not needed, and Na2SO4 has been replaced with
NaOH or Na2CO3 [18, 28]. NaOH can be added in several points of the chemical cycle [25,
28], Na2SO3 is added before caustizing [28].
4.2.5 Fly ash from the electrostatic precipitators
Excessive sulfur and sodium levels in the chemical cycle can be reduced by removing salts,
mainly Na2SO4, from the fly ash collected by the electrostatic precipitators of the recovery
boiler. In modern mills, an excess of sodium is not typical without concurrent excess of
sulfur. Even more typically, only sulfur excess exists. Fly ash removal always diminishes
the amounts of both sulfur and sodium, and if the reason for fly ash removal is sulfur
excess, removed sodium has to be replaced by adding NaOH or Na2CO3 make up to the
balance. [25]
In addition to controlling sulfur and sodium balance, fly ash removal is a good way to
purge non-process elements, such as potassium and chlorine, out of the chemical cycle,
as they concentrate in the recovery boiler. Typically, some fly ash is always removed for
this reason. A modern way to do this is by using ash-leaching technologies, where non-
process elements are dissolved to acidic water and directed to waste water treatment, as
most Na2SO4 stays in solid form and can be recycled as a slurry back to the recovery cycle.
Na2SO4 losses to wastewater are around one third of the total amount for maximal
removal of non-process elements. [42] In this work, the minimum fly ash discharge is
estimated to be 0.132 kg S/ADt as Na2SO4, based on 33% fly ash loss to wastewater from
the total amount of sulfur in fly ash, 0.4 kg S/ADt [28].
If ash-leaching is not used, the fly ash can be removed by dissolving it into water and
directing it to waste water treatment [25]. Fly ash from pulp mills has also been

41
successfully utilized as a hardener for filling mine cavities and as a filler in asphalt mass
[43]. It can also be granulated and recycled back to the forest as a fertilizer [44].
4.3 The impact of acidulation in a typically balanced pulp mill
As concluded in earlier chapters, sewering mother liquid from acidulation is not a practical
option for pulp mills, and therefore the sulfur and sodium additions from acidulation to
the chemical balance have to be considered a default intake. Spent acid from ClO2
manufacturing on the other hand has other uses outside the chemical cycle and not
directing it to the chemical cycle is a preferred choice in many modern pulp mills, if it is
not used for acidulation. In the probable case, that spent acid is not taken to the chemical
cycle, acidulation intake forms a major part of all sulfur input to the balance. The role of
acidulation as a sulfur intake becomes even more emphasized when no external sulfur
containing fuels are used in the pulp mill.
Table 2 summarizes the ranges found for typical kraft mill sodium and sulfur intakes and
discharges. According to conclusions drawn, the more probable ends of the ranges are
marked with bolded values. These are zero intakes from fuels and spent acid, and zero
discharge of sodium in scrubber salts, when external NaOH is used for scrubbing. By
estimation, a minimum of 0.13 kg S/ADt as Na2SO4 has to be removed from the fly ash of
electrostatic precipitators in order to purge non-process elements from the cycle. [18, 31]
Increasing fly ash removal or adding make-up chemicals are the simplest ways to control
the sulfur and sodium balances of the mill and the quantities vary depending on other
uncontrolled intakes and discharges.
The impact of acidulation on the operation of the pulp mill is also dependent of the other
intakes and discharges of sulfur in the mill. Depending on the pulping process and its
integrations affecting the chemical balance, acidulation of CSS to CTO could lead to excess
amounts of sulfur in the balance, increase the need for fly ash removal from the
electrostatic precipitators and therefore add the need for make-up NaOH. However, if
discharges from the chemical cycle are greater than intakes without acidulation, the sulfur
addition from mother liquid can also be necessary for balancing the pulp mill. If that case,
42
sulfur addition from acidulation reduces the need for sulfur containing make-up
chemicals.
Table 2. The ranges of sulfur and sodium intakes and discharges in a typical kraft pulp mill. Bolded values are considered more typical than the other end of the range. Make-up chemical intake and fly ash discharge are altered so that the intakes and discharges are balanced.
In conclusion, acidulation process is strongly integrated with the pulp mill and therefore
the effects of acidulation on the chemical balance cannot be excluded from the
calculations of acidulation emissions. Moreover, the operation of the chemical cycle is
optimized as a unity in order to optimize the pulp production process and changes in some
parts of the cycle could affect the control strategy of others. For these reasons, a model
of a typical pulp mill balance is not easy to define, and conclusions should not be based
on results obtained using single starting values. In the next part of the work, the emissions
of acidulation are hence calculated with estimated typical values, and studied over the
ranges presented here.
Sulfur Sodium
Range References Range References
Intakes in a
kraft mill (kg/ADt)
Wood, water and
chemicals 0.3-0.5 [26, 34] 0.0-0.07 [27]
MgSO4 from
delignification 0.0-0.8 [26, 34] 0.0 [34]
Fuels 0.0-2.0 [26] 0.0 [34]
ClO2 waste acid 0.0-15.0 [26] 0.0-21.5
[26] as
Na2SO
Acidulation of CTO 1.2-3.2 [26, 27] 0.0-0.3 [27]
pH adjustment /Make-
up chemicals calculated calculated
Discharges
in a kraft
mill
kg/ADt)
Air emissions 0.05-1.0 [35, 41] 0.0 [44]
Scrubber salts 0.0-0.6 [34] 0.0-0.7 [36]
Fly ash from electrostatic
precipitators 0.13-
[28, 42]
calculated 0.19-
[28, 42]
calculated
Washing losses in fiber
line 0.3-1.5 [38] 1.3-4.5 [38]
Crude tall oil 0.1-1.0 [27] -0.01 [27, 36]
Turpentine 0.0-0.1 [36] 0.0 [36]

43
APPLIED PART

44
5 Defining the acidulation process emissions in a kraft pulp mill
The literature part summarized the policies and guidelines for the process emission
calculation and described the typical acidulation processes and their effect on the
chemical balance of the pulp mill. This chapter first presents a method for calculating
process emissions for acidulation, based on the information gathered, which was the first
objective of this work. Then, the method is used to calculate the acidulation emissions of
the three most typical process types presented and to analyze the sensitivity of the results
to changes in the acidulation process and pulp mill operation. Conclusions on whether the
acidulation emissions can be separated from the pulp production emissions are drawn
and deductions made regarding the residue status of CTO, based on the sensitivity
analysis and EU legislation presented in the previous part. The role of acidulation process
on defining the status of CTO is discussed in more detail in chapter 6 and conclusions are
summarized in chapter 7.
In this chapter, section 5.1 first presents the definitions of system boundaries and related
input and waste streams that need to be considered in the emission calculations of
acidulation. Section 5.2 lists the presumptions for calculations made, including the
balances and control strategy for the reference pulp mill used in calculations, based on
information gathered in chapter 4, and balances for the three typical acidulation
processes, presented in chapter 2.6. The calculation and results are presented in section
5.3 and finally, the sensitivity analysis, which provides the most important results of this
work, is made in section 5.4.
5.1 System boundary and calculation method
Acidulation process is directly interlinked with the pulp mill chemical recovery cycle and
affects the sulfur and sodium balance of the pulp mill, as concluded in the literature part.
This causes a challenge to the emission calculation, because defining the system boundary
is not as straightforward, as it would be for a separate process.

45
According to the EU Renewable Energy Directive as well as voluntary and national
certification schemes, the unit for the analysis of process emissions for interlinked
processes should be the refinery. This rule is set for calculating the process emissions of
biofuel production, but as no other specifications are given for any feedstock processing,
it is concluded that same rules apply throughout the whole production chain. In this
context, the refinery is the pulp mill. Consequently, emission allocation should be done
only for products exiting the balance area, when no more interlinkages exist between the
process parts. Thus, according to the EU policy, emissions of acidulation should not have
to be defined separately. This guideline is likely given, as the separation of emissions
between different process parts is not always possible.
Despite the initial controversy, the process emissions of acidulation can be calculated with
certain presumptions, keeping the system boundary set around the pulp mill, as defined
for refineries. In this approach, the emissions of a pulp mill with acidulation plant are
compared to the emissions that the pulp mill would have without the acidulation plant.
The pulp mill without the acidulation plant is assumed identical to the one with
acidulation, with the exception, that instead of processing CSS to CTO, CSS is directed
outside the pulp mill as such. Although CSS could be taken to acidulation for example to
another pulp mill, this is mainly a theoretical approach, in order to allow calculation of the
emissions from the creation of CSS to the creation of CTO. Combustion of CSS is not
regarded as a reference, as it is not comparable to a process where CTO can still be further
utilized.
Hence, the acidulation process emissions are calculated as pictured in Figure 8. The
approach is based on calculating
-.� = -.�,=�=A; − -.�,=�=A; , (10)
where
EMC is the total emissions caused by the acidulation process in the whole pulp mill,
EMA,total is the greenhouse gas emissions of a whole pulp mill with an integrated acidulation
process and
EMB,total is the greenhouse gas emissions of a whole pulp mill without an acidulation
process, CSS being directed outside the mill.
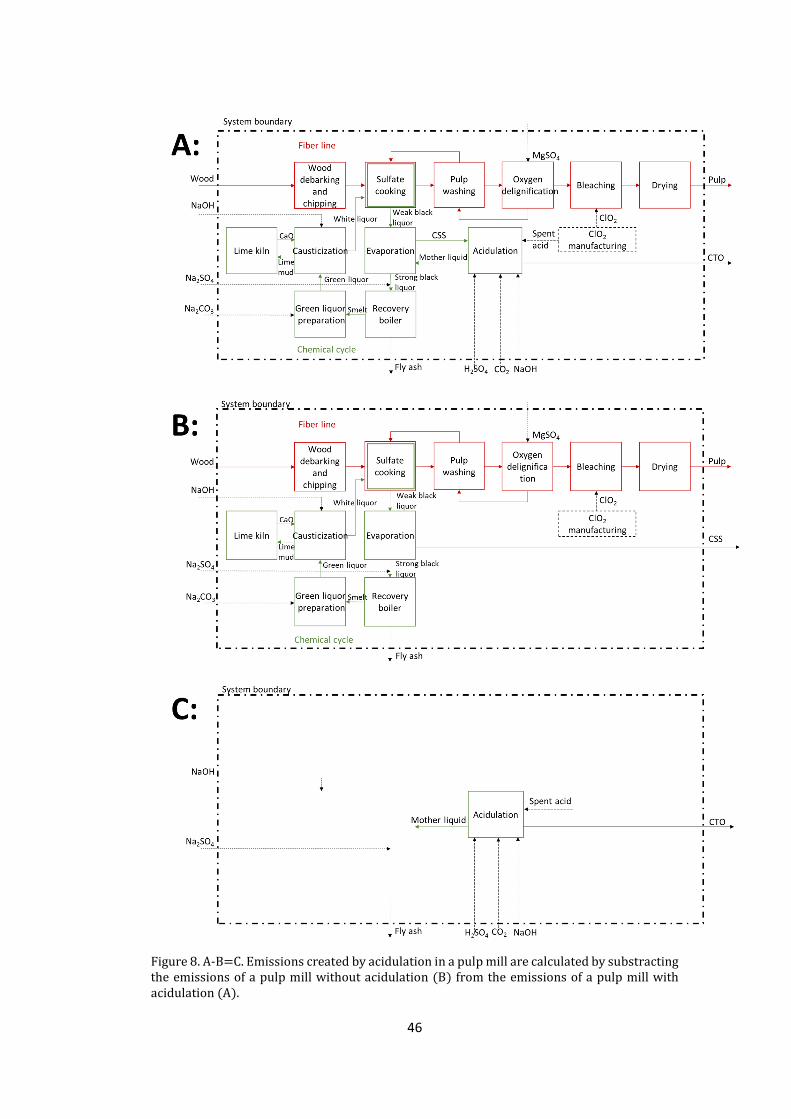
46
Figure 8. A-B=C. Emissions created by acidulation in a pulp mill are calculated by substracting the emissions of a pulp mill without acidulation (B) from the emissions of a pulp mill with acidulation (A).

47
In order to simplify the calculations, the emissions of the pulp mill A, EMA and pulp mill B,
EMB do not have to be determined in totality. As the interest is in their remainder, the
emissions of all streams that are equal in mill A and mill B can be excluded from the
calculations, as their effect on EMC is zero. Hence, only the difference is intakes and
discharges form the pulp mills A and B is estimated. According to information gathered in
chapters 3 and 4, the intake and discharge streams affected by acidulation are acidulation
inputs and in the chemical recovery cycle the make-up chemical need and fly ash
discharge need. In addition, electricity and steam use of the whole mill are increased in
mill A, compared to mill B without acidulation. These streams, except the difference
energy need, are all pictured for process C in Figure 8 and the calculation is based on these
differences.
When excluding the emissions that stay constant in both mill A and mill B, the calculation
reduces to:
-.� = -.�,=�=A; − -.�,=�=A; = -.� − -.�, (11)
where
EMC is the total emissions caused by the acidulation process in the whole pulp mill,
EMA is the greenhouse gas emissions of the pulp mill with an integrated acidulation
process when only the acidulation inputs, make-up chemical need, fly ash
discharge and energy consumption are considered and
EMB is the greenhouse gas emissions of a whole pulp mill without an acidulation
process, CSS being directed outside the mill, when only the make-up chemical
need, fly ash discharge and energy consumption are considered.
The total emissions caused by acidulation, EMC, are therefore determined by the inputs
in acidulation, and in the changes of controlled intake and discharge of sulfur and sodium
in the chemical recovery cycle of the pulp mill. The chemical balances are controlled by
adding make-up chemicals, Na2SO4 or NaOH, if there is a deficit of sulfur or sodium, and
by removing fly ash from electrostatic precipitators of the recovery boiler, if there is
surplus of sulfur or sodium. All these emissions are calculated and allocated to CTO exiting
the process, as pictured in Figure 9.

48
Figure 9. The emissions allocated to crude tall oil are calculated as a sum of emissions created by acidulation inputs (blue clouds), emissions created or reduced by the change (EMA-EMB) in the need of make-up chemicals (red clouds) and emissions created by the change (EMA-EMB) in the generation of wastewater treatment of the fly ash slurry (green cloud). In addition, the change in the energy consumption of the mill is considered.
The emissions of acidulation for process C in Figure 8 can be calculated following
Equations 4 to 8 as:
3<,� ` z}��esuv ���f = �-.8;89=B�9�=� 9��@?�<=���,� − -.8;89=B�9�=� 9��@?�<=���,�� +
�-.�8A= <B�>?9=���,� − -.�8A= <B�>?9=���,�� + �-.��<?=@,� − -.��<?=@,�� + �-.�A@=8 �A=8B,� −-.�A@=8 �A=8B,�� (12)
where
emission caused by the consumption of electricity for each case is
-.8;89=B�9�=� 9��@?�<=���,� ` z}��esuv ���f = 3 3¡¢£¤¡¤¢¥ ` z{|
suv ���f ∗ EFnonrstmrmsl xwnp mv s|n PxoP ymoo `z}��ez{| f,
(13)
emission caused by the production of heat, equal to the internal consumption of low
pressure steam is
EM|n~s Ptupxrsmuv,m ` z}��esuv ���f = fuel consumption ` z}
suv ���f ∗ EF�xno xwnp mv s|n PxoP ymoo `z}��ez} f, (14)
emission caused by the production of inputs used in processing is

49
EMmvPxsw,m ` z}��esuv ���f = H2SO� ` z}
suv ���f ∗ EF¦e§�¨ `z}��ez} f + Spent acid ` z}
suv ���f ∗
EF§Pnvs ~rmp `z}��ez} f + CO2 ` z}
suv ���f ∗ EF��e `z}��ez} f + Process water ` o
suv ���f ∗
EF©turnww �~snt `z}��eo f + NaOH ` z}
suv ���f ∗ EFª~�¦ `z}��ez} f + Na2SO� ` z}
suv ���f ∗
EFª~e§�¨ `z}��ez} f (15)
and emission caused by the treatment of waste waters from the process is
-.�A@=8 �A=8B,� = «�¬¢3 «�¢3£ ` �=�� �®¯f ∗ EF�~wsn �~snt `°±�¯e
� f. (16)
For comparison, Figure 10 presents an alternative way of defining the system boundary
for acidulation process emissions. This approach would ignore the emissions created or
saved in the chemical cycle due to acidulation and is not valid for an interlinked process.
In order to demonstrate the difference between the two approaches, the results for
emissions calculation in section 5.3 are presented also for this system boundary setting.
Figure 10. System boundary set around the acidulation process would exclude the effects of acidulation to the chemical cycle from the emission calculation. This system boundary setting is presented only for comparison.
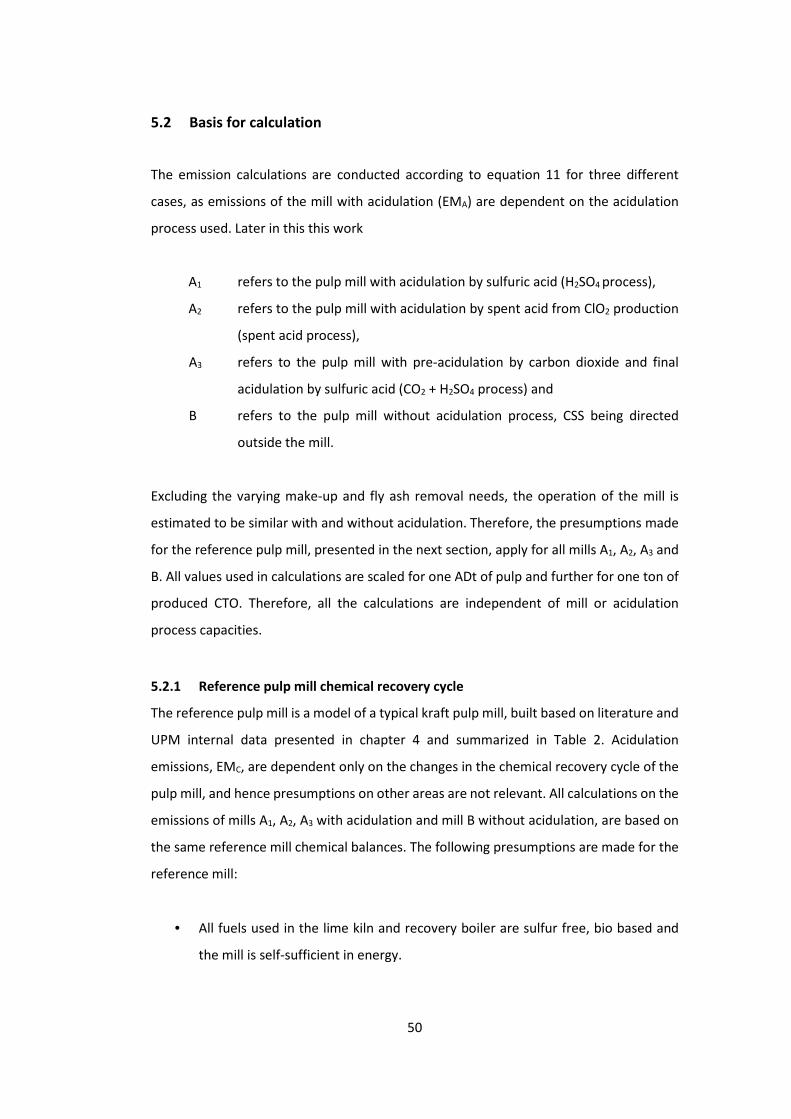
50
5.2 Basis for calculation
The emission calculations are conducted according to equation 11 for three different
cases, as emissions of the mill with acidulation (EMA) are dependent on the acidulation
process used. Later in this this work
A1 refers to the pulp mill with acidulation by sulfuric acid (H2SO4 process),
A2 refers to the pulp mill with acidulation by spent acid from ClO2 production
(spent acid process),
A3 refers to the pulp mill with pre-acidulation by carbon dioxide and final
acidulation by sulfuric acid (CO2 + H2SO4 process) and
B refers to the pulp mill without acidulation process, CSS being directed
outside the mill.
Excluding the varying make-up and fly ash removal needs, the operation of the mill is
estimated to be similar with and without acidulation. Therefore, the presumptions made
for the reference pulp mill, presented in the next section, apply for all mills A1, A2, A3 and
B. All values used in calculations are scaled for one ADt of pulp and further for one ton of
produced CTO. Therefore, all the calculations are independent of mill or acidulation
process capacities.
5.2.1 Reference pulp mill chemical recovery cycle
The reference pulp mill is a model of a typical kraft pulp mill, built based on literature and
UPM internal data presented in chapter 4 and summarized in Table 2. Acidulation
emissions, EMC, are dependent only on the changes in the chemical recovery cycle of the
pulp mill, and hence presumptions on other areas are not relevant. All calculations on the
emissions of mills A1, A2, A3 with acidulation and mill B without acidulation, are based on
the same reference mill chemical balances. The following presumptions are made for the
reference mill:
• All fuels used in the lime kiln and recovery boiler are sulfur free, bio based and
the mill is self-sufficient in energy.
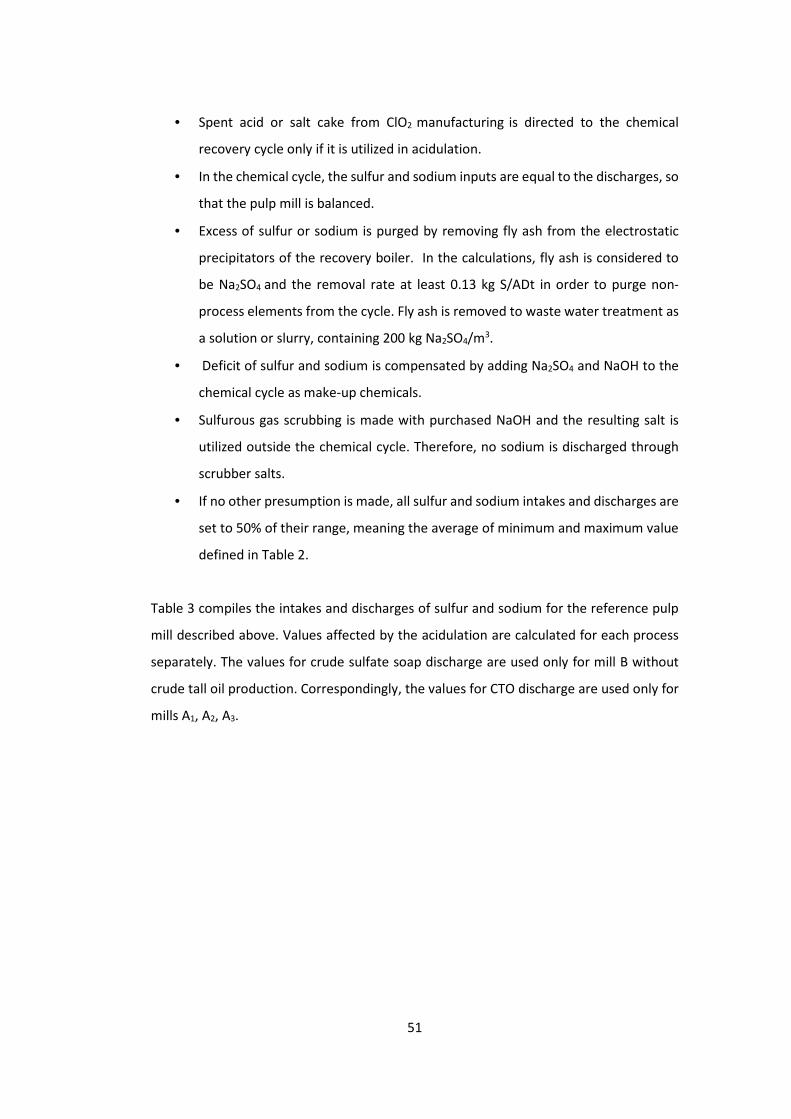
51
• Spent acid or salt cake from ClO2 manufacturing is directed to the chemical
recovery cycle only if it is utilized in acidulation.
• In the chemical cycle, the sulfur and sodium inputs are equal to the discharges, so
that the pulp mill is balanced.
• Excess of sulfur or sodium is purged by removing fly ash from the electrostatic
precipitators of the recovery boiler. In the calculations, fly ash is considered to
be Na2SO4 and the removal rate at least 0.13 kg S/ADt in order to purge non-
process elements from the cycle. Fly ash is removed to waste water treatment as
a solution or slurry, containing 200 kg Na2SO4/m3.
• Deficit of sulfur and sodium is compensated by adding Na2SO4 and NaOH to the
chemical cycle as make-up chemicals.
• Sulfurous gas scrubbing is made with purchased NaOH and the resulting salt is
utilized outside the chemical cycle. Therefore, no sodium is discharged through
scrubber salts.
• If no other presumption is made, all sulfur and sodium intakes and discharges are
set to 50% of their range, meaning the average of minimum and maximum value
defined in Table 2.
Table 3 compiles the intakes and discharges of sulfur and sodium for the reference pulp
mill described above. Values affected by the acidulation are calculated for each process
separately. The values for crude sulfate soap discharge are used only for mill B without
crude tall oil production. Correspondingly, the values for CTO discharge are used only for
mills A1, A2, A3.

52
Table 3. Intakes to and discharges from the chemical balance of the reference pulp mill, based on the typical ranges presented in Table 2. Reference pulp mill Sulfur Sodium Notes
Intakes to
the pulp
mill
(kg/ADt)
Wood, water and
chemicals 0.40 0.04 50% of range
MgSO4 from
delignification 0.40 0.00 50% of range
Fuels 0.00 0.00 sulfur free fuels used
ClO2 waste acid 0.00 0.00 not directed to chemical cycle
Acidulation of CTO calculated separately
pH adjustment /Make-up
chemicals calculated separately
Discharges
from the
pulp mill
(kg/ADt)
Air emissions 0.19 0.00 50% of range
Scrubber salts 0.30 0.00
50% of range for S, ext. NaOH
used
Fly ash from electrostatic
precipitators
calculated separately, min.
0.13 kg S/ADt
Washing losses in fiber
line 0.90 2.90 50% of range
Crude sulfate soap 0.20 2.25
50% of range for mill B
without acidulation, else 0
Crude tall oil 0.55 0.01
50% of range for mills A1, A2
and A3 with acidulation, else 0
Turpentine 0.05 0.00 50% of range
5.2.2 Acidulation plant
The greenhouse gas emissions of three different acidulation processes, compared to
emissions of mill B without acidulation, are calculated presuming that the processes are
integrated with the reference pulp mill chemical recovery cycle presented in the previous
section. The following presumptions were made for all three acidulation processes in mills
A1 (mill with H2SO4 process), A2 (mill with spent acid process) and A3 (mill with CO2 + H2SO4
process):
• CTO yield is 40 kg/ADt, which is 50% of the typical range, 30-50 kg/ADt.
• Mother liquid is always returned to the chemical cycle.
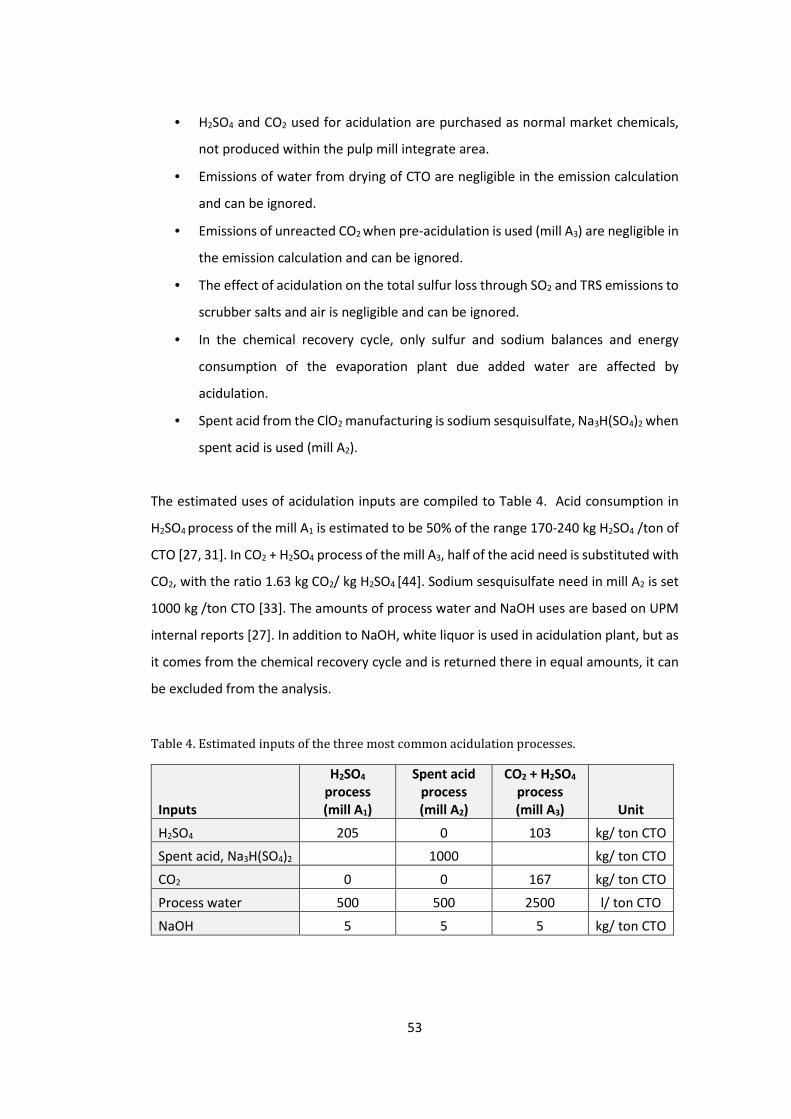
53
• H2SO4 and CO2 used for acidulation are purchased as normal market chemicals,
not produced within the pulp mill integrate area.
• Emissions of water from drying of CTO are negligible in the emission calculation
and can be ignored.
• Emissions of unreacted CO2 when pre-acidulation is used (mill A3) are negligible in
the emission calculation and can be ignored.
• The effect of acidulation on the total sulfur loss through SO2 and TRS emissions to
scrubber salts and air is negligible and can be ignored.
• In the chemical recovery cycle, only sulfur and sodium balances and energy
consumption of the evaporation plant due added water are affected by
acidulation.
• Spent acid from the ClO2 manufacturing is sodium sesquisulfate, Na3H(SO4)2 when
spent acid is used (mill A2).
The estimated uses of acidulation inputs are compiled to Table 4. Acid consumption in
H2SO4 process of the mill A1 is estimated to be 50% of the range 170-240 kg H2SO4 /ton of
CTO [27, 31]. In CO2 + H2SO4 process of the mill A3, half of the acid need is substituted with
CO2, with the ratio 1.63 kg CO2/ kg H2SO4 [44]. Sodium sesquisulfate need in mill A2 is set
1000 kg /ton CTO [33]. The amounts of process water and NaOH uses are based on UPM
internal reports [27]. In addition to NaOH, white liquor is used in acidulation plant, but as
it comes from the chemical recovery cycle and is returned there in equal amounts, it can
be excluded from the analysis.
Table 4. Estimated inputs of the three most common acidulation processes.
Inputs
H2SO4
process
(mill A1)
Spent acid
process
(mill A2)
CO2 + H2SO4
process
(mill A3) Unit
H2SO4 205 0 103 kg/ ton CTO
Spent acid, Na3H(SO4)2 1000 kg/ ton CTO
CO2 0 0 167 kg/ ton CTO
Process water 500 500 2500 l/ ton CTO
NaOH 5 5 5 kg/ ton CTO
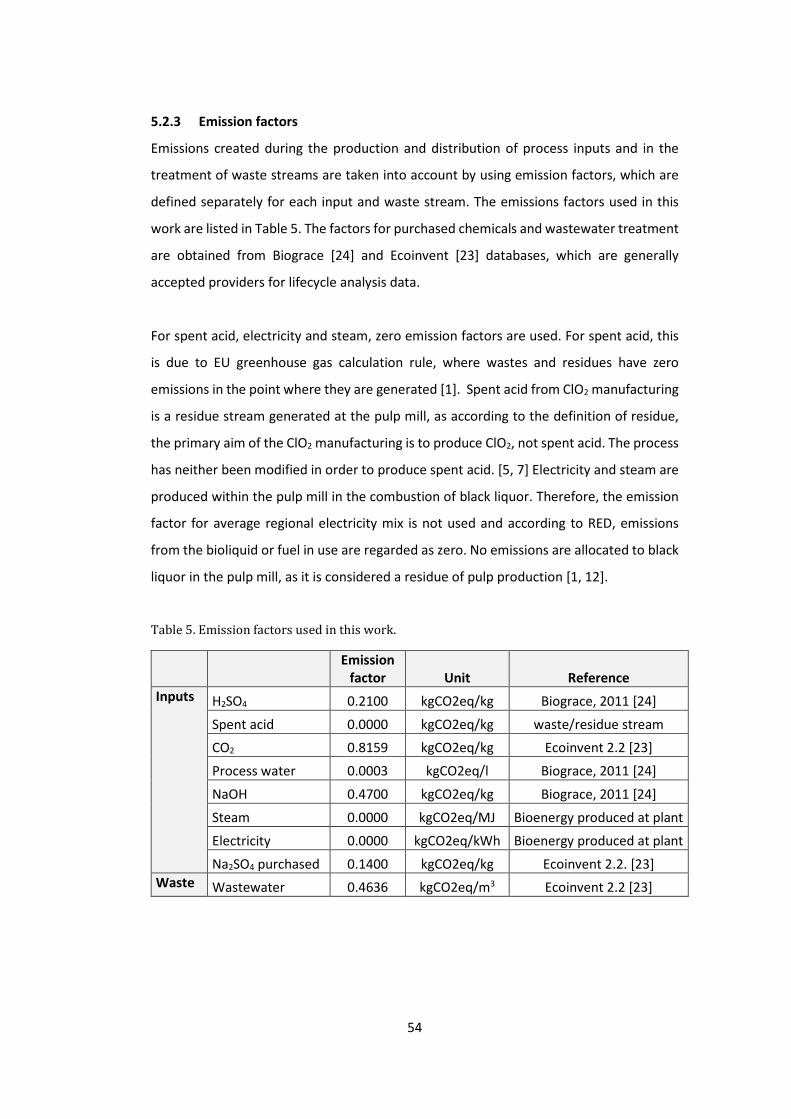
54
5.2.3 Emission factors
Emissions created during the production and distribution of process inputs and in the
treatment of waste streams are taken into account by using emission factors, which are
defined separately for each input and waste stream. The emissions factors used in this
work are listed in Table 5. The factors for purchased chemicals and wastewater treatment
are obtained from Biograce [24] and Ecoinvent [23] databases, which are generally
accepted providers for lifecycle analysis data.
For spent acid, electricity and steam, zero emission factors are used. For spent acid, this
is due to EU greenhouse gas calculation rule, where wastes and residues have zero
emissions in the point where they are generated [1]. Spent acid from ClO2 manufacturing
is a residue stream generated at the pulp mill, as according to the definition of residue,
the primary aim of the ClO2 manufacturing is to produce ClO2, not spent acid. The process
has neither been modified in order to produce spent acid. [5, 7] Electricity and steam are
produced within the pulp mill in the combustion of black liquor. Therefore, the emission
factor for average regional electricity mix is not used and according to RED, emissions
from the bioliquid or fuel in use are regarded as zero. No emissions are allocated to black
liquor in the pulp mill, as it is considered a residue of pulp production [1, 12].
Table 5. Emission factors used in this work.
Emission
factor Unit Reference
Inputs H2SO4 0.2100 kgCO2eq/kg Biograce, 2011 [24]
Spent acid 0.0000 kgCO2eq/kg waste/residue stream
CO2 0.8159 kgCO2eq/kg Ecoinvent 2.2 [23]
Process water 0.0003 kgCO2eq/l Biograce, 2011 [24]
NaOH 0.4700 kgCO2eq/kg Biograce, 2011 [24]
Steam 0.0000 kgCO2eq/MJ Bioenergy produced at plant
Electricity 0.0000 kgCO2eq/kWh Bioenergy produced at plant
Na2SO4 purchased 0.1400 kgCO2eq/kg Ecoinvent 2.2. [23]
Waste Wastewater 0.4636 kgCO2eq/m3 Ecoinvent 2.2 [23]
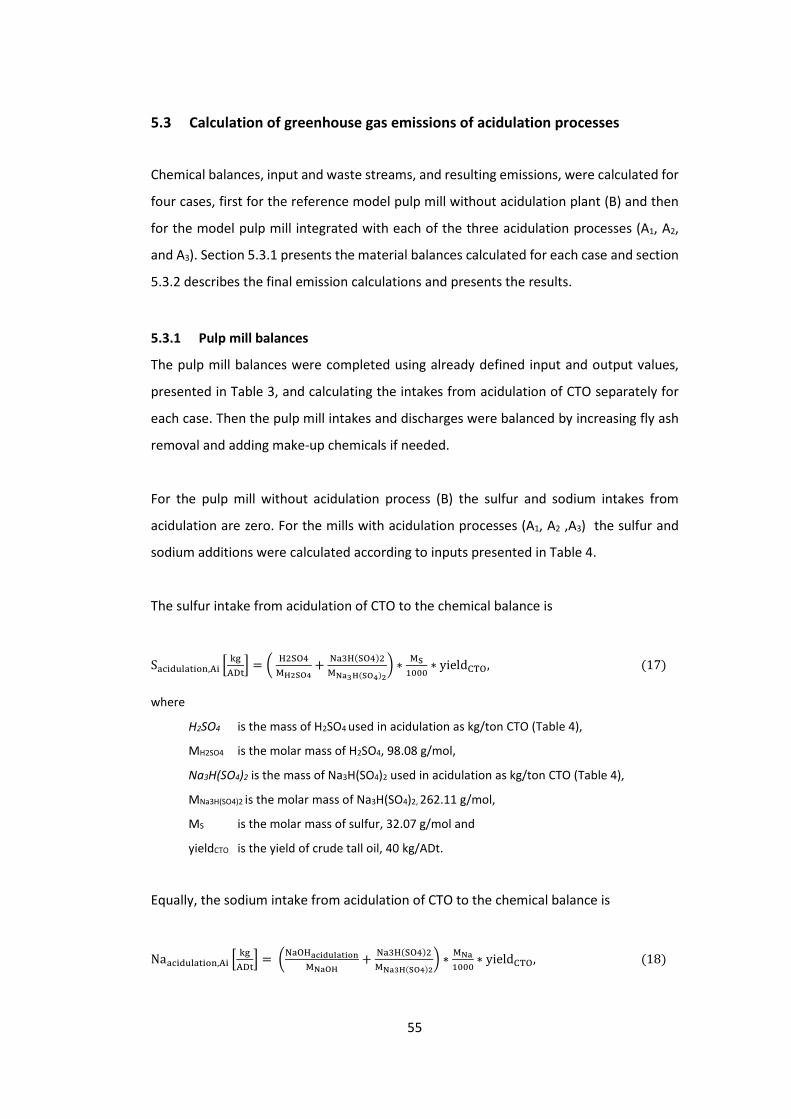
55
5.3 Calculation of greenhouse gas emissions of acidulation processes
Chemical balances, input and waste streams, and resulting emissions, were calculated for
four cases, first for the reference model pulp mill without acidulation plant (B) and then
for the model pulp mill integrated with each of the three acidulation processes (A1, A2,
and A3). Section 5.3.1 presents the material balances calculated for each case and section
5.3.2 describes the final emission calculations and presents the results.
5.3.1 Pulp mill balances
The pulp mill balances were completed using already defined input and output values,
presented in Table 3, and calculating the intakes from acidulation of CTO separately for
each case. Then the pulp mill intakes and discharges were balanced by increasing fly ash
removal and adding make-up chemicals if needed.
For the pulp mill without acidulation process (B) the sulfur and sodium intakes from
acidulation are zero. For the mills with acidulation processes (A1, A2 ,A3) the sulfur and
sodium additions were calculated according to inputs presented in Table 4.
The sulfur intake from acidulation of CTO to the chemical balance is
S~rmpxo~smuv,²m ` z}²³sf = ´ ¦2§��
Rµe¶d¨+ ª~·¦(§��)2
R¸iµ(¶d¨)e¹ ∗ R¶
º»»» ∗ yield���, (17)
where
H2SO4 is the mass of H2SO4 used in acidulation as kg/ton CTO (Table 4),
MH2SO4 is the molar mass of H2SO4, 98.08 g/mol,
Na3H(SO4)2 is the mass of Na3H(SO4)2 used in acidulation as kg/ton CTO (Table 4),
MNa3H(SO4)2 is the molar mass of Na3H(SO4)2, 262.11 g/mol,
MS is the molar mass of sulfur, 32.07 g/mol and
yieldCTO is the yield of crude tall oil, 40 kg/ADt.
Equally, the sodium intake from acidulation of CTO to the chemical balance is
Na~rmpxo~smuv,²m ` z}²³sf = ´ª~�¦iUXj]TiVXZ[
R¸idµ+ ª~·¦(§��)2
R¸iµ(¶d¨)e¹ ∗ R¸i
º»»» ∗ yield���, (18)

56
where
NaOHacidulation is the mass of NaOH added in acidulation as kg/ton CTO (Table 4),
MNaOH is the molar mass of sodium hydroxide, 40.00 g/mol and
MNa is the molar mass of sodium, 22.99 g/mol.
The resulting intakes from acidulation of CTO for the acidulation processes are presented
in Table 6.
Table 6. Sulfur and sodium intakes of different acidulation processes and reference without acidulation calculated by equations 16 and 17.
Intakes from acidulation
of CTO
Mill B
(no
acidulation)
Mill A1
(H2SO4
process)
Mill A2
(Spent acid
process)
Mill A3
(CO2 + H2SO4
process)
Sacidulation (kg/ADt) 0.00 2.68 9.03 1.34
Naacidulation (kg/ADt) 0.00 0.11 6.59 0.11
Based on the calculated intakes from acidulation presented in Table 6, the amount of
sulfur and sodium addition or discharges was calculated. If the already known intakes are
greater than discharges, fly ash is removed to balance the situation. Correspondingly, if
discharges are greater than intakes, make-up chemicals are added.
The difference between inputs and outputs is calculated for sulfur as:
½¤¾¾3£3¿¡3À ` °±�Á=f = I���> + IL±À¯� + IÂ?8;@ + I@<8�= A9�> + IA9�>?;A=��� − IA�B − I@9B?ÃÃ8B −
IÂ;� A@�,��� − I�A@���± − I�ÀÀ − I�®¯ − I=?B<8�=��8 , (19)
where
Swood is the sulfur intake from wood, water and chemicals as kg/ADt (Table 3)
SMgSO4 is the sulfur intake from MgSO4 from delignification as kg/ADt (Table 3)
Sfuels is the sulfur intake from fuels as kg/ADt (Table 3)
Sspent acid is the sulfur intake from spent acid from ClO2 plant as kg/ADt (Table 3)
Sacidulation is the sulfur intake from acidulation of CTO as kg/ADt (Table 6)
Sair is the sulfur discharge to air emissions as kg/ADt (Table 3)
Sscrubber is the sulfur discharge to scrubber salts as kg/ADt (Table 3)
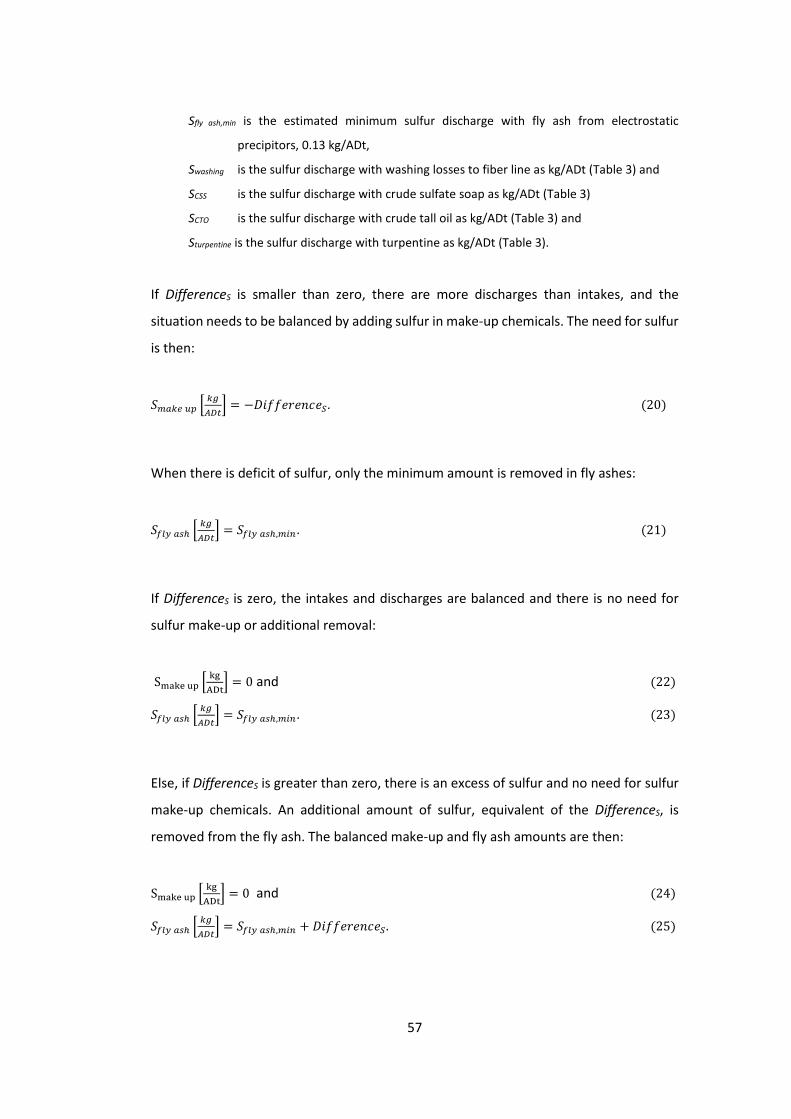
57
Sfly ash,min is the estimated minimum sulfur discharge with fly ash from electrostatic
precipitors, 0.13 kg/ADt,
Swashing is the sulfur discharge with washing losses to fiber line as kg/ADt (Table 3) and
SCSS is the sulfur discharge with crude sulfate soap as kg/ADt (Table 3)
SCTO is the sulfur discharge with crude tall oil as kg/ADt (Table 3) and
Sturpentine is the sulfur discharge with turpentine as kg/ADt (Table 3).
If DifferenceS is smaller than zero, there are more discharges than intakes, and the
situation needs to be balanced by adding sulfur in make-up chemicals. The need for sulfur
is then:
I�A°8 ?< ` °±�Á=f = −½¤¾¾3£3¿¡3À. (20)
When there is deficit of sulfur, only the minimum amount is removed in fly ashes:
IÂ;� A@� ` °±�Á=f = IÂ;� A@�,��� . (21)
If DifferenceS is zero, the intakes and discharges are balanced and there is no need for
sulfur make-up or additional removal:
Sy~zn xP ` z}²³sf = 0 and (22)
IÂ;� A@� ` °±�Á=f = IÂ;� A@�,��� . (23)
Else, if DifferenceS is greater than zero, there is an excess of sulfur and no need for sulfur
make-up chemicals. An additional amount of sulfur, equivalent of the DifferenceS, is
removed from the fly ash. The balanced make-up and fly ash amounts are then:
Sy~zn xP ` z}²³sf = 0 and (24)
IÂ;� A@� ` °±�Á=f = IÂ;� A@�,��� + ½¤¾¾3£3¿¡3À. (25)

58
Within the intake and discharge ranges specified in Table 2, the excess of sulfur is always
greater than the excess of sodium, if there is excess at all. The fly ash is presumed to be
Na2SO4, which means that there is always two moles of discharged sodium per one mole
of discharged sulfur. The sodium discharge in fly ash is therefore defined by the greater
sulfur removal need as:
��Â;� A@� ` °±�Á=f = 2 ∗ LÄÅ
LÆ∗ IÂ;� A@� . (26)
As the higher sulfur removal need inevitably results to removing more sodium than
required for balancing the intakes and discharges, the excessively removed sodium needs
to be replaced by adding sodium make-up chemicals. Now that the sodium removal in fly
ash is known, the needed make-up amount can be calculated as the difference between
intakes and discharges:
���A°8 ?< ` °±�Á=f = −(�����> + ��L±À¯� + ��Â?8;@ + ��@<8�= A9�> + ��A9�>?;A=��� − ��A�B −
��@9B?ÃÃ8B − ��Â;� A@� − ���A@���± − ���ÀÀ − ���®¯ − ��=?B<8�=��8), (27)
where all the variables for sodium are defined equally as for sulfur in kg/ADt, as listed in
Table 3.
These calculations result to a balanced situation, were inputs and outputs are equal. The
completed chemical balances of the reference mill B and mills with varying acidulation
processes are presented in Table 7. The bolded values are the mill dependent calculated
values for each mill, Sacidulation and Naacidulation obtained from Table 6, Smake-up obtained from
equation 20 or 22, Namake-up from equation 27, Sfly ash from equation 21 or 25 and Nafly ash
from equation 26.

59
Su
lfu
r S
od
ium
Su
lfu
r S
od
ium
Su
lfu
r S
od
ium
Su
lfu
r S
od
ium
Wo
od
, wat
er
and
ch
em
ical
s0.
400.
040.
400.
040.
400.
040.
400.
04
MgS
O4
fro
m d
eli
gnif
icat
ion
0.40
0.00
0.40
0.00
0.40
0.00
0.40
0.00
Fue
ls0.
000.
000.
000.
000.
000.
000.
000.
00
ClO
2 w
aste
aci
d0.
000.
000.
000.
000.
000.
000.
000.
00
Aci
du
lati
on
of
CTO
0
.00
0.0
02
.68
0.1
19
.03
6.5
91
.34
0.1
1
pH
ad
just
me
nt
/Mak
e-u
p c
he
mic
als
0.9
75
.30
0.0
04
.90
0.0
07
.53
0.0
02
.97
TO
TA
L1
.77
5.3
43
.48
5.0
59
.83
14
.15
2.1
43
.12
Air
em
issi
on
s0.
190.
000.
190.
000.
190.
000.
190.
00
Scru
bb
er
salt
s0.
300.
000.
300.
000.
300.
000.
300.
00
Fly
ash
fro
m e
lect
rost
atic
pre
cip
itat
ors
0.1
30
.19
1.4
92
.14
7.8
41
1.2
50
.15
0.2
2
Was
hin
g lo
sse
s to
fib
re li
ne
0.90
2.90
0.90
2.90
0.90
2.90
0.90
2.90
Cru
de
su
lfat
e s
oap
0.2
02
.25
0.0
00
.00
0.0
00
.00
0.0
00
.00
Cru
de
tal
l oil
0.0
00
.00
0.5
50
.01
0.5
50
.01
0.5
50
.01
Turp
en
tin
e0.
050.
000.
050.
000.
050.
000.
050.
00
TO
TA
L1
.77
5.3
43
.48
5.0
59
.83
14
.15
2.1
43
.12
Re
fere
nce
mil
l B
No
aci
du
lati
on
Mil
l A
1
H2S
O4 p
roce
ss
Mil
l A
2
Sp
en
t a
cid
pro
cess
Mil
l A
3
CO
2 +
H2S
O4 p
roce
ss
Inta
kes
kg/A
Dt
Dis
char
ges
kg/A
Dt
Table
7. So
dium
and s
ulfur
balan
ces of
the p
ulp m
ills st
udied
. Mill
depe
nden
t and
calcu
lated
value
s are
marke
d with
bolde
d num
bers.
Intak
es fro
m aci
dulat
ion ar
e grea
test fr
om th
e spe
nt aci
d proc
ess in
mill
A 2, ca
using
also t
he gr
eatest
need
for s
ulfur
remov
al thro
ugh f
ly ash
in th
is mill.
The s
ulfur
intak
e from
acidu
lation
in m
ill A 3
is alm
ost eq
uivale
nt to
the am
ount
need
ed in
orde
r to ba
lance
the m
ill, w
hich c
an be
seen
from
the sm
all am
ount
of exc
ess su
lfur r
emov
al need
throu
gh fly
ash, w
here
the m
inimu
m pu
rge is
set to
0.13 k
g S/A
Dt.
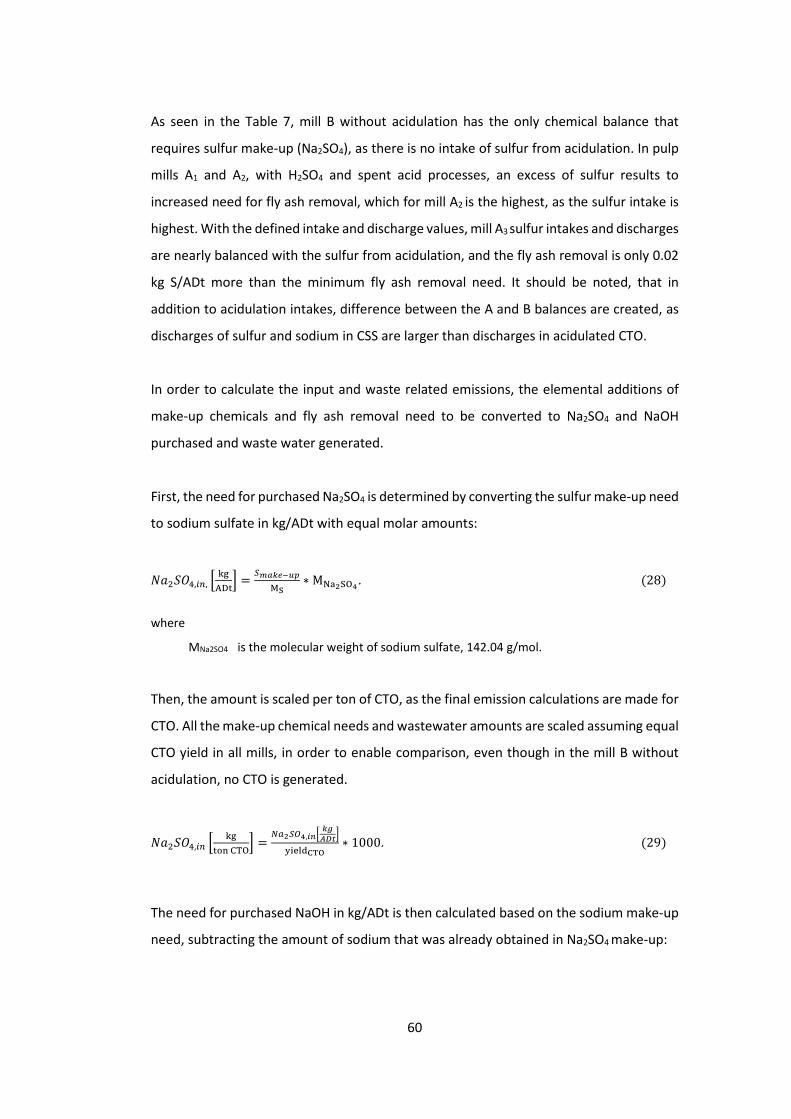
60
As seen in the Table 7, mill B without acidulation has the only chemical balance that
requires sulfur make-up (Na2SO4), as there is no intake of sulfur from acidulation. In pulp
mills A1 and A2, with H2SO4 and spent acid processes, an excess of sulfur results to
increased need for fly ash removal, which for mill A2 is the highest, as the sulfur intake is
highest. With the defined intake and discharge values, mill A3 sulfur intakes and discharges
are nearly balanced with the sulfur from acidulation, and the fly ash removal is only 0.02
kg S/ADt more than the minimum fly ash removal need. It should be noted, that in
addition to acidulation intakes, difference between the A and B balances are created, as
discharges of sulfur and sodium in CSS are larger than discharges in acidulated CTO.
In order to calculate the input and waste related emissions, the elemental additions of
make-up chemicals and fly ash removal need to be converted to Na2SO4 and NaOH
purchased and waste water generated.
First, the need for purchased Na2SO4 is determined by converting the sulfur make-up need
to sodium sulfate in kg/ADt with equal molar amounts:
��2I1�,��, ` z}²³sf = ÀÈÅÉÊËÌÍ
R¶∗ Mª~e§�¨ . (28)
where
MNa2SO4 is the molecular weight of sodium sulfate, 142.04 g/mol.
Then, the amount is scaled per ton of CTO, as the final emission calculations are made for
CTO. All the make-up chemical needs and wastewater amounts are scaled assuming equal
CTO yield in all mills, in order to enable comparison, even though in the mill B without
acidulation, no CTO is generated.
��2I1�,�� ` z}suv ���f = ÎAeÀ¯¨,ÏÐ` ÉÑ
ÒÓÔflmnopcÕd
∗ 1000. (29)
The need for purchased NaOH in kg/ADt is then calculated based on the sodium make-up
need, subtracting the amount of sodium that was already obtained in Na2SO4 make-up:
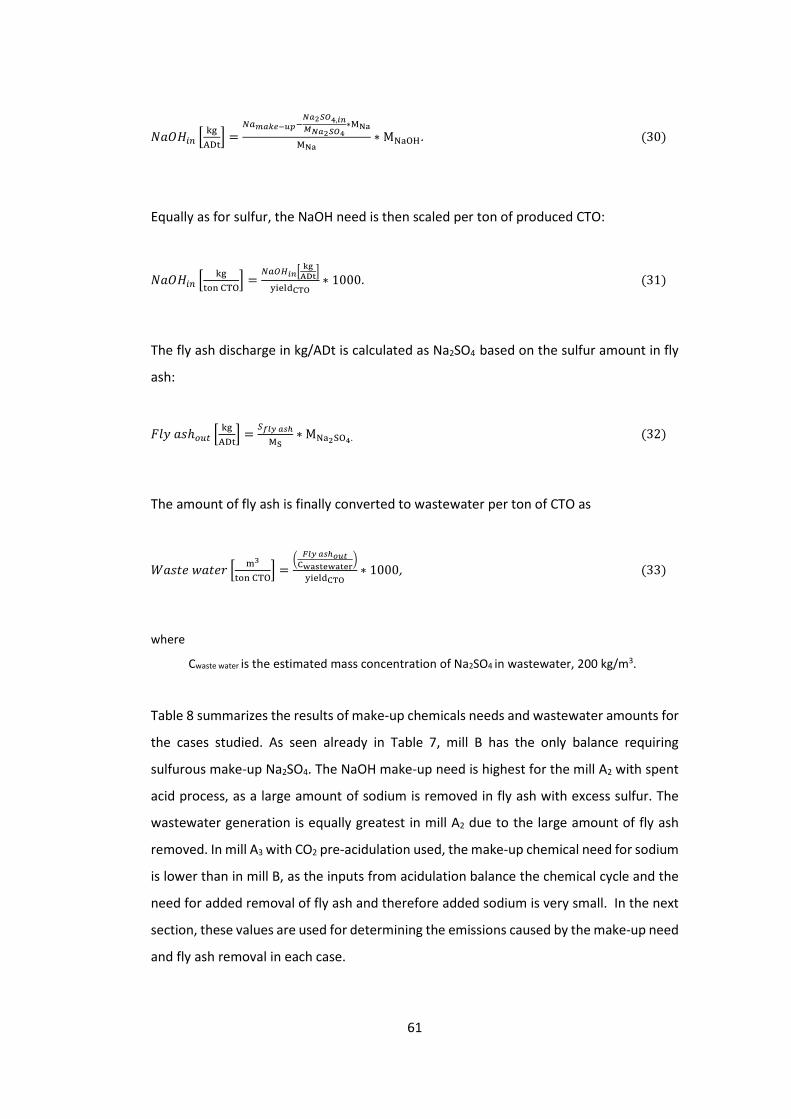
61
��1��� ` z}²³sf =
ÎAÈÅÉÊËÌÍÖÄÅeÆר,ÏÐØÄÅeÆר
∗R¸iR¸i
∗ Mª~�¦. (30)
Equally as for sulfur, the NaOH need is then scaled per ton of produced CTO:
��1��� ` z}suv ���f = ÎA¯ÙÏÐ` ab
ÚÛVflmnopcÕd
∗ 1000. (31)
The fly ash discharge in kg/ADt is calculated as Na2SO4 based on the sulfur amount in fly
ash:
Ü ¥ �¬ℎ�?= ` z}²³sf = ÀÞßà Åáâ
R¶∗ Mª~e§�¨. (32)
The amount of fly ash is finally converted to wastewater per ton of CTO as
ã�¬¢3 «�¢3£ ` ysuv ���f = ´ Mßà ÅáâäÌÔ
cki\VSkiVSW¹lmnopcÕd
∗ 1000, (33)
where
Cwaste water is the estimated mass concentration of Na2SO4 in wastewater, 200 kg/m3.
Table 8 summarizes the results of make-up chemicals needs and wastewater amounts for
the cases studied. As seen already in Table 7, mill B has the only balance requiring
sulfurous make-up Na2SO4. The NaOH make-up need is highest for the mill A2 with spent
acid process, as a large amount of sodium is removed in fly ash with excess sulfur. The
wastewater generation is equally greatest in mill A2 due to the large amount of fly ash
removed. In mill A3 with CO2 pre-acidulation used, the make-up chemical need for sodium
is lower than in mill B, as the inputs from acidulation balance the chemical cycle and the
need for added removal of fly ash and therefore added sodium is very small. In the next
section, these values are used for determining the emissions caused by the make-up need
and fly ash removal in each case.

62
Table 8. Make-up Na2SO4 (equation 29) and NaOH (equation 31) need and wastewater (equation 33) generated due to fly ash discharge for reference mill without acidulation and mills integrated with three typical acidulation processes. To enable comparison, amounts are scaled per ton of CTO assuming equal yields of CTO in all mills, although no CTO is created in mill B.
Mill B
(No
acidulation)
Mill A1
(H2SO4
process)
Mill A2
(Spent acid
process)
Mill A3
(CO2 +
H2SO4
process) Unit
Na2SO4 107.35 0.00 0.00 0.00 kg /ton CTO
NaOH 170.25 212.98 327.37 129.38 kg /ton CTO
Waste water 0.07 0.83 4.34 0.08 m3 /ton CTO
5.3.2 Emission calculations
Finally, the greenhouse gas emissions induced by acidulation were calculated based on
the inputs of acidulation in Table 6 and pulp mill make-up, and wastewater amounts
presented in Table 8. The conversion of the mass and volume streams to emissions was
made by using emission factors listed in Table 5.
Equations 12 to 15 summarized the calculation method, where the emissions of the mill
without acidulation (B) are subtracted from the emissions of the mill with acidulation (A).
As the emission factors for electricity, steam and spent acid are zero, the equations are
reduced to the following:
-.�� `°±�¯e8å=�� �®¯ f = �-.��<?=@,�� − -.��<?=@,�� + �-.�A@=8 �A=8B,�� − -.�A@=8 �A=8B,��
= (�2I1��� − �2I1��) ∗ -ÜÙeÀ¯¨ + (012�� − 012� ) ∗ -Ü�¯e + (æ£ç¡3¬¬ «�¢3£�� −æ£ç¡3¬¬ «�¢3£�) ∗ -ÜèB�98@@ �A=8B + (��1��� − ��1��) ∗ -ÜÎA¯Ù + (��2I1��� −��2I1��) ∗ -ÜÎAeÀ¯¨ + ( «�¬¢3 «�¢3£�� − «�¬¢3 «�¢3£�) ∗ EF�~wsn �~snt . (34)
As inputs in the acidulation plant for reference pulp mill B are zero, the same equation
can also be written as

63
-.�� `z}��enésuv ��� f = `�2I1���,A9�>?;A=��� ∗ -ÜÙeÀ¯¨ + 012��,A9�>?;A=��� ∗ EF��e +
æ£ç¡3¬¬ «�¢3£��,A9�>?;A=��� ∗ EF©turnww �~snt + ��1���,A9�>?;A=��� ∗ EFª~�¦f +`ê��1���,�A°8Ö?< ∗ EFª~�¦ + ��2I1���,�A°8Ö?< ∗ EFª~e§�¨ + «�¬¢3«�¢3£��,Â;� A@� ∗
EF�~wsn�~sntë − ê��1��,�A°8Ö?< ∗ EFª~�¦+��2I1��,�A°8Ö?< ∗ EFª~e§�¨ + «�¬¢3«�¢3£�,Â;� A@� ∗ EF�~wsn�~sntëf, (35)
where the amounts of H2SO4, CO2, process water and NaOH of acidulation are obtained
from Table 4, amounts of NaOH and Na2SO4 make-up as well as wastewater from Table 8,
and emission factors, EFi, from Table 5.
The previous grouping of the variables equals to
-.�� ìkgCO2eqton CTO í = -.��,A9�>?;A=��� + �-.�A°8Ö?<g�A@=8,�� − -.�A°8Ö?<g�A@=8,��,
(36)
where EMAi,acidulation is equal to the emissions of acidulation without considering the effects
on chemical balance, as would be obtained in emission calculation using system boundary
pictured in Figure 10.
For comparison, the results are divided in this manner in Table 7, where the emissions of
acidulation inputs indicates the direct emissions caused by acidulation (system boundary
of Figure 10). Emissions induced in chemical cycle take into account the indirect emissions
caused or saved in the pulp mill due to acidulation-induced changes in the chemical
balance of the mill. In Table 7, negative values in emissions induced in the chemical cycle
for H2SO4 and CO2+ H2SO4 processes indicate that less emissions are created in the pulp
mill chemical recovery cycle with an acidulation process than in the mill B without
acidulation, when the make-up need and fly ash discharge are considered. However,
when the emissions induced in the chemical cycle are added together with the emissions
of acidulation inputs, all processes result to have positive emission values, which means
that with the estimated reference pulp mill values used, the emissions in total are higher
in mills with acidulation (A) than in in a mill without acidulation (B).

64
Table 7. Total emissions of acidulation processes (EMC), calculated as a sum of direct emissions from acidulation inputs and indirect emissions caused or saved in the pulp mill due to effects on the chemical balance. Negative emission values indicate, that less emissions are generated with acidulation than without acidulation.
No
acidulati
on (mill
B)
H2SO4
process
(mill A1)
Spent
acid
process
(mill A2)
CO2 +
H2SO4
process
(mill A3) Unit
Acidulation
inputs H2SO4 0.00 43.05 0.00 21.53 kgCO2eq/ton CTO
Spent acid 0.00 0.00 0.00 0.00 kgCO2eq/ton CTO
CO2 0.00 0.00 0.00 136.31 kgCO2eq/ton CTO
Process water 0.00 0.15 0.15 0.75 kgCO2eq/ton CTO
NaOH 0.00 2.35 2.35 2.35 kgCO2eq/ton CTO
Emissions of
acidulation
inputs
(EMAi,acidulation) 0.00 45.55 2.50 160.94 kgCO2eq/ton CTO
Make-up
and waste
NaOH 80.02 100.10 153.86 60.81 kgCO2eq/ton CTO
Na2SO4 49.77 0.00 0.00 0.00 kgCO2eq/ton CTO
Waste water 0.01 0.12 0.61 0.01 kgCO2eq/ton CTO
SUM 129.79 100.21 154.47 60.82 kgCO2eq/ton CTO
Emission induced
in chemical cycle
(EMmake-up+waste,Ai
− EMmake-up+waste,B) -29.58 24.68 -68.98 kgCO2eq/ton CTO
TOTAL
EMISSIONS OF
ACIDULATION
(EMCi) 15.97 27.18 91.96 kgCO2eq/ton CTO
The results are visualized in Figure 11, where the relative amounts of acidulation input
emissions (EMAi,acidulation), emissions generated by make-up chemical addition and
emissions from wastewater treatment can be compared for all the processes. As seen, the
effect of wastewater is negligible for all the processes. For spent acid process, the effect
of acidulation input emissions are very small, but make-up chemical emissions are high.
In contrary, CO2 + H2SO4 process results to the highest emissions from acidulation inputs
due to the high emission factor of CO2, but the emissions of make-up chemicals are the
lowest of all processes compared. The baseline for zero emissions is set by the emissions
of make-up chemicals and negligible wastewater of the reference mill B and the values
above zero indicate the total emissions of acidulation process.
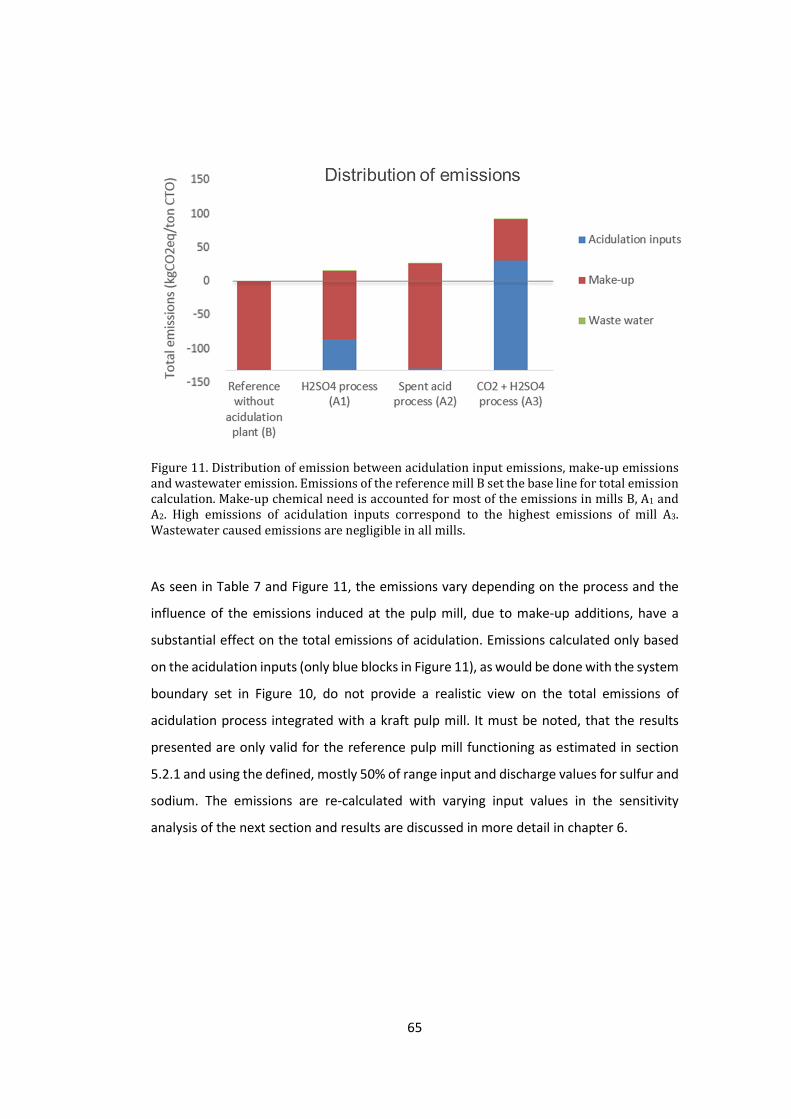
65
Figure 11. Distribution of emission between acidulation input emissions, make-up emissions and wastewater emission. Emissions of the reference mill B set the base line for total emission calculation. Make-up chemical need is accounted for most of the emissions in mills B, A1 and A2. High emissions of acidulation inputs correspond to the highest emissions of mill A3. Wastewater caused emissions are negligible in all mills.
As seen in Table 7 and Figure 11, the emissions vary depending on the process and the
influence of the emissions induced at the pulp mill, due to make-up additions, have a
substantial effect on the total emissions of acidulation. Emissions calculated only based
on the acidulation inputs (only blue blocks in Figure 11), as would be done with the system
boundary set in Figure 10, do not provide a realistic view on the total emissions of
acidulation process integrated with a kraft pulp mill. It must be noted, that the results
presented are only valid for the reference pulp mill functioning as estimated in section
5.2.1 and using the defined, mostly 50% of range input and discharge values for sulfur and
sodium. The emissions are re-calculated with varying input values in the sensitivity
analysis of the next section and results are discussed in more detail in chapter 6.

66
5.4 Sensitivity analysis
It has already been noted, that both acidulation inputs and chemical balance of the pulp
mill affect the total amount of acidulation emissions. A sensitivity analysis was performed
in order to determine which input values have the largest effects on the total emissions
of each process and to define how much effect the changes in each variable cause to the
total emissions of acidulation. The analysis was made by repeating all the calculations by
varying one input value at the time from its determined minimum value to its determined
maximum value, while other variables were kept at the initial estimate, 50% of their
range.
The input variables studied were chosen as the most important variables in both
acidulation and chemical balance. These variables were the CTO yield, acid need in
acidulation per ton of CTO and both sulfur and sodium intakes to and discharges from the
chemical balance. Increasing CTO yield does not affect the acidulation input emission, as
the use of inputs per ton of CTO is kept the same, but it increases the sulfur intakes to the
chemical cycle. Growing acid need per ton of CTO on the other hand increases both the
acidulation input emissions, except for spent acid process with zero emission factor, and
sulfur intake to the chemical balance. The studied variables and corresponding ranges,
based on information presented in chapter 3 and Table 2, are compiled to Table 8. Acid
need in acidulation, as well as sulfur intakes and discharges and sodium discharges, are a
combination of several input values that were changed at once with the same percentage
of their range.
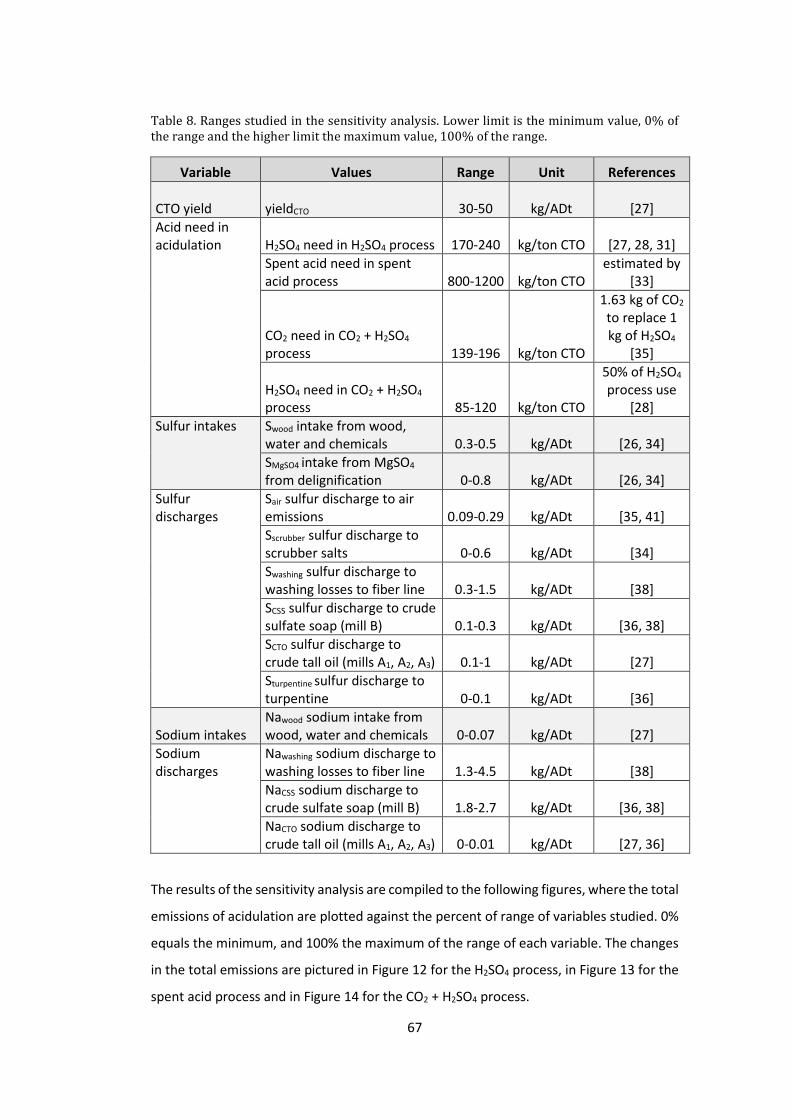
67
Table 8. Ranges studied in the sensitivity analysis. Lower limit is the minimum value, 0% of the range and the higher limit the maximum value, 100% of the range.
Variable Values Range Unit References
CTO yield yieldCTO 30-50 kg/ADt [27]
Acid need in
acidulation H2SO4 need in H2SO4 process 170-240 kg/ton CTO [27, 28, 31]
Spent acid need in spent
acid process 800-1200 kg/ton CTO
estimated by
[33]
CO2 need in CO2 + H2SO4
process 139-196 kg/ton CTO
1.63 kg of CO2
to replace 1
kg of H2SO4
[35]
H2SO4 need in CO2 + H2SO4 process 85-120 kg/ton CTO
50% of H2SO4
process use [28]
Sulfur intakes Swood intake from wood,
water and chemicals 0.3-0.5 kg/ADt [26, 34]
SMgSO4 intake from MgSO4
from delignification 0-0.8 kg/ADt [26, 34]
Sulfur
discharges
Sair sulfur discharge to air
emissions 0.09-0.29 kg/ADt [35, 41]
Sscrubber sulfur discharge to
scrubber salts 0-0.6 kg/ADt [34]
Swashing sulfur discharge to
washing losses to fiber line 0.3-1.5 kg/ADt [38]
SCSS sulfur discharge to crude
sulfate soap (mill B) 0.1-0.3 kg/ADt [36, 38]
SCTO sulfur discharge to
crude tall oil (mills A1, A2, A3) 0.1-1 kg/ADt [27]
Sturpentine sulfur discharge to
turpentine 0-0.1 kg/ADt [36]
Sodium intakes
Nawood sodium intake from
wood, water and chemicals 0-0.07 kg/ADt [27]
Sodium
discharges
Nawashing sodium discharge to
washing losses to fiber line 1.3-4.5 kg/ADt [38]
NaCSS sodium discharge to
crude sulfate soap (mill B) 1.8-2.7 kg/ADt [36, 38]
NaCTO sodium discharge to
crude tall oil (mills A1, A2, A3) 0-0.01 kg/ADt [27, 36]
The results of the sensitivity analysis are compiled to the following figures, where the total
emissions of acidulation are plotted against the percent of range of variables studied. 0%
equals the minimum, and 100% the maximum of the range of each variable. The changes
in the total emissions are pictured in Figure 12 for the H2SO4 process, in Figure 13 for the
spent acid process and in Figure 14 for the CO2 + H2SO4 process.
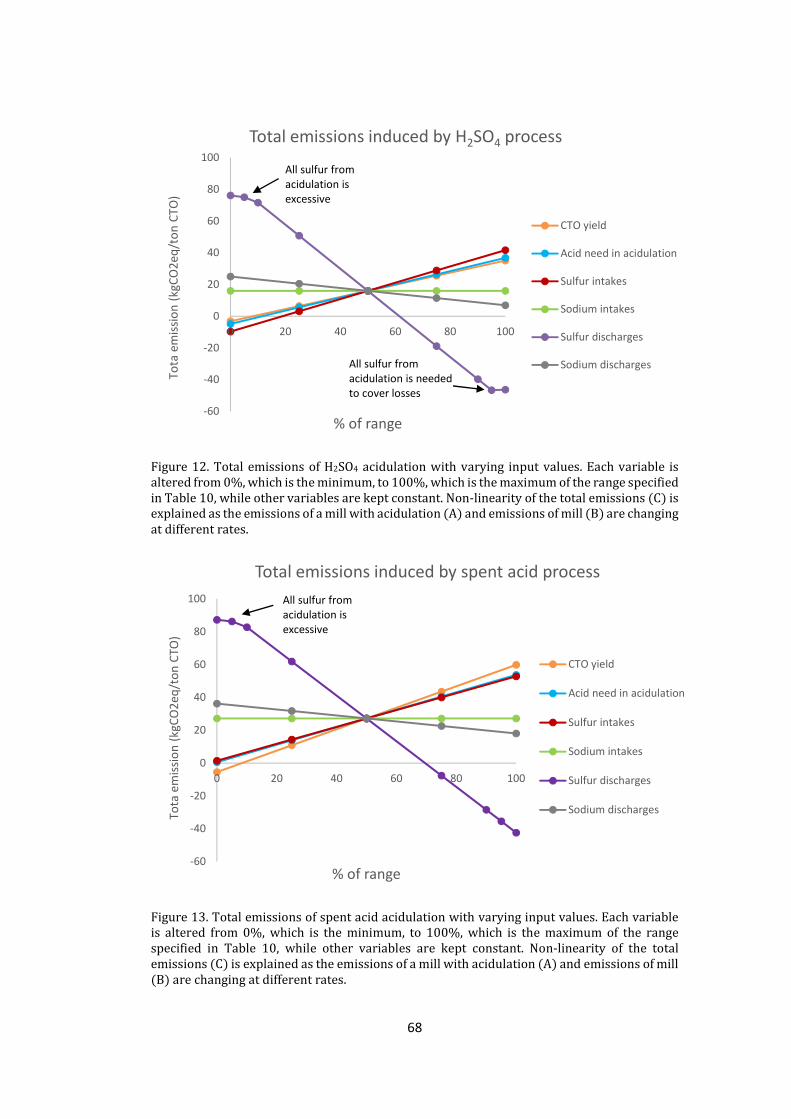
68
Figure 12. Total emissions of H2SO4 acidulation with varying input values. Each variable is altered from 0%, which is the minimum, to 100%, which is the maximum of the range specified in Table 10, while other variables are kept constant. Non-linearity of the total emissions (C) is explained as the emissions of a mill with acidulation (A) and emissions of mill (B) are changing at different rates.
Figure 13. Total emissions of spent acid acidulation with varying input values. Each variable is altered from 0%, which is the minimum, to 100%, which is the maximum of the range specified in Table 10, while other variables are kept constant. Non-linearity of the total emissions (C) is explained as the emissions of a mill with acidulation (A) and emissions of mill (B) are changing at different rates.
-60
-40
-20
0
20
40
60
80
100
0 20 40 60 80 100
Tota
em
issi
on
(kg
CO
2e
q/t
on
CTO
)
% of range
Total emissions induced by H2SO4 process
CTO yield
Acid need in acidulation
Sulfur intakes
Sodium intakes
Sulfur discharges
Sodium dischargesAll sulfur from
acidulation is needed
to cover losses
All sulfur from
acidulation is
excessive
-60
-40
-20
0
20
40
60
80
100
0 20 40 60 80 100
Tota
em
issi
on
(kg
CO
2e
q/t
on
CTO
)
% of range
Total emissions induced by spent acid process
CTO yield
Acid need in acidulation
Sulfur intakes
Sodium intakes
Sulfur discharges
Sodium discharges
All sulfur from
acidulation is
excessive
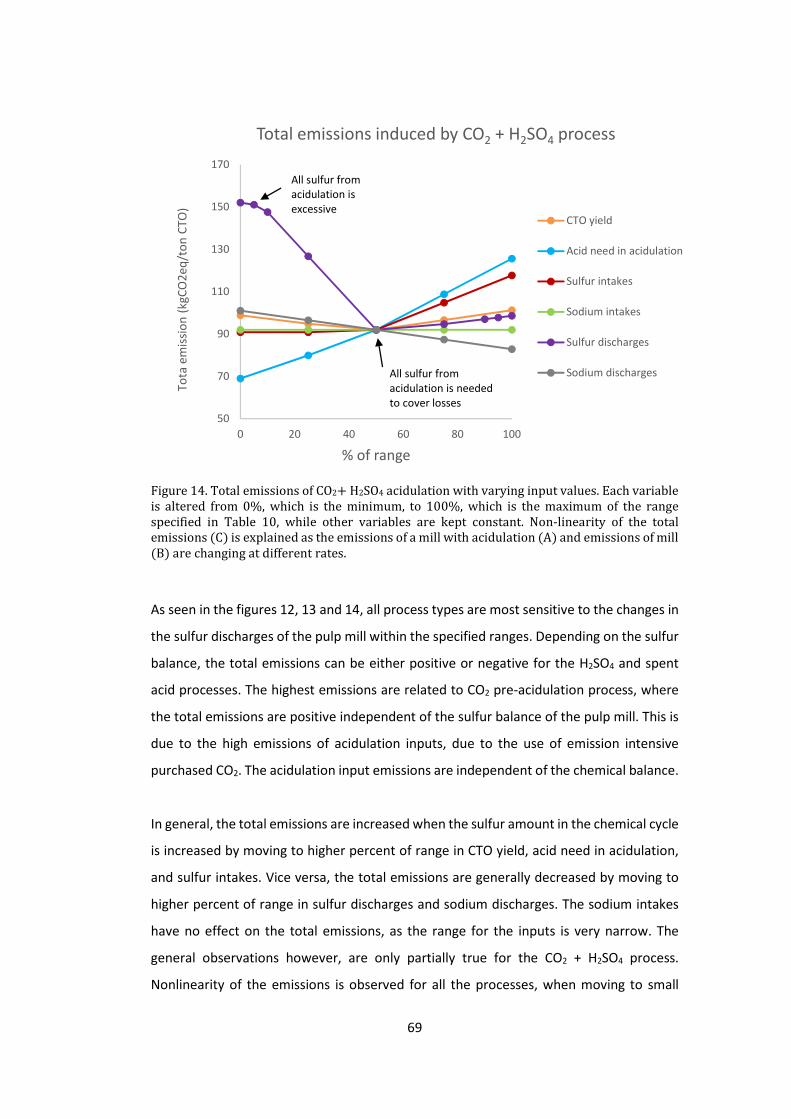
69
Figure 14. Total emissions of CO2+ H2SO4 acidulation with varying input values. Each variable is altered from 0%, which is the minimum, to 100%, which is the maximum of the range specified in Table 10, while other variables are kept constant. Non-linearity of the total emissions (C) is explained as the emissions of a mill with acidulation (A) and emissions of mill (B) are changing at different rates.
As seen in the figures 12, 13 and 14, all process types are most sensitive to the changes in
the sulfur discharges of the pulp mill within the specified ranges. Depending on the sulfur
balance, the total emissions can be either positive or negative for the H2SO4 and spent
acid processes. The highest emissions are related to CO2 pre-acidulation process, where
the total emissions are positive independent of the sulfur balance of the pulp mill. This is
due to the high emissions of acidulation inputs, due to the use of emission intensive
purchased CO2. The acidulation input emissions are independent of the chemical balance.
In general, the total emissions are increased when the sulfur amount in the chemical cycle
is increased by moving to higher percent of range in CTO yield, acid need in acidulation,
and sulfur intakes. Vice versa, the total emissions are generally decreased by moving to
higher percent of range in sulfur discharges and sodium discharges. The sodium intakes
have no effect on the total emissions, as the range for the inputs is very narrow. The
general observations however, are only partially true for the CO2 + H2SO4 process.
Nonlinearity of the emissions is observed for all the processes, when moving to small
50
70
90
110
130
150
170
0 20 40 60 80 100
Tota
em
issi
on
(kg
CO
2e
q/t
on
CTO
)
% of range
Total emissions induced by CO2 + H2SO4 process
CTO yield
Acid need in acidulation
Sulfur intakes
Sodium intakes
Sulfur discharges
Sodium dischargesAll sulfur from
acidulation is needed
to cover losses
All sulfur from
acidulation is
excessive
70
sulfur discharges, and again with higher sulfur discharges for H2SO4 CO2 + H2SO4 process.
The points, where the emission change rate changes, are points where either all the sulfur
from acidulation becomes excessive in the chemical balance or all the sulfur from
acidulation becomes needed to cover the sulfur losses of the balance.
In more detail, the changing differential coefficient of the emissions relates to several
reasons. First, the total emissions reach a local minimum value when the sulfur discharges
are sufficiently high. This is seen in Figure 12 at 95% of range and in Figure 14 at 50% of
range. This minimum-emission situation is equal to the point where both fly ash discharge
need and make-up chemical need in the pulp mill with acidulation are minimized. The
exact amount of sulfur input from acidulation is therefore needed for the chemical
balance without excess. Without this acidulation intake in mill B, corresponding amounts
of sulfur are needed as make-up chemicals. When the sulfur discharges increase towards
this point, the emissions are decreased, as the excess of sulfur is decreased. This leads to
decreasing need for fly ash removal, and correspondingly to smaller amount of sodium
make-up, which results to smaller make-up chemical emissions in mill A. In contrary, when
the sulfur discharges increase further from this point, Na2SO4 make-up is needed in mill A
in addition to the sulfur intake from acidulation, and total emissions start to increase due
to the emissions caused by this added make-up need. As the sulfur addition in H2SO4
process in larger than in the CO2 + H2SO4 process, the minimum emissions are reached
with a higher sulfur discharge level than for CO2 + H2SO4 process. The sulfur addition to
the chemical cycle from spent acid process is so high, that the amount of sulfur is always
excessive within the ranges studied.
In addition to sulfur discharges, a similar local emission minimum is observed in Figure 14,
for CTO yield. The reason for this minimum is the same that for sulfur discharge, just vice
versa, as increasing CTO yield results to increasing acid consumption and sulfur addition
to chemical cycle. Equally as for sulfur discharge, in the minimum emission point, the
sulfur from acidulation covers the balance sulfur need without addition of sulfurous make-
up or need for discharging excess sulfur through fly ash.
Near the minimum sulfur discharge, the change in the emissions is very slow. When the
discharges are increased from 0% of range, both A and B mills have an excess of sulfur,

71
and there is a decreasing need for additional sulfur removal from fly ash with increasing
sulfur discharges. This results to decreasing sodium make-up need in both A and B mills.
However, the sodium make-up need in mill A decreases faster than that for mill B, and the
total emission (EMA-EMB) are slowly decreased with increasing sulfur discharge from 0%
of range. In 0-6% of sulfur discharge range, more than the sulfur from acidulation is
excessive in all A mills. From 6% of range onwards, some of the sulfur intake from
acidulation in A mills is needed to cover the losses in chemical recovery cycle. Due to
higher discharges of sulfur in CSS than CTO, mill B reaches its balance at 8% of the sulfur
discharge range and from 8% onwards, sulfur make-up (Na2SO4) is needed at the B mill.
Hence, from 8% of sulfur discharge range, until all sulfur from acidulation becomes
needed to cover the sulfur losses, the change in emissions (EMA-EMB) is fast as EMA
decreases and EMB increases.
In summary, the sulfur balance of the pulp mill is the most significant variable in the total
emission calculations of acidulation processes. The sulfur balance is affected by the CTO
yield, acid need in acidulation and other sulfur intakes and discharges, but considering the
ranges, the sulfur discharges have the greatest effect on the total emissions of acidulation.
The emissions of acidulation inputs on CO2 + H2SO4 process are higher than for other
processes, due to high emission factor of purchased CO2, and therefore they are less
sensitive to the sulfur balance changes. If the CO2 used in acidulation could be collected
from inside the pulp mill as a waste, the total emissions of CO2 + H2SO4 process would be
much lower, at 50% of sulfur discharge range below zero. Total emissions of H2SO4 and
spent acid process can obtain either positive or negative values, depending on the pulp
mill sulfur balance. The negative total emission values indicate that from the emission
point of view, it is better to balance the pulp mill sulfur deficit by sulfur from acidulation,
than by separate make-up chemicals.
As seen in the sensitivity analysis, changing the initial values through the ranges of the
variables changes the results in a large scale. Therefore, it is impossible to estimate a
typical emission value for an acidulation process, as each pulp mill has a different chemical
balance and is optimized differently considering all the interlinked processes together.
Most uncertainty in the initial estimates was related to the chemical balance of the pulp
mill. However, results are comparable with a study by Ehtonen et al. [31], where using

72
different pulp mill balances, it was similarly to this work concluded, that substituting half
of the H2SO4 by CO2 in acidulation, results to balanced sulfur situation without the removal
need for excess sulfur. In this work, the same conclusion is seen as the local minimum
emission point in Figure 14.
If spent acid from ClO2 plant would be directed to the chemical recovery cycle, contrary
to the presumption made in this work, the sulfur intake of the balance would be higher.
This would lead to higher emissions for all acidulation processes, as most sulfur from the
acidulation would be excessive in the balance. However, in modern mills with high
sulfidity, the spent acid is preferably used elsewhere than in the chemical recovery cycle.
The estimated acidulation input amounts were probably realistic for most mills, as these
variables are less affected by the set-up of the whole mill integrate. Tall oil yied could in
some cases vary more than in the range specified in this work. In this case, the yield of tall
oil would have a larger effect on the process emissions of acidulation, but that would not
make the effect of sulfur balance any less significant.
However, the conclusion, that the pulp mill sulfur balance affects the emissions of
acidulation in an integrated kraft mill, is independent on the initial presumptions made.
The results presented are in line with the earlier conclusion, that the pulp mill chemical
balance cannot be separated from the calculation of acidulation emissions and hence
emissions of acidulation cannot be separated from emissions of the pulp mill. This result
is generalizable in Northern coniferous forest belt, in North America and North Europe
and Asia, where acidulation processes are interlinked with kraft pulping.
73
6 Discussion and recommendations
The total emissions of acidulation are studied in this work, as the residue status of CTO
has been questioned especially due to this processing step in the kraft pulp mill. The
current EU policy does not provide clear instructions on neither defining wastes and
residues nor calculating raw material processing emissions. The instructions provided in
RED Annex V Part C on calculating processing emissions, are all aimed for the processing
of the final biofuel. [1] However, as no other instructions are given, it must be assumed
that the same rules apply also for raw material processing.
Crude sulfate soap, from which CTO is generated in acidulation, is undoubtedly a
processing residue from pulp production, as it separates unavoidably and has to be
removed from the pulping process to optimize pulp production [26, 25]. Without further
knowledge, it would seem appealing to classify CSS a residue, and add acidulation
emissions to the lifecycle analysis of a CTO based biofuel. However, as the acidulation
process in interlinked with the pulping process, this approach has two major drawbacks.
First, the configuration of the acidulation process in a pulp mill, presented in Figure 15, is
directly comparable to the concept of a refinery, defined by the certification schemes [21,
22], and pictured in Figure 2. According to this definition of a refinery, processing
emissions should be determined for the whole pulp mill, and then divided between the
products, allocating zero emissions to wastes and residues [1]. In this approach,
considering CSS a residue from pulp production would be equal to allocating zero
emissions to an intermediate stream inside the system boundary, which is clearly against
the allocation rule [1]. This refinery rule is most probably set, because the division of
emissions from different process parts is extremely difficult, as concluded in this work.
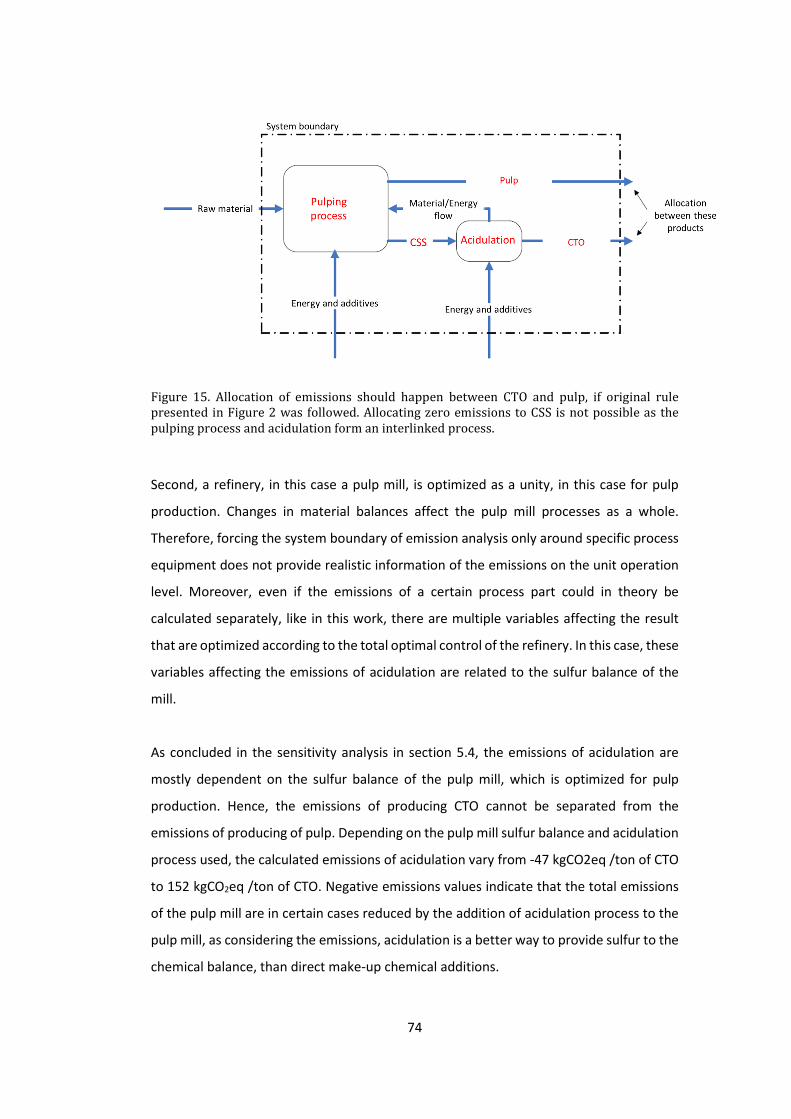
74
Figure 15. Allocation of emissions should happen between CTO and pulp, if original rule presented in Figure 2 was followed. Allocating zero emissions to CSS is not possible as the pulping process and acidulation form an interlinked process.
Second, a refinery, in this case a pulp mill, is optimized as a unity, in this case for pulp
production. Changes in material balances affect the pulp mill processes as a whole.
Therefore, forcing the system boundary of emission analysis only around specific process
equipment does not provide realistic information of the emissions on the unit operation
level. Moreover, even if the emissions of a certain process part could in theory be
calculated separately, like in this work, there are multiple variables affecting the result
that are optimized according to the total optimal control of the refinery. In this case, these
variables affecting the emissions of acidulation are related to the sulfur balance of the
mill.
As concluded in the sensitivity analysis in section 5.4, the emissions of acidulation are
mostly dependent on the sulfur balance of the pulp mill, which is optimized for pulp
production. Hence, the emissions of producing CTO cannot be separated from the
emissions of producing of pulp. Depending on the pulp mill sulfur balance and acidulation
process used, the calculated emissions of acidulation vary from -47 kgCO2eq /ton of CTO
to 152 kgCO2eq /ton of CTO. Negative emissions values indicate that the total emissions
of the pulp mill are in certain cases reduced by the addition of acidulation process to the
pulp mill, as considering the emissions, acidulation is a better way to provide sulfur to the
chemical balance, than direct make-up chemical additions.

75
The highest emission levels of the acidulation processes studied are related to the CO2 +
H2SO4 acidulation process, where the total emissions of acidulation are always above zero.
However, the decision for implementing a CO2 pre-acidulation process instead of using
only H2SO4, which would have lower emissions, is made in order to control the sulfur
balance of the pulp mill by restricting sulfur intake in mother liquid. Therefore, the
emissions of acidulation process are always dependent on the control of the pulp mill
sulfur balance, which is optimized for pulp production, not CTO production. As the
optimization of pulp production affects the acidulation emissions the most, these
emissions should be allocated to pulp, rather than to CTO.
The results of this work support the use of the refinery rule [1] also for processing of
biofuel feedstocks, as reliable separation of the emissions of interlinked processes is not
possible. As CSS is clearly a residual stream from pulping and no emissions can be
allocated to CTO from acidulation, it is recommended that CTO is regarded a residue from
pulp production in EU biofuel legislation.
Another aspect supporting this conclusion is that acidulation is a predetermined
processing step in the total pulp mill optimization. CSS is inevitably separated from pulp
production and acidulation is an optimal way to dispose it and recycle the valuable
cooking chemicals. A predetermined normal processing step does not prevent a material
to be considered a residue. For example, RED lists crude glycerine as a processing residue
although like CTO, it is generated in an additional process. Crude glycerine is a side-stream
from conventional biodiesel (FAME) processing after separation of glycerine containing
stream from FAME containing phase, it is often neutralized by an acid, and water and
alcohol are removed from the crude glycerine by distillation [45]. As the resulting pre-
treated crude glycerine stream is considered a residue by the European Union, it would
be inconsistent not to regard CTO as one.
76
7 Conclusions
In this work, a method for calculating the process emissions of CSS acidulation to CTO was
created and implemented for three common acidulation processes. Conclusions were
made on whether these emissions can be separated from the emissions caused by the
pulp production in a kraft mill and recommendations on the classification of CTO in EU
biofuel policy were provided according to results.
The acidulation process is directly interlinked with the kraft pulp mill and constitutes a
major intake of sulfur to the chemical recovery cycle of the mill. The method created in
this work for the calculation of acidulation emissions, takes into account the effects of
acidulation on the chemical recovery cycle of the mill. In the calculation method, the total
emissions of acidulation were determined by the difference between the emissions of a
pulp mill with an acidulation process and the emissions of an identical pulp mill without
an acidulation process. This approach was built in line with the directions set in the
Renewable Energy Directive, which specifies that the emissions of a refinery, build of
several interlinked processes, shall be analyzed on the refinery level. The method was
used for calculating the process emissions of acidulation by sulfuric acid, acidulation by
spent acid and acidulation by carbon dioxide and sulfuric acid. The sensitivity of the
emissions to different variables, from their minimum to the maximum value, was
analyzed, as most of the variables were determined as typical ranges, rather than typical
values.
It was observed, that depending on the acidulation process and the sulfur balance of the
pulp mill, acidulation could either increase or decrease the emissions of the whole pulp
mill in comparison to the mill without acidulation. The total emissions of all studied
acidulation processes were found to be the most sensitive to discharges of sulfur from the
pulp mill chemical balance. No typical value for the emissions of any of the processes
could be assigned, due to the strong dependence of the emissions on the sulfur balance,
which varies by mill and time, and is controlled for optimization of pulp production. As
acidulation emissions depend more on pulp production than on CTO production, the
emissions of pulp processing and CTO processing in acidulation cannot be separated and
allocated to CTO.

77
In conclusion, CSS is clearly a residual stream, but according to the Renewable Energy
Directive, no allocation of zero emissions should be done to CSS as it is an intermediate
stream. In addition, the emissions of converting CSS to CTO in acidulation cannot be
separated from the emissions of pulp processing. Therefore, no processing emissions can
be allocated to CTO and it is recommended that CTO is considered a residue of pulp
production in the EU legislation.

78
References
1. Directive 2009/28/EC of the European parliament and of the council of 23 April
2009 on the promotion of the use of energy from renewable sources and amending
and subsequently repealing Directives 2001/77/EC and 2003/30/EC, OJ L 140, April
23, 2009, p.16-62.
2. Tuovinen, J., Arizona Chemicals, Statement regarding the Finnish Ministry on
Employment and the Economy's documentary TEM/2930/03.01.01/2011, 2011.
3. Real green gold web page, Arizona Chemical, Forchem, Respol,
http://www.realgreengold.com/what-is-at-stake/. Accessed: May 28, 2015.
4. Directive 2009/30/EC of the European Parliament and of the Council of 23 April
2009 amending Directive 98/70/EC as regards the specification of petrol, diesel and
gas-oil and introducing a mechanism to monitor and reduce greenhouse gas
emissions and amending Council Directive 1999/32/EC as regards the specification
of fuel used by inland waterway vessels and repealing Directive 93/12/EEC,
2009/30/EC, OJ L 140, p. 88-113.
5. Laki biopolttoaineista ja bionesteistä 393/2013 (Act on biofuels and bioliquids),
393/2013, June 7, 2013.
6. Laki biopolttoaineiden käytön edistämisestä liikenteessä 446/2007 (Distribution
obligation act), 446/2007, December 30, 2010.

79
7. Communication from the Commission on the practical implementation of the EU
biofuels and bioliquids sustainability scheme and on counting rules for biofuels,
2010/C 160/02, OJ C 160, p. 8-16.
8. Finnish Energy Authority web page: Approved sustainability management systems,
http://www.energiavirasto.fi/hyvaksytyt-kestavyysjarjestelmat. Accessed: May 28,
2015.
9. New GHG requirements for Voluntary Sustainability Schemes, Biofuels
International,
http://biofuelsnews.com/display_news/8673/new_ghg_requirements_for_volunta
ry_sustainability_schemes/. Accessed: January 28, 2015.
10. Ecofys, Observations on advanced biofuel feedstocks and policies in the EU,
Unpublished report, 2014.
11. ePure, Overview of the biofuel policies in EU-28 Member States, Unpublished
report, 2014.
12. Position of the European Parliament adopted at second reading on 28 April 2015
with a view to the adoption of Directive (EU) 2015/... of the European Parliament
and of the Council amending Directive 98/70/EC relating to the quality of petrol
and diesel fuels and amending Directive 2009/28/EC on the promotion of the use of
energy from renewable sources, P8_TA(2015)0100, April 28, 2015.
13. ISCC System GmbH , Lists of material eligible for ISCC EU certification, November
24, 2014.

80
14. Federal Office for Agriculture and Food of Germany, List regarding the concretion of
possible materials which can be credited as waste and residues for the GHG-quote
pursuant to § 37 a para. 4 of the BImSchG, 2015.
15. Regeling van de Staatssecretaris van Infrastructuur en Milieu, van 27 november
2014, nr. IenM/BSK-2014/259021, houdende vaststelling van regels ter uitvoering
van titel 9.7 Hernieuwbare energie vervoer van de Wet milieubeheer en van het
Besluit hernieuwbare energie vervoer 2015 (Act on renewable energy in transport
2015), IenM/BSK-2014/259021, November 27, 2014.
16. Swedish Energy Agency , Vägledning till regelverket om hållbarhetskriterier för
biodrivmedel och flytande biobränslen (Guidance on the regulatory framework of
sustainability criteria for biofuels and bioliquids), 2012.
17. UK Government, Renewable Transport Fuel Obligation (RTFO) Guidance: List of
Wastes and Residues year 7 version 7.3, 2015.
18. Panda, D.H. , Handbook on Tall Oil Rosin Production, Processing and Utilization, Asia
Pacific Business Press Inc., Delhi 2013, 480 p.
19. Communication from the Commission on voluntary schemes and default values in
the EU biofuels and bioliquids sustainability scheme, 2010/C 160/01, OJ C 160, June
19, 2010, p. 1-7.
20. European Commission web page: Voluntary schemes,
http://ec.europa.eu/energy/en/topics/renewable-energy/biofuels/voluntary-
schemes. Accessed: January 28, 2015.
81
21. ISCC System GmbH, ISCC 205 GHG Emissions Calculation Methodology and GHG
Audit v. 2.3 EU, 2011.
22. Finnish Energy Authority, Lain biopolttoaineista ja bionesteistä mukainen
Toiminnanharjoittajan kestävyyskriteeriohje (Sustainability criteria instructions for
operators according to Act on biofuels and bioliquids), 2013.
23. The ecoinvent Database version 2.2, Ecoinvent,
http://www.ecoinvent.org/database/database.html.
24. Biograce GHG calculation tool 2011, Biograce,
http://www.biograce.net/content/ghgcalculationtools/recognisedtool/.
25. KnowPulp 10.0, AEL,
http://know.aalto.fi.libproxy.aalto.fi/pulp/latest/english/kps/ui/frontpage.htm.
Accessed: March 18, 2015.
26. European IPPC Bureau, Best Available Techniques (BAT) Reference Document for
the Production of Pulp, Paper and Board, FINAL DRAFT, 2013.
27. UPM Biorefining, Internal documentation, 2015.
28. Pikka O., Sulfaattisellutehtaan rikki- ja natriumtase, Licenciate thesis, Helsinki
University of Technology, Laboratory of Pulping Technology, Espoo 1979, 162 p.
29. Vuorikari O., Tanner T., Koistinen J., Sarkkinen K. and Mattelmäki E., Method for
acidification of soap with sodium bisulphite solution, CA2148232 C, 2000.
82
30. Maunus-Tiihonen M., Suovan käsittely ja mäntyöljyn valmistus, UPM internal
report, 2006.
31. Ehtonen P., Methods to balance the kraft pulp mill, Doctoral thesis, Helsinki
University of Technology, Department of Chemical Technology, Espoo 1997, 95 p.
32. Morris C. and Watkins G., Tall oil recovery, US 3575952 A, 1971.
33. Canifru J., Process for obtainiing tall oil from a sodium sesquisulfate solution,
US20130172527 A1, 2013.
34. Pöyry SmartTerminal online service, Pöyry Management Consulting,
https://www.jpsmartterminal.com/clients/. Accessed: January 28, 2015.
35. Ehtonen P., Hurme M. and Järveläinen M., Integrated Chemical Plants at the Pulp
Mill, Helsinki University of Technology, Laboratory of Chemical Engineering, Plant
Design Report Series 37, Espoo 1995, 24 p.
36. Kontu T., Sodium and sulfur balances of a kraft pulp mill, Master´s thesis, Aalto
University, Department of Forest products Technology, Espoo 2010, 91 p.
37. Commission Implementing Decision of 26 September 2014 establishing the best
available techniques (BAT) conclusions, under Directive 2010/75/EU of the
European Parliament and of the Council, for the production of pulp, paper and
board, OJ L 284, September 26, 2014, p. 76-125.
38. Keitaanniemi O., Eräiden alkuaineiden määrät ja käyttäytyminen
sulfaattisellutehtaan kierroissa, Helsinki University of Technology, Department of
Forest Product Technologies, Laboratory of Chemical Pulping, Espoo 1977, 117 p.

83
39. Ali M. and Sreekrishnan T., Aquatic toxicity from pulp and paper mill effluents: a
review, Adv. Environ. Res. 5 (2) (2001) 175-196.
40. AkzoNobel web page: Chlorine dioxide technology,
https://www.akzonobel.com/eka/products/plant_equipment_it/eka_engineering/
products_services/chlorine_dioxide_tech/. Accessed: January 14, 2015.
41. Environmental Impact Assessment of Äänekoski Bioproduct mill, Metsä Fibre. The
Centre for Economic Development, Transport and the Environment of Central
Finland, 2014.
42. Valmet web page: Ash leaching and crystallization solutions,
http://www.valmet.com/Valmet/products/Vault2MP.nsf/BYWID/WID-130603-
2256E-8AC31/$File/HPGB_B_2300_018-02.pdf?OpenElement. Accessed: May 28,
2015.
43. Nurmesniemi H., Pöykiö R. and Keiski R.L., A case study of waste management at
the Northern Finnish pulp and paper mill complex of Stora Enso Veitsiluoto Mills,
Waste manage. 27 (2007) 1939-1948.
44. Ehtonen P., Golam S. and Hurme M., Studies on the ecologically balanced ECF pulp
mill, International pulp bleaching conference, Halifax 2000, p. 205-208.
45. Leung D., Wu X. and Leung M., A review on biodiesel production using catalyzed
transesterification, Appl. Energy 87 (2010) 1083-1095.