Embed Size (px)
Citation preview
School Finance 101
Presented by Thomas E. White
Michigan School Business Officials
October 2004
2
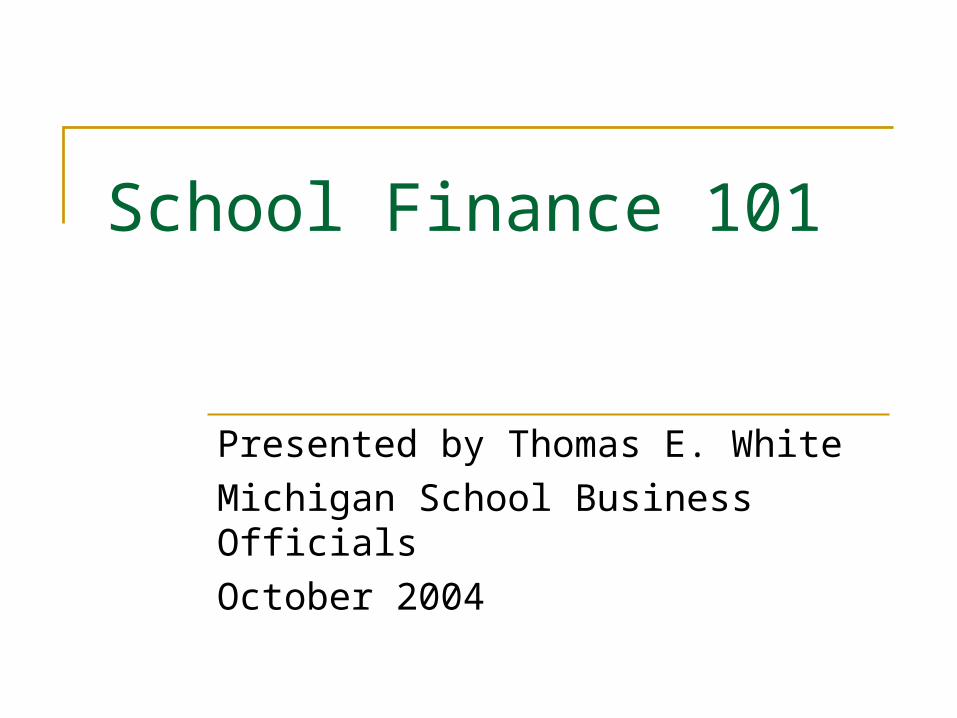
The Michigan Budget
Total State Budget = $39.1 billion State’s 2 Major Funds
General = $8.7 billion School Aid = $12.5 billion
State Funds Restricted for Other Purposes Transportation Federal Revenues
3
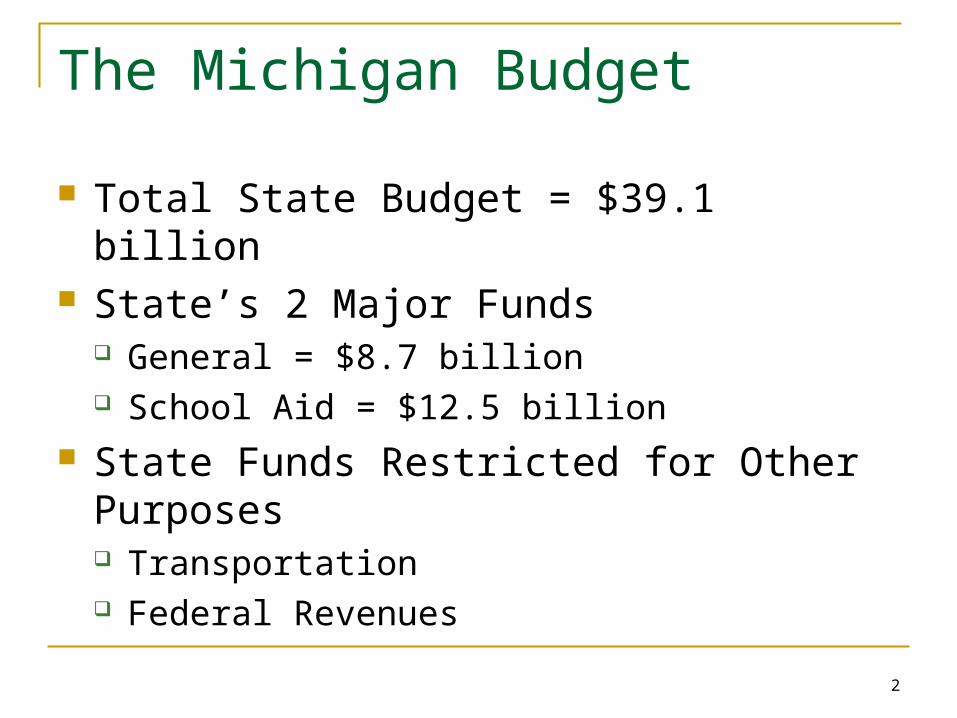
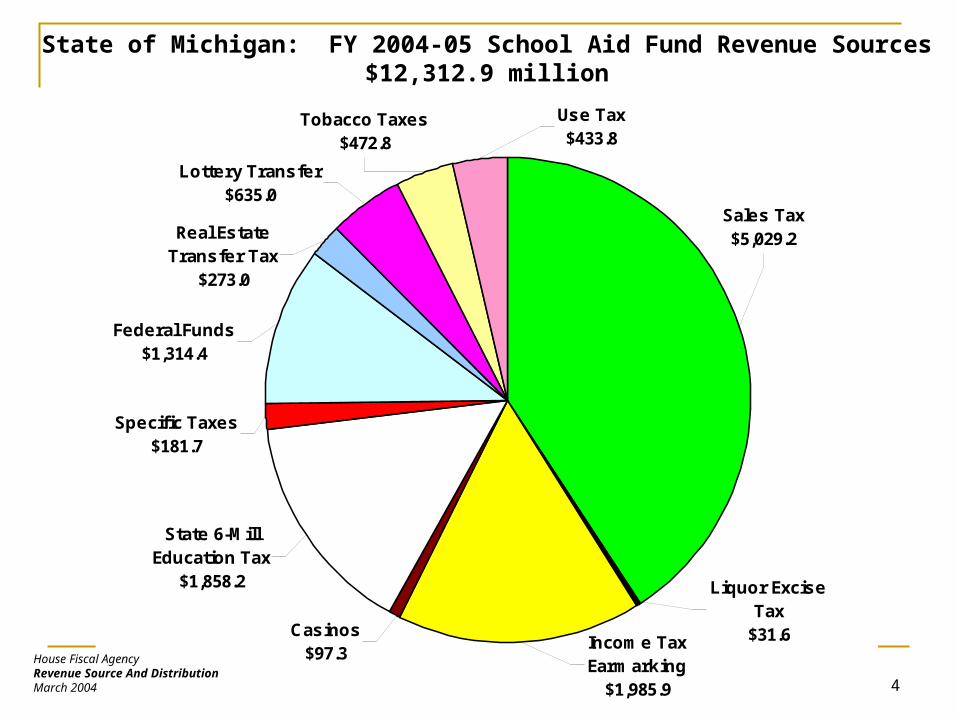
Tobacco Taxes$128.0
Other Sources$372.4
Liquor, Beer, and Wine Taxes
$83.6
Sales and Use Taxes$987.2
Inheritance/ Estate Tax
$34.0
Single Business Tax
$1,962.5
Income Taxes$3,994.1
Insurance Company Tax
$261.0
State of Michigan: FY2004-05 General Fund/General Purpose Revenue Sources$7,822.8 million
House Fiscal AgencyRevenue Source And DistributionMarch 2004
4
Use Tax$433.8
Federal Funds$1,314.4
Specific Taxes$181.7
Casinos$97.3
State 6-Mill Education Tax
$1,858.2 Liquor Excise Tax
$31.6Income Tax Earmarking
$1,985.9
Sales Tax$5,029.2
Lottery Transfer$635.0
Real Estate Transfer Tax
$273.0
Tobacco Taxes$472.8
State of Michigan: FY 2004-05 School Aid Fund Revenue Sources$12,312.9 million
House Fiscal AgencyRevenue Source And DistributionMarch 2004
5
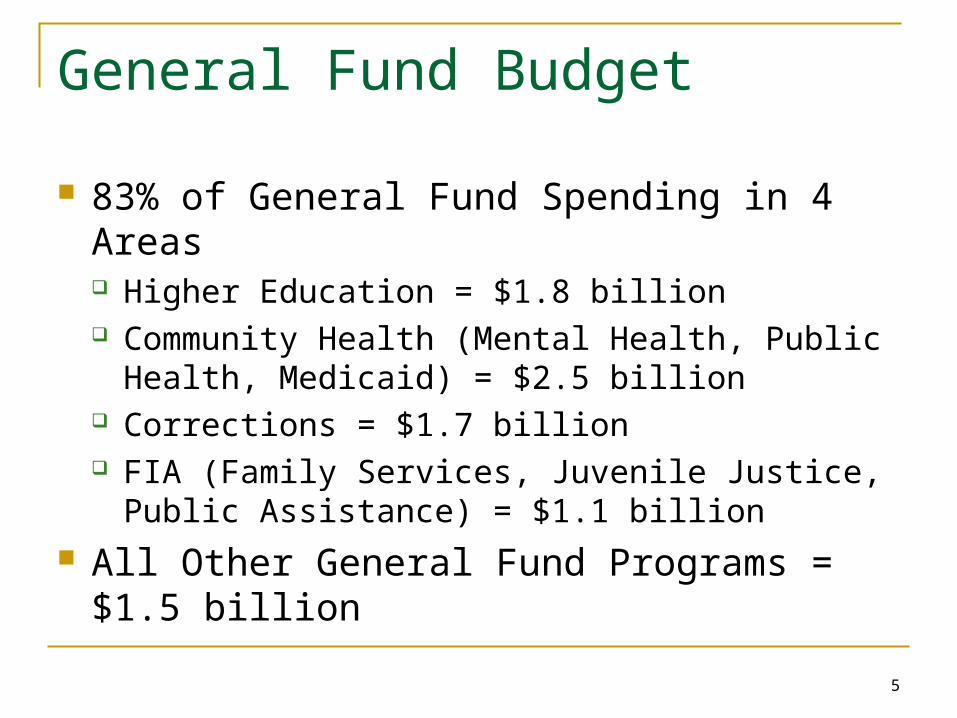
General Fund Budget
83% of General Fund Spending in 4 Areas Higher Education = $1.8 billion Community Health (Mental Health, Public Health,
Medicaid) = $2.5 billion Corrections = $1.7 billion FIA (Family Services, Juvenile Justice, Public
Assistance) = $1.1 billion All Other General Fund Programs = $1.5
billion
6
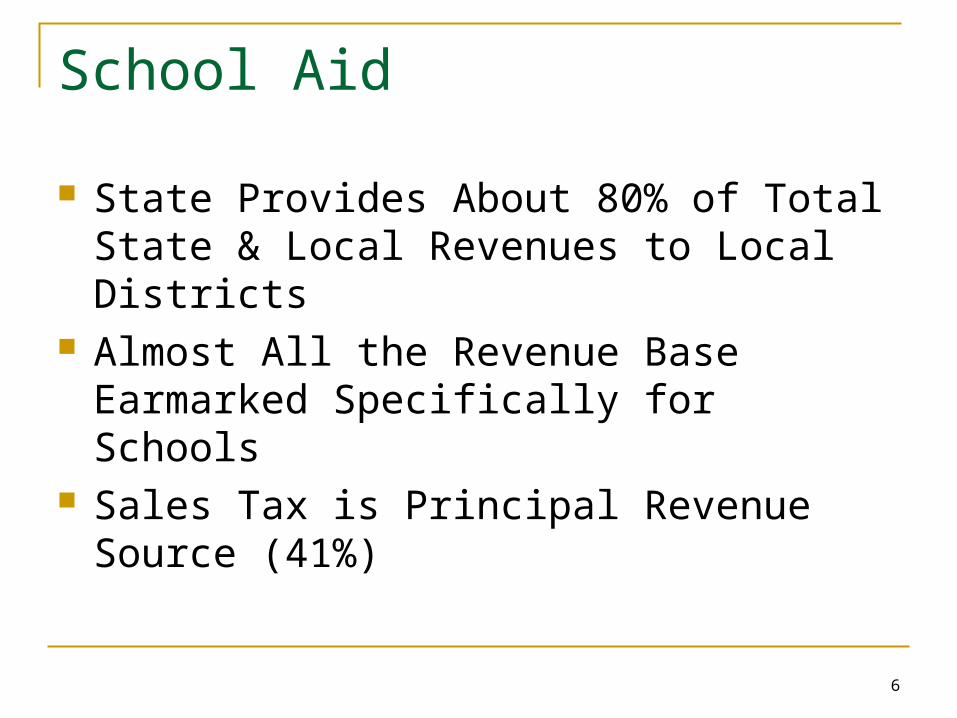
School Aid
State Provides About 80% of Total State & Local Revenues to Local Districts
Almost All the Revenue Base Earmarked Specifically for Schools
Sales Tax is Principal Revenue Source (41%)
7
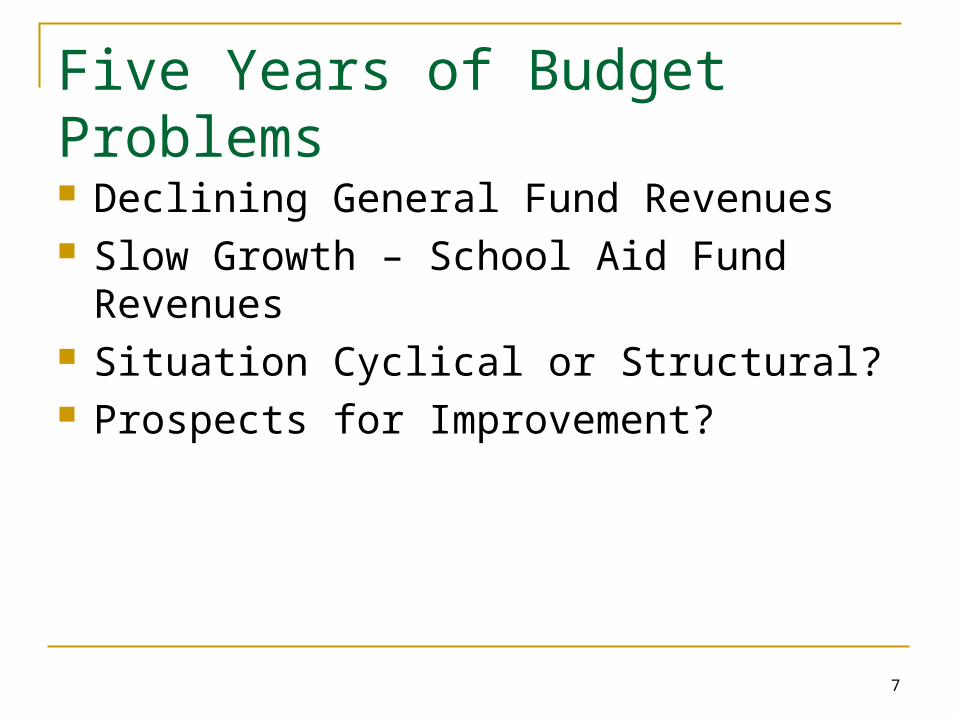
Five Years of Budget Problems Declining General Fund Revenues Slow Growth – School Aid Fund Revenues Situation Cyclical or Structural? Prospects for Improvement?

8
Perspective on Revenues
Actual General Fund Revenues in FY03, FY04 & FY05 Below FY95
10 Years of Higher Costs & Increased Needs Go Unfunded
Some Programs Crowding Out Others

9
FY2004 Review – General Fund Budgets Cut $1.7 billion
General Fund = $1,335 million School Aid = $361 million
One-time Resources & Savings = $807 million
Fees & Other Revenues = $453 million Other Changes = $155 million Tax Increases Off the Table More Cuts Coming

10
FY2004 School Aid Review
School Aid Down Year to Year = $128 million First Decline Since Proposal A Retirement Percentage Going to 14.87%
from 12.99% - Reserves used to postpone increase
Can More Cuts Be Avoided?

11
How Weak is the Economy?
Michigan’s Recent Statistics 46th in Personal Income Growth 48th in Unemployment Rate 49th in Employment Growth (Decline for Michigan) 49th in Index of Economic Momentum (Population,
Personal Income, Employment)
12
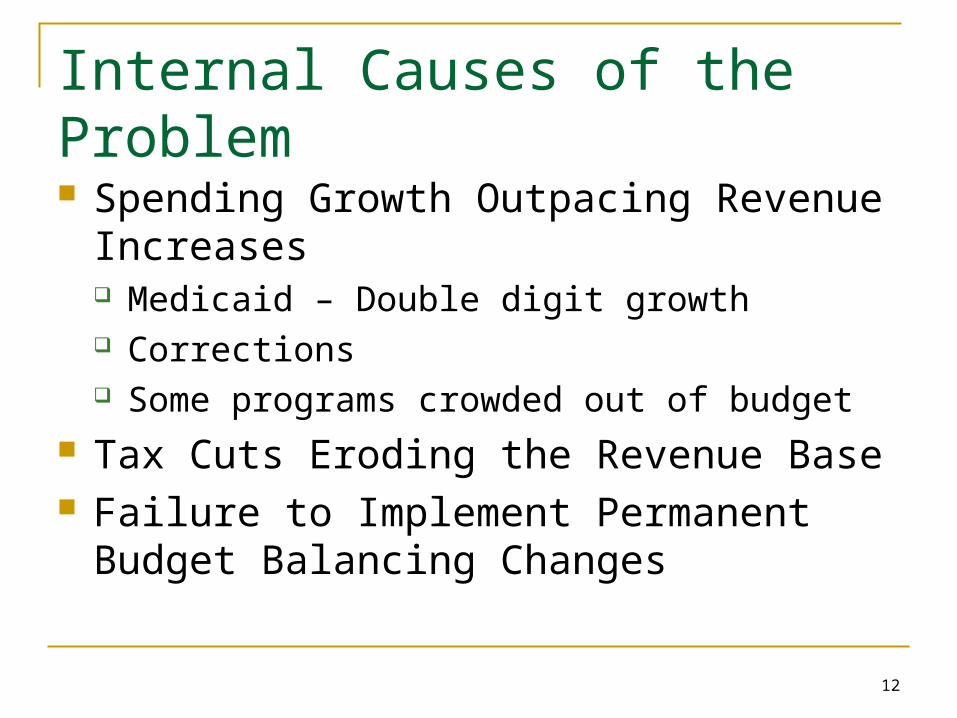
Internal Causes of the Problem Spending Growth Outpacing Revenue
Increases Medicaid – Double digit growth Corrections Some programs crowded out of budget
Tax Cuts Eroding the Revenue Base Failure to Implement Permanent Budget
Balancing Changes
13
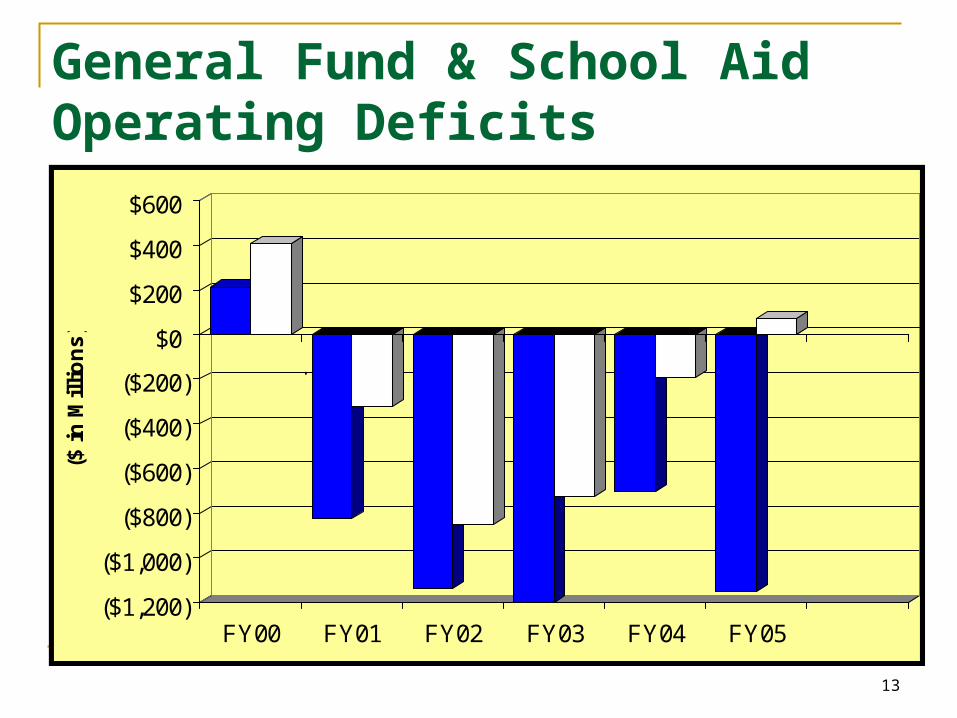
($1,200)
($1,000)
($800)
($600)
($400)
($200)
$0
$200
$400
$600
($ i
n M
illi
on
s)
FY00 FY01 FY02 FY03 FY04 FY05
School Aid Fund
General Fund
General Fund & School Aid Operating Deficits
14
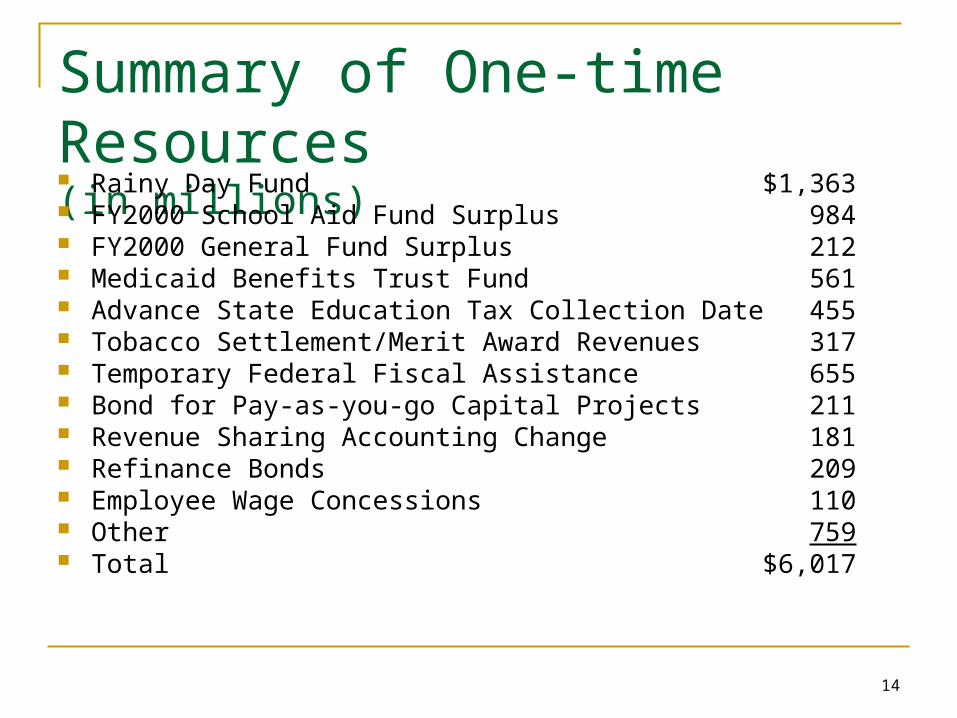
Summary of One-time Resources (in millions) Rainy Day Fund $1,363 FY2000 School Aid Fund Surplus 984 FY2000 General Fund Surplus 212 Medicaid Benefits Trust Fund 561 Advance State Education Tax Collection Date 455 Tobacco Settlement/Merit Award Revenues 317 Temporary Federal Fiscal Assistance 655 Bond for Pay-as-you-go Capital Projects 211 Revenue Sharing Accounting Change 181 Refinance Bonds 209 Employee Wage Concessions 110 Other 759 Total $6,017
15
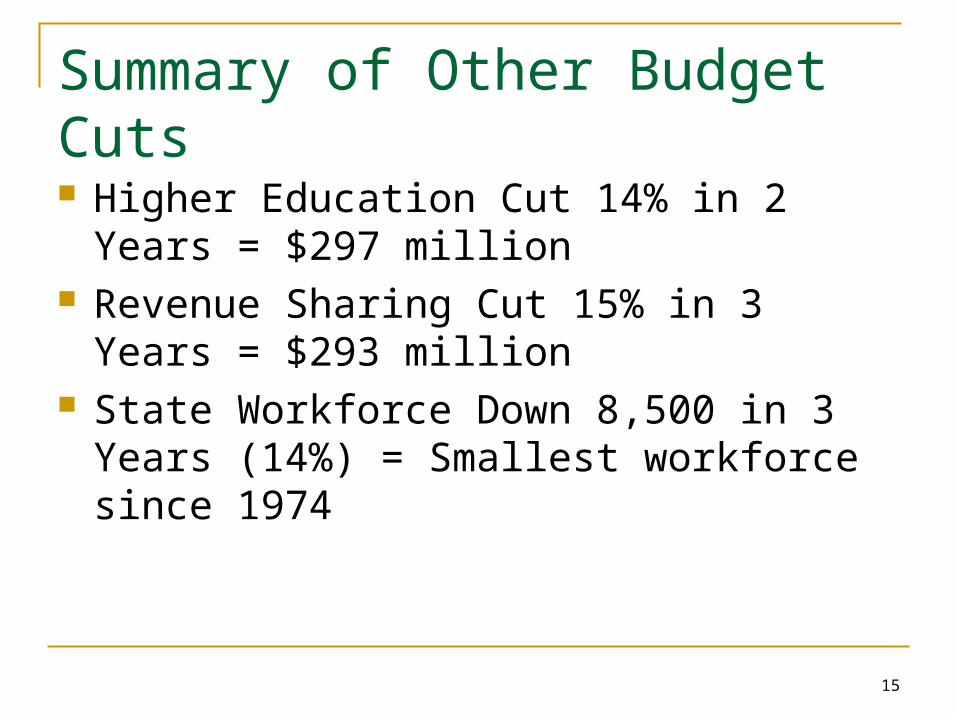
Summary of Other Budget Cuts Higher Education Cut 14% in 2 Years = $297
million Revenue Sharing Cut 15% in 3 Years = $293
million State Workforce Down 8,500 in 3 Years
(14%) = Smallest workforce since 1974
16
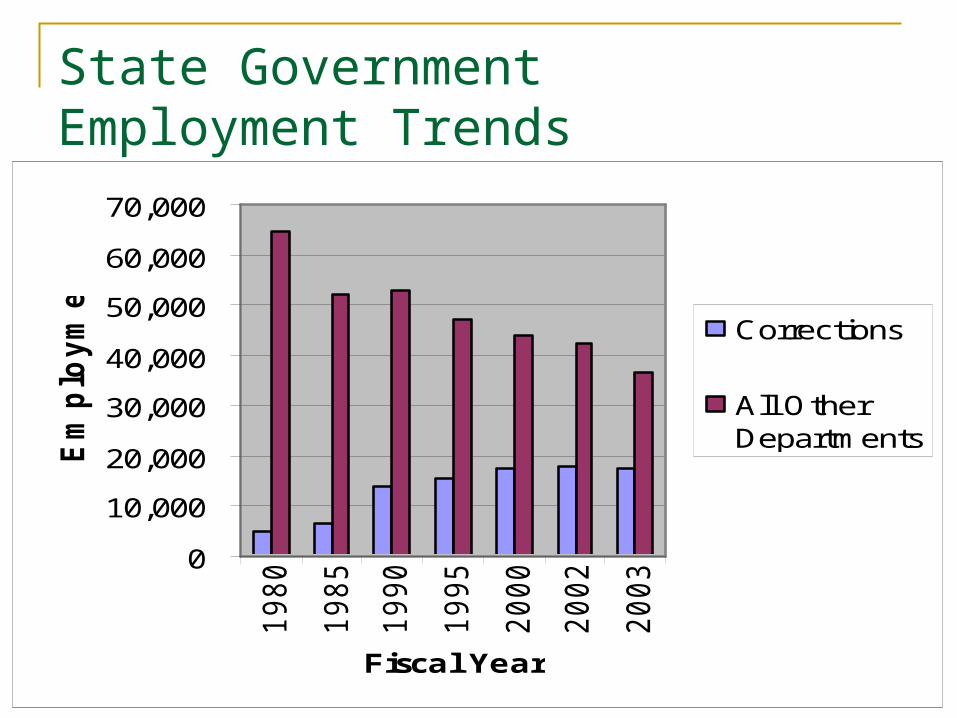
State Government Employment Trends
0
10,000
20,000
30,000
40,000
50,000
60,000
70,000
1980
1985
1990
1995
2000
2002
2003
Fiscal Year
Em
plo
ym
en
t
Corrections
All OtherDepartments
17
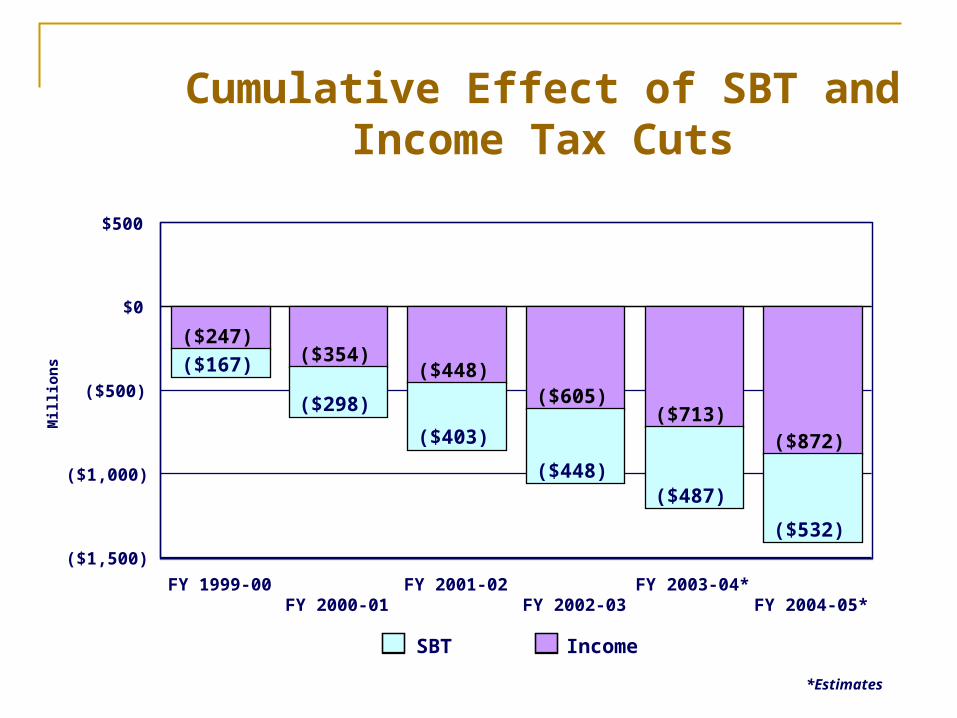
Cumulative Effect of SBT and Income Tax Cuts
($167)
($298)
($403)
($448)($487)
($532)
($247)($354)
($448)($605)
($713)($872)
FY 1999-00FY 2000-01
FY 2001-02FY 2002-03
FY 2003-04*FY 2004-05*
($1,500)
($1,000)
($500)
$0
$500
Mil
lio
ns
SBT Income
*Estimates
18
Proposal A – What Did it Do?
Senate Fiscal Agency Report Says 28 districts are better off 553 districts are worse
19
What About Taxpayers?
Michigan was 14th in Tax Burden in 1993 Michigan was 20th in Tax Burden in 2000 Property Taxes are 6.1% Above National
Average Sales & Use Taxes are 0.8% Below National
Average
20
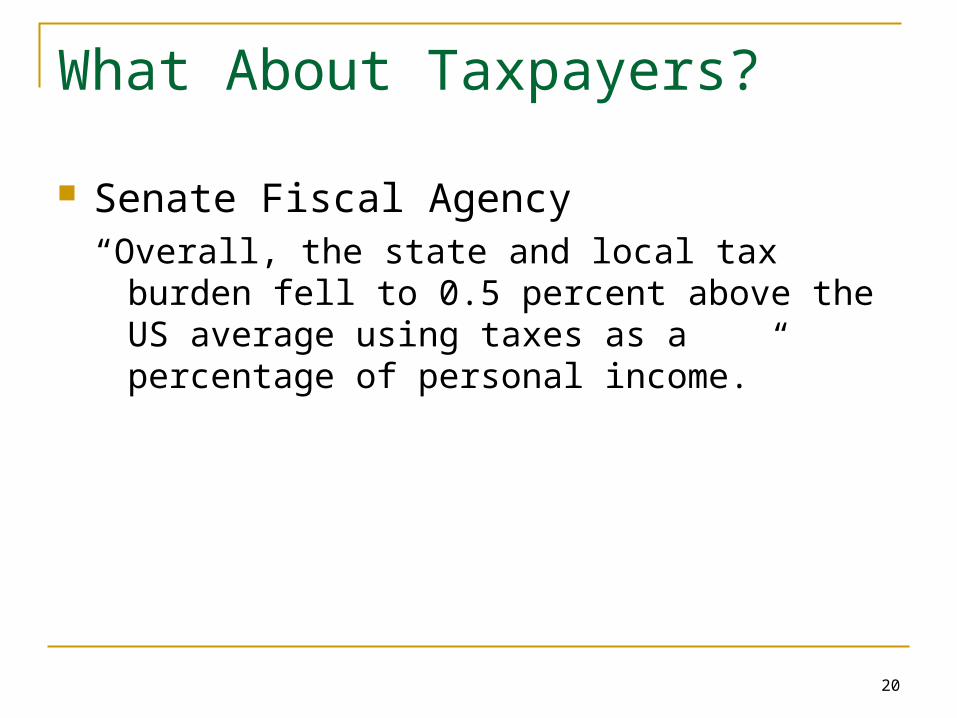
What About Taxpayers?
Senate Fiscal Agency“Overall, the state and local tax burden fell to 0.5
percent above the US average using taxes as a percentage of personal income.”
21
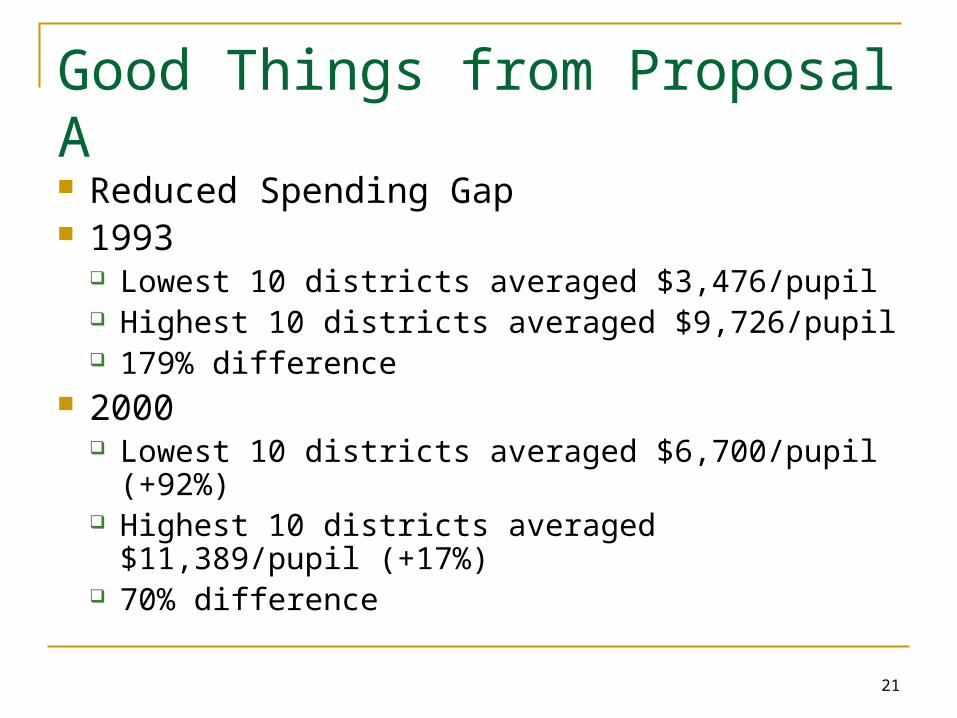
Good Things from Proposal A
Reduced Spending Gap 1993
Lowest 10 districts averaged $3,476/pupil Highest 10 districts averaged $9,726/pupil 179% difference
2000 Lowest 10 districts averaged $6,700/pupil (+92%) Highest 10 districts averaged $11,389/pupil
(+17%) 70% difference
22
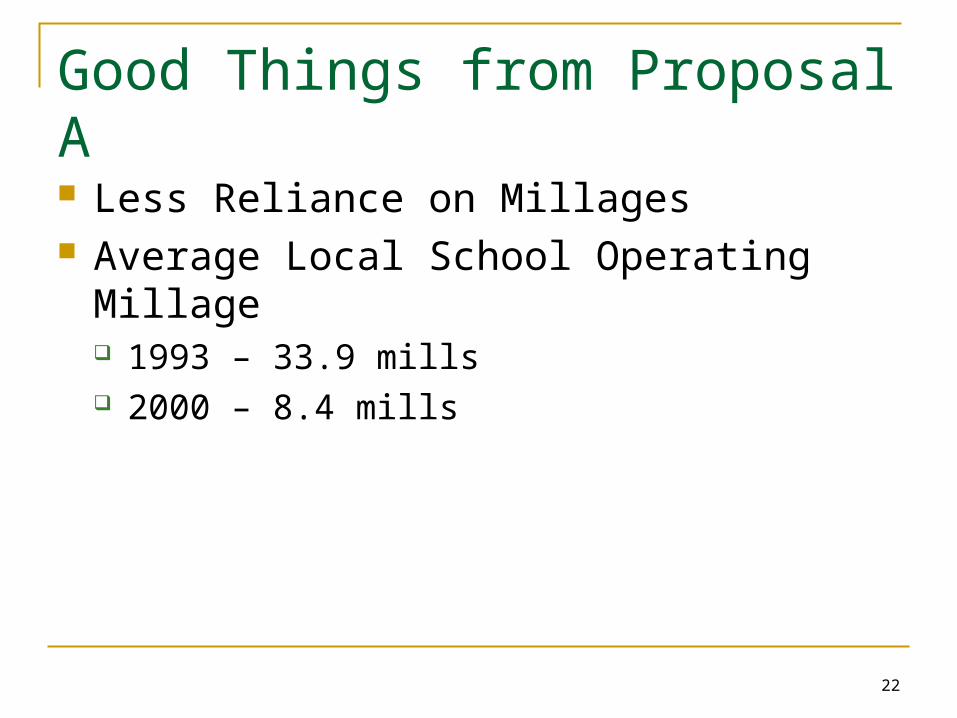
Good Things from Proposal A
Less Reliance on Millages Average Local School Operating Millage
1993 – 33.9 mills 2000 – 8.4 mills

23
Proposal A’s Impact on Foundation Allowance Foundation Allowance has not Increased in 3
Years Summary of K-12 Budget Cuts Since 2002
Lost $127 million in prorated foundation allowances & categoricals in 2002-03
Lost $111 million in reduced/eliminated categoricals in 2003-04
Lost $131 million in prorated foundation allowances in 2003-04
24
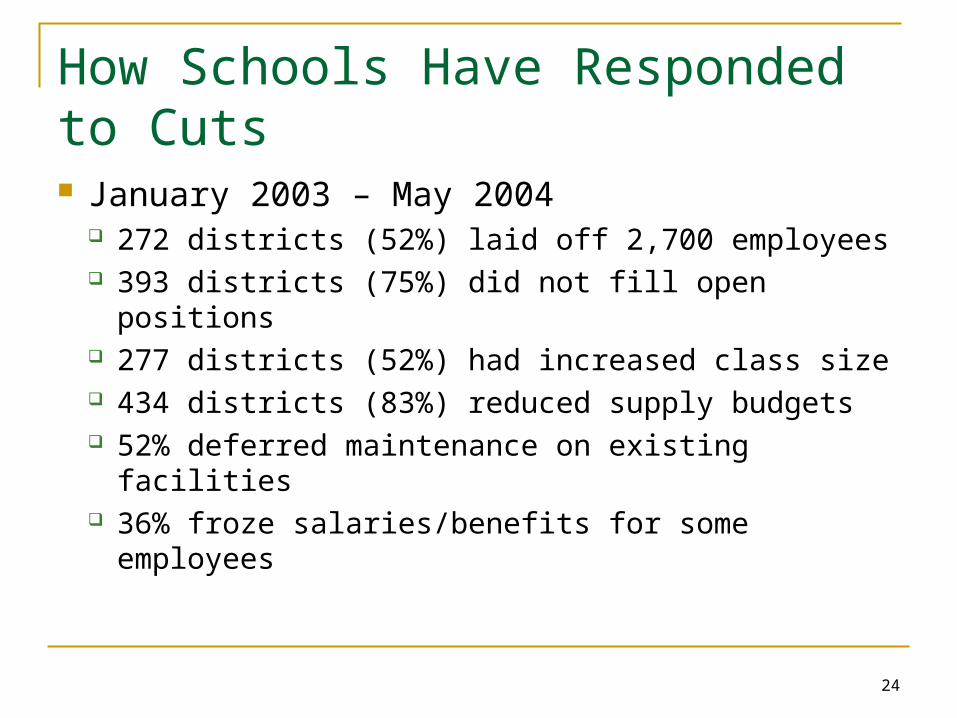
How Schools Have Responded to Cuts January 2003 – May 2004
272 districts (52%) laid off 2,700 employees 393 districts (75%) did not fill open positions 277 districts (52%) had increased class size 434 districts (83%) reduced supply budgets 52% deferred maintenance on existing facilities 36% froze salaries/benefits for some employees
25
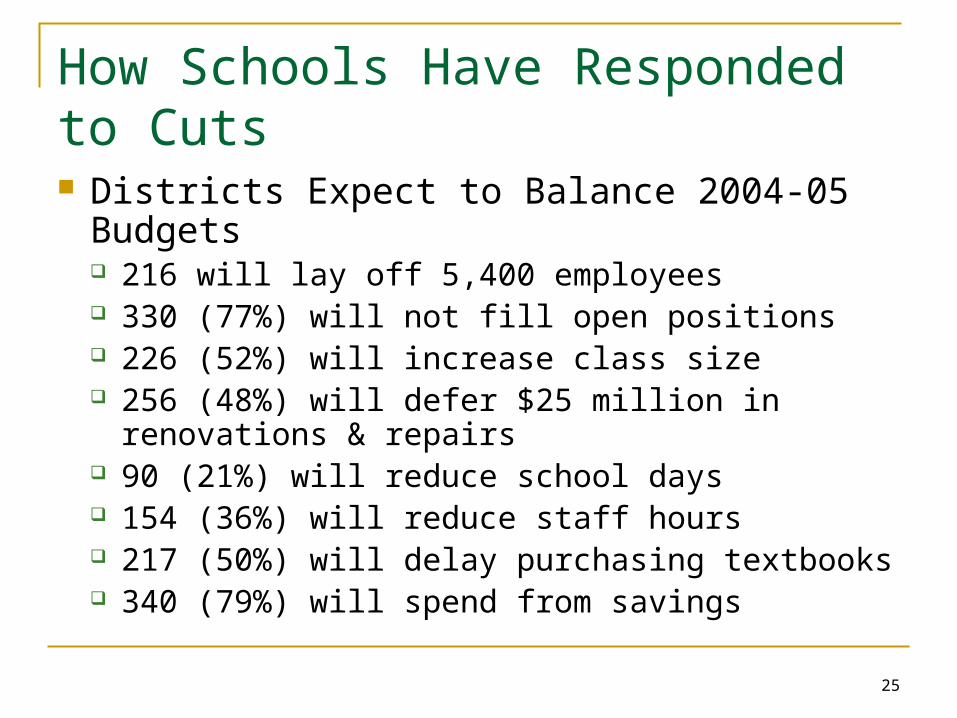
How Schools Have Responded to Cuts Districts Expect to Balance 2004-05 Budgets
216 will lay off 5,400 employees 330 (77%) will not fill open positions 226 (52%) will increase class size 256 (48%) will defer $25 million in renovations &
repairs 90 (21%) will reduce school days 154 (36%) will reduce staff hours 217 (50%) will delay purchasing textbooks 340 (79%) will spend from savings

26
How to Evaluate a School Funding System Predictability Equity Adequacy Stability
27
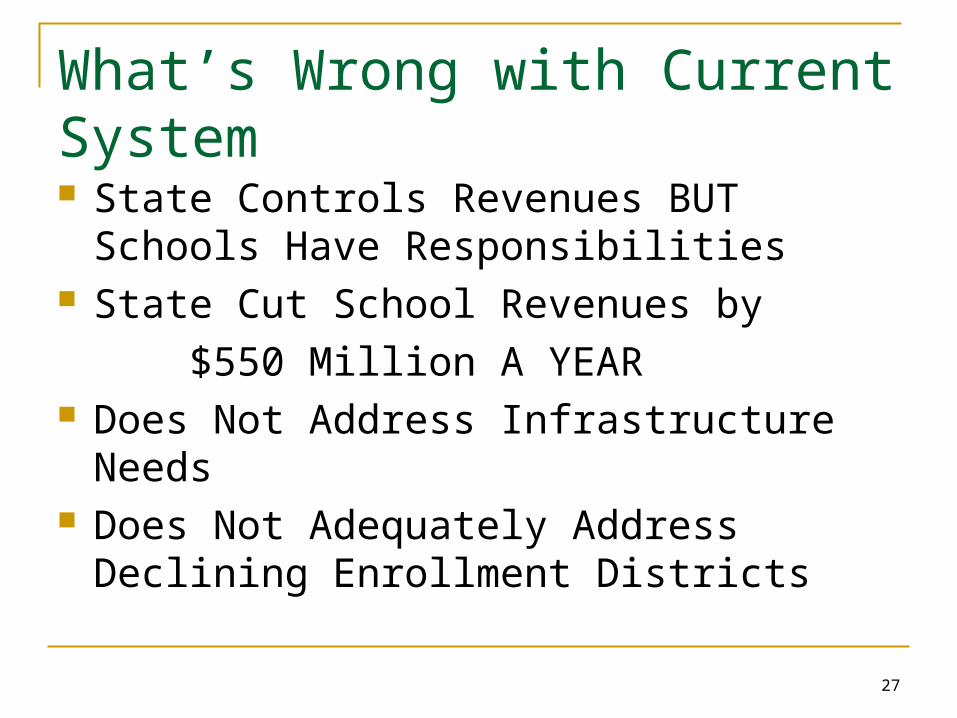
What’s Wrong with Current System State Controls Revenues BUT Schools Have
Responsibilities State Cut School Revenues by
$550 Million A YEAR Does Not Address Infrastructure Needs Does Not Adequately Address Declining
Enrollment Districts
28
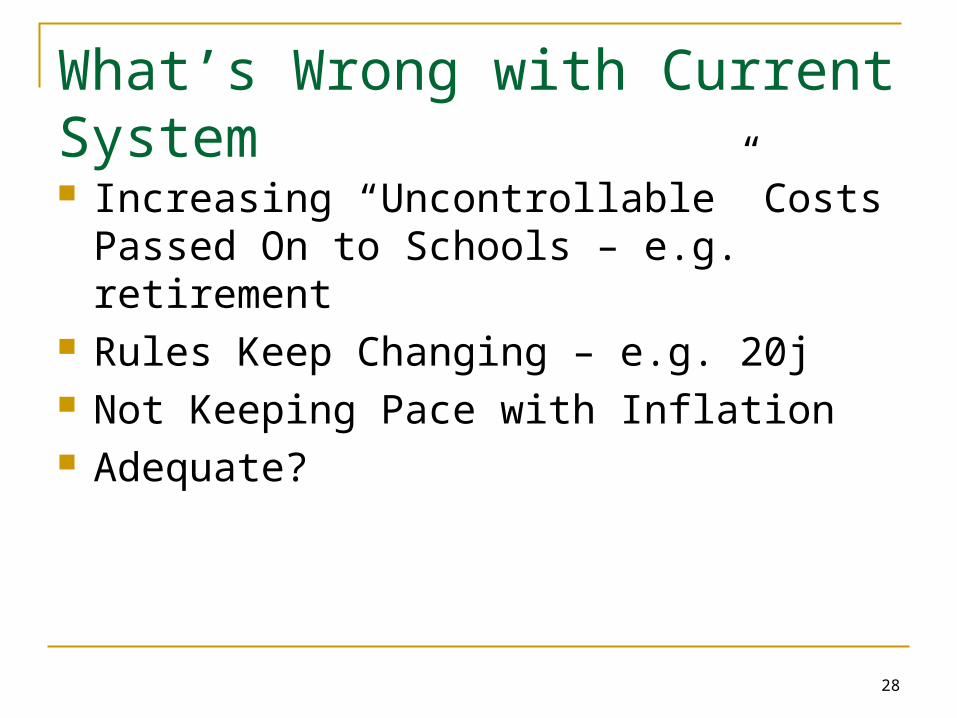
What’s Wrong with Current System Increasing “Uncontrollable” Costs Passed On
to Schools – e.g. retirement Rules Keep Changing – e.g. 20j Not Keeping Pace with Inflation Adequate?

29
What to Do
Tell Your Story Get Involved Politically Stay Involved Locally Be Persistent
A marathon; not a sprint